ecological the imbalance of nature: revisiting …€¦ · a darwinian framework for invasion...
TRANSCRIPT
ECOLOGICALSOUNDING
The imbalance of nature: revisitinga Darwinian framework forinvasion biologyJason D. Fridley1* and Dov F. Sax2
1Department of Biology, Syracuse University,
Syracuse, NY 13244, USA, 2Department of
Ecology and Evolutionary Biology, Brown
University, Providence, RI, USA
ABSTRACT
Aim A major implication of natural selection is that species from different parts ofthe world will vary in their efficiency in converting resources into offspring for agiven type of environment. This insight, articulated by Darwin, is usually over-looked in more recent studies of invasion biology that are often based on the moremodern Eltonian perspective of imbalanced ecosystems. We formulate a renewedDarwinian framework for invasion biology, the evolutionary imbalance hypothesis(EIH), based only on the action of natural selection in historically isolated popu-lations operating within a global network of repeated environments. This frame-work predicts that successful invaders are more likely to come from biotic regionsof high genetic potential (with independent lineages of large population size),experiencing a given environment for many generations and under strong compe-tition from other lineages.
Location Global.
Methods We test the predictive power of this framework by examining disparitiesin recent species exchanges between global biotic regions, including patterns ofplant invasions across temperate regions and exchanges of aquatic fauna as a resultof modern canal building.
Results Our framework successfully predicts global invasion patterns usingphylogenetic diversity of the world’s biotic regions as a proxy that reflects theirgenetic potential, historical stability and competitive intensity, in line with theDarwinian expectation. Floristic regions of higher phylogenetic diversity are morelikely to be source areas of invasive plants, and regions of lower phylogeneticdiversity are more likely to be invaded. Similar patterns are evident for formerlyisolated marine or freshwater assemblages that have been connected via canals.
Main conclusions We advocate an approach to understanding modern speciesinvasions that recognizes the potential significance of both the original Darwinianexplanation and the more modern view that emphasizes novel ecological or evo-lutionary mechanisms arising in the introduced range. Moreover, if biologicalinvasions are a natural outcome of Darwinian evolution in an increasingly con-nected world, then invasive species should continue to displace native species anddrive widespread shifts in the functioning of ecosystems.
KeywordsBiotic resistance, Darwin, Elton, empty niche, floristic regions, natural selection,phylogenetic diversity, pre-adaptation, species invasions.
*Correspondence: Jason Fridley, Department ofBiology, Syracuse University, 107 College Place,Syracuse, NY 13244, USA.E-mail: [email protected]
Global Ecology and Biogeography, (Global Ecol. Biogeogr.) (2014)
© 2014 John Wiley & Sons Ltd DOI: 10.1111/geb.12221http://wileyonlinelibrary.com/journal/geb 1
INTRODUCTION
Since Charles Elton’s (1958) first modern treatment of the
subject more than 50 years ago, the study of biological inva-
sions has matured from one largely restricted to ecological
processes – competition, predation, disturbance – to one that
more fully acknowledges community assembly as driven by the
interplay of ecological and evolutionary processes (Simberloff,
2000; Richardson, 2011). Although Elton’s core mechanisms of
enemy release (Keane & Crawley, 2002), biotic resistance
(Levine & D’Antonio, 1999; Tilman, 2004) and disturbance
(Hobbs & Huenneke, 1992; Davis et al., 2000) remain key foci
of invasion studies, evolutionary processes such as rapid adap-
tation of invaders to new selection pressures in the introduced
range have emerged as a major feature of many invasions
(Blossey & Nötzold, 1995; Callaway & Ridenour, 2004; Colautti
& Barrett, 2013; Felker-Quinn et al., 2013). Invasion biology
today is therefore both ‘Eltonian’ and ‘Darwinian’, in the sense
that Elton’s perspective of imbalanced ecosystems (Cronk &
Fuller, 1995) and the potential for evolutionary change in
novel environments provide complementary frameworks for
invasion studies. Moreover, these perspectives start from the
same premise that there must be a strong explanation for why
invading species (those with no evolutionary history in an
invaded environment) can outcompete native species – species
that are presumably finely adapted to local conditions (Sax &
Brown, 2000).
Despite the increasing integration of evolutionary processes
into invasion studies, it is remarkable that the original evolu-
tionary explanation of species invasions, espoused by Darwin
himself a century before Elton’s publication, remains an after-
thought in invasion theory. Darwin (1859) observed that
because ‘natural selection acts by competition, it adapts the
inhabitants of each country only in relation to the degree of
perfection of their associates’, such that, ‘we need feel no surprise
at the inhabitants of any one country, although on the ordinary
view supposed to have been specially created and adapted for
that country, being beaten and supplanted by the naturalised
productions from another land’. Darwin’s view, one of the ear-
liest on biological invasions, presents invasion as an expectation
of natural selection – a view largely absent from modern inva-
sion biology (Vermeij, 2005; Tilman, 2011). Darwin (1859)
further suggested that species from larger regions, represented
by more individuals, have ‘consequently been advanced through
natural selection and competition to a higher stage of perfection
or dominating power’ and therefore be expected to beat ‘less
powerful’ forms found in other regions. Here we suggest that
this basic insight can be used to develop a more holistic frame-
work for understanding biological invasions as a fundamental
product of Darwinian evolution, a framework we call the evo-
lutionary imbalance hypothesis (EIH) of species invasions. This
framework builds upon Darwin’s observations, but also the
work of others who recognized the role that evolutionary
history, contingency and pre-adaptation can play in mediating
the success or failure of invading species (MacArthur, 1972;
Rejmánek, 1989; Tilman, 1999, 2011; Sax & Brown, 2000;
Flannery, 2002; Mack, 2003; Stachowicz & Tilman, 2005;
Vermeij, 2005; Leigh et al., 2009; Fridley, 2013).
THE EVOLUTIONARY IMBALANCEHYPOTHESIS
The EIH is based on three postulates. First, evolution is contin-
gent and imperfect. Evolution is a tinkerer (Jacob, 1977) rather
than an engineer, working by modifying existing forms to meet
new challenges. Thus, the characteristics of species in any biotic
assemblage are subject to constraints posed by evolutionary
history and past environments. Second, the degree to which
species are ecologically optimized increases as the number of ‘evo-
lutionary experiments’ increases, and with the intensity of compe-
tition. Each newly derived phenotype can be viewed as an
evolutionary experiment, one that has some probability of
having a selective advantage for a given set of environmental
conditions. The number of such experiments should vary
among regions that differ in spatial extent and biotic history,
and their success should be influenced by the intensity of com-
petition. Richer biotas of more potential competitors and those
that have experienced a similar set of environmental conditions
for a longer period should be more likely to have produced
better environmental solutions (adaptations) to any given envi-
ronmental challenge. Third, similar sets of ecological conditions
exist around the world. Environmental conditions vary over the
globe but similar habitats, including climate, soils and disturb-
ance regimes, are repeated and separated by vast distances.
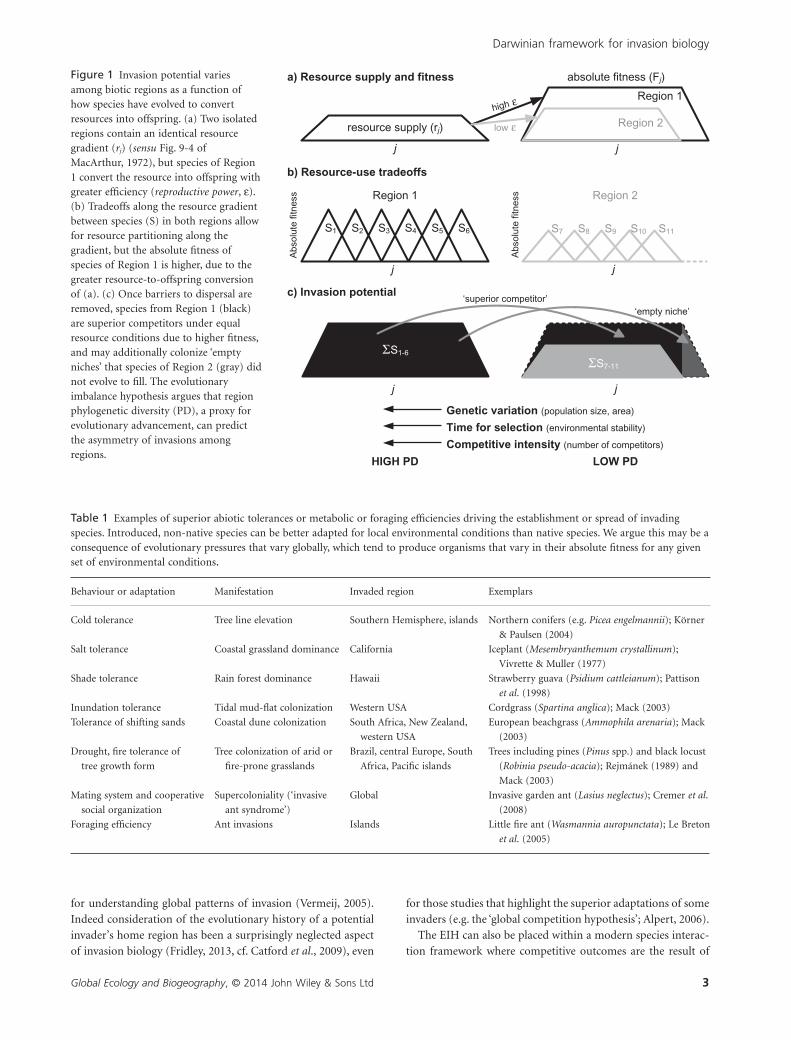
Given these postulates, it follows that once biotas of previ-
ously isolated habitats are mixed, some species should have a
higher fitness than others for any given set of environmental
conditions (Fig. 1). If the disparity in fitness is great enough, an
introduced species becomes an ‘invader’; i.e. it is able to become
abundant within the ancestral habitat of resident species, based
solely on an imbalance in the degree to which organisms are
adapted to local environments (Stachowicz & Tilman, 2005;
Vermeij, 2005). Superior adaptations to particular environmen-
tal circumstances by non-native organisms have long been
implicated in ecophysiological and behavioural studies of inva-
sive plants and animals (Table 1). If such adaptations were
present in introduced species in their native range (what some
invasion biologists have called ‘pre-adaptation’; Mack, 2003),
this becomes a basis for the EIH. In contrast, modern invasion
studies often emphasize either the presumed advantages that
invaders acquire by leaving their evolutionary context behind,
such as hypotheses based on missing enemies (Colautti et al.,
2004), novel phenotypes (Callaway & Ridenour, 2004) or the
evolution of increased competitive ability upon arrival to a
newly occupied region (Blossey & Nötzold, 1995), or they
depend on ecological explanations, such as reduced biotic resist-
ance caused by disturbance or low native species diversity
(Elton, 1958). We assert that the study of biological invasions
should comprise a more balanced approach that acknowledges
the full complement of mechanisms in both Darwinian and
Eltonian frameworks, and specifically that divergent evolution-
ary histories of the donor and recipient regions are significant
J. D. Fridley and D. F. Sax
Global Ecology and Biogeography, © 2014 John Wiley & Sons Ltd2
for understanding global patterns of invasion (Vermeij, 2005).
Indeed consideration of the evolutionary history of a potential
invader’s home region has been a surprisingly neglected aspect
of invasion biology (Fridley, 2013, cf. Catford et al., 2009), even
for those studies that highlight the superior adaptations of some
invaders (e.g. the ‘global competition hypothesis’; Alpert, 2006).
The EIH can also be placed within a modern species interac-
tion framework where competitive outcomes are the result of
S1 S2 S3 S4 S5 S6
j
S7 S8 S9 S10 S11
j
j
ΣS1-6
j
j
absolute fitness (Fj)
Region 1 Region 2
‘empty niche’
Genetic variation (population size, area)
Time for selection (environmental stability)
Competitive intensity (number of competitors)
HIGH PD LOW PD
‘superior competitor’
a) Resource supply and fitness
b) Resource-use tradeoffs
c) Invasion potential
resource supply (rj)
Region 1
Region 2
ΣS7-11
Abs
olut
efit
ness
high ε
low ε
Abs
olut
efit
ness
j
Figure 1 Invasion potential variesamong biotic regions as a function ofhow species have evolved to convertresources into offspring. (a) Two isolatedregions contain an identical resourcegradient (rj) (sensu Fig. 9-4 ofMacArthur, 1972), but species of Region1 convert the resource into offspring withgreater efficiency (reproductive power, ε).(b) Tradeoffs along the resource gradientbetween species (S) in both regions allowfor resource partitioning along thegradient, but the absolute fitness ofspecies of Region 1 is higher, due to thegreater resource-to-offspring conversionof (a). (c) Once barriers to dispersal areremoved, species from Region 1 (black)are superior competitors under equalresource conditions due to higher fitness,and may additionally colonize ‘emptyniches’ that species of Region 2 (gray) didnot evolve to fill. The evolutionaryimbalance hypothesis argues that regionphylogenetic diversity (PD), a proxy forevolutionary advancement, can predictthe asymmetry of invasions amongregions.
Table 1 Examples of superior abiotic tolerances or metabolic or foraging efficiencies driving the establishment or spread of invadingspecies. Introduced, non-native species can be better adapted for local environmental conditions than native species. We argue this may be aconsequence of evolutionary pressures that vary globally, which tend to produce organisms that vary in their absolute fitness for any givenset of environmental conditions.
Behaviour or adaptation Manifestation Invaded region Exemplars
Cold tolerance Tree line elevation Southern Hemisphere, islands Northern conifers (e.g. Picea engelmannii); Körner
& Paulsen (2004)
Salt tolerance Coastal grassland dominance California Iceplant (Mesembryanthemum crystallinum);
Vivrette & Muller (1977)
Shade tolerance Rain forest dominance Hawaii Strawberry guava (Psidium cattleianum); Pattison
et al. (1998)
Inundation tolerance Tidal mud-flat colonization Western USA Cordgrass (Spartina anglica); Mack (2003)
Tolerance of shifting sands Coastal dune colonization South Africa, New Zealand,
western USA
European beachgrass (Ammophila arenaria); Mack
(2003)
Drought, fire tolerance of
tree growth form
Tree colonization of arid or
fire-prone grasslands
Brazil, central Europe, South
Africa, Pacific islands
Trees including pines (Pinus spp.) and black locust
(Robinia pseudo-acacia); Rejmánek (1989) and
Mack (2003)
Mating system and cooperative
social organization
Supercoloniality (‘invasive
ant syndrome’)
Global Invasive garden ant (Lasius neglectus); Cremer et al.
(2008)
Foraging efficiency Ant invasions Islands Little fire ant (Wasmannia auropunctata); Le Breton
et al. (2005)
Darwinian framework for invasion biology
Global Ecology and Biogeography, © 2014 John Wiley & Sons Ltd 3
both niche and fitness differences between species (Chesson,
2000; Stachowicz & Tilman, 2005; MacDougall et al., 2009). For
example, Tilman (2011) showed that even small differences in
absolute fitness between resident and introduced species inhab-
iting the same niche could lead to the rapid dominance of invad-
ers. Although he used this approach in the context of extinction
data to come to different conclusions about the mechanisms
underlying historical biotic exchanges, his ‘biogeographic
superiority hypothesis’ describing the evolution of different
tradeoff surfaces among biotic regions is an expression of the
EIH using resource ratio theory. Differences in average absolute
fitness among regions as a result of contrasting tradeoff surfaces
are a major implication, but they are not the only explanation
for invasion under the EIH, as species from one region can also
evolve to exploit resource conditions that species from another
region cannot (an ‘empty niche’). From this perspective,
invasion mechanisms that invoke a ‘superior competitor’
(Rejmánek, 1989) or ‘empty niche’ (Mack, 2003) are both mani-
festations of a higher absolute fitness of the invader, in that
empty niches are simply conditions under which natives cannot
sustain self-supporting populations (Fig. 1).
QUANTIFYING EVOLUTIONARY IMBALANCE
The EIH is based on the insight provided by Darwin that regions
of the world should vary in the degree to which natural selection
has been able to optimize the conversion of resources into off-
spring by organisms under competition, or what Brown et al.
(1993) called ‘reproductive power’. For this insight to explain
global invasion patterns, we must first understand the factors
that vary among regions and produce differences in reproduc-
tive power for organisms inhabiting a given set of environmental
conditions. We suggest that this process could be driven by three
primary factors: (1) the amount of genetic variation within
populations; (2) the amount of time a population or genetic
lineage has experienced a given set of environmental conditions;
and (3) the intensity of the competitive environment experi-
enced by the population.
Spatially extensive regions of contiguous habitat contain
species with larger populations, and thus allow for a greater
array of genetic variation to be acted upon by natural selection
over time (Darlington, 1959; MacArthur, 1972; Leigh et al.,
2009). We would thus expect a population’s reproductive power
to scale with the size of its habitat. This was the original mecha-
nism of invasion invoked by Darwin (1859) in consideration of
the apparent bias in plant invasions between the Northern and
Southern Hemispheres. Darlington (1959) invoked a similar
mechanism for global patterns of environmental adaptation in
mammals, and Tilman (1999, 2011) considered the conse-
quences of larger plant population sizes and genetic variation
for the evolution of resource-based tradeoff surfaces. In general,
the correlation of population size and genetic diversity is a well-
tested tenet of conservation genetics (Leimu et al., 2006), and
genetic variation is well recognized as a key driver of long-term
adaptation. We apply this basic evolutionary process to the
assessment of species invasiveness: all else being equal, we expect
species with a high reproductive power in a given environment
to come from regions where that environment is more extensive,
supporting larger population sizes for a given selection regime.
We also expect evolutionary lineages in older, more stable
environments to have had more opportunities to be honed by
selective pressures than those occupying new environments (e.g.
young oceanic islands) or those more disturbed in the recent
past (e.g. formerly glaciated regions) (Dobzhansky, 1950; Cody
& Mooney, 1978). This mechanism is a direct consequence of
the significance of time in the process of natural selection, where
adaptation occurs continually through the accumulation of
beneficial mutations, even in a constant environment (Lenski
et al., 1991). The tendency of the fitness of a population to
increase in response to a constant selection pressure, even after
thousands of generations, has been well demonstrated in micro-
bial systems in the laboratory (Elena & Lenski, 2003; Barrick
et al., 2009) and is consistent with quantitative genetics theory
(Fisher, 1930). Extending this process to the biogeography of
species invasions, we suggest that organisms with high repro-
ductive power (and thus invasiveness) for a given environment
should tend to be those that in addition to having large
populations have been exposed to that condition for more
generations.
A third mechanism promoting disparities in reproductive
power is differences in interspecific competitive intensity among
regions that vary in the complexity and diversity of their com-
munities (Dobzhansky, 1950; MacArthur, 1972; Leigh et al.,
2009; Schemske, 2009), a mechanism often invoked to explain
the apparent competitive superiority of tropical lineages.
MacArthur (1972) extended this idea to species invasions,
arguing that ‘emigrants from species-rich continents in tropical
climates have had much practice in competing . . . they certainly
should be good at invading a new community of competitors’.
This idea has also been invoked to explain biases in past biotic
exchanges (Vermeij, 1996, 2005) and the competitive superiority
of mainland over island species (Leigh et al., 2009). Although
separating this mechanism from other regional differences
underlying diversity patterns may not be feasible in many cases,
we expect that populations facing a greater array of competing
species historically have evolved a higher reproductive power
and will therefore be more likely to invade regions of lower
competitive intensity.
The challenge for applying regional variation in these factors
– larger population sizes, relative environmental stability or
habitat age and competitive intensity – to global invasion pat-
terns is finding a straightforward way to measure them. Even
seemingly simple measurements like habitat area as a proxy for
population size require decisions about what constitutes a
‘habitat’, or how environmental constancy or competitive inten-
sity should be quantified. As a first attempt to evaluate the
predictive power of the EIH we suggest an alternative approach
of using a proxy variable, one that is likely to correlate with the
above factors but is relatively easy to estimate for the biota of a
given region. One such candidate is phylogenetic diversity (PD),
which, broadly speaking, is an index of the number of unique
lineages in a region (Faith, 1992) and should bear a strong
J. D. Fridley and D. F. Sax
Global Ecology and Biogeography, © 2014 John Wiley & Sons Ltd4
relation to the range of phenotypic innovation available and the
level of competitive intensity experienced by extant species
(Vermeij, 1996, 2005; Leigh et al., 2009). Because PD is more
reflective of deep divergences than recent diversification, we
further expect it to be a rough indicator of environmental con-
stancy or habitat age, in that it can distinguish between recent
adaptive radiations (e.g. on island archipelagos) and longer-
term trends in diversity driven by adaptation through speciali-
zation (e.g. Safi et al., 2011, for global mammalian assemblages)
whereas species diversity cannot. All else being equal, our expec-
tation is that biotas represented by lineages of greater number or
longer evolutionary history should be more likely to have pro-
duced a more optimal solution to a given environmental
problem, and it is this regional disparity, approximated by PD,
that allows predictions of global invasion patterns. We empha-
size, however, that we consider PD to be the best available sur-
rogate for describing how species assemblages should vary in
reproductive power for a given environment, and do not imply
any direct causal relationship between PD and the invasibility of
a region.
PHYLOGENETIC DIVERSITY AND GLOBALINVASION PATTERNS
The EIH suggests that species with a disparate evolutionary
history inhabiting similar but spatially isolated environments
should vary in reproductive power, and thus exhibit differential
fitness in a common environment. If, as we suggest, PD is a
suitable proxy for differences in reproductive power between
biotic regions, then the EIH predicts that when introduction
attempts are held constant among donor regions, the number of
successful invaders in a recipient region should vary positively with
the PD of each donor region, and recipient regions with lower PD
should be easier to invade. In other words, the EIH presents
global invasion patterns as a function of the biological charac-
teristics of both a recipient region and potential donor regions,
which we suggest can be predicted using regional PD. Unfortu-
nately, the condition of equal introduction attempts among
potential donor regions is rarely met, such that simple compari-
sons of invader richness and PD of the donor region across
different recipient regions are not appropriate tests of the EIH.
Instead, we demonstrate two alternative approaches to evaluat-
ing this prediction that control for variation in introduction
attempts between regions.
First, we examine whether native region PD can predict
whether a species will become invasive in a region after it has
been introduced. This is an approach used in invasive species
risk assessments (Pheloung et al., 1999; Daehler et al., 2004),
where non-native species of a certain region are separated into
‘invasive’ or ‘non-invasive’ groups, and traits or other species-
level variables are sought that are predictive of whether a species
belongs in the invasive group. The approach is useful here
because it does not depend on equal introduction attempts from
each potential donor region; rather, it examines the probability
that species from different regions will be successful invaders
once introduced, as a function of the PD of their native range.
We examined this prediction for plants by estimating PD for the
35 floristic regions of the world identified by Takhtajan (1986),
and assigning each introduced species in a region a PD value
according to the region of largest PD that overlaps with their
native range. We did this for three geographic areas that have
well-documented non-native floras, including Eastern North
America (Fridley, 2008), the Czech Republic (Pysek et al., 2002)
and New Zealand (Howell & Sawyer, 2006; Howell, 2008). For
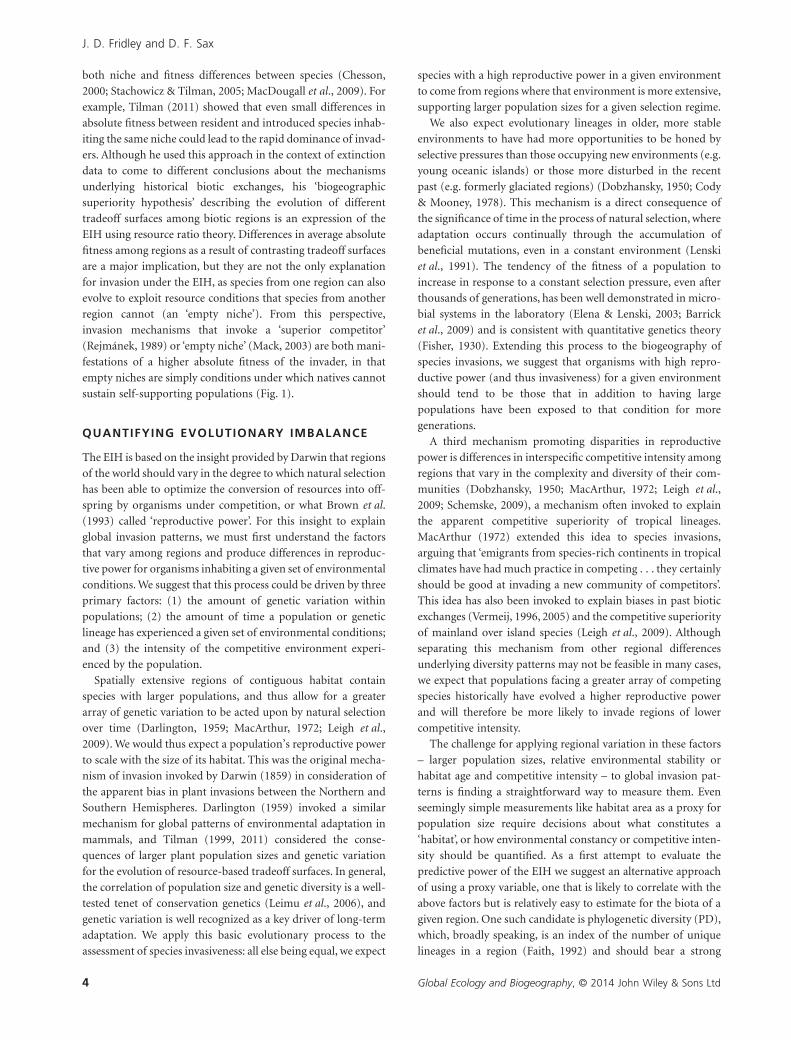
example, eastern North America (Fig. 2, top panel) contains
0.45 0.55 0.65 0.75
0.0
0.5
1.0
Eastern North America
******
0.45 0.55 0.65 0.75
0.0
0.5
1.0
Czech Republic
Casuals excluded
All species
****
0.45 0.55 0.65 0.750.
00.
51.
0
New Zealand
Max PD of Native Regions
Pro
babi
lity
of B
ecom
ing
Inva
sive
*****
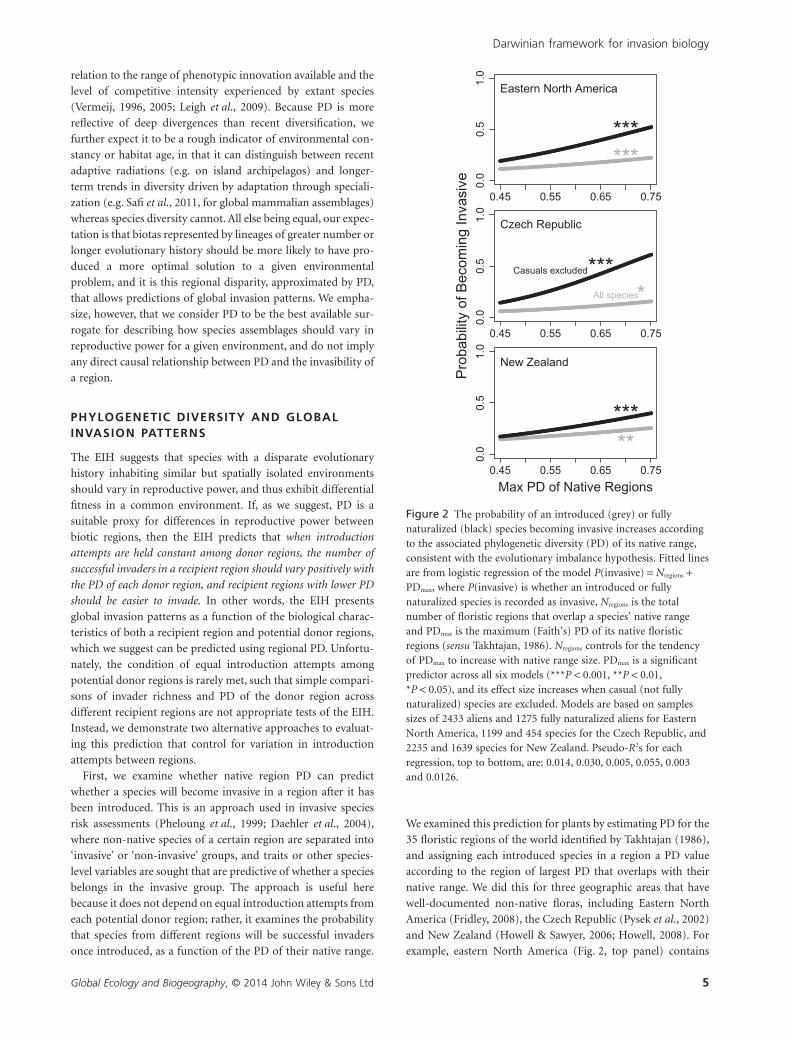
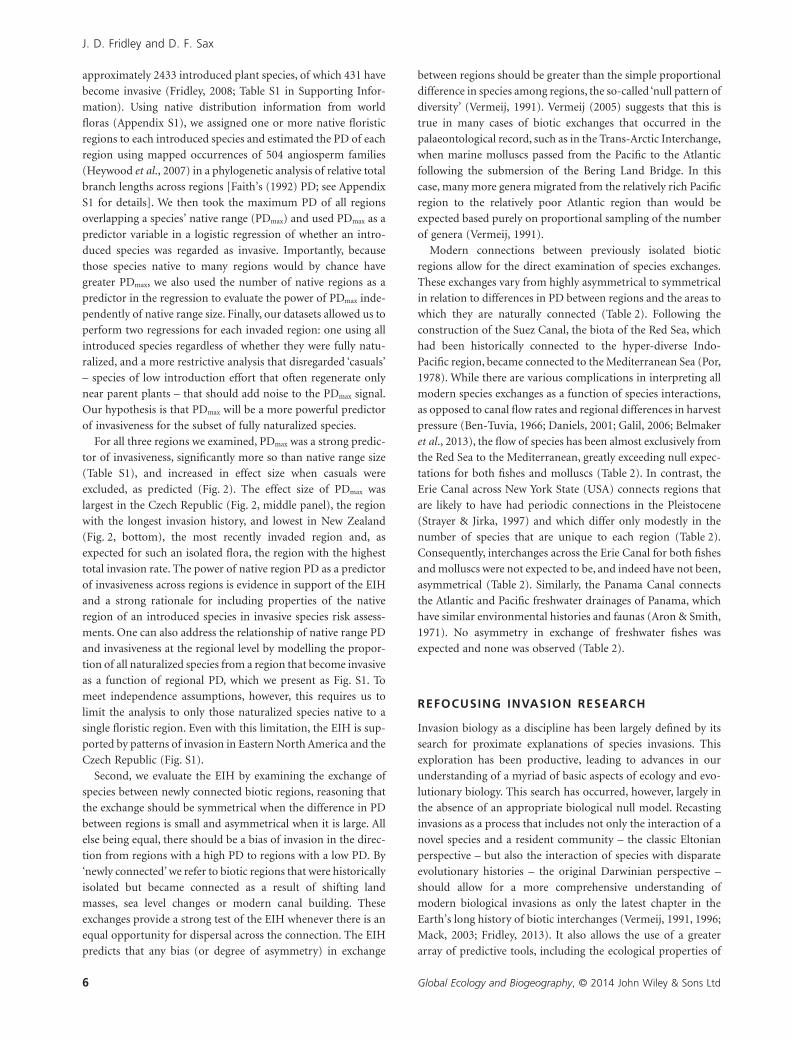
Figure 2 The probability of an introduced (grey) or fullynaturalized (black) species becoming invasive increases accordingto the associated phylogenetic diversity (PD) of its native range,consistent with the evolutionary imbalance hypothesis. Fitted linesare from logistic regression of the model P(invasive) = Nregions +PDmax, where P(invasive) is whether an introduced or fullynaturalized species is recorded as invasive, Nregions is the totalnumber of floristic regions that overlap a species’ native rangeand PDmax is the maximum (Faith’s) PD of its native floristicregions (sensu Takhtajan, 1986). Nregions controls for the tendencyof PDmax to increase with native range size. PDmax is a significantpredictor across all six models (***P < 0.001, **P < 0.01,*P < 0.05), and its effect size increases when casual (not fullynaturalized) species are excluded. Models are based on samplessizes of 2433 aliens and 1275 fully naturalized aliens for EasternNorth America, 1199 and 454 species for the Czech Republic, and2235 and 1639 species for New Zealand. Pseudo-R2s for eachregression, top to bottom, are: 0.014, 0.030, 0.005, 0.055, 0.003and 0.0126.
Darwinian framework for invasion biology
Global Ecology and Biogeography, © 2014 John Wiley & Sons Ltd 5
approximately 2433 introduced plant species, of which 431 have
become invasive (Fridley, 2008; Table S1 in Supporting Infor-
mation). Using native distribution information from world
floras (Appendix S1), we assigned one or more native floristic
regions to each introduced species and estimated the PD of each
region using mapped occurrences of 504 angiosperm families
(Heywood et al., 2007) in a phylogenetic analysis of relative total
branch lengths across regions [Faith’s (1992) PD; see Appendix
S1 for details]. We then took the maximum PD of all regions
overlapping a species’ native range (PDmax) and used PDmax as a
predictor variable in a logistic regression of whether an intro-
duced species was regarded as invasive. Importantly, because
those species native to many regions would by chance have
greater PDmax, we also used the number of native regions as a
predictor in the regression to evaluate the power of PDmax inde-
pendently of native range size. Finally, our datasets allowed us to
perform two regressions for each invaded region: one using all
introduced species regardless of whether they were fully natu-
ralized, and a more restrictive analysis that disregarded ‘casuals’
– species of low introduction effort that often regenerate only
near parent plants – that should add noise to the PDmax signal.
Our hypothesis is that PDmax will be a more powerful predictor
of invasiveness for the subset of fully naturalized species.
For all three regions we examined, PDmax was a strong predic-
tor of invasiveness, significantly more so than native range size
(Table S1), and increased in effect size when casuals were
excluded, as predicted (Fig. 2). The effect size of PDmax was
largest in the Czech Republic (Fig. 2, middle panel), the region
with the longest invasion history, and lowest in New Zealand
(Fig. 2, bottom), the most recently invaded region and, as
expected for such an isolated flora, the region with the highest
total invasion rate. The power of native region PD as a predictor
of invasiveness across regions is evidence in support of the EIH
and a strong rationale for including properties of the native
region of an introduced species in invasive species risk assess-
ments. One can also address the relationship of native range PD
and invasiveness at the regional level by modelling the propor-
tion of all naturalized species from a region that become invasive
as a function of regional PD, which we present as Fig. S1. To
meet independence assumptions, however, this requires us to
limit the analysis to only those naturalized species native to a
single floristic region. Even with this limitation, the EIH is sup-
ported by patterns of invasion in Eastern North America and the
Czech Republic (Fig. S1).
Second, we evaluate the EIH by examining the exchange of
species between newly connected biotic regions, reasoning that
the exchange should be symmetrical when the difference in PD
between regions is small and asymmetrical when it is large. All
else being equal, there should be a bias of invasion in the direc-
tion from regions with a high PD to regions with a low PD. By
‘newly connected’ we refer to biotic regions that were historically
isolated but became connected as a result of shifting land
masses, sea level changes or modern canal building. These
exchanges provide a strong test of the EIH whenever there is an
equal opportunity for dispersal across the connection. The EIH
predicts that any bias (or degree of asymmetry) in exchange
between regions should be greater than the simple proportional
difference in species among regions, the so-called ‘null pattern of
diversity’ (Vermeij, 1991). Vermeij (2005) suggests that this is
true in many cases of biotic exchanges that occurred in the
palaeontological record, such as in the Trans-Arctic Interchange,
when marine molluscs passed from the Pacific to the Atlantic
following the submersion of the Bering Land Bridge. In this
case, many more genera migrated from the relatively rich Pacific
region to the relatively poor Atlantic region than would be
expected based purely on proportional sampling of the number
of genera (Vermeij, 1991).
Modern connections between previously isolated biotic
regions allow for the direct examination of species exchanges.
These exchanges vary from highly asymmetrical to symmetrical
in relation to differences in PD between regions and the areas to
which they are naturally connected (Table 2). Following the
construction of the Suez Canal, the biota of the Red Sea, which
had been historically connected to the hyper-diverse Indo-
Pacific region, became connected to the Mediterranean Sea (Por,
1978). While there are various complications in interpreting all
modern species exchanges as a function of species interactions,
as opposed to canal flow rates and regional differences in harvest
pressure (Ben-Tuvia, 1966; Daniels, 2001; Galil, 2006; Belmaker
et al., 2013), the flow of species has been almost exclusively from
the Red Sea to the Mediterranean, greatly exceeding null expec-
tations for both fishes and molluscs (Table 2). In contrast, the
Erie Canal across New York State (USA) connects regions that
are likely to have had periodic connections in the Pleistocene
(Strayer & Jirka, 1997) and which differ only modestly in the
number of species that are unique to each region (Table 2).
Consequently, interchanges across the Erie Canal for both fishes
and molluscs were not expected to be, and indeed have not been,
asymmetrical (Table 2). Similarly, the Panama Canal connects
the Atlantic and Pacific freshwater drainages of Panama, which
have similar environmental histories and faunas (Aron & Smith,
1971). No asymmetry in exchange of freshwater fishes was
expected and none was observed (Table 2).
REFOCUSING INVASION RESEARCH
Invasion biology as a discipline has been largely defined by its
search for proximate explanations of species invasions. This
exploration has been productive, leading to advances in our
understanding of a myriad of basic aspects of ecology and evo-
lutionary biology. This search has occurred, however, largely in
the absence of an appropriate biological null model. Recasting
invasions as a process that includes not only the interaction of a
novel species and a resident community – the classic Eltonian
perspective – but also the interaction of species with disparate
evolutionary histories – the original Darwinian perspective –
should allow for a more comprehensive understanding of
modern biological invasions as only the latest chapter in the
Earth’s long history of biotic interchanges (Vermeij, 1991, 1996;
Mack, 2003; Fridley, 2013). It also allows the use of a greater
array of predictive tools, including the ecological properties of
J. D. Fridley and D. F. Sax
Global Ecology and Biogeography, © 2014 John Wiley & Sons Ltd6
an invader’s region of origin, which have been largely neglected
under the Eltonian paradigm (Fridley, 2011).
Predictions of the EIH also contrast with those of the core
Eltonian perspective in several ways. Biotic resistance, an impor-
tant component of the Eltonian view (Fridley et al., 2007), pre-
dicts that a similar number of invaders should be exchanged
between regions that have a similar diversity of species, regard-
less of differences in region age, size or PD, which form the basis
of the EIH predictions. For example, an Eltonian view would
predict a largely symmetrical exchange of species across the Suez
Canal, as the difference in species pools is small, whereas the EIH
predicts the large asymmetry that is actually observed (Table 2).
Further, because the core Eltonian framework does not consider
the origin of an invader, it cannot explain why the identity of
problematic invaders is typically shared among regions with
similar abiotic conditions (Richardson & Thuiller, 2007), or why
the best predictor of invasiveness in a region is whether a species
is invasive elsewhere (D’Antonio et al., 2004), both predicted
under the EIH. Perhaps most significantly, the EIH does not
highlight disturbance or anthropogenic change to ecosystems as
precursors to invader dominance, as Elton (1958) and others
(Davis et al., 2000) have advocated, which we argue better
reflects the reality that disturbance is associated with many
(Hobbs & Huenneke, 1992) but by no means all (Rejmánek,
1989; Holm, 1991; Pysek et al., 2002; Mack, 2003) current
invasions.
We emphasize that the EIH does not predict outcomes for
individual species, but instead predicts trends among species
and regions. For example, the EIH predicts that island species
should be relatively poor invaders of mainland environments;
although this is generally true, there are nonetheless a small
number of island species that have invaded continental regions
(such as the New Zealand ngaio tree, Myoporum laetum, invasive
in California). Similarly, the EIH predicts an asymmetry in
biotic exchanges, but it is mute on which particular species
should invade. The EIH defines a statistical expectation about
source areas of invaders and the sensitivity of regions to inva-
sion, and does not imply that all species from a phylogenetically
rich region will outcompete those from a phylogenetically poor
region in a common environment, or vice versa. Consequently,
the EIH provides a framework for estimating risk of invasion
among species and regions, but cannot be used to predict the
outcome of invasions for particular species in the absence of
relevant fitness data. Nonetheless, comparisons of the character-
istics of successful invaders and the natives they disadvantage
should give great insight into the nature of adaptation for par-
ticular environmental conditions. Further, the EIH provides an
alternative framework for understanding why the performance
of species can change between recipient and donor regions and
so is valuable in contextualizing recent integrative frameworks
in invasion biology (e.g. Colautti et al., 2014).
IMPLICATIONS FOR CONSERVATION ANDECOSYSTEM FUNCTIONING
The EIH has two important implications for species conserva-
tion and the functioning of ecosystems. First, if species invade
because they are more finely tuned by natural selection for a
particular environment, then over the long term these species
are expected to displace native species through competitive
dominance. However, whether this process inevitably results in
the extinction of native species is unclear, given that competition
(as opposed to predation) has yet to be implicated as the sole
factor causing the extinction of any species, despite more than
five centuries of human-mediated species introductions (Sax &
Gaines, 2008). For biotas that inhabit all but the smallest land
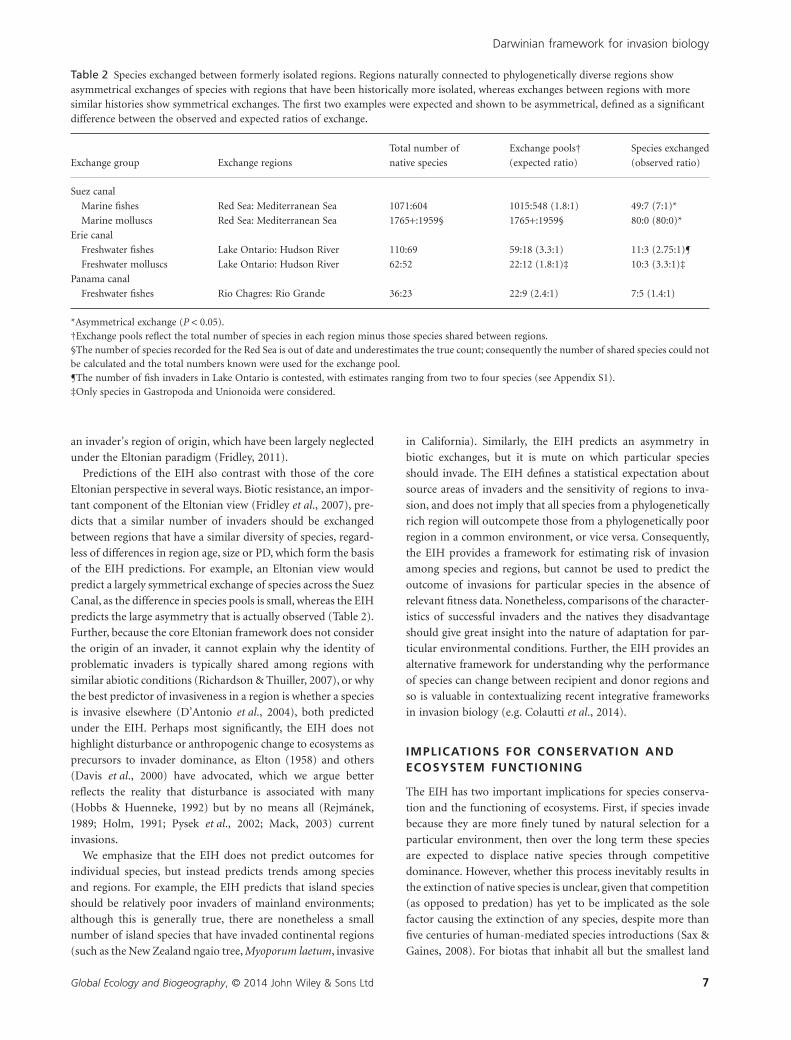
Table 2 Species exchanged between formerly isolated regions. Regions naturally connected to phylogenetically diverse regions showasymmetrical exchanges of species with regions that have been historically more isolated, whereas exchanges between regions with moresimilar histories show symmetrical exchanges. The first two examples were expected and shown to be asymmetrical, defined as a significantdifference between the observed and expected ratios of exchange.
Exchange group Exchange regions
Total number of
native species
Exchange pools†
(expected ratio)
Species exchanged
(observed ratio)
Suez canal
Marine fishes Red Sea: Mediterranean Sea 1071:604 1015:548 (1.8:1) 49:7 (7:1)*
Marine molluscs Red Sea: Mediterranean Sea 1765+:1959§ 1765+:1959§ 80:0 (80:0)*
Erie canal
Freshwater fishes Lake Ontario: Hudson River 110:69 59:18 (3.3:1) 11:3 (2.75:1)¶
Freshwater molluscs Lake Ontario: Hudson River 62:52 22:12 (1.8:1)‡ 10:3 (3.3:1)‡
Panama canal
Freshwater fishes Rio Chagres: Rio Grande 36:23 22:9 (2.4:1) 7:5 (1.4:1)
*Asymmetrical exchange (P < 0.05).†Exchange pools reflect the total number of species in each region minus those species shared between regions.§The number of species recorded for the Red Sea is out of date and underestimates the true count; consequently the number of shared species could notbe calculated and the total numbers known were used for the exchange pool.¶The number of fish invaders in Lake Ontario is contested, with estimates ranging from two to four species (see Appendix S1).‡Only species in Gastropoda and Unionoida were considered.
Darwinian framework for invasion biology
Global Ecology and Biogeography, © 2014 John Wiley & Sons Ltd 7
masses it may well be that sufficient space or marginal habitat
exists to stave off competition-induced extinction for centuries,
perhaps via further habitat-based selection in native popula-
tions. This would additionally explain why there are such large
disparities in both historical and modern exchanges between
biotas (Vermeij, 1991, 2005) yet subsequently few extinctions
(Tilman, 2011). Nonetheless, to prevent severe reductions in
native population sizes, particularly on islands but on conti-
nents as well, relatively costly control programmes may be the
only alternative in lieu of strict introduction controls.
Second, to the extent that the fitness advantage of invaders
stems from more efficient conversion of resources into biomass
(Funk & Vitousek, 2007), invaders may significantly alter the
rates of productivity and nutrient cycling in invaded ecosystems
(Liao et al., 2008). This should lead to increases in net rates of
biomass production, with possible ramifications for future
carbon storage (Wardle et al., 2007), hydrological processes
(Sala et al., 1996) and biogeochemistry (Liao et al., 2008). Some
of these ecosystem changes may prove detrimental to native
species (Burghardt et al., 2010), raising additional hurdles for
conservation. In the context of a rapidly changing global envi-
ronment, balancing conservation risks with the potential func-
tional benefits of invasive species may prove especially
challenging.
ACKNOWLEDGEMENTS
We thank G. Vermeij, J. Stachowicz, M. Rejmánek, G.
Mittelbach, two anonymous referees and the many colleagues
who have contributed to discussions of these ideas, and H.
Dekker, D. Golani, R. O’Gorman and D. Strayer for helping to
clarify the species exchanged across canals.
REFERENCES
Alpert, P. (2006) The advantages and disadvantages of being
introduced. Biological Invasions, 8, 1523–1534.
Aron, W.I. & Smith, S.H. (1971) Ship canals and aquatic ecosys-
tems. Science, 174, 13–20.
Barrick, J.E., Yu, D.S., Yoon, S.H., Jeong, H., Oh, T.K., Schneider,
D., Lenski, R.E. & Kim, J.F. (2009) Genome evolution and
adaptation in a long-term experiment with Escherichia coli.
Nature, 461, 1243–1247.
Belmaker, J., Parravicini, V. & Kulbicki, M. (2013) Ecological
traits and environmental affinity explain Red Sea fish intro-
duction into the Mediterranean. Global Change Biology, 19,
1373–1382.
Ben-Tuvia, A. (1966) Red Sea fishes recently found in the Medi-
terranean. Copeia, 2, 254–275.
Blossey, B. & Nötzold, R. (1995) Evolution of increased com-
petitive ability in invasive nonindigenous plants: a hypothesis.
Journal of Ecology, 83, 887–889.
Brown, J.H., Marquet, P.A. & Taper, M.L. (1993) Evolution of
body size: consequences of an energetic definition of fitness.
The American Naturalist, 142, 573–584.
Burghardt, K.T., Tallamy, D.W., Philips, C. & Shropshire, K.J.
(2010) Non-native plants reduce abundance, richness, and
host specialization in lepidopteran communities. Ecosphere, 1,
art. 11, doi: 10.1890/ES10-00032.1.
Callaway, R.M. & Ridenour, W.M. (2004) Novel weapons: inva-
sive success and the evolution of increased competitive ability.
Frontiers in Ecology and the Environment, 2, 436–443.
Catford, J.A., Jansson, R. & Nilsson, C. (2009) Reducing redun-
dancy in invasion ecology by integrating hypotheses into a
single theoretical framework. Diversity and Distributions, 15,
22–40.
Chesson, P. (2000) Mechanisms of maintenance of species
diversity. Annual Review of Ecology and Systematics, 31, 343–
358.
Cody, M.L. & Mooney, H.A. (1978) Convergence versus
nonconvergence in Mediterranean-climate ecosystems.
Annual Review of Ecology and Systematics, 9, 265–321.
Colautti, R.I. & Barrett, S.C.H. (2013) Rapid adaptation to
climate facilitates range expansion of an invasive plant.
Science, 342, 364–366.
Colautti, R.I., Ricciardi, A., Grigorovich, I.A. & MacIsaac, H.J.
(2004) Is invasion success explained by the enemy release
hypothesis? Ecology Letters, 7, 721–733.
Colautti, R.I., Parker, J.D., Cadotte, M.W., Pysek, P., Brown, C.S.,
Sax, D.F. & Richardson, D.M. (2014) Quantifying the
invasiveness of species. Neobiota, 21, 7–27.
Cremer, S., Ugelvig, L.V., Drijfhout, F.P., Schlick-Steiner, B.C.,
Steiner, F.M., Seifert, B., Hughes, D.P., Schulz, A., Petersen,
K.S., Konrad, H., Stauffer, C., Kiran, K., Espadaler, X.,
d’Ettorre, P., Aktaç, N., Eilenberg, J., Jones, G.R., Nash, D.R.,
Pedersen, J.S. & Boomsma, J.J. (2008) The evolution of
invasiveness in garden ants. PLoS ONE, 3, e3838.
Cronk, Q.B. & Fuller, J.L. (1995) Plant invaders. Chapman and
Hall, New York.
Daehler, C.C., Denslow, J.S., Ansari, S. & Kuo, H.C. (2004) A
risk-assessment system for screening out invasive pest plants
from Hawaii and other Pacific islands. Conservation Biology,
18, 360–368.
Daniels, R.A. (2001) Untested assumptions: the role of canals in
the dispersal of sea lamprey, alewife, and other fishes in the
eastern United States. Environmental Biology of Fishes, 60,
309–329.
D’Antonio, C.M., Jackson, N.E., Horvitz, C.C. & Hedberg, R.
(2004) Invasive plants in wildland ecosystems: merging the
study of invasion processes with management needs. Frontiers
in Ecology and the Environment, 2, 513–521.
Darlington, P.J. (1959) Area, climate and evolution. Evolution,
13, 488–510.
Darwin, C. (1859) On the origin of species by means of natural
selection. Atheneum, New York. (1967 facsimile reproduction
of 1st edn.)
Davis, M.A., Grime, J.P. & Thompson, K. (2000) Fluctuating
resources in plant communities: a general theory of
invasibility. Journal of Ecology, 88, 528–534.
Dobzhansky, T. (1950) Evolution in the tropics. American Sci-
entist, 38, 209–221.
J. D. Fridley and D. F. Sax
Global Ecology and Biogeography, © 2014 John Wiley & Sons Ltd8
Elena, S.F. & Lenski, R.E. (2003) Evolution experiments with
microorganisms: the dynamics and genetic bases of adapta-
tion. Nature Reviews Genetics, 4, 457–469.
Elton, C. (1958) The ecology of invasions by animals and plants.
Methuen and Company, London.
Faith, D.P. (1992) Conservation evaluation and phylogenetic
diversity. Biological Conservation, 61, 1–10.
Felker-Quinn, E., Schweitzer, J.A. & Bailey, J.K. (2013) Meta-
analysis reveals evolution in invasive plant species but little
support for evolution of increased competitive ability (EICA).
Ecology and Evolution, 3, 739–751.
Fisher, R.A. (1930) The genetical theory of natural selection.
Oxford University Press, Oxford.
Flannery, T. (2002) The eternal frontier: an ecological history of
North America and its peoples. Grove, New York.
Fridley, J.D. (2008) Of Asian forests and European fields: eastern
U.S. plant invasions in a global floristic context. PLoS ONE, 3,
e3630.
Fridley, J.D. (2011) Biodiversity as a bulwark against invasion:
conceptual threads since Elton. Fifty years of invasion ecology:
the legacy of Charles Elton (ed. by D.M. Richardson), pp. 121–
130. Blackwell, London.
Fridley, J.D. (2013) Plant invasions across the Northern Hemi-
sphere: a deep-time perspective. Annals of the New York
Academy of Sciences, 1293, 8–17.
Fridley, J.D. et al. (2007) The invasion paradox: reconciling
pattern and process in species invasions. Ecology, 88, 3–17.
Funk, J.L. & Vitousek, P.M. (2007) Resource-use efficiency and
plant invasion in low-resource systems. Nature, 446, 1079–
1081.
Galil, B.S. (2006) The marine caravan–the Suez Canal and
the Erythrean invasion. Bridging divides (ed. by S. Gollasch,
B.S. Galil and A.N. Cohen), pp. 207–300. Springer,
Dordrecht.
Heywood, V.H., Brummitt, R.K., Culham, A. & Seberg, O.
(2007) Flowering plant families of the world. Firefly Books,
Richmond Hill, ON.
Hobbs, R.J. & Huenneke, L.F. (1992) Disturbance, diversity, and
invasion: implications for conservation. Conservation Biology,
6, 324–337.
Holm, L.G. (1991) The world’s worst weeds: distribution and
biology. Krieger, Malabar, FL.
Howell, C.J. (2008) Consolidated list of environmental weeds in
New Zealand. DOC Research and Development Series 292,
New Zealand Department of Conservation, Wellington.
Howell, C.J. & Sawyer, J.W.D. (2006) New Zealand naturalised
vascular plant checklist. New Zealand Plant Conservation
Network, Wellington.
Jacob, F. (1977) Evolution and tinkering. Science, 196, 1161–
1166.
Keane, R.M. & Crawley, M.J. (2002) Exotic plant invasions and
the enemy release hypothesis. Trends in Ecology and Evolution,
17, 164–170.
Körner, C. & Paulsen, J. (2004) A worldwide study of high
altitude treeline temperatures. Journal of Biogeography, 31,
713–732.
Le Breton, J., Jourdan, H., Chazeau, J., Orivel, J. & Dejean, A.
(2005) Niche opportunity and ant invasion: the case of
Wasmannia auropunctata in a New Caledonian rain forest.
Journal of Tropical Ecology, 21, 93–98.
Leigh, E.G., Vermeij, G.J. & Wikelski, M. (2009) What do human
economies, large islands and forest fragments reveal about the
factors limiting ecosystem evolution? Journal of Evolutionary
Biology, 22, 1–12.
Leimu, R., Mutikainen, P.I.A., Koricheva, J. & Fischer, M. (2006)
How general are positive relationships between plant popula-
tion size, fitness and genetic variation? Journal of Ecology, 94,
942–952.
Lenski, R.E., Rose, M.R., Simpson, S.C. & Tadler, S.C. (1991)
Long-term experimental evolution in Escherichia coli. I. Adap-
tation and divergence during 2,000 generations. The American
Naturalist, 138, 1315–1341.
Levine, J.M. & D’Antonio, C.M. (1999) Elton revisited: a review
of evidence linking diversity and invasibility. Oikos, 87,
15–26.
Liao, C., Peng, R., Luo, Y., Zhou, X., Wu, X., Fang, C., Chen, J. &
Bo Li, B. (2008) Altered ecosystem carbon and nitrogen cycles
by plant invasion: a meta-analysis. New Phytologist, 177, 706–
714.
MacArthur, R.H. (1972) Geographical ecology. Harper and Row,
New York.
MacDougall, A.S., Gilbert, B. & Levine, J.M. (2009) Plant inva-
sions and the niche. Journal of Ecology, 97, 609–615.
Mack, R.N. (2003) Phylogenetic constraint, absent life forms,
and preadapted alien plants: a prescription for biological
invasions. International Journal of Plant Science, 164, S185–
S196.
Pattison, R.R., Goldstein, G. & Ares, A. (1998) Growth, biomass
allocation and photosynthesis of invasive and native Hawaiian
rainforest species. Oecologia, 117, 449–459.
Pheloung, P.C., Williams, P.A. & Halloy, S.R. (1999) A weed risk
assessment model for use as a biosecurity tool evaluating
plant introductions. Journal of Environmental Management,
57, 239–251.
Por, F.D. (1978) Lessepsian migration: the influx of Red Sea biota
into the Mediterranean by way of the Suez Canal. Springer-
Verlag, New York.
Pysek, P., Sádlo, J. & Mandák, B. (2002) Catalogue of alien plants
of the Czech Republic. Preslia, 74, 97–186.
Rejmánek, M. (1989) Invasibility of plant communities. Biologi-
cal invasions: a global perspective (ed. by J.A. Drake, H.A.
Mooney & F. di Castri), pp. 369–388. Wiley, New York.
Richardson, D.M. (ed.) (2011) Fifty years of invasion ecology: the
legacy of Charles Elton. Blackwell, London.
Richardson, D.M. & Thuiller, W. (2007) Home away from home
– objective mapping of high-risk source areas for plant intro-
ductions. Diversity and Distributions, 13, 299–312.
Safi, K., Cianciaruso, M.V., Loyola, R.D., Brito, D.,
Armour-Marshall, K. & Diniz-Filho, J.A.F. (2011) Under-
standing global patterns of mammalian functional and
phylogenetic diversity. Philosophical Transactions of the Royal
Society B: Biological Sciences, 366, 2536–2544.
Darwinian framework for invasion biology
Global Ecology and Biogeography, © 2014 John Wiley & Sons Ltd 9
Sala, A., Smith, S.D. & Devitt, D.A. (1996) Water use by Tamarix
ramosissima and associated phreatophytes in a Mojave Desert
floodplain. Ecological Applications, 6, 888–898.
Sax, D.F. & Brown, J.H. (2000) The paradox of invasion. Global
Ecology and Biogeography, 9, 363–372.
Sax, D.F. & Gaines, S.D. (2008) Species invasions and extinction:
the future of native biodiversity on islands. Proceedings of the
National Academy of Sciences USA, 105, 11490–11497.
Schemske, D.W. (2009) Biotic interactions and speciation in the
tropics. Speciation and patterns of diversity (ed. by R. Butlin, J.
Bridle and D. Schluter), pp. 219–239. Cambridge University
Press, Cambridge.
Simberloff, D. (2000) Foreword. The ecology of invasions by
animals and plants (ed. by C.S. Elton) (reprint of 1958
edition), pp. vii–xiv. Methuen and Company, London.
Stachowicz, J.J. & Tilman, D. (2005) Species invasions and the
relationships between species diversity, community satura-
tion, and ecosystem functioning. Species invasions: insights
into ecology, evolution, and biogeography (ed. by D.F. Sax, S.D.
Gaines and J.J. Stachowicz), pp. 41–64. Sinauer, New York.
Strayer, D.L. & Jirka, K.J. (1997) The pearly mussels of New York
State. New York State Education Department, Albany, NY.
Takhtajan, A. (1986) Floristic regions of the world. University of
California, Berkeley, CA.
Tilman, D. (1999) The ecological consequences of changes in
biodiversity: a search for general principles. Ecology, 80, 1455–
1474.
Tilman, D. (2004) Niche tradeoffs, neutrality, and community
structure: a stochastic theory of resource competition, inva-
sion, and community assembly. Proceedings of the National
Academy of Sciences USA, 101, 10854–10861.
Tilman, D. (2011) Diversification, biotic interchange, and the
universal trade-off hypothesis. The American Naturalist, 178,
355–371.
Vermeij, G.J. (1991) When biotas meet: understanding biotic
interchange. Science, 253, 1099–1104.
Vermeij, G.J. (1996) An agenda for invasion biology. Biological
Conservation, 78, 3–9.
Vermeij, G.J. (2005) Invasion as expectation: a historical fact of
life. Species invasions: insights into ecology, evolution, and bio-
geography (ed. by D.F. Sax, S.D. Gaines and J.J. Stachowicz),
pp. 315–339. Sinauer, New York.
Vivrette, N.J. & Muller, C.H. (1977) Mechanism of invasion and
dominance of coastal grassland by Mesembryanthemum
crystallinum. Ecological Monographs, 47, 301–318.
Wardle, D.A., Bellingham, P.J., Fukami, T. & Mulder, C.P.H.
(2007) Promotion of ecosystem carbon sequestration by inva-
sive predators. Biology Letters, 3, 479–482.Additional references concerning sources of the data used in this studyare found at the end of Appendix S1 at [website URL].
SUPPORTING INFORMATION
Additional supporting information may be found in the online
version of this article at the publisher’s web-site.
Figure S1 Presentation of an alternative analysis to Fig. 2 using
floristic region rather than species as the unit of analysis.
Table S1 ANOVA tables of logistic regressions associated with
Fig. 2.
Appendix S1 Detailed methods.
BIOSKETCHES
Jason Fridley is a plant ecologist interested in the
assembly of plant communities from local to global
scales.
Dov Sax’s research interests include species invasions,
biotic responses to climate change and species
extinctions.
Editor: Gary Mittelbach
J. D. Fridley and D. F. Sax
Global Ecology and Biogeography, © 2014 John Wiley & Sons Ltd10
Supporting Information
Fridley, J.D. & Sax, D.F., The imbalance of nature: revisiting a Darwinian framework for
invasion biology
Appendix S1: Detailed methods
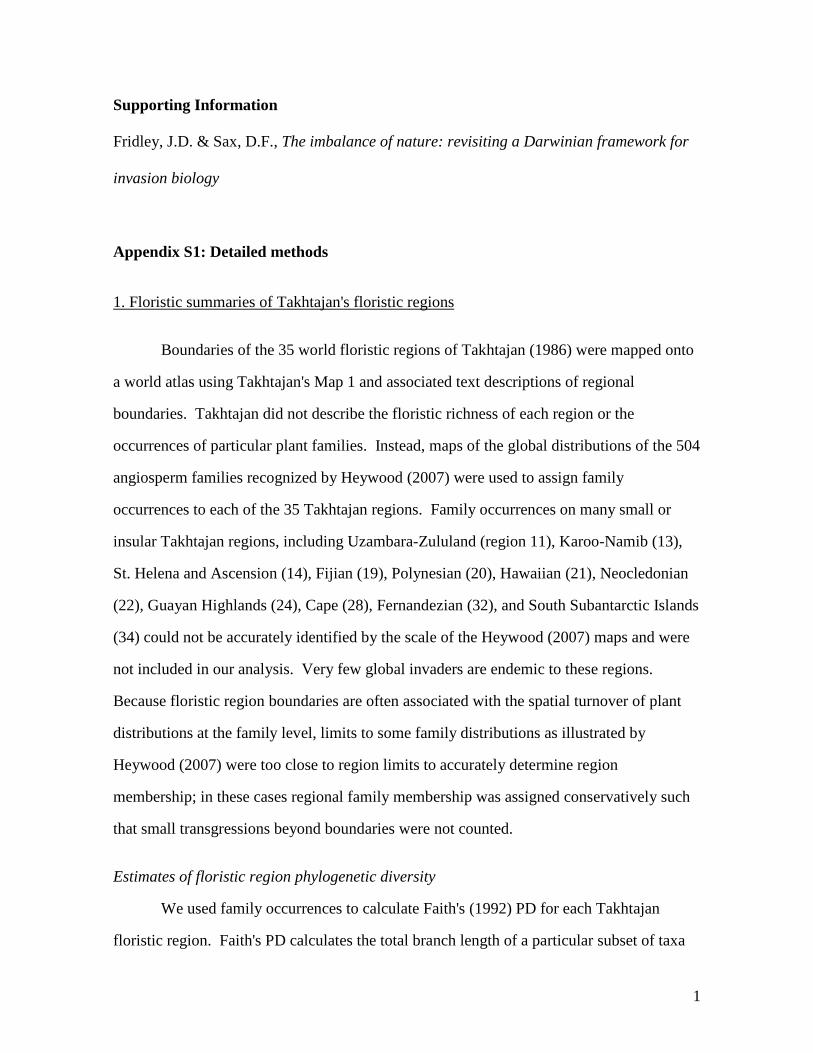
1. Floristic summaries of Takhtajan's floristic regions
Boundaries of the 35 world floristic regions of Takhtajan (1986) were mapped onto
a world atlas using Takhtajan's Map 1 and associated text descriptions of regional
boundaries. Takhtajan did not describe the floristic richness of each region or the
occurrences of particular plant families. Instead, maps of the global distributions of the 504
angiosperm families recognized by Heywood (2007) were used to assign family
occurrences to each of the 35 Takhtajan regions. Family occurrences on many small or
insular Takhtajan regions, including Uzambara-Zululand (region 11), Karoo-Namib (13),
St. Helena and Ascension (14), Fijian (19), Polynesian (20), Hawaiian (21), Neocledonian
(22), Guayan Highlands (24), Cape (28), Fernandezian (32), and South Subantarctic Islands
(34) could not be accurately identified by the scale of the Heywood (2007) maps and were
not included in our analysis. Very few global invaders are endemic to these regions.
Because floristic region boundaries are often associated with the spatial turnover of plant
distributions at the family level, limits to some family distributions as illustrated by
Heywood (2007) were too close to region limits to accurately determine region
membership; in these cases regional family membership was assigned conservatively such
that small transgressions beyond boundaries were not counted.
Estimates of floristic region phylogenetic diversity
We used family occurrences to calculate Faith's (1992) PD for each Takhtajan
floristic region. Faith's PD calculates the total branch length of a particular subset of taxa
1
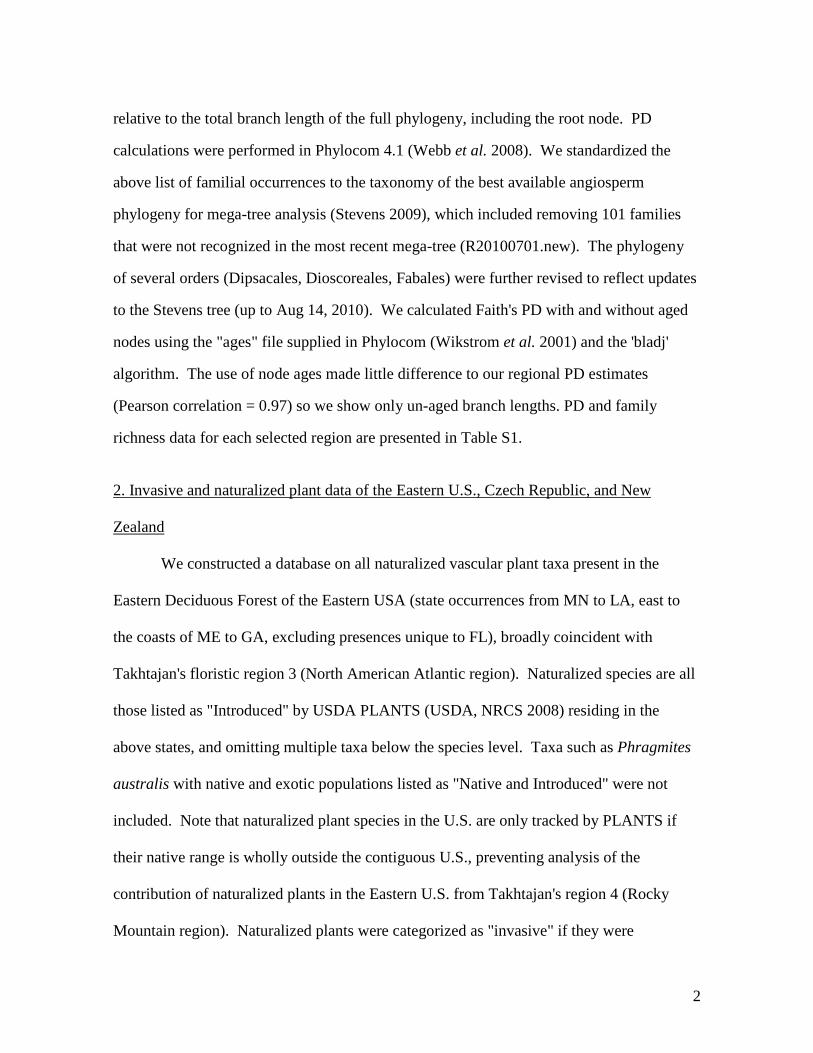
relative to the total branch length of the full phylogeny, including the root node. PD
calculations were performed in Phylocom 4.1 (Webb et al. 2008). We standardized the
above list of familial occurrences to the taxonomy of the best available angiosperm
phylogeny for mega-tree analysis (Stevens 2009), which included removing 101 families
that were not recognized in the most recent mega-tree (R20100701.new). The phylogeny
of several orders (Dipsacales, Dioscoreales, Fabales) were further revised to reflect updates
to the Stevens tree (up to Aug 14, 2010). We calculated Faith's PD with and without aged
nodes using the "ages" file supplied in Phylocom (Wikstrom et al. 2001) and the 'bladj'
algorithm. The use of node ages made little difference to our regional PD estimates
(Pearson correlation = 0.97) so we show only un-aged branch lengths. PD and family
richness data for each selected region are presented in Table S1.
2. Invasive and naturalized plant data of the Eastern U.S., Czech Republic, and New
Zealand
We constructed a database on all naturalized vascular plant taxa present in the
Eastern Deciduous Forest of the Eastern USA (state occurrences from MN to LA, east to
the coasts of ME to GA, excluding presences unique to FL), broadly coincident with
Takhtajan's floristic region 3 (North American Atlantic region). Naturalized species are all
those listed as "Introduced" by USDA PLANTS (USDA, NRCS 2008) residing in the
above states, and omitting multiple taxa below the species level. Taxa such as Phragmites
australis with native and exotic populations listed as "Native and Introduced" were not
included. Note that naturalized plant species in the U.S. are only tracked by PLANTS if
their native range is wholly outside the contiguous U.S., preventing analysis of the
contribution of naturalized plants in the Eastern U.S. from Takhtajan's region 4 (Rocky
Mountain region). Naturalized plants were categorized as "invasive" if they were
2
represented on the USDA PLANTS Weedy and Invasive Plants list for particular Eastern
U.S. regions, including the Northeast U.S. (Uva et al. 1997), Kentucky (Haragan 1991),
Tennessee/Southeast U.S. (Southeast Exotic Pest Plant Council 1996), or Wisconsin
(Hoffman & Kearns 1997), plus any remaining naturalized taxa that were indicated as
present in the selected states in the WeedsUS database maintained by the U.S. National
Park Service (Swearingen 2008). Our invasive plant definition for ENA is thus a
naturalized plant in the Eastern U.S. of significant management concern. Although
introduced plants of the Eastern U.S. have not been categorized as ‘casual’ versus ‘fully
naturalized’ as they have been in other non-native floras, we created a ‘casuals’ category of
non-invasive introduced species as those present in fewer than 10 U.S. counties or those
with no herbarium occurrences. The final dataset contained 2433 introduced species, of
which 1158 were only casuals and 431 were invasive.
Naturalized and invasive plant taxa of the Czech Republic were obtained from
Pyŝek et al. (2002), using their status designations of ‘casual’, 'naturalized', and 'invasive',
eliminating hybrids or species of unknown origin. This produced a list of 1199 introduced
species, including 745 casuals and 85 invaders. Casual (596) and fully naturalized (1639)
plant species of New Zealand were obtained from Howell & Sawyer (2006), with a subset
of 399 invaders from Howell et al. (2008), after restricting the analysis to species-level taxa
and removing species of unknown, hybrid, or cultivation origin.
All naturalized taxa for each dataset were assigned regions of origin (nativity)
according to the Takhtajan scheme through online queries to the Germplasm Resources
Information Network (USDA, ARS 2008), a central location of floristic distribution
information compiled from world floras for listed taxa. In a small but significant number of
cases where GRIN records were unavailable or did not clarify species distribution with
3
respect to Takhtajan boundaries, a number of other floras were consulted, including (but
not limited to) Flora of North America (FNA Committee 1993+), Flora of China (Wu &
Raven 1994+), Flora of Japan (Ohwi et al. 1965), Flora Europea (Tutin et al. 1964-1980),
Flora of the U.S.S.R. (Komarov 1934-1964), and, when necessary due to absence in a flora,
specimen distribution information available online at TROPICOS (version 1.5, Missouri
Botanical Garden, http://mobot.mobot.org/W3T/Search/vast.html). Online databases were
accessed between and 2007 and 2011.
3. Methods for biotic interchanges across the Panama, Erie and Suez Canals
Ascribing with certainty the movement of species by natural means across a canal is
rarely possible (Daniels 2001). Instead, we have considered species that are likely to have
dispersed across a canal or been moved by ships using these canals. Similarly, differences
in physical conditions on either side of a canal, as well as conditions within canals, are
likely to serve as a strong filter on which species are capable of dispersing or becoming
established (Aron & Smith 1971). Nevertheless, the differences or similarities in numbers
of species exchanged across such artificial bodies is instructive, particularly in aggregate
across several canals, in evaluating whether such evidence is consistent with the predictions
of EIH. In each case we examined evidence of an asymmetry between observed and
expected frequencies with a binomial model that tested the null hypothesis that the actual
number of exchanged species in one region (N) is consistent with that expected from N
random draws from the overall (exchanged) species pool. We describe each of our five
cases below.
Suez Canal – Marine Fishes: The number of native species of fishes for the Red Sea is from
Golani & Bogorodsky (2010), whereas the number for the Mediterranean was tabulated
from FishBase (Froese & Pauly 2008). The number of shared native species between
regions was determined by comparing species lists generated from FishBase for both
4
regions. The number of non-native species in the Mediterranean of Red Sea origin were
tabulated by cross-checking the total list of established exotic fishes in the Mediterranean
(Zenetos et al. 2010) against those native to the Red Sea (Golani & Bogorodsky 2010).
The number of fishes of Mediterranean origin in the Red Sea are from Golani (1999). If we
had compared Red Sea invaders against only those species in the Eastern Mediterranean,
the numbers of species would have changed relatively little and the significant asymmetry
of the result presented in Table 2 would still be below a P value of 0.05. The number of
native species in the Eastern Mediterranean is 408 and the number of non-natives from the
Red Sea is 48. Finally, although we listed seven species as being established in the Red
Sea, several are restricted to the Northern Gulf of Suez region, in relatively close proximity
to the Canal; four species are found in other parts of the Red Sea (Golani 1999), but none of
these species appear to be widely distributed (Por & Dimentman 2006). This is in sharp
contrast to fishes that have invaded the Mediterranean, which have become so abundant
that they are now commercially important (Boudouresque 1999).
Suez Canal – Marine Mollusks: The number of native species of mollusks for the Red Sea
is from Dekker & Orlin (2000), whereas the number for the Mediterranean is from Coll et
al. (2010). The number of shared native species between regions was not evaluated, but is
likely to be small; however, given the observed exchange values, even a large number of
shared species would not change the significance of the asymmetry observed. The number
of non-native species in the Mediterranean of Red Sea origin was tabulated by cross-
checking the total list of established exotic mollusks in the Mediterranean (Zenetos et al.
2010) against those native to the Red Sea, as determined by accessing one or more of
several online databases, including A Biotic Database of Indo-Pacific Marine Mollusks,
CIESM.org, World Register of Marine Species, and other sources. The presence of
Mediterranean invaders in the Red Sea was evaluated by consulting Barash & Danin
(1987), Dekker & Orlin (2000), and Rusmore-Villaume (2008). From these publications,
5
four candidate invaders arise, but each can be shown to be species already present in the
Red Sea before the opening of the Suez Canal or not clearly having established populations
in the Red Sea. The number of native species recorded for the Red Sea is an underestimate
of the actual number (Dekker & Orlin 2000). The true number is difficult to determine and
will only become apparent with further study. Nevertheless, even a doubling of this
number would not change the statistical significance of the asymmetry indicated in Table 2.
Finally, as in the fishes described above, some mollusk species invading the Mediterranean
have become abundant and invasive (Gofas & Zenetos 2003).
Erie Canal Freshwater Fishes: The numbers of native species of fishes for the Lake Ontario
Basin and for the Hudson River Basin, which includes the Hudson and Mohawk drainages,
are from Carlson & Daniels (2004). Species that were exclusively estuarine in distribution
were excluded from these counts. The number of non-native species are from Mills et al.
(1993, 1997) and Owens et al. (1998). The number of species of fishes established in the
Lake Ontario Basin that are from the Hudson River Basin is disputed; we indicated 3
species in Table 2, but there are four potential candidates and we believe that the actual
number is likely to be 2 or 3 species. One species, Morone americana (white perch), clearly
dispersed from the Hudson River Basin to Lake Ontario through the Erie Canal (Mills et al.
1993). A second species, Alosa aestivalis (blueback herring), was first observed in Lake
Ontario in 1995 (Owens et al. 1998). The only other known observation in Lake Ontario
was an adult caught in 2006 (Robert O'Gorman, pers. comm.), but the length of time
between sightings suggests that this species might be established in Lake Ontario in low
numbers. A third species, Alosa pseudoharengus (alewife), while of contested origin in
Lake Ontario (Mills et al. 1993), appears based on allozyme variation, to have invaded
Lake Ontario from the Hudson River Basin (Ihssen et al. 1992). The status of fourth
species, Petromyzon marinus (sea lamprey), is debated in the literature (Eshenroder 2009;
Waldman et al. 2009), but the preponderance of data seems to indicate that it is native to
6
Lake Ontario. Even if the final tally of invaders to the Lake Ontario Basin is only two
species, the exchange is still not significantly asymmetrical; consequently the results shown
in Table 2 are robust to the range of possible invaders reported in the literature.
Erie Canal Freshwater Mollusks: Freshwater species in the family Sphaeriidae (order
Veneroida) were excluded from consideration because of the limited information available
on the their current and historical distributions. The numbers of freshwater species of
Gastropoda and Unionoida that are natives and invaders were determined from several
sources (Strayer 1987, 1990; Jokinen 1992; Strayer & Jirka 1997); Strayer, pers. comm.).
Species that invaded through the Erie Canal, but which are not native to one of the two
basins were excluded from all counts; this excludes Eurasian invaders, as well as species
native to North America that invaded the Lake Ontario Basin and subsequently invaded the
Hudson River Basin. Species only observed once within the invaded range were also
excluded. Species observed at two or more locations with an invaded basin were
considered to have been established and hence included in the species counts. Many of the
native and invader species may no longer be established in these basins due to changes in
environmental conditions, including pollution of aquatic environments (Strayer & Jirka
1997). The numbers of species listed in Table 2 represent a best estimate, but there is some
uncertainty in these numbers as a consequence of limited current and historical distribution
data, as well as disagreements over the taxonomy of some species (Jokinen 1992; Strayer &
Jirka 1997). Two additional species not included in our counts, Alasmidonta undulata and
Lampsilis cariosa, may have invaded the Lake Ontario Basin, although they may have
arrived under their own power prior to the establishment of the Erie Canal (Strayer & Jirka
1997). Similarly, one additional species, Elimia livescens, that did invade the Hudson
River Basin through the Erie Canal, was not included in our counts because it is probably
not native to the Lake Ontario Basin (Jokinen 1992). However, the results presented in
Table 2 are robust to the decision to exclude these species, because if we had included them
7
the observed exchange ratio would have become even closer to the expected ratio, i.e., even
more symmetrical.
Panama Canal Freshwater Fishes: The numbers of native and naturalized species from both
drainages are from Smith et al. (2004).
Supporting Information References
Aron, W. I. & Smith, S. H. (1971) Ship canals and aquatic ecosystems. Science, 174, 13-20.
Barash, A. L. & Danin, Z. (1987) Red Sea malacology V: Notes on the antilessepsian
migration of Mediterranean species of Mollusca into the Indo-Pacific region. Gloria
Maris, 26, 81-100.
Boudouresque, C. F. (1999) The Red Sea – Mediterranean link: unwanted effects of canals.
Invasive Species and Biodiversity Management (ed. by Sandlund, T., et al.), pp.
213-228. Kluwer, Netherlands.
Carlson, D. M. & Daniels, R. A. (2004) Status of fishes in New York: Increases, declines
and homogenization of watersheds. American Midland Naturalist, 152, 104-139.
Coll, M., et al. (2010) The biodiversity of the Mediterranean Sea: Estimates, patterns, and
threats. PLoS One, 5, e11842.
Daniels, R. A. (2001) Untested assumptions: the role of canals in the dispersal of sea
lamprey, alewife, and other fishes in the eastern United States. Environmental
Biology of Fishes, 60, 309-329.
Dekker, H. & Orlin, Z. (2000) Check-list of Red Sea Mollusca. Spirula, 47 (supplement),
1-46.
8
Eshenroder, R. L. (2009) Comment: Mitochondrial DNA analysis indicates sea lampreys
are indigenous to Lake Ontario. Transactions of the American Fisheries Society,
138, 1178-1189.
Faith, D. P. Conservation evaluation and phylogenetic diversity. (1992) Biological
Conservation, 61, 1-10.
Flora of North America Editorial Committee (eds.). (1993+) Flora of North America North
of Mexico. Oxford University Press, Oxford, UK.
Froese, R. & Pauly, D. (eds.). (2008) FishBase. World Wide Web electronic publication.
www.fishbase.org, version 02/2008.
Gofas, S. & Zenetos, A. (2003) Exotic molluscs in the Mediterranean basin: Current status
and perspectives. Oceanography and Marine Biology: an Annual Review, 41, 237-
277.
Golani, D. & Bogorodsky, S. V. (2010) The fishes of the Red Sea - reappraisal and updated
checklist. Zootaxa, 2463, 1-135.
Golani, D. (1999) The Gulf of Suez Ichthyofauna – assemblage pool for Lessespsian
migration into the Mediterranean. Israel Journal of Zoology, 45, 79-90.
Golani, D., Ozturk, B. & Basusta, N. (2006) Fishes of the eastern Mediterranean. Turkish
Marine Research Foundation.
Haragan, P. D. (1991) Weeds of Kentucky and adjacent States: a field guide. University
Press of Kentucky, Lexington, KY.
Heywood, V. H., Brummitt, R. K., Culham, A. & Seberg, O. (2007) Flowering plant
families of the world. Firefly Books, Ontario.
9
Hoffman, R. & Kearns, K. (eds.) (1997) Wisconsin manual of control recommendations for
ecologically invasive plants. Wisconsin Dept. Natural Resources.
Howell, C. J. & Sawyer, J. W. D. (2006) New Zealand naturalised vascular plant checklist.
New Zealand Plant Conservation Network.
Howell, C. J. (2008) Consolidated list of environmental weeds in New Zealand. Doc
research and development series 292, New Zealand Department of Conservation.
Ihssen, P. E., Martin, G. W., Rogers, D. W. (1992) Allozyme variation of Great Lakes
alewife, Alosa pseudoharengus: Genetic differentiation and affinities of a recent
invader. Canadian Journal of Fisheries and Aquatic Sciences, 49, 1770-1777.
Jalas, J. & Suominen, J. (eds.) (1972) Atlas Florae Europaeae. Distribution of Vascular
Plants in Europe. 1. Pteridophyta (Psilotaceae to Azollaceae. The Committee for
Mapping the Flora of Europe & Societas Biologica Fennica Vanamo.
Jokinen, E. H. (1992) The Freshwater Snails (Mollusca: Gastropoda) of New York State.
The New York State Museum, Albany, NY.
Komarov, V. L. (ed.) (1934-1964) Flora of the USSR. Translated from the Russian by the
Israel Program for Scientific Translations for the Smithsonian Institute.
Mills, E. L. Scheuerell, M. D., Carlton, J. T. & Strayer, D. L. (1997) Biological Invasions
in the Hudson River Basin: An inventory and historical analysis. New York State
Museum, Albany, NY.
Mills, E. L., Leach, J. H., Carlton, J. T. & Secor, C. L. (1993) Exotic species in the Great
Lakes: A history of biotic crises and anthropogenic introductions. Journal of Great
Lakes Research, 19, 1-54.
10
Ohwi, J., Meyer, F. G. & Walker, E. H. (1965) Flora of Japan. Smithsonian, Washington,
D.C.
Owens, R.J., et al. (1998) Blueback herring (Alosa aestivalis) in Lake Ontario: First record,
entry route, and colonization potential. Journal of Great Lakes Research, 24, 723-
730.
Por, F. D. & Dimentman, C. (2006) Mare Nostrum – Neogene and anthropic natural
history of the Mediterranean Basin, with emphasis on the Levant. Pensoft, Sofia,
Bulgaria.
Pyŝek, P., Sádlo, J. & Mandák, B. (2002) Catalogue of alien plants of the Czech Republic.
Preslia, 74, 97-186.
Rusmore-Villaume, M. L. (2008) Seashells of the Egyptian Red Sea: The illustrated
handbook. American University in Cairo Press, Cairo, Egypt.
Smith, S.A., Bell, G. & Bermingham, E. (2004) Cross-cordillera exchange mediated by the
Panama Canal increased the species richness of local freshwater fish assemblages.
Proceedings of the Royal Society of London B, 271, 1889-1896.
Southeast Exotic Pest Plant Council. (1996) Invasive Exotic Pest Plants in Tennessee.
Research Committee of the Tennessee Exotic Pest Plant Council.
Stevens, P. F. (2010) Angiosperm Phylogeny Website. Version 10, June 2009 [accessed
before and up to Aug 14, 2010]. http://www.mobot.org/MOBOT/research/APweb/.
Strayer, D. (1987) Ecology and zoogeography of the freshwater mollusks of the Hudson
River Basin. Malacological Review, 20, 1-68.
11
Strayer, D. (1990) Freshwater Mollusca. Freshwater macroinvertebrates of northeastern
North America (ed. by Peckarsky, B. L., et al.), pp. 335-372. Cornell University
Press, Ithaca, New York.
Strayer, D. L. & Jirka, K. J. (1997) The Pearly Mussels of New York State. The New York
State Education Department.
Swearingen, J. (2008) WeedUS: Database of plants invading natural areas in the United
States [accessed 2008]. http://www.nps.gov/plants/alien/list/WeedUS.xls
Takhtajan, A. (1986) Floristic regions of the world. University of California Press,
Berkeley, CA.
Tutin, T. G. et al. (eds.) (1964-1980) Flora europaea. Royal Botanic Garden Edinburgh.
Accessed online. http://rbg-web2.rbge.org.uk/FE/fe.html
USDA, ARS, National Genetic Resources Program. (2008) Germplasm Resources
Information Network - (GRIN) [Online Database]. National Germplasm Resources
Laboratory, Beltsville, MD. http://www.ars-grin.gov/cgi-
bin/npgs/html/tax_search.pl
USDA, NRCS. (2008) The PLANTS Database. http://plants.usda.gov. National Plant Data
Center, Baton Rouge, LA.
Uva, R. H., Neal, J. C. & DiTomaso, J. M. (1997) Weeds of the Northeast. Cornell
University Press, Ithaca, NY.
Waldman, J., Daniels, R., Hickerson, M. & Wirgin, I. (2009) Mitochondrial DNA analysis
indicates sea lampreys are indigenous to Lake Ontario: Response to comment.
Transactions of the American Fisheries Society, 138, 1190-1197.
12
Webb, C. O., Ackerly, D. D. & Kembel, S.W. (2008) Phylocom: software for the analysis
of phylogenetic community structure and trait evolution. Bioinformatics, 24, 2098-
2100.
Wikstrom, N., Savolainen, V. & Chase, M. W. (2001) Evolution of angiosperms:
calibrating the family tree. Proceedings of the Royal Society of London B, 268,
2211–2220.
Wu, Z.-y. & P. H. Raven, P. D. (eds.) (1994+) Flora of China. Science Press, Missouri
Botanical Garden. Accessed online.
http://www.efloras.org/flora_page.aspx?flora_id=2
Zenetos, A., et al. (2010) Alien species in the Mediterranean Sea by 2010. A contribution to
the application of European Union’s Marine Strategy Framework Directive
(MSFD). Part I. Spatial distribution. Mediterranean Marine Science, 11, 381-493.
13
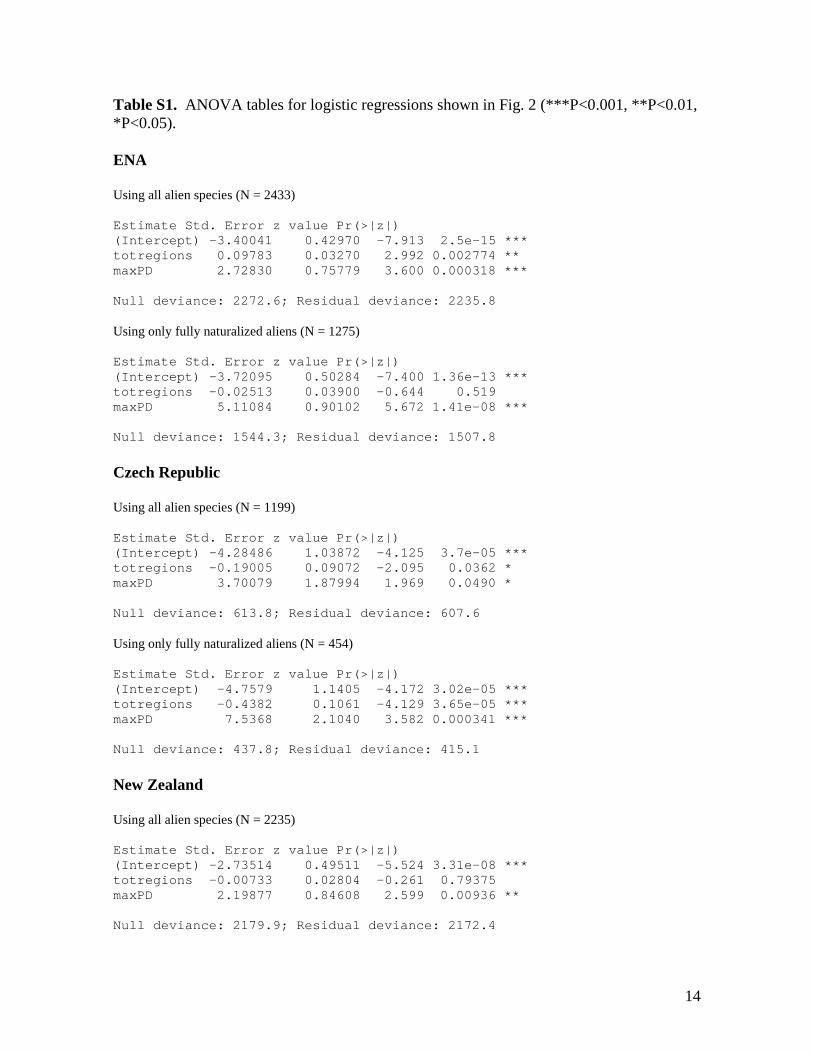
Table S1. ANOVA tables for logistic regressions shown in Fig. 2 (***P<0.001, **P<0.01, *P<0.05). ENA Using all alien species (N = 2433) Estimate Std. Error z value Pr(>|z|) (Intercept) -3.40041 0.42970 -7.913 2.5e-15 *** totregions 0.09783 0.03270 2.992 0.002774 ** maxPD 2.72830 0.75779 3.600 0.000318 *** Null deviance: 2272.6; Residual deviance: 2235.8 Using only fully naturalized aliens (N = 1275) Estimate Std. Error z value Pr(>|z|) (Intercept) -3.72095 0.50284 -7.400 1.36e-13 *** totregions -0.02513 0.03900 -0.644 0.519 maxPD 5.11084 0.90102 5.672 1.41e-08 *** Null deviance: 1544.3; Residual deviance: 1507.8 Czech Republic Using all alien species (N = 1199) Estimate Std. Error z value Pr(>|z|) (Intercept) -4.28486 1.03872 -4.125 3.7e-05 *** totregions -0.19005 0.09072 -2.095 0.0362 * maxPD 3.70079 1.87994 1.969 0.0490 * Null deviance: 613.8; Residual deviance: 607.6 Using only fully naturalized aliens (N = 454) Estimate Std. Error z value Pr(>|z|) (Intercept) -4.7579 1.1405 -4.172 3.02e-05 *** totregions -0.4382 0.1061 -4.129 3.65e-05 *** maxPD 7.5368 2.1040 3.582 0.000341 *** Null deviance: 437.8; Residual deviance: 415.1 New Zealand Using all alien species (N = 2235) Estimate Std. Error z value Pr(>|z|) (Intercept) -2.73514 0.49511 -5.524 3.31e-08 *** totregions -0.00733 0.02804 -0.261 0.79375 maxPD 2.19877 0.84608 2.599 0.00936 ** Null deviance: 2179.9; Residual deviance: 2172.4
14

Using only fully naturalized aliens (N = 1639) Estimate Std. Error z value Pr(>|z|) (Intercept) -3.13999 0.52662 -5.963 2.48e-09 *** totregions -0.07062 0.03157 -2.237 0.0253 * maxPD 3.69220 0.90612 4.075 4.61e-05 *** Null deviance: 1819.3; Residual deviance: 1799.0
15
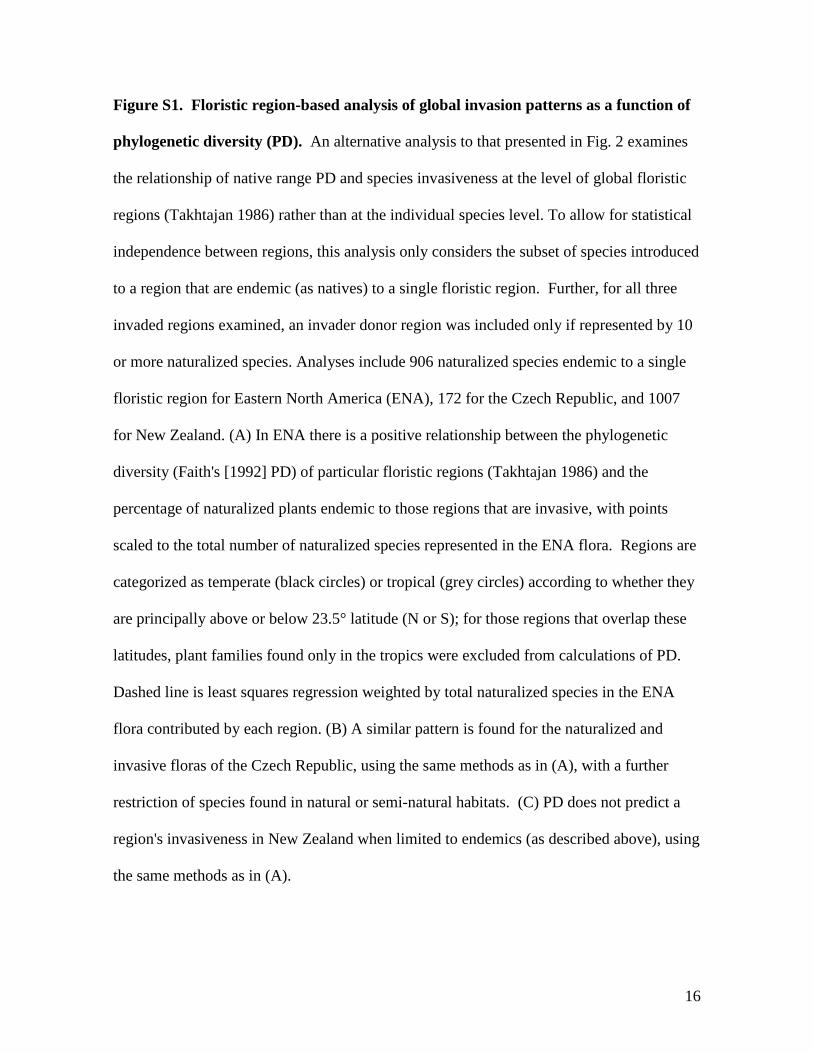
Figure S1. Floristic region-based analysis of global invasion patterns as a function of
phylogenetic diversity (PD). An alternative analysis to that presented in Fig. 2 examines
the relationship of native range PD and species invasiveness at the level of global floristic
regions (Takhtajan 1986) rather than at the individual species level. To allow for statistical
independence between regions, this analysis only considers the subset of species introduced
to a region that are endemic (as natives) to a single floristic region. Further, for all three
invaded regions examined, an invader donor region was included only if represented by 10
or more naturalized species. Analyses include 906 naturalized species endemic to a single
floristic region for Eastern North America (ENA), 172 for the Czech Republic, and 1007
for New Zealand. (A) In ENA there is a positive relationship between the phylogenetic
diversity (Faith's [1992] PD) of particular floristic regions (Takhtajan 1986) and the
percentage of naturalized plants endemic to those regions that are invasive, with points
scaled to the total number of naturalized species represented in the ENA flora. Regions are
categorized as temperate (black circles) or tropical (grey circles) according to whether they
are principally above or below 23.5° latitude (N or S); for those regions that overlap these
latitudes, plant families found only in the tropics were excluded from calculations of PD.
Dashed line is least squares regression weighted by total naturalized species in the ENA
flora contributed by each region. (B) A similar pattern is found for the naturalized and
invasive floras of the Czech Republic, using the same methods as in (A), with a further
restriction of species found in natural or semi-natural habitats. (C) PD does not predict a
region's invasiveness in New Zealand when limited to endemics (as described above), using
the same methods as in (A).
16
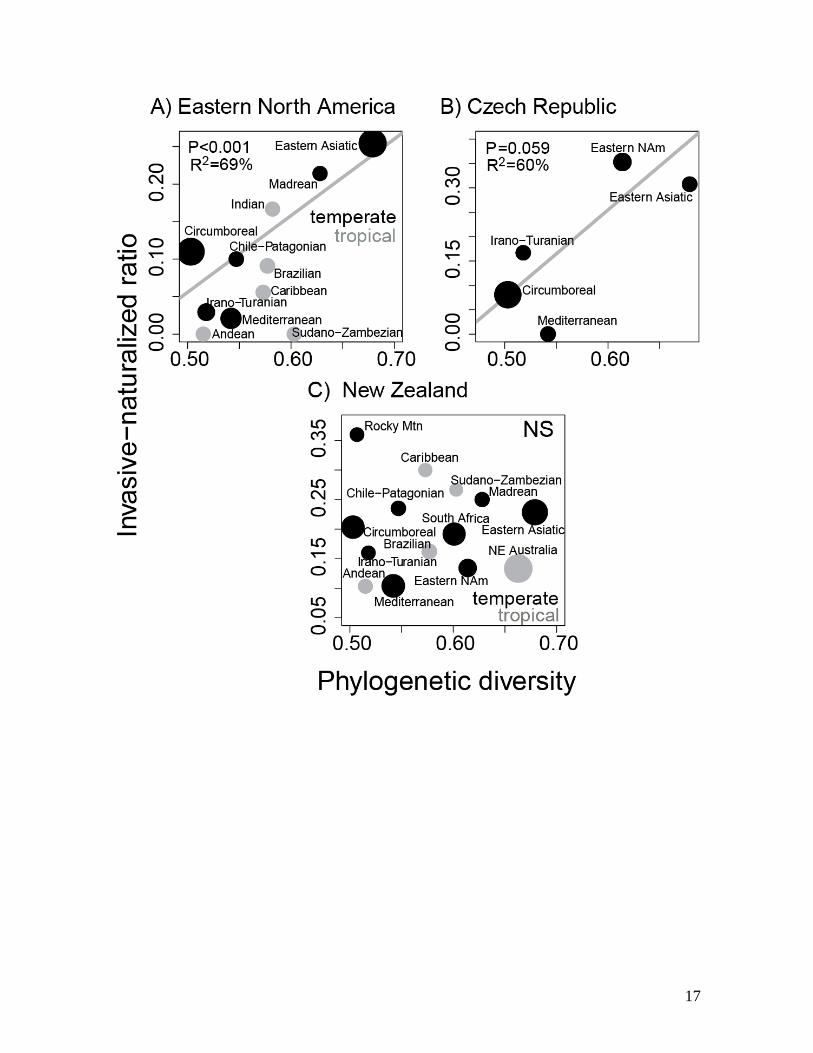
17