ecological and socio-cultural factors influencing plant management in náhuatl communities of the...
TRANSCRIPT

Ecological and socio-cultural factors influencingplant management in Náhuatl communities ofthe Tehuacán Valley, MexicoBlancas et al.
Blancas et al. Journal of Ethnobiology and Ethnomedicine 2013, 9:39http://www.ethnobiomed.com/content/9/1/39
JOURNAL OF ETHNOBIOLOGY AND ETHNOMEDICINE

RESEARCH Open Access
Ecological and socio-cultural factors influencingplant management in Náhuatl communities ofthe Tehuacán Valley, MexicoJosé Blancas1, Alejandro Casas1*, Diego Pérez-Salicrup1, Javier Caballero2 and Ernesto Vega1
Abstract
Background: Management types and their intensity may vary according to indicators such as: (1) practices complexity,(2) degree of techniques specialization, (3) occurrence and types of social regulations, (4) artificial selection intensity,(5) energy invested, (6) tools types, and (7) amounts of resources obtained. Management types of edible plants werecharacterized and analyzed in Náhuatl communities of the Tehuacán Valley. We expected that both natural and humanpressures generate risk on plant resources availability, influencing human responses of management directed to decreaserisk. We particularly hypothesized that magnitude of risk would be a direct function of human pressures favored by culturaland economic value and ecological factors such as scarcity (restricted distribution and abundance). Management practicesmay decrease risk of plant resources, more effectively when they aremore intense; however, absence or insufficiency ofmanagement practices on endangered plants may favor loss of their populations. Understanding current managementmotives and their consequences on the purpose of ensuring availability of plant resourcesmight allow us to understandsimilar processes occurring in the past. This issue is particularly important to be studied in the Tehuacán Valley, wherearchaeologists documented possible scenarios motivating origins of plant management by agriculture during prehistory.
Methods: Through ethnobotanical collecting, 55 semi-structured and free listing interviews we inventoried edible plantspecies used in five villages of Coyomeapan, Mexico. We identified: (1) native plant species whose products are obtainedexclusively through simple gathering, (2) native species involving simple gathering and other management types, and(3) non-native species managed by agricultural management. We conducted in depth studies on the 33 native speciesmanaged through gathering and other types of practices. We carried out a total of 660 sessions of detailed interviews to20 households randomly selected. We showed to people voucher specimens and photos of the sample of specieschosen and documented their cultural and economic values. Spatial availability of these plant species was evaluatedthrough vegetation sampling. Values for each cultural, economic, and ecological indicator were codified and averaged orsummed and weighed according to frequency of interviewees’ responses or ecological conditions per plant species.With the standardized values of these indicators we performed a PCA and scores of the first principal component wereconsidered as a risk index, which summarizes information of thirteen indicators of human use, demand and scarcity ofeach plant species. Similarly, eleven indicators of energy invested, complexity, tools and management strategies wereused for performing PCA and scores of the first principal component were considered as management intensity index foreach plant species. A linear regression analysis was performed to analyze the relation between risk and managementintensity indexes. Amounts of variation of management data explained by ecological, cultural and economic information,as well as their risk level were analyzed through canonical correspondence analyses (CCA).(Continued on next page)
* Correspondence: [email protected] de Investigaciones en Ecosistemas (CIECO), Universidad NacionalAutónoma de México (campus Morelia), Antigua Carretera a Pátzcuaro 8711Col. Ex Hacienda de San José de la Huerta, Morelia, Michoacán 58190, MéxicoFull list of author information is available at the end of the article
JOURNAL OF ETHNOBIOLOGY AND ETHNOMEDICINE
© 2013 Blancas et al.; licensee BioMed Central Ltd. This is an Open Access article distributed under the terms of the CreativeCommons Attribution License (http://creativecommons.org/licenses/by/2.0), which permits unrestricted use, distribution, andreproduction in any medium, provided the original work is properly cited.
Blancas et al. Journal of Ethnobiology and Ethnomedicine 2013, 9:39http://www.ethnobiomed.com/content/9/1/39
(Continued from previous page)
Results: A total of 122 edible plant species were recorded, nearly 30% of them were introduced domesticated plants,51 were wild species obtained exclusively by simple gathering and 33 were native species obtained by simplegathering and other management practices, these latter were the ones more deeply studied. People recognizedvariants in 21 of these latter 33 species, the variants receiving differential use, management, artificial selection andincipient domestication. The lowest values of management intensity corresponded to species under simple gatheringand tolerance, mostly annual abundant plants, occasionally consumed by few people. The highest managementintensity values were recorded in species with economic importance, mostly perennial with recognized variants whosemanagement requires using tools, and which are protected by collective regulations. The regression analysis indicatedsignificant value R2 = 0.433 (P < 0.001) between risk and management indexes. CCA explained 65.5% of variation ofmanagement intensity, mainly by socio-cultural factors (32.6%), whereas ecological data explained 21.3% and theintersection of all factors 11.6%. Variation of management intensity is 67.6% explained by risk variables. Length-spanof life cycle, reproductive system type, distribution, number of parts used, number of management and use formsand type of regulations were statistically significant.
Conclusion: People manage plant resources according to the role these play in households’ subsistence, the quantityavailable and the quality of their useful products; particularly important is the balance between resources availability anddemand. Management responses to risk are also influenced by the ease to propagate or manipulate individual plantsand time requiring the construction of manipulation strategies and techniques.
Keywords: Domestication, Food Security, Plant Management, Risk Management, Tehuacán Valley
BackgroundHumans have developed different types of interactions withtheir surrounding ecosystems and natural resources, con-tinually shaping them according to their subsistence needsand other cultural purposes. Such shaping process is do-mestication and may involve particular resources andecosystems. We generally define management as practicesdirected to transforming or adapting ecosystems, theircomponents (e.g. natural resources) and/or its processes(e.g. ecosystem functions and services) according to humanpurposes [1-4]. For instance, in Mesoamerica forest ma-nagement practices are commonly targeted at promotingcertain compositions of vegetation, in order to ensure orincrease the availability of populations of particular species,or individual phenotypes within populations which havedesirable features to people [1,2,5]. Our study area is partof Mesoamerica and we were particularly interested indocumenting the motives associated to such managementtypes of forests.The Mexican territory is highly diverse in ecosystems,
species and human cultures [6]. Some authors have esti-mated that nearly 7,000 plant species are used by peoples inthis country [7]. However, not all species are equally valued,since human groups recognize different properties andqualities of particular plant species for satisfying their needs,which influences how valuable the resources are, and suchvalue may in turn influence how plants are managed [1-3].In addition, peoples have developed ecological knowledgeabout plants they use (life cycle, distribution, abundance,interactions with other organisms) [8-10] and this infor-mation also influences the ways they interact with plants.
Human cultural values and traditional ecological know-ledge of plant resources are therefore crucial for makingmanagement decisions in order to ensure or increase avai-lability and/or quality of desired plant resources. These cri-teria are valid for particular species but also for particularphenotypic variants of a species [2,5]. A plant species maybe managed differently in variable ecological and culturalcontexts, and may involve different management inten-sities, degrees of specialization and complexity of practices[1,5,11-13]. To understand the motives of managementand domestication of plants it is therefore helpful toanalyze cultural and economic values of plant resources inrelation to their spatial availability and all these factors inrelation to management complexity and intensity.Cultural importance of plant resources has been evalu-
ated through their use frequency, amounts of productsharvested or consumed, use preference, and the explicitvalue that people attribute to them [14-17]. Their eco-nomic importance has been evaluated through informa-tion about their exchange for other products, prices inmarkets, the economic value of other goods that mightsubstitute a plant resource, or through evaluating the bal-ance between availability and demand of products [18].Plant resource availability has been calculated throughecological aspects such as distribution, abundance, tem-poral availability of useful products, adaptability to dis-turbed environments, length of life cycle, reproductivesystem type, seed dormancy or special requirements forgermination, among others [3,5,19].Several authors have proposed different criteria for
characterizing and classifying plant management types
Blancas et al. Journal of Ethnobiology and Ethnomedicine 2013, 9:39 Page 2 of 22http://www.ethnobiomed.com/content/9/1/39

[1,3,5,11,12,20-24]; most of them agree that complexityof practices and the occurrence of artificial selectionare meaningful aspects that can be found in a gradientof conditions and should be the bases for developingplant management typologies [3,23,24]. In Mexico, ethno-botanical studies have documented different forms ofplant management at individual, population, or com-munity levels involving wild, weedy, and domesticatedplants; such variation allows analyzing variation ofmanagement forms as well as causes of that variation.Gathering and agriculture are two main categories ofhuman-plants interactions, but some intermediate man-agement types or “incipient” management forms have alsobeen documented [1,2,5,11,12,25-27]. Management prac-tices may be carried out in the habitats where plantsnaturally occur (forests in the case of wild plants andhuman-made environments in the case of weeds), andfor this reason these are called in situ management tech-niques. Other practices are conducted out of the naturalenvironments of plants and for this reason are called exsitu management techniques [1,5,11,12].Most approaches to classify management types highlight
the importance of artificial selection which may vary in in-tensity according to the degree of systematic decisions ofeliminating non-preferred phenotypes and enhancing thosepreferred by people, the degree of isolation of managedplant populations with respect to their wild relatives, thelength of life cycle, or the type of reproductive system,among other aspects [1]. Artificial selection has been docu-mented most commonly to occur in human made environ-ments out of natural plant species populations. However,some studies have documented the occurrence of artificialselection in situ, associated to silvicultural practices, by se-lectively let standing and/or removing species or particularphenotypes in vegetation, or in association with propaga-tion of seeds or vegetative propagules of desirable pheno-types [1-5].We have proposed that in addition to artificial selec-
tion, other criteria used by agroecologists as indicatorsof agricultural management intensity [28] may also behelpful for general characterizations of plant manage-ment [3]. In a previous study we discussed a typology ofplant management forms based on information on useand management of nearly 1600 useful plant species ofthe Tehuacán Valley [3]. We proposed that such ty-pology should consider the following aspects: i) energyinvested in practices (for instance hours and effortdedicated to management practices), use of fuel or fos-sil energy, use of tools or machines involving energypreviously invested in producing them; ii) managementstrategies, planning, regulations and techniques, iii) occur-rence of artificial selection and degree of intensity of thisevolutionary force; and iv) production, in terms of amountor biomass of useful product per area unit. All these
aspects may be indicators of creativity, measurable en-ergy invested in practices, degree of human interest onmanaged plant resource, benefits obtained by practices,and degree of domestication of a plant resource. Suchindicators can be observed in gradients of values fromlower to higher and, accordingly, may be indicators ofmanagement intensity.This study analyzed how such general categories of
management and management intensity indicators arefound in a case study: the edible plants used by Náhuatlcommunities of the Tehuacán Valley, central Mexico. Wedocumented in detail all practices involved in plant man-agement to establish more precisely than in our previousstudies which indicators are relevant for classifying andconstructing a precise typology. In addition, we analyzedcultural and economic values of the plant resources stu-died along with their abundance or scarcity in their terri-tories. Relations of all these indicators were examined inorder to identify motives of management associated toneeds of ensuring or increasing plant resources availabi-lity or local people worries about plant resources avai-lability or risk. We expected that both natural andhuman pressures generate risk on plant resources avail-ability, influencing human responses of management di-rected to decrease risk. We particularly hypothesizedthat magnitude of risk would be a direct function of hu-man pressures favored by cultural and economic valueand ecological factors such as scarcity (restricted distri-bution and abundance). Management practices may de-crease risk of plant resources, more effectively whenthey are more intense; however, absence or insufficiencyof management practices on endangered plants mayfavor loss of their populations. Understanding currentmanagement motives and their consequences on thepurpose of ensuring availability of plant resources mightallow us to understand similar processes occurring in thepast. This issue is particularly important to be studied inthe Tehuacán Valley, where archaeologists documentedpossible scenarios motivating origins of plant manage-ment by agriculture during prehistory.
MethodsStudy areaOur study was conducted in the highlands of the TehuacánValley, an area of high biological and cultural diversity andlong history of interactions between humans and plants.We studied indigenous Náhuatl people communities inthe municipality of Santa María Coyomeapan, located atthe southeast of Puebla, central Mexico (Figure 1). Thearea belongs to the mountain range regionally known asthe Sierra Negra, with elevations ranging from 1200 to3250 m. Annual mean temperature and precipitation areon average 16°C and 2200 mm, respectively [29]. Theregion hosts the following vegetation types: I) Pine-oak
Blancas et al. Journal of Ethnobiology and Ethnomedicine 2013, 9:39 Page 3 of 22http://www.ethnobiomed.com/content/9/1/39

forest, II) evergreen rainforest and III) tropical dry forest.Coyomeapan is a rural region where people’s subsistencemainly depends on agriculture, raising of domestic ani-mals, and extraction of forest products. Nearly 98% ofthe 12,000 people inhabiting the area are Náhuatl people.Part of the local households also obtains incomes fromannual seasonal migration to cities in Mexico and theUnited States.
Inventory of edible plant resourcesDuring a first year of field work we inventoried the edibleplant resources in five communities: Aticpac, Ahuatla,Chimalhuaca, Yohuajca and Coyomeapan (Figure 1). Forinventorying all plant species used as food we intervieweda total of 55 household selected at random in the villagesstudied. Through semi-structured interviews [30], weobtained information about plant uses, management forms,
ethnoclassification of variants, social and cultural roles ofplants, and ecological data on distribution, abundance,phenology, and biotic interactions (Additional file 1). Weused interviews with the free listing method as a first ap-proach to identify main plant resources perceived bypeople. We sampled and collected plant specimens in nat-ural vegetation, markets, crop fields, and homegardens.This information was complemented with direct observa-tions. Plant specimens were deposited in the NationalHerbarium of Mexico (MEXU).
Detailed in-depth interviewsAdditional information was obtained during a secondyear of fieldwork through in-depth interviews aimed atdocumenting detailed data about the 33 native edibleplant species that people managed in some way ad-ditional to simple gathering. These interviews explored
Figure 1 Study area. Location of municipality of Santa María Coyomeapan and the villages studied in the highlands of the TehuacánValley, central Mexico.
Blancas et al. Journal of Ethnobiology and Ethnomedicine 2013, 9:39 Page 4 of 22http://www.ethnobiomed.com/content/9/1/39

information on ecological (perceived abundance, distri-bution and temporal availability) and sociocultural as-pects (use of inputs, extraction rates, harvesting andconsumption frequencies, use of tools, labor force invested,economic value, labor maintenance, methods of artificialselection) of these native species. To obtain this infor-mation, voucher specimens and photos of the 33 speciesreferred to were shown to a random sample of 20 house-holds (Table 1). Each person was asked to answer a total of36 questions (Tables 2, 3, 4 and 5). We completed the in-terviews in nearly 660 sessions of approximately 2 hourseach in average.We constructed matrixes with the responses of each
person interviewed codified as explained in Tables 2, 3,4, 5, 6 and 7 for each plant species. Also, the value ofthe responses were averaged or summed and weighedaccording to the frequency of the responses consideringthe whole sample of interviewees. The values per specieswere used for calculating the indexes explained below.
Management intensity indexWe calculated a management intensity index summarizinginformation of eleven indicators related to energy investedin management, type of tools used, complexity of regula-tions and institutions, artificial selection intensity and bio-logical aspects influencing rapidness of management results(Table 2). Indicators used were: MF = Management form(or forms according to the general types mentioned above);IT = Invested Time (time invested in managing plants orobtaining plant products); PSD = Plant Site Distance(distance from town to sites where plant resources arefound; T = Tools (type of tools used in management); CR =Collective Regulations (rules, agreements for accessingand protecting plant resources); AS = Artificial Selection(occurrence of selection criteria and type of selection prac-ticed); ML = Maintenance Labors (type of activities carriedout for ensuring availability of plant resources); RS = Repro-ductive System Type; MR = Modes of Reproduction, andLC = Life Cycle type. The standardized values of theseindicators were used to perform a Principal ComponentAnalyses by NTSYS. Scores of the first principal compo-nent were used as management intensity indexes, whichwere calculated for the 33 native managed species.
Cultural and economic values of edible plant speciesThe index of cultural value (Ic) of the 33 native managededible species was calculated based on indexes previ-ously designed by Pieroni and González-Insuasti et al.[24,31]. Our modified index was:
Ic ¼ PULdcNuSNsuHtCM10000
Where: P = number of sampled persons who ate the spe-cies; U = use frequency (once or less per year = 1; up totwice a year = 2; up to 10 times a year = 3; more than 10times a year = 4; more than once a week = 5); Ldc = lastday of consumption (more than one year ago = 1; less thanone year ago = 2; less than 6 months ago = 3; within thelast month = 4; within the last week = 5; Nu = Number ofdifferent uses; S = structures used as food (mostlyvegetative parts / leaves, branches = 1; Mostly reproductiveparts / flowers, seeds, fruits = 2; complete individualplants = 3); Nsu = Number of structures consumed;Ht = Harvest type (opportunistic = 1; dedicated = 2);C = commercialization possibilities (non-existing = 1;existing = 2); M = medicinal use (not medicinal = 1; edibleplants considered also as medicine = 2).The economic value was calculated for the 33 species re-
ferred to above considering the amount of plant productsper species that is commercialized, the standardized priceper kg or liter in the local market, and the proportion of re-spondents who commercialize products of a plant species.Since plant products are commercialized in different units,we standardized amounts of products to one kg or literand prices in U.S. dollars. We used the formula:
Ev ¼ PQN
in which Ev = economic value; P = price per kilogramor liter of product (for species not commercialized weassigned an arbitrary value of $0.001 U.S. dollars); Q =amount of product per species annually marketed, and N =proportion of respondents who commercialize a plantspecies product (Table 3).
Distribution and abundance of plant resourcesPlant communities of natural environmental (i. e. non-agricultural or urban) units were sampled in three sitesrepresenting each vegetation type: tropical dry forest,pine-oak forest and tropical rain forest. In addition, arti-ficially transformed units were sampled, including areasof secondary vegetation, fruit plantations and maizefields. Vegetation sampling was conducted through 500m2 rectangles of 50x10 m (see Valiente-Banuet et al.[32]). Shrubs and trees were counted and the density ofeach species calculated. Biomass of each species was cal-culated based on measurements of height (h) and twodiameters (D1 and D2) of the canopy of every individualof shrubs and trees included in the 500 m2 samples.Diameter at breast height (d) was also considered forsampled trees. Biomass estimations were conducted byusing volume formulas of geometric figures resemblingthe physiognomy of the plant species recorded [33]. Forherbs, we used three 1 m2 squares randomly distributedin each 500 m2 rectangle and biomass was calculated asthe cover percentage per m2.
Blancas et al. Journal of Ethnobiology and Ethnomedicine 2013, 9:39 Page 5 of 22http://www.ethnobiomed.com/content/9/1/39

Distribution of edible plant species was evaluated asthe percentage of all sites sampled where each specieswas recorded (Table 3). We also documented the per-ception of abundance of plant resources by local peoplethrough an index of scarcity. We used five images withthe form of a star which were showed by the researchersto stimulating responses of people interviewed. The
image showing 100% of colored cover was the categoryvery abundant (value 1), that with 80% was the categoryabundant (2), that with 60% was the category moderatelyabundant (3), that with 40% was the category scarce (4)and that with 20% of colored cover was the category veryscarce (5). Table 3 summarizes average abundance valueperceived by people for the 33 species analyzed.
Table 1 Edible plant species managed in Santa María Coyomeapan, Puebla
Species Common name 1 Useful parts(Mostly)
2 Availability 3 Forms ofpropagation
4 Economicimportance
Agave obscura Schiede Mexcalli cacaya RP S VP, TI CT, Ex
Agave salmiana Otto ex Salm-Dyck Mexcalli mateuonti CI S VP, TI CT
Amaranthus hybridus L. Baquilitl VP S S CT
Brassica rapa L. Colesh VP S S *
Canna indica L. Panispatl VP C TI, S *
Cestrum nocturnum L. Zopelilquilitl VP C VP CT, Ex
Chamaedorea tepejilote Liebm. ex Mart Tepejilote CI S TI, S CT, Ex
Cleoserrata speciosa (Raf.) H.H. Iltis Mabilquilitl VP S S CT
Crataegus mexicana Moc. & Sessé ex DC. Xocotebitl CI S TI Ex
Dasylirion serratifolium (Karw. ex Schult. f.) Zucc. Mazitzi RP S TI CT, Ex
Eugenia capuli (Schltdl. & Cham.) Hook. & Arn. Mototetl CI S TI CT, Ex
Inga vera Kunth Topetli RP S TI *
Jatropha curcas L. Piñòn RP S VP CT
Leucaena leucocephala (Lam.) Baxi RP S TI, S CT, Ex
Litsea glaucescens Kunth Sogogotl VP C TI CT, Ex
Peperomia peltilimba C. DC. Tequilitl CI C VP CT, Ex
Phaseolus coccineus L. (Nezoquilitl) Xochiquilitl RP S S Ex
Phytolacca icosandra L. Molquilitl VP C S *
Piper auritum Kunth Tlanilpaquilitl VP S VP, TI *
Plantago alismatifolia Pilg. Toro lengua VP S S *
Porophyllum ruderale (Jacq.) Cass. Pipicha CI C S CT, Ex
Prunus serotina Ehrh. Capulli RP S TI, S CT, Ex
Quercus candicans Née Tamalabatl VP C TI *
Raphanus raphanistrum L. Rábano VP S S *
Renealmia alpinia (Rottb.) Maas Velijmolli VP C TI, VP, S CT, Ex
Sambucus mexicana C. Presl ex DC. Xometl VP C VP *
Sideroxylon palmeri (Rose) T.D. Penn. Tempesquistle RP S TI CT, Ex
Solanum americanum Mill. Tomaquilitl VP S S Ex
Sonchus oleraceus L. Memella VP S S *
Spathiphyllum cochlearispathum (Liebm.) Engl. Elotlquilitl RP S TI, VP CT, Ex
Tigridia pavonia (L. f.) DC. Tlalteztli VP C S *
Vaccinium leucanthum Schltdl. Tetzmolli RP S TI *
Yucca elephantipes Regel Izotl RP S VP CT, Ex1 Mostly useful parts - CI Complete Individuals, RP Reproductive parts, Vegetative parts.2 Disponibility - S Seasonally, C Continual.3 Forms of propagation- S Seed; TI Transplantation Individuals; VP Vegetative parts.4 Economic Importance - CT Cash transaction; Ex Exchanged; * Without economic importance.
Blancas et al. Journal of Ethnobiology and Ethnomedicine 2013, 9:39 Page 6 of 22http://www.ethnobiomed.com/content/9/1/39

Table 2 Variables considered for analyzing management intensity (numbers in parentheses are the codified values)
Variable States of variables and codified values
Lifecycle Perennial (1) Annual (2)
Method of reproduction Sexual (1) Asexual (2) Sexual and Asexual (3)
Reproductive System Mostly self-incompatible (1) Mostly self-compatible (2)
Maintenance Labours Cleaningorweeding (0.5)
Grooves waterpenetration (0.5)
Softeningsoil (0.5)
Remove dead leavesor pruning branches
(0.5)
Apply fertilizer(0.5)
Irrigation(0.5)
Fumigation(0.5)
Calcimine(0.5)
Separate clumpsor propagules
(0.5)
Place ofguardiansrods (0.5)
Make fences(0.5)
Artificial selection Odor (1) Form (1) Color (1) Flavor (1) Size(1) Phenological differences (1) Texture (1)
Collective regulation No regulation (0) Yes, but does not apply (1) Yes, admonition applies (1.5) Yes, applies monetary penalty (2)
Using Tools Manual (0.5) Stem, pole or equivalent (1) Knife, penknife or equivalent (1.5) Machete, sickle or equivalent (2) Axe, shovel or equivalent (2.5) Specialized (3)
Proximity to site collects Less than 100 mg (0.5) Up to 1 Km (1) Up to 5 km (1.5) More than 5 km (2)
Time spent in collecting Minutes (0.5) Hours (1) Days (2)
Management forms Simple collection(0.5)
Regulatedcollection (1)
Tolerance(1.5)
Enhancement (2) Protection (2.5) Vegetative parts transplantation (3) Transplantation individuals(3.5)
Sowingseeds (4)
Blancaset
al.JournalofEthnobiology
andEthnom
edicine2013,9:39
Page7of
22http://w
ww.ethnobiom
ed.com/content/9/1/39
Risk indexFor evaluating risk of edible plant species we consideredecological and sociocultural variables for which highervalues indicated higher risk (Table 5), as well as manage-ment intensity. For each species the risk value was thefirst principal component of a total of thirteen indica-tors. We standardized values of this index to a scalefrom 0 to 1, the maximum risk value being 1.
Data analyses
a) Variation partitioning of managementIn these analyses and others explained below wecentred our attention on the 33 native edible plantspecies receiving a management type. CanonicalCorrespondence Analyses (CCA) were performed tomeasure the amount of variation of management
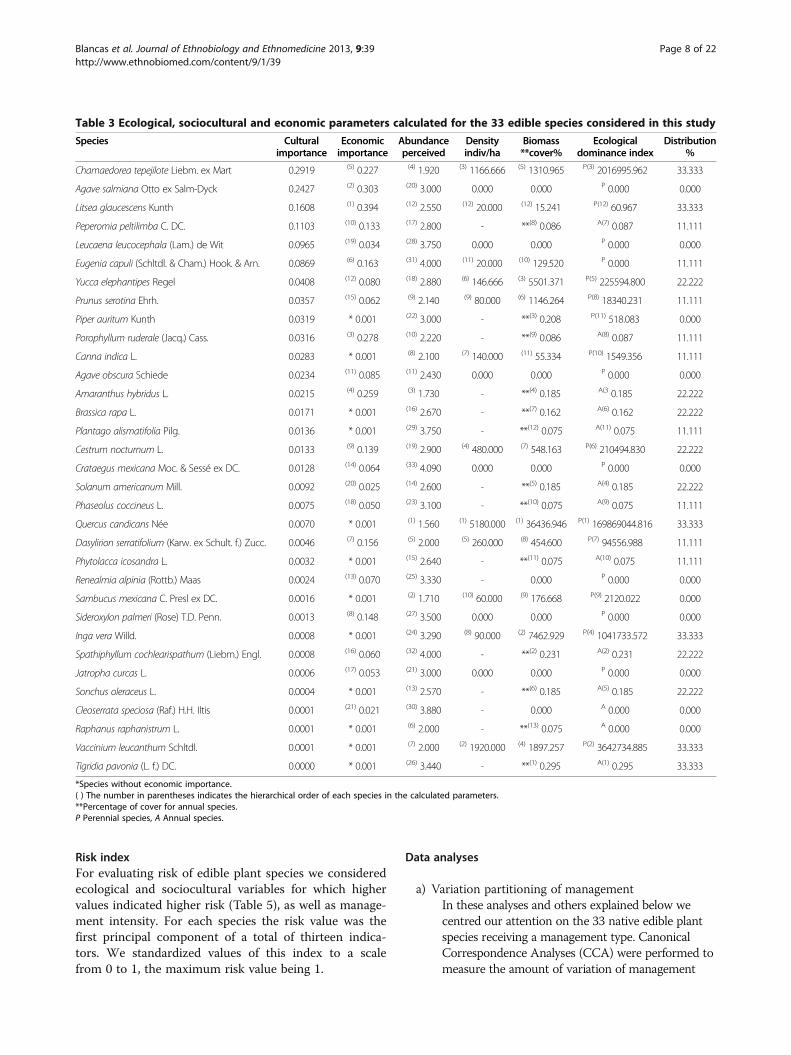
Table 3 Ecological, sociocultural and economic parameters calculated for the 33 edible species considered in this study
Species Culturalimportance
Economicimportance
Abundanceperceived
Densityindiv/ha
Biomass**cover%
Ecologicaldominance index
Distribution%
Chamaedorea tepejilote Liebm. ex Mart 0.2919 (5) 0.227 (4) 1.920 (3) 1166.666 (5) 1310.965 P(3) 2016995.962 33.333
Agave salmiana Otto ex Salm-Dyck 0.2427 (2) 0.303 (20) 3.000 0.000 0.000 P 0.000 0.000
Litsea glaucescens Kunth 0.1608 (1) 0.394 (12) 2.550 (12) 20.000 (12) 15.241 P(12) 60.967 33.333
Peperomia peltilimba C. DC. 0.1103 (10) 0.133 (17) 2.800 - **(8) 0.086 A(7) 0.087 11.111
Leucaena leucocephala (Lam.) de Wit 0.0965 (19) 0.034 (28) 3.750 0.000 0.000 P 0.000 0.000
Eugenia capuli (Schltdl. & Cham.) Hook. & Arn. 0.0869 (6) 0.163 (31) 4.000 (11) 20.000 (10) 129.520 P 0.000 11.111
Yucca elephantipes Regel 0.0408 (12) 0.080 (18) 2.880 (6) 146.666 (3) 5501.371 P(5) 225594.800 22.222
Prunus serotina Ehrh. 0.0357 (15) 0.062 (9) 2.140 (9) 80.000 (6) 1146.264 P(8) 18340.231 11.111
Piper auritum Kunth 0.0319 * 0.001 (22) 3.000 - **(3) 0.208 P(11) 518.083 0.000
Porophyllum ruderale (Jacq.) Cass. 0.0316 (3) 0.278 (10) 2.220 - **(9) 0.086 A(8) 0.087 11.111
Canna indica L. 0.0283 * 0.001 (8) 2.100 (7) 140.000 (11) 55.334 P(10) 1549.356 11.111
Agave obscura Schiede 0.0234 (11) 0.085 (11) 2.430 0.000 0.000 P 0.000 0.000
Amaranthus hybridus L. 0.0215 (4) 0.259 (3) 1.730 - **(4) 0.185 A(3 0.185 22.222
Brassica rapa L. 0.0171 * 0.001 (16) 2.670 - **(7) 0.162 A(6) 0.162 22.222
Plantago alismatifolia Pilg. 0.0136 * 0.001 (29) 3.750 - **(12) 0.075 A(11) 0.075 11.111
Cestrum nocturnum L. 0.0133 (9) 0.139 (19) 2.900 (4) 480.000 (7) 548.163 P(6) 210494.830 22.222
Crataegus mexicana Moc. & Sessé ex DC. 0.0128 (14) 0.064 (33) 4.090 0.000 0.000 P 0.000 0.000
Solanum americanum Mill. 0.0092 (20) 0.025 (14) 2.600 - **(5) 0.185 A(4) 0.185 22.222
Phaseolus coccineus L. 0.0075 (18) 0.050 (23) 3.100 - **(10) 0.075 A(9) 0.075 11.111
Quercus candicans Née 0.0070 * 0.001 (1) 1.560 (1) 5180.000 (1) 36436.946 P(1) 169869044.816 33.333
Dasylirion serratifolium (Karw. ex Schult. f.) Zucc. 0.0046 (7) 0.156 (5) 2.000 (5) 260.000 (8) 454.600 P(7) 94556.988 11.111
Phytolacca icosandra L. 0.0032 * 0.001 (15) 2.640 - **(11) 0.075 A(10) 0.075 11.111
Renealmia alpinia (Rottb.) Maas 0.0024 (13) 0.070 (25) 3.330 - 0.000 P 0.000 0.000
Sambucus mexicana C. Presl ex DC. 0.0016 * 0.001 (2) 1.710 (10) 60.000 (9) 176.668 P(9) 2120.022 0.000
Sideroxylon palmeri (Rose) T.D. Penn. 0.0013 (8) 0.148 (27) 3.500 0.000 0.000 P 0.000 0.000
Inga vera Willd. 0.0008 * 0.001 (24) 3.290 (8) 90.000 (2) 7462.929 P(4) 1041733.572 33.333
Spathiphyllum cochlearispathum (Liebm.) Engl. 0.0008 (16) 0.060 (32) 4.000 - **(2) 0.231 A(2) 0.231 22.222
Jatropha curcas L. 0.0006 (17) 0.053 (21) 3.000 0.000 0.000 P 0.000 0.000
Sonchus oleraceus L. 0.0004 * 0.001 (13) 2.570 - **(6) 0.185 A(5) 0.185 22.222
Cleoserrata speciosa (Raf.) H.H. Iltis 0.0001 (21) 0.021 (30) 3.880 - 0.000 A 0.000 0.000
Raphanus raphanistrum L. 0.0001 * 0.001 (6) 2.000 - **(13) 0.075 A 0.000 0.000
Vaccinium leucanthum Schltdl. 0.0001 * 0.001 (7) 2.000 (2) 1920.000 (4) 1897.257 P(2) 3642734.885 33.333
Tigridia pavonia (L. f.) DC. 0.0000 * 0.001 (26) 3.440 - **(1) 0.295 A(1) 0.295 33.333
*Species without economic importance.( ) The number in parentheses indicates the hierarchical order of each species in the calculated parameters.**Percentage of cover for annual species.P Perennial species, A Annual species.
Blancas et al. Journal of Ethnobiology and Ethnomedicine 2013, 9:39 Page 8 of 22http://www.ethnobiomed.com/content/9/1/39
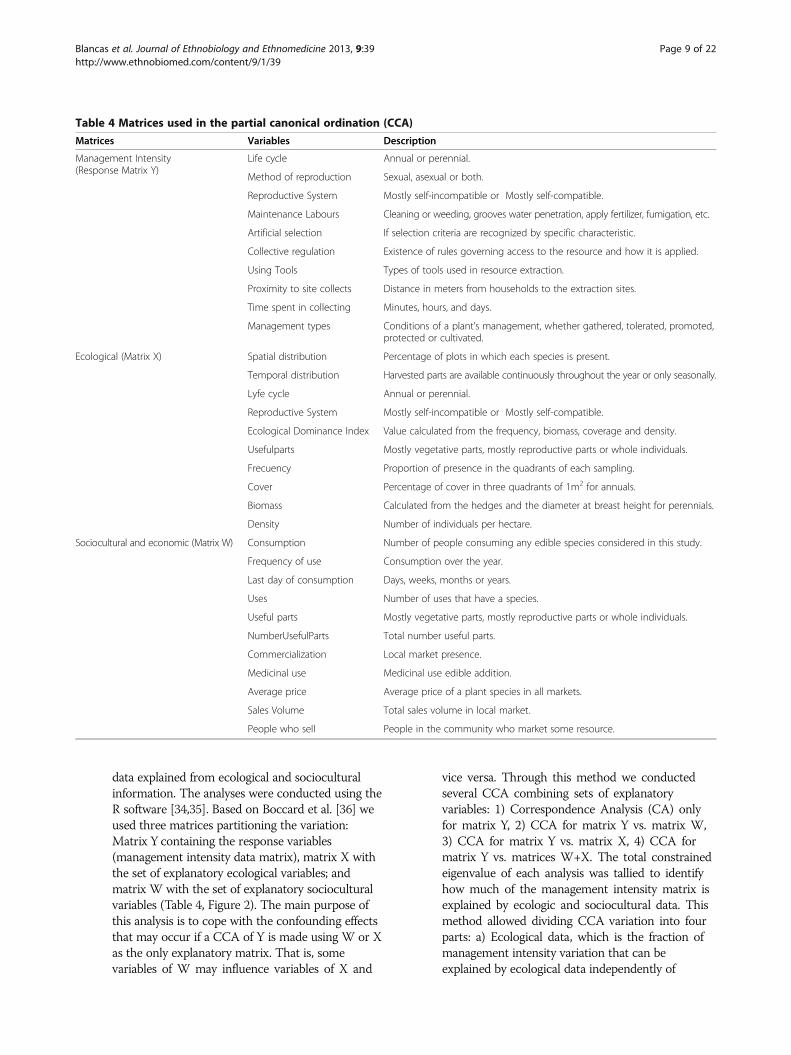
data explained from ecological and socioculturalinformation. The analyses were conducted using theR software [34,35]. Based on Boccard et al. [36] weused three matrices partitioning the variation:Matrix Y containing the response variables(management intensity data matrix), matrix X withthe set of explanatory ecological variables; andmatrix W with the set of explanatory socioculturalvariables (Table 4, Figure 2). The main purpose ofthis analysis is to cope with the confounding effectsthat may occur if a CCA of Y is made using W or Xas the only explanatory matrix. That is, somevariables of W may influence variables of X and
vice versa. Through this method we conductedseveral CCA combining sets of explanatoryvariables: 1) Correspondence Analysis (CA) onlyfor matrix Y, 2) CCA for matrix Y vs. matrix W,3) CCA for matrix Y vs. matrix X, 4) CCA formatrix Y vs. matrices W+X. The total constrainedeigenvalue of each analysis was tallied to identifyhow much of the management intensity matrix isexplained by ecologic and sociocultural data. Thismethod allowed dividing CCA variation into fourparts: a) Ecological data, which is the fraction ofmanagement intensity variation that can beexplained by ecological data independently of
Table 4 Matrices used in the partial canonical ordination (CCA)
Matrices Variables Description
Management Intensity(Response Matrix Y)
Life cycle Annual or perennial.
Method of reproduction Sexual, asexual or both.
Reproductive System Mostly self-incompatible or Mostly self-compatible.
Maintenance Labours Cleaning or weeding, grooves water penetration, apply fertilizer, fumigation, etc.
Artificial selection If selection criteria are recognized by specific characteristic.
Collective regulation Existence of rules governing access to the resource and how it is applied.
Using Tools Types of tools used in resource extraction.
Proximity to site collects Distance in meters from households to the extraction sites.
Time spent in collecting Minutes, hours, and days.
Management types Conditions of a plant’s management, whether gathered, tolerated, promoted,protected or cultivated.
Ecological (Matrix X) Spatial distribution Percentage of plots in which each species is present.
Temporal distribution Harvested parts are available continuously throughout the year or only seasonally.
Lyfe cycle Annual or perennial.
Reproductive System Mostly self-incompatible or Mostly self-compatible.
Ecological Dominance Index Value calculated from the frequency, biomass, coverage and density.
Usefulparts Mostly vegetative parts, mostly reproductive parts or whole individuals.
Frecuency Proportion of presence in the quadrants of each sampling.
Cover Percentage of cover in three quadrants of 1m2 for annuals.
Biomass Calculated from the hedges and the diameter at breast height for perennials.
Density Number of individuals per hectare.
Sociocultural and economic (Matrix W) Consumption Number of people consuming any edible species considered in this study.
Frequency of use Consumption over the year.
Last day of consumption Days, weeks, months or years.
Uses Number of uses that have a species.
Useful parts Mostly vegetative parts, mostly reproductive parts or whole individuals.
NumberUsefulParts Total number useful parts.
Commercialization Local market presence.
Medicinal use Medicinal use edible addition.
Average price Average price of a plant species in all markets.
Sales Volume Total sales volume in local market.
People who sell People in the community who market some resource.
Blancas et al. Journal of Ethnobiology and Ethnomedicine 2013, 9:39 Page 9 of 22http://www.ethnobiomed.com/content/9/1/39

sociocultural data, b) Sociocultural + ecological data,c) Sociocultural data which is the fraction ofmanagement intensity variation that can beexplained by sociocultural data independently ofecologic data, and, d) Undetermined data or fractionof management intensity variation explained neitherby ecological nor by sociocultural data (Figure 2).For each of these analyses, the sum of all canonicaleigenvalues divided by the sum of all canonicaleigenvalues, allowed calculating the correspondingfraction of variation explained by the analysis.Significance of the models for each CCA wasestimated by permutation tests for: a) the wholemodel, b) management intensity explained byecological variables and 3) management intensityexplained by sociocultural variables.
b) Management as response of riskTo explore how management is a response to riskwe performed a canonical correspondence analysis(CCA) with a data matrix with information onmanagement intensity and the other with the riskindex indicators (Tables 3 and 6).
ResultsInventory of edible plant resourcesA total of 122 edible plant species were recorded, nearly67% of them were native to the region and the remainingspecies were introduced from other areas (Additionalfile 1). These species belong to 50 botanical families,Rosaceae and Solanaceae provide the greatest number ofspecies (10 each); followed by Fabaceae (8); Cucurbitaceae(7); Asteraceae (6) and Agavaceae (5). A total of 55 species(45%) are domesticated plants, and 35 (28.6%) are wildspecies obtained exclusively from simple gathering. Weidentified 33 species (27%) of wild plant species under
one or more management types. In addition, we recorded23 species of edible ruderal plants and 31 species of edibleweedy plants.A total of 55 species are used by their edible fruits and
34 produce edible leaves, including 27 species of the trad-itional greens called “quilitl” (“quilite” in plural) in Náhuatlwhose young tender leaves are consumed and are amongthe most important food resources in rural communities ofthe study area. Other 19 species are used for their leaves towrap food during its preparation which are condimentsconferring flavor to food. Additionally, we found that seedsof 15 species are edible, the whole plant of 10 species areharvested; and rhizomes of 7 species, inflorescences of 6species, flowers of four species, stems of four species andtendrils of two species are also consumed as food.A total of 61 species are marketed at both local and/or
regional levels thus providing significant monetary incomesto households. From the commercialized species, 48 areseasonally sold when the resources are available, wildspecies in this condition have some management type.A total of 13 plant species commercialized are availablethroughout the whole year, most of them being cultivated-domesticated plants and some others wild, weedy and ru-deral plants.
Management typesMost edible plant species are obtained through simplegathering but 33 species had additionally other type ofmanagement (Table 1). From these species, local peopleprofit leaves, flowers, fruits and/or whole plants. Most spe-cies have more than one useful part, but we identifiedthose used: 1) mostly by their vegetative parts (16 species,48.5%); 2) mostly by their reproductive parts (11 species,33.3%) including flowers, fruits, flower buds, inflorescences
Table 5 Indicators and the numerical values assigned for analyzing risk of edible plant species
Variables Scale
Life cycle Annual (1); Perennial (2)
Reproductive System Mostly self-compatible (1); Mostly self-incompatible (2)
Distribution Broad (1); Restricted (2)
Abundance perceived Very abundant (1); Abundant (2;) Regular abundance (3); Escarse (4); Very escarse (5)
Useful parts Mostly vegetative parts (1); Mostly reproductive parts (2); Complete individuals (3)
Availability Continuous (1); Temporal (2)
Plagues No pest (1); Presents pests, but nothing is done to eliminate them (2); Presents pests and these are eliminated (3)
Number of used parts Number of parts utilized
Management With management (1); Without management (2)
Norms of use No rule (1); With rule, but this does not apply (2); With rule, and this are applied (3)
Cultural Importance Value calculated for Cultural Importance Index
Economic Importance Value calculated for Economic Importance Index
Distribution In over 30% of plots (0.5); Up to 20% of plots (1); Up to 10% of plots (1.5); Not found in the plots (2)
Blancas et al. Journal of Ethnobiology and Ethnomedicine 2013, 9:39 Page 10 of 22http://www.ethnobiomed.com/content/9/1/39
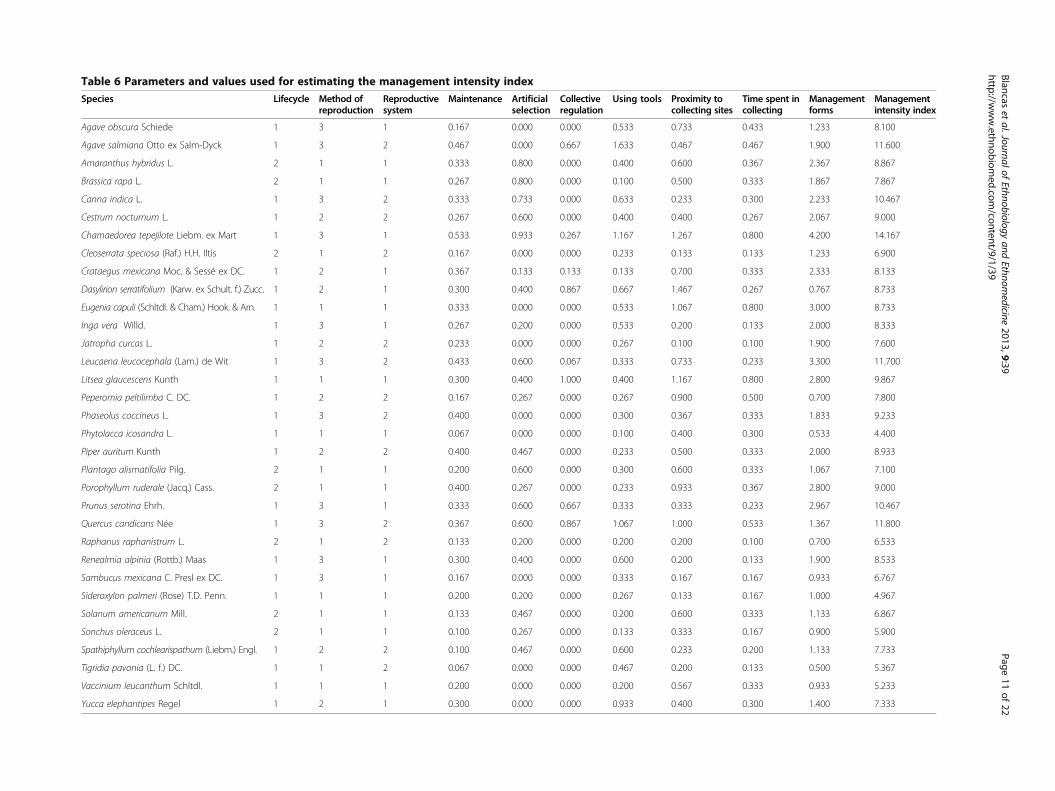
Table 6 Parameters and values used for estimating the management intensity indexSpecies Lifecycle Method of
reproductionReproductivesystem
Maintenance Artificialselection
Collectiveregulation
Using tools Proximity tocollecting sites
Time spent incollecting
Managementforms
Managementintensity index
Agave obscura Schiede 1 3 1 0.167 0.000 0.000 0.533 0.733 0.433 1.233 8.100
Agave salmiana Otto ex Salm-Dyck 1 3 2 0.467 0.000 0.667 1.633 0.467 0.467 1.900 11.600
Amaranthus hybridus L. 2 1 1 0.333 0.800 0.000 0.400 0.600 0.367 2.367 8.867
Brassica rapa L. 2 1 1 0.267 0.800 0.000 0.100 0.500 0.333 1.867 7.867
Canna indica L. 1 3 2 0.333 0.733 0.000 0.633 0.233 0.300 2.233 10.467
Cestrum nocturnum L. 1 2 2 0.267 0.600 0.000 0.400 0.400 0.267 2.067 9.000
Chamaedorea tepejilote Liebm. ex Mart 1 3 1 0.533 0.933 0.267 1.167 1.267 0.800 4.200 14.167
Cleoserrata speciosa (Raf.) H.H. Iltis 2 1 2 0.167 0.000 0.000 0.233 0.133 0.133 1.233 6.900
Crataegus mexicana Moc. & Sessé ex DC. 1 2 1 0.367 0.133 0.133 0.133 0.700 0.333 2.333 8.133
Dasylirion serratifolium (Karw. ex Schult. f.) Zucc. 1 2 1 0.300 0.400 0.867 0.667 1.467 0.267 0.767 8.733
Eugenia capuli (Schltdl. & Cham.) Hook. & Arn. 1 1 1 0.333 0.000 0.000 0.533 1.067 0.800 3.000 8.733
Inga vera Willd. 1 3 1 0.267 0.200 0.000 0.533 0.200 0.133 2.000 8.333
Jatropha curcas L. 1 2 2 0.233 0.000 0.000 0.267 0.100 0.100 1.900 7.600
Leucaena leucocephala (Lam.) de Wit 1 3 2 0.433 0.600 0.067 0.333 0.733 0.233 3.300 11.700
Litsea glaucescens Kunth 1 1 1 0.300 0.400 1.000 0.400 1.167 0.800 2.800 9.867
Peperomia peltilimba C. DC. 1 2 2 0.167 0.267 0.000 0.267 0.900 0.500 0.700 7.800
Phaseolus coccineus L. 1 3 2 0.400 0.000 0.000 0.300 0.367 0.333 1.833 9.233
Phytolacca icosandra L. 1 1 1 0.067 0.000 0.000 0.100 0.400 0.300 0.533 4.400
Piper auritum Kunth 1 2 2 0.400 0.467 0.000 0.233 0.500 0.333 2.000 8.933
Plantago alismatifolia Pilg. 2 1 1 0.200 0.600 0.000 0.300 0.600 0.333 1.067 7.100
Porophyllum ruderale (Jacq.) Cass. 2 1 1 0.400 0.267 0.000 0.233 0.933 0.367 2.800 9.000
Prunus serotina Ehrh. 1 3 1 0.333 0.600 0.667 0.333 0.333 0.233 2.967 10.467
Quercus candicans Née 1 3 2 0.367 0.600 0.867 1.067 1.000 0.533 1.367 11.800
Raphanus raphanistrum L. 2 1 2 0.133 0.200 0.000 0.200 0.200 0.100 0.700 6.533
Renealmia alpinia (Rottb.) Maas 1 3 1 0.300 0.400 0.000 0.600 0.200 0.133 1.900 8.533
Sambucus mexicana C. Presl ex DC. 1 3 1 0.167 0.000 0.000 0.333 0.167 0.167 0.933 6.767
Sideroxylon palmeri (Rose) T.D. Penn. 1 1 1 0.200 0.200 0.000 0.267 0.133 0.167 1.000 4.967
Solanum americanum Mill. 2 1 1 0.133 0.467 0.000 0.200 0.600 0.333 1.133 6.867
Sonchus oleraceus L. 2 1 1 0.100 0.267 0.000 0.133 0.333 0.167 0.900 5.900
Spathiphyllum cochlearispathum (Liebm.) Engl. 1 2 2 0.100 0.467 0.000 0.600 0.233 0.200 1.133 7.733
Tigridia pavonia (L. f.) DC. 1 1 2 0.067 0.000 0.000 0.467 0.200 0.133 0.500 5.367
Vaccinium leucanthum Schltdl. 1 1 1 0.200 0.000 0.000 0.200 0.567 0.333 0.933 5.233
Yucca elephantipes Regel 1 2 1 0.300 0.000 0.000 0.933 0.400 0.300 1.400 7.333
Blancaset
al.JournalofEthnobiology
andEthnom
edicine2013,9:39
Page11
of22
http://www.ethnobiom
ed.com/content/9/1/39
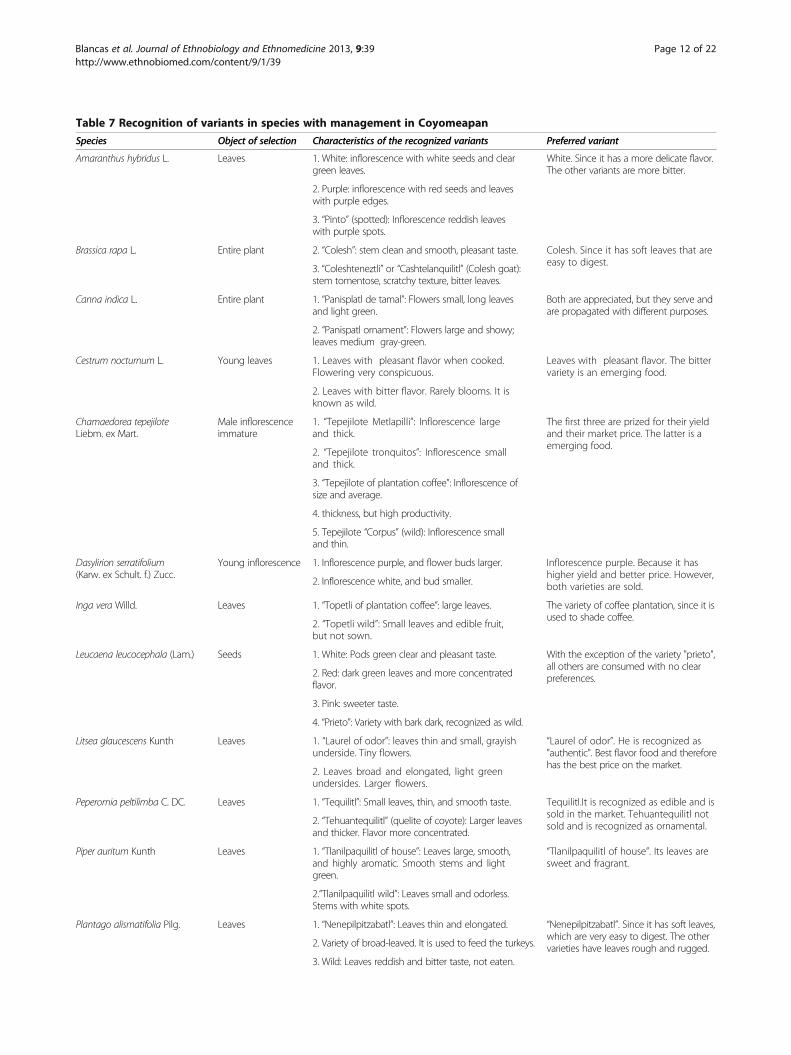
Table 7 Recognition of variants in species with management in Coyomeapan
Species Object of selection Characteristics of the recognized variants Preferred variant
Amaranthus hybridus L. Leaves 1. White: inflorescence with white seeds and cleargreen leaves.
White. Since it has a more delicate flavor.The other variants are more bitter.
2. Purple: inflorescence with red seeds and leaveswith purple edges.
3. “Pinto” (spotted): Inflorescence reddish leaveswith purple spots.
Brassica rapa L. Entire plant 2. “Colesh”: stem clean and smooth, pleasant taste. Colesh. Since it has soft leaves that areeasy to digest.
3. “Coleshteneztli” or “Cashtelanquilitl” (Colesh goat):stem tomentose, scratchy texture, bitter leaves.
Canna indica L. Entire plant 1. “Panisplatl de tamal”: Flowers small, long leavesand light green.
Both are appreciated, but they serve andare propagated with different purposes.
2. “Panispatl ornament”: Flowers large and showy;leaves medium gray-green.
Cestrum nocturnum L. Young leaves 1. Leaves with pleasant flavor when cooked.Flowering very conspicuous.
Leaves with pleasant flavor. The bittervariety is an emerging food.
2. Leaves with bitter flavor. Rarely blooms. It isknown as wild.
Chamaedorea tepejiloteLiebm. ex Mart.
Male inflorescenceimmature
1. “Tepejilote Metlapilli”: Inflorescence largeand thick.
The first three are prized for their yieldand their market price. The latter is aemerging food.
2. “Tepejilote tronquitos”: Inflorescence smalland thick.
3. “Tepejilote of plantation coffee”: Inflorescence ofsize and average.
4. thickness, but high productivity.
5. Tepejilote “Corpus” (wild): Inflorescence smalland thin.
Dasylirion serratifolium(Karw. ex Schult. f.) Zucc.
Young inflorescence 1. Inflorescence purple, and flower buds larger. Inflorescence purple. Because it hashigher yield and better price. However,both varieties are sold.2. Inflorescence white, and bud smaller.
Inga vera Willd. Leaves 1. “Topetli of plantation coffee”: large leaves. The variety of coffee plantation, since it isused to shade coffee.
2. “Topetli wild”: Small leaves and edible fruit,but not sown.
Leucaena leucocephala (Lam.) Seeds 1. White: Pods green clear and pleasant taste. With the exception of the variety "prieto",all others are consumed with no clearpreferences.2. Red: dark green leaves and more concentrated
flavor.
3. Pink: sweeter taste.
4. “Prieto”: Variety with bark dark, recognized as wild.
Litsea glaucescens Kunth Leaves 1. “Laurel of odor”: leaves thin and small, grayishunderside. Tiny flowers.
“Laurel of odor”. He is recognized as"authentic". Best flavor food and thereforehas the best price on the market.
2. Leaves broad and elongated, light greenundersides. Larger flowers.
Peperomia peltilimba C. DC. Leaves 1. “Tequilitl”: Small leaves, thin, and smooth taste. Tequilitl.It is recognized as edible and issold in the market. Tehuantequilitl notsold and is recognized as ornamental.2. “Tehuantequilitl” (quelite of coyote): Larger leaves
and thicker. Flavor more concentrated.
Piper auritum Kunth Leaves 1. “Tlanilpaquilitl of house”: Leaves large, smooth,and highly aromatic. Smooth stems and lightgreen.
“Tlanilpaquilitl of house”. Its leaves aresweet and fragrant.
2.“Tlanilpaquilitl wild”: Leaves small and odorless.Stems with white spots.
Plantago alismatifolia Pilg. Leaves 1. “Nenepilpitzabatl”: Leaves thin and elongated. “Nenepilpitzabatl”. Since it has soft leaves,which are very easy to digest. The othervarieties have leaves rough and rugged.2. Variety of broad-leaved. It is used to feed the turkeys.
3. Wild: Leaves reddish and bitter taste, not eaten.
Blancas et al. Journal of Ethnobiology and Ethnomedicine 2013, 9:39 Page 12 of 22http://www.ethnobiomed.com/content/9/1/39

and seeds; and 3) mostly complete individuals (6 species,18.2%) (Table 1).We recorded 11 species that are tolerated in maize
fields (milpas) and homegardens. These are species witha) low frequencies in natural vegetation due to massiveextraction associated to their increasing economic im-portance in recent years; or b) declining cultural import-ance and for which tolerance is progressively unusual(see Additional file 2). The following forms of deliberatepropagation were identified among managed plant species:1) mainly by seeds (11 species, 33.3%); 2) mainly by vegeta-tive parts (5 species, 15.1%); 3) mainly by transplantingentire individual plants (8 species, 24.2%); and 4) propa-gation through several forms (9 species, 27.3%), includ-ing seeds, vegetative propagules and transplanting ofcomplete individuals from forests to homegardens and
crop fields. Plant species that in the last 20 years haveincreased their economic value were found under especialeffort of deliberate propagation. Several species reportednot to be intentionally propagated were reported by peopleto receive management practices such as pruning, soil re-moval, elimination of competitors, which may increaseavailability of their products.Seven species (21%) are clearly managed by women.
These are species growing in homegardens and othersspaces near peoples’ homes. Harvest of edible weeds(“quilite”) is considered a female activity. For instance,Cleoserrata speciosa should be properly harvested by ex-perienced women since, depending on the way in whichthe leaves are cut, "quilite" acquire particular flavor. Ifharvesting of leaves is not carefully performed (cuttingthe leaves with nails, just below the petiole), cooked
Table 7 Recognition of variants in species with management in Coyomeapan (Continued)
Porophyllum ruderale (Jacq.)Cass. Complete plant 1. White: Light green leaves. Cultivated. Both are appreciated. Although the"white" is cultivated by irrigation, whichguarantees to be present throughoutalmost all year. By contrast, the seed ofthe variety "purple" is spread in thefields of temporal.
2. Purple: Leaves and flowers of purple coloration.This grows in the dry zone.
Prunus serotina Ehrh. Fruit 1. “Capulín of house”. Red fruits, sweet taste, lightgreen leaves.
Capulín of house.This is sold in local andregional markets. The variety “capulín offox" the fruits are not consumed. Thewood is used as firewood and formaking tools.
2. “Capulli Iztotzi or Capulli Quimichi” (Capulín offox or of mouse). Black fruit with acid flavor, darkgreen leaves.
Quercus candicans Née Leaves 1. Leaves large, thin, smooth. Leaf undersideglabrous and bright. The surface of the leaf islight green.
Leaf smooth and glabrous. Can behandled better.
2. Leaves thick, leathery, spoon-shaped.Undersides densely tomentose. Beamdarker color.
Raphanus raphanistrum L. Leaves 1. Pubescent leaf, purple flower, intense flavorand hard to digest.
Smooth leaf. It is more digestible. Thepurple variety is recognized as fodder.
2. Smooth leaf, white flower and sweeter taste.
Renealmia alpinia (Rottb.) Maas Complete plant 1. “Velijmolli”: Dark green leaves with slightlywavy edges. Rounded tips.
Velijmolli. They have larger leaves, higherperformance, and better price.
2. “Velijmolli wild”. Leaves light green, smoothedge. Ending in a peak.
Sideroxylon palmeri (Rose)T.D. Penn.
Fruit 1. Fruit round. Locally are consumed the two varieties.However, the variety of round fruit atregional sells better.2. Fruit shaped-avocad.
Solanum americanum Mill. Complete plant 1. Bitter or wild. The non-bitter. However, the bitter hasbeen identified as Solanum nigrescensMart. & Gal.2. Not bitter.
Sonchus oleraceus L. Leaves 1. White: Stems light green. Broad leaves. White and purple are recognized asedibles. The variety green is recognizedas wild and just is consumed as foodemerging.
2. Purple: Stems with purple beam.
3. Green: Stems green. Thin leaves, ending in apeak. Bitter taste.
Spathiphyllum cochlearispathum(Liebm.) Engl.
Inflorescence 1. “Iztacxóchitl”: White flower, is not edible, bitter,is used for adornment, wild plant.
Elotlxóchitl. Its are better flavor and issold in the market.
2. “Elotlxóchitl or Oloxóchitl”. Green flower. Fastcooking and palatable.
Blancas et al. Journal of Ethnobiology and Ethnomedicine 2013, 9:39 Page 13 of 22http://www.ethnobiomed.com/content/9/1/39

“quilite” will be bitter. Preparation of this species is aslow and complicated process (it takes a whole day, re-quiring continually adding water and firewood to keepconstant cooking temperature, ash for acquiring thedesired color, and a bit of salt until “quilite” are com-pletely cooked), that requires experience that only havethe best cooks.Similarly, management of some species is considered
typically practiced by men. These are those needingclimbing trees, handling thorny plants or entering intoinaccessible places (ravines, cliffs, among others) forharvesting edible parts. For instance, harvesting sap ofAgave salmiana used to produce the fermented beveragecalled "pulque” requires knowledge and tools that localculture has assigned to men. Specifically, the "tlachiqueros",people who are dedicated to extract agave sap and prepa-ring “pulque” is considered a guild of men. Other examplesare Eugenia capuli and Quercus candicans, trees more than20 m tall whose fruit and leaves harvesting requires mento climb up.
Artificial selection criteriaA crucial aspect of artificial selection is the recognitionof variants in populations, some of them having favor-able characteristics to humans, the continuous selectionfavoring particular variants leading (at least in theory) to
domestication. We found that in 21 of the 33 nativemanaged species (63.3%), the interviewees explicitly re-cognized particular variants preferred for using, and allof them are species managed through deliberate propaga-tion (Table 7). For instance, four variants of Chamaedoreatepejilote are recognized, people preferring those producinggreater biomass inflorescences which can be commercia-lized at higher prices. Similarly, for Dasylirion serratifoliumpeople recognize two varieties, although collecting bothvarieties involves similar effort people direct their efforts tocollect the most productive variant which has higher priceon the market. For Porophyllum ruderale people identifytwo variants, “white” and “purple”, the white one beingwidely cultivated in warm humid areas whereas the purplevariety occurs in areas with dry and warm climate. The lat-ter variety is less consumed and not cultivated. In otherspecies, variation is more subtle and unclear the preferencein favor of one particular variant.Regional market preferences are influencing patterns
of selection. For instance, in “tempesquistle” Sideroxylonpalmeri round fruits are preferred over ellipsoid fruits.Consumers of the lowlands of the Tehuacán Valley con-sider that ellipsoid fruits have higher content of latexand for this reason this variety is considered wild("tempesquistle de monte"). Litsea glaucescens has twovarieties, one producing dark green leaves with light
Figure 2 Influences (pure and combined) of ecological (matrix X) and sociocultural (matrix W) explanatory variables on managementof edible species (matrix Y). Each CCA model involves different subsets of variation sources. For instance, matrix X affects matrix Y (Y~X) but inX coexists intermingled variation sources a) and b). Modified from Boccard et al. [36]. a) Ecological fraction of management intensity variation thatcan be explained only by ecological data, b) Sociocultural + ecological data, c) Sociocultural fraction of management intensity variationexplained only by sociocultural data, and d) Undetermined data or fraction of management intensity variation explained neither by ecologicalnor by sociocultural data.
Blancas et al. Journal of Ethnobiology and Ethnomedicine 2013, 9:39 Page 14 of 22http://www.ethnobiomed.com/content/9/1/39
odor, the other with bright green leaves and strongerodor. Although both are harvested and commercialized,consumers prefer the variant of bright green leaves andstrong odor. Selection criteria that are important at re-gional level are not necessarily consistent with those pre-dominating at local level.
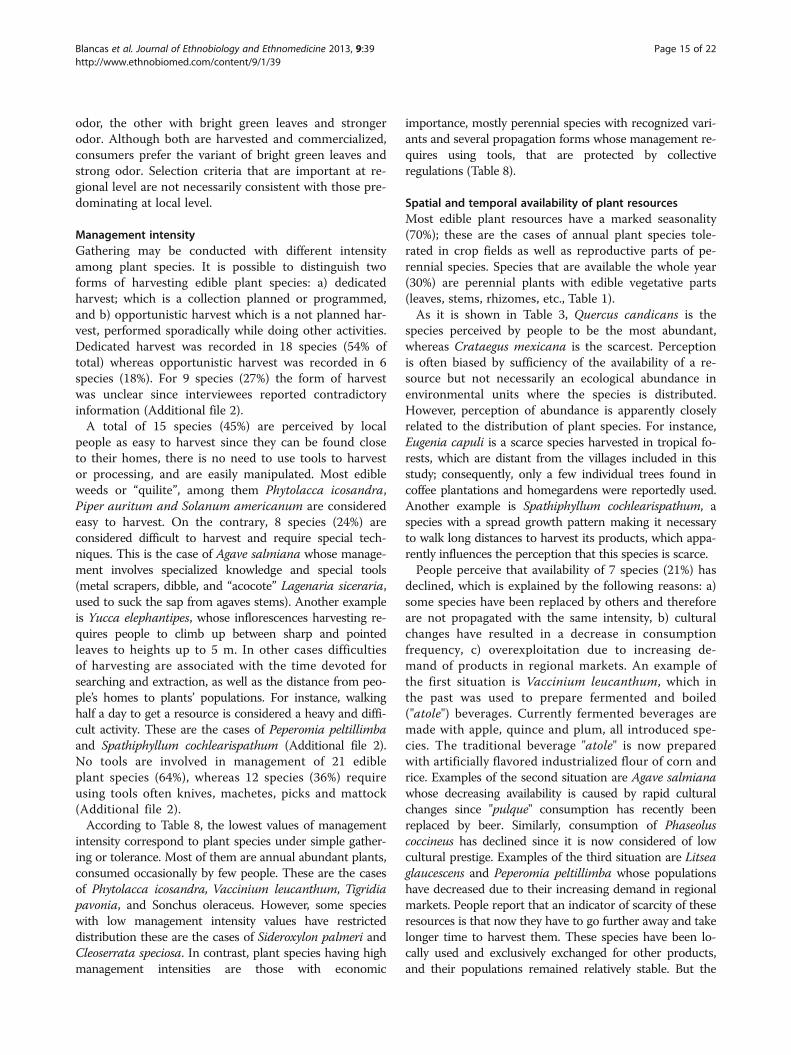
Management intensityGathering may be conducted with different intensityamong plant species. It is possible to distinguish twoforms of harvesting edible plant species: a) dedicatedharvest; which is a collection planned or programmed,and b) opportunistic harvest which is a not planned har-vest, performed sporadically while doing other activities.Dedicated harvest was recorded in 18 species (54% oftotal) whereas opportunistic harvest was recorded in 6species (18%). For 9 species (27%) the form of harvestwas unclear since interviewees reported contradictoryinformation (Additional file 2).A total of 15 species (45%) are perceived by local
people as easy to harvest since they can be found closeto their homes, there is no need to use tools to harvestor processing, and are easily manipulated. Most edibleweeds or “quilite”, among them Phytolacca icosandra,Piper auritum and Solanum americanum are consideredeasy to harvest. On the contrary, 8 species (24%) areconsidered difficult to harvest and require special tech-niques. This is the case of Agave salmiana whose manage-ment involves specialized knowledge and special tools(metal scrapers, dibble, and “acocote” Lagenaria siceraria,used to suck the sap from agaves stems). Another exampleis Yucca elephantipes, whose inflorescences harvesting re-quires people to climb up between sharp and pointedleaves to heights up to 5 m. In other cases difficultiesof harvesting are associated with the time devoted forsearching and extraction, as well as the distance from peo-ple’s homes to plants’ populations. For instance, walkinghalf a day to get a resource is considered a heavy and diffi-cult activity. These are the cases of Peperomia peltillimbaand Spathiphyllum cochlearispathum (Additional file 2).No tools are involved in management of 21 edibleplant species (64%), whereas 12 species (36%) requireusing tools often knives, machetes, picks and mattock(Additional file 2).According to Table 8, the lowest values of management
intensity correspond to plant species under simple gather-ing or tolerance. Most of them are annual abundant plants,consumed occasionally by few people. These are the casesof Phytolacca icosandra, Vaccinium leucanthum, Tigridiapavonia, and Sonchus oleraceus. However, some specieswith low management intensity values have restricteddistribution these are the cases of Sideroxylon palmeri andCleoserrata speciosa. In contrast, plant species having highmanagement intensities are those with economic
importance, mostly perennial species with recognized vari-ants and several propagation forms whose management re-quires using tools, that are protected by collectiveregulations (Table 8).
Spatial and temporal availability of plant resourcesMost edible plant resources have a marked seasonality(70%); these are the cases of annual plant species tole-rated in crop fields as well as reproductive parts of pe-rennial species. Species that are available the whole year(30%) are perennial plants with edible vegetative parts(leaves, stems, rhizomes, etc., Table 1).As it is shown in Table 3, Quercus candicans is the
species perceived by people to be the most abundant,whereas Crataegus mexicana is the scarcest. Perceptionis often biased by sufficiency of the availability of a re-source but not necessarily an ecological abundance inenvironmental units where the species is distributed.However, perception of abundance is apparently closelyrelated to the distribution of plant species. For instance,Eugenia capuli is a scarce species harvested in tropical fo-rests, which are distant from the villages included in thisstudy; consequently, only a few individual trees found incoffee plantations and homegardens were reportedly used.Another example is Spathiphyllum cochlearispathum, aspecies with a spread growth pattern making it necessaryto walk long distances to harvest its products, which appa-rently influences the perception that this species is scarce.People perceive that availability of 7 species (21%) has
declined, which is explained by the following reasons: a)some species have been replaced by others and thereforeare not propagated with the same intensity, b) culturalchanges have resulted in a decrease in consumptionfrequency, c) overexploitation due to increasing de-mand of products in regional markets. An example ofthe first situation is Vaccinium leucanthum, which inthe past was used to prepare fermented and boiled("atole") beverages. Currently fermented beverages aremade with apple, quince and plum, all introduced spe-cies. The traditional beverage "atole" is now preparedwith artificially flavored industrialized flour of corn andrice. Examples of the second situation are Agave salmianawhose decreasing availability is caused by rapid culturalchanges since "pulque" consumption has recently beenreplaced by beer. Similarly, consumption of Phaseoluscoccineus has declined since it is now considered of lowcultural prestige. Examples of the third situation are Litseaglaucescens and Peperomia peltillimba whose populationshave decreased due to their increasing demand in regionalmarkets. People report that an indicator of scarcity of theseresources is that now they have to go further away and takelonger time to harvest them. These species have been lo-cally used and exclusively exchanged for other products,and their populations remained relatively stable. But the
Blancas et al. Journal of Ethnobiology and Ethnomedicine 2013, 9:39 Page 15 of 22http://www.ethnobiomed.com/content/9/1/39
opening of new roads and access to regional markets rep-resented for local people an opportunity to obtain mone-tary incomes. Nowadays, regional markets demand theseproducts in high quantities. Some people have tried topropagate these species without success.In contrast, three species are perceived to have increased
their abundance in association to their increase of com-mercial value. Demand in markets has enhanced people tocultivate them now but previously were only harvested in
the wild. These are the cases of Chamaedorea tepejilote,Renealmia alpinia, and Porophyllum ruderale, which areeasily propagated. For 23 species (70%) no changes in theiravailability were perceived by people.People generally considered that incidence of pests is
low or inexistent in the 33 native managed plant speciesstudied. However, they mentioned that some pests attackeleven species (33%) and affect their availability in differentdegrees (Additional file 2). The main pests mentioned areaphids, white scale, caterpillars, moths, grasshoppers, andfungi. Although these pests damage leaves, stems and fruit,preventive or correction actions are only occasional andlimited to manual removal, pruning of affected areas, andapplication of soapy water or lime to remove the pest.People seldom use agrochemicals for controlling pests ofspecies tolerated in crop fields (Amaranthus hybridus,Cleoserrata speciosa, and Phaseolus coccineus), and whenapplied is a consequence of protecting the staple crops.
Cultural and economic importanceA total of 21 managed plant species (63.6%) had an eco-nomic value, 14 of which (42.4%) are exchanged andsold, 4 (12.1%) only purchased by cash and 3 (9.0%) areonly exchanged by other products (barter). In contrast,12 species (36.3%) are not considered economically im-portant, since their consumption is limited to a markedseason or sporadic events. Moreover, for five species(15.0%) data are not conclusive, since 20% of inter-viewees indicated that a resource is sold, while otherssay it is only for household consumption (Table 3).The highest values of cultural importance were identified
in species widely and frequently consumed, with severaluses, commercialized in markets and are consumed in se-veral communities even when they are absent in their terri-tories. These are the cases of Chamaedorea tepejilote,Agave salmiana and Litsea glaucescens. The lowest valuesof cultural importance were recorded in plant species onlyoccasionally consumed, few use types, easily substituted byother resources and not commercialized. These are thecases of Tigridia pavonia, Raphanus raphanistrum andSonchus oleraceus. Cleoserrata speciosa and Sideroxylonpalmeri are economically important and appreciated asedible resources; however, their frequency of consumptionis low and restricted to areas where these species grow.
Collective regulations for accessing to edible plantresourcesCollective regulations to access plant resources were docu-mented to occur in three species (Dasylirion serratifolium,Litsea glaucescens, and Quercus candicans). These regula-tions are rules agreed in the General Assembly, which isthe meeting of all household’ heads in a community, andare designed to protect resources considered important forthe whole community. They include partial ban to cut
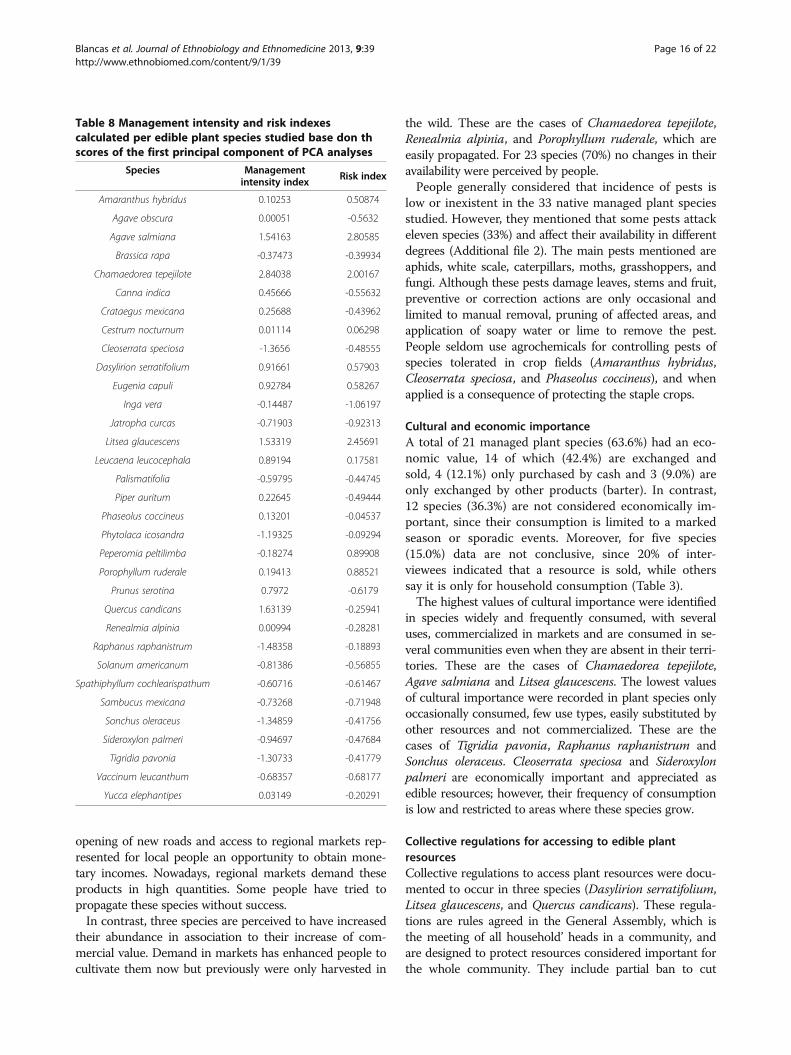
Table 8 Management intensity and risk indexescalculated per edible plant species studied base don thscores of the first principal component of PCA analyses
Species Managementintensity index Risk index
Amaranthus hybridus 0.10253 0.50874
Agave obscura 0.00051 -0.5632
Agave salmiana 1.54163 2.80585
Brassica rapa -0.37473 -0.39934
Chamaedorea tepejilote 2.84038 2.00167
Canna indica 0.45666 -0.55632
Crataegus mexicana 0.25688 -0.43962
Cestrum nocturnum 0.01114 0.06298
Cleoserrata speciosa -1.3656 -0.48555
Dasylirion serratifolium 0.91661 0.57903
Eugenia capuli 0.92784 0.58267
Inga vera -0.14487 -1.06197
Jatropha curcas -0.71903 -0.92313
Litsea glaucescens 1.53319 2.45691
Leucaena leucocephala 0.89194 0.17581
Palismatifolia -0.59795 -0.44745
Piper auritum 0.22645 -0.49444
Phaseolus coccineus 0.13201 -0.04537
Phytolaca icosandra -1.19325 -0.09294
Peperomia peltilimba -0.18274 0.89908
Porophyllum ruderale 0.19413 0.88521
Prunus serotina 0.7972 -0.6179
Quercus candicans 1.63139 -0.25941
Renealmia alpinia 0.00994 -0.28281
Raphanus raphanistrum -1.48358 -0.18893
Solanum americanum -0.81386 -0.56855
Spathiphyllum cochlearispathum -0.60716 -0.61467
Sambucus mexicana -0.73268 -0.71948
Sonchus oleraceus -1.34859 -0.41756
Sideroxylon palmeri -0.94697 -0.47684
Tigridia pavonia -1.30733 -0.41779
Vaccinum leucanthum -0.68357 -0.68177
Yucca elephantipes 0.03149 -0.20291
Blancas et al. Journal of Ethnobiology and Ethnomedicine 2013, 9:39 Page 16 of 22http://www.ethnobiomed.com/content/9/1/39

these species and sanctions to those who do it. Regulationsare generally respected by people but penalties range froma verbal reprimand to monetary fines. Communitarianrules protect lands and resources communally owned.Constructing collective regulations is associated with theperception that resources are being depleted or that slow-growing species have to be left growing before taking ad-vantage of them. For instance Litsea glaucescens is a scarcespecies, and communitarian regulations prohibit gatheringits leaves for commercial purposes (which frequently in-volves cutting the whole tree for making harvesting easier).People who violate the rule are fined $45 US dollars.People are authorized harvesting leaves of this species onlyonce per year, the community designating specific persons(called "mozos"), which are the only one authorized to har-vest leaves, branches or sometimes trees.
Risk and management intensityRegression analysis in Figure 3 indicates the highly sig-nificant linear relation between risk and management in-tensity indexes (R2 = 0.433, P<0.001). Partitioning CCAexplains 65.5% of the management variation as shown inFigure 4. This variation can be explained mainly bysociocultural factors (32.6%) while ecological data ex-plain 21.3%. Intersection of ecological and sociocultural
factors explains 11.6% and is statistically significant. Un-explained variation was 34.5%. Two variables of theintersection of ecological and sociocultural indicatorswere particularly important: distribution and abundanceof resources and number of uses (Table 9). Other vari-ables such as number of persons commercializing andconsuming plant resources were important although sta-tistically no significant.Partitioned CCA indicates that variation of manage-
ment intensity is 67.6% explained by risk variables.According to Table 10 the following variables were sta-tistically significant: life cycle (annual or perennial), re-productive system (self-compatible or self-incompatible),distribution (broad or restricted), number of parts used,number of forms in which a resource is managed andregulations for using resources.Figure 5 shows that long-life span species from which
entire plants or their reproductive parts are used, with noregulations, high economic and cultural value and self-incompatible breeding system have higher risk. These arethe cases of Agave salmiana, Dasylirion serratifolium andLitsea glaucescens. On the opposite end of a risk gradient,annual plant species whose vegetative parts are used andhave self-compatible breeding systems have low risk levels.These are represented by weedy species in maize fields
Figure 3 Regression analysis of the management intensity index as a function of the risk index calculated as the scores of the firstprincipal component of PCA analyzing indicators of these aspects per edible plant species (R2 = 0.433, P<0.001).
Blancas et al. Journal of Ethnobiology and Ethnomedicine 2013, 9:39 Page 17 of 22http://www.ethnobiomed.com/content/9/1/39

such as Plantago alismatifolia, Raphanus raphanistrum,Solanum americanum and Sonchus oleraceus.
Discussion and conclusionsManagement typesNáhuatl people from Coyomeapan manage plants in dif-ferent forms and with different intensities and that ma-nagement of wild and weedy plants takes place parallel to
agricultural management of domesticated plants. Thesemanagement types and intensities are integrated to asubsistence pattern based on multi-purpose use of plantresources and ecosystems which is characteristic of indi-genous peoples in Mexico [6].We found general categories of management forms oc-
curring in natural environments (in situ management ofboth wild and weedy plants), and others occurring inhuman-controlled environments, (ex situ managementin crop fields, homegardens, and agroforestry systems).We also consider that recognition of intra-specific vari-ants and practice of differential use and artificial selec-tion on these variants are key criteria for classifying bothin situ and ex situ management types. Consequently, theclassification should include the following categories:
In situ interactions
(1.1)Gathering without recognition of variants. Mostwild species are gathered from natural vegetationwithout distinction of varieties of particularpreference. Some are annual, other are perennial.Sambucus mexicana, Tigridia pavonia andVaccinium leucanthum are some examples of thiscondition (see Additional file 2).
(1.2) Specialized gathering with appreciation of variants.The gathering is differential, since some individualsare preferred by collectors due to specific features(flavor, color, texture, size, presence or absence oftoxic substances, etc.). For instance, Quercuscandicans whose leaves are used to cook “tamales”on celebrations days. Collectors recognized twovariants: I) “Lisa”. Leaves large, thin, smooth. Leaf
Management
Ecological SocCultEco
?Unexplained
a = 21.28% p = 0.56
(b)Eco+Cult =11.57%p = 0.001
c = 32.63% p = 0.66
d = 34.50% p=0.98
Figure 4 Partitioned CCA scheme showing the relative influenceof ecological, sociocultural (SocCultEco) factors and theirinteraction on management strategies of edible plant species byNáhuatl communities of the Tehuacán Valley.
Table 9 Permutation test for CCA variables under reducedmodel of management factors and ecologic andsociocultural and economic factors
Variable DF Chisq F Pr(>F)
Quantity Marketed (kg or L) 1 0.0087 1.2515 0.46
Cost (Kg or L) 1 0.0035 0.5081 0.9
People who Sell 1 0.0189 2.7245 0.07
Number People Consume 1 0.0192 2.7721 0.1
Frequency Use 1 0.0084 1.2105 0.33
Last Day Consumption 1 0.0076 1.0914 0.43
Number of Uses 1 0.0312 4.489 0.03
Useful Parts 1 0.0114 1.6426 0.23
Number Useful Parts 1 0.0005 0.0758 1
Commercialization 1 0.0099 1.4333 0.3
Medicinal Use 1 0.0051 0.7391 0.57
Espacial Distribution 1 0.0237 3.4077 0.02
Temporal Distribution 1 0.0046 0.6602 0.67
Lyfe Cycle 1 0.0084 1.2126 0.46
Ecological Dominance 1 0.0062 0.8891 0.64
Disponibility 1 0.0017 0.2475 0.98
Reproductive System 1 0.0044 0.6357 0.72
Relative Importance Value 1 0.011 1.5811 0.22
Residual 14 0.0972
Table 10 Permutation test for CCA variables under reducedmodel of management intensity factors and risk factors
Variable DF Chisq F Pr(>F)
Lyfe cycle 1 0.042 10.120 0.01
Reproductive system 1 0.016 3.767 0.01
Distribution 1 0.011 2.609 0.01
Abundance perceived 1 0.006 1.474 0.30
Useful part 1 0.007 1.566 0.16
Temporal disponibility 1 0.007 1.547 0.30
Pests 1 0.004 1.059 0.46
No. of useful parts 1 0.014 3.235 0.01
No. of management Forms 1 0.012 2.855 0.02
Rules 1 0.030 7.213 0.01
Cultural importance 1 0.010 2.263 0.06
Economic importance 1 0.007 1.778 0.07
Spatial availability 1 0.009 0.215 0.97
Residual 19 0.079
Variables in bold were statistically significant.
Blancas et al. Journal of Ethnobiology and Ethnomedicine 2013, 9:39 Page 18 of 22http://www.ethnobiomed.com/content/9/1/39

underside glabrous and bright. The surface of theleaf is light green; and II) “cucharuda”. Leaves thick,leathery, spoon-shaped. Undersides denselytomentose, beam darker color. The “lisa” variant ispreferred to wrap tamales, since it can be handledbetter and confers a nicer flavor. According tointerviewees, the variety "cucharuda" is difficult tobend and confers bitter taste to “tamales”.
(2.1) Tolerance without recognition of variants. Theseare species tolerated in maize fields, which aretolerated considering only their availability but notvariant types. People practice weeding twice peragricultural cycle and decide to maintain theseplant species because they are edible. An exampleof these plants is Cleoserrata speciosa. Amongperennial species Sambucus mexicana tolerated inlimits of parcels can be mentioned.
(2.2) Tolerance of recognized variants. Some variantsare preferred and deliberately tolerated whenpeasants open crop fields to sow maize seeds; orwhen this are cleaned of weeds. This is the case ofannual species of "quilite". Many of these speciesbehave as weeds and invade the crop fields.However, people distinguished variations inindividuals, and these differences allow adifferential removal of phenotypes that areundesirable. For instance, Raphanus raphanistrumis a weedy species of which two varieties are
recognized: I) Pubescent leaf, purple flower,intense flavor and hard to digest; and II) Smoothleaf, white flower and sweeter taste. This lattervariety is occasionally used as food. The pubescentvariety is eliminated, since its consumption cancause stomach ache, or alternatively is used asfodder for turkeys, chickens, sheep, goats, andpigs. The same is true for Phytolacca icosandra.Another example of tolerance, but for a perennialspecies, is Dasylirion serratifolium, for which twovarieties are recognized: I) Individuals with purpleinflorescence and larger flower buds; and II)Individuals with white inflorescence and smallerflower buds. Both varieties are consumed andtraded, but if a person needs to make a choiceshe/he will selectively remove the variety withwhite inflorescences, since it produces a loweryield and has lower market prices.
(3.1) Enhancement without recognition of variants.This management type includes practices directedto deliberately increase abundance of a plantspecies but not specific variants. This is the caseof Phaseolus coccineus, whose seeds are manuallydispersed in parcels where it is absent. Once in theparcel, people do not report investing anyadditional action.
(3.2) Enhancement with recognition of variants. In thismanagement type different strategies are
Figure 5 Ordination plane of CCA showing how species (italics) and management intensity (red) are influenced by risk variables (bluearrows) of edible plant species by Náhuatl communities of the Tehuacán Valley.
Blancas et al. Journal of Ethnobiology and Ethnomedicine 2013, 9:39 Page 19 of 22http://www.ethnobiomed.com/content/9/1/39

undertaken to increase the population density ofuseful plants. This includes the sowing of seedsor the intentional propagation of vegetativestructures in the same places occupied bypopulations of wild or weedy plants. For instance,Brassica rapa; and Solanum americanum areenhanced in the crop fields. In addition, the seedsof Phytolacca icosandra, Porophyllum ruderale,and Sonchus oleraceus are scattered on roads andcrop fields in fallow. An example of perennialplants managed in this form is the scattering ofseeds and vegetative propagules of Agave obscurain areas around mother plants.
(4.1) Protection without recognition of variants. Thismanagement practice includes actions directed topreserve wild plant resources that are notcultivated nor transplanted. In this type of actionwe include those practiced without distinction ofvariants. This can be reported for Agave obscurain which all plants recognized as competitors areremoved. Also, dry leaves are removed in order tofavour production of edible flower buds and it is aprotection action.
(4.2) Protection with recognition of variants. It consistsof actions that seek to preserve wild resourceswithout being cultivated or transplanted. Theseactions may be practical, as in the case of Litseaglaucescens, whose members are sometimessurrounded with branches to prevent grazing ofgoats and sheep. Another example are regulationsintended to safeguard scarce species such as Agavesalmiana, whose leaves are used to prepare“barbacoa” (earth oven cooked meat).
Ex situ interactionsSome wild plants are cultivated in homegardens or inedges of crop fields. They are propagated by seeds, vege-tative propagules, and in most cases by transplantingwhole plants. The ex situ interactions may be through:
Seeds sowing. As in the case of Chamaedorea tepejilote,whose fruits are edible and the seeds are spread inhomegardens, coffee plantations, and occasionally incornfields. Other examples are Amaranthus hybridus,Canna indica, Prunus serotina, Jatropha curcas,Renealmia alpinia, Leucaena leucocephala,Porophyllum ruderale, Sideroxylon palmeri andCleoserrata speciosa (see Additional file 2).Transplanting of whole plants. This practice involvestransplanted complete individuals from wildenvironments to crop field or homegardens.Frequently, these individuals have characteristics thatare appreciated by people. For instance, Agave obscuraand Eugenia capuli are transplanted to homegardens
because according to people these are scarce in naturalvegetation. Their proximity allows them to takeadvantage of these species without traveling longdistances. Eugenia capuli has recently acquiredimportance as flavoring for coffee, so this is anadditional reason for transplanting it. Crataegusmexicana is also transplanted to crop fields. Besideseating the fruit, the whole plant it is used to graft offruit trees like apple and quince. Other speciestransplanted are Inga vera, Peperomia peltilimba andSpathiphyllum cochlearispathum. Agave salmiana ispropagated mainly in crop fields. Shoots are removedof mother plants and they are replanted mainly on theedges of crop fields. These actions allow theconservation of soil and retain moisture. Also theyserve as a living fences to demarcate plots.Propagation of vegetative parts. Stems of Cestrumnocturnum and Piper auritum whose leaf buds areedible, are planted in homegardens.
Management intensityIt is possible to generally recognize a gradient of man-agement intensity. How intense plant management canbe appears to be related mainly with the economic andcultural importance, easiness of propagation, as well asperception of resource scarcity (Table 8, Figure 3).With the exception of Porophyllum ruderale and
Amaranthus hybridus, most of managed plant speciesrecorded in this study are perennial plants, particularlythose with both sexual and asexual propagation. This is forinstance the case of Chamaedorea tepejilote. In contrast,most species with low levels of management intensity arethose propagated by either sexual or asexual means.Economic importance enhances plant management in-
tensity. Species like Chamaedorea tepejilote, Leucaenaleucocephala, Litsea glaucescens, Eugenia capuli andPorophyllum ruderale are now demanded in regionalmarkets and people are interested in ensuring and in-creasing their availability through propagating them.We found that the management intensity index proposed
is generally proportional to the risk index constructedbased on distribution, abundance, cultural and economicimportance. This general pattern suggests that in the caseof edible plants, management is a response associated tofood security. Uncertainty in the availability of edible re-sources appears to be an important motive of manage-ment. Such uncertainty should be perceived associated toecological factors such as year to year periods accordingto variations in mean temperature and precipitation,longer period’s climate change, pests’ incidence, amongothers. Meaning of uncertainty or scarcity may be variableaccording to variation in cultural and economic import-ance. How uncertainty or scarcity of a plant resource ismeaningful to people may be influenced by the role of
Blancas et al. Journal of Ethnobiology and Ethnomedicine 2013, 9:39 Page 20 of 22http://www.ethnobiomed.com/content/9/1/39
plants in human subsistence and how indispensable orsubstitutable the resources are. Uncertainty in plant avail-ability is an important issue to be investigated in order tounderstand motives of plant management and domestica-tion. Uncertainty could also be the a motive of manage-ment of plants used for medicinal purposes or for fuelwood whose availability people want to ensure, to havecloser to their houses or to increase. Ornamental plantsare importantly managed and uncertainty could not bethe main factor motivating management since theseplants are managed because of their beauty and thespiritual wellbeing they determine when having themaround. Therefore, motives of plant management wouldnot only be responses to scarcity and food security, butthis is a topic yet to be investigated. Qualitative re-search approaches would be appropriate for a deeperunderstanding on this topic.In a previous study Casas et al. [13,19] discussed that in-
tensity of interactions between humans and plants areinfluenced by 1) their role in human subsistence (in eco-nomic and cultural terms), 2) their availability (distributionand abundance) in relation to human demand, 3) quality oftheir products, 4) viability of managing their propagules,their populations or biotic communities where these re-sources occur, which is influenced by length of life cycle, re-productive system, capacity of adaptation to human madeenvironments, among others. Our current study confirmsthat these are relevant aspects and provides methodologicaltools for analyzing how meaningful these factors arefor motivating management. These factors are dynamicthroughout time and those motivating management atpresent are most probably different to those motivatingmanagement in the past. However, understanding principlesof management construction is helpful for analyzing howhumans currently make and made decisions in the past,as well as for designing decisions for a sustainable future.
Additional files
Additional file 1: Edible plant species recorded in the study area.Voucher specimens are José Blancas collection numbers.
Additional file 2: Management forms of edible plant species inSanta María Coyomeapan, México.
Competing interestsThe authors articulate that they have no competing interest.
Authors' contributionsJB main author, involved in the study design, conducting of interview, fieldwork, literature review and general data collection and systematization,wrote the first draft and concluded the final version this paper. AC maincoordinator-supervisor of the research project; contributed with original dataand the designing of all the researches providing the information for thecurrent analysis; participated in fieldwork, systematization and analysis ofdata and reviewed several drafts of the manuscript. EV suggested andperformed statistical analysis, teaming with JB and AC. DP and JC
contributed to designing and following progress of the research and fieldwork and data analyses. All authors read and approved the final manuscript.
Authors' informationJB postgraduate student at the Centro de Investigaciones en Ecosistemas(CIEco), UNAM. AC, DP and EV full time researchers at CIEco, UNAM. JCresearcher at the Jardín Botánico, Instituto de Biología, UNAM.
AcknowledgementsThe authors thank the Posgrado en Ciencias Biológicas, UNAM and theConsejo Nacional de Ciencia y Tecnología CONACYT for supporting PhDstudies of JB. The Programa de Apoyo a Proyectos de Investigación eInnovación Tecnológica (PAPIIT IN219608) and CONACYT (CB-2008-01-103551) for financial support of research. We specially thank people of theCoyomeapan for their hospitality, generosity and participation in interviewsand sharing their knowledge.
Author details1Centro de Investigaciones en Ecosistemas (CIECO), Universidad NacionalAutónoma de México (campus Morelia), Antigua Carretera a Pátzcuaro 8711Col. Ex Hacienda de San José de la Huerta, Morelia, Michoacán 58190, México.2Jardín Botánico, Instituto de Biología, Universidad Nacional Autónoma deMéxico, Apdo. Postal 70-614, C.P. 04510, Ciudad Universitaria, D.F, México.
Received: 7 April 2013 Accepted: 24 May 2013Published: 2 June 2013
References1. Casas A, Caballero J, Mapes C, Zárate S: Manejo de la vegetación,
domesticación de plantas y origen de la agricultura en Mesoamérica.Boletín de la Sociedad Botánica de México 1997, 61:31–47.
2. Casas A, Otero-Arnaiz A, Pérez-Negrón E, Valiente-Banuet A: In situmanagement and domestication of plants in Mesoamerica. Ann Bot 2007,100:1101–1115.
3. Blancas J, Casas A, Rangel-Landa S, Moreno-Calles A, Torres I, Pérez-NegrónE, Solís L, Delgado-Lemus A, Parra F, Arellanes Y, Caballero J, Cortés L, Lira R,Dávila P: Plant management in the Tehuacán-Cuicatlán Valley Mexico.Econ Bot 2010, 64(4):287–302.
4. Parra F, Blancas J, Casas A: Landscape management and domestication ofStenocereus pruinosus (Cactaceae) in the Tehuacán Valley: human guidedselection and gene flow. J Ethnobiol Ethnomed 2012, 8:32.
5. Casas A, Vázquez C, Viveros JL, Caballero J: Plant management amongthe Nahua and the Mixtec in the Balsas River Basin, México:an ethnobotanical approach to the study of plant domestication.Hum Ecol 1996, 24(4):455–478.
6. Toledo VM, Ordoñez MJ: The biodiversity scenario of Mexico: a review ofterrestrial habitats. In Biological diversity of Mexico, Origins and distribution.Edited by Ramamoorthy TP, Bye R, Lot A, Fa J. New York: Oxford UniversityPress; 1993:81–101.
7. Caballero J, Casas A, Cortés L, Mapes C: Patrones en el conocimiento, uso ymanejo de plantas en pueblos indígenas de México. Estudios Atacameños1998, 16:181–195.
8. Alcorn JB: Huastec non-crop resource management: implications forprehistoric rainforest management. Hum Ecol 1981, 9(4):395–417.
9. Berkes F, Holding J, Folke C: Rediscovery of traditional ecologicalknowledge as adaptive management. Ecol Appl 2000, 10:1251–1262.
10. Toledo VM, Ortiz-Espejel B, Cortés L, Moguel P, Ordoñez MJ: The multipleuse of tropical forests by indigenous peoples in Mexico: a case ofadaptive management. Conserv Ecol 2003, 7:9.
11. Bye R: The role of humans in the diversification of plants in Mexico.In Biological diversity of Mexico, Origins and distribution. Edited by RamamoorthyTP, Bye R, Lot A, Fa J. New York: Oxford University Press; 1993:707–731.
12. Caballero J: La dimension culturelle de la diversite vegetale au Mexique.Journal d’ Agriculture Traditionelle et de Botanique Appliquee 1994,XXXVI(2):1–12.
13. Casas A, Valiente-Banuet A, Viveros JL, Caballero J, Cortés L, Dávila P, Lira R,Rodríguez I: Plant resources of the Tehuacán-Cuicatlán valley, México.Econ Bot 2001, 55:129–166.
14. Turner NJ: “The Importance of a rose”: evaluating the cultural significanceof plants in Thompson and Lillooet Interior Salish. Am Anthropol 1988,90:272–290.
Blancas et al. Journal of Ethnobiology and Ethnomedicine 2013, 9:39 Page 21 of 22http://www.ethnobiomed.com/content/9/1/39
15. Pieroni A: E: Evaluation of the cultural significance of wild food botanicalstraditionally consumed in northwestern Tuscany, Italy. J Ethnobiol 2001,21(1):89–104.
16. Camou-Guerrero A, Reyes-García V, Martínez-Ramos M, Casas A: Knowledgeand use value of plant species in a Rarámuri community: a genderperspective for conservation. Hum Ecol 2007, 36:259–272.
17. Reyes-García V, Huanca T, Vadez V, Leonard WR, Wilkie D: Cultural, practical,and economic value of wild plants: a quantitative study in the BolivianAmazon. Econ Bot 2006, 60(1):62–74.
18. Tardío J, Pardo-de-Santayana M: Cultural importance indices: a comparativeanalysis based on the useful wild plants of southern Cantabria (northernspain). Econ Bot 2008, 62(1):24–39.
19. García-Frapolli E, Toledo VM, Martinez-Alier J: Apropiación de la naturalezapor una comunidad maya yucateca: un análisis económico-ecológico.Revista Iberoamericana de Economía Ecológica 2008, 7:27–42.
20. Casas A, Rangel-Landa S, Torres-García I, Pérez-Negrón E, Solís L, Parra F,Delgado A, Blancas J, Farfán B, Moreno A: In situ management andconservation of plant resources in the Tehuacán-Cuicatlán Valley,Mexico: an ethnobotanical and ecological perspective. In Currenttopics in Ethnobotany. Edited by De Albuquerque U, Alves-Ramos M. India:Resesarch Sigpost; 2008:1–23.
21. Higgs ES, Jarman MR: The origins of animal and plant husbandry.In Papers in economic prehistory. Edited by Higgs ES. Cambridge: UniversityPress; 1972:3–14.
22. Rindos D: The origins of agriculture: an evolutionary perspective. Orlando:Academic Press; 1984.
23. Ford R: Prehistoric food production in North America. In Anthropologicalpapers. Nº 75. Edited by Ford R. Michigan: Ann Arbor-Museum ofAnthropology University of Michigan; 1985:365–411.
24. González-Insuasti MS, Caballero J: Managing plant resources: howintensive can it be? Hum Ecol 2006, 35:303–314.
25. González-Insuasti MS, Martorell C, Caballero J: Factors that influence the intensityof non-agricultural management of plant resources. Agroforest Syst 2008, 74:1–15.
26. Colunga-GarcíaMarín P, Zizumbo-Villarreal D: Domestication of plants inMaya Lowlands. Econ Bot 2004, 58:S101–S110.
27. Mapes C, Caballero J, Espitia E, Bye RA: Morphophysiological variation insome Mexican species of vegetable Amaranthus: evolutionarytendencies under domestication. Genet Resour Crop Evol 1996, 43:283–290.
28. Rendón B, Rebollar S, Caballero J, Martínez M: Plantas, cultura y sociedad:Estudio sobre la relación entre seres humanos y plantas en los albores del sigloXXI. Mexico city: Universidad Autónoma Metropolitana-Unidad Iztapalapa ySecretaría de Medio Ambiente Recursos Naturales y Pesca; 2001.
29. Altieri MA, Koohafkan P: Globally important ingenious agricultural heritage systems(GIAHS): extent, significance, and implications for development, GIAHS secondinternational workshop and steering committee meeting. United Nations foodand agriculture organization: 7–9 June 2004. Rome: UN-FAO; 2004:1–44.
30. Instituto Nacional para el Federalismo y el Desarrollo Municipal (INAFED).Enciclopedia de los municipios y delegaciones de México. http://www.e-local.gob.mx/wb2/ELOCAL/EMM_Puebla. INAFED, Mexico; 1986.
31. Bernard RH: Research methods in anthropology: qualitative & quantitativemethods. New York: Altamira Press; 2002.
32. Valiente-Banuet A, Casas A, Alcántara A, Dávila P, Flores-Hernández N,Villaseñor JL, Ortega-Ramírez J, Soriano JA: La vegetación del Valle deTehuacán-Cuicatlán. Boletín de la Sociedad Botánica de México 2000, 67:25–74.
33. Pérez-Negrón E, Casas A: Use, extraction rates and spatial availability ofplant resources in the Tehuacán-Cuicatlán Valley, Mexico: The case ofSantiago Quiotepec, Oaxaca. J Arid Environ 2007, 70:356–379.
34. Ihaka R, Gentleman R: A language for data analysis and graphics.J Computational and Graphical Statistics 1996, 5:299–314.
35. R Development Core Team: R: R: A language and environment for statisticalcomputing. Vienna, Austria: R Foundation for Statistical; 2007.
36. Borcard D, Legendre P, Drapeau P: Partialling out the spatial componentof ecological variation. Ecology 1992, 73(Suppl 3):1045–1055.
doi:10.1186/1746-4269-9-39Cite this article as: Blancas et al.: Ecological and socio-cultural factorsinfluencing plant management in Náhuatl communities of theTehuacán Valley, Mexico. Journal of Ethnobiology and Ethnomedicine 20139:39.
Submit your next manuscript to BioMed Centraland take full advantage of:
• Convenient online submission
• Thorough peer review
• No space constraints or color figure charges
• Immediate publication on acceptance
• Inclusion in PubMed, CAS, Scopus and Google Scholar
• Research which is freely available for redistribution
Submit your manuscript at www.biomedcentral.com/submit
Blancas et al. Journal of Ethnobiology and Ethnomedicine 2013, 9:39 Page 22 of 22http://www.ethnobiomed.com/content/9/1/39