ecconet: methodological overview€¦ · ecconet: methodological overview transport & mobility...
TRANSCRIPT
ECCONET: methodological overview
Transport & Mobility Leuven
Christophe Heyndrickx
Tim Breemersch

Outline presentation
• Project plan and objectives ECCONET
• Methodological issues
– Modelling
– Adaptation measures

ECCONET
• Effects of Climate Change on the inland
waterway network
• 7th Framework Program, European
Commission
• 10 partners, 5 countries, multidisciplinary: – Meteorology
– Hydrology
– Infrastructure Management
– Shipbuilding
– Economics/Logistics
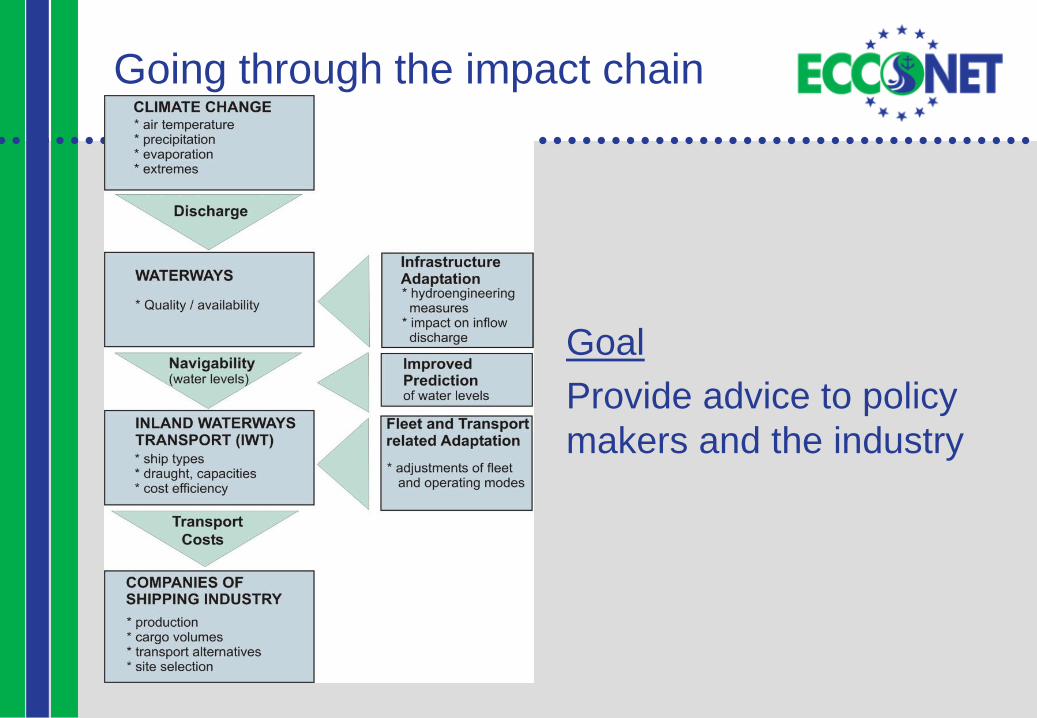
Going through the impact chain
Goal
Provide advice to policy
makers and the industry

Methodology and modeling
Time span Important output
variables
Complications
Climatological models 30 year-averages for
example:1960-1990,
1991-2021, 2021-2050,
2040-2070, etc.
precipitation,
temperature
Bias-prediction, regional
climate scenarios, large
set of model chains
(ensembles), uncertainty
Hydrological
modelling
Daily and even hourly
variations for all
modelled years (30
years)
water levels/water
depths on different
river stretches
based on nature of
river
Added uncertainty due to
regional variance and
anthropogenic factors.
Large running time
Transport-economic
modelling
Based on an OD-matrix
for 1 year. Predictions
should be based on
averages or should be
composed of different
characteristic situations
Flow of goods by
transport mode
(inland waterways
are 1 of the modes)
Costs of transport
(minimized by
model)
Difficult to handle sub-
annual information (for
example seasonal
variance)
Uncertainty in OD matrix.
Only a limited set of
model runs is possible

Selected impact chains

Representative years
2005 ‘reference’ Near future 'dry' scenario
Water depth Median D5 D10 Median D5 D10
1.6 0 0 0 0 4 24
1.8 0 20 36 5.5 55 74
2 14 61 86 28.5 79.5 121.5
2.4 133 192 221 135.5 203.5 234.5
2.6 182 260 273 216 259.5 307.5
3.25 301 334 344 324 365 365
3.55 328 351 352 344 365 365
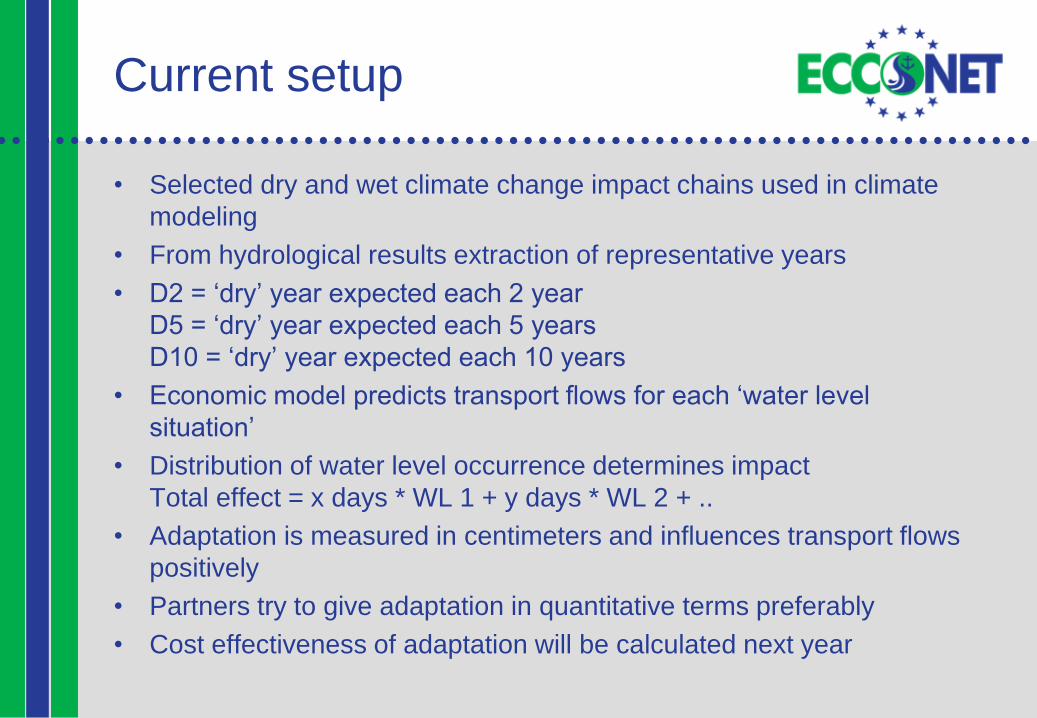
Current setup
• Selected dry and wet climate change impact chains used in climate
modeling
• From hydrological results extraction of representative years
• D2 = ‘dry’ year expected each 2 year
D5 = ‘dry’ year expected each 5 years
D10 = ‘dry’ year expected each 10 years
• Economic model predicts transport flows for each ‘water level
situation’
• Distribution of water level occurrence determines impact
Total effect = x days * WL 1 + y days * WL 2 + ..
• Adaptation is measured in centimeters and influences transport flows
positively
• Partners try to give adaptation in quantitative terms preferably
• Cost effectiveness of adaptation will be calculated next year

Chosen ship types
# CEMT
class
Name (type of ship,
train)
Length Beam Draught
at 78%
load
Draught
min.
Payload at
min.draug
ht
Draught
max.
Payload at
max.
draught
(m) (m) (m) (m) (t) (m) (t)
RHINE SHIPS
1 III Gustav Koenigs 80 8.2 2.10 1.10 240 2.50 1080
2 IV Johann Welker
("Europe"-ship)
85 9.5 2.36 1.20 312 2.80 1560
3 Va GMS 110 110 11.4 2.95 1.35 392 3.50 2873
4 Vb GMS 135 135 11.4 2.93 1.35 672 3.50 3802
5 Vb Koppelverband 185 11.4 2.92 1.35 1005 3.50 5292
GMS 110 + 1 x E-II
Rhine
DANUBE SHIPS
1 III Gustav Koenigs 80 8.2 2.10 1.10 240 2.50 1080
2 Vb Koppelverband 172 11 2.14 1.35 935 2.50 3240
GMS 95 + E-II-
Danube
3 VIb Koppelverband 172 22 2.11 1.35 2270 2.50 6380
GMS 95 + 3 E-II-
Danube
4 VIc PB + 3x2 Danube
barges
270 22 2.06 1.60 5180 2.50 9420
PB + 2x3 Danube
barges
190 33 2.06 1.60 5180 2.50 9420

Fleet adaptation Measure Primary effect Preliminary assessment
A1 Lightweight structure Reduction of own weight
causing lower draught
Further research necessary on
technical solutions
A2 Adjustable tunnel Navigation in lower water
levels
In combination with A1
A3 Side blisters
Payload gain between 115
and 260 tonnes
Theoretical approach, handling
provides to be difficult
A4 Flat hulls (multiple screw
push boats)
Draught reduction from
1.7 to 1.4 meter
Promising approach especially
for push boat technology, even at
increased construction cost
B1 Small instead of large
vessels
Small vessels are less
water sensitive
Goes contrary to scale effect
B2 Upgrade of small vessels to
continuous operation
Increased performance Promising approach
B3 Coupling convoys Redistribution of load Promising due to increased scale
effect
C1 Strategic alliance between
IWT and other modes
Co-operation with other
modes
Capacity limits of rail and high
prices make this difficult

Adaptation measured in cm
savings immersion
[t] [t/cm] 5 6 7 8 9 10 15 20 25 30
Gustav Koenigs extended 45 6,1 31 37 43 45 45 45 45 45 45 45
Johann Welker extended 55 7,5 38 45 53 55 55 55 55 55 55 55
GMS 110 90 11,1 56 67 78 89 90 90 90 90 90 90
GMS 135 150 14,3 72 86 100 115 129 143 150 150 150 150
JOWI 200 21,1 105 127 148 169 190 200 200 200 200 200
Europe II Barge 70 8,0 40 48 56 64 70 70 70 70 70 70
More carrying capacity at reduced draught for x[cm] - corresponds to the
same drop of water depth and unchanged carrying capacity
water level drop [cm]
Co
mpe
nsa
tio
n o
f
ca
rryin
g c
apa
city
[t]
• Example: weight reduction

Infrastructure adaptation
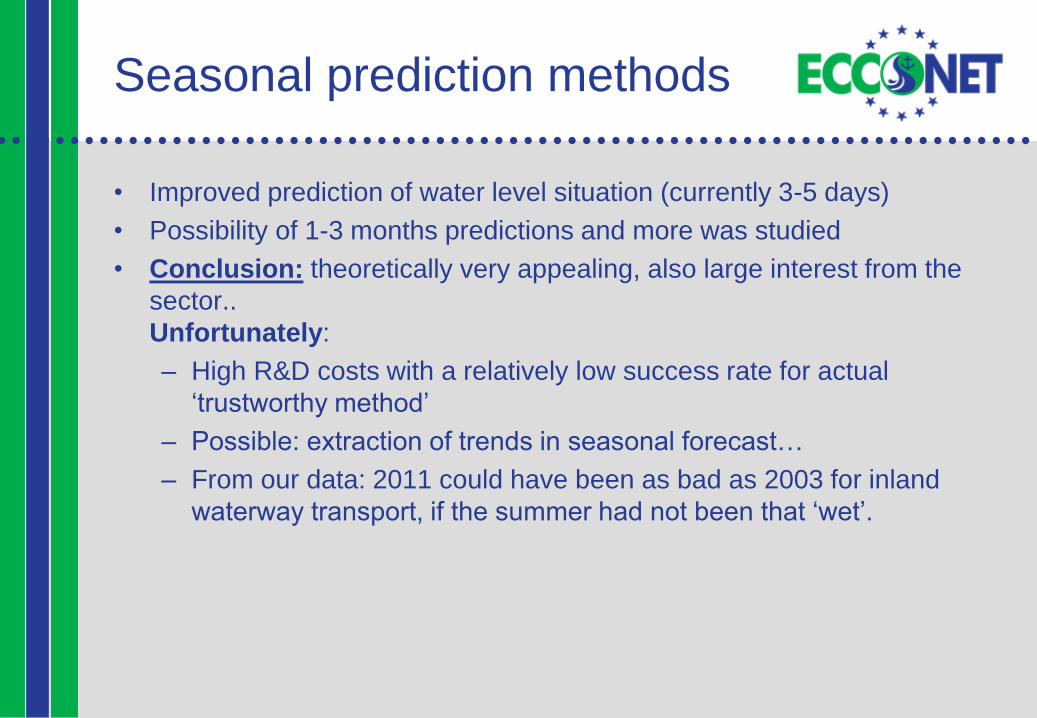
Seasonal prediction methods
• Improved prediction of water level situation (currently 3-5 days)
• Possibility of 1-3 months predictions and more was studied
• Conclusion: theoretically very appealing, also large interest from the
sector..
Unfortunately:
– High R&D costs with a relatively low success rate for actual
‘trustworthy method’
– Possible: extraction of trends in seasonal forecast…
– From our data: 2011 could have been as bad as 2003 for inland
waterway transport, if the summer had not been that ‘wet’.

Adaptation by industry
• Survey method: Very low response rate
– 80 questionnaires were sent out, only 9 filled in.
(+- 10 % response)
• We have the impression that the issue of climate change
is currently not alive in the sector.
• Our results show that the impact of climate change should
not be overestimated, the impact is relatively low,
especially compared to economic variables
• Additionally very large time spans -> potential negative
side-effects only really apparent for 2100

Work planned
• Evaluation of adaptation measures:
– By transport network modeling
– Cost effectiveness analysis
• Policy advice
• Project end date January 2013

Christophe Heyndrickx
Tim Breemersch
Transport & Mobility Leuven
Diestsesteenweg 57
Tel: +32 (16) 74.51.21
ECCONET website
www.tmleuven.be/project/ecconet/home.html