ec689 mnc trendshandout
TRANSCRIPT

1
Trends in Multinational Activity
Economics 689 Texas A&M University
BEA Operations of US MNCs
• Slow growth in the operations of U.S. multinational companies (MNCs) during the first decade of the 21st century, compared with growth in the preceding decade.
• Benchmark statistics now cover the operations of bank MNCs as well as those of nonbank MNCs; previously, coverage was limited to the operations of nonbank MNCs.

2
BEA Operations of US MNCs
• The worldwide current-dollar value added of U.S. MNCs - the combined value added of U.S. parent companies and their majority-owned foreign affiliates increased at an average annual rate of 3.1% in 1999-2009, – compared with 6.6% in 1989-1999.
BEA Operations of US MNCs
• In 1999–2009, the value added of foreign affiliates grew substantially faster (7.0%) than that of their U.S. parents (1.7%).– Faster growth abroad was concentrated in
emerging markets, such as China, Brazil, India, and Eastern Europe.

3
BEA Operations of US MNCs
• The goal of the U.S. MNCs expanded production was to primarily sell to local customers – rather than to reduce their labor costs for goods and
services destined for sale in the United States, Western Europe, and other high income countries.
• Sales by foreign affiliates were $4,857 billion. Sales to host-country customers accounted for 60.8%, sales to customers in foreign countries other than the host country accounted for 30.3%, and sales to U.S. customers accounted for 8.9%.
BEA Operations of US MNCs
• Most foreign affiliates continued to be located in high-income countries.
• Affiliates in these countries accounted for about 73 percent of the value added by all affiliates. – However, the share of these countries decreased 10
percentage points from 1999 to 2009.
• U.S. MNCs tend to be very large companies (parent companies that have more than 10,000 employees), compared with U.S. businesses as a whole.
4
BEA Operations of US MNCs
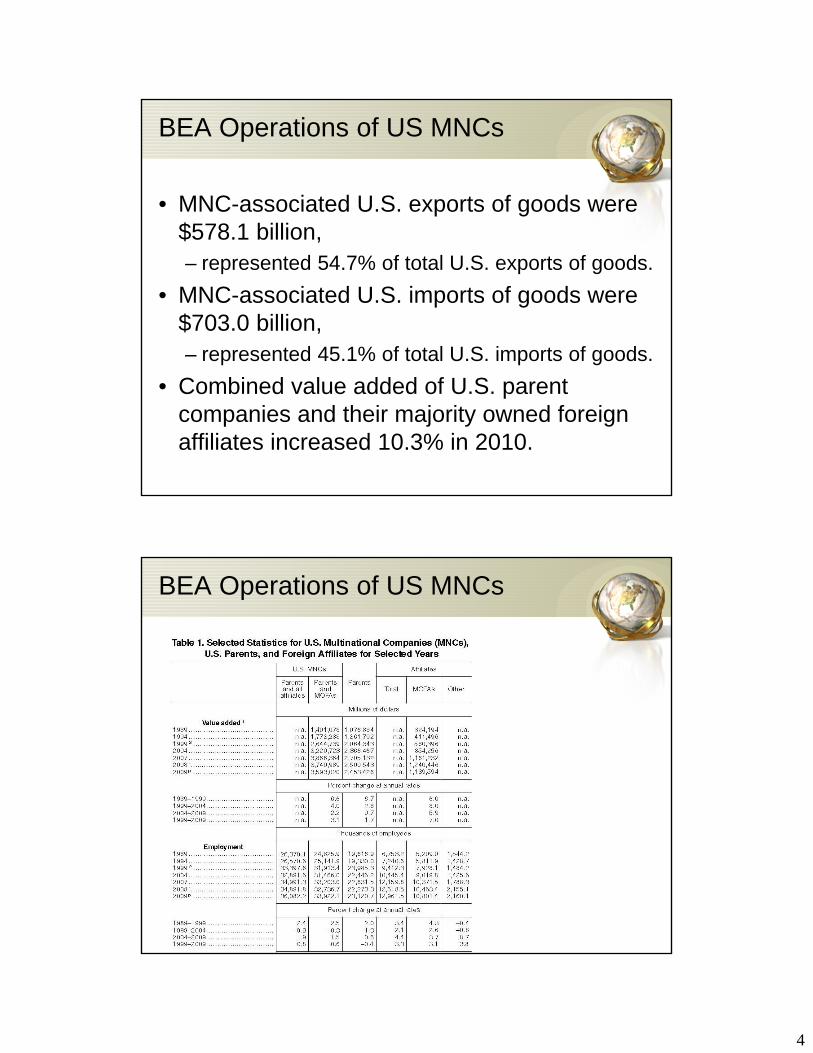
• MNC-associated U.S. exports of goods were $578.1 billion, – represented 54.7% of total U.S. exports of goods.
• MNC-associated U.S. imports of goods were $703.0 billion, – represented 45.1% of total U.S. imports of goods.
• Combined value added of U.S. parent companies and their majority owned foreign affiliates increased 10.3% in 2010.
BEA Operations of US MNCs

5
World Investment Report 2011
• Global foreign direct investment (FDI) flows rose moderately to $1.24 trillion in 2010, but were still 15% below their pre-crisis average.
• In contrast, global industrial output and trade were already back to pre-crisis levels.
• UNCTAD estimates that global FDI will recover to its pre-crisis level in 2011 and approach its 2007 peak in 2013.
Global FDI Inflows 2007-2010

6
Global FDI Flows 2002-2010
World Investment Report 2011
• For the first time, developing and transition economies together attracted more than half of global FDI flows.
• Half of the top-20 host economies for FDI in 2010 were developing or transition economies.
• Outward FDI from those economies also reached record highs, with most of their investment directed towards other countries in the South.
• In contrast, FDI inflows to developed countries continued to decline.

7
FDI Inflows by Group of Country
Distribution of FDI by Region

8
World Investment Report 2011
• International production is expanding, with foreign sales, employment and assets of transnational corporations (TNCs) all increasing.
• TNCs’ production worldwide generated value-added of approximately $16 trillion in 2010, about a quarter of global GDP.
• Foreign affiliates of TNCs accounted for more than 10% of global GDP and one-third of world exports.
FDI Inflows: Top 20 Countries
9
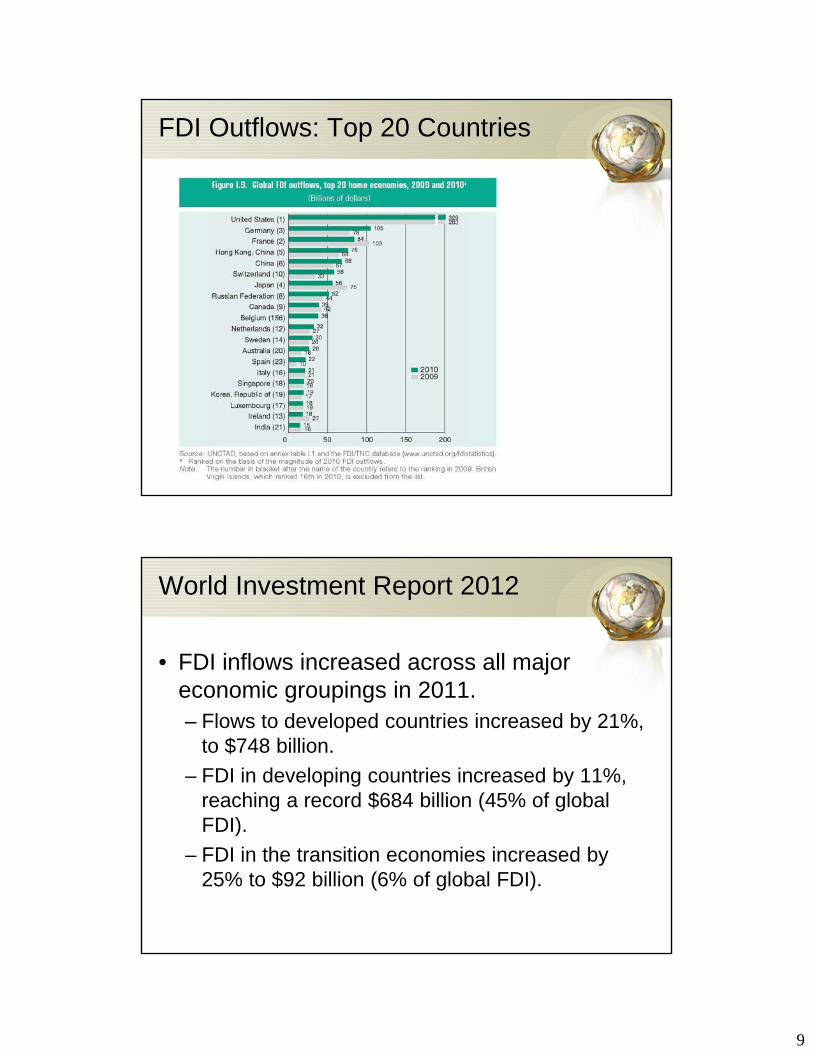
FDI Outflows: Top 20 Countries
World Investment Report 2012
• FDI inflows increased across all major economic groupings in 2011. – Flows to developed countries increased by 21%,
to $748 billion.
– FDI in developing countries increased by 11%, reaching a record $684 billion (45% of global FDI).
– FDI in the transition economies increased by 25% to $92 billion (6% of global FDI).
10
World Investment Report 2013
• Global FDI fell 18% to $1.35 trillion in 2012.
• For the first time ever, developing economies absorbed more FDI than developed countries, accounting for 52% of global FDI flows. – The biggest fall in FDI inflows occurred in
developed countries, which now account for only 42% of global flows.
• Developing economies generated almost one third of global FDI outflows, continuing a steady upward trend.
World Investment Report 2014
• After the 2012 slump, global FDI grew, with inflows rising 9% in 2013, to $1.45 trillion.
• FDI flows to developed countries increased by 9% to $566 billion, leaving them at 39% of global flows, while those to developing economies reached a new high of $778 billion, or 54% of the total.
• The balance of $108 billion went to transition economies.

11
World Investment Report 2014
• Developing and transition economies now constitute half of the top 20 ranked by FDI inflows.
• FDI outflows from developing countries also reached a record level.
• Developing and transition economies together invested $553 billion, or 39% of global FDI
Trends in Multinational Activity
• Wynne & Kersting (2008), “The Globalization of U.S. Business Investment,” Federal Reserve Bank of Dallas Staff Papers.
• Provides some key facts about foreign direct investment flows by U.S. businesses overseas and foreign businesses in the United States. – How the pattern of flows has evolved, – Sources and destination of these flows, – Associated employment and productivity gains, and – How investment-related sales compare with traditional
exports.

12
Trends in Multinational Activity
• Direct investment overseas by U.S. businesses exceeds direct investment in the U.S. by foreign businesses.
• U.S. businesses seem to earn more on their foreign investments than foreign firms earn on their U.S. investments.
• Bulk of U.S. investment overseas is in other high-income countries.
Trends in Multinational Activity
• Foreign investment in the U.S. has been an important source of employment growth in recent years.
• Even employment oversees by U.S. multinationals mostly complements domestic employment – more employment abroad leads to more
employment at home.

13
Trends in Multinational Activity
• Examples for foreign direct investment (FDI):– Ireland has become a major platform for U.S. businesses
seeking to sell into the single European market.
– Since the 1980s, many Japanese auto companies have opened plants in the United States to produce for the American market.
– The big U.S. automobile manufacturers use maquiladoras in Mexico to construct parts like doors and electronic components like sensors, which are shipped to the United States for final assembly and sale.
Trends in Multinational Activity
• To answer any policy questions about multinational firms, must first understand why they occur.
• Choose between making goods at home and exporting them to a foreign market or producing overseas.
• Transportation costs, tariffs and nontariff barriers can make exporting unattractive.
• FDI that is motivated by the existence of high trade costs is referred to as “tariff-jumping.”

14
Trends in Multinational Activity
• Firms that engage in FDI (multinational firms) are assumed to have firm-specific assets that both give them an advantage in their industry significant enough to venture abroad– Such as superior production techniques and
management strategies.
• These assets help explain stylized facts about FDI, such as higher productivity and wages in multinational firms relative to domestic ones.
Trends in Multinational Activity
• Investment undertaken by multinational enterprises usually falls into one of two categories. – Horizontal investment = creating a subsidiary in a host
country that essentially replicates the original firm’s operations.
– This form of investment is chosen when the reason for going abroad is to enter a new market.
– Horizontal investment is usually viewed as the main driver of FDI between developed countries, and tariff-jumping is often seen as an important motive for horizontal FDI.

15
Trends in Multinational Activity
• Vertical investment takes advantage of differences in factor costs by shifting some stages of production abroad. – Such as a firm moving final assembly of its product to a
country where low-skilled labor is abundant and cheap, but keeping design stage back at home.
• Vertical investment is the root of many concerns about the potential negative effects of globalization and the fear that firms are “exporting jobs.”
• FDI can also create export platforms for selling to third countries.
Trends in Multinational Activity
• FDI predominantly occurs between developed countries suggests that horizontal investment plays a much larger role than vertical investment.
• Projects in Europe and Canada are mostly undertaken to enter new markets, not to access large pools of cheap labor.
• Horizontal investment can be expected to increase the domestic activity of the U.S. parent of the new affiliate rather than cause it to export jobs.
16
Trends in Multinational Activity
• The firm specific assets that give rise to multinational activity also create accounting nightmares.
• The location of intangible assets, such as patents, corporate logos, and software licenses, and the output attributed to them can typically be freely chosen by the firm. – Usually chosen, along with the price that inputs
are transferred within the firm, to minimize taxes.
Trends in Multinational Activity
• FDI into the United States
• Gross product of U.S. affiliates almost doubled from 1992 to 2000, while employment of U.S. affiliates of foreign multinationals rose from 2 million in 1980 to 6.5 million in 2000.– 5.6, 5.6 & 5.3 million in 2007, 2008 & 2009 (BEA)
• Foreign-owned establishments are more concentrated in the Southeastern United States.

17
Trends in Multinational Activity
• Canadian investment is concentrated in areas along the country’s border and in the central United States.– Greenfield investment from Canada primarily takes place in regions
that already host Canadian-owned establishments.– Greenfield investments are new plants and facilities (starting from a
“green field”).
• French- and German-owned greenfield establishments tend to locate in the eastern half of the United States.
• New British-owned establishments follow a regional pattern most similar to U.S. establishments.
Trends in Multinational Activity
• Japanese greenfield establishments tend to concentrate in the far Western United States and along a corridor from Indiana to northern Georgia.
• The Western establishments are in the electronics industry, whereas most in the corridor are related to producing motor vehicles.