ebooksclub.org ...
TRANSCRIPT


Biomechatronic Designin Biotechnology
Biomechatronic Designin Biotechnology
A Methodology for Developmentof Biotechnological Products
Carl-Fredrik MandeniusProfessor in Engineering Biology
Linkoping University, Sweden
Mats BjorkmanProfessor in Assembly Technology
Linkoping University, Sweden
Copyright � 2011 by John Wiley & Sons, Inc. All rights reserved.
Published by John Wiley & Sons, Inc., Hoboken, New Jersey.
Published simultaneously in Canada.
No part of this publication may be reproduced, stored in a retrieval system, or transmitted in any
form or by any means, electronic, mechanical, photocopying, recording, scanning, or otherwise,
except as permitted under Section 107 or 108 of the 1976 United States Copyright Act, without
either the prior written permission of the Publisher, or authorization through payment of the
appropriate per-copy fee to the Copyright Clearance Center, Inc., 222 Rosewood Drive, Danvers,
MA 01923, (978) 750-8400, fax (978) 750-4470, or on the web at www.copyright.com. Requests
to the Publisher for permission should be addressed to the Permissions Department, John Wiley &
Sons, Inc., 111 River Street, Hoboken, NJ 07030, (201) 748-6011, fax (201) 748-6008, or online at
http://www.wiley.com/go/permission.
Limit of Liability/Disclaimer of Warranty: While the publisher and author have used their best
efforts in preparing this book, they make no representations or warranties with respect to the accuracy
or completeness of the contents of this book and specifically disclaim any implied warranties of
merchantability or fitness for a particular purpose. No warranty may be created or extended by sales
representatives or written sales materials. The advice and strategies contained herein may not be suitable
for your situation. You should consult with a professional where appropriate. Neither the publisher nor
author shall be liable for any loss of profit or any other commercial damages, including but not limited to
special, incidental, consequential, or other damages.
For general information on our other products and services or for technical support, please
contact our Customer Care Department within the United States at (800) 762-2974, outside the
United States at (317) 572-3993 or fax (317) 572-4002.
Wiley also publishes its books in a variety of electronic formats and by print-on-demand. Not all content
that is available in standard print versions of this book may appear or be packaged in all book formats.
If you have purchased a version of this book that did not include media that is referenced by or
accompanies a standard print version, you may request this media by visiting http://booksupport.wiley.
com. For more information about Wiley products, visit us www.wiley.com.
Library of Congress Cataloging-in-Publication Data:
Mandenius, Carl-Fredrik, 1954-
Biomechatronic design in biotechnology : a methodology for development of
biotechnological products / Carl-Fredrik Mandenius, Mats Bj€orkman.
p. ; cm.
Includes bibliographical references and index.
ISBN 978-0-470-57334-1 (cloth)
1. Biotechnology. 2. Biomechanics. 3. Biomedical engineering. I. Bj€orkman,
Mats, 1955- II. Title.
[DNLM: 1. Biotechnology–methods. 2. Biomedical Engineering–methods. 3.
Chemistry Techniques, Analytical. W 82]
TP248.2.M366 2011
610.28–dc22
2010054066
Printed in Singapore
oBook ISBN: 9781118067147
ePDF ISBN: 9781118067123
ePub ISBN: 9781118067130
10 9 8 7 6 5 4 3 2 1
Contents
PREFACE xiii
1 Introduction 1
1.1 Scope of Design / 1
1.2 Definition of Biomechatronic Products / 3
1.3 Principles of Biomechatronics / 4
1.4 Brief History of the Development of BiomechatronicProducts and Engineering / 7
1.5 Aim of This Book / 9
References / 10
PART I FUNDAMENTALS 13
2 Conceptual Design Theory 15
2.1 Systematic Design / 15
2.1.1 Design for Products / 152.1.2 Origin of the Design Task / 182.1.3 Development of Design Thinking / 182.1.4 Recent Methods / 20
v
2.2 Basics of Technical Systems / 21
2.2.1 Energy, Material, and Signals and TheirConversion / 22
2.2.2 Interrelationships of Functions / 222.2.3 Interrelationship of Constructions / 252.2.4 Interrelationship of Systems / 25
2.3 Psychology in the Systematic Approach / 25
2.4 A General Working Methodology / 26
2.4.1 Analysis for Resolving Technical Problems / 272.4.2 Abstraction of Interrelationships of Systems / 282.4.3 Synthesis of the Technical System / 28
2.5 Conceptual Design / 28
2.6 Abstraction inOrder to Identify Essential Problems / 29
2.7 Developing the Concepts / 31
2.7.1 Organizing the Development Process / 332.8 Concluding Remarks / 34
References / 35
3 Biotechnology and Mechatronic Design 37
3.1 Transduction of the Biological Scienceinto Biotechnology / 37
3.2 Biological Sciences and Their Applications / 39
3.3 Biotechnology and Bioengineering / 42
3.4 Applying Mechatronic Theory toBiotechnology: Biomechatronics / 44
3.5 Conclusions / 47
References / 48
4 Methodology for Utilization of MechatronicDesign Tools 49
4.1 Idea of Applying the Mechatronic Design Tools / 49
4.2 Table of User Needs / 51
4.3 List of Target Specifications / 52
4.4 Concept Generation Chart / 52
4.4.1 Basic Concept Component Chart / 534.4.2 Permutation Chart / 54
4.5 Concept Screening Matrix / 55
4.6 Concept Scoring Matrix / 56
4.7 Hubka–Eder Mapping / 57
vi CONTENTS
4.7.1 Overview Hubka–Eder Map / 574.7.2 Zoom-in Hubka–Eder Mapping / 59
4.8 Functions Interaction Matrix / 60
4.8.1 Functions Interaction Matrix for Systems andSubsystems / 60
4.8.2 Functions Interaction Matrix for Systemsand Transformation Process / 61
4.8.3 Design Structure Matrix / 614.9 Anatomical Blueprint / 62
4.10 Conclusions / 63
References / 63
PART II APPLICATIONS 65
5 Blood Glucose Sensors 67
5.1 Background of Blood Glucose Analysis / 67
5.2 Specification of Needs for BloodGlucoseAnalysis / 70
5.3 Design of Blood Glucose Sensors / 71
5.3.1 Generation of Sensor Concepts / 715.4 Description of the Systems Involved in the
Design Concepts for Glucose Blood Sensors / 76
5.4.1 Biological Systems / 775.4.2 Technical Systems / 775.4.3 Information Systems / 785.4.4 Management and Goal Systems / 785.4.5 Human Systems / 795.4.6 Active Environment / 795.4.7 Interactions Between the Systems and
Functions of the Design / 795.4.8 Anatomical Blueprints from the Functions
Interaction Matrix Analysis / 815.5 Conclusions / 82
References / 82
6 Surface Plasmon Resonance Biosensor Devices 85
6.1 Introduction / 85
6.2 Design Requirements on SPR Systems / 88
6.2.1 Needs and Specifications of anSPR Design / 88
CONTENTS vii
6.3 Mechatronic Design Approach of SPR Systems / 89
6.3.1 Generation of Design Alternatives / 896.3.2 Hubka–Eder Mapping of the Design
Alternatives / 926.4 Detailed Design of Critical SPR Subsystems / 99
6.4.1 Design of the Sensor Surface / 1006.4.2 Design of the Fluidic System / 103
6.5 Conclusions / 109
References / 109
7 A Diagnostic Device for Helicobacter pylori Infection 113
7.1 Diagnostic Principle of Helicobacter Infection / 113
7.2 Mechatronic Analysis of Urea BreathTest Systems / 117
7.2.1 Mission and Specification for a Urea BreathTests / 117
7.2.2 Generation of UBT Design Concepts / 1187.2.3 Screening and Scoring of UBT Design
Concepts / 1197.3 Description of the Systems Involved in the Design
Concepts for the Urea Breath Tests / 124
7.3.1 Biological Systems Involved / 1247.3.2 Technical Systems Alternatives / 1267.3.3 Information Systems (SIS) Required / 1277.3.4 Management and Goal Systems
Required / 1277.3.5 Human Systems Involved in the Testing / 1277.3.6 Active Environment That Can
Influence / 1287.4 Aspects of the Design for Efficient
Manufacture / 128
7.5 Conclusions / 131
References / 131
8 Microarray Devices 135
8.1 Principles, Methods, and Applicationsof Microarrays / 135
8.1.1 Principles and Technology / 1358.1.2 Fabrication Methods / 136
viii CONTENTS
8.1.3 Companies Developing Microarrays / 1388.1.4 Applications of DNA Microarrays / 139
8.2 Specification of Needs / 141
8.3 Design of Microarrays / 142
8.3.1 Generation of cDNA MicroarrayConcepts / 142
8.4 Description of the Systems Involvedin the Design Concepts / 145
8.4.1 Biological Systems / 1468.4.2 Technical Systems / 1478.4.3 Information System / 1478.4.4 Management andGoal Systemsand theHuman
Systems / 1478.4.5 Active Environment / 1478.4.6 Interaction Analysis / 148
8.5 Conclusions / 149
References / 149
9 Microbial and Cellular Bioreactors 153
9.1 Bioreactor Development During the1970s–1990s / 153
9.2 Missions, User Needs, and Specificationsfor Bioreactors / 158
9.2.1 Design Mission and User Needs / 1589.2.2 Target Specifications / 158
9.3 Analysis of Systems for ConventionalBioreactors / 161
9.3.1 Biological Systems in the Bioreactor / 1619.3.2 Technical Systems / 1649.3.3 Studying the Interactions of the Systems / 1669.3.4 Penicillin Production in a Metabolically
Engineered Penicillium strain (Case 1) / 1689.3.5 A Bioreactor System Producing a Recombinant
Protein in CHO Cell Culture (Case 2) / 1719.3.6 Information Systems / 1739.3.7 Management and Goal Systems / 1779.3.8 Human Systems / 1799.3.9 Active Environment / 179
CONTENTS ix
9.4 Novel Bioreactor Designs / 180
9.4.1 Microbioreactors / 1809.4.2 Bioreactors with Immobilized Cells / 1839.4.3 Bioreactors for Tissue and Stem Cell
Cultures / 1859.4.4 Bioreactors for Plant Cell Cultures / 186
9.5 Conclusions / 187
References / 187
10 Chromatographic Protein Purification 193
10.1 Background of Chromatographic ProteinPurification / 193
10.2 Specification of Needs for ProteinPurification Systems / 197
10.3 Design of Purification Systems / 199
10.3.1 Generation of Design Alternatives / 19910.3.2 Screening the Design Alternatives / 20110.3.3 Analysis of the Generated Alternatives
for a Chromatography System / 20210.3.4 Interactions Between Key Systems and
the Transformation Process / 20610.4 Unit Operation Purification in a FVIII
Production Process (Case 1) / 208
10.5 Micropurification System Based on a Multichip Device(Case 2) / 209
10.6 Conclusions / 211
References / 212
11 Stem Cell Manufacturing 215
11.1 State of the Art of Stem Cell Manufacturing / 215
11.2 Needs and Target Specifications for Scaled-Up StemCell Manufacturing / 218
11.3 Setting Up an Efficient Manufacturing System by UsingBiomechatronic Conceptual Design / 220
11.3.1 Generating Process Alternatives / 22011.3.2 Hubka–Eder Map for a Human Embryonic
Stem Cell Process / 22011.4 Conclusions / 225
References / 226
x CONTENTS
12 Bioartificial Organ-Simulating Devices 229
12.1 Introduction / 229
12.2 Design of Bioartificial Organ-Simulation Devices / 232
12.2.1 Needs and Specifications / 23212.2.2 Evaluation of the Design Concepts / 236
12.3 Analysis of Bioartificial Liver Systems / 239
12.3.1 Biological Systems / 23912.3.2 Technical Systems / 24112.3.3 Information Systems / 24212.3.4 Management and Goals Systems / 24312.3.5 Human Systems / 243
12.4 Conclusions / 244
References / 244
13 Applications to Process Analytical Technologyand Quality by Design 249
13.1 PAT and QbD Concepts / 249
13.2 Needs of the PAT/QbD Players and ResultingSpecifications / 253
13.3 Application of Design Methodology to PAT/QbD / 255
13.3.1 Concept Generation for a PAT/QbD SystemStructure / 255
13.3.2 Hubka–Eder Mapping of the PAT/QbDTransformation Process for a PharmaceuticalProcess / 257
13.3.3 Analysis of Effects / 25913.4 Applying Mechatronic Design on a PAT System
for Online Software Sensing in a Bioprocess(Case) / 260
13.5 Conclusions / 263
References / 263
GLOSSARY 267
INDEX 275
CONTENTS xi

Preface
The purpose of this book is to provide the reader with an introduction to
systematic design principles andmethodologywhen applied to biotechnology
products. Certainly, none of these fields is new on the block – it is the
combination of them that brings about a novel approach in this book. The
theory of systematic design has almost entirely been devoted tomechanics and
electronics, and the biotechnology field has had much of its roots in white
biology and in (bio)chemical engineering.
Thus, we are dealing with a subject that lies on the border between
biological technology and mechanical and electric engineering. The aim is
to integrate important aspects of biological technology with mechanical and
electric engineering. Inwriting a book of this type, there are twomajorways of
organizing the material, either from the perspective of mechanical design
engineering or from the perspective of biotechnology.We have chosen the first
for the simple reason that we have used mechatronics methodology from
mechanical design engineering as a basis and applied it to biotechnology.
When doing so, we have adapted the methodology to what we call a
biomechatronics approach.
We presume the bookwill havemainly two categories of readers, thosewith
a background in biotechnology and related areas and those with a background
in mechanics and electronics. We have tried to keep most of the text on a level
where both categories of readers would be able to understand the subject.
xiii
When this has not been possible, due to space constraints, we have instead
provided rather detailed lists of reference literature.
We realize that a great deal of the biotechnical details in the application
cases in Chapters 5–13 are probably rather difficult to understand for a
person with a background in mechanics and/or electronics. You would need
a thorough knowledge of biotechnology in order to comprehend everything
in these chapters. However, the main ideas of how to utilize and work
with the presented biomechatronic design methodology are possible to
understand when reading these chapters. It is not necessary to understand
all the biotechnological details in order to have great benefit from these
chapters.
We have provided in the book nine application cases from a rather
diverse collection of biotechnology products, such as biosensors, analytical
instrumentations, production equipment for cell culturing, and protein
purification. Some of the products could be characterized more as systems
products rather than discrete physical products, for example, PAT-based
quality systems.
Readers with their own practical experiences could select from these
application cases those relevant to their area of practice. Still, it is necessary
to first grasp the generalmethodology approach and tools, especially explained
in Chapter 4 and related to fundamental design theory in Chapter 2, before
starting reading specific application cases.
The readers who wish to have a complete overview should of course go
through most of the chapters.
We take a great pleasure in expressing thanks to our colleagues Dr. Micael
Derel€ov and Dr. Jonas Detterfelt for contributing many valuable ideas and
suggestions, in particular, to the initial studies of the subject of the book.
Valuable contributions on inquiries and interviews with developers and
companies were made by Maria Uhr and Annika Perhammar.
We also thank our academic colleagues in engineering, medicine, and
biophysics: Drs. Katrin Zeilinger, J€org Gerlach, Bo Liedberg, Danny van
Noort, and Ingemar Lundstr€om.
We are also grateful to many biotechnology companies and their personnel
who have shared their experiences and endeavors in the development of
biomechatronic products. In particular, we would like to mention Drs. Stefan
L€ofa�s, Ulf J€onsson, at Biacore; LasseM€ortsell at BelachAB; Stellan Lindberg
at Hemocue AB; Stefan Nilsson and Johan Ryd�en at Noster AB; Dario Kriz atEuropean Institute of Science AB; and colleagues at Cellartis AB.
We owe gratitude to Abbott, Agilent, Affymetrix, Biodot, Charite
Universitatsmedizin Berlin, GE Healthcare, Hemocue, Johnson & Johnson,
Kibion, KronLab Chromatography, LifeSpan, Roche Diagnostics, Q-Sense
and Mr. Anders Sandelin for providing us figures and pictures.
xiv PREFACE

We would like to thank the Swedish Agency for Innovation Systems
(VINNOVA) andLink€opingUniversity for financially supporting our researchon this topic.
We appreciate the support from John Wiley & Sons, Inc., Hoboken, in the
production of this book.
Finally, we would like to express our sincere gratitude to all the skillful
scientists and engineers who have contributed immensely to the development
of design science in a variety of areas of technology. Without them, this book
would not have been realized.
CARL-FREDRIK MANDENIUS
MATS BJ€ORKMAN
Link€oping
November 2010
PREFACE xv
1Introduction
1.1 SCOPE OF DESIGN
Design is a concept with many aspects. So far, there exists no generally
accepted definition of the concept. The word design has different meanings
in different disciplines and fields. However, in general terms the verb design
normally does refer to the process of planning, constructing, and creating
a physical structure and functions of a physical artifact. Design can also
refer to the process of creating the structure and functions of systems or
services. In most cases, the concept of design is related to the development
of new products.
Design is also characterized by having significant impact on most areas of
human life. Almost all objects we interact with have gone through a design
stage: the house we live in, the household machines for food preparation, and
the vehicles that transport us to our office. Our mobile telephone is integrated
into a complex communication network designed for optimal interconnection.
The pills to cure the headache after work are a result of drug design.
The examples from daily life are endless.
Biomechatronic Design in Biotechnology: A Methodology for Development ofBiotechnological Products, First Edition. Carl-Fredrik Mandenius and Mats Bjorkman.� 2011 John Wiley & Sons, Inc. Published 2011 by John Wiley & Sons, Inc.
1

Of the designed products we encounter daily, many have a biotechnology
origin although most people do not recognize them as being designed using
materials or methods derived from biotechnology. This could concern pro-
ducts such as fermented food and beverage, biological drugs, or diagnostic
tests used by the medical care unit in the aftermath of flue.
These biotechnology products are examples of design that includes a wide
range of considerations, of course, not only frombiology but also fromphysics
and chemistry.
All modern design is, with few exceptions, based on scientific laws and
principles. Previous experiences are almost always considered when a new
product is designed. Sometimes, a product design can be based on a new
invention or a discovery. This is an aspect that is often present for biotechnical
products. Biotechnical innovations are, in comparison with many other fields,
often based on new inventions or scientific discoveries. This puts extra
demands and strains on the design process, as the design task is more complex
and complicated compared to the design of a new product that is based on an
existing product or range of products. In the latter case, there exist more
experience and knowledge of the utilized technology. Furthermore, the
scientific basis of the product is better known.
The design concept is not limited to physical artifacts or devices – design is
also required for manufacturing processes to produce the designed products
and services to support them. Biotechnology products are examples of that.
Design in industry has in recent years gone through a significant devel-
opment and vitalization in order to strengthen product development in aworld
of increasing global competition, higher demands from customers, and with
tighter regulations. One example of this development is the trend among the
producing companies of selling products not only as a single physical unit but
also in combination with a service related to the physical product [1].
Furthermore, this trend goes in the direction that the relative value of the
service part increases while the physical product part decreases. However, the
proportion between the value of the physical product and the service differs
verymuch between different product categories. Traditionally, the service part
has often been added to the physical product offer to the customers.
The trend has led to an outspoken industrial interest augmented by
significant research efforts on how to integrate the designwith a combination
of the physical product and its required service. This is often referred to as
Product Service Systems design [2]. This new approach means new chal-
lenges for the producing companies [3] such as designing their physical
products to fit Product Service Systems. In addition, the Product Service
Systems approach gives opportunity to close the material flows with product
remanufacturing in an economic and environmentally beneficial manner [4].
One of the large business incentives for the producing companies is that the
2 INTRODUCTION
customer relationship is improved that also increases the possibilities for
product remanufacturing within the product life cycle [5].
Another aspect of design that grows in importance is the sustainability of
the designed product. Sustainable design aims to design products that support
a sustainable development in society. In 1987, the World Commission on
Environment and Development (WCED) defined sustainable development as
“a development that meets the needs of the present without compromising the
ability of future generations to meet their own need” [6]. As a consequence,
sustainable design has three dimensions that must be addressed. The product
must be environmentally, economically, and socially sustainable.
The examples in this book address all these dimensions as biotechnology
products are intended to improve the health and well-being of people. The
sustainability aspect is explicitly not discussed, yet it has a strong impact
through economical use of biomechatronic products.
1.2 DEFINITION OF BIOMECHATRONIC PRODUCTS
We refer frequently in this book to mechatronics. A mechatronic product is
a product where the fields of mechanical, electronic, computer, control, and
systems design engineering are combined in order to design a useful
product [7,8]. Most of our more advanced consumer and business-to-
business products are mechatronic products comprised of combinations
of mechanical and electronic components [9]. We may think of a car as a
mechanical product. That was true for a Ford Model-T, but today a modern
car is a highly advanced mechatronic product where the value and cost of
the mechanical components are continuously decreasing in relation to the
electronic components and subsystems. Many of our “mechanical” con-
sumer products are in fact controlled by microcomputers/microprocessors.
A relatively inexpensive product such as the modern digital consumer
camera is based on highly advanced microchip technology for creation of a
digital image and the camera is controlled by advanced electronics and
microprocessors. Digital cameras are intended for a mass consumer market
and the advanced key components are mass-produced. The result is that
the development and manufacturing costs can be distributed over a vast
number of individual cameras decreasing the unit price of the cameras that,
in fact, are highly advanced mechatronic products. Cheap does not have to
imply simple anymore.
To combine and synthesize expertise from the fields of mechanical,
electronic, computer, control, and systems design engineering in a design
process in order to design a product is not an easy achievement. The major
task is to come up with an optimal combination of the different fields of
DEFINITION OF BIOMECHATRONIC PRODUCTS 3
engineering and technologies. This is accompanied with a huge risk for
suboptimizations.
A biomechatronic product, as this book focuses on, is a mechatronic
product with a substantial element of biotechnology added that shares all
these characteristics of the mechatronic product.
In order to emphasize this, we define the biomechatronic products in the
following way:
A product where biological and biochemical, technical, human, management
and goal, and information systems are combined and integrated in order to solve
a mission that fulfils a human need. A biomechatronic product includes a
biological, a mechanical, and an electronic part.
The generic biomechatronic definition used here pinpoints a unique feature
in design that a biological system in the product is an active part of the design
concept. By that, our definition of a biomechatronic product focuses on what
systems are included and constitute important parts of the product [10].
Common biomechatronic products include, for example, many products
used for production of food andmedicine, medical analysis equipment, and so
on. This book focuses on these types of biomechatronic products.
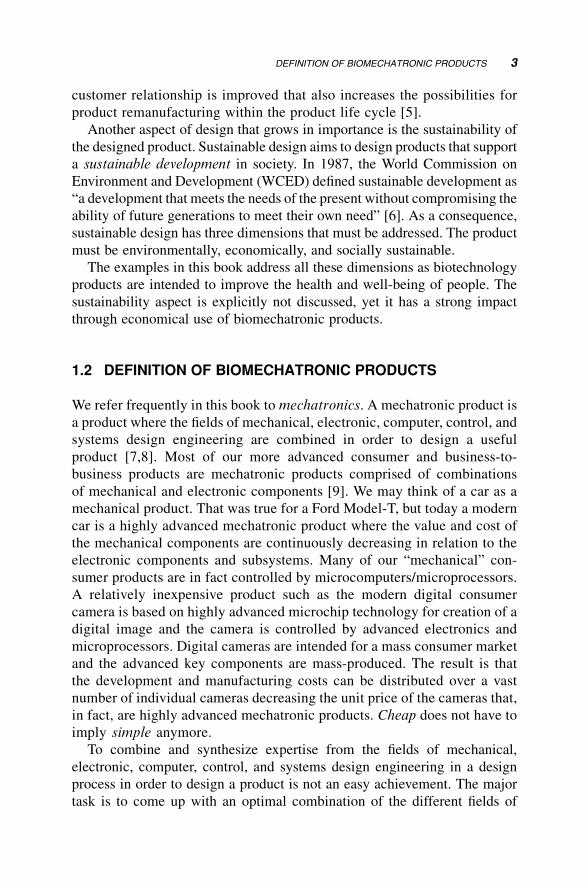
1.3 PRINCIPLES OF BIOMECHATRONICS
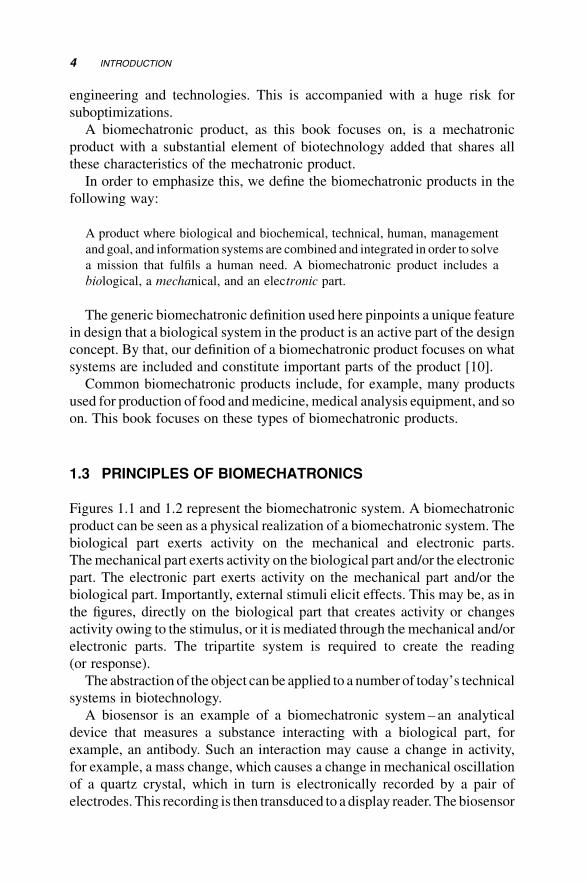
Figures 1.1 and 1.2 represent the biomechatronic system. A biomechatronic
product can be seen as a physical realization of a biomechatronic system. The
biological part exerts activity on the mechanical and electronic parts.
Themechanical part exerts activity on the biological part and/or the electronic
part. The electronic part exerts activity on the mechanical part and/or the
biological part. Importantly, external stimuli elicit effects. This may be, as in
the figures, directly on the biological part that creates activity or changes
activity owing to the stimulus, or it is mediated through the mechanical and/or
electronic parts. The tripartite system is required to create the reading
(or response).
The abstraction of the object can be applied to a number of today’s technical
systems in biotechnology.
A biosensor is an example of a biomechatronic system – an analytical
device that measures a substance interacting with a biological part, for
example, an antibody. Such an interaction may cause a change in activity,
for example, a mass change, which causes a change in mechanical oscillation
of a quartz crystal, which in turn is electronically recorded by a pair of
electrodes. This recording is then transduced to a display reader. The biosensor
4 INTRODUCTION
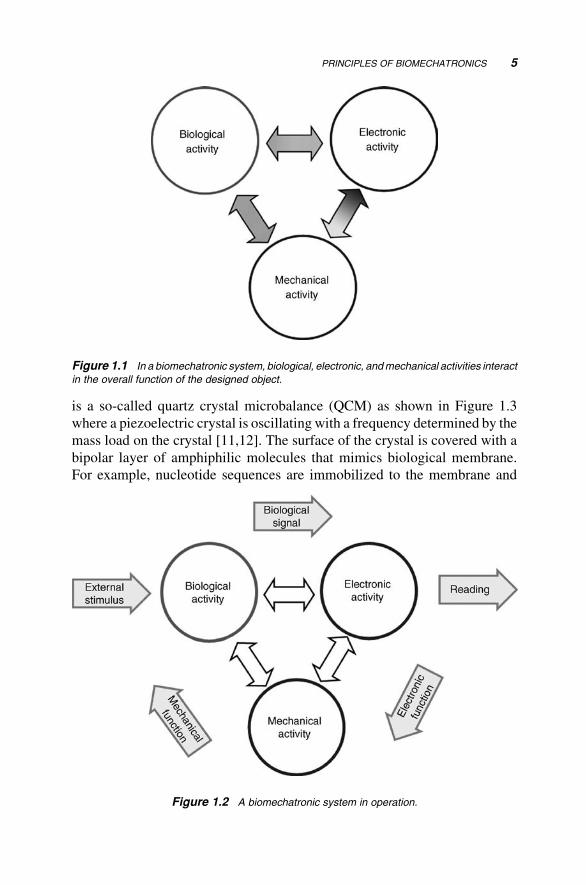
is a so-called quartz crystal microbalance (QCM) as shown in Figure 1.3
where a piezoelectric crystal is oscillating with a frequency determined by the
mass load on the crystal [11,12]. The surface of the crystal is covered with a
bipolar layer of amphiphilic molecules that mimics biological membrane.
For example, nucleotide sequences are immobilized to the membrane and
Figure 1.1 In a biomechatronic system, biological, electronic, andmechanical activities interact
in the overall function of the designed object.
Figure 1.2 A biomechatronic system in operation.
PRINCIPLES OF BIOMECHATRONICS 5
can bind, or hybridize, with complementary DNA sequences. Thus, the QCM
is a biomechatronic product since it exemplifies exactly what Figure 1.2
illustrates.
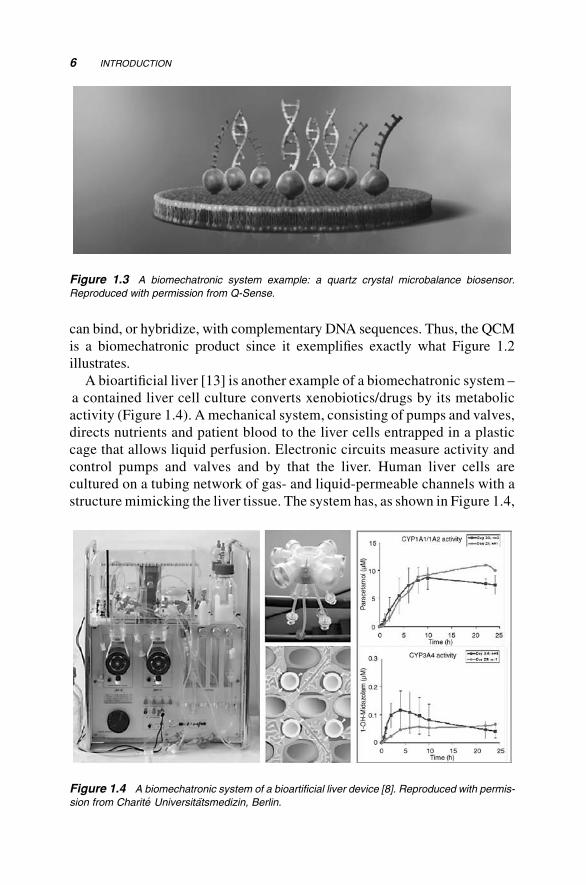
A bioartificial liver [13] is another example of a biomechatronic system –
a contained liver cell culture converts xenobiotics/drugs by its metabolic
activity (Figure 1.4). A mechanical system, consisting of pumps and valves,
directs nutrients and patient blood to the liver cells entrapped in a plastic
cage that allows liquid perfusion. Electronic circuits measure activity and
control pumps and valves and by that the liver. Human liver cells are
cultured on a tubing network of gas- and liquid-permeable channels with a
structure mimicking the liver tissue. The system has, as shown in Figure 1.4,
Figure 1.3 A biomechatronic system example: a quartz crystal microbalance biosensor.
Reproduced with permission from Q-Sense.
Figure 1.4 A biomechatronic system of a bioartificial liver device [8]. Reproduced with permis-
sion from Charit�e Universitatsmedizin, Berlin.
6 INTRODUCTION
a mechanical part consisting of pumps, valves, and plastic containers and an
electronic part consisting of sensors and actuators that interact with the
biological liver cells growing and metabolizing nutrients perfused through
the system. The tripartite system is fully interdependent and, by that, also
adheres to Figure 1.2.
1.4 BRIEF HISTORY OF THE DEVELOPMENTOF BIOMECHATRONIC PRODUCTS AND ENGINEERING
From a historical perspective, biomechanical products and systems have been
created in societies very early. The electronic part of biomechatronic products,
however, was developed first during the twentieth century after the technical
development of electricity at the end of the nineteenth century.
Biology and mechanics were merged already at least 4000 years BC [14].
Artifacts and excavations from ancient Mesopotamia and Egypt show
examples of breweries and wineries on an industrial scale. Recipes for
production have been interpreted from hieroglyph tables and cave paintings
show snapshots of equipment. This was actually a sort of early Standard
Operation Procedures (SOPs) [15]. During the ancient Roman period, fac-
tories were set up for industrial olive oil and vinegar manufacture with
hundreds of workers.
These historical examples are, in a wide sense, biomechanical inventions.
They brought in the grape culture at an industrial level and combined it with
technical mechanical devices. Of course, electronics was not applied at this
developmental stage.
Also in the field of practical medicine, the biology and mechanics were
integrated. In ancient Egypt, medicine reached sometimes a surprising high
technical level – in some respects, the medical treatments were technical
although the biological understanding was shallow.
Another early example of a sort of bioreactor is the beehive. The
biological component – the bee – carried out the transformation from nectar
to honey. The technical invention, the hive, nourished the bee swarm and
recovered the product.
Brewing and fermentation technologydeveloped slowly until the nineteenth
centurywhen Louis Pasteur finally was able to bring a scientific understanding
to biological transformation on a molecular and cellular level [14]. Early
twentieth-century microbiology refined this knowledge for new microbial
strains and products. Electricity became a way to transform energy in the
biological system that previously was limited to mechanical functions. Thus,
temperature control of a culture could be done and mixing devices could be
integrated into the first generation of bioreactors 100 years ago.
BRIEF HISTORY OF THE DEVELOPMENT OF BIOMECHATRONIC PRODUCTS 7
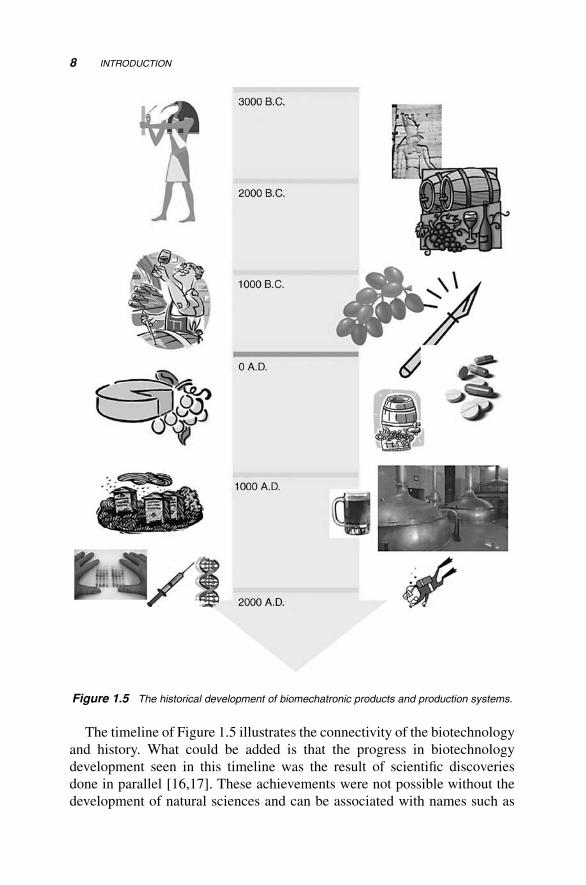
The timeline of Figure 1.5 illustrates the connectivity of the biotechnology
and history. What could be added is that the progress in biotechnology
development seen in this timeline was the result of scientific discoveries
done in parallel [16,17]. These achievements were not possible without the
development of natural sciences and can be associated with names such as
Figure 1.5 The historical development of biomechatronic products and production systems.
8 INTRODUCTION
Linnaeus, Jenner, Mendel, Leeuwenhoek, Darwin, Watson, and many
others [17–19].
Its seems very likely that the continuation of the time arrow of Figure 1.5
will in the near future be decorated with numerous new inventions and follow-
up products extruding into themicro- and nanoscaleworld of biotechnology. If
this development is augmented by systematic design approaches, the new
biotechnology products have a better potential to gain high quality at an earlier
stage of development.
1.5 AIM OF THIS BOOK
The overall aim of this book is to support the task of designing biomechatronic
products. It is very complex to design mechatronic products and the task is
further increased in complexity when the biotechnological element is added
in the form of biological activities and systems. This is illustrated by the
bioartificial liver above. The focus in the book is on how to integrate and
handle this biotechnological element in the integrated design process for the
design of biomechatronic products and systems.
We try to fulfill the aim by several means. As the major enablingmeans, we
propose and present a generic methodology for systematic design of biome-
chatronic products. This biomechatronic design methodology includes a
number of design tools for supporting the work in the different stages or
parts of the methodology. This is mainly done in Chapter 4, which can be seen
as the central chapter of this book.
The presented methodology and design tools are all based on existing and
well-established methodologies and design tools from the field of mechanical
engineering. These are presented mainly in Chapters 2 and 4. The method-
ologies and tools are further developed and adapted to include the biotech-
nological elements of biomechatronic design. Biotechnology in mechatronic
design is treated mainly in Chapters 3 and 4.
One important aspect of the presented biomechatronic designmethodology
is that it gives the means for supporting the communication between experts
in the different fields of engineering that are involved in the design. Many
suboptimizations in designs are the result of misunderstandings in the
communications.
The presented methodology and design tools are applied to a number of
biomechatronic products and/or systems. This is covered in Chapters 5–13.
These applications give an insight and understanding of how themethodology
could be applied and used.
The applications in Chapters 5–13 also give comprehensive descriptions of
many different types of modern biomechatronic products and systems. These
AIM OF THIS BOOK 9
descriptions can be of great interest, especially for readers unfamiliar with
biotechnology products, regardless of the applications of the biomechatronic
methodology.
It is possible for the reader to focus on the chapters that describe biome-
chatronic products and systems of special interest for the reader. However,
we strongly advise the reader to also read the other chapters, as all applications
are not implemented in the same manner. The different applications act as
examples of how it is possible to apply and utilize the presented methodology
and design tools in different ways. There is not just one way of using them.
This is clearly illustrated in the different application chapters.
REFERENCES
1. Lifset, R. (2000) Moving from products to services. J. Ind. Ecol. 4, 1–2.
2. Sundin, E., Lindahl, M., Ijomah, W. (2009) Product design for product/service
systems: design experiences from Swedish industry. J. Manuf. Technol. Manage.
20, 723–753.
3. Sundin, E., €Olundh Sandstr€om, G., Lindahl, M., €Ohrwall R€onnb€ack, A.,
Sakao, T., Larsson, T. (2009) Challenges for industrial product/service
systems: experiences from a learning network of large companies. In:
Proceedings of CIRP Industrial Product/Service Systems (IPS2), Cranfield,
UK, April 1–2 pp. 298–304.
4. Sundin, E., Bras, B. (2005) Making functional sales environmentally and
economically beneficial through product remanufacturing. J. Cleaner Prod.
13, 913–925.
5. €Ostlin, J., Sundin, E., Bj€orkman, M. (2009) Product life-cycle implications for
remanufacturing strategies. J. Cleaner Prod. 17, 999–1009.
6. United Nations (1987) Report of the World Commission on Environment and
Development. General Assembly Resolution 42/187, December 11.
7. Bradley, D.A., Loader, A.J., Burd, N.C., Dawson, D. (1991) Mechatronics:
Electronics in Products and Processes. Chapman & Hall, London.
8. Karnopp, D.C., Margolis, D.L., Rosenberg, R.C. (2006) System Dynamics:
Modeling and Simulation of Mechatronic Systems, 4th edition. Wiley.
9. Cetinkunt, S. (2007) Mechatronics. Wiley.
10. Derel€ov, M., Detterfelt, J., Bj€orkman, M., Mandenius, C.F. (2008) Engineering
designmethodology for bio-mechatronic products.Biotechnol.Prog.24, 232–244.
11. Ngeh-Ngwainbi, J., Suleiman, A.A., Guilbault, G.G. (1990) Piezoelectric crystal
biosensors. Biosens. Bioelectron. 5, 13–26.
12. Fung. Y.S., Wong, Y.Y. (2001) Self-assembled monolayers as the coating in a
quartz piezoelectric crystal immunosensor to detect Salmonella in aqueous
solution. Anal. Chem. 73, 5302–5309.
10 INTRODUCTION
13. Gerlach, J.C., L€ubberstedt, M., Edsbagge, J., Ring, A., Hout, M., Baun, M.,
Rossberg, I., Kn€ospel, F., Peters, G., Eckert, K.,Wulf-Goldenberg, A., Bj€orquist,P., Stachelscheid, H., Urbaniak, T., Schatten, G., Miki, T., Schmelzer, E.,
Zeilinger, K. (2010) Interwoven four-compartment capillary membrane tech-
nology for three-dimensional perfusion with decentralized mass exchange to
scale up embryonic stem cell culture. Cells Tissues Organs 192, 39–49.
14. Bud, R. (1993) The Uses of Life: A History of Biotechnology. Cambridge
University Press.
15. Gaudilli�ere, J.P. (2009) New wine in old bottles? The biotechnology problem in
the history ofmolecular biology. Stud. Hist. Philos. Biol. Biomed. Sci. 40, 20–28.
16. Mason, S.F. (1962) A History of the Sciences. MacMillan, New York.
17. Prigogine, I., Stengers, I. (1984)Order Out of Chaos. Bantam Books, NewYork.
18. Schneer, C.J. (1960) The Search of Order. Harper and Brothers, New York.
19. Watson, J.D. (1968) The Double Helix: A Personal Account of the Discovery of
the Structure of DNA. Atheneum, New York.
REFERENCES 11


Part IFundamentals

2Conceptual Design Theory
This chapter summarizes fundamental principles of mechatronic design with
the mechanical engineering perspective. We present here the concepts in
mechatronics upon which are based the biotechnology applications discussed
in this book. The chapter does not bring up biotechnology aspects per se – this
will be saved for the following chapters.
2.1 SYSTEMATIC DESIGN
2.1.1 Design for Products
“The main task of engineers is to apply their scientific and engineering
knowledge to the solution of technical problems, and then to optimize those
solutions within the requirements and constraints set by materials, techno-
logical, economic, legal, environmental and human-related considerations,”
say Gerald Pahl and Wolfgang Beitz [1], two German researchers who have
made significant impact on research, teaching, and training in mechanical
design engineering for several decades.
Biomechatronic Design in Biotechnology: A Methodology for Development ofBiotechnological Products, First Edition. Carl-Fredrik Mandenius and Mats Bj€orkman.� 2011 John Wiley & Sons, Inc. Published 2011 by John Wiley & Sons, Inc.
15
However, the scope of design is not restricted to mechanical engineering, it
applies to all engineering sciences and its basic principles are as much
applicable to engineering design problems and solutions in electronics,
physics, information technology, chemical technology, and biotechnology,
for example.
Technical problems become concrete engineering tasks after their clarifi-
cation and definition that engineers have to solve to create new technical
products. These products may vary widely: mechanical products, electric
devices, power plants, chemical processes, software programs, and so on.
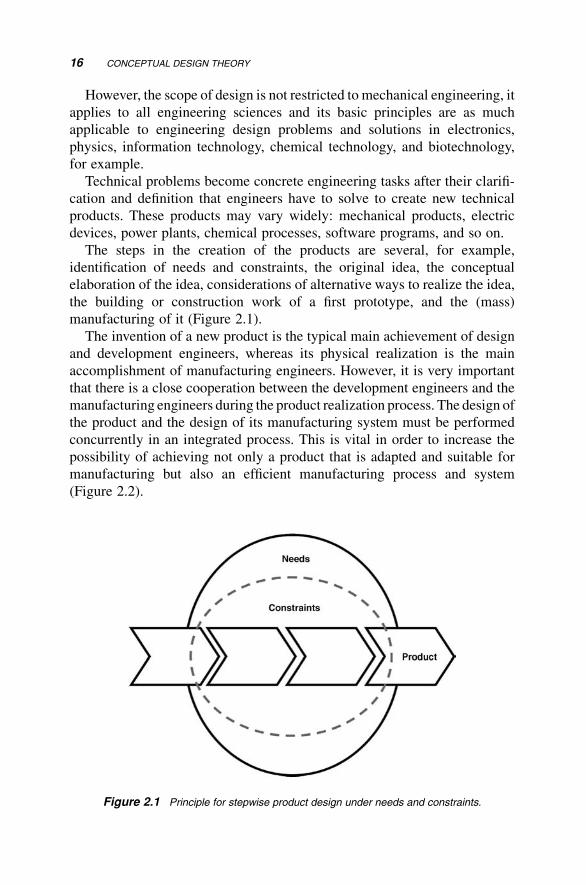
The steps in the creation of the products are several, for example,
identification of needs and constraints, the original idea, the conceptual
elaboration of the idea, considerations of alternative ways to realize the idea,
the building or construction work of a first prototype, and the (mass)
manufacturing of it (Figure 2.1).
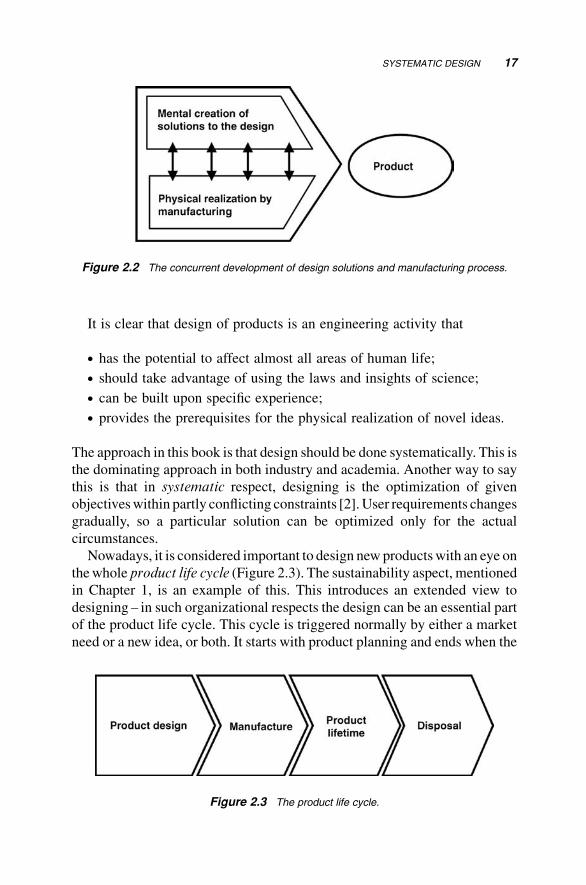
The invention of a new product is the typical main achievement of design
and development engineers, whereas its physical realization is the main
accomplishment of manufacturing engineers. However, it is very important
that there is a close cooperation between the development engineers and the
manufacturing engineers during the product realization process. The design of
the product and the design of its manufacturing system must be performed
concurrently in an integrated process. This is vital in order to increase the
possibility of achieving not only a product that is adapted and suitable for
manufacturing but also an efficient manufacturing process and system
(Figure 2.2).
Figure 2.1 Principle for stepwise product design under needs and constraints.
16 CONCEPTUAL DESIGN THEORY
It is clear that design of products is an engineering activity that
. has the potential to affect almost all areas of human life;
. should take advantage of using the laws and insights of science;
. can be built upon specific experience;
. provides the prerequisites for the physical realization of novel ideas.
The approach in this book is that design should be done systematically. This is
the dominating approach in both industry and academia. Another way to say
this is that in systematic respect, designing is the optimization of given
objectiveswithin partly conflicting constraints [2].User requirements changes
gradually, so a particular solution can be optimized only for the actual
circumstances.
Nowadays, it is considered important to design new productswith an eye on
thewhole product life cycle (Figure 2.3). The sustainability aspect, mentioned
in Chapter 1, is an example of this. This introduces an extended view to
designing – in such organizational respects the design can be an essential part
of the product life cycle. This cycle is triggered normally by either a market
need or a new idea, or both. It starts with product planning and ends when the
Figure 2.2 The concurrent development of design solutions and manufacturing process.
Figure 2.3 The product life cycle.
SYSTEMATIC DESIGN 17
product’s useful life is over, with recycling/remanufacturing or environmen-
tally safe disposal.
2.1.2 Origin of the Design Tasks
It is common that systematic design projects, related to (mass) production or
batch production, are initiated by a product planning team after carrying
out a thorough analysis of the market needs. A number of issues are essential
to consider:
. The Novelty of the Product: Does a similar product already exist?
Biotechnology has in this respect been favored for entering a virgin
market areawithmany opportunities. The productmay be based on a new
scientific discovery. This is not uncommon for the biomechatronic
products. The novelty aspect has therefore often been easy to accomplish.
With a maturing biotechnology market segment, this has become more
difficult.
. The Production Cost: It must be realistic andwithin the tolerance limit of
the market.
. The Complexity of the Product: The design applications in coming
chapters address the complexity of biomechatronic design. However,
biomechatronic products are not the sole complex product type – large-scale
mechanical systems or mechatronic products can often be very complex
products themselves before merging with the biotechnical dimension.
. Realistic Goals: Goals must be realistic and must not cross the limits of
aspirations. This is both a restriction and a challenge for the creativity and
imagination of the design team. Some of the products we will discuss
approach this limit, such as artificial organs, stem cells, and biological
microchips.
The essential considerations above create a number of working tasks and
activities for the design team that should be approached systematically. But
first, let us bring up a fewhistorically establisheddesign issues that have driven
design achievements over the past years and shaped the way we apply design
today.
2.1.3 Development of Design Thinking
From a recent historical perspective, it is possible to mention a few steps of
particular importance for the ascent of design thinking.
An important theoretical contribution was the identification of governing
scientific principles and economical constraints that conduct systematic
18 CONCEPTUAL DESIGN THEORY
design behavior [3]. Concerning the form of the design, these principles are
related to (1) minimizing production cost in order to improve the compet-
itive edge of the design solution, (2) minimum space, which is close to the
former, where it is assumed that the smallest product that can fill the same
need is the most attractive solution, (3) minimum weight, another criterion
that strengthens the product is that it is reasonably inexpensive, (4)minimum
losses in the production of the product, and (5) optimal handlingwhen using
the product.
In the design and optimization of individual parts and simple technical
artifacts of the product, these principles could and should be followed.
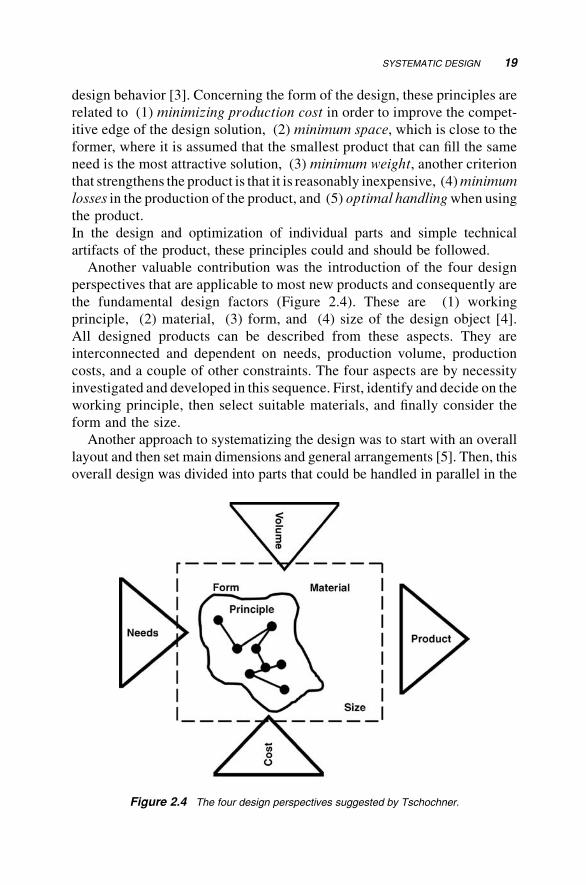
Another valuable contribution was the introduction of the four design
perspectives that are applicable to most new products and consequently are
the fundamental design factors (Figure 2.4). These are (1) working
principle, (2) material, (3) form, and (4) size of the design object [4].
All designed products can be described from these aspects. They are
interconnected and dependent on needs, production volume, production
costs, and a couple of other constraints. The four aspects are by necessity
investigated and developed in this sequence. First, identify and decide on the
working principle, then select suitable materials, and finally consider the
form and the size.
Another approach to systematizing the design was to start with an overall
layout and then set main dimensions and general arrangements [5]. Then, this
overall design was divided into parts that could be handled in parallel in the
Figure 2.4 The four design perspectives suggested by Tschochner.
SYSTEMATIC DESIGN 19
design work process. When doing this, the identified design tasks were
systematically varied and with this a number of alternatives could be
generated from which the optimal solution could be identified.
Later on, the design working process was divided into distinguishable
phases [6]. The first is the establishment of theworking principle based on an
idea or invention. The second is the embodiment of the idea where the form
is laid out and supported by calculations based on scientific rules and
knowledge. The third phase is the implementation of the first and second
phases. Although seemingly straightforward, these phases were and are
occasionally overruled resulting in unfavorable consequences.
An important step in the development of the existing systematic
design theory, now often referred to as the basic systems approach, was
taken in the 1960s [7]. This is based on a thorough and critical analysis
of the task (goals, specification, and overall function), followed by a
systematic search for solution elements and their combination into a working
principle. Subsequently, these combinations are analyzed critically in order to
identify shortcomings and find a remedy for alleviating these shortcomings,
and by that, present a new solution. This solution is further analyzed,
recombined, and optimized. The way to develop a new product has many
traits that are further developed in the biomechatronic approach we apply in
this book.
2.1.4 Recent Methods
No doubt, several of these early theoretical ascents have been integrated into
today’s design methodology.
A relatively novel approach that is particularly relevant to biological
problem formulation is the introduction of a reasoning based on flows, energy,
and signals [8]. Although originally it was concerned with characterizing
mechanical systems, it is particularly appropriate to apply on biological
systems.
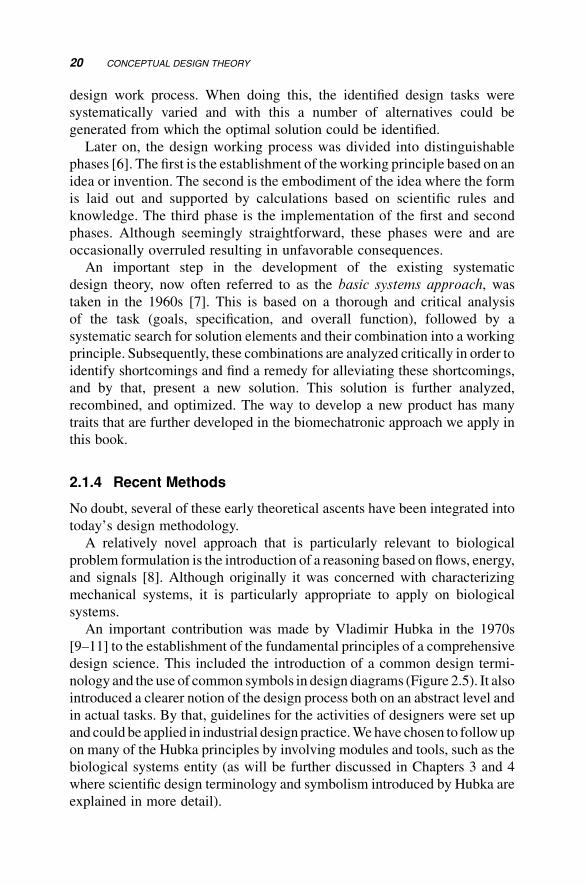
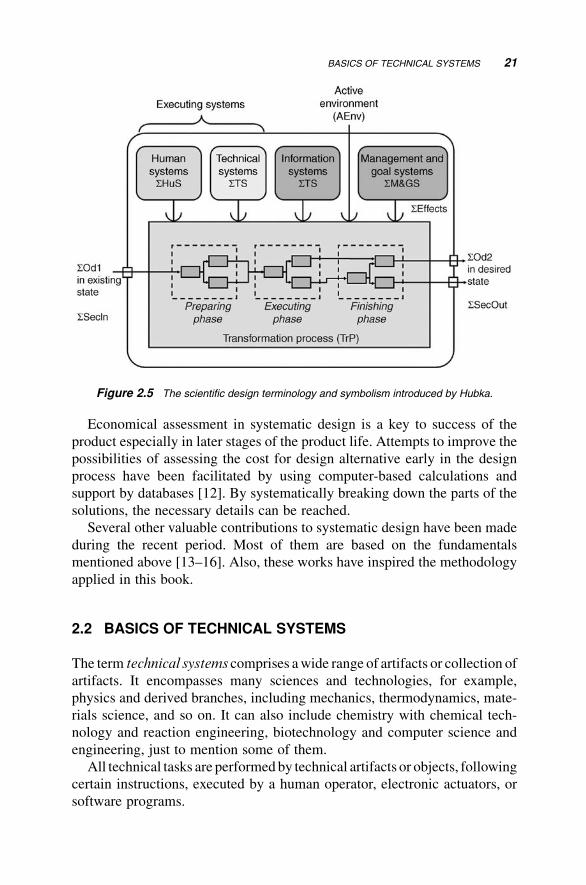
An important contribution was made by Vladimir Hubka in the 1970s
[9–11] to the establishment of the fundamental principles of a comprehensive
design science. This included the introduction of a common design termi-
nology and the use of common symbols in design diagrams (Figure 2.5). It also
introduced a clearer notion of the design process both on an abstract level and
in actual tasks. By that, guidelines for the activities of designers were set up
and could be applied in industrial design practice.We have chosen to followup
on many of the Hubka principles by involving modules and tools, such as the
biological systems entity (as will be further discussed in Chapters 3 and 4
where scientific design terminology and symbolism introduced by Hubka are
explained in more detail).
20 CONCEPTUAL DESIGN THEORY
Economical assessment in systematic design is a key to success of the
product especially in later stages of the product life. Attempts to improve the
possibilities of assessing the cost for design alternative early in the design
process have been facilitated by using computer-based calculations and
support by databases [12]. By systematically breaking down the parts of the
solutions, the necessary details can be reached.
Several other valuable contributions to systematic design have been made
during the recent period. Most of them are based on the fundamentals
mentioned above [13–16]. Also, these works have inspired the methodology
applied in this book.
2.2 BASICS OF TECHNICAL SYSTEMS
The term technical systems comprises awide range of artifacts or collection of
artifacts. It encompasses many sciences and technologies, for example,
physics and derived branches, including mechanics, thermodynamics, mate-
rials science, and so on. It can also include chemistry with chemical tech-
nology and reaction engineering, biotechnology and computer science and
engineering, just to mention some of them.
All technical tasks are performedby technical artifacts or objects, following
certain instructions, executed by a human operator, electronic actuators, or
software programs.
Figure 2.5 The scientific design terminology and symbolism introduced by Hubka.
BASICS OF TECHNICAL SYSTEMS 21
Aclassification of technical artifacts has been suggested byHubka [10]. This
is based on function, working means, complexity, production, product, and
other critical conditions. This type of classification is not always useful due to its
disparity and varying origin.More useful is often to apply system boundaries in
which the technical objects will exert their actions, based on inputs and outputs.
The form of these inputs and outputs is energy, material, or signals.
2.2.1 Energy, Material, and Signals and Their Conversion
In technical objects, energy is often manifested as mechanical, electrical,
optical, or chemical energy. Material is characterized by weight, color,
substance, and other conditions. Signals can in some sense be regarded as
information; it is an electrical analog signal, a digital signal, or a chemical
signal substance. Signals can also be complex sequences and arrays of signals,
such as messages, speech, and books.
Energy can be converted from one form to another in the technical system.
In a combustion engine, thermodynamic energy is converted to mechanical
energy; in a muscle fiber, biochemical energy is converted to mechanical
energy; and in a water power plant, hydrodynamic energy is converted to
electrical energy.
Materials can be converted as well. Metals can be melted and mixed to
produce alloys. Food nutrients can be converted to vital energy in a growing
body. Polymers can be shaped to desired forms with specific functions.
Signals can also be converted, or as more commonly said, be transmitted,
displayed, recorded, and received. This conversion occurs, for example, in a
biological cell in the brain and in the eye when reading a message, in an
electrical circuit in a computer, and so on.
Important for design work is that energy takes the form of mechanical,
thermal, electrical, chemical, optical, nuclear, force, heat, current, and
biological energy.
Materials appear in the form of gas, liquid, and solid dust, and also as raw
materials, as test sample, and as workpieces. Furthermore, materials also
appear as end products and components.
Signals are in design work accompanied with characteristic features, such
as signal magnitude, display, control impulse, data, or information. Conver-
sion of energy, material, and signals can normally be related to quantity and
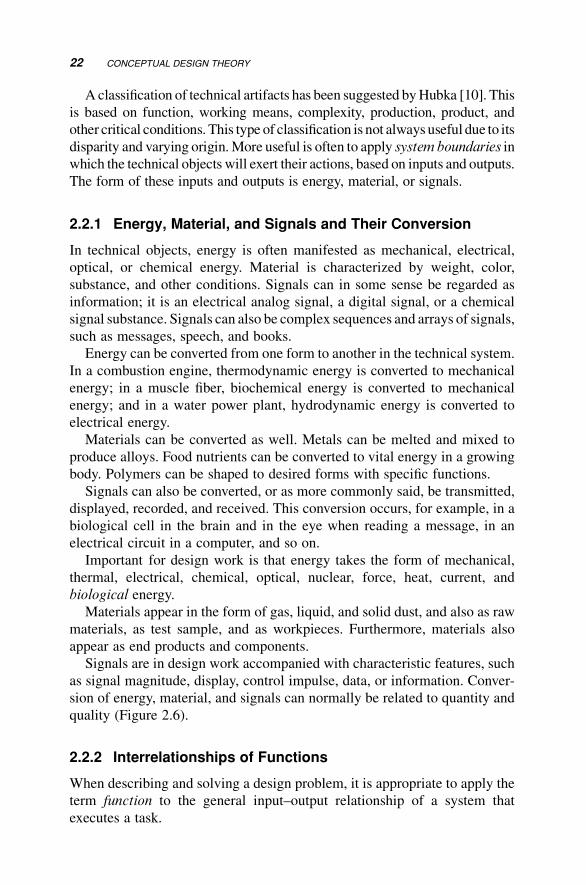
quality (Figure 2.6).
2.2.2 Interrelationships of Functions
When describing and solving a design problem, it is appropriate to apply the
term function to the general input–output relationship of a system that
executes a task.
22 CONCEPTUAL DESIGN THEORY
This has the advantage of providing a system description with a clear and
easily reproduced relationship between these inputs and outputs. Applying
this will be very helpful for solving a technical problem.
Once the overall task is well defined, which should be made clear from the
inputs and outputs, the overall function of the system can be described.
The overall function can be divided into subfunctions that also have defined
subtasks.
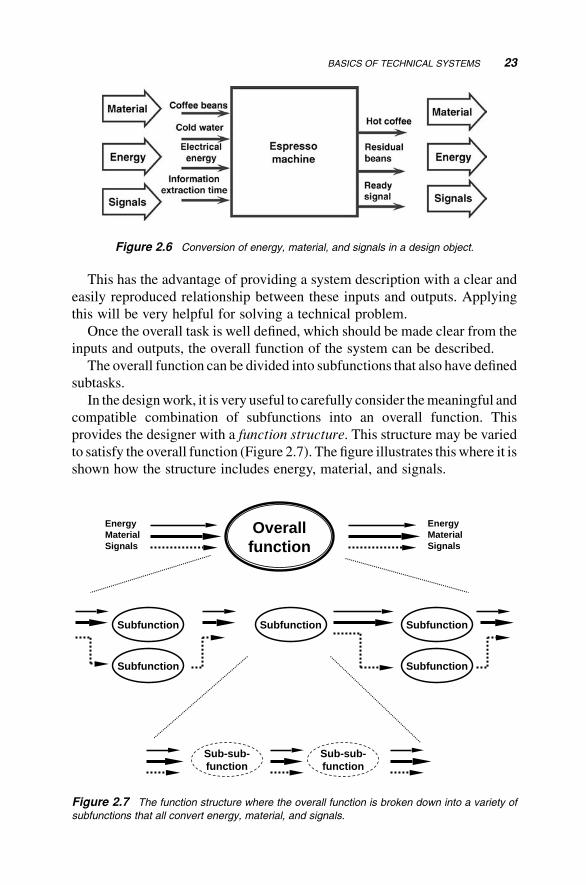
In the designwork, it is very useful to carefully consider themeaningful and
compatible combination of subfunctions into an overall function. This
provides the designer with a function structure. This structure may be varied
to satisfy the overall function (Figure 2.7). The figure illustrates thiswhere it is
shown how the structure includes energy, material, and signals.
Figure 2.6 Conversion of energy, material, and signals in a design object.
Overallfunction
EnergyMaterialSignals
Subfunction Subfunction Subfunction
Subfunction
Sub-sub-function
Sub-sub-function
EnergyMaterialSignals
Subfunction
Figure 2.7 The function structure where the overall function is broken down into a variety of
subfunctions that all convert energy, material, and signals.
BASICS OF TECHNICAL SYSTEMS 23
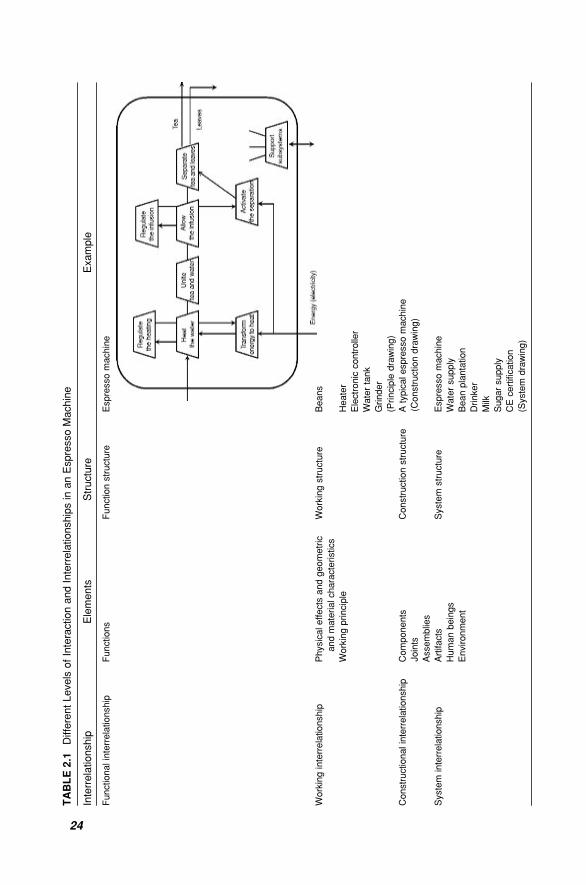
TABLE2.1
DifferentLevels
ofInteractionandInterrelationshipsin
anEsp
ressoMachine
Interrelationship
Elements
Structure
Exa
mple
Functionalinterrelationship
Functions
Functionstructure
Espressomachine
Workinginterrelationship
Physicaleffects
andgeometric
andmaterialcharacteristics
Workingstructure
Beans
Workingprinciple
Heater
Electronic
controller
Watertank
Grinder
(Principle
drawing)
Constructionalinterrelationship
Components
Joints
Constructionstructure
Atypicalespressomachine
(Constructiondrawing)
Assemblies
System
interrelationship
Artifacts
System
structure
Espressomachine
Humanbeings
Watersupply
Environment
Beanplantation
Drinker
Milk
Sugarsupply
CEcertification
(System
drawing)
24
2.2.3 Interrelationship of Constructions
A concretization of the function structure leads to a construction structure.
By this, the subfunctions are embodied by physical, chemical, or biological
processes. A majority of subfunctions are of mechanical or electrical/
electronic engineering nature for most products. Thus, objects where
mechanical and electrical parts are the main design issues dominate over the
others. So far, biological processes are almost absent in the theoretical design
literature.
What is well studied and described is the physical process. This is realized
by physical effects occurring under certain geometrical and material condi-
tions. This results in a working interrelationship that fulfils the function
necessary for performing the task.
A further concretization of theworking interrelationship paves theway for a
construction structure of the design. For this interrelationship, the modules,
assemblies, and machines with their connections deliver a more concrete
technical system.
2.2.4 Interrelationship of Systems
Since the technical system normally is a part of a large technical product
context, a design cannot be successful without considering this higher level.
This will include human beings, laws of the society, and the surrounding
physical environment. In systematic design, this level is referred to as the
system interrelationship. It is especially useful for studying effects from the
interacting environment, humans, unpredictable effects, external information,
and so on. Table 2.1 shows the levels of interactions we have discussed
illustrated with an example from mechatronic engineering – an espresso
machine. In fact, this also has a biological component in its input material.
2.3 PSYCHOLOGY IN THE SYSTEMATIC APPROACH
The systematic design approach has its roots in the human psychology and our
inherited way of thinking.
Often, we form our thinking along the relationship of concretewith abstract
descriptions. Theway tomove our ideas from one concrete solution to another
concrete solution goes over a state of abstraction.
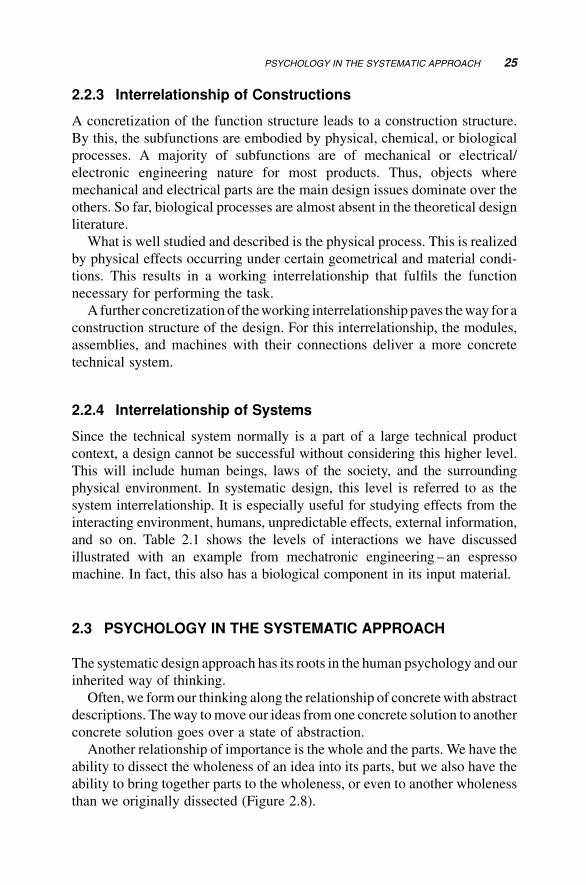
Another relationship of importance is the whole and the parts. We have the
ability to dissect the wholeness of an idea into its parts, but we also have the
ability to bring together parts to the wholeness, or even to another wholeness
than we originally dissected (Figure 2.8).
PSYCHOLOGY IN THE SYSTEMATIC APPROACH 25
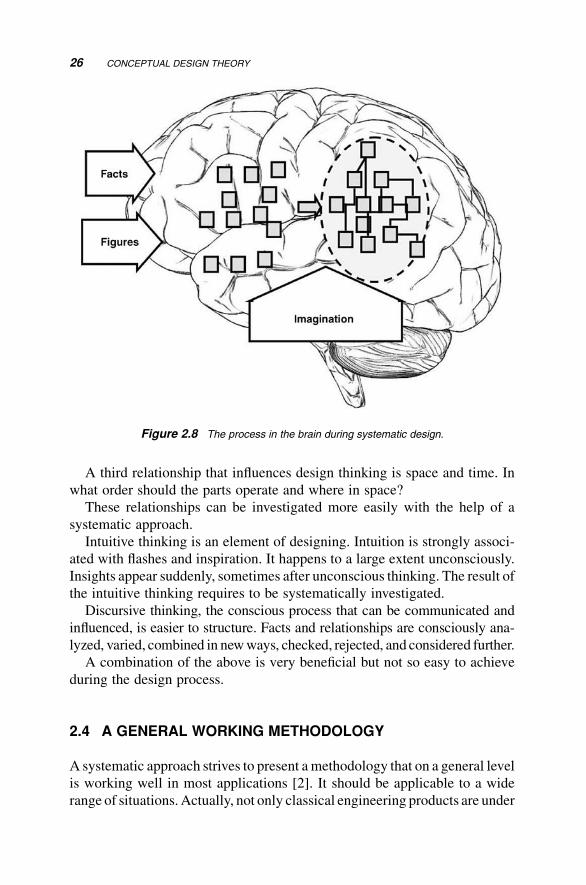
A third relationship that influences design thinking is space and time. In
what order should the parts operate and where in space?
These relationships can be investigated more easily with the help of a
systematic approach.
Intuitive thinking is an element of designing. Intuition is strongly associ-
ated with flashes and inspiration. It happens to a large extent unconsciously.
Insights appear suddenly, sometimes after unconscious thinking. The result of
the intuitive thinking requires to be systematically investigated.
Discursive thinking, the conscious process that can be communicated and
influenced, is easier to structure. Facts and relationships are consciously ana-
lyzed, varied, combined in newways, checked, rejected, and considered further.
A combination of the above is very beneficial but not so easy to achieve
during the design process.
2.4 A GENERAL WORKING METHODOLOGY
A systematic approach strives to present amethodology that on a general level
is working well in most applications [2]. It should be applicable to a wide
range of situations. Actually, not only classical engineering products are under
Figure 2.8 The process in the brain during systematic design.
26 CONCEPTUAL DESIGN THEORY
consideration but also services, organizational activities, company business
systems, and so on.
Is it possible towork using the same general approach formost applications
when carrying out the design work? The theory believes that. According to
Pahl and Beitz there are six preconditions that must be satisfied for all
systematic approaches [1]:
1. Formulating the overall goal and subgoals for the system. The goals
become the driver for the work.
2. Clarifying boundary conditions for the work from initial constraints.
3. Dispelling prejudice that risk to limit the possibility to see new solutions
and others cause illogical setbacks.
4. Searching variants to the first solution so that there is a multitude of
choices to select from and to compare.
5. Evaluating the variants from the previous step thoroughly versus the goal.
6. Making decisions about the evaluated variants based on the goal
compliance.
This is not so easy to carry out as the short list may imply. A number of
additional criteria and conditions should be met.
As mentioned in Section 2.3, intuition in combination with discursive
thinking is a potential resource of new ideas. The limitation is here that intuitive
ideas are not possible to generate by organizing actions, it is time independent
and requires individual talents. Furthermore, it is difficult to train this ability.
One should also actively try tominimize errors in the design [2]. This could
be done by
. careful definition of the requirements and constraints of a task;
. not persisting on intuitive solutions without a combination of discursive
evaluation;
. avoiding standard or fixed ideas;
. avoiding going for the easiest solution available at the moment.
Othermeansarealsouseful,forexample,allowingnewideastomature,havinga
clear and realistic timeplanning for thework, andsystematicallyworkingalong
the relationships of abstraction–concretism, time–space, and whole–parts.
2.4.1 Analysis for Resolving Technical Problems
Analysis is a powerful tool for resolving complex tasks. Problem analysis is
the identification of the essential bottlenecks for a successful solution.
A GENERAL WORKING METHODOLOGY 27
Structure analysis is the action of bringing order and logical connections
into the complex of problems associated with a task. It usually results in a
hierarchical structure of the problems. This may better reveal how they are
related and how solutions can be found from other systems.
It is also helpful to applyweak spot analysis of the system:Wheremay it fail
and why? Could the weak spots be ranked in terms of severity? And could a
remedy be anticipated?
2.4.2 Abstraction of Interrelationships of Systems
Another means is to apply the principle of abstraction on the system. This
tends to reduce the complexity and to generalize the problems. Abstraction
means that the problems are placed on a generalized abstract level. It simplifies
to see parallel solutions from other systems that share the same level of
abstraction. This may stimulate creativity and systematic thinking and reduce
the risk of going for an easy concrete solution too soon.
2.4.3 Synthesis of the Technical System
By synthesis in designingwemean assembling of the parts that shall create the
system.Normally, it is possible to generate by synthesis a number of solutions.
A systematic variation is here of value. However, the risk is that too many
permutations result. Some are obviously redundant and unrealistic. For the
trained engineers, this can be considered trivial. On the other hand, a risk of
introducing prejudices exists in the sorting process.
2.5 CONCEPTUAL DESIGN
The term conceptual design refers to the identification of the essential design
problems by applying abstraction, function structures, andworking principles
and their combination into a system. Conceptual design is by that a way to
generalize the design problem. It creates a principle for its solution.
The initiating event is a decision that something is going to be designed.
From that decision certain questions must be asked. These are as follows:
. Is the design task clear enough?
. Should more information be gathered?
. Is the goal tangible with existing resources?
. Is it needed or does it actually already exist?
. How should the design be done systematically?
28 CONCEPTUAL DESIGN THEORY
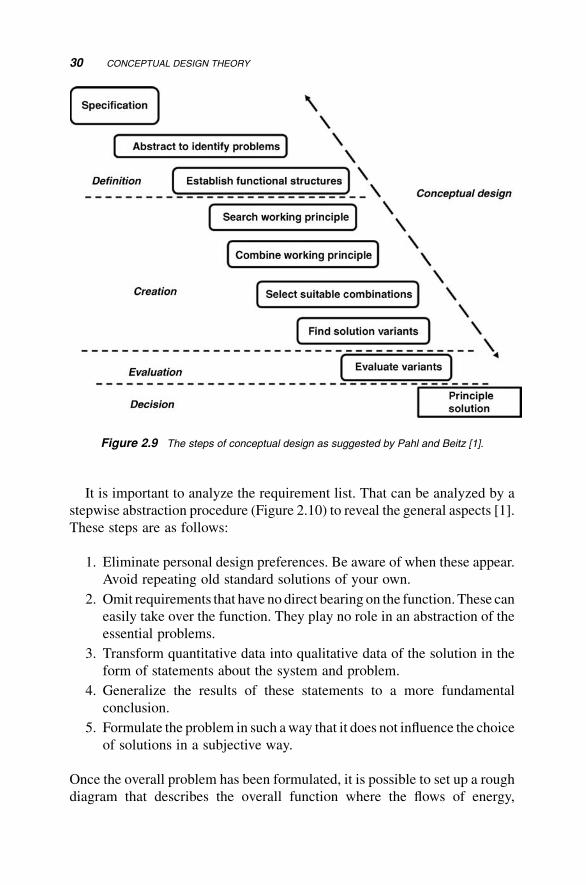
Conceptual design can be divided into nine steps after the task has
been defined until the conceptual solution is ready [1]. The steps are the
following:
1. Specification: A specification is established for the design task. This is
mainly based on needs of the potential users and customers.
2. Abstraction in Order to Identify Essential Problems: The specification
is brought to an abstract level in order to simplify the identification of
the most essential design problems to be solved during the conceptual
design.
3. Establishing Function Structures: The overall function structure is
established and the subfunctions within the overall functions are iden-
tified and established.
4. Searching Working Principles to Fulfill Subfunctions: The possible
working principles for the subfunctions are considered. A selection of
these is identified.
5. Combining Working Principles into Working Structures: The
possible working principles are considered and a working structure is
set up.
6. Selecting Suitable Combinations: By using selection tools the possible
combinations are investigated, assessed, and ranked.
7. Generating Principle Solution Variants: Find new variants of solutions
that are different from the first. Use the experience of the previous steps.
8. Evaluating Variants Against Technical and Economical Criteria: Take
all variants into consideration and assess their strengths toward each
other.
9. Principle Solution (Concept) Presented: The variant with the best
ranking is taken as the principle solution.
The steps and their role in the process are shown in Figure 2.9.
2.6 ABSTRACTION IN ORDER TO IDENTIFY ESSENTIALPROBLEMS
As mentioned, abstraction is a powerful way to create new solutions. It
intends to enforce new conceptual ideas and to negate those that rely too
much on traditional solutions and methods. New ideas should solve an
essential existing problem. A key issue is to identify the existence of the
essential problems. The most essential problems are often not the most
obvious ones.
ABSTRACTION IN ORDER TO IDENTIFY ESSENTIAL PROBLEMS 29
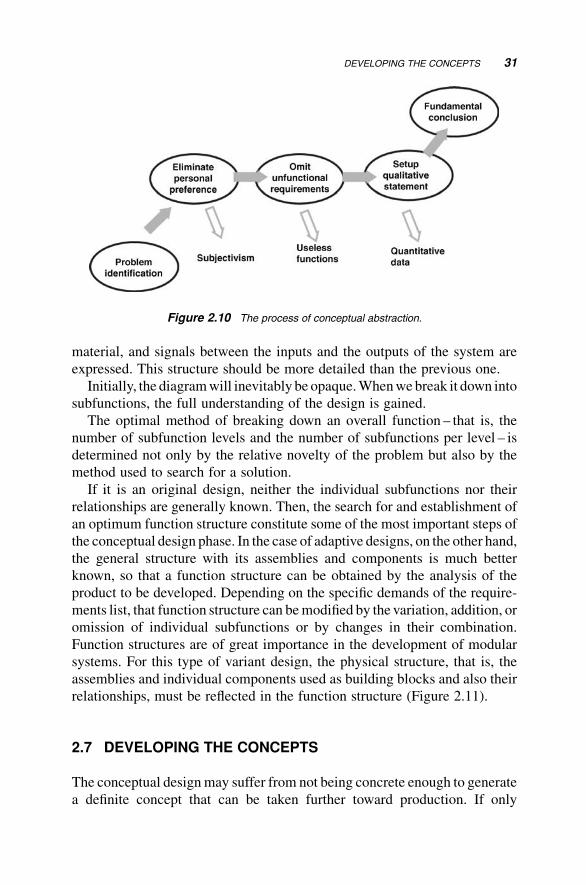
It is important to analyze the requirement list. That can be analyzed by a
stepwise abstraction procedure (Figure 2.10) to reveal the general aspects [1].
These steps are as follows:
1. Eliminate personal design preferences. Be aware of when these appear.
Avoid repeating old standard solutions of your own.
2. Omit requirements that have no direct bearing on the function. These can
easily take over the function. They play no role in an abstraction of the
essential problems.
3. Transform quantitative data into qualitative data of the solution in the
form of statements about the system and problem.
4. Generalize the results of these statements to a more fundamental
conclusion.
5. Formulate the problem in such away that it does not influence the choice
of solutions in a subjective way.
Once the overall problem has been formulated, it is possible to set up a rough
diagram that describes the overall function where the flows of energy,
Figure 2.9 The steps of conceptual design as suggested by Pahl and Beitz [1].
30 CONCEPTUAL DESIGN THEORY
material, and signals between the inputs and the outputs of the system are
expressed. This structure should be more detailed than the previous one.
Initially, the diagramwill inevitably be opaque.Whenwebreak it down into
subfunctions, the full understanding of the design is gained.
The optimal method of breaking down an overall function – that is, the
number of subfunction levels and the number of subfunctions per level – is
determined not only by the relative novelty of the problem but also by the
method used to search for a solution.
If it is an original design, neither the individual subfunctions nor their
relationships are generally known. Then, the search for and establishment of
an optimum function structure constitute some of the most important steps of
the conceptual design phase. In the case of adaptive designs, on the other hand,
the general structure with its assemblies and components is much better
known, so that a function structure can be obtained by the analysis of the
product to be developed. Depending on the specific demands of the require-
ments list, that function structure can bemodified by the variation, addition, or
omission of individual subfunctions or by changes in their combination.
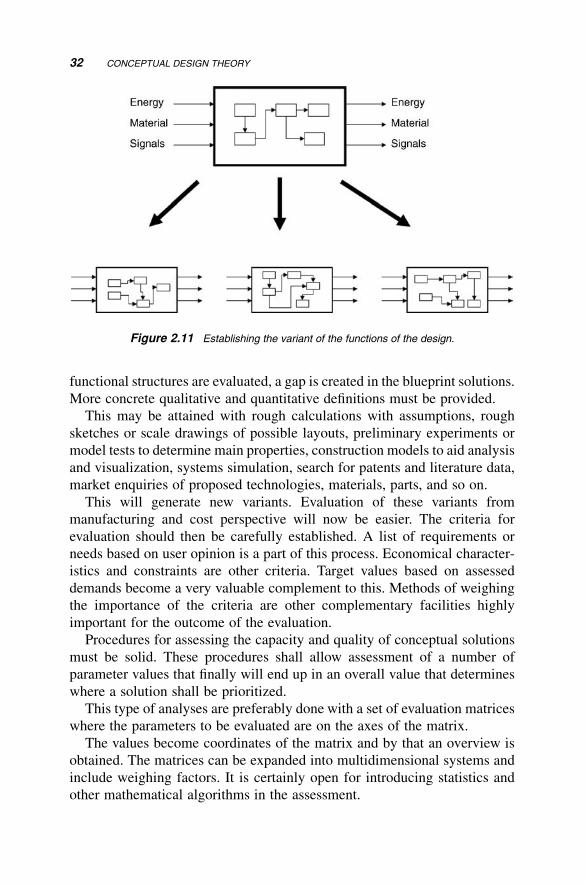
Function structures are of great importance in the development of modular
systems. For this type of variant design, the physical structure, that is, the
assemblies and individual components used as building blocks and also their
relationships, must be reflected in the function structure (Figure 2.11).
2.7 DEVELOPING THE CONCEPTS
The conceptual designmay suffer from not being concrete enough to generate
a definite concept that can be taken further toward production. If only
Figure 2.10 The process of conceptual abstraction.
DEVELOPING THE CONCEPTS 31
functional structures are evaluated, a gap is created in the blueprint solutions.
More concrete qualitative and quantitative definitions must be provided.
This may be attained with rough calculations with assumptions, rough
sketches or scale drawings of possible layouts, preliminary experiments or
model tests to determine main properties, construction models to aid analysis
and visualization, systems simulation, search for patents and literature data,
market enquiries of proposed technologies, materials, parts, and so on.
This will generate new variants. Evaluation of these variants from
manufacturing and cost perspective will now be easier. The criteria for
evaluation should then be carefully established. A list of requirements or
needs based on user opinion is a part of this process. Economical character-
istics and constraints are other criteria. Target values based on assessed
demands become a very valuable complement to this. Methods of weighing
the importance of the criteria are other complementary facilities highly
important for the outcome of the evaluation.
Procedures for assessing the capacity and quality of conceptual solutions
must be solid. These procedures shall allow assessment of a number of
parameter values that finally will end up in an overall value that determines
where a solution shall be prioritized.
This type of analyses are preferably done with a set of evaluation matrices
where the parameters to be evaluated are on the axes of the matrix.
The values become coordinates of the matrix and by that an overview is
obtained. The matrices can be expanded into multidimensional systems and
include weighing factors. It is certainly open for introducing statistics and
other mathematical algorithms in the assessment.
Figure 2.11 Establishing the variant of the functions of the design.
32 CONCEPTUAL DESIGN THEORY
Still, data in and tuning of weights decide the outcome. Thus, proper
experiments, enquiries, model evaluations, and so on are crucial for these
tools.
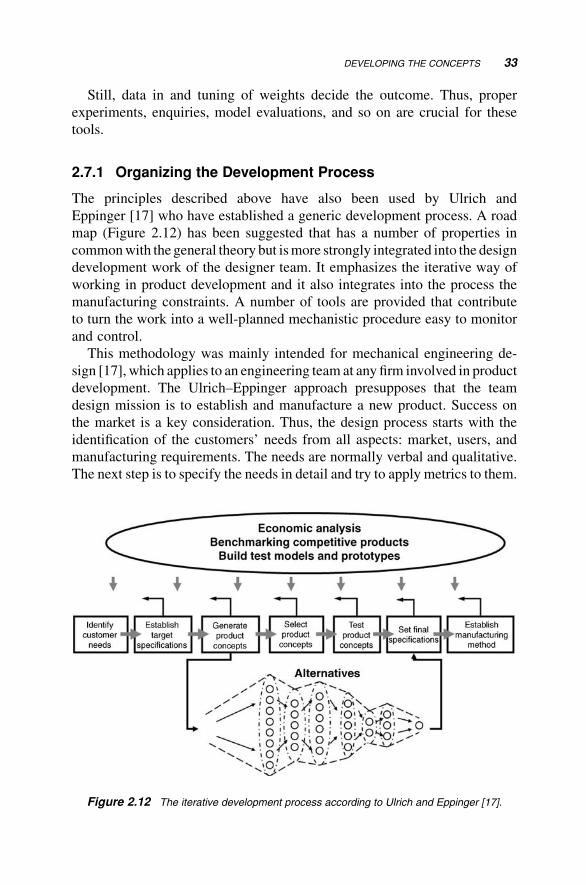
2.7.1 Organizing the Development Process
The principles described above have also been used by Ulrich and
Eppinger [17] who have established a generic development process. A road
map (Figure 2.12) has been suggested that has a number of properties in
commonwith the general theory but ismore strongly integrated into the design
development work of the designer team. It emphasizes the iterative way of
working in product development and it also integrates into the process the
manufacturing constraints. A number of tools are provided that contribute
to turn the work into a well-planned mechanistic procedure easy to monitor
and control.
This methodology was mainly intended for mechanical engineering de-
sign [17], which applies to an engineering team at any firm involved in product
development. The Ulrich–Eppinger approach presupposes that the team
design mission is to establish and manufacture a new product. Success on
the market is a key consideration. Thus, the design process starts with the
identification of the customers’ needs from all aspects: market, users, and
manufacturing requirements. The needs are normally verbal and qualitative.
The next step is to specify the needs in detail and try to apply metrics to them.
Figure 2.12 The iterative development process according to Ulrich and Eppinger [17].
DEVELOPING THE CONCEPTS 33
At this stage, it is difficult to assess the realism of the specifications,
but target values are set for the attributes qualitatively or in ranges. The target
specification directs the activity in the third step, the concept generation,
where a large number of concepts are generated based on known techniques
and material properties. Since it is unrealistic to test and prototype
all concepts, these are screened toward criteria derived from the target
specification and are subsequently scored, or assessed, according to
metrics (Figure 2.12). With one or two concepts remaining after the scoring
assessment, prototypes are built and tested in thorough testing programs [18].
Of particular interest is to integrate the manufacturing requirements
into the design, the so-called design for manufacturing (DfM) [19] (see
also Chapter 7). The aim is to ensure that those design concepts that are more
feasible for manufacturing become favored in the screening and assessment
process. For biotechnological and biomechatronic products, it is important
that the biological attributes and criteria of relevance for manufacturing are
carefully considered when they are listed in the target specification. These
criteria should also be ranked high when scoring the manufacturing alter-
natives. Thus, the biological experts of the team must identify the biology-
related manufacturing requirements early, and, if possible, also anticipate
their cost effects.
2.8 CONCLUDING REMARKS
The theory description in this chapter has brought up the essential principles of
modern design methodology. As emphasized throughout the chapter, the
theory and its methodology have predominantly been used for mechanical
product design and development. In this book, we will further develop and
apply the theory on products with a significant biotechnological content. We
do this since we are convinced that biotechnology products can be developed
and designedmore easily andwithmore success for their intended purposes by
using the methodology.
In Chapter 4, the applied biomechatronic methodology is described from
the mechatronic perspective outlined above. Thus, reasoning and analysis
based on transformation of energy, materials, and signals within the systems
and functions are applied on the biotechnology products.
The Hubka terminology and symbolism are amply taken advantage of for
describing and analyzing the biotechnology design problems. But we also
bring into this procedures that are based on the systematic thinking and
reasoning as presented in several other parts of this theory.
In order tomake themethodologymore adaptive to the added complexity of
biology and biotechnology,we support the utilization of themethodologywith
34 CONCEPTUAL DESIGN THEORY
additional design tools (see Chapter 4). These tools are then used in the cases
presented in the preceding chapters.
Before entering into these hands-on biomechatronic tools, a brief account
of the prerequisites the biological systems impose on systematic design due to
its inherent complexity (Chapter 3) is given.
REFERENCES
1. Pahl, G., Beitz, W. (1996) Engineering Design: A Systematic Approach.
Springer, Berlin.
2. Pahl, G., Beitz, W., Feldhusen, J., Grote, K.H. (2007) Engineering Design, 3rd
edition. Springer, New York.
3. Kesselring, F. (1954) Technische Kompositionslehre. Springer, Berlin.
4. Tschochner, H. (1954) Konstruieren und Gestalten. Girardet, Essen.
5. Niemann, G. (1975) Maschinenelemente Bd. 1. Springer, Berlin.
6. Leyer, A. (1971) Maschinenkonstruktionslehre 1–6. Birkh€auser, Reihe, Basel.
7. Hansen, F. (1965) Konstruktionssystematik. VEB Verlag, Berlin.
8. Koller, R. (1994) Konstruktionslehre f€ur der Maschinenbau. Grundlagen,
Arbeitsschritte, Prinzipl€osungen. Springer, Berlin.
9. Hubka, V., Andreasen, M.M., Eder, W.E. (1988) Practical Studies in Systematic
Design. Butterworths & Co. Ltd, London, UK.
10. Hubka, V., Eder, W.E. (1988) Theory of Technical Systems: A Total Concept
Theory for Engineering Design. Springer, Berlin.
11. Hubka, V., Eder, W.E. (1996) Design Science. Springer, Berlin.
12. Ehrenspiel, K. (1985) Kosteng€unstig Konstruieren. Springer, Berlin.
13. Andresen, M.M., Hein, L. (1987) Integrated Product Development. Springer,
Berlin.
14. Archer, L.B. (1985) The implications for the study of design methods of recent
developments in neighbouring disciplines. In: Proceedings of ICCD, Heurista,
Zurich.
15. Roozenburg, N.F.M., Eekels, J. (1996) Product Design: Fundamentals and
Methods. Wiley, Chichester.
16. Ullman, D.G. (2003)TheMechanicalDesign Process, 3rd edition.McGraw-Hill,
New York.
17. Ulrich, K.T., Eppinger, S.D. (2008) Product Design and Development, 4th
edition. McGraw-Hill, New York.
18. Wall, M.B., Ulrich, K.T., Flowers, W.C. (1992) Evaluating prototyping tech-
nologies for product design. Res. Eng. Des. 3,163–177.
19. Poli, C. (2001) Engineering Design and Design for Manufacturing: A Structural
Approach. Butterworth-Heinemann.
REFERENCES 35

3Biotechnology and
Mechatronic Design
This chapter emphasizes the characteristics of the biological components of
the biomechatronic systems and products. In order to systematically integrate
the biological parts of a technical designwemust have an accurate description
of their characters. In the biological world these characters can vary consid-
erably for each part depending on conditions. This is much owing not only to
biochemical composition but also to architecture and microstructure of cells.
Biomolecular structures or larger biological structures such as organs or
individuals or whole biotopes have a great impact on the systematic design.
These complexities are added to the extensive mechatronic prerequisites
outline in Chapter 2 and by that impose new considerations and complex facts
to the existing complexities of the technical system. This chapter systemizes
the biological parts and highlights the biological features that are critical to
consider.
3.1 TRANSDUCTION OF THE BIOLOGICAL SCIENCEINTO BIOTECHNOLOGY
Bringing the biological science into daily life applications has been done since
ancient days. As mentioned in the introduction already, the Mesopotamians
Biomechatronic Design in Biotechnology: A Methodology for Development ofBiotechnological Products, First Edition. Carl-Fredrik Mandenius and Mats Bjorkman.� 2011 John Wiley & Sons, Inc. Published 2011 by John Wiley & Sons, Inc.
37
fermented wines and the Romans produced olive oil in industrial refineries.
In applied medicine, technical devices were used by the ancient Egyptian
surgeons. In late eighteenth century, pharmaceutical technique for vaccination
of small pox was begun and agricultural methods became a technology
with harvesting machines. In the nineteenth century, industrial biotechnology
set up protein enzyme production in fermenters with selected cultures.
During the twentieth century, we were flooded with numerous biotechnology
applications such as antibiotic manufacture, monoclonal antibodies for fast
diagnosis, polio vaccines, recombinant insulin, and personal medicine with
DNA mapping.
These examples all describe how biology interacts with mechanics and
where the mechanics is the enabling means that allows the force of the
biological systems to be exploited.
In a wider sense, mechanical systems can be expanded to hydrodynamics,
fluid mechanics, reaction chemistry, thermodynamics, electronics, and other
sciences related to engineering, which in oneway or another can interact with
biology in order to shape a technical system. In the introduction we coined the
term “biomechatronics” to demark developments that are based on these
preconditions.
In spite of this development, the design science and design theory we
described in the previous chapter has had limited impact on the development
of biology and biologically derivedmachines and system products.We quoted
Gerald Pahl and Wolfgang Beitz who had stated:
The main task of engineers is to apply their scientific and engineering
knowledge to the solution of technical problems, and then to optimize those
solutions within the requirements and constraints set by materials, technolog-
ical, economic, legal, environmental and human-related considerations. [1]
Obviously, these engineers may be bioengineers, the materials may be
microbial or human cells and biomolecules, and the legal aspects are covered
by regulatory and ethical restrictions.
The mechatronic design theory is very compatible with biology although it
has seldom been utilized in bioengineering training and, as a consequence,
probably not very much in industrial practice.
We have shown in a few recent papers this possibility and how it can be
applied to several of themechatronicmethods [1–5]. In this chapter,we further
discuss the biological part itself and how it should be better merged with the
mechatronic design methodology.
Here, we will try to further understand how biological principles are
turned into technical products where the biology drives the invention/
design concept.
38 BIOTECHNOLOGY AND MECHATRONIC DESIGN
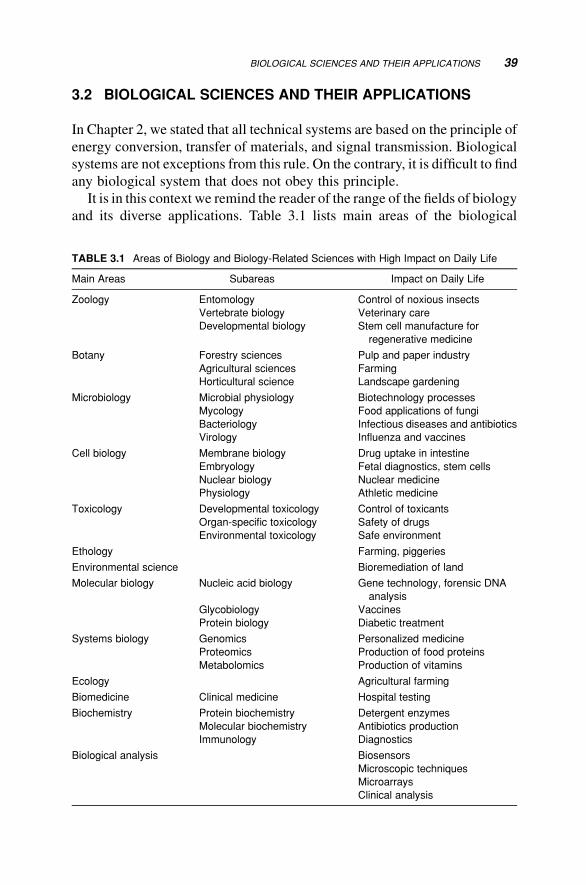
3.2 BIOLOGICAL SCIENCES AND THEIR APPLICATIONS
In Chapter 2, we stated that all technical systems are based on the principle of
energy conversion, transfer of materials, and signal transmission. Biological
systems are not exceptions from this rule. On the contrary, it is difficult to find
any biological system that does not obey this principle.
It is in this context we remind the reader of the range of the fields of biology
and its diverse applications. Table 3.1 lists main areas of the biological
TABLE 3.1 Areas of Biology and Biology-Related Sciences with High Impact on Daily Life
Main Areas Subareas Impact on Daily Life
Zoology Entomology Control of noxious insects
Vertebrate biology Veterinary care
Developmental biology Stem cell manufacture for
regenerative medicine
Botany Forestry sciences Pulp and paper industry
Agricultural sciences Farming
Horticultural science Landscape gardening
Microbiology Microbial physiology Biotechnology processes
Mycology Food applications of fungi
Bacteriology Infectious diseases and antibiotics
Virology Influenza and vaccines
Cell biology Membrane biology Drug uptake in intestine
Embryology Fetal diagnostics, stem cells
Nuclear biology Nuclear medicine
Physiology Athletic medicine
Toxicology Developmental toxicology Control of toxicants
Organ-specific toxicology Safety of drugs
Environmental toxicology Safe environment
Ethology Farming, piggeries
Environmental science Bioremediation of land
Molecular biology Nucleic acid biology Gene technology, forensic DNA
analysis
Glycobiology Vaccines
Protein biology Diabetic treatment
Systems biology Genomics Personalized medicine
Proteomics Production of food proteins
Metabolomics Production of vitamins
Ecology Agricultural farming
Biomedicine Clinical medicine Hospital testing
Biochemistry Protein biochemistry Detergent enzymes
Molecular biochemistry Antibiotics production
Immunology Diagnostics
Biological analysis Biosensors
Microscopic techniques
Microarrays
Clinical analysis
BIOLOGICAL SCIENCES AND THEIR APPLICATIONS 39
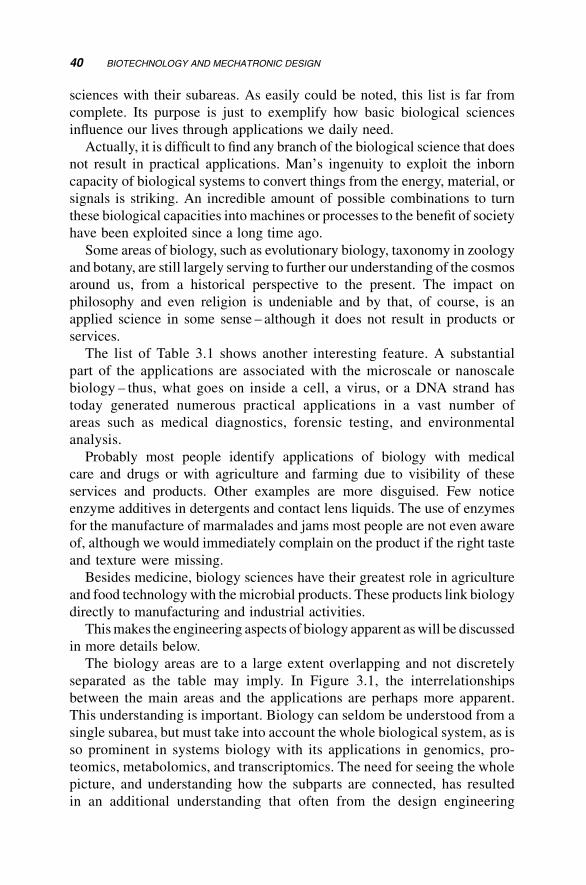
sciences with their subareas. As easily could be noted, this list is far from
complete. Its purpose is just to exemplify how basic biological sciences
influence our lives through applications we daily need.
Actually, it is difficult to find any branch of the biological science that does
not result in practical applications. Man’s ingenuity to exploit the inborn
capacity of biological systems to convert things from the energy, material, or
signals is striking. An incredible amount of possible combinations to turn
these biological capacities into machines or processes to the benefit of society
have been exploited since a long time ago.
Some areas of biology, such as evolutionary biology, taxonomy in zoology
and botany, are still largely serving to further our understanding of the cosmos
around us, from a historical perspective to the present. The impact on
philosophy and even religion is undeniable and by that, of course, is an
applied science in some sense – although it does not result in products or
services.
The list of Table 3.1 shows another interesting feature. A substantial
part of the applications are associated with the microscale or nanoscale
biology – thus, what goes on inside a cell, a virus, or a DNA strand has
today generated numerous practical applications in a vast number of
areas such as medical diagnostics, forensic testing, and environmental
analysis.
Probably most people identify applications of biology with medical
care and drugs or with agriculture and farming due to visibility of these
services and products. Other examples are more disguised. Few notice
enzyme additives in detergents and contact lens liquids. The use of enzymes
for the manufacture of marmalades and jams most people are not even aware
of, although we would immediately complain on the product if the right taste
and texture were missing.
Besides medicine, biology sciences have their greatest role in agriculture
and food technologywith themicrobial products. These products link biology
directly to manufacturing and industrial activities.
Thismakes the engineering aspects of biology apparent aswill be discussed
in more details below.
The biology areas are to a large extent overlapping and not discretely
separated as the table may imply. In Figure 3.1, the interrelationships
between the main areas and the applications are perhaps more apparent.
This understanding is important. Biology can seldom be understood from a
single subarea, but must take into account the whole biological system, as is
so prominent in systems biology with its applications in genomics, pro-
teomics, metabolomics, and transcriptomics. The need for seeing the whole
picture, and understanding how the subparts are connected, has resulted
in an additional understanding that often from the design engineering
40 BIOTECHNOLOGY AND MECHATRONIC DESIGN
perspective is critical for the function and operation of technical systems.
Without knowing how the genome interacts with the metabolome and
transcriptome, our ability to exploit the cellular machinery is severely
impeded. The functionality of systems is a critical characteristic for
the operation of the microcosm of the cell. It is also very critical for the
functionality of the technical systems on a larger scale in any manmade
machine, including those sprung from biotechnology inventions.
Furthermore, the knowledge about biological microscale world is needed
also for analysis in the design of technical systems where interactions are
pivotal for interpreting effects and interactions. Thus, genuine biological
interactions that we predominantly have studied inside or between parts of
biological systems need to be understood from an external view – from how
they interact with nonbiological entities. These nonbiological parts could,
as mentioned, be mechanical, electronic, optical, thermal, or chemical
interactions. But it also includes social interactions, that is, how people
interact with the systems – influence them or are influenced by them.
Without this understanding, a complete integration of systems cannot be
realized. When biological system is an integral part of this whole technical
system, it is necessary to understand the underlying interactions and the
possible effects on the whole technical system if this is going to be operable
and meet the design intentions.
Biology
Plant virology
Virology
Molecular
biology
Zoology
Human biology
Physiology MicrobiologyMedici
ne
Botany
Figure 3.1 Overlapping biological competences.
BIOLOGICAL SCIENCES AND THEIR APPLICATIONS 41
3.3 BIOTECHNOLOGY AND BIOENGINEERING
Thus, the biology applications utilize the capacity of the biological systems.
Since the past 40–50 years we have been naming this biotechnology or
bioengineering, depending on if we want to emphasize the technology aspect
or the engineering aspect of the application. Today, we encompass in the
concept of biotechnology a wide scope of applications: molecular biotech-
nology, nanobiotechnology, agricultural biotechnology, marine biotechnolo-
gy, gene biotechnology, food biotechnology, forest biotechnology, space
biotechnology, analytical biotechnology, and so on. In its widest definition,
biotechnology is all application areas where biology is applied for technical or
methodological purposes.
The concept of bioengineering has developed into an engineering
science approach to the biology. This includes for example biochemical
engineering, biomedical engineering, food engineering, genetic engineer-
ing, plant culture engineering, bioreaction engineering, biothermal engi-
neering, bioanalytical engineering, biophysical engineering, biomaterials
engineering, and so on. The bioengineering aspect is here related to the
technique of carrying out the technology, how to design an engineering
system, for example, a biochemical reaction, a biomedical device, a
genetic construct, or a bioanalytical instrument. The bioengineering
science relies much on general engineering mathematics where energy
and mass balances are used and kinetics and dynamics are described for
the systems. Typically, this is related to conversions of materials, energy,
and signals.
Key features of bioengineering are production of materials: cells, such as
fodder products, stem cells, or cell lines; proteins such as insulin, monoclonal
antibodies, vaccines, or restriction enzymes; and metabolites, such as anti-
biotics, bioethanol, or biodiesel. In biotechnology,we often exploit the genetic
capacity of the biological system, either as it is created by Nature or by using
genetic engineering methods to improve it.
Other key features are observed when, for example, we use a biological
system for producing information or signals through its capacity to recognize.
What normally then is recognized are analytes, such as glucose or HIV in
blood, environmental toxins, or complementary DNA or RNA sequences in
forensic analysis.
Yet another key feature is seen when we try to rebuild with technical means
the functions of a human organ. This could be exemplified by artificial liver
devices and artificial heart veins.
All the application examples in this book (Chapters 5–13) bring
the mechatronic design theory into these types of biotechnology design
tasks.
42 BIOTECHNOLOGY AND MECHATRONIC DESIGN
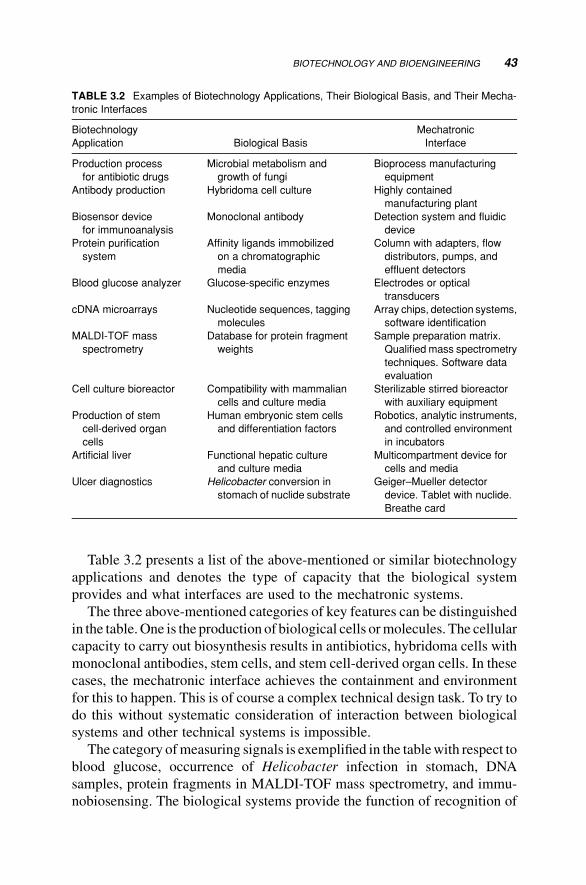
Table 3.2 presents a list of the above-mentioned or similar biotechnology
applications and denotes the type of capacity that the biological system
provides and what interfaces are used to the mechatronic systems.
The three above-mentioned categories of key features can be distinguished
in the table.One is the production of biological cells ormolecules. The cellular
capacity to carry out biosynthesis results in antibiotics, hybridoma cells with
monoclonal antibodies, stem cells, and stem cell-derived organ cells. In these
cases, the mechatronic interface achieves the containment and environment
for this to happen. This is of course a complex technical design task. To try to
do this without systematic consideration of interaction between biological
systems and other technical systems is impossible.
The category ofmeasuring signals is exemplified in the tablewith respect to
blood glucose, occurrence of Helicobacter infection in stomach, DNA
samples, protein fragments in MALDI-TOF mass spectrometry, and immu-
nobiosensing. The biological systems provide the function of recognition of
TABLE 3.2 Examples of Biotechnology Applications, Their Biological Basis, and Their Mecha-
tronic Interfaces
Biotechnology
Application Biological Basis
Mechatronic
Interface
Production process
for antibiotic drugs
Microbial metabolism and
growth of fungi
Bioprocess manufacturing
equipment
Antibody production Hybridoma cell culture Highly contained
manufacturing plant
Biosensor device
for immunoanalysis
Monoclonal antibody Detection system and fluidic
device
Protein purification
system
Affinity ligands immobilized
on a chromatographic
media
Column with adapters, flow
distributors, pumps, and
effluent detectors
Blood glucose analyzer Glucose-specific enzymes Electrodes or optical
transducers
cDNA microarrays Nucleotide sequences, tagging
molecules
Array chips, detection systems,
software identification
MALDI-TOF mass
spectrometry
Database for protein fragment
weights
Sample preparation matrix.
Qualified mass spectrometry
techniques. Software data
evaluation
Cell culture bioreactor Compatibility with mammalian
cells and culture media
Sterilizable stirred bioreactor
with auxiliary equipment
Production of stem
cell-derived organ
cells
Human embryonic stem cells
and differentiation factors
Robotics, analytic instruments,
and controlled environment
in incubators
Artificial liver Functional hepatic culture
and culture media
Multicompartment device for
cells and media
Ulcer diagnostics Helicobacter conversion in
stomach of nuclide substrate
Geiger–Mueller detector
device. Tablet with nuclide.
Breathe card
BIOTECHNOLOGY AND BIOENGINEERING 43
the biomolecules or cells of interest. The key feature of the mechatronic
interface is the detection and interpretation of the signals.
The third category is exemplified only with the artificial liver device. This
can be expandedwith other organs such as kidney, pancreas, veins, blood cells
in the circulation, and so on. The biosystem is there to imitate the natural organ
for various applications. The functions need to imitate the human organ
accurately or at least as accurate as possible if it concerns with surgery,
regenerativemedicine, or toxicity test of drug on the artificial liver. To achieve
such as biological system is a challenge. The mechatronic interfaces are as a
consequence also demanding.
3.4 APPLYING MECHATRONIC THEORY TOBIOTECHNOLOGY: BIOMECHATRONICS
In the present design methodology, as presented in Chapter 2, all technical
systems are regarded equal. Thus, either it is a technical system derived from
mechanics, electronics, optics, or chemistry it belongs to or it is a subsystemof
the general technical system.
In the approach taken in this book, the biological systems are always
analyzed separately fromother technical systems. This ismotivated by the fact
that the biological systems are enormously complex and interconnected. Their
impacts onto the other systems of the design are therefore significant.
Moreover, the biological systems are also complicated by the fact that they
themselves are sometimes consumed or reproduced. For example, in a
bioprocess we inoculate the process with a biological system, for example,
a microbial cell. Thus, it is the material that is added to the process and
converted. But the biological functions of this input biological material are
able to reproduce the input into newmaterials with the same functions. This is
a manifestation of the dogma of biology – sometimes referred to as the first
principle of biology [1]:
CellsþRaw materials ðnutrientsÞ!New cellsþ Side products
þRemainsþEnergy
This condition makes the biological systems different from most other
technical systems. Chemical systems are consumed and do not reproduce;
mechanical and electric systems behave in the sameway.Of course, biological
systems need materials and energy and signals to reproduce – but the func-
tions, or program code, are embedded into the biological materials and exert
their effects on thesematerials. This is a unique feature that justifies the special
44 BIOTECHNOLOGY AND MECHATRONIC DESIGN
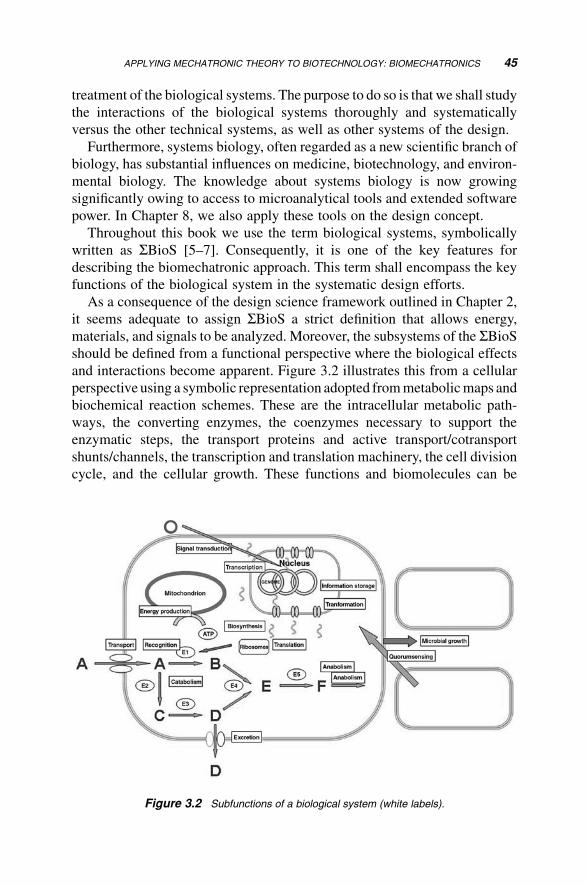
treatment of the biological systems. The purpose to do so is that we shall study
the interactions of the biological systems thoroughly and systematically
versus the other technical systems, as well as other systems of the design.
Furthermore, systems biology, often regarded as a new scientific branch of
biology, has substantial influences on medicine, biotechnology, and environ-
mental biology. The knowledge about systems biology is now growing
significantly owing to access to microanalytical tools and extended software
power. In Chapter 8, we also apply these tools on the design concept.
Throughout this book we use the term biological systems, symbolically
written as SBioS [5–7]. Consequently, it is one of the key features for
describing the biomechatronic approach. This term shall encompass the key
functions of the biological system in the systematic design efforts.
As a consequence of the design science framework outlined in Chapter 2,
it seems adequate to assign SBioS a strict definition that allows energy,
materials, and signals to be analyzed. Moreover, the subsystems of the SBioSshould be defined from a functional perspective where the biological effects
and interactions become apparent. Figure 3.2 illustrates this from a cellular
perspective using a symbolic representation adopted frommetabolicmaps and
biochemical reaction schemes. These are the intracellular metabolic path-
ways, the converting enzymes, the coenzymes necessary to support the
enzymatic steps, the transport proteins and active transport/cotransport
shunts/channels, the transcription and translation machinery, the cell division
cycle, and the cellular growth. These functions and biomolecules can be
Figure 3.2 Subfunctions of a biological system (white labels).
APPLYING MECHATRONIC THEORY TO BIOTECHNOLOGY: BIOMECHATRONICS 45
ranged into a hierarchical relationship of subsystems and subfunctions.
Together they form SBioS. The rationale for doing this is to open up and
desiccate the interactions on a more detailed level. The interactions can be not
only within the SBioS but also between the other systems and subsystems.
The functions human systems (SHuS) are in most cases clearly distin-
guished from SBioS by social or individual conditions. Despite being by
necessity a biological system, SHuS are characterized by actions carried out
by humans in their professional situation as operators, teachers, service men,
doctors, and engineers. Conversely, the functions of a product may affect the
function and capacities of SHuS, for example, the ergonomy of a product’s
design exert effects on the operator of the product or the physical form of a
dentist’s drill affects his ability to operate it with precision. The design
solution shall consequently try to minimize such effects. In some instances,
the distinction between SBioS and SHuS may be difficult to define. In the
example in Chapter 7, a human/patient carries a stomach ulcer bacterial
culture. The patient’s body (intestinal tract/stomach) interacts with the culture
and the culture interacts with a reagent to form a conversion product the
technical system can record. In this example, theHuS is the patient, the culture
the SBioS and the subsystems of the bacterium, that is, the transformations
taking place inside the bacterium, that is, as shown in Figure 3.2.
The simple illustration of the functions in the cell in Figure 3.2 shows the
essence of the biological processes.Materials (A, B, C, etc.) are transformed
into the biological system with the help of energy (ATP that drives the
biochemical transformations) and enzymes that execute the transformations
of the materials from signals collected from the code of genome (DNA and
mRNA) and the environment (signaling molecules and quorum sensing
effectors). This is translated further by materials’ transformation (tRNA and
ribosomes) into functional enzymes.
The effects of the other parts and components of a (bio)-technical design
will or could change the functions of the biological systems on the cellular
or biomolecular levels. Of course, also the subfunctions of the SBioS affect
each other.
The systems of technical equipment, process information, management,
and regulations, and the environmental factors that are difficult to anticipate
and control all exert their effects on functional biology. Figure 3.3 illustrates
this. In the upper left circle, technical functions are carried out by certain
gears/devices. In the lower left circle, information is handled, here illustrated
by integrated circuits, by amobile telephone andmeasurement instrument that
can record and deliver information.
The upper right circle shows laws and regulations that restrict the technical
systems’ sometimes larger potential. This also includes goal/target values to
be communicated to the personnel (HuS).
46 BIOTECHNOLOGY AND MECHATRONIC DESIGN
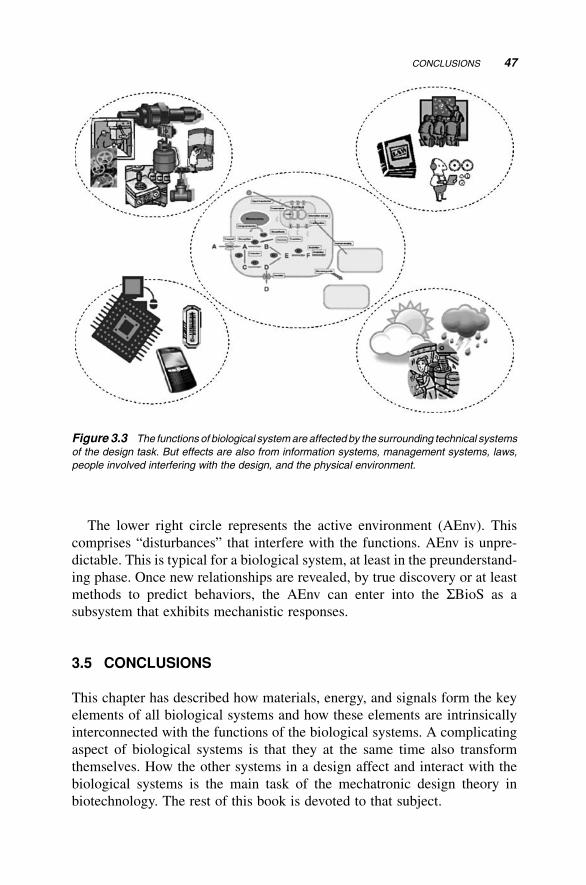
The lower right circle represents the active environment (AEnv). This
comprises “disturbances” that interfere with the functions. AEnv is unpre-
dictable. This is typical for a biological system, at least in the preunderstand-
ing phase. Once new relationships are revealed, by true discovery or at least
methods to predict behaviors, the AEnv can enter into the SBioS as a
subsystem that exhibits mechanistic responses.
3.5 CONCLUSIONS
This chapter has described how materials, energy, and signals form the key
elements of all biological systems and how these elements are intrinsically
interconnected with the functions of the biological systems. A complicating
aspect of biological systems is that they at the same time also transform
themselves. How the other systems in a design affect and interact with the
biological systems is the main task of the mechatronic design theory in
biotechnology. The rest of this book is devoted to that subject.
Figure 3.3 The functions of biological systemare affected by the surrounding technical systems
of the design task. But effects are also from information systems, management systems, laws,
people involved interfering with the design, and the physical environment.
CONCLUSIONS 47
REFERENCES
1. Pahl, G., Beitz, W. (1996) Engineering Design, A Systematic Approach, Springer-
Verlag, Berlin.
2. Ulrich, K.T., Eppinger, S.D. (2008)ProductDesign andDevelopment, 4th edition,
McGraw-Hill, New York.
3. Hubka, V., Eder, W.E. (1988) Theory of Technical Systems, A Total Concept
Theory for Engineering Design, Springer-Verlag, Berlin.
4. Hubka, V., Eder, W.E. (1996) Design Science, Springer-Verlag, Berlin.
5. Mandenius, C.F., Bj€orkman, M. (2010) Design principles for biotechnology
product development. Trend. Biotechnol. 28(5), 230–236.
6. Derel€ov, M., Detterfelt, J., Bj€orkman M., Mandenius C.F. (2008) Engineering
design methodology for bio-mechatronic products. Biotechnol. Prog. 24,
232–244.
7. Mandenius, C.F., Derel€ov, M., Detterfelt, J., Bj€orkman, M. (2007) Process
analytical technology and design science. Eur. Pharm. Rev. 12, 74–80.
48 BIOTECHNOLOGY AND MECHATRONIC DESIGN
4Methodology forUtilization
of MechatronicDesign Tools
This chapter describes a biomechatronic methodology for adapting and
utilizing design methodologies and tools from the mechatronic design area
to design biomechatronic products and systems. The methodology and tools
are used in the biotechnology design applications described in the following
chapters. Here, we explain how the design tools are best taken advantage of
in general. It is explained when, how, and why they should be used. In
particular, the biotechnology aspect is highlighted based on the views
presented in Chapter 3.
4.1 IDEA OF APPLYING THE MECHATRONIC DESIGN TOOLS
The generic mechatronic design tools we describe and use as a basis in this
chapter have all been previously presented by several authors [1–5]. Some of
these authors also describe thoroughly how to use the tools in industrial design
in a practical and optimal way in order to achieve a good design result.
Our approach in this book is to take established design tools from the
mechatronic area and to modify, develop, and adapt them for application in
Biomechatronic Design in Biotechnology: A Methodology for Development ofBiotechnological Products, First Edition. Carl-Fredrik Mandenius and Mats Bj€orkman.� 2011 John Wiley & Sons, Inc. Published 2011 by John Wiley & Sons, Inc.
49
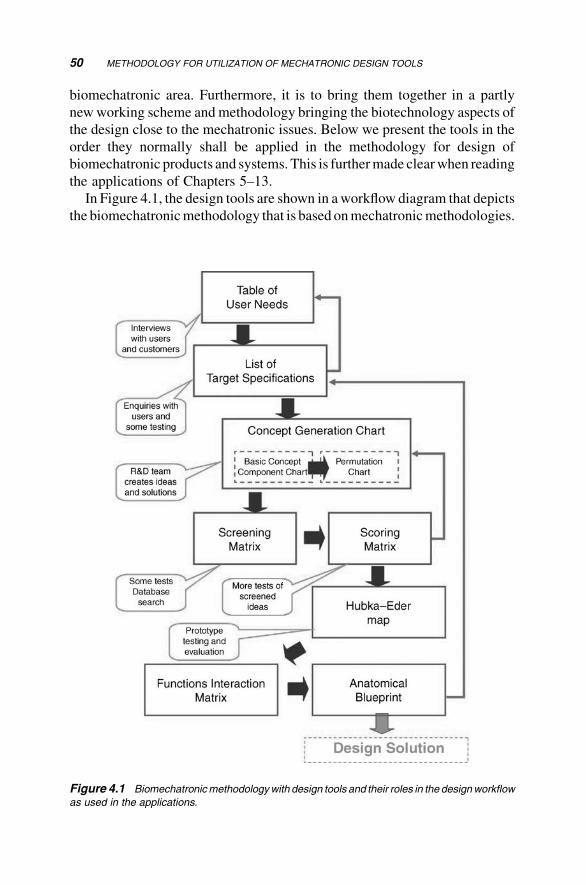
biomechatronic area. Furthermore, it is to bring them together in a partly
newworking scheme and methodology bringing the biotechnology aspects of
the design close to the mechatronic issues. Below we present the tools in the
order they normally shall be applied in the methodology for design of
biomechatronic products and systems. This is furthermade clearwhen reading
the applications of Chapters 5–13.
In Figure 4.1, the design tools are shown in aworkflow diagram that depicts
the biomechatronicmethodology that is based onmechatronicmethodologies.
Figure 4.1 Biomechatronicmethodologywith design tools and their roles in the designworkflow
as used in the applications.
50 METHODOLOGY FOR UTILIZATION OF MECHATRONIC DESIGN TOOLS
The structure of the workflow should not be taken as absolute. Special
applications may motivate to deviate to some extent.
In most of the application examples, we begin the design work by defining
the goal of the design. Once this is done, it is possible to list the needs of the
users. These needs can then be transformed into concrete specifications for the
needs, quite often with quantitative measures.
The specifications’ different values give the boundaries for a design and
based on these boundaries a number of design concepts are generated. It is
often done by permuting combinations of functions.
The generated concepts are first systematically screened to remove
those ideas that are not in line with the needs and specifications. The
remaining concepts are thoroughly assessed by scoring by tests and other
measurements.
The design alternatives with best scores are further studied. At this stage, a
so-called Hubka–Eder map of the functions of the designed object is drawn.
The map is a conceptual model-like approach where transformations and
interactions in the design structure are lifted up to the design team’s attention.
The interactions are then systematically evaluated in a Functions Inter-
action Matrix (FIM) that should show the most critical interactions.
Finally, this analysis of the critical interactions paves the way for setting an
Anatomical Blueprint of the design. The anatomical blueprint goes into actual
biological and mechatronic components and presents distinct and well-
founded suggestions for realizing the conceptual design.
As Figure 4.1 tries to illuminate by reciprocal arrows, the designwork is not
a linear process in practice. It is a highly iterative process and without
these iterations it is very difficult to achieve a proper design solution. It is
also possible to omit design tools during a specific design task. This can be
found in Chapters 5–13. All design tools are not utilized in all chapters.
However, all the chapters follow the generic methodology order shown in
Figure 4.1. With a sound utilization of design tools, recirculation/iterations,
and evaluation of design concepts, the possibility to accomplish a feasible and
optimal design solution is increased. Several of the steps in this methodology
are similar to the Ulrich and Eppinger approach [1] that we have previously
described [5].
4.2 TABLE OF USER NEEDS
Once the design mission is settled, the actual needs of the users must be
confirmed. In many instances, the users are more or less obvious. Quite often,
it is the same as the customers – those who are going to buy the designed
product.
TABLE OF USER NEEDS 51
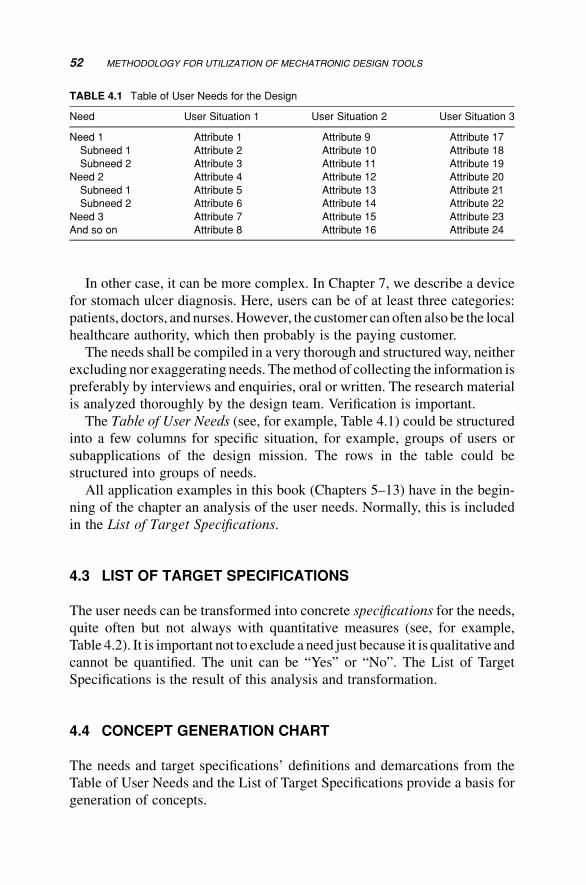
In other case, it can be more complex. In Chapter 7, we describe a device
for stomach ulcer diagnosis. Here, users can be of at least three categories:
patients, doctors, and nurses.However, the customer can often also be the local
healthcare authority, which then probably is the paying customer.
The needs shall be compiled in a very thorough and structured way, neither
excluding nor exaggerating needs. Themethod of collecting the information is
preferably by interviews and enquiries, oral or written. The research material
is analyzed thoroughly by the design team. Verification is important.
The Table of User Needs (see, for example, Table 4.1) could be structured
into a few columns for specific situation, for example, groups of users or
subapplications of the design mission. The rows in the table could be
structured into groups of needs.
All application examples in this book (Chapters 5–13) have in the begin-
ning of the chapter an analysis of the user needs. Normally, this is included
in the List of Target Specifications.
4.3 LIST OF TARGET SPECIFICATIONS
The user needs can be transformed into concrete specifications for the needs,
quite often but not always with quantitative measures (see, for example,
Table 4.2). It is important not to exclude a need just because it is qualitative and
cannot be quantified. The unit can be “Yes” or “No”. The List of Target
Specifications is the result of this analysis and transformation.
4.4 CONCEPT GENERATION CHART
The needs and target specifications’ definitions and demarcations from the
Table of User Needs and the List of Target Specifications provide a basis for
generation of concepts.
TABLE 4.1 Table of User Needs for the Design
Need User Situation 1 User Situation 2 User Situation 3
Need 1 Attribute 1 Attribute 9 Attribute 17
Subneed 1 Attribute 2 Attribute 10 Attribute 18
Subneed 2 Attribute 3 Attribute 11 Attribute 19
Need 2 Attribute 4 Attribute 12 Attribute 20
Subneed 1 Attribute 5 Attribute 13 Attribute 21
Subneed 2 Attribute 6 Attribute 14 Attribute 22
Need 3 Attribute 7 Attribute 15 Attribute 23
And so on Attribute 8 Attribute 16 Attribute 24
52 METHODOLOGY FOR UTILIZATION OF MECHATRONIC DESIGN TOOLS
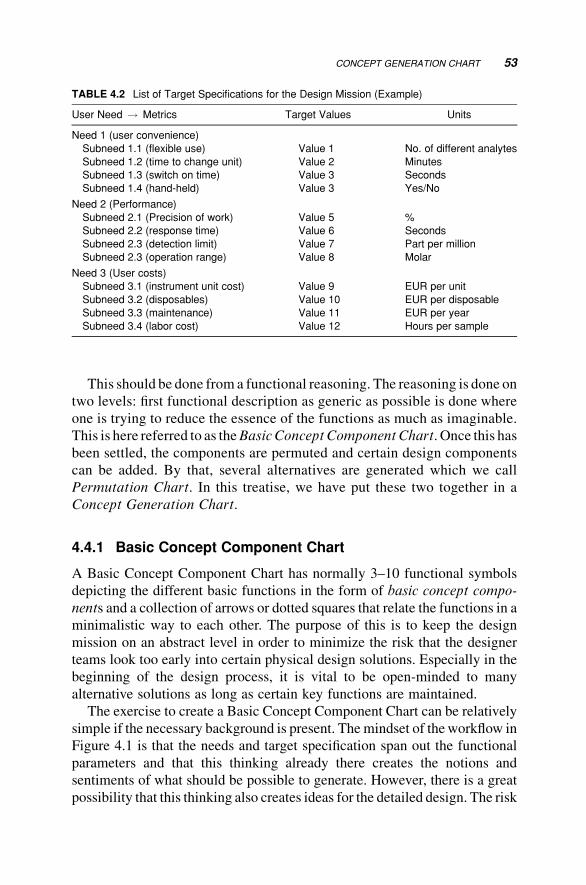
This should be done from a functional reasoning. The reasoning is done on
two levels: first functional description as generic as possible is done where
one is trying to reduce the essence of the functions as much as imaginable.
This is here referred to as theBasic ConceptComponent Chart. Once this has
been settled, the components are permuted and certain design components
can be added. By that, several alternatives are generated which we call
Permutation Chart. In this treatise, we have put these two together in a
Concept Generation Chart.
4.4.1 Basic Concept Component Chart
A Basic Concept Component Chart has normally 3–10 functional symbols
depicting the different basic functions in the form of basic concept compo-
nents and a collection of arrows or dotted squares that relate the functions in a
minimalistic way to each other. The purpose of this is to keep the design
mission on an abstract level in order to minimize the risk that the designer
teams look too early into certain physical design solutions. Especially in the
beginning of the design process, it is vital to be open-minded to many
alternative solutions as long as certain key functions are maintained.
The exercise to create a Basic Concept Component Chart can be relatively
simple if the necessary background is present. The mindset of theworkflow in
Figure 4.1 is that the needs and target specification span out the functional
parameters and that this thinking already there creates the notions and
sentiments of what should be possible to generate. However, there is a great
possibility that this thinking also creates ideas for the detailed design. The risk
TABLE 4.2 List of Target Specifications for the Design Mission (Example)
User Need ! Metrics Target Values Units
Need 1 (user convenience)
Subneed 1.1 (flexible use) Value 1 No. of different analytes
Subneed 1.2 (time to change unit) Value 2 Minutes
Subneed 1.3 (switch on time) Value 3 Seconds
Subneed 1.4 (hand-held) Value 3 Yes/No
Need 2 (Performance)
Subneed 2.1 (Precision of work) Value 5 %
Subneed 2.2 (response time) Value 6 Seconds
Subneed 2.3 (detection limit) Value 7 Part per million
Subneed 2.3 (operation range) Value 8 Molar
Need 3 (User costs)
Subneed 3.1 (instrument unit cost) Value 9 EUR per unit
Subneed 3.2 (disposables) Value 10 EUR per disposable
Subneed 3.3 (maintenance) Value 11 EUR per year
Subneed 3.4 (labor cost) Value 12 Hours per sample
CONCEPT GENERATION CHART 53
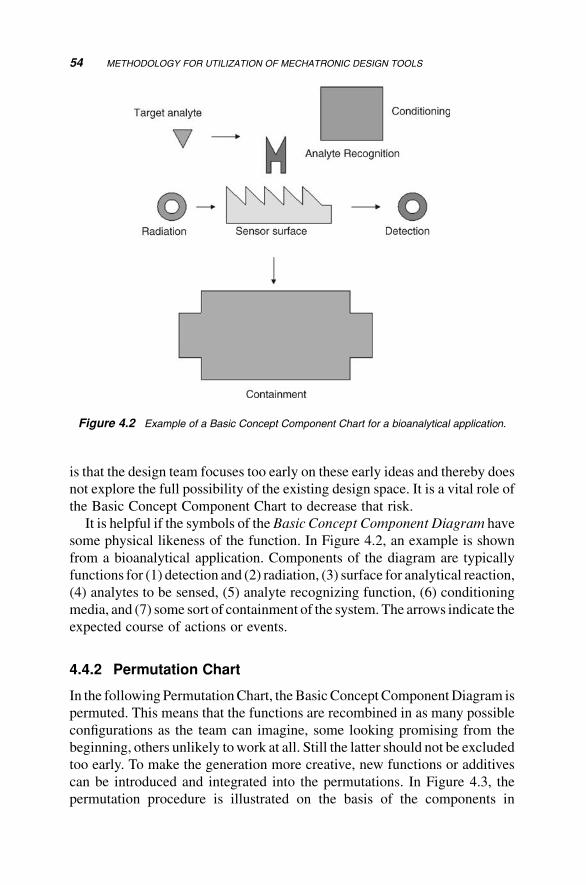
is that the design team focuses too early on these early ideas and thereby does
not explore the full possibility of the existing design space. It is a vital role of
the Basic Concept Component Chart to decrease that risk.
It is helpful if the symbols of the Basic Concept Component Diagram have
some physical likeness of the function. In Figure 4.2, an example is shown
from a bioanalytical application. Components of the diagram are typically
functions for (1) detection and (2) radiation, (3) surface for analytical reaction,
(4) analytes to be sensed, (5) analyte recognizing function, (6) conditioning
media, and (7) some sort of containment of the system. The arrows indicate the
expected course of actions or events.
4.4.2 Permutation Chart
In the following PermutationChart, theBasicConcept ComponentDiagram is
permuted. This means that the functions are recombined in as many possible
configurations as the team can imagine, some looking promising from the
beginning, others unlikely towork at all. Still the latter should not be excluded
too early. To make the generation more creative, new functions or additives
can be introduced and integrated into the permutations. In Figure 4.3, the
permutation procedure is illustrated on the basis of the components in
Figure 4.2 Example of a Basic Concept Component Chart for a bioanalytical application.
54 METHODOLOGY FOR UTILIZATION OF MECHATRONIC DESIGN TOOLS
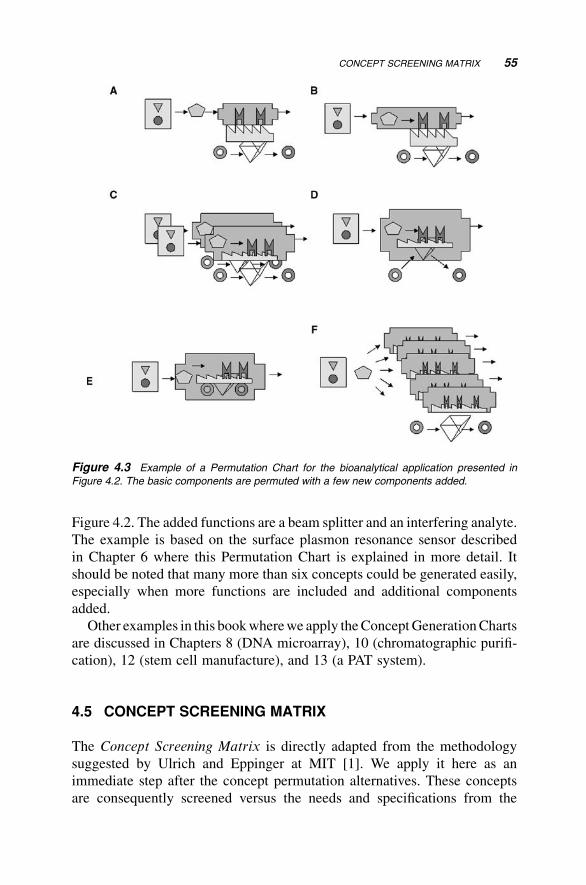
Figure 4.2. The added functions are a beam splitter and an interfering analyte.
The example is based on the surface plasmon resonance sensor described
in Chapter 6 where this Permutation Chart is explained in more detail. It
should be noted that many more than six concepts could be generated easily,
especially when more functions are included and additional components
added.
Other examples in this bookwherewe apply theConceptGenerationCharts
are discussed in Chapters 8 (DNA microarray), 10 (chromatographic purifi-
cation), 12 (stem cell manufacture), and 13 (a PAT system).
4.5 CONCEPT SCREENING MATRIX
The Concept Screening Matrix is directly adapted from the methodology
suggested by Ulrich and Eppinger at MIT [1]. We apply it here as an
immediate step after the concept permutation alternatives. These concepts
are consequently screened versus the needs and specifications from the
Figure 4.3 Example of a Permutation Chart for the bioanalytical application presented in
Figure 4.2. The basic components are permuted with a few new components added.
CONCEPT SCREENING MATRIX 55
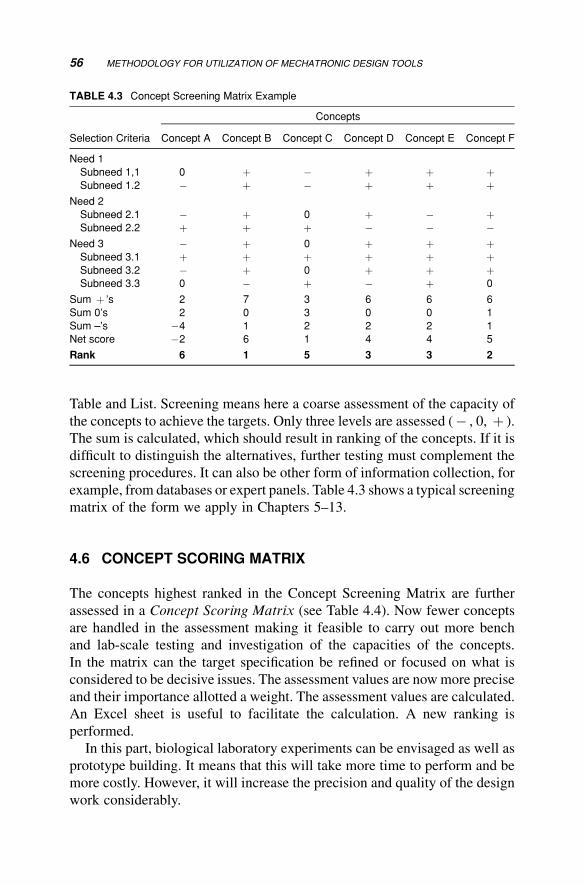
Table and List. Screening means here a coarse assessment of the capacity of
the concepts to achieve the targets. Only three levels are assessed (� , 0, þ ).
The sum is calculated, which should result in ranking of the concepts. If it is
difficult to distinguish the alternatives, further testing must complement the
screening procedures. It can also be other form of information collection, for
example, from databases or expert panels. Table 4.3 shows a typical screening
matrix of the form we apply in Chapters 5–13.
4.6 CONCEPT SCORING MATRIX
The concepts highest ranked in the Concept Screening Matrix are further
assessed in a Concept Scoring Matrix (see Table 4.4). Now fewer concepts
are handled in the assessment making it feasible to carry out more bench
and lab-scale testing and investigation of the capacities of the concepts.
In the matrix can the target specification be refined or focused on what is
considered to be decisive issues. The assessment values are nowmore precise
and their importance allotted a weight. The assessment values are calculated.
An Excel sheet is useful to facilitate the calculation. A new ranking is
performed.
In this part, biological laboratory experiments can be envisaged as well as
prototype building. It means that this will take more time to perform and be
more costly. However, it will increase the precision and quality of the design
work considerably.
TABLE 4.3 Concept Screening Matrix Example
Concepts
Selection Criteria Concept A Concept B Concept C Concept D Concept E Concept F
Need 1
Subneed 1,1 0 þ � þ þ þSubneed 1.2 � þ � þ þ þ
Need 2
Subneed 2.1 � þ 0 þ � þSubneed 2.2 þ þ þ � � �
Need 3 � þ 0 þ þ þSubneed 3.1 þ þ þ þ þ þSubneed 3.2 � þ 0 þ þ þSubneed 3.3 0 � þ � þ 0
Sum þ ’s 2 7 3 6 6 6
Sum 0’s 2 0 3 0 0 1
Sum –’s �4 1 2 2 2 1
Net score �2 6 1 4 4 5
Rank 6 1 5 3 3 2
56 METHODOLOGY FOR UTILIZATION OF MECHATRONIC DESIGN TOOLS
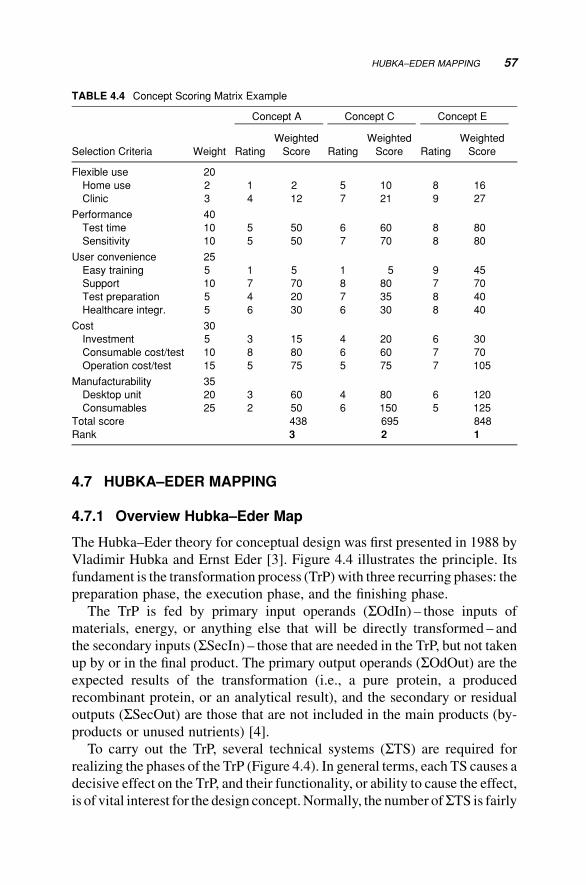
4.7 HUBKA–EDER MAPPING
4.7.1 Overview Hubka–Eder Map
The Hubka–Eder theory for conceptual design was first presented in 1988 by
Vladimir Hubka and Ernst Eder [3]. Figure 4.4 illustrates the principle. Its
fundament is the transformation process (TrP) with three recurring phases: the
preparation phase, the execution phase, and the finishing phase.
The TrP is fed by primary input operands (SOdIn) – those inputs of
materials, energy, or anything else that will be directly transformed – and
the secondary inputs (SSecIn) – those that are needed in the TrP, but not takenup by or in the final product. The primary output operands (SOdOut) are theexpected results of the transformation (i.e., a pure protein, a produced
recombinant protein, or an analytical result), and the secondary or residual
outputs (SSecOut) are those that are not included in the main products (by-
products or unused nutrients) [4].
To carry out the TrP, several technical systems (STS) are required for
realizing the phases of the TrP (Figure 4.4). In general terms, each TS causes a
decisive effect on the TrP, and their functionality, or ability to cause the effect,
is of vital interest for the design concept.Normally, the number ofSTS is fairly
TABLE 4.4 Concept Scoring Matrix Example
Concept A Concept C Concept E
Selection Criteria Weight Rating
Weighted
Score Rating
Weighted
Score Rating
Weighted
Score
Flexible use 20
Home use 2 1 2 5 10 8 16
Clinic 3 4 12 7 21 9 27
Performance 40
Test time 10 5 50 6 60 8 80
Sensitivity 10 5 50 7 70 8 80
User convenience 25
Easy training 5 1 5 1 5 9 45
Support 10 7 70 8 80 7 70
Test preparation 5 4 20 7 35 8 40
Healthcare integr. 5 6 30 6 30 8 40
Cost 30
Investment 5 3 15 4 20 6 30
Consumable cost/test 10 8 80 6 60 7 70
Operation cost/test 15 5 75 5 75 7 105
Manufacturability 35
Desktop unit 20 3 60 4 80 6 120
Consumables 25 2 50 6 150 5 125
Total score 438 695 848
Rank 3 2 1
HUBKA–EDER MAPPING 57
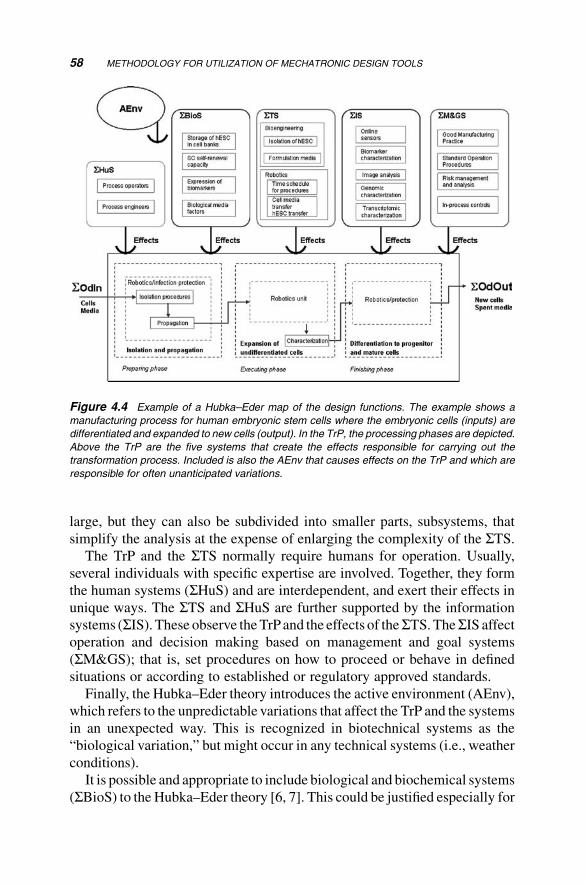
large, but they can also be subdivided into smaller parts, subsystems, that
simplify the analysis at the expense of enlarging the complexity of the STS.The TrP and the STS normally require humans for operation. Usually,
several individuals with specific expertise are involved. Together, they form
the human systems (SHuS) and are interdependent, and exert their effects in
unique ways. The STS and SHuS are further supported by the information
systems (SIS). These observe theTrPand the effects of theSTS.TheSIS affectoperation and decision making based on management and goal systems
(SM&GS); that is, set procedures on how to proceed or behave in defined
situations or according to established or regulatory approved standards.
Finally, the Hubka–Eder theory introduces the active environment (AEnv),
which refers to the unpredictable variations that affect the TrP and the systems
in an unexpected way. This is recognized in biotechnical systems as the
“biological variation,” but might occur in any technical systems (i.e., weather
conditions).
It is possible and appropriate to include biological and biochemical systems
(SBioS) to the Hubka–Eder theory [6, 7]. This could be justified especially for
Figure 4.4 Example of a Hubka–Eder map of the design functions. The example shows a
manufacturing process for human embryonic stem cells where the embryonic cells (inputs) are
differentiated and expanded to new cells (output). In the TrP, the processing phases are depicted.
Above the TrP are the five systems that create the effects responsible for carrying out the
transformation process. Included is also the AEnv that causes effects on the TrP and which are
responsible for often unanticipated variations.
58 METHODOLOGY FOR UTILIZATION OF MECHATRONIC DESIGN TOOLS
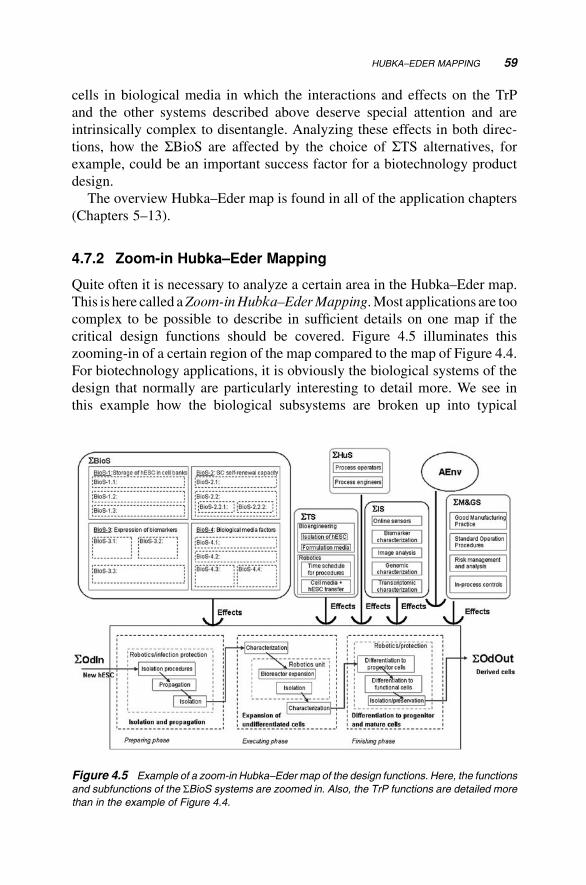
cells in biological media in which the interactions and effects on the TrP
and the other systems described above deserve special attention and are
intrinsically complex to disentangle. Analyzing these effects in both direc-
tions, how the SBioS are affected by the choice of STS alternatives, for
example, could be an important success factor for a biotechnology product
design.
The overview Hubka–Eder map is found in all of the application chapters
(Chapters 5–13).
4.7.2 Zoom-in Hubka–Eder Mapping
Quite often it is necessary to analyze a certain area in the Hubka–Eder map.
This is here called aZoom-inHubka–EderMapping.Most applications are too
complex to be possible to describe in sufficient details on one map if the
critical design functions should be covered. Figure 4.5 illuminates this
zooming-in of a certain region of the map compared to the map of Figure 4.4.
For biotechnology applications, it is obviously the biological systems of the
design that normally are particularly interesting to detail more. We see in
this example how the biological subsystems are broken up into typical
Figure 4.5 Example of a zoom-in Hubka–Eder map of the design functions. Here, the functions
and subfunctions of the SBioS systems are zoomed in. Also, the TrP functions are detailed more
than in the example of Figure 4.4.
HUBKA–EDER MAPPING 59
biomolecular or cell biological functions. For example, the second biological
system (BioS-2) stem cell self-renewal capacity is broken up into the
subsystems1 BioS-2.1 and BioS-2.2. The BioS-2.2 is further broken down
into the subsystems2 BioS-2.2.1 and BioS-2.2.2.
The zoom-in Hubka–Eder mapping is found in the applications of
Chapters 6 (for detailed design of fluidics and immobilization), 9 (for
detailed design of bioreactor parts), 10 (for special cases of micropurifica-
tion and FVIII large-scale purification), and 13 (for details in the PAT
systems design).
4.8 FUNCTIONS INTERACTION MATRIX
The Hubka–Eder mapping contains an essential description of the function-
ality of the design. But the most valuable contributions of the maps are in
visualizing the interactions between the systems and howdifferent subsystems
can influence the functions of the transformation process. In this book, we use
two types of interaction matrices: (1) those with the main objective of
elucidating the interaction between the systems and the subsystems per se
and (2) those that elucidate the interactions between the systems, on the one
hand, and the transformation process steps on the other. These are discussed in
brief in the following sections.
4.8.1 Functions Interaction Matrix for Systems and Subsystems
By placing the same system items, including subsystems, on both axes of
the matrix (X and Y), each interaction can be identified at the different x/y-
coordinates.Note that in amatrix thex–y pair appears twice, either on the right
or on the left side of the diagonal axis of the matrix. These positions are not
equal. The right side shows the x-item’s effect on the y-item and left side
shows the y-item’s effect on the x-item. These effects may be very different in
a design structure.
With FIM for systems and subsystems only the interactions between
these are analyzed. Figure 4.6 shows an example from a bioreactor design
case.
Figure 4.6 shows thematrix based on theSBioS andSTS of the Hubka–Edermap. The matrix has three levels of systems: the main systems and the first and
second levels of subsystems. By not including all systems in the matrix, more
spaceisleftformoredetailsbygoingfurtherdowninlevels.Thisissomethingthat
is of great value for those systems that have the highest degree of complexity.
We apply this type of FIM in the design cases of blood glucose sensors
(Chapter 5) and bioreactors (Chapter 9).
60 METHODOLOGY FOR UTILIZATION OF MECHATRONIC DESIGN TOOLS
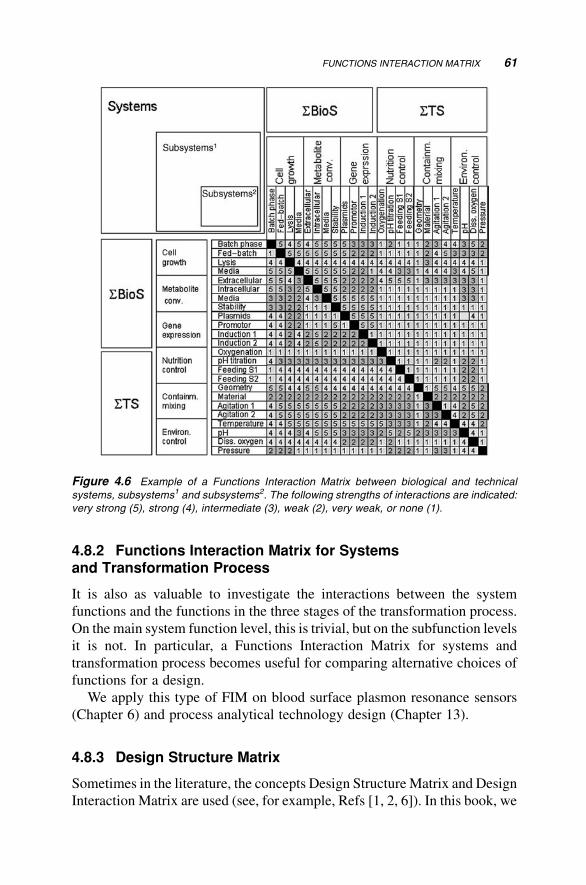
4.8.2 Functions Interaction Matrix for Systemsand Transformation Process
It is also as valuable to investigate the interactions between the system
functions and the functions in the three stages of the transformation process.
On the main system function level, this is trivial, but on the subfunction levels
it is not. In particular, a Functions Interaction Matrix for systems and
transformation process becomes useful for comparing alternative choices of
functions for a design.
We apply this type of FIM on blood surface plasmon resonance sensors
(Chapter 6) and process analytical technology design (Chapter 13).
4.8.3 Design Structure Matrix
Sometimes in the literature, the concepts Design Structure Matrix and Design
Interaction Matrix are used (see, for example, Refs [1, 2, 6]). In this book, we
Figure 4.6 Example of a Functions Interaction Matrix between biological and technical
systems, subsystems1 and subsystems2. The following strengths of interactions are indicated:
very strong (5), strong (4), intermediate (3), weak (2), very weak, or none (1).
FUNCTIONS INTERACTION MATRIX 61
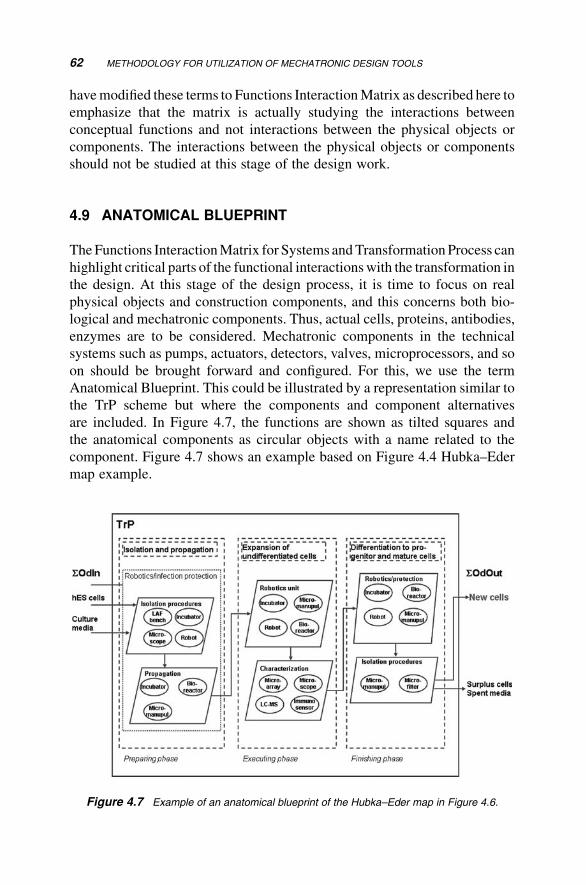
havemodified these terms to Functions InteractionMatrix as described here to
emphasize that the matrix is actually studying the interactions between
conceptual functions and not interactions between the physical objects or
components. The interactions between the physical objects or components
should not be studied at this stage of the design work.
4.9 ANATOMICAL BLUEPRINT
TheFunctions InteractionMatrix for Systems andTransformation Process can
highlight critical parts of the functional interactionswith the transformation in
the design. At this stage of the design process, it is time to focus on real
physical objects and construction components, and this concerns both bio-
logical and mechatronic components. Thus, actual cells, proteins, antibodies,
enzymes are to be considered. Mechatronic components in the technical
systems such as pumps, actuators, detectors, valves, microprocessors, and so
on should be brought forward and configured. For this, we use the term
Anatomical Blueprint. This could be illustrated by a representation similar to
the TrP scheme but where the components and component alternatives
are included. In Figure 4.7, the functions are shown as tilted squares and
the anatomical components as circular objects with a name related to the
component. Figure 4.7 shows an example based on Figure 4.4 Hubka–Eder
map example.
Figure 4.7 Example of an anatomical blueprint of the Hubka–Eder map in Figure 4.6.
62 METHODOLOGY FOR UTILIZATION OF MECHATRONIC DESIGN TOOLS
4.10 CONCLUSIONS
This chapter has introduced the reader to a number of design tools for
mechatronic design. The original tools are general, but they are adapted for
biomechatronic applications in this chapter. The purpose of all the tools is to
structure the design task. Furthermore, this chapter also describes an overall
methodology for how to utilize these design tools in a structured manner in
biomechatronic design applications. This will facilitate for the design team to
organize the design work and to communicate.
All the design tools described are not necessary to be used for each design
task. It is up to the designers to make the choice and to realize which tools are
appropriate for a particular task.
In the design cases discussed in this book, the designmethodology and tools
are exploited and demonstrated.
REFERENCES
1. Ulrich,K.T., Eppinger, S.D. (2008)ProductDesign andDevelopment, 4th edition,
McGraw-Hill, New York.
2. Pahl, G., Beitz,W. (1996) Engineering Design: A Systematic Approach, Springer-
Verlag, Berlin.
3. Hubka, V., Eder, W.E. (1988) Theory of Technical Systems: A Total Concept
Theory for Engineering Design, Springer, Berlin.
4. Hubka, V., Eder, W.E. (1996) Design Science, Springer, Berlin.
5. Mandenius, C.F., Bj€orkman, M. (2010) Mechatronics design principles for
biotechnology product development. Trend. Biotechnol. 28(5), 230–236.
6. Hubka, V., Andreasen, M.M., Eder, W.E. (1988) Practical Studies in Systematic
Design, Butterworths & Co. Ltd., London, UK.
7. Derel€ov, M., Detterfelt, J., Bj€orkman, M., Mandenius, C.F. (2008) Engineering
design methodology for bio-mechatronic products. Biotechnol. Prog. 24,
232–244.
8. Mandenius, C.F., Derel€ov, M., Detterfelt, J., Bj€orkman, M. (2007) Process
analytical technology and design science. Eur. Pharm. Rev. 12, 74–80.
REFERENCES 63


Part IIApplications

5Blood Glucose Sensors
This chapter discusses the design of blood glucose sensors. First, a basic
background is given on clinical glucose testing and the diagnostic methods
that are applied (Section 5.1). Then the needs of blood glucose analyzers are
thoroughly specified (Section 5.2). Finally, these specified needs are used to
develop new design solutions to blood glucose sensors (Sections 5.3 and 5.4).
5.1 BACKGROUND OF BLOOD GLUCOSE ANALYSIS
Blood glucose analysis is one of the most common tests in clinics, doctor’s
offices, and in homecare. Themain utility for measuring glucose in blood is to
support the treatment of diabetic patients, monitoring of patients under
intensive care, and to detect states of hyper- or hypoglycemia.
Clinical glucose analysis is based on enzymatic conversion of the glucose
in blood samples followed by detection using either spectrophotometric
or electrode-based methods. Well-established laboratory methods are the
Cobas-Bio centrifugal analyzer (Roche Diagnostics) and the YSI enzyme
electrode method (YSI Model 23 AM, Yellow Spring Instruments, OH).
Biomechatronic Design in Biotechnology: A Methodology for Development ofBiotechnological Products, First Edition. Carl-Fredrik Mandenius and Mats Bj€orkman.� 2011 John Wiley & Sons, Inc. Published 2011 by John Wiley & Sons, Inc.
67
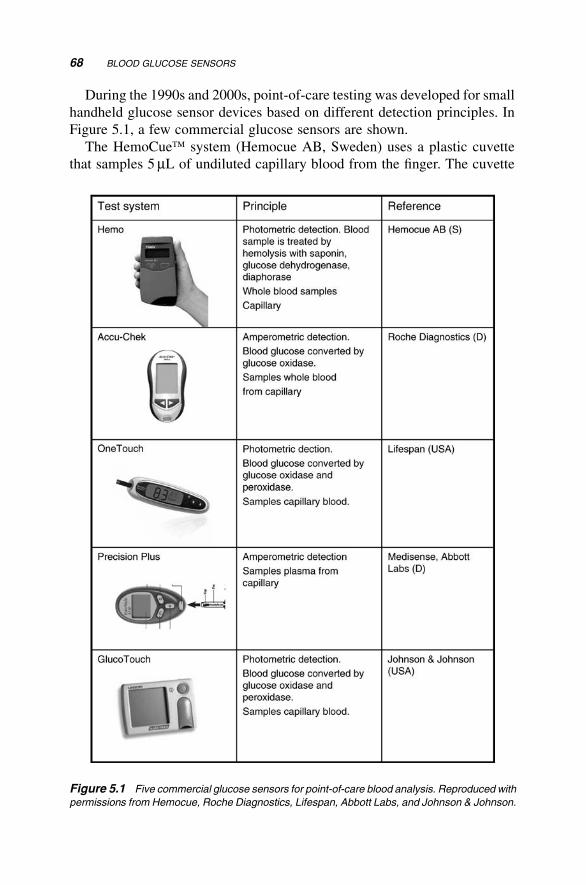
During the 1990s and 2000s, point-of-care testing was developed for small
handheld glucose sensor devices based on different detection principles. In
Figure 5.1, a few commercial glucose sensors are shown.
The HemoCue� system (Hemocue AB, Sweden) uses a plastic cuvette
that samples 5mL of undiluted capillary blood from the finger. The cuvette
Figure 5.1 Five commercial glucose sensors for point-of-care blood analysis. Reproduced with
permissions from Hemocue, Roche Diagnostics, Lifespan, Abbott Labs, and Johnson & Johnson.
68 BLOOD GLUCOSE SENSORS
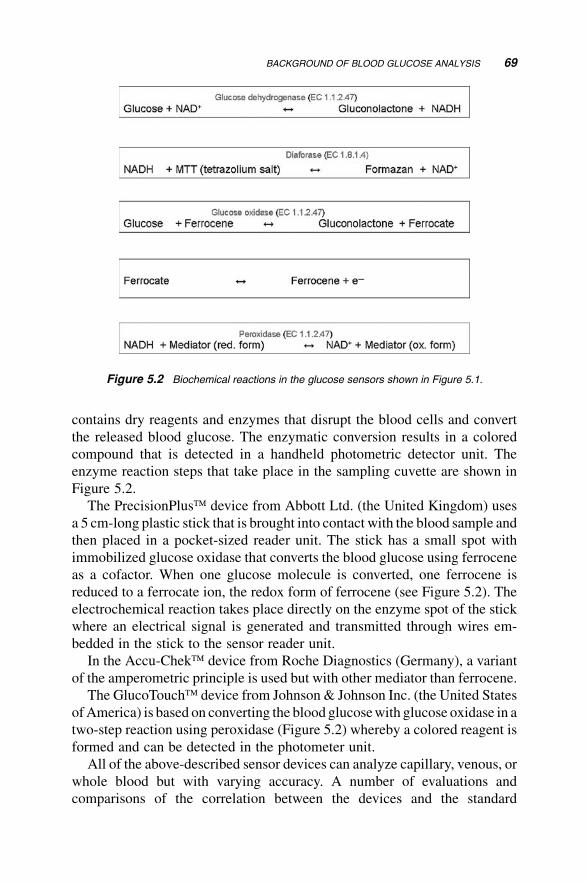
contains dry reagents and enzymes that disrupt the blood cells and convert
the released blood glucose. The enzymatic conversion results in a colored
compound that is detected in a handheld photometric detector unit. The
enzyme reaction steps that take place in the sampling cuvette are shown in
Figure 5.2.
The PrecisionPlus� device from Abbott Ltd. (the United Kingdom) uses
a 5 cm-long plastic stick that is brought into contact with the blood sample and
then placed in a pocket-sized reader unit. The stick has a small spot with
immobilized glucose oxidase that converts the blood glucose using ferrocene
as a cofactor. When one glucose molecule is converted, one ferrocene is
reduced to a ferrocate ion, the redox form of ferrocene (see Figure 5.2). The
electrochemical reaction takes place directly on the enzyme spot of the stick
where an electrical signal is generated and transmitted through wires em-
bedded in the stick to the sensor reader unit.
In the Accu-Chek� device from Roche Diagnostics (Germany), a variant
of the amperometric principle is used but with other mediator than ferrocene.
The GlucoTouch� device from Johnson & Johnson Inc. (the United States
ofAmerica) is based on converting the blood glucosewith glucose oxidase in a
two-step reaction using peroxidase (Figure 5.2) whereby a colored reagent is
formed and can be detected in the photometer unit.
All of the above-described sensor devices can analyze capillary, venous, or
whole blood but with varying accuracy. A number of evaluations and
comparisons of the correlation between the devices and the standard
Figure 5.2 Biochemical reactions in the glucose sensors shown in Figure 5.1.
BACKGROUND OF BLOOD GLUCOSE ANALYSIS 69
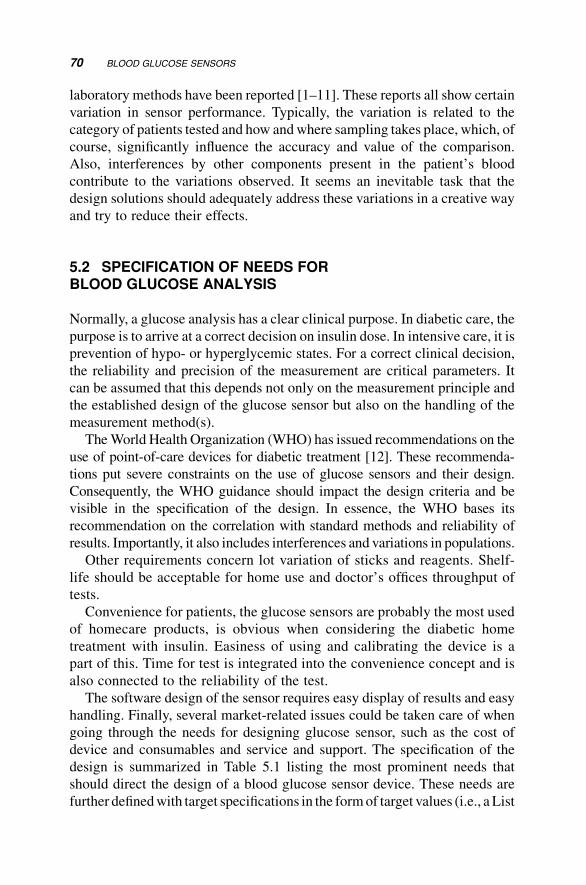
laboratory methods have been reported [1–11]. These reports all show certain
variation in sensor performance. Typically, the variation is related to the
category of patients tested and how andwhere sampling takes place, which, of
course, significantly influence the accuracy and value of the comparison.
Also, interferences by other components present in the patient’s blood
contribute to the variations observed. It seems an inevitable task that the
design solutions should adequately address these variations in a creative way
and try to reduce their effects.
5.2 SPECIFICATION OF NEEDS FORBLOOD GLUCOSE ANALYSIS
Normally, a glucose analysis has a clear clinical purpose. In diabetic care, the
purpose is to arrive at a correct decision on insulin dose. In intensive care, it is
prevention of hypo- or hyperglycemic states. For a correct clinical decision,
the reliability and precision of the measurement are critical parameters. It
can be assumed that this depends not only on the measurement principle and
the established design of the glucose sensor but also on the handling of the
measurement method(s).
TheWorld Health Organization (WHO) has issued recommendations on the
use of point-of-care devices for diabetic treatment [12]. These recommenda-
tions put severe constraints on the use of glucose sensors and their design.
Consequently, the WHO guidance should impact the design criteria and be
visible in the specification of the design. In essence, the WHO bases its
recommendation on the correlation with standard methods and reliability of
results. Importantly, it also includes interferences and variations in populations.
Other requirements concern lot variation of sticks and reagents. Shelf-
life should be acceptable for home use and doctor’s offices throughput of
tests.
Convenience for patients, the glucose sensors are probably the most used
of homecare products, is obvious when considering the diabetic home
treatment with insulin. Easiness of using and calibrating the device is a
part of this. Time for test is integrated into the convenience concept and is
also connected to the reliability of the test.
The software design of the sensor requires easy display of results and easy
handling. Finally, several market-related issues could be taken care of when
going through the needs for designing glucose sensor, such as the cost of
device and consumables and service and support. The specification of the
design is summarized in Table 5.1 listing the most prominent needs that
should direct the design of a blood glucose sensor device. These needs are
further definedwith target specifications in the formof target values (i.e., a List
70 BLOOD GLUCOSE SENSORS
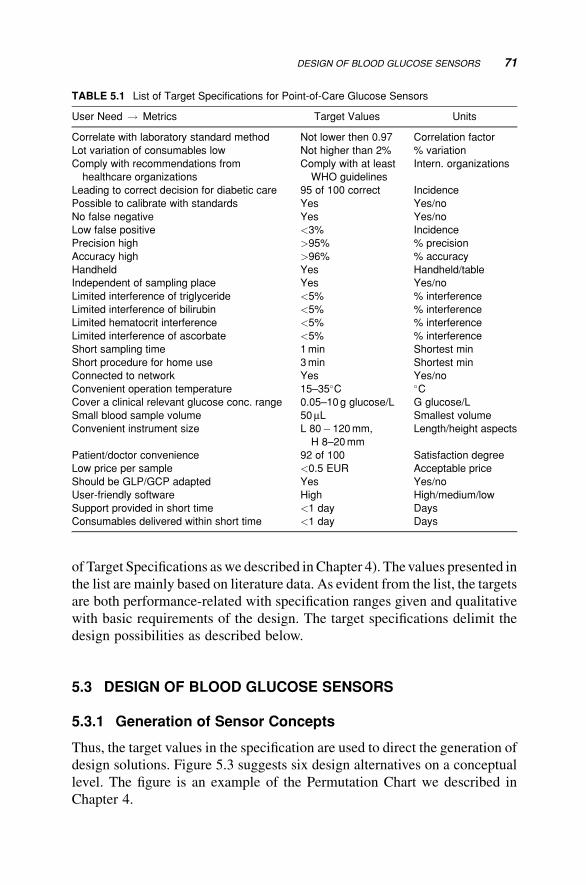
of Target Specifications aswe described in Chapter 4). The values presented in
the list are mainly based on literature data. As evident from the list, the targets
are both performance-related with specification ranges given and qualitative
with basic requirements of the design. The target specifications delimit the
design possibilities as described below.
5.3 DESIGN OF BLOOD GLUCOSE SENSORS
5.3.1 Generation of Sensor Concepts
Thus, the target values in the specification are used to direct the generation of
design solutions. Figure 5.3 suggests six design alternatives on a conceptual
level. The figure is an example of the Permutation Chart we described in
Chapter 4.
TABLE 5.1 List of Target Specifications for Point-of-Care Glucose Sensors
User Need ! Metrics Target Values Units
Correlate with laboratory standard method Not lower then 0.97 Correlation factor
Lot variation of consumables low Not higher than 2% % variation
Comply with recommendations from
healthcare organizations
Comply with at least
WHO guidelines
Intern. organizations
Leading to correct decision for diabetic care 95 of 100 correct Incidence
Possible to calibrate with standards Yes Yes/no
No false negative Yes Yes/no
Low false positive <3% Incidence
Precision high >95% % precision
Accuracy high >96% % accuracy
Handheld Yes Handheld/table
Independent of sampling place Yes Yes/no
Limited interference of triglyceride <5% % interference
Limited interference of bilirubin <5% % interference
Limited hematocrit interference <5% % interference
Limited interference of ascorbate <5% % interference
Short sampling time 1min Shortest min
Short procedure for home use 3min Shortest min
Connected to network Yes Yes/no
Convenient operation temperature 15–35�C �CCover a clinical relevant glucose conc. range 0.05–10g glucose/L G glucose/L
Small blood sample volume 50mL Smallest volume
Convenient instrument size L 80�120mm,
H 8–20mm
Length/height aspects
Patient/doctor convenience 92 of 100 Satisfaction degree
Low price per sample <0.5 EUR Acceptable price
Should be GLP/GCP adapted Yes Yes/no
User-friendly software High High/medium/low
Support provided in short time <1 day Days
Consumables delivered within short time <1 day Days
DESIGN OF BLOOD GLUCOSE SENSORS 71
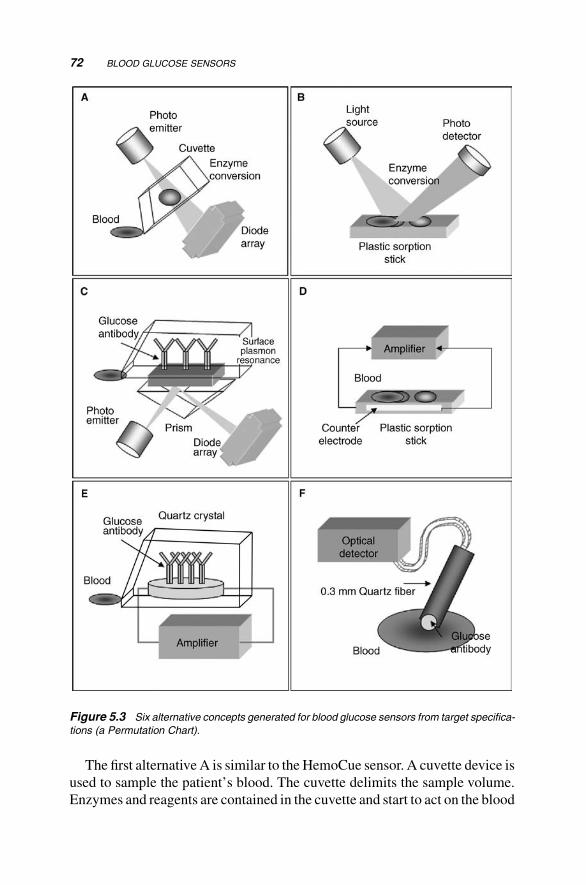
The first alternativeA is similar to the HemoCue sensor. A cuvette device is
used to sample the patient’s blood. The cuvette delimits the sample volume.
Enzymes and reagents are contained in the cuvette and start to act on the blood
Figure 5.3 Six alternative concepts generated for blood glucose sensors from target specifica-
tions (a Permutation Chart).
72 BLOOD GLUCOSE SENSORS
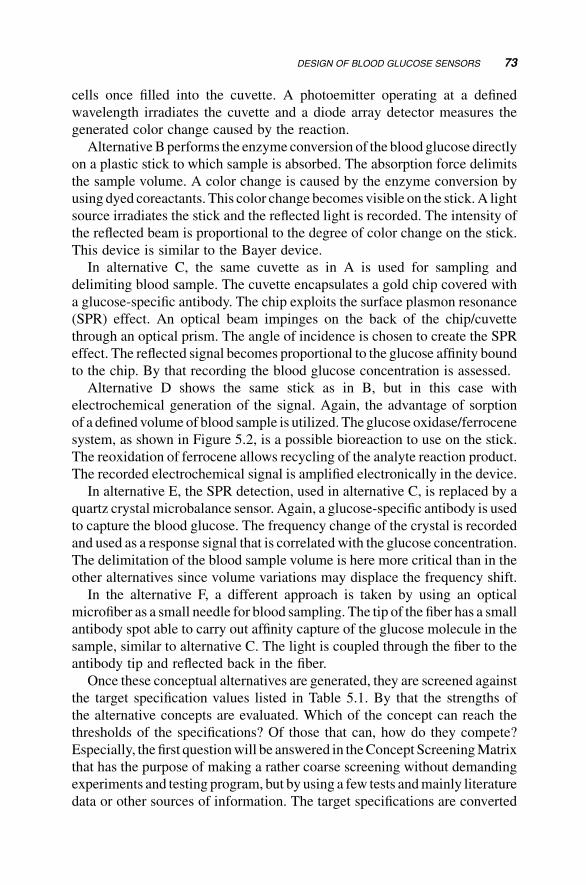
cells once filled into the cuvette. A photoemitter operating at a defined
wavelength irradiates the cuvette and a diode array detector measures the
generated color change caused by the reaction.
AlternativeBperforms the enzyme conversion of the blood glucose directly
on a plastic stick to which sample is absorbed. The absorption force delimits
the sample volume. A color change is caused by the enzyme conversion by
using dyed coreactants. This color change becomes visible on the stick.A light
source irradiates the stick and the reflected light is recorded. The intensity of
the reflected beam is proportional to the degree of color change on the stick.
This device is similar to the Bayer device.
In alternative C, the same cuvette as in A is used for sampling and
delimiting blood sample. The cuvette encapsulates a gold chip covered with
a glucose-specific antibody. The chip exploits the surface plasmon resonance
(SPR) effect. An optical beam impinges on the back of the chip/cuvette
through an optical prism. The angle of incidence is chosen to create the SPR
effect. The reflected signal becomes proportional to the glucose affinity bound
to the chip. By that recording the blood glucose concentration is assessed.
Alternative D shows the same stick as in B, but in this case with
electrochemical generation of the signal. Again, the advantage of sorption
of a defined volume of blood sample is utilized. The glucose oxidase/ferrocene
system, as shown in Figure 5.2, is a possible bioreaction to use on the stick.
The reoxidation of ferrocene allows recycling of the analyte reaction product.
The recorded electrochemical signal is amplified electronically in the device.
In alternative E, the SPR detection, used in alternative C, is replaced by a
quartz crystal microbalance sensor. Again, a glucose-specific antibody is used
to capture the blood glucose. The frequency change of the crystal is recorded
and used as a response signal that is correlated with the glucose concentration.
The delimitation of the blood sample volume is here more critical than in the
other alternatives since volume variations may displace the frequency shift.
In the alternative F, a different approach is taken by using an optical
microfiber as a small needle for blood sampling. The tip of the fiber has a small
antibody spot able to carry out affinity capture of the glucose molecule in the
sample, similar to alternative C. The light is coupled through the fiber to the
antibody tip and reflected back in the fiber.
Once these conceptual alternatives are generated, they are screened against
the target specification values listed in Table 5.1. By that the strengths of
the alternative concepts are evaluated. Which of the concept can reach the
thresholds of the specifications? Of those that can, how do they compete?
Especially, the first questionwill be answered in theConcept ScreeningMatrix
that has the purpose of making a rather coarse screening without demanding
experiments and testing program, but by using a few tests andmainly literature
data or other sources of information. The target specifications are converted
DESIGN OF BLOOD GLUCOSE SENSORS 73
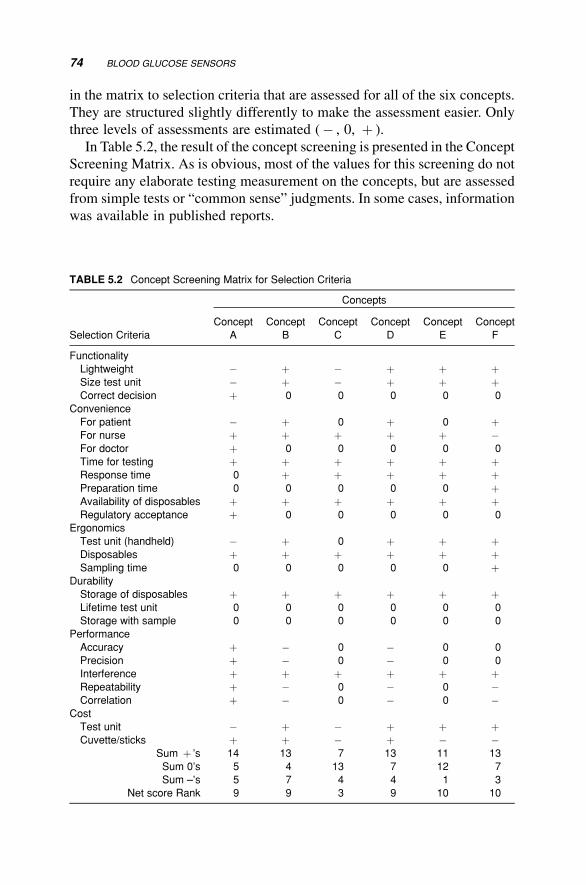
in the matrix to selection criteria that are assessed for all of the six concepts.
They are structured slightly differently to make the assessment easier. Only
three levels of assessments are estimated (� , 0, þ ).
In Table 5.2, the result of the concept screening is presented in the Concept
Screening Matrix. As is obvious, most of the values for this screening do not
require any elaborate testing measurement on the concepts, but are assessed
from simple tests or “common sense” judgments. In some cases, information
was available in published reports.
TABLE 5.2 Concept Screening Matrix for Selection Criteria
Concepts
Selection Criteria
Concept
A
Concept
B
Concept
C
Concept
D
Concept
E
Concept
F
Functionality
Lightweight � þ � þ þ þSize test unit � þ � þ þ þCorrect decision þ 0 0 0 0 0
Convenience
For patient � þ 0 þ 0 þFor nurse þ þ þ þ þ �For doctor þ 0 0 0 0 0
Time for testing þ þ þ þ þ þResponse time 0 þ þ þ þ þPreparation time 0 0 0 0 0 þAvailability of disposables þ þ þ þ þ þRegulatory acceptance þ 0 0 0 0 0
Ergonomics
Test unit (handheld) � þ 0 þ þ þDisposables þ þ þ þ þ þSampling time 0 0 0 0 0 þ
Durability
Storage of disposables þ þ þ þ þ þLifetime test unit 0 0 0 0 0 0
Storage with sample 0 0 0 0 0 0
Performance
Accuracy þ � 0 � 0 0
Precision þ � 0 � 0 0
Interference þ þ þ þ þ þRepeatability þ � 0 � 0 �Correlation þ � 0 � 0 �
Cost
Test unit � þ � þ þ þCuvette/sticks þ þ � þ � �
Sum þ ’s 14 13 7 13 11 13
Sum 0’s 5 4 13 7 12 7
Sum –’s 5 7 4 4 1 3
Net score Rank 9 9 3 9 10 10
74 BLOOD GLUCOSE SENSORS
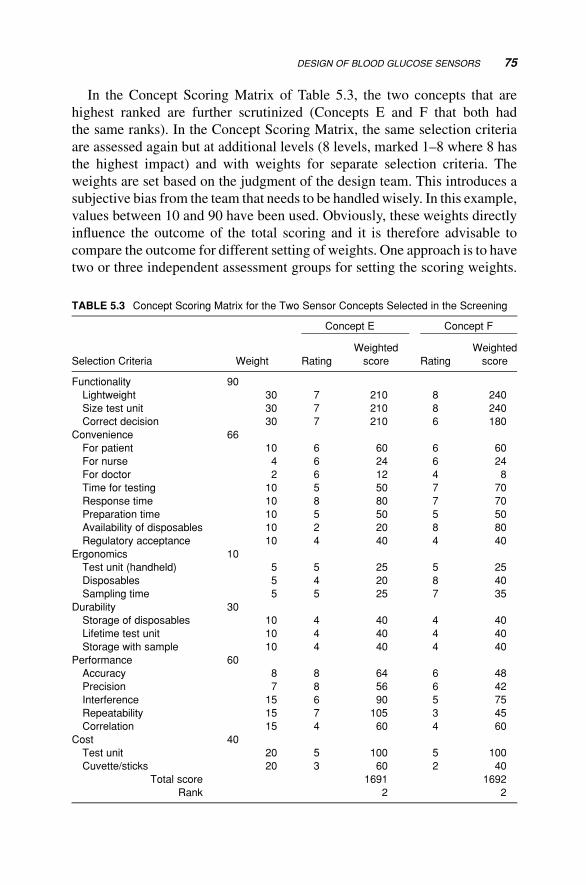
In the Concept Scoring Matrix of Table 5.3, the two concepts that are
highest ranked are further scrutinized (Concepts E and F that both had
the same ranks). In the Concept Scoring Matrix, the same selection criteria
are assessed again but at additional levels (8 levels, marked 1–8 where 8 has
the highest impact) and with weights for separate selection criteria. The
weights are set based on the judgment of the design team. This introduces a
subjective bias from the team that needs to be handled wisely. In this example,
values between 10 and 90 have been used. Obviously, these weights directly
influence the outcome of the total scoring and it is therefore advisable to
compare the outcome for different setting of weights. One approach is to have
two or three independent assessment groups for setting the scoring weights.
TABLE 5.3 Concept Scoring Matrix for the Two Sensor Concepts Selected in the Screening
Concept E Concept F
Selection Criteria Weight Rating
Weighted
score Rating
Weighted
score
Functionality 90
Lightweight 30 7 210 8 240
Size test unit 30 7 210 8 240
Correct decision 30 7 210 6 180
Convenience 66
For patient 10 6 60 6 60
For nurse 4 6 24 6 24
For doctor 2 6 12 4 8
Time for testing 10 5 50 7 70
Response time 10 8 80 7 70
Preparation time 10 5 50 5 50
Availability of disposables 10 2 20 8 80
Regulatory acceptance 10 4 40 4 40
Ergonomics 10
Test unit (handheld) 5 5 25 5 25
Disposables 5 4 20 8 40
Sampling time 5 5 25 7 35
Durability 30
Storage of disposables 10 4 40 4 40
Lifetime test unit 10 4 40 4 40
Storage with sample 10 4 40 4 40
Performance 60
Accuracy 8 8 64 6 48
Precision 7 8 56 6 42
Interference 15 6 90 5 75
Repeatability 15 7 105 3 45
Correlation 15 4 60 4 60
Cost 40
Test unit 20 5 100 5 100
Cuvette/sticks 20 3 60 2 40
Total score 1691 1692
Rank 2 2
DESIGN OF BLOOD GLUCOSE SENSORS 75
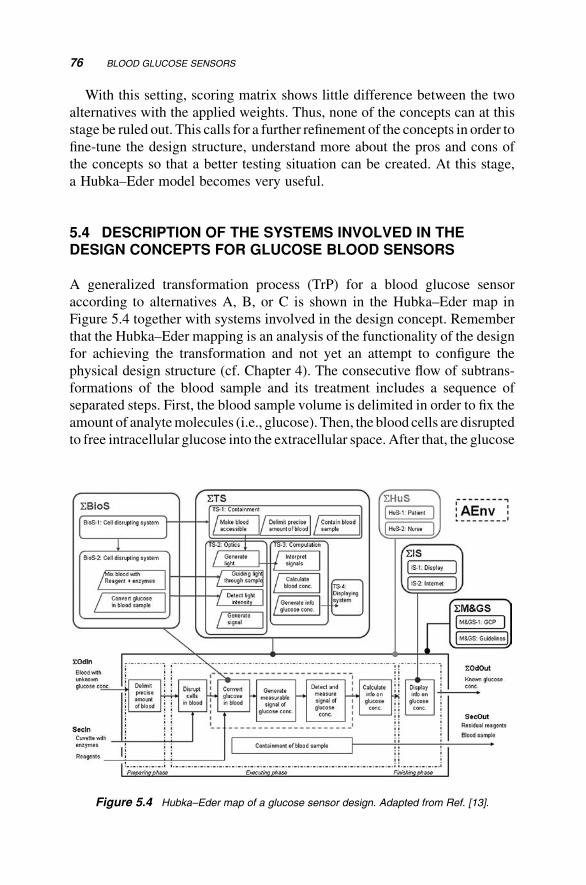
With this setting, scoring matrix shows little difference between the two
alternatives with the applied weights. Thus, none of the concepts can at this
stage be ruled out. This calls for a further refinement of the concepts in order to
fine-tune the design structure, understand more about the pros and cons of
the concepts so that a better testing situation can be created. At this stage,
a Hubka–Eder model becomes very useful.
5.4 DESCRIPTION OF THE SYSTEMS INVOLVED IN THEDESIGN CONCEPTS FOR GLUCOSE BLOOD SENSORS
A generalized transformation process (TrP) for a blood glucose sensor
according to alternatives A, B, or C is shown in the Hubka–Eder map in
Figure 5.4 together with systems involved in the design concept. Remember
that the Hubka–Eder mapping is an analysis of the functionality of the design
for achieving the transformation and not yet an attempt to configure the
physical design structure (cf. Chapter 4). The consecutive flow of subtrans-
formations of the blood sample and its treatment includes a sequence of
separated steps. First, the blood sample volume is delimited in order to fix the
amount of analytemolecules (i.e., glucose). Then, the blood cells are disrupted
to free intracellular glucose into the extracellular space. After that, the glucose
Figure 5.4 Hubka–Eder map of a glucose sensor design. Adapted from Ref. [13].
76 BLOOD GLUCOSE SENSORS
is enzymatically converted to molecules suitable for detection. This is
followed by the generation of a signal from these molecules, which reflects
the number of glucose molecules. Subsequently, this signal is measured and
the glucose concentration in the sampled volume is calculated. Finally, the
calculation is displayed for the user. Note the strict function description of the
subtransformation steps. The order of the steps could be changed, but actually
not very much if the purpose of the design should be met. Note also that an
additional subtransformation step, containment of the blood sample, is placed
separate. This is because this step may be realized in different ways.
The various systems that provide the functions for effectuating the trans-
formation are discussed in the following sections.
5.4.1 Biological Systems
The necessary biological and biochemical systems (SBioS) for carrying out
the TrP are enzymes and the red blood cells themselves. Contacting of blood
with active reagents, either by a transport into the cells or by disruption of
the cells depends on the cellular properties (cell wall, cell membrane, and
diffusion conditions). The result of this is a mixture of cell components,
including the glucose molecules, and the reagents. The glucose analytes
may be entrapped by cellular components (e.g., membrane residues,
nondisrupted organelles). This emphasizes that the blood cell itself takes
an active part in influencing the transformation and requires thorough
consideration.
The reagents are here thought to be either enzymes or glucose-specific
antibodies. Figure 5.2 has given a few common enzymes used for converting
glucose in analytical assays.However, froma functional perspective also other
reaction routes justify considerations, for example, the classical colorimetric
dinitrosalicylic acid (DNS) method.
The enzymatic conversions are multistep. Thus, performance, kinetics, and
specificity of the acting enzymes are key design issues. The option of using
recombinant enzymes and protein-engineered enzymes with more favorable
functionality for the glucose assaying is an extendable design challenge.
5.4.2 Technical Systems
The technical systems (STS) to be used for carrying out the TrP are a
combination of sensor and actuator functions and mechanical functions.
A key subsystem is the sampling of the blood. The requirements of this
system are to make the blood accessible, if possible, delimit the sample
volume, protect the sample from adverse reactions or transformations, and
allow detection within the device or through subsequent transformations.
DESCRIPTION OF THE SYSTEMS INVOLVED 77
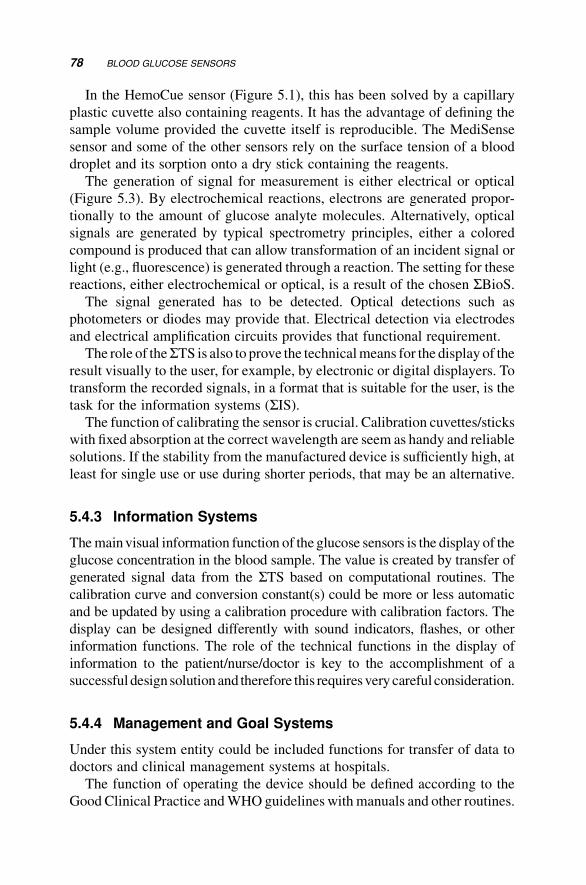
In the HemoCue sensor (Figure 5.1), this has been solved by a capillary
plastic cuvette also containing reagents. It has the advantage of defining the
sample volume provided the cuvette itself is reproducible. The MediSense
sensor and some of the other sensors rely on the surface tension of a blood
droplet and its sorption onto a dry stick containing the reagents.
The generation of signal for measurement is either electrical or optical
(Figure 5.3). By electrochemical reactions, electrons are generated propor-
tionally to the amount of glucose analyte molecules. Alternatively, optical
signals are generated by typical spectrometry principles, either a colored
compound is produced that can allow transformation of an incident signal or
light (e.g., fluorescence) is generated through a reaction. The setting for these
reactions, either electrochemical or optical, is a result of the chosen SBioS.The signal generated has to be detected. Optical detections such as
photometers or diodes may provide that. Electrical detection via electrodes
and electrical amplification circuits provides that functional requirement.
The role of theSTS is also to prove the technicalmeans for the display of the
result visually to the user, for example, by electronic or digital displayers. To
transform the recorded signals, in a format that is suitable for the user, is the
task for the information systems (SIS).The function of calibrating the sensor is crucial. Calibration cuvettes/sticks
with fixed absorption at the correct wavelength are seem as handy and reliable
solutions. If the stability from the manufactured device is sufficiently high, at
least for single use or use during shorter periods, that may be an alternative.
5.4.3 Information Systems
Themainvisual information function of the glucose sensors is the display of the
glucose concentration in the blood sample. The value is created by transfer of
generated signal data from the STS based on computational routines. The
calibration curve and conversion constant(s) could be more or less automatic
and be updated by using a calibration procedure with calibration factors. The
display can be designed differently with sound indicators, flashes, or other
information functions. The role of the technical functions in the display of
information to the patient/nurse/doctor is key to the accomplishment of a
successful design solution and therefore this requires very careful consideration.
5.4.4 Management and Goal Systems
Under this system entity could be included functions for transfer of data to
doctors and clinical management systems at hospitals.
The function of operating the device should be defined according to the
Good Clinical Practice andWHO guidelines with manuals and other routines.
78 BLOOD GLUCOSE SENSORS
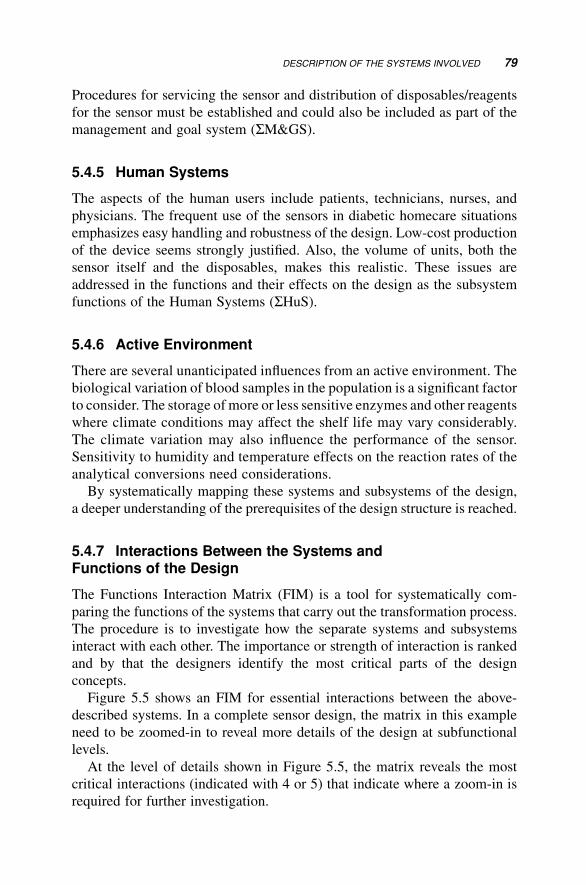
Procedures for servicing the sensor and distribution of disposables/reagents
for the sensor must be established and could also be included as part of the
management and goal system (SM&GS).
5.4.5 Human Systems
The aspects of the human users include patients, technicians, nurses, and
physicians. The frequent use of the sensors in diabetic homecare situations
emphasizes easy handling and robustness of the design. Low-cost production
of the device seems strongly justified. Also, the volume of units, both the
sensor itself and the disposables, makes this realistic. These issues are
addressed in the functions and their effects on the design as the subsystem
functions of the Human Systems (SHuS).
5.4.6 Active Environment
There are several unanticipated influences from an active environment. The
biological variation of blood samples in the population is a significant factor
to consider. The storage of more or less sensitive enzymes and other reagents
where climate conditions may affect the shelf life may vary considerably.
The climate variation may also influence the performance of the sensor.
Sensitivity to humidity and temperature effects on the reaction rates of the
analytical conversions need considerations.
By systematically mapping these systems and subsystems of the design,
a deeper understanding of the prerequisites of the design structure is reached.
5.4.7 Interactions Between the Systems andFunctions of the Design
The Functions Interaction Matrix (FIM) is a tool for systematically com-
paring the functions of the systems that carry out the transformation process.
The procedure is to investigate how the separate systems and subsystems
interact with each other. The importance or strength of interaction is ranked
and by that the designers identify the most critical parts of the design
concepts.
Figure 5.5 shows an FIM for essential interactions between the above-
described systems. In a complete sensor design, the matrix in this example
need to be zoomed-in to reveal more details of the design at subfunctional
levels.
At the level of details shown in Figure 5.5, the matrix reveals the most
critical interactions (indicated with 4 or 5) that indicate where a zoom-in is
required for further investigation.
DESCRIPTION OF THE SYSTEMS INVOLVED 79
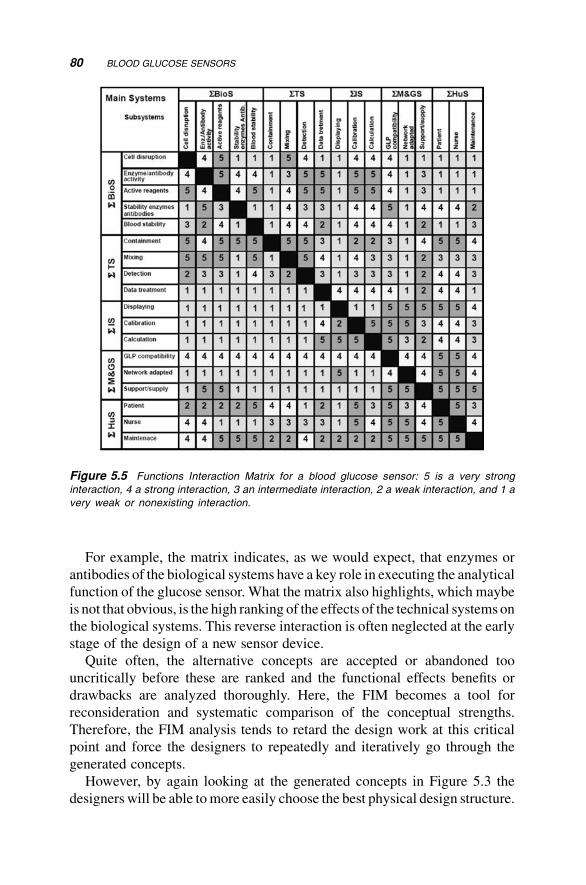
For example, the matrix indicates, as we would expect, that enzymes or
antibodies of the biological systems have a key role in executing the analytical
function of the glucose sensor. What the matrix also highlights, which maybe
is not that obvious, is the high ranking of the effects of the technical systems on
the biological systems. This reverse interaction is often neglected at the early
stage of the design of a new sensor device.
Quite often, the alternative concepts are accepted or abandoned too
uncritically before these are ranked and the functional effects benefits or
drawbacks are analyzed thoroughly. Here, the FIM becomes a tool for
reconsideration and systematic comparison of the conceptual strengths.
Therefore, the FIM analysis tends to retard the design work at this critical
point and force the designers to repeatedly and iteratively go through the
generated concepts.
However, by again looking at the generated concepts in Figure 5.3 the
designers will be able tomore easily choose the best physical design structure.
Figure 5.5 Functions Interaction Matrix for a blood glucose sensor: 5 is a very strong
interaction, 4 a strong interaction, 3 an intermediate interaction, 2 a weak interaction, and 1 a
very weak or nonexisting interaction.
80 BLOOD GLUCOSE SENSORS
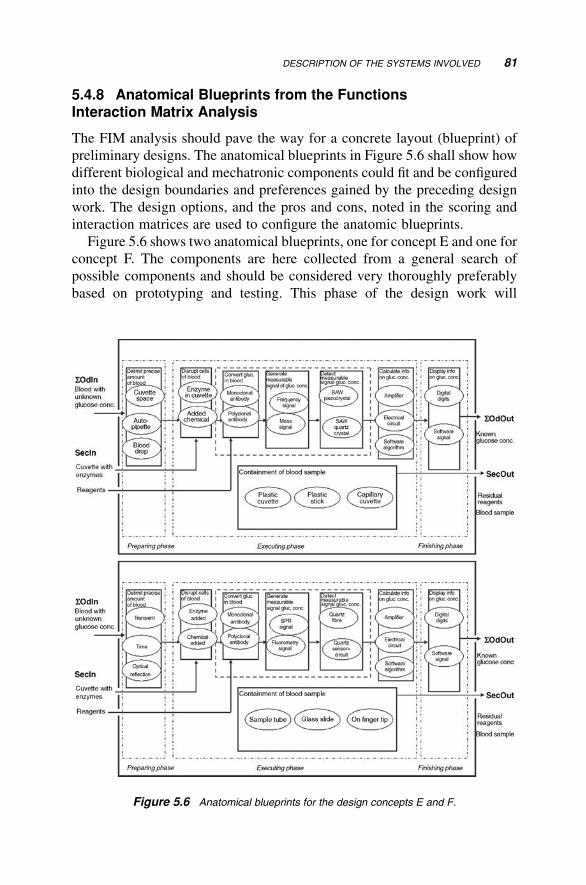
5.4.8 Anatomical Blueprints from the FunctionsInteraction Matrix Analysis
The FIM analysis should pave the way for a concrete layout (blueprint) of
preliminary designs. The anatomical blueprints in Figure 5.6 shall show how
different biological and mechatronic components could fit and be configured
into the design boundaries and preferences gained by the preceding design
work. The design options, and the pros and cons, noted in the scoring and
interaction matrices are used to configure the anatomic blueprints.
Figure 5.6 shows two anatomical blueprints, one for concept E and one for
concept F. The components are here collected from a general search of
possible components and should be considered very thoroughly preferably
based on prototyping and testing. This phase of the design work will
Figure 5.6 Anatomical blueprints for the design concepts E and F.
DESCRIPTION OF THE SYSTEMS INVOLVED 81
consequently be a key activity (using a substantial portion of the product
development budget).
Here, the components are based on standard components from established
vendors of antibodies, enzymes, optical devices, and microprocessors. The
key components for the functions are shown in the graphs.
5.5 CONCLUSIONS
Blood glucose sensors are already well-established biotech products on the
market. Thus, this design casemight be considered superfluous from a product
development perspective. However, this design case has had the advantage of
presenting a quite transparent showcase serving as a basic illustration of the
mechatronic design methodology and how it should be used in a biotechnol-
ogy application.
The steps of the systematic conceptual design approach in the chapter have
therefore been kept rather short without going deeper into all actual sensor
design structures. Instead, it intends to open up a continuing discussion of how
possibly glucose sensors could be further developed with partly different and
new design concepts.
Indirectly, the chapter also serves the purpose of retrospectively reviewing
the outcome of design development with a nonsystematic approach.
It is perhaps noticeable that the existing commercial products are all fairly
similar in their design. At this stage, it is difficult to know if this has been
caused by that other design concepts were tried and abandoned or if the
commercial vendors simply copied concepts from competitors.
Thus, the chapter has tried to show that a conceptual design approach easily
generates many more design solutions than appears to have been created for
the existing market.
REFERENCES
1. Solnica, B., Naskalski, J.W., Sieradzki, J. (2003) Analytical performance of
glucometers used for routine glucose self-monitoring of diabetic patients. Clin.
Chim. Acta 331, 29–35.
2. Solnica, B., Naskalski J.W. (2005) Quality control of self-monitored glucose in
clinical practice. Scand. J. Clin. Lab. Invest. Suppl. 240, 80–85.
3. Chaiken, J., Finney,W.,Knudson, P.E.,Weinstock,R.S.,Khan,M.,Rebecca, J.B.,
Hagrman,D.,Hagrman,P.,Zhao,Y., Peterson,C.M., Peterson,K. (2005)Effect of
hemoglobin concentration variation on the accuracy and precision of glucose
analysis using tissue modulated, noninvasive, in vivo Raman spectroscopy of
human blood: a small clinical study. J. Biomed. Opt. 10, 031111–031112.
82 BLOOD GLUCOSE SENSORS
4. Buhling, K.J., Henrich, W., Kjos, S.L., Siebert, G., Elizabeth, S.E., Dreweck, C.,
Stein, U., Dudenhausen, J.W. (2003) Comparison of point-of-care-testing glu-
cosemeters with standard laboratorymeasurement of the 50 g-glucose-challenge
test (GCT) during pregnancy. Clin. Biochem. 36, 333–337.
5. Ashworth, L., Gibb, I., Alberti, K.G.M.M. (1992) HemoCue: evaluation of
a portable photometric system for determining glucose in whole blood. Clin.
Chem. 38, 1479–1482.
6. Bellini, C., Serra1 G., Risso, D., Massimo, M.M., Bonioli, E. (2007) Reliability
assessment of glucose measurement by HemoCue analyser in a neonatal
intensive care unit. Clin. Chem. Lab. Med. 45, 1549–1554.
7. Hoedemaekers, C.W.E., Klein Gunnewiek, J.M.T, Prinsen, M.A., Willems, J.L.,
Van der Hoeven, J.G. (2008) Accuracy of bedside glucose measurement from
three glucometers in critically ill patients. Crit. Care Med. 36, 3062–3066.
8. Hoej-Hansen, T., Pedersen-Bjergaard, U., Thorsteinsson, B. (2005) Reproduc-
ibility and reliability of hypoglycaemic episodes recorded with Continuous
Glucose Monitoring System (CGMS) in daily life. Diabetic Med. 22, 858–862.
9. Kristiansen, G.B.B., Christensen, N.G., Thue, G., Sandberg, S. (2005) Between-
lot variation in external quality assessment of glucose: clinical importance and
effect on participant performance evaluation. Clin. Chem. 51, 1632–1636.
10. Hannestad, U., Lundblad, A. (1997) Accurate and precise isotope dilution mass
spectrometry method for determining glucose in whole blood. Clin. Chem. 43,
794–800.
11. P€untmann, I., Wosniok, W., Haeckel, R. (2003) Comparison of several point-of-
care testing (POCT) glucometerswith an established laboratory procedure for the
diagnosis of type 2 diabetes using the discordance rate: a new statistical approach.
Clin. Chem. Lab. Med. 41, 809–820.
12. World Health, Organization. (2006). Definition and Diagnosis of Diabetes
Mellitus and Intermediate Hyperglycemia, WHO Press, Switzerland.
13. Derel€ov, M., Detterfelt, J., Bj€orkman, M., Mandenius, C.F. (2008) Engineering
designmethodologyforbio-mechatronicproducts.Biotechnol.Prog.24,232–244.
REFERENCES 83

6SurfacePlasmonResonance
Biosensor Devices
In this chapter, design of surface plasmon resonance (SPR) biosensors is
discussed. First, the theoretical background of SPR is given (Section 6.1),
then the design requirements are analyzed and described from user aspects
(Section 6.2), and then the biomechatronic design methodology is applied
to the design (Section 6.3). Finally, the design of two of the most critical
parts of the SPR is elaborated on (i) the fluidics of the sensor and (ii) the
immobilization of biomolecules on the sensor chip, in finer details
(Section 6.4). This design serves as a concrete illustration of how the
methodology should be used in practice.
6.1 INTRODUCTION
One of the most successful biosensor achievements so far are the surface
plasmon resonance sensors.
The principle of SPR, known since 1950s [1–3], was not commercialized
for biological sensing purposes until the late 1980s when the first BiacoreTM
instrument was launched on the market [4]. This had been preceded by
scientific investigations in which the design of surface-sensitive interactions
on a metal film grafted on an optical prism for SPR detection was done [5].
Biomechatronic Design in Biotechnology: A Methodology for Development ofBiotechnological Products, First Edition. Carl-Fredrik Mandenius and Mats Bj€orkman.� 2011 John Wiley & Sons, Inc. Published 2011 by John Wiley & Sons, Inc.
85
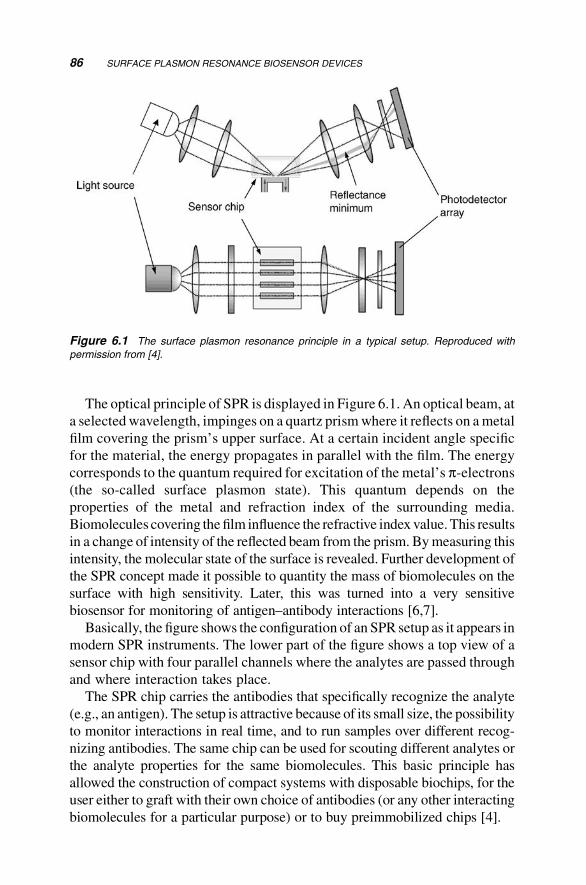
The optical principle of SPR is displayed in Figure 6.1. An optical beam, at
a selected wavelength, impinges on a quartz prismwhere it reflects on ametal
film covering the prism’s upper surface. At a certain incident angle specific
for the material, the energy propagates in parallel with the film. The energy
corresponds to the quantum required for excitation of the metal’s p-electrons(the so-called surface plasmon state). This quantum depends on the
properties of the metal and refraction index of the surrounding media.
Biomolecules covering thefilm influence the refractive index value.This results
in a change of intensity of the reflected beam from the prism. Bymeasuring this
intensity, the molecular state of the surface is revealed. Further development of
the SPR concept made it possible to quantity the mass of biomolecules on the
surface with high sensitivity. Later, this was turned into a very sensitive
biosensor for monitoring of antigen–antibody interactions [6,7].
Basically, the figure shows the configuration of an SPR setup as it appears in
modern SPR instruments. The lower part of the figure shows a top view of a
sensor chip with four parallel channels where the analytes are passed through
and where interaction takes place.
The SPR chip carries the antibodies that specifically recognize the analyte
(e.g., an antigen). The setup is attractive because of its small size, the possibility
to monitor interactions in real time, and to run samples over different recog-
nizing antibodies. The same chip can be used for scouting different analytes or
the analyte properties for the same biomolecules. This basic principle has
allowed the construction of compact systems with disposable biochips, for the
user either to graft with their own choice of antibodies (or any other interacting
biomolecules for a particular purpose) or to buy preimmobilized chips [4].
Figure 6.1 The surface plasmon resonance principle in a typical setup. Reproduced with
permission from [4].
86 SURFACE PLASMON RESONANCE BIOSENSOR DEVICES
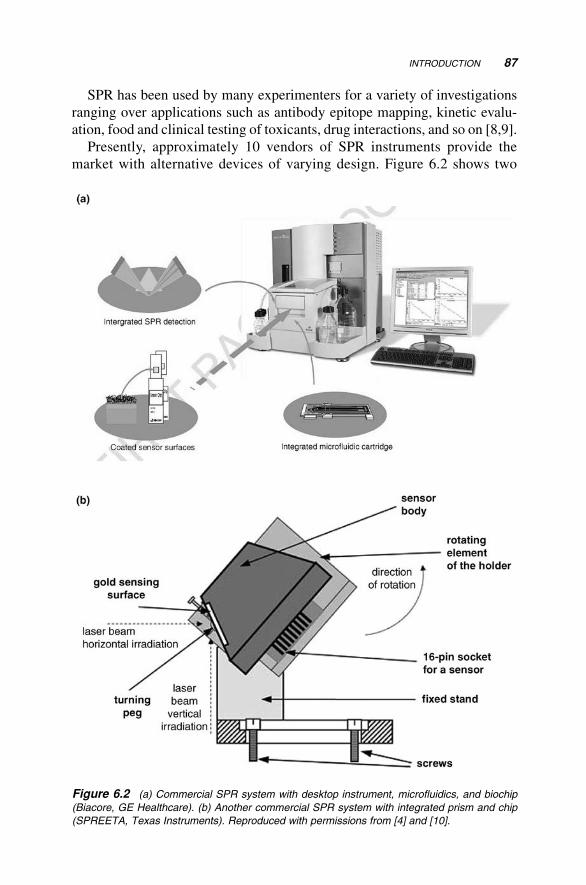
SPR has been used by many experimenters for a variety of investigations
ranging over applications such as antibody epitope mapping, kinetic evalu-
ation, food and clinical testing of toxicants, drug interactions, and so on [8,9].
Presently, approximately 10 vendors of SPR instruments provide the
market with alternative devices of varying design. Figure 6.2 shows two
Figure 6.2 (a) Commercial SPR system with desktop instrument, microfluidics, and biochip
(Biacore, GE Healthcare). (b) Another commercial SPR system with integrated prism and chip
(SPREETA, Texas Instruments). Reproduced with permissions from [4] and [10].
INTRODUCTION 87
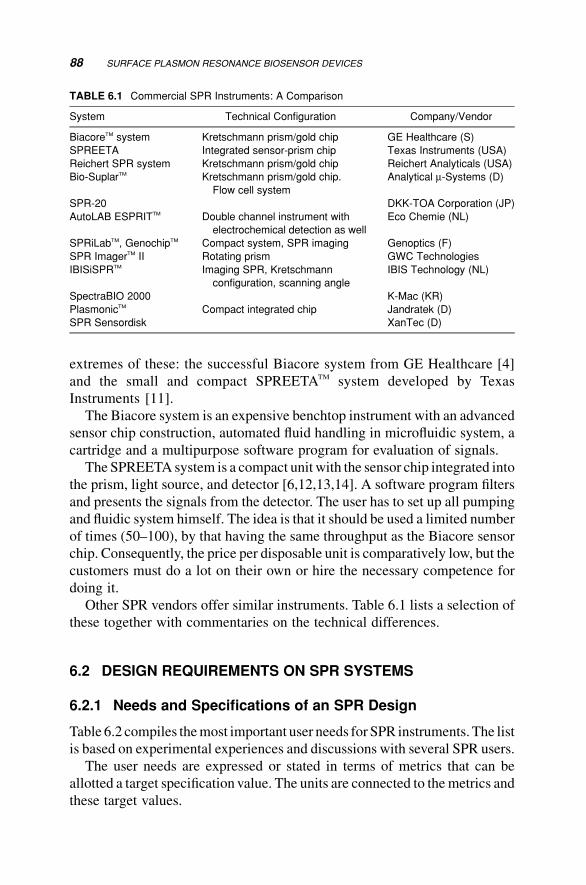
extremes of these: the successful Biacore system from GE Healthcare [4]
and the small and compact SPREETATM system developed by Texas
Instruments [11].
The Biacore system is an expensive benchtop instrument with an advanced
sensor chip construction, automated fluid handling in microfluidic system, a
cartridge and a multipurpose software program for evaluation of signals.
The SPREETA system is a compact unit with the sensor chip integrated into
the prism, light source, and detector [6,12,13,14]. A software program filters
and presents the signals from the detector. The user has to set up all pumping
and fluidic system himself. The idea is that it should be used a limited number
of times (50–100), by that having the same throughput as the Biacore sensor
chip. Consequently, the price per disposable unit is comparatively low, but the
customers must do a lot on their own or hire the necessary competence for
doing it.
Other SPR vendors offer similar instruments. Table 6.1 lists a selection of
these together with commentaries on the technical differences.
6.2 DESIGN REQUIREMENTS ON SPR SYSTEMS
6.2.1 Needs and Specifications of an SPR Design
Table 6.2 compiles themost important user needs for SPR instruments. The list
is based on experimental experiences and discussions with several SPR users.
The user needs are expressed or stated in terms of metrics that can be
allotted a target specification value. The units are connected to themetrics and
these target values.
TABLE 6.1 Commercial SPR Instruments: A Comparison
System Technical Configuration Company/Vendor
BiacoreTM system Kretschmann prism/gold chip GE Healthcare (S)
SPREETA Integrated sensor-prism chip Texas Instruments (USA)
Reichert SPR system Kretschmann prism/gold chip Reichert Analyticals (USA)
Bio-SuplarTM Kretschmann prism/gold chip.
Flow cell system
Analytical m-Systems (D)
SPR-20 DKK-TOA Corporation (JP)
AutoLAB ESPRITTM Double channel instrument with
electrochemical detection as well
Eco Chemie (NL)
SPRiLabTM, GenochipTM Compact system, SPR imaging Genoptics (F)
SPR ImagerTM II Rotating prism GWC Technologies
IBISiSPRTM Imaging SPR, Kretschmann
configuration, scanning angle
IBIS Technology (NL)
SpectraBIO 2000 K-Mac (KR)
PlasmonicTM Compact integrated chip Jandratek (D)
SPR Sensordisk XanTec (D)
88 SURFACE PLASMON RESONANCE BIOSENSOR DEVICES
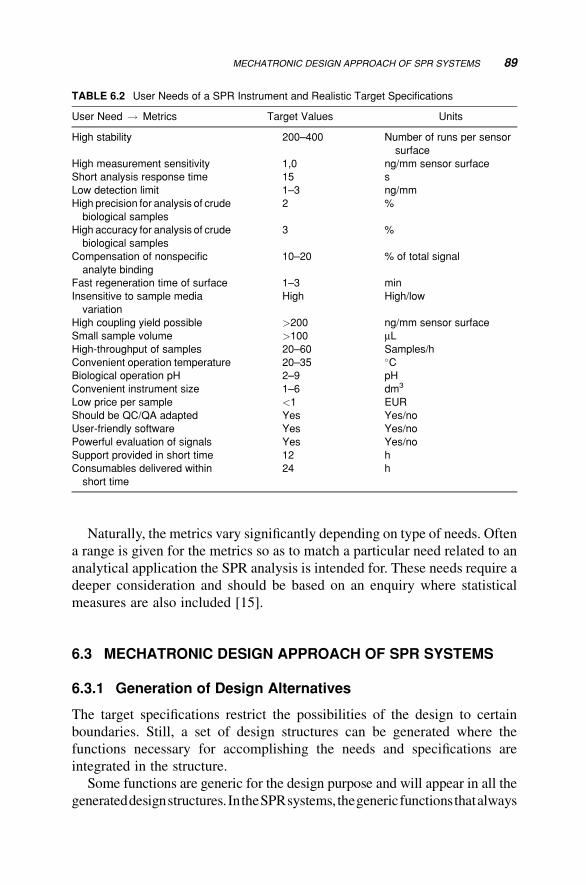
Naturally, the metrics vary significantly depending on type of needs. Often
a range is given for the metrics so as to match a particular need related to an
analytical application the SPR analysis is intended for. These needs require a
deeper consideration and should be based on an enquiry where statistical
measures are also included [15].
6.3 MECHATRONIC DESIGN APPROACH OF SPR SYSTEMS
6.3.1 Generation of Design Alternatives
The target specifications restrict the possibilities of the design to certain
boundaries. Still, a set of design structures can be generated where the
functions necessary for accomplishing the needs and specifications are
integrated in the structure.
Some functions are generic for the design purpose and will appear in all the
generateddesignstructures.IntheSPRsystems,thegenericfunctionsthatalways
TABLE 6.2 User Needs of a SPR Instrument and Realistic Target Specifications
User Need ! Metrics Target Values Units
High stability 200–400 Number of runs per sensor
surface
High measurement sensitivity 1,0 ng/mm sensor surface
Short analysis response time 15 s
Low detection limit 1–3 ng/mm
High precision for analysis of crude
biological samples
2 %
High accuracy for analysis of crude
biological samples
3 %
Compensation of nonspecific
analyte binding
10–20 % of total signal
Fast regeneration time of surface 1–3 min
Insensitive to sample media
variation
High High/low
High coupling yield possible >200 ng/mm sensor surface
Small sample volume >100 mLHigh-throughput of samples 20–60 Samples/h
Convenient operation temperature 20–35 �CBiological operation pH 2–9 pH
Convenient instrument size 1–6 dm3
Low price per sample <1 EUR
Should be QC/QA adapted Yes Yes/no
User-friendly software Yes Yes/no
Powerful evaluation of signals Yes Yes/no
Support provided in short time 12 h
Consumables delivered within
short time
24 h
MECHATRONIC DESIGN APPROACH OF SPR SYSTEMS 89
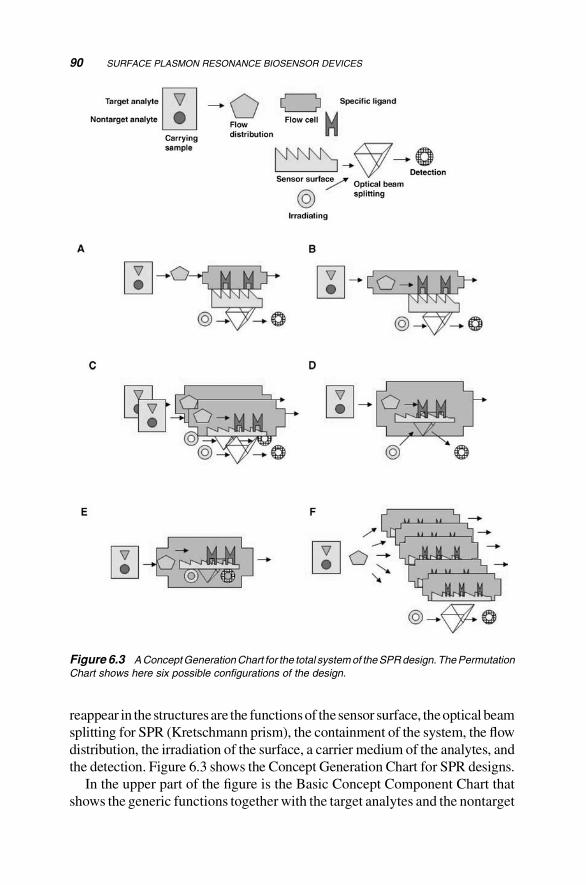
reappear in the structures are the functionsof thesensor surface, theoptical beam
splitting for SPR (Kretschmann prism), the containment of the system, the flow
distribution, the irradiation of the surface, a carrier medium of the analytes, and
the detection. Figure 6.3 shows the Concept Generation Chart for SPR designs.
In the upper part of the figure is the Basic Concept Component Chart that
shows the generic functions together with the target analytes and the nontarget
Figure 6.3 AConceptGenerationChart for the total systemof theSPRdesign.ThePermutation
Chart shows here six possible configurations of the design.
90 SURFACE PLASMON RESONANCE BIOSENSOR DEVICES
analytes. These functions are coarsely related to each other. This is done
without locking the configuration with the intention to make the structures
available for generating alternatives. The lower part of the figure (the
Permutation Chart) shows six design alternatives that are generated from the
basic concept components.
Alternative A shows a configuration where the surface function has been
placed on the prism function. The flow cell system is placed close to the
surface and the ligand function is placed inside the flow cell. The flow
distribution is performed prior to and separate from the surface and flow
cell. The irradiation and detection functions are placed before and after the
prism. It is felt that this design alternative is suitable for a relative large-size
system where standard components can be assembled, for example, on an
optical bench, and later be encased in an instrument cabinet.
In alternativeB, theA configuration remains almost unaltered but instead of
separating the flowdistribution and flow cell containments, they are integrated
here. This opens up for a more elaborate design of a flow cell. It would give
some opportunity to make the system smaller and may suggest that different
construction materials such as polymeric or glass materials can be used to
mend a more unique device unit.
In alternative C, the surface function has been placed inside the flow cell
integrated compartment. This is a radical change. It means that the SPR
surface physics shall take place in the containment unit. Also, it keeps the
surface closer to the ligand function. As in B, the flow distribution is inside the
flow cell. This configuration could allow a further downsizing of the essential
units of the designed system while still keeping the prism, irradiation, and
detection functions apart. The D configuration seems to approach the first
Biacore system.
Alternative D places the prism function inside the flow cell. The other
functions remain unchanged. More units inside the flow cell probably require
space inside the compartment. But it is also a challenge for further minia-
turization of the separate units. Here, need for a novel design can be felt.
In alternative E, the D alternative is taken further by also placing the
irradiation and detection functions inside the flow cell. This means a compact
design solution. It envisages a design similar to the SPREETA system shown
in Figure 6.2b.
In the alternative F, the C configuration has been multiplied. This could
benefit from again having the flow distribution placed separated from the flow
cell, at least a part of it. The number of repeated flowcell/surface units canvary
(five is depicted in the figure). For example, a Biacore 1000TM instrument has
4 channels and a Biacore A100TM has 20 channels.
The six alternatives shown in the figure are a starting point. More alter-
natives can be generated. However, it is clear that a deeper analysis of the
MECHATRONIC DESIGN APPROACH OF SPR SYSTEMS 91
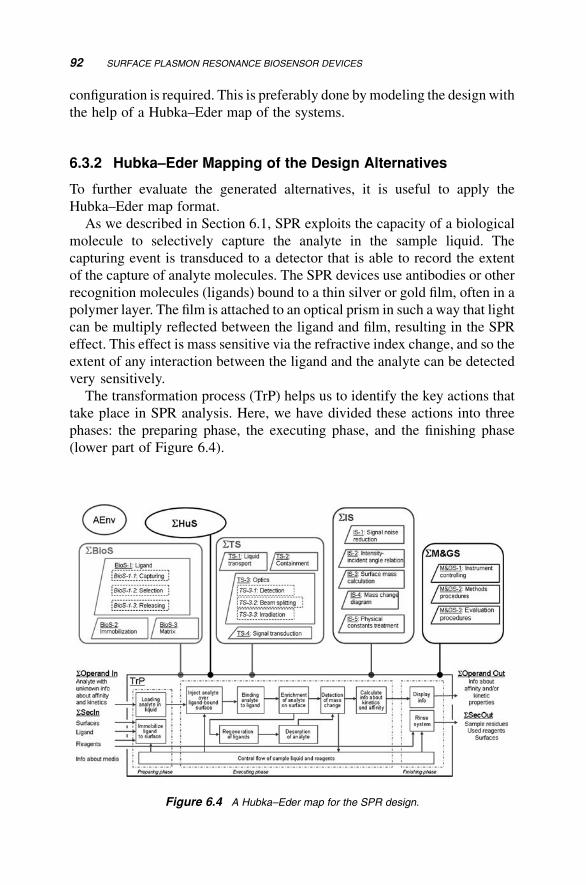
configuration is required. This is preferably done bymodeling the design with
the help of a Hubka–Eder map of the systems.
6.3.2 Hubka–Eder Mapping of the Design Alternatives
To further evaluate the generated alternatives, it is useful to apply the
Hubka–Eder map format.
As we described in Section 6.1, SPR exploits the capacity of a biological
molecule to selectively capture the analyte in the sample liquid. The
capturing event is transduced to a detector that is able to record the extent
of the capture of analyte molecules. The SPR devices use antibodies or other
recognition molecules (ligands) bound to a thin silver or gold film, often in a
polymer layer. The film is attached to an optical prism in such a way that light
can be multiply reflected between the ligand and film, resulting in the SPR
effect. This effect is mass sensitive via the refractive index change, and so the
extent of any interaction between the ligand and the analyte can be detected
very sensitively.
The transformation process (TrP) helps us to identify the key actions that
take place in SPR analysis. Here, we have divided these actions into three
phases: the preparing phase, the executing phase, and the finishing phase
(lower part of Figure 6.4).
Figure 6.4 A Hubka–Eder map for the SPR design.
92 SURFACE PLASMON RESONANCE BIOSENSOR DEVICES
In the preparing phase, the analyte sample is loaded and the sensor surface is
immobilized with ligands. When this phase is completed, the instrument can
start the activity of the SPR system where the biological interaction between
the analyte and the ligand is analyzed.
The executing phase do this by first injecting the analyte into the ligand-
bound surface. This is followed by the binding of analyte molecules to ligand
on the surface. An important subphase of the executing phase is the enrich-
ment of the analyte molecules on the sensor surface, that is, when all available
ligand sites become occupied by the analytes. These series of events are
recorded in real time as mass change according to the SPR principle.
The next steps are a further evaluation of the signal and calculation of
interaction kinetics. This activity can occur in real time but also be done in
retrospect.
The bound analyte is removed from the surface by desorption. This has two
functions: (1) to compare signals before and after the interaction and (2) to
regenerate the surface for next analyte cycle. Also, these functions go through
mass detection and subsequent signal evaluation.
In the finishing phase, the results of the interaction analysis are displayed.
The ingoing operand to the TrP is samplewith analyte(s), and the secondary
inputs are the ligand, preprepared surfaces, reagents for coupling, and liquid
for transporting the samples. The outgoing operand is the analytical infor-
mation, and the secondary outputs are the residual reagents, used surfaces, and
sample solution.
Next is to describe the systems responsible for carrying out the TrP (upper
part of Figure 6.4).
The biological systems (SBioS) are primarily the biological functions of
the ligand molecular complex (BioS-1), and its immobilization to the sensor
surface (BioS-2), and the biointerface of the sensor surface matrix (BioS-3).
The ligand functions can be diversified into the capturingmechanism function
(BioS-1.1), the selectivity function (BioS-1.2), and the release mechanism
function (BioS-1.3).
The technical systems (STS) include functions for liquid transportation
(TS-1), optics (TS-2), containment of sensor surface, samples, and optical
components (TS-3), and signal treatment (TS-4). Especially, the optical
components are further subdivided into detection, irradiation, beam splitting,
and SPR media (e.g., a metallic film).
The information systems (SIS) are the functions for processing the detectorsignal from TS-4. It concerns functions for reducing noise in order to make the
signal informative (IS-1), relating angle and intensity to interpret the SPR signal
dip where evanescence occurs (IS-2), to translate the signal to surface mass
(IS-3), to record a time course for themass change (IS-4), and to handle physical
constants such as refractive indices for the media of the components (IS-5).
MECHATRONIC DESIGN APPROACH OF SPR SYSTEMS 93
The management and goal systems (SM&GS) are the functional proce-
dures for controlling the parts of the SPR instrument (M&GS-1), the method
of immobilizing the surface (M&GS-2), and the evaluation of the tests carried
out (M&GS-3). Also, a further subdivision can be done here.
Some of the subsystems provide materials, others energy, and others
information. The interaction of operator personnel and scientists are included
in both SHuS and active environment (AEnv).
As before, the Hubka–Eder map puts focus on the disturbances caused by
theAEnvon the calculationwork necessary tomanage the interpretation of the
kinetic results and the planning of the experiment (SHuS), on the requirements
of the lab supply systems and the support from the vendor for instrument
operation and chip fabrication and consumables (STS), and on the biotech-
nical system, including the availability and development of suitable biological
ligands and the preparation of the sample to be analyzed.
The Hubka–Eder map addresses, at an early stage, how many of the
functionalities are placed outside the product (as in the Biacore instrument)
and how demanding the product is, both for the user, who must provide these
competences, and for the selling company, which must be prepared to provide
support and consumables [16].
When each of the systems in the STS domain is decomposed further, the
technical operation of the biosensor instrument through the functions and
subfunctions of binding of ligands to the sensor surface, sample distribution,
irradiation and detection by emitter and diode arraymultiplier, and analysis of
signals come out clearly. The relationships to materials (sample, ligands, and
chips), energy (to pumps and valves), and signals (from the detector and for
operating valves and pumps) can be understood similarly to a flow scheme.
Fundamental to the design work is to clearly define the main technical
principle to be exploited and how the design space can be utilized in relation to
that principle. Abstractly, the goal is defined as exploiting the capacity of a
biological molecule (i.e., the ligand) to selectively capture or convert the
analyte in proximity to a sufficiently sensitive detector.
By further decomposing the Hubka–Eder map in Figure 6.4, it becomes
possible to identify additional key functions for each technical (TS-n) or
biological system (BioS-n) essential for the performance and the design.Here,
we focused on the decomposition to four different subsystems, each providing
critical functions:
1. Fcapture: capturing the target analyte in a complexmatrix of the analyzed
sample.
2. Fmass change: generating a detectable physicobiochemical change from
the captured analyte.
94 SURFACE PLASMON RESONANCE BIOSENSOR DEVICES
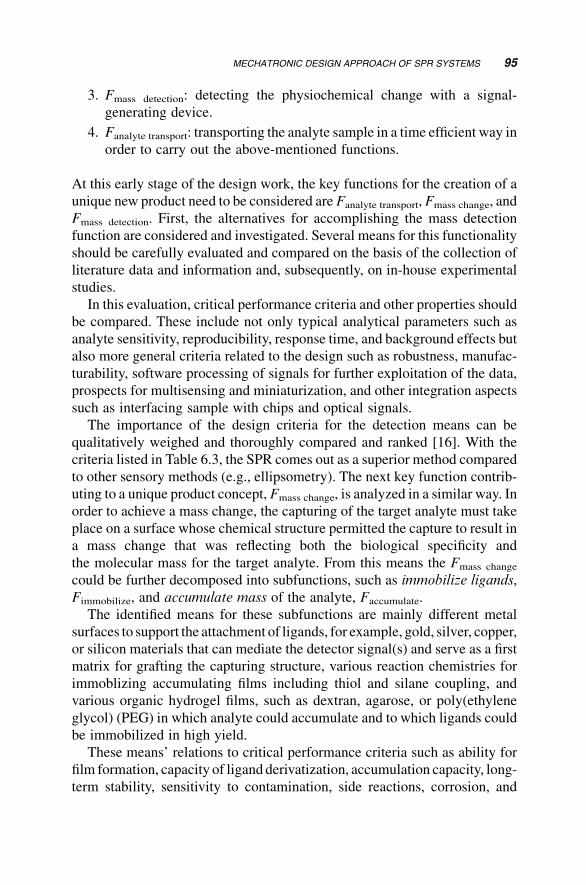
3. Fmass detection: detecting the physiochemical change with a signal-
generating device.
4. Fanalyte transport: transporting the analyte sample in a time efficient way in
order to carry out the above-mentioned functions.
At this early stage of the design work, the key functions for the creation of a
unique new product need to be considered are Fanalyte transport, Fmass change, and
Fmass detection. First, the alternatives for accomplishing the mass detection
function are considered and investigated. Several means for this functionality
should be carefully evaluated and compared on the basis of the collection of
literature data and information and, subsequently, on in-house experimental
studies.
In this evaluation, critical performance criteria and other properties should
be compared. These include not only typical analytical parameters such as
analyte sensitivity, reproducibility, response time, and background effects but
also more general criteria related to the design such as robustness, manufac-
turability, software processing of signals for further exploitation of the data,
prospects for multisensing and miniaturization, and other integration aspects
such as interfacing sample with chips and optical signals.
The importance of the design criteria for the detection means can be
qualitatively weighed and thoroughly compared and ranked [16]. With the
criteria listed in Table 6.3, the SPR comes out as a superior method compared
to other sensory methods (e.g., ellipsometry). The next key function contrib-
uting to a unique product concept, Fmass change, is analyzed in a similar way. In
order to achieve a mass change, the capturing of the target analyte must take
place on a surface whose chemical structure permitted the capture to result in
a mass change that was reflecting both the biological specificity and
the molecular mass for the target analyte. From this means the Fmass change
could be further decomposed into subfunctions, such as immobilize ligands,
Fimmobilize, and accumulate mass of the analyte, Faccumulate.
The identified means for these subfunctions are mainly different metal
surfaces to support the attachment of ligands, for example, gold, silver, copper,
or silicon materials that can mediate the detector signal(s) and serve as a first
matrix for grafting the capturing structure, various reaction chemistries for
immoblizing accumulating films including thiol and silane coupling, and
various organic hydrogel films, such as dextran, agarose, or poly(ethylene
glycol) (PEG) in which analyte could accumulate and to which ligands could
be immobilized in high yield.
These means’ relations to critical performance criteria such as ability for
film formation, capacity of ligand derivatization, accumulation capacity, long-
term stability, sensitivity to contamination, side reactions, corrosion, and
MECHATRONIC DESIGN APPROACH OF SPR SYSTEMS 95
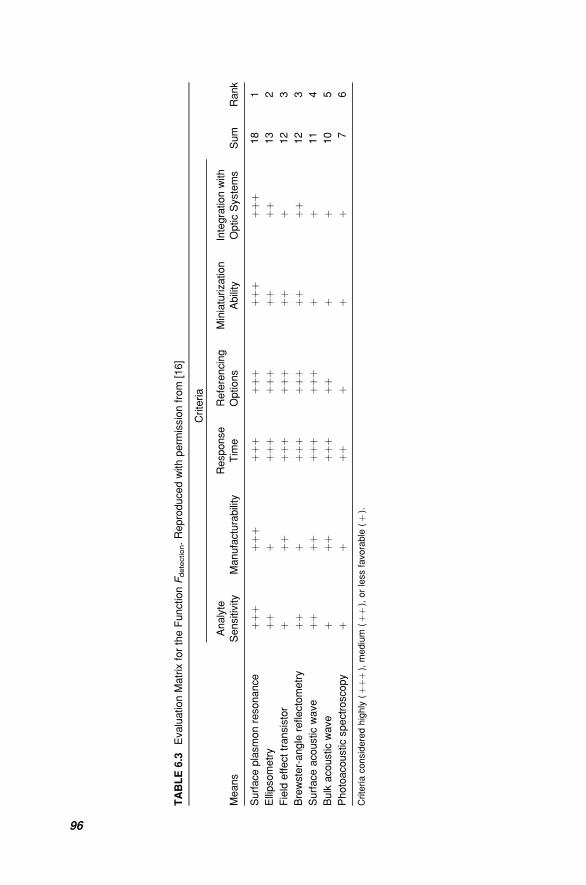
TABLE6.3
EvaluationMatrix
fortheFunctionFdetection.Reproducedwithperm
issionfrom
[16]
Criteria
Means
Analyte
Sensitivity
Manufacturability
Response
Tim
e
Referencing
Options
Miniaturizatio
n
Ability
Integrationwith
OpticSystems
Sum
Rank
Surfaceplasmonresonance
þþþ
þþþ
þþþ
þþþ
þþþ
þþþ
18
1
Ellipsometry
þþþ
þþþ
þþþ
þþþþ
13
2
Field
effecttransistor
þþþ
þþþ
þþþ
þþþ
12
3
Brewster-angle
reflectometry
þþþ
þþþ
þþþ
þþþþ
12
3
Surfaceacousticwave
þþþþ
þþþ
þþþ
þþ
11
4
Bulk
acousticwave
þþþ
þþþ
þþþ
þ10
5
Photoacousticspectrosco
py
þþ
þþþ
þþ
76
Criteriaconsideredhighly
(þþ
þ),medium
(þþ
),orlessfavorable
(þ).
96
durability to reagents and sample solutionswere analyzed. Table 6.4 compares
these criteria, although, as is easily realized, the selection matrix is in reality
much more complex. Table 6.4 focuses on methods that are applicable to SPR
in particular.
For the biological systems, function Fcapture, that is, capacity of capturing
target analyte, different means are analyzed as well. The function can be
attained by introducing biological ligand molecules at or very close to the
place, or system, where the mass change takes place (Fmass change), and
subsequently, can be detected (Fmass detection). Thus, these biological ligands
become the main biological component of the biological systems SBioS for
which the functional interconnections between the detection method, the
surface chemistry, and biological capture methods become visible. Table 6.5
shows the evaluation of various ligand means versus some of the most critical
properties, user’s analytical purpose, to analyze a particular sample. The
sample must also withstand the analyzer conditions according to the critical
properties.
The fourth functional requirement, to transport the target analyte in the
sample, depends on different flow conduit systems. Existing well-known
means, such as peristaltic pumps, rotary valves, and silicone tubing systems
were redesigned and compared in microsystem formats using various poly-
meric materials (e.g., silicone-based polymers, polycarbonate), hydraulic
microvalves, and devices made in silicon circuits with lithographic methods.
Although already listed and preliminarily ranked in the initial specification,
potential analytical applications are recurrently considered on the basis of
opportunities created in the functional analysis. These applications included
antigen concentration determination, epitope mapping of antibodies, and
kinetic evaluation of affinity interactions.
The three tables evaluate themeans for each function separately and take no
or little consideration of how well they fit together with each other or with
other means of the final technical system. However, in order to design an
“optimal solution,” not only the most potential means but also the effect of the
integration of the different means had to be identified and evaluated. To do
so, several design solutions should be conceptually synthesized. In design
science, this synthesis is commonly systemized by a morphological
matrix [17]. In the matrix in Table 6.6, the functions are listed vertically and
the different possible solutions horizontally. The concepts are synthesized by
selection of different sets ofmeans in thematrix.Alreadywith this rather small
morphological matrix the designers have, at least theoretically, 180 different
concepts or solutions.
For obvious reasons, all combinations possible from the table should not be
further analyzed. The most interesting above-mentioned alternative morphol-
ogies are compared versus general overall criteria. These included total quality
MECHATRONIC DESIGN APPROACH OF SPR SYSTEMS 97
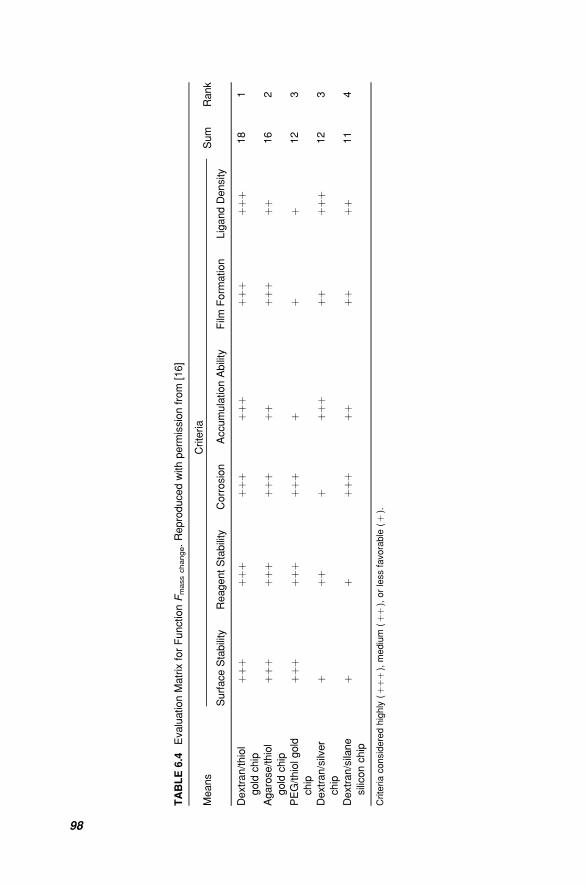
TABLE6.4
EvaluationMatrix
forFunctionFmasschange.Reproduce
dwithperm
issionfrom
[16]
Means
Criteria
Sum
Rank
SurfaceStability
ReagentStability
Corrosion
Accumulatio
nAbility
Film
Form
ation
LigandDensity
Dextran/thiol
gold
chip
þþþ
þþþ
þþþ
þþþ
þþþ
þþþ
18
1
Agarose/thiol
gold
chip
þþþ
þþþ
þþþ
þþþþ
þþþ
16
2
PEG/thiolgold
chip
þþþ
þþþ
þþþ
þþ
þ12
3
Dextran/silver
chip
þþþ
þþþ
þþþ
þþþ
12
3
Dextran/silane
siliconchip
þþ
þþþ
þþþþ
þþ11
4
Criteriaconsideredhighly
(þþ
þ),medium
(þþ
),orlessfavorable
(þ).
98
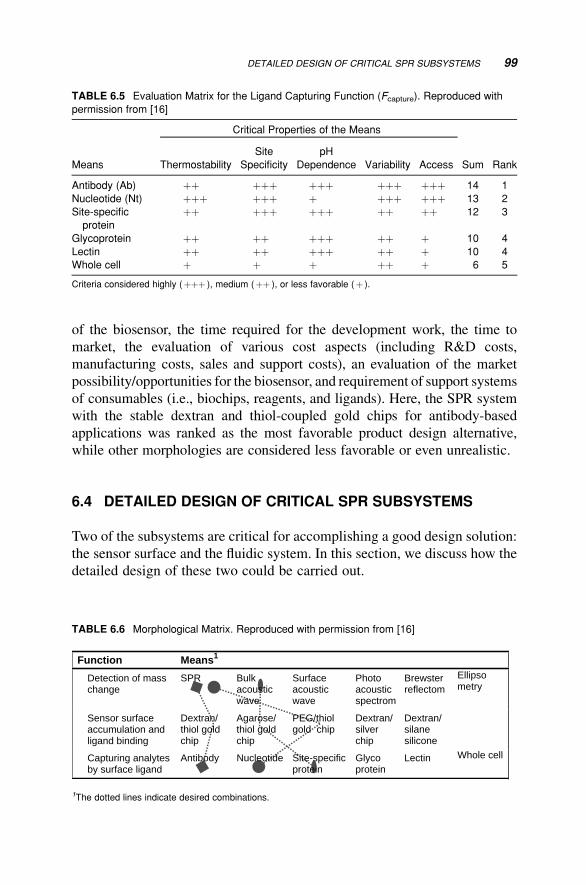
of the biosensor, the time required for the development work, the time to
market, the evaluation of various cost aspects (including R&D costs,
manufacturing costs, sales and support costs), an evaluation of the market
possibility/opportunities for the biosensor, and requirement of support systems
of consumables (i.e., biochips, reagents, and ligands). Here, the SPR system
with the stable dextran and thiol-coupled gold chips for antibody-based
applications was ranked as the most favorable product design alternative,
while other morphologies are considered less favorable or even unrealistic.
6.4 DETAILED DESIGN OF CRITICAL SPR SUBSYSTEMS
Two of the subsystems are critical for accomplishing a good design solution:
the sensor surface and the fluidic system. In this section, we discuss how the
detailed design of these two could be carried out.
TABLE 6.5 Evaluation Matrix for the Ligand Capturing Function (Fcapture). Reproduced with
permission from [16]
Critical Properties of the Means
Means Thermostability
Site
Specificity
pH
Dependence Variability Access Sum Rank
Antibody (Ab) þþ þþþ þþþ þþþ þþþ 14 1
Nucleotide (Nt) þþþ þþþ þ þþþ þþþ 13 2
Site-specific
protein
þþ þþþ þþþ þþ þþ 12 3
Glycoprotein þþ þþ þþþ þþ þ 10 4
Lectin þþ þþ þþþ þþ þ 10 4
Whole cell þ þ þ þþ þ 6 5
Criteria considered highly (þþþ ), medium (þþ ), or less favorable (þ ).
TABLE 6.6 Morphological Matrix. Reproduced with permission from [16]
Means1
Function
Detection of mass change
Bulk SPR acousticwave
Surfaceacousticwave
Photoacousticspectrom
Brewsterreflectom
Ellipsometry
Sensor surface accumulation and ligand binding
Dextran/thiol gold chip
Agarose/thiol gold chip
PEG/thiolgold chip
Dextran/silverchip
Dextran/silanesilicone
Capturing analytes by surface ligand
Site-specific Nucleotide Antibody protein
Glycoprotein
Lectin Whole cell
1The dotted lines indicate desired combinations.
DETAILED DESIGN OF CRITICAL SPR SUBSYSTEMS 99
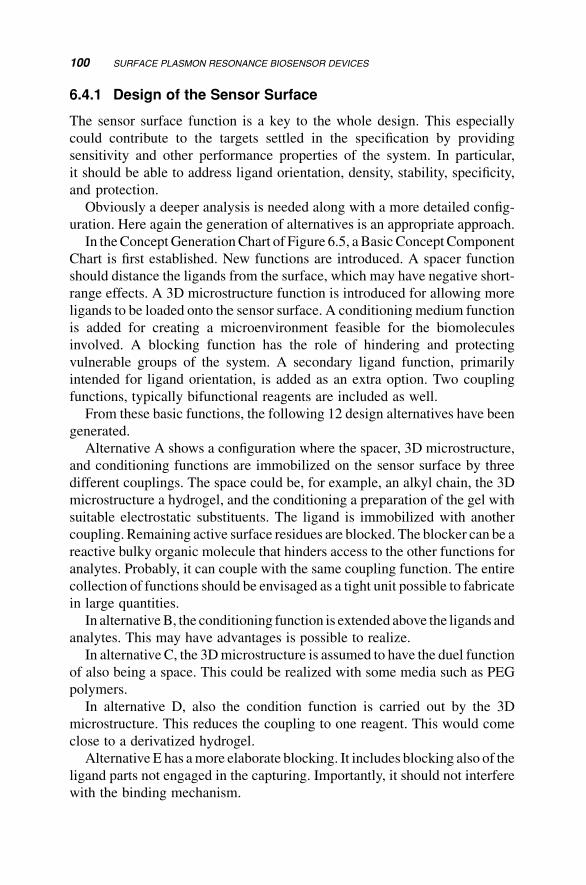
6.4.1 Design of the Sensor Surface
The sensor surface function is a key to the whole design. This especially
could contribute to the targets settled in the specification by providing
sensitivity and other performance properties of the system. In particular,
it should be able to address ligand orientation, density, stability, specificity,
and protection.
Obviously a deeper analysis is needed along with a more detailed config-
uration. Here again the generation of alternatives is an appropriate approach.
In theConceptGenerationChart of Figure 6.5, aBasic ConceptComponent
Chart is first established. New functions are introduced. A spacer function
should distance the ligands from the surface, which may have negative short-
range effects. A 3D microstructure function is introduced for allowing more
ligands to be loaded onto the sensor surface. A conditioning medium function
is added for creating a microenvironment feasible for the biomolecules
involved. A blocking function has the role of hindering and protecting
vulnerable groups of the system. A secondary ligand function, primarily
intended for ligand orientation, is added as an extra option. Two coupling
functions, typically bifunctional reagents are included as well.
From these basic functions, the following 12 design alternatives have been
generated.
Alternative A shows a configuration where the spacer, 3D microstructure,
and conditioning functions are immobilized on the sensor surface by three
different couplings. The space could be, for example, an alkyl chain, the 3D
microstructure a hydrogel, and the conditioning a preparation of the gel with
suitable electrostatic substituents. The ligand is immobilized with another
coupling. Remaining active surface residues are blocked. The blocker can be a
reactive bulky organic molecule that hinders access to the other functions for
analytes. Probably, it can couple with the same coupling function. The entire
collection of functions should be envisaged as a tight unit possible to fabricate
in large quantities.
In alternativeB, the conditioning function is extended above the ligands and
analytes. This may have advantages is possible to realize.
In alternative C, the 3Dmicrostructure is assumed to have the duel function
of also being a space. This could be realized with some media such as PEG
polymers.
In alternative D, also the condition function is carried out by the 3D
microstructure. This reduces the coupling to one reagent. This would come
close to a derivatized hydrogel.
Alternative E has amore elaborate blocking. It includes blocking also of the
ligand parts not engaged in the capturing. Importantly, it should not interfere
with the binding mechanism.
100 SURFACE PLASMON RESONANCE BIOSENSOR DEVICES
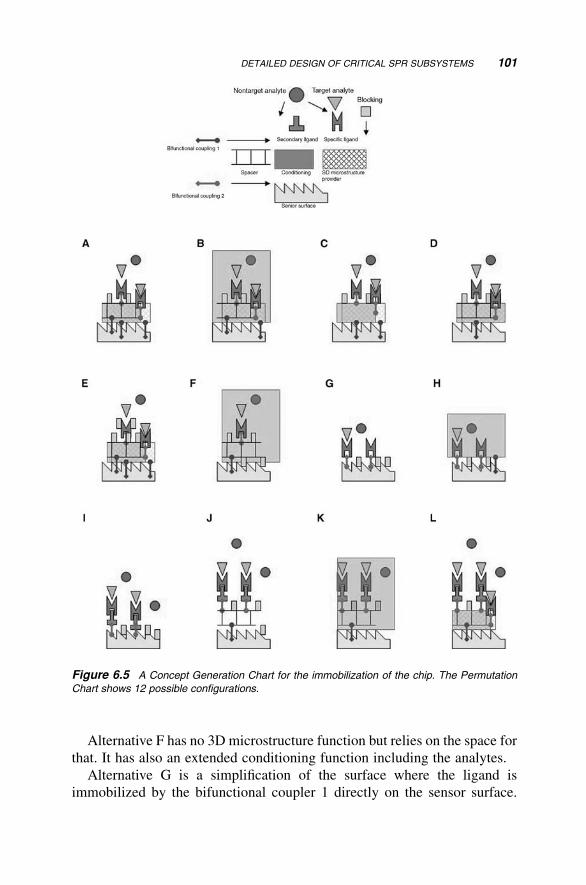
Alternative F has no 3D microstructure function but relies on the space for
that. It has also an extended conditioning function including the analytes.
Alternative G is a simplification of the surface where the ligand is
immobilized by the bifunctional coupler 1 directly on the sensor surface.
Figure 6.5 A Concept Generation Chart for the immobilization of the chip. The Permutation
Chart shows 12 possible configurations.
DETAILED DESIGN OF CRITICAL SPR SUBSYSTEMS 101
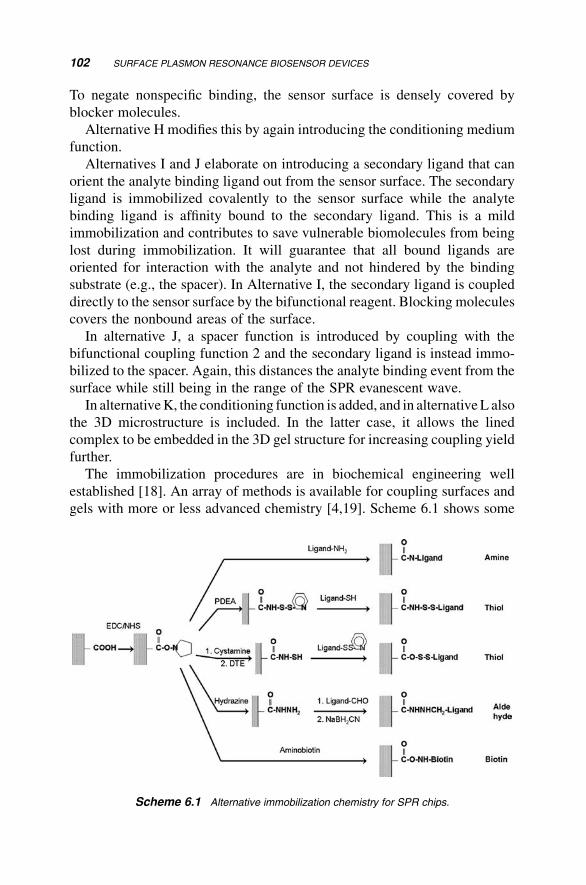
To negate nonspecific binding, the sensor surface is densely covered by
blocker molecules.
Alternative H modifies this by again introducing the conditioning medium
function.
Alternatives I and J elaborate on introducing a secondary ligand that can
orient the analyte binding ligand out from the sensor surface. The secondary
ligand is immobilized covalently to the sensor surface while the analyte
binding ligand is affinity bound to the secondary ligand. This is a mild
immobilization and contributes to save vulnerable biomolecules from being
lost during immobilization. It will guarantee that all bound ligands are
oriented for interaction with the analyte and not hindered by the binding
substrate (e.g., the spacer). In Alternative I, the secondary ligand is coupled
directly to the sensor surface by the bifunctional reagent. Blocking molecules
covers the nonbound areas of the surface.
In alternative J, a spacer function is introduced by coupling with the
bifunctional coupling function 2 and the secondary ligand is instead immo-
bilized to the spacer. Again, this distances the analyte binding event from the
surface while still being in the range of the SPR evanescent wave.
In alternativeK, the conditioning function is added, and in alternativeL also
the 3D microstructure is included. In the latter case, it allows the lined
complex to be embedded in the 3D gel structure for increasing coupling yield
further.
The immobilization procedures are in biochemical engineering well
established [18]. An array of methods is available for coupling surfaces and
gels with more or less advanced chemistry [4,19]. Scheme 6.1 shows some
Scheme 6.1 Alternative immobilization chemistry for SPR chips.
102 SURFACE PLASMON RESONANCE BIOSENSOR DEVICES
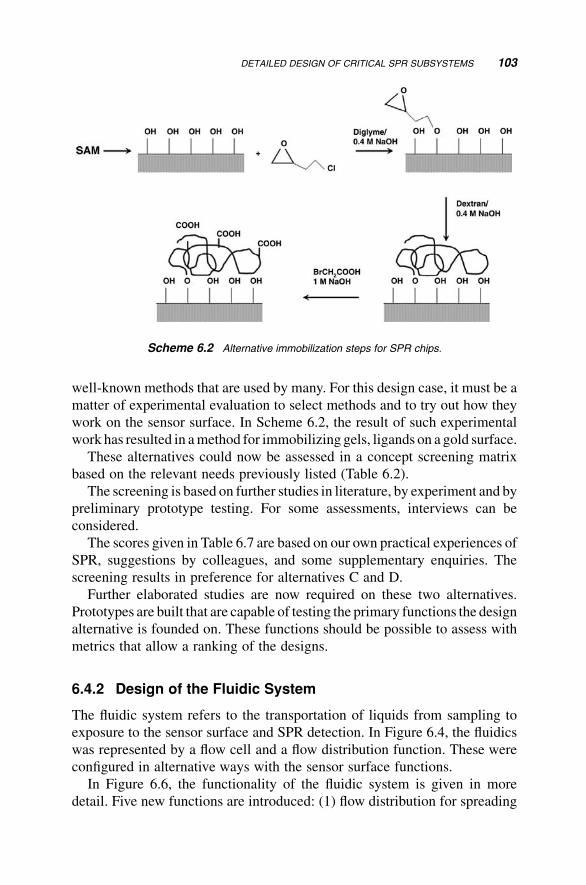
well-known methods that are used by many. For this design case, it must be a
matter of experimental evaluation to select methods and to try out how they
work on the sensor surface. In Scheme 6.2, the result of such experimental
work has resulted in amethod for immobilizing gels, ligands on a gold surface.
These alternatives could now be assessed in a concept screening matrix
based on the relevant needs previously listed (Table 6.2).
The screening is based on further studies in literature, by experiment and by
preliminary prototype testing. For some assessments, interviews can be
considered.
The scores given in Table 6.7 are based on our own practical experiences of
SPR, suggestions by colleagues, and some supplementary enquiries. The
screening results in preference for alternatives C and D.
Further elaborated studies are now required on these two alternatives.
Prototypes are built that are capable of testing the primary functions the design
alternative is founded on. These functions should be possible to assess with
metrics that allow a ranking of the designs.
6.4.2 Design of the Fluidic System
The fluidic system refers to the transportation of liquids from sampling to
exposure to the sensor surface and SPR detection. In Figure 6.4, the fluidics
was represented by a flow cell and a flow distribution function. These were
configured in alternative ways with the sensor surface functions.
In Figure 6.6, the functionality of the fluidic system is given in more
detail. Five new functions are introduced: (1) flow distribution for spreading
Scheme 6.2 Alternative immobilization steps for SPR chips.
DETAILED DESIGN OF CRITICAL SPR SUBSYSTEMS 103
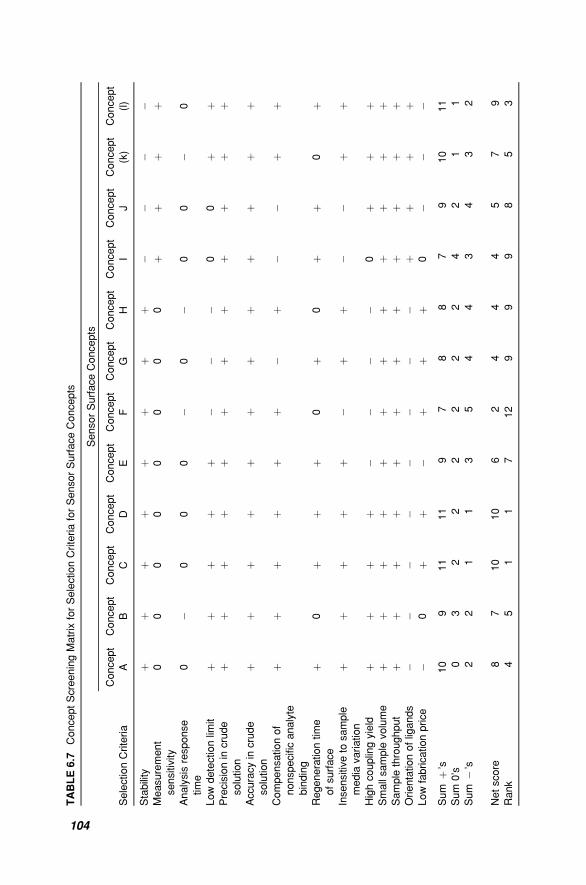
TABLE6.7
ConceptScreeningMatrix
forSelectio
nCriteriaforSenso
rSurfaceConcepts
Senso
rSurfaceConcepts
SelectionCriteria
Concept
A
Concept
B
Concept
C
Concept
D
Concept
E
Concept
F
Concept
G
Concept
H
Concept
I
Concept
J
Concept
(k)
Concept
(l)
Stability
þþ
þþ
þþ
þþ
��
��
Measurement
sensitivity
00
00
00
00
þþ
þþ
Analysisresponse
time
0�
00
0�
0�
00
�0
Low
detectionlim
itþ
þþ
þþ
��
�0
0þ
þPrecisionin
crude
solution
þþ
þþ
þþ
þþ
þþ
þþ
Accuracyin
crude
solution
þþ
þþ
þþ
þþ
þþ
þþ
Compensationof
nonspecificanalyte
binding
þþ
þþ
þþ
�þ
��
þþ
Regenerationtime
ofsurface
þ0
þþ
þ0
þ0
þþ
0þ
Insensitiveto
sample
media
variation
þþ
þþ
þ�
þþ
��
þþ
Highcouplingyield
þþ
þþ
��
��
0þ
þþ
Smallsample
volume
þþ
þþ
þþ
þþ
þþ
þþ
Sample
throughput
þþ
þþ
þþ
þþ
þþ
þþ
Orientatio
nofligands
��
��
��
��
þþ
þþ
Low
fabricationprice
�0
þþ
�þ
þþ
0�
��
Sum
þ’s
10
911
11
97
88
79
10
11
Sum
0’s
03
22
22
22
42
11
Sum
�’s
22
11
35
44
34
32
Netscore
87
10
10
62
44
45
79
Rank
45
11
712
99
98
53
104
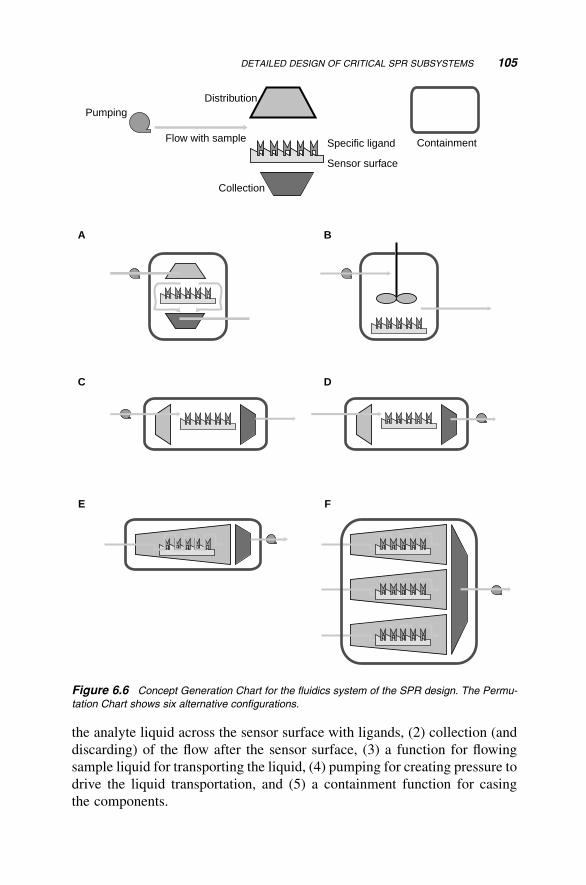
the analyte liquid across the sensor surface with ligands, (2) collection (and
discarding) of the flow after the sensor surface, (3) a function for flowing
sample liquid for transporting the liquid, (4) pumping for creating pressure to
drive the liquid transportation, and (5) a containment function for casing
the components.
Distribution
Flow with sample
Collection
Pumping
A B
C D
E F
Specific ligand
Sensor surface
Containment
Figure 6.6 Concept Generation Chart for the fluidics system of the SPR design. The Permu-
tation Chart shows six alternative configurations.
DETAILED DESIGN OF CRITICAL SPR SUBSYSTEMS 105
The five functions are loosely interrelated in the top of the figure. Below, six
alternative configurations are generated based on the functions.
Alternative A distributes the analyte flow over the sensor surface perpen-
dicular from above, letting the flow spread over the ligands. Then the flow
leaves the ligand surface at the periphery and becomes collected beneath the
sensor surface. The functions are assembled in the containment function, for
example, a compact plastic chamber. Only the pumping is placed outside the
container. The flow distribution could, for example, be a helical coil starting at
the center moving across the ligand surface until it reaches the periphery. It
could also be a thin space between a distributor plate and the sensor surface.
In alternative B, this arrangement has been replaced with a microchamber
with stirring, similar to a continuous stirred tank reactor. A microagitation
function is added (represented by a propeller, but could in reality be something
else causing mixing) on top of the sensor surface. The flow passing in is
instantaneously mixed and distributed, thus the agitator fills the distribution
function. The flow passes out from the chamber due to the pumping on new
sample liquid into the containment chamber. Here, we can envisage, for
example, a metallic microdevice with electrically generated vibrations.
In alternative C, the stirred tank fashion configuration has been replaced
with a transversal setup. Flow enters at one side of the sensor surface and
leaves at the opposite side. A distribution function is placed at the entrance and
a collector at the outlet. The containment shapes the setup to resemble a tube or
column intowhich liquid is pumped in. In this alternative, an integrated device
in polymeric materials can be foreseen. It would probably be easier to
miniaturize than alternative B.
Alternative D is the same as C but has the pumping function after the
containment. This may have a certain advantage: the sample flow is sucked
through the device causing lower hydrodynamic pressure inside the tube,
while the C setup causes an increase in hydrodynamic pressure. This may
influence mixing effects and diffusion of analytes to the ligands.
In alternative E, the distributor has been extended to cover the sensor
surface with ligands. The sample flow is coiled across the surface, forming a
channel close to the ligands. To realize this arrangement, a special design of
the distributor is needed. Probably, a lithography fabrication of the geometry
channel could be a solution.
Alternative F is a multiplication of the sensor surface in the same con-
tainment in order to multiply the capacity of the device. The E arrangement is
themost suited for this. The distribution functionwill now also have the role to
direct the flow to several sensor surfaces. The pump is placed after the
container. The number of sensor surfaces in on container can vary.
The six alternatives are screened in a matrix as above for critical target
specifications as listed in Table 6.8.
106 SURFACE PLASMON RESONANCE BIOSENSOR DEVICES
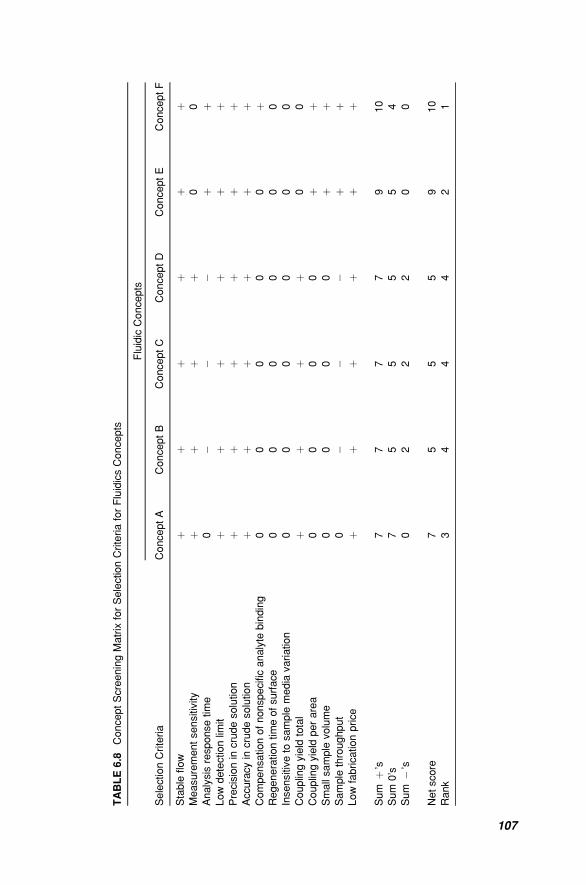
TABLE6.8
ConceptScreeningMatrix
forSelectio
nCriteriaforFluidicsConcepts
Fluidic
Concepts
SelectionCriteria
ConceptA
ConceptB
ConceptC
ConceptD
ConceptE
ConceptF
Stable
flow
þþ
þþ
þþ
Measurementsensitivity
þþ
þþ
00
Analysisresponsetime
0�
��
þþ
Low
detectionlim
itþ
þþ
þþ
þPrecisionin
crudesolution
þþ
þþ
þþ
Accuracyin
crudesolution
þþ
þþ
þþ
Compensationofnonspecificanalyte
binding
00
00
0þ
Regenerationtimeofsurface
00
00
00
Insensitiveto
sample
media
variation
00
00
00
Couplingyield
total
þþ
þþ
00
Couplingyield
perarea
00
00
þþ
Smallsample
volume
00
00
þþ
Sample
throughput
0�
��
þþ
Low
fabricationprice
þþ
þþ
þþ
Sum
þ’s
77
77
910
Sum
0’s
75
55
54
Sum
�’s
02
22
00
Netscore
75
55
910
Rank
34
44
21
107
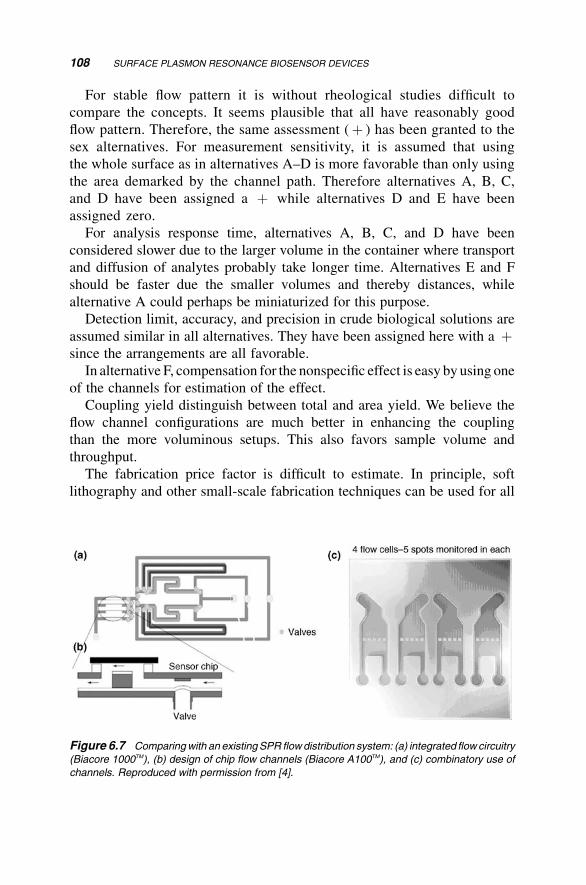
For stable flow pattern it is without rheological studies difficult to
compare the concepts. It seems plausible that all have reasonably good
flow pattern. Therefore, the same assessment (þ ) has been granted to the
sex alternatives. For measurement sensitivity, it is assumed that using
the whole surface as in alternatives A–D is more favorable than only using
the area demarked by the channel path. Therefore alternatives A, B, C,
and D have been assigned a þ while alternatives D and E have been
assigned zero.
For analysis response time, alternatives A, B, C, and D have been
considered slower due to the larger volume in the container where transport
and diffusion of analytes probably take longer time. Alternatives E and F
should be faster due the smaller volumes and thereby distances, while
alternative A could perhaps be miniaturized for this purpose.
Detection limit, accuracy, and precision in crude biological solutions are
assumed similar in all alternatives. They have been assigned here with a þsince the arrangements are all favorable.
In alternative F, compensation for the nonspecific effect is easy by using one
of the channels for estimation of the effect.
Coupling yield distinguish between total and area yield. We believe the
flow channel configurations are much better in enhancing the coupling
than the more voluminous setups. This also favors sample volume and
throughput.
The fabrication price factor is difficult to estimate. In principle, soft
lithography and other small-scale fabrication techniques can be used for all
Figure 6.7 Comparingwith an existingSPR flowdistribution system: (a) integrated flow circuitry
(Biacore 1000TM), (b) design of chip flow channels (Biacore A100TM), and (c) combinatory use of
channels. Reproduced with permission from [4].
108 SURFACE PLASMON RESONANCE BIOSENSOR DEVICES
alternatives equally. If so, mass production of units should be easy once an
assembling fabrication line is setup and automated.
The summation of the assessments ranks alternative F as the best and
alternativeE as the second best. Thus, this alternative should be pairedwith the
sensor chip design according to alternatives C and D. Since these two are
probably very similar from the fluidics point of view, any of these can be used
with fluidics alternative F.
In Figure 6.7, we see examples of this setup principle from the Biacore
1000TM andA100TM systems. It seems that these design solutions coincidewith
the conclusion of the mechatronic design analysis, while a more integrated
design as in SPREETA is not.
However, it must be emphasized that screening should be followed by
scoring assessment that would be based on more experimental evidence.
6.5 CONCLUSIONS
This chapter has shown in detail how the mechatronic conceptual design
theory is applied. It has shown the benefits of initially defining needs and target
specifications, continuing with generating design alternatives based on func-
tions and ranking these. It has also shown how the Hubka–Eder mapping
further analyzes these functions and relates them to the transformation
process, thereby increasing the understanding of the interactions of the
subsystems of the design.
In particular, the chapter has shown how the design methodology can be
useful for zooming-in critical and pivotal parts of the design, and by that, bring
these down to more concrete design solutions.
Here, in this chapter, we have not intended to go through all parts of the
methodology. Chapter 5 brought up other aspects of the design methodology
that also can be used within this example, such as functions interaction
matrices and anatomical blueprints.
REFERENCES
1. Ritchie, R.H. (1957) Plasma losses by fast electrons in thin films.Phys. Rev. 106,
874–881.
2. Turbader, T. (1959) Complete adsorption of light by thin metal films.Proc. Phys.
Soc. Lond. 73, 40–44.
REFERENCES 109
3. Reather, H. (1988) Surface plasmons on smooth and rough surfaces and
on gratings. In: H€ohler, G. (ed.), Springer Tracts in Modern Physics,
Springer-Verlag.
4. L€ofa�s, S. (2007) Biacore – creating the business of label-free protein-interaction
analysis. In: Marks, R.S., Cullen, D.C., Karube, I., Lowe, C.R., Weetall, H.H.
(eds.), Handbook of Biosensors and Biochips, Wiley.
5. Liedberg, B., Nylander, C., Lundstr€om I. (1983) Surface plasmon resonance for
gas detection and biosensing. Sens. Actuators 4, 299–304.
6. Marchesini, G.R., Koopal, K., Meulenberg, E., Haasnoot, W., Irth, H. (2007)
Spreeta-based biosensor assays for endocrine disruptors. Biosens. Bioelectron.
22, 1908–1915.
7. Karlsson, R. (2004) SPR formolecular interaction analysis: a review of emerging
application areas. J. Mol. Recogn. 17, 151–161.
8. Rich, R.L., Myszka, D.G. (2010) Grading the commercial optical biosensor
literature. J. Mol. Recogn. 23, 1–64.
9. Rich, R.L., Myszka, D.G. (2007) Survey of the year 2006 commercial optical
biosensor literature. J. Mol. Recogn. 20, 300–366.
10. Matejka, P., Hruby, P., Volka, K. (2003) Surface plasmon resonance and Raman
scattering effects studied for layers deposited on Spreeta sensors. Anal. Bioanal.
Chem. 375, 1240–1245.
11. Soelberg, S.D., Chinowsky, T., Geiss, G., Spinelli, C.B., Stevens, R., Near, S.,
Kauffman, P., Yee, S., Furlong, C.E. (2005) A portable surface plasmon
resonance sensor system for real-time monitoring of small to large analytes.
J. Ind. Microbiol. Biotechnol. 32, 669–674.
12. Haasnoot, W., Marchesini, G.R., Koopal, K. (2006) Spreeta-based biosensor
immunoassays to detect fraudulent adulteration in milk and milk powder. J.
AOAC Int. 89, 849–855.
13. Spangler, B.D., Wilkinson, E.A., Murphy, J.T., Tyler, B.J. (2001) Comparison of
the Spreeta (R) surface plasmon resonance sensor and a quartz crystal micro-
balance for detection of Escherichia coli heat-labile enterotoxin. Anal. Chim.
Acta 444, 149–161.
14. Chinowsky, T.M., Growa,M.S., Johnston, K.S., Nelson, K., Edwards, T., Fua, E.,
Yager, P. (2007) Compact, high performance surface plasmon resonance imaging
system. Biosens. Bioelectron. 22, 2208–2215.
15. Ulrich, K.T., Eppinger, S.D. (2007) Product Design and Development, 3rd
edition, McGraw-Hill, New York.
16. Derel€ov, M., Jonas, Detterfelt, J., Mats Bj€orkman, M., Mandenius, C.-F. (2008)
Engineering Design Methodology for Bio-Mechatronic Products. Biotechnol.
Prog., 24, 232–244.
17. Pahl, G., Beitz, W. (1996) Engineering Design: A Systematic Approach.
Springer, Berlin.
110 SURFACE PLASMON RESONANCE BIOSENSOR DEVICES

18. Hermanson, G.T., Malllia, A.K., Smith, P.K. (1992) Immobilization Affinity
Techniques, Academic Press, New York.
19. Johnsson, B., L€ofa�s, S., Lindquist, G. (1991) Immobilization of proteins to a
carboxymethyl dextranmodified gold surface for biospecific interaction analysis
in surface plasmon resonance. Anal. Biochem. 198, 268–277.
REFERENCES 111

7A Diagnostic Device for
Helicobacter pyloriInfection
The chapter describes the design of a clinically successful test system for
diagnosis of Helicobacter pylori infection based on detection of emission
from the bacteria in the patient’s breath. First, the epidemiology and the
variety of diagnostic principles for the infection are described (Section 7.1).
Then, the diagnostic needs are specified with a typical biomechatronic
design perspective on existing breath analysis methods (Section 7.2). This
is followed by generation and selection of different design alternatives for
breath testing (Section 7.3). The most highly ranked alternatives are further
analyzed by Hubka–Eder mapping and compared with one existing com-
mercial test (Section 7.4). The purpose of the chapter is to illustrate for the
readers how a typical bioanalytical technology such as the H. pylori breath
analysis can utilize the biomechatronic design methodology for generating
optimal design solutions.
7.1 DIAGNOSTIC PRINCIPLE OF HELICOBACTER INFECTION
The infection of the upper gastrointestinal tract, stomach, and duodenum by
the bacterium H. pylori is one of the most contagious diseases in the world.
Fifty percent of the world population is infected by H. pylori in upper
Biomechatronic Design in Biotechnology: A Methodology for Development ofBiotechnological Products, First Edition. Carl-Fredrik Mandenius and Mats Bjorkman.� 2011 John Wiley & Sons, Inc. Published 2011 by John Wiley & Sons, Inc.
113
gastrointestinal tract [1]. However, more than 80% of the infected individuals
are not symptomatic, and normally it takes long to develop the disease.
Chronic low-level inflammation of the stomach lining leads to duodenal and
gastric ulcers and stomach cancer [2]. The H. pylori bacterium penetrates the
mucoid lining of the stomach and cause there severe ulcers [1].
The H. pylori is the helical shaped Gram-negative bacterium. The bacte-
rium produces acidic enzymatic reactions causing lesions in the gastrointes-
tinal organs. High activities of urease, catalase, and oxidases, all involved in
these reactions, are potential candidates for diagnostic assaying for identi-
fying infected patients. H. pylori has also characteristic outer membrane
proteins, some available for immunoassays.
Diagnostic testing of the infection is considered a challenge in clinical
analysis [3]. This is partly due to that H. pylori is considered to lack
absolute reliability as an indicator of the gastric ulcer infection [4].
Therefore, so far, it is recommended to use combinations of test methods
for reliable diagnosis [5–7].
Currently applied diagnostic methods are summarized in Figure 7.1. Very
reliable aremicrobial cultures of endoscopic biopsies from thegastrointestinal
stomach. The drawback is the long culture time taking at least 1 day and
sometimes difficult microscopic identification of the infecting species. Di-
agnosis can also include antibiotic susceptibility testing by culturing for
planning therapy. Alternatively, polymerase chain reaction (PCR) methods
can be used for critical genes [5].
Faster methods are serological tests [8]. For example, blood antibody
testing of urease or other sufficiently specific biomarkers for H. pylori is
possible to run within 1 h but requires analytical equipment, skilled practice,
and expensive reagents. Another possibility is urine sampling followed by
ELISA assaying. Also, stool samples are considered reliable. PCR analysis
of specific genes of H. pylori has a very high identification precision but is
costly and time consuming. Histological examination of biopsies, although
also time consuming, has a high reliability and precision for diagnosis [6, 7].
In recent years, urea breath tests (UBTs) have become increasingly popular.
TheUBTexists in several variants [9–12]. Two isotopes of urea are used in the
tests, the 13C or the 14C urea isotope, which are detected with different
methods. Citrate is usually added to enhance the reaction. The false negative
responses are normally low.
The UBT systems are considered cost-effective in the healthcare system
and are therefore often the method of choice. To invent or refine better UBT
devices or kits is consequently a prioritized product development activity.
One of the already commercially realized UBT systems is the Heliprobe�test (Figure 7.2). The Heliprobe uses 14C-labeled urea ingested by the patient
in a tablet form. The tablet is dissolved in the stomach and urea is, when
114 A DIAGNOSTIC DEVICE FOR HELICOBACTER PYLORI INFECTION
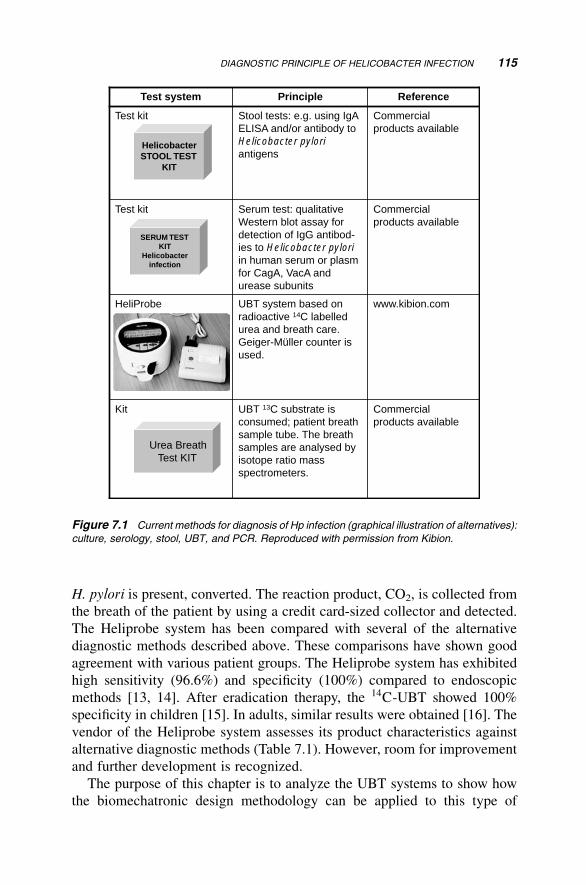
H. pylori is present, converted. The reaction product, CO2, is collected from
the breath of the patient by using a credit card-sized collector and detected.
The Heliprobe system has been compared with several of the alternative
diagnostic methods described above. These comparisons have shown good
agreement with various patient groups. The Heliprobe system has exhibited
high sensitivity (96.6%) and specificity (100%) compared to endoscopic
methods [13, 14]. After eradication therapy, the 14C-UBT showed 100%
specificity in children [15]. In adults, similar results were obtained [16]. The
vendor of the Heliprobe system assesses its product characteristics against
alternative diagnostic methods (Table 7.1). However, room for improvement
and further development is recognized.
The purpose of this chapter is to analyze the UBT systems to show how
the biomechatronic design methodology can be applied to this type of
Commercial
products available
UBT 13C substrate is
consumed; patient breath
sample tube. The breath
samples are analysed by
isotope ratio mass
spectrometers.
Kit
www.kibion.comUBT system based on
radioactive 14C labelled
urea and breath care.
Geiger-Müller counter is
used.
HeliProbe
Commercial
products available
Serum test: qualitative
Western blot assay for
detection of IgG antibod-
ies to Helicobacter pyloriin human serum or plasm
for CagA, VacA and
urease subunits
Test kit
Commercial
products available
Stool tests: e.g. using IgA
ELISA and/or antibody to
Helicobacter pyloriantigens
Test kit
ReferencePrincipleTest system
Urea BreathUrea Breath
Test KITTest KIT
HelicobacterHelicobacterSTOOL TESTSTOOL TEST
KITKIT
SERUM TESTSERUM TESTKITKIT
HelicobacterHelicobacterinfectioninfection
Figure 7.1 Current methods for diagnosis of Hp infection (graphical illustration of alternatives):
culture, serology, stool, UBT, and PCR. Reproduced with permission from Kibion.
DIAGNOSTIC PRINCIPLE OF HELICOBACTER INFECTION 115
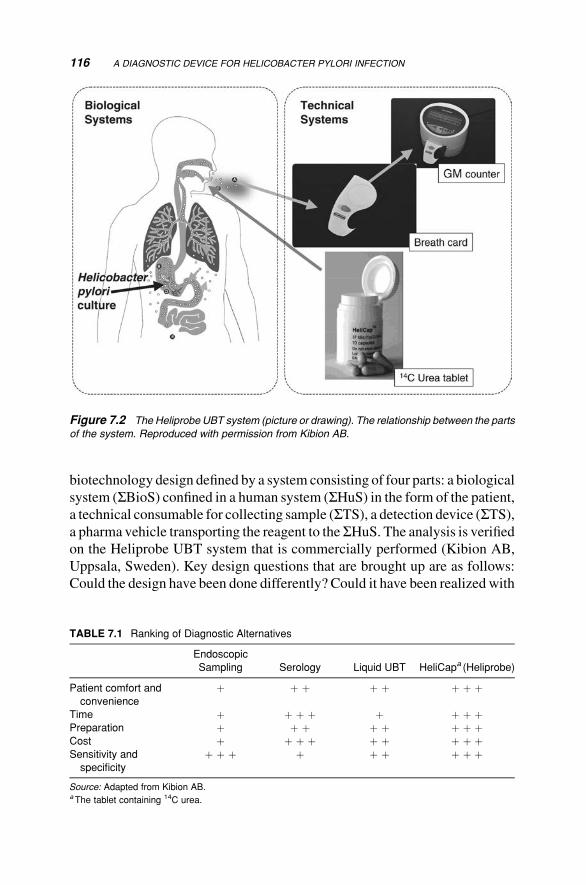
biotechnology design defined by a system consisting of four parts: a biological
system (SBioS) confined in a human system (SHuS) in the form of the patient,
a technical consumable for collecting sample (STS), a detection device (STS),a pharma vehicle transporting the reagent to theSHuS. The analysis is verifiedon the Heliprobe UBT system that is commercially performed (Kibion AB,
Uppsala, Sweden). Key design questions that are brought up are as follows:
Could the design have been done differently? Could it have been realized with
Figure 7.2 The Heliprobe UBT system (picture or drawing). The relationship between the parts
of the system. Reproduced with permission from Kibion AB.
TABLE 7.1 Ranking of Diagnostic Alternatives
Endoscopic
Sampling Serology Liquid UBT HeliCapa (Heliprobe)
Patient comfort and
convenience
þ þ þ þ þ þ þ þ
Time þ þ þ þ þ þ þ þPreparation þ þ þ þ þ þ þ þCost þ þ þ þ þ þ þ þ þSensitivity and
specificity
þ þ þ þ þ þ þ þ þ
Source: Adapted from Kibion AB.aThe tablet containing 14C urea.
116 A DIAGNOSTIC DEVICE FOR HELICOBACTER PYLORI INFECTION
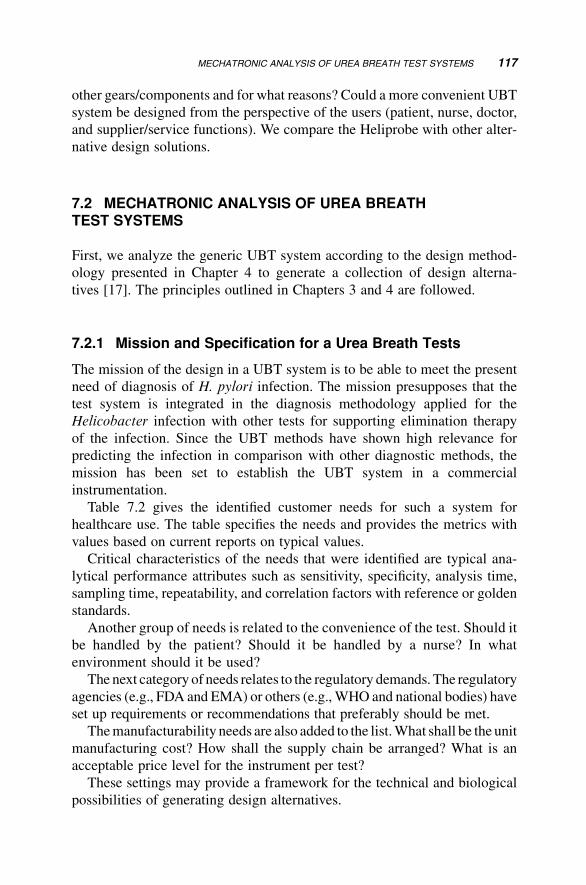
other gears/components and for what reasons? Could a more convenient UBT
system be designed from the perspective of the users (patient, nurse, doctor,
and supplier/service functions). We compare the Heliprobe with other alter-
native design solutions.
7.2 MECHATRONIC ANALYSIS OF UREA BREATHTEST SYSTEMS
First, we analyze the generic UBT system according to the design method-
ology presented in Chapter 4 to generate a collection of design alterna-
tives [17]. The principles outlined in Chapters 3 and 4 are followed.
7.2.1 Mission and Specification for a Urea Breath Tests
The mission of the design in a UBT system is to be able to meet the present
need of diagnosis of H. pylori infection. The mission presupposes that the
test system is integrated in the diagnosis methodology applied for the
Helicobacter infection with other tests for supporting elimination therapy
of the infection. Since the UBT methods have shown high relevance for
predicting the infection in comparison with other diagnostic methods, the
mission has been set to establish the UBT system in a commercial
instrumentation.
Table 7.2 gives the identified customer needs for such a system for
healthcare use. The table specifies the needs and provides the metrics with
values based on current reports on typical values.
Critical characteristics of the needs that were identified are typical ana-
lytical performance attributes such as sensitivity, specificity, analysis time,
sampling time, repeatability, and correlation factors with reference or golden
standards.
Another group of needs is related to the convenience of the test. Should it
be handled by the patient? Should it be handled by a nurse? In what
environment should it be used?
The next category of needs relates to the regulatory demands. The regulatory
agencies (e.g., FDA and EMA) or others (e.g.,WHO and national bodies) have
set up requirements or recommendations that preferably should be met.
Themanufacturability needs are also added to the list.What shall be the unit
manufacturing cost? How shall the supply chain be arranged? What is an
acceptable price level for the instrument per test?
These settings may provide a framework for the technical and biological
possibilities of generating design alternatives.
MECHATRONIC ANALYSIS OF UREA BREATH TEST SYSTEMS 117
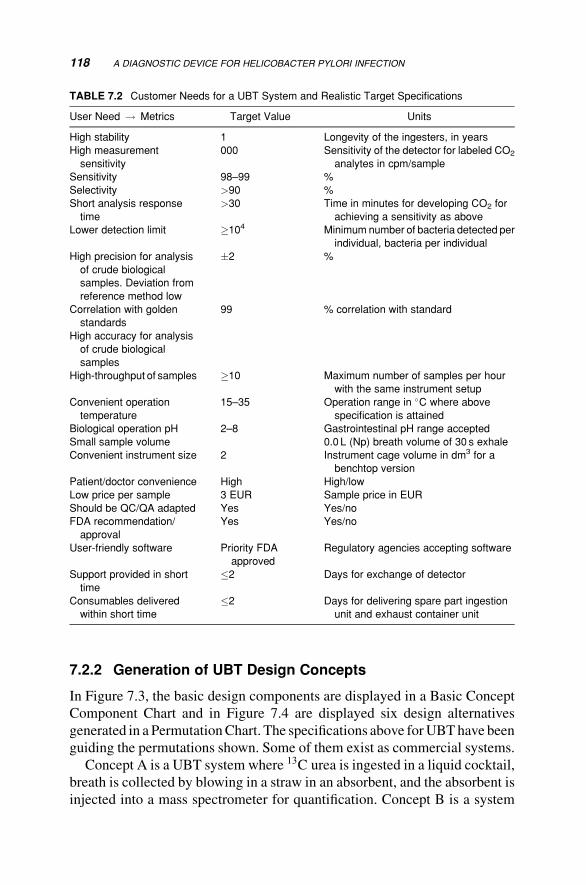
7.2.2 Generation of UBT Design Concepts
In Figure 7.3, the basic design components are displayed in a Basic Concept
Component Chart and in Figure 7.4 are displayed six design alternatives
generated in a PermutationChart. The specifications above forUBThave been
guiding the permutations shown. Some of them exist as commercial systems.
Concept A is a UBT system where 13C urea is ingested in a liquid cocktail,
breath is collected by blowing in a straw in an absorbent, and the absorbent is
injected into a mass spectrometer for quantification. Concept B is a system
TABLE 7.2 Customer Needs for a UBT System and Realistic Target Specifications
User Need ! Metrics Target Value Units
High stability 1 Longevity of the ingesters, in years
High measurement
sensitivity
000 Sensitivity of the detector for labeled CO2
analytes in cpm/sample
Sensitivity 98–99 %
Selectivity >90 %
Short analysis response
time
>30 Time in minutes for developing CO2 for
achieving a sensitivity as above
Lower detection limit �104 Minimum number of bacteria detected per
individual, bacteria per individual
High precision for analysis
of crude biological
samples. Deviation from
reference method low
�2 %
Correlation with golden
standards
99 % correlation with standard
High accuracy for analysis
of crude biological
samples
High-throughput of samples �10 Maximum number of samples per hour
with the same instrument setup
Convenient operation
temperature
15–35 Operation range in �C where above
specification is attained
Biological operation pH 2–8 Gastrointestinal pH range accepted
Small sample volume 0.0 L (Np) breath volume of 30 s exhale
Convenient instrument size 2 Instrument cage volume in dm3 for a
benchtop version
Patient/doctor convenience High High/low
Low price per sample 3 EUR Sample price in EUR
Should be QC/QA adapted Yes Yes/no
FDA recommendation/
approval
Yes Yes/no
User-friendly software Priority FDA
approved
Regulatory agencies accepting software
Support provided in short
time
�2 Days for exchange of detector
Consumables delivered
within short time
�2 Days for delivering spare part ingestion
unit and exhaust container unit
118 A DIAGNOSTIC DEVICE FOR HELICOBACTER PYLORI INFECTION
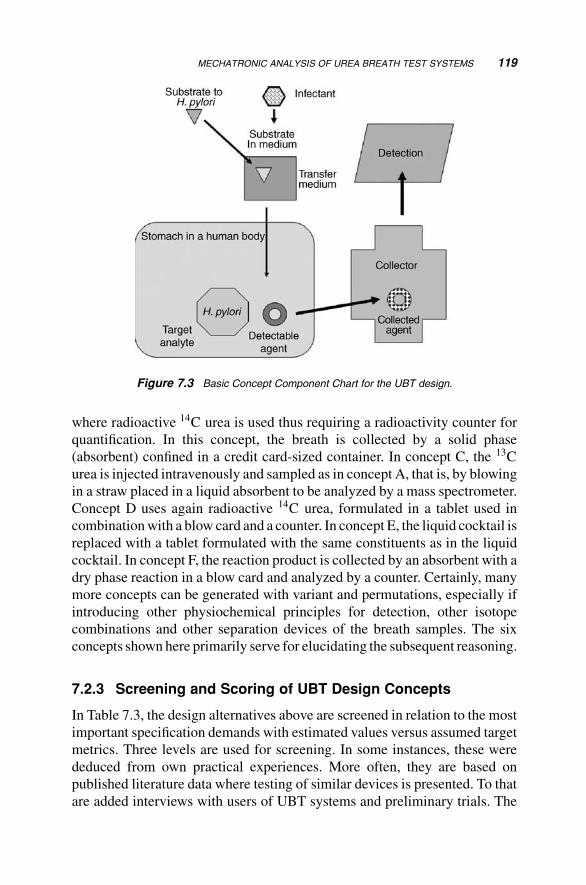
where radioactive 14C urea is used thus requiring a radioactivity counter for
quantification. In this concept, the breath is collected by a solid phase
(absorbent) confined in a credit card-sized container. In concept C, the 13C
urea is injected intravenously and sampled as in concept A, that is, by blowing
in a straw placed in a liquid absorbent to be analyzed by a mass spectrometer.
Concept D uses again radioactive 14C urea, formulated in a tablet used in
combinationwith a blow card and a counter. In concept E, the liquid cocktail is
replaced with a tablet formulated with the same constituents as in the liquid
cocktail. In concept F, the reaction product is collected by an absorbent with a
dry phase reaction in a blow card and analyzed by a counter. Certainly, many
more concepts can be generated with variant and permutations, especially if
introducing other physiochemical principles for detection, other isotope
combinations and other separation devices of the breath samples. The six
concepts shown here primarily serve for elucidating the subsequent reasoning.
7.2.3 Screening and Scoring of UBT Design Concepts
In Table 7.3, the design alternatives above are screened in relation to the most
important specification demands with estimated values versus assumed target
metrics. Three levels are used for screening. In some instances, these were
deduced from own practical experiences. More often, they are based on
published literature data where testing of similar devices is presented. To that
are added interviews with users of UBT systems and preliminary trials. The
Figure 7.3 Basic Concept Component Chart for the UBT design.
MECHATRONIC ANALYSIS OF UREA BREATH TEST SYSTEMS 119
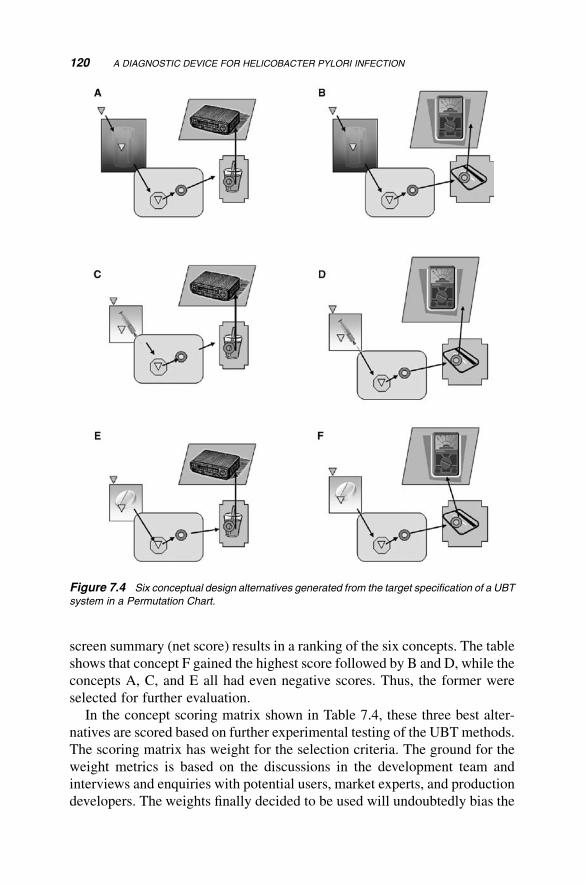
screen summary (net score) results in a ranking of the six concepts. The table
shows that concept F gained the highest score followed by B and D, while the
concepts A, C, and E all had even negative scores. Thus, the former were
selected for further evaluation.
In the concept scoring matrix shown in Table 7.4, these three best alter-
natives are scored based on further experimental testing of the UBTmethods.
The scoring matrix has weight for the selection criteria. The ground for the
weight metrics is based on the discussions in the development team and
interviews and enquiries with potential users, market experts, and production
developers. The weights finally decided to be used will undoubtedly bias the
Figure 7.4 Six conceptual design alternatives generated from the target specification of a UBT
system in a Permutation Chart.
120 A DIAGNOSTIC DEVICE FOR HELICOBACTER PYLORI INFECTION
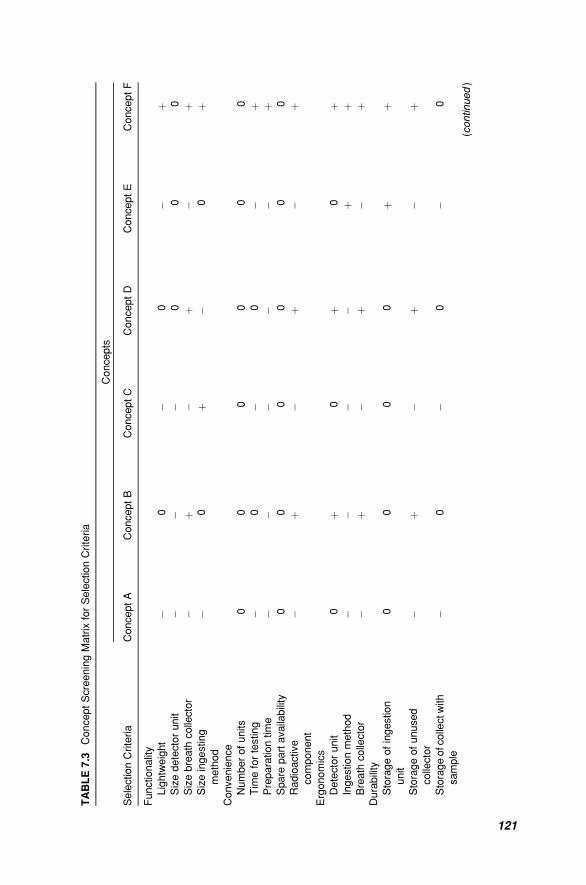
TABLE7.3
ConceptScreeningMatrix
forSelectio
nCriteria
SelectionCriteria
Concepts
ConceptA
ConceptB
ConceptC
ConceptD
ConceptE
ConceptF
Functio
nality
Lightweight
�0
�0
�þ
Sizedetectorunit
��
�0
00
Sizebreath
collector
�þ
�þ
�þ
Sizeingestin
g
method
�0
þ�
0þ
Convenience
Numberofunits
00
00
00
Tim
efortesting
�0
�0
�þ
Preparatio
ntime
��
��
�þ
Spare
partavailability
00
00
00
Radioactive
component
�þ
�þ
�þ
Ergonomics
Detectorunit
0þ
0þ
0þ
Ingestionmethod
��
��
þþ
Breath
collector
�þ
�þ
�þ
Durability
Storageofingestio
n
unit
00
00
þþ
Storageofunuse
d
collector
�þ
�þ
�þ
Storageofcollectw
ith
sample
�0
�0
�0
(continued)
121
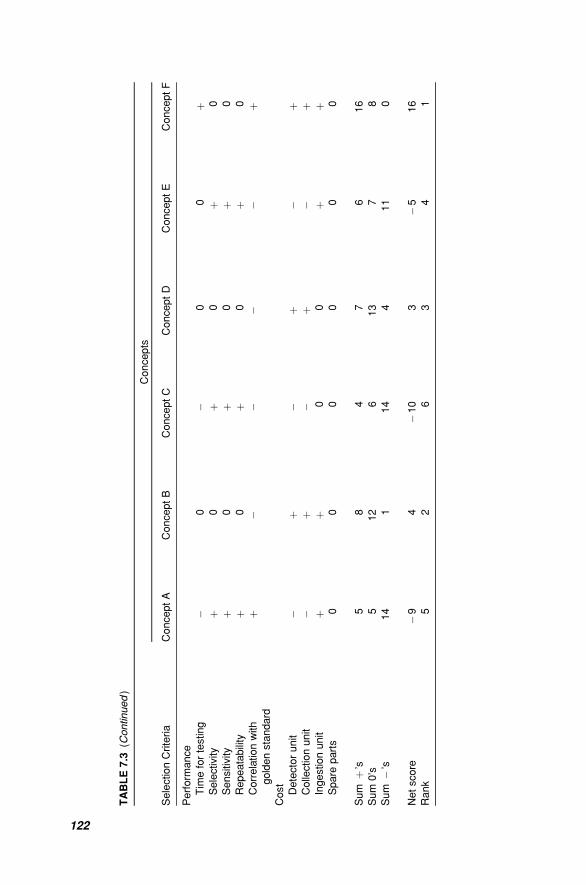
TABLE7.3
(Continued)
SelectionCriteria
Concepts
ConceptA
ConceptB
ConceptC
ConceptD
ConceptE
ConceptF
Perform
ance
Tim
efortesting
�0
�0
0þ
Selectivity
þ0
þ0
þ0
Sensitivity
þ0
þ0
þ0
Repeatability
þ0
þ0
þ0
Correlationwith
goldenstandard
þ�
��
�þ
Cost
Detectorunit
�þ
�þ
�þ
Collectionunit
�þ
�þ
�þ
Ingestio
nunit
þþ
00
þþ
Spare
parts
00
00
00
Sum
þ’s
58
47
616
Sum
0’s
512
613
78
Sum
�’s
14
114
411
0
Netscore
�9
4�10
3�5
16
Rank
52
63
41
122
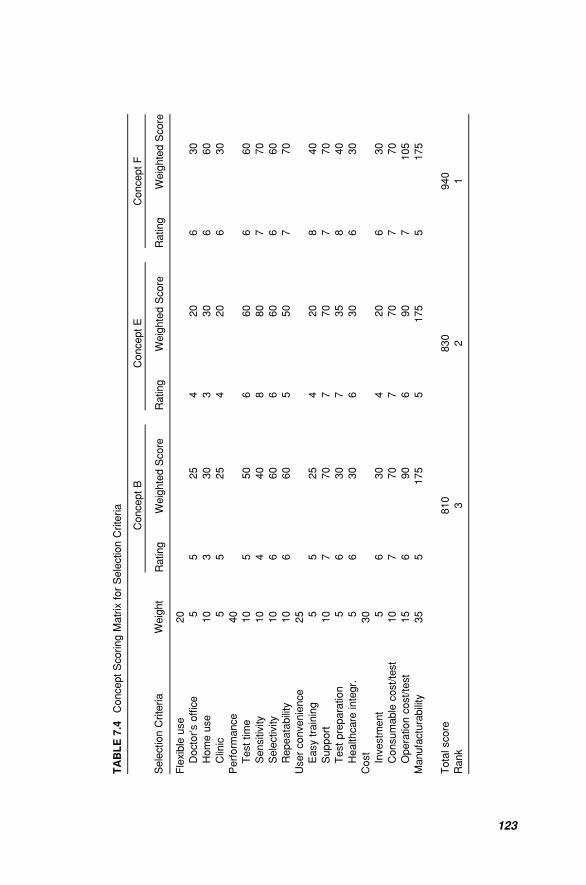
TABLE7.4
ConceptSco
ringMatrix
forSelectio
nCriteria
SelectionCriteria
Weight
ConceptB
ConceptE
ConceptF
Ratin
gWeightedScore
Ratin
gWeightedScore
Rating
WeightedScore
Flexible
use
20
Doctor’soffice
55
25
420
630
Homeuse
10
330
330
660
Clinic
55
25
420
630
Perform
ance
40
Testtime
10
550
660
660
Sensitivity
10
440
880
770
Selectivity
10
660
660
660
Repeatability
10
660
550
770
Userconvenience
25
Easytraining
55
25
420
840
Support
10
770
770
770
Testpreparatio
n5
630
735
840
Health
care
integr.
56
30
630
630
Cost
30
Investm
ent
56
30
420
630
Consumable
cost/test
10
770
770
770
Operatio
ncost/test
15
690
690
7105
Manufacturability
35
5175
5175
5175
Totalscore
810
830
940
Rank
32
1
123
outcome of the scoring. Thus, it is of utmost importance to make careful
decisions and thorough weight estimates. The rationales used in Table 7.4
are based on a thorough analysis of the competition situation for UBT
systems, the assessment of the healthcare systems criteria for diagnostic
methods, and the set standardization by international committees for clinical
gastroenterology. As can be noted, performance weights are highest, which
is based on the fact that the credibility of test results has priority in most
Western healthcare systems and these countries are the primemarkets for the
product. The convenience and flexibility weights are also high due to the
appreciated general level of new instrumentation in healthcare. Manufactur-
ing price is also provided with a high weight due to the commercial target
value of the producers of the UBT systems.
The score number is on a scale of 1–8 where 8 is the optimal performance of
the established selection criteria.Each criterion has a tabulated scorevalue. The
score values are associated with the specification target metrics. Again, test
programs with representative samples and individuals have been considered.
7.3 DESCRIPTION OF THE SYSTEMS INVOLVED INTHE DESIGN CONCEPTS FOR THE UREA BREATHTESTS
The transformation process (TrP) that should take place in theUBT systemcan
be divided into three phases [18,19]. First, urea is going to be ingested and
transported to the Helicobacter infection. Second, the conversion of urea to
CO2 by the bacteria-derived urease shall be executed. Third, the formed CO2
should be collected and measured. The primary operands are the 14C urea and
a formulation. Secondary inputs are probably a disposable sampler and breath
of the patient. Possibly, the patient data can also be input into the analytical
system. The operand out from the TrP is the obtained analytical data.
The secondary outputs are exhaust breath, used samplers, and residual
formulation.
This is not the only possible configuration of the TrP. What characterizes
this is that the patient and device are both included. This has been chosen
for more optimally describing the effect interactions of the systems. The
Hubka–Eder map in Figure 7.5 shows the transformation process, its phases,
and inputs and outputs.
7.3.1 Biological Systems Involved
The biological systems involved in the design of the diagnostic instrument
are (1) the bacterium, (2) the patient’s organs involved in the diagnostic
124 A DIAGNOSTIC DEVICE FOR HELICOBACTER PYLORI INFECTION
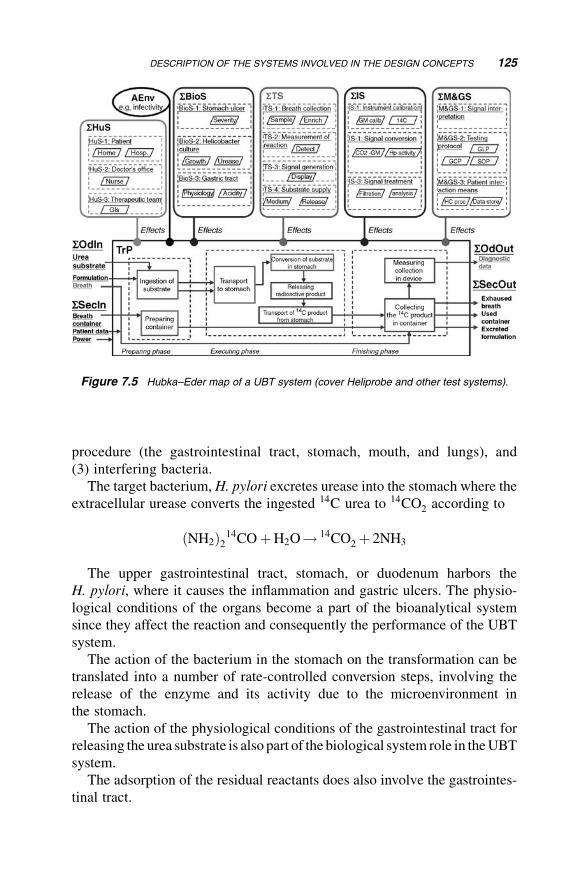
procedure (the gastrointestinal tract, stomach, mouth, and lungs), and
(3) interfering bacteria.
The target bacterium, H. pylori excretes urease into the stomach where the
extracellular urease converts the ingested 14C urea to 14CO2 according to
ðNH2Þ214COþH2O! 14CO2 þ 2NH3
The upper gastrointestinal tract, stomach, or duodenum harbors the
H. pylori, where it causes the inflammation and gastric ulcers. The physio-
logical conditions of the organs become a part of the bioanalytical system
since they affect the reaction and consequently the performance of the UBT
system.
The action of the bacterium in the stomach on the transformation can be
translated into a number of rate-controlled conversion steps, involving the
release of the enzyme and its activity due to the microenvironment in
the stomach.
The action of the physiological conditions of the gastrointestinal tract for
releasing the urea substrate is also part of the biological system role in theUBT
system.
The adsorption of the residual reactants does also involve the gastrointes-
tinal tract.
Figure 7.5 Hubka–Eder map of a UBT system (cover Heliprobe and other test systems).
DESCRIPTION OF THE SYSTEMS INVOLVED IN THE DESIGN CONCEPTS 125
The biological transformation reaction can potentially be carried out by
other invading bacteria in the biological system. This could be the mouth
bacterial flora. Thus, additional biological systems must be considered in the
design as well. Figure 7.5 shows the biological systems that may cause effects
on the UBT design.
7.3.2 Technical Systems Alternatives
Based on the outline of the TrP several different technical systems (STS)become involved. These are (1) the formulation of the substrate, (2) the
collection of sample, and (3) the detection systems of the collected analyte
molecule.
The formulation of the substrate is, in principle, a pharmaceutical design
solution. It is an oral formulation, either a tablet or a liquid. The composition of
the components of a tablet and its fabrication could follow typical procedures
for pharmaceutical tablet preparation. If a liquid formulation is preferred, a
cocktail should be considered. The formulation shall release 14C urea in the
stomach. It can effectuate various side reactions that facilitate uptake and pH
control.14CO2 is exhaled in the breath and the breath is collected for analysis. This
could be a bag or an absorbent. In one of the systems considered, it is a so-
called breath card that the patient blows in until it is saturated.An indicator dye
shows when the absorbent is filled. Thus, the function is to collect gaseous
sample with 14CO2 in a quantitatively representative way so the subsequent
detection of the CO2 formed by urease is made.
The absorbed sample of CO2 shall be determined. Since it is labeled with14C or possibly some other isotope, the detection function can be carried
out with typical radiochemistry methods such as b-scintillators or with
Geiger–M€uller counters. Alternatively, mass spectrometry may be used
where the mass number for the isotope is recorded.
The counts per minutes or the mass spectrometry signals become the
analytical response.
The detection function is selected based on response time, sensitivity,
analytical cost, measurement time, convenience for measurement, and so on.
These properties are to interact with the sampling method, thus the interac-
tions between these subsystems are critical for the design.
Furthermore, the manufacturability of the chosen technical systems should
be considered. Design for manufacturing analysis will include unit cost,
manufacturing time, reproducibility of sampling device (e.g., card), and
reproducibility of formulation of tablet/liquid. These should be factors in
the ranking of methods/solutions.
126 A DIAGNOSTIC DEVICE FOR HELICOBACTER PYLORI INFECTION
7.3.3 Information Systems (SIS) Required
The information systems’ (SIS) key component is found in the technical
system of the detector. The signal is displayed to the user based on software
interface. The functionality of the software becomes an important part of the
designwhere calibration of signals to the user information is defined. Thismay
include functions for statistics andmore or less customer specified parameters.
If the customer shall have the opportunity to adjust the functions or if the
parameters are set by the manufacturer of the UBT system, there are other
alternative design choices.
7.3.4 Management and Goal Systems Required
The software can contain several important management and goal systems
(SM&GS) functions. The clinical practice and the regulatory requirements of
the test systems are probably set with the supervision of the regulators or
according to other standardization bodies or committees. If these functions are
embedded in the software, it is an important design decision.
Distribution of cards and tablets should also be on the functions of the test
system.How these functions interactwith different alternatives of theSTSandSIS may result in different priorities of the design solutions. Cost for
effectuating the function is definitely a key consideration for market success
of the UBT system.
The detector system is also a part of this. The device is either repaired or
discarded when there is malfunction and a new detector device is provided.
This affects the design.
Other service function concerns expert advice, howeasy instrumental faults
are diagnosed, and so on.
7.3.5 Human Systems Involved in the Testing
The human systems involved are the patient to be diagnosed, the nurse
carrying out the test, the doctor receiving the diagnostic results, and possibly
other member of the therapy team.
The patient’s role in the diagnosis is to ingest the urea formulation and
breathe into the collection device. The ways different patients do this shall be
considered in the design of different alternatives of formulations and collec-
tion devices.
The nurse’s role is to interact with the patient through instructions and to
carry out the manual procedure of the sampling device and the detector
device. The nurse shall also interact with the doctor about the diagnostic
results.
DESCRIPTION OF THE SYSTEMS INVOLVED IN THE DESIGN CONCEPTS 127
The doctor’s role is to receive the information from the display of the
detector through the nurse. The doctor shall probably also interact with the
therapy team.
The supply of tablets and cards are to be done by a service function at the
doctor’s office/clinic, where different systems are followed depending on
the country or healthcare system.
Consequently, the analysis of the functions on the SHuS involved in the useof the UBT system are numerous and complex per se. The variation may be
considerable depending in the marketing strategy. For the design issue, these
consequences are extensive to take into account when evaluating the design
alternatives.
7.3.6 Active Environment That Can Influence
Finally, the active environment (AEnv) plays a role in the design. Here, we
decided to include unknown bacteria in the body as part of the SBioS. Thus,the focus of the active environment is on how conditions in the environment
influence the performance of the other systems. Ambient conditions have
effects on the devices.
Are there any environmental conditions that are unique for this type of test
system?
Could regulatory framework change? Will the disease affect a significant
part of the world population change? Will there be side effects due to other
treatments of patients? These types of questions can be asked but are not
always possible to reply.
In Figure 7.6, an anatomical blueprint of theHubka–Edermap is set up. The
concept alternatives in the Permutation Chart are captured in the blueprint.
One of the components should be selected and the Scoring Matrix has
suggested which. However, the SBioS, STS, SIS, and SM&GS should now
be scrutinized versus the anatomical alternatives. This will be further exem-
plified in the next chapter.
7.4 ASPECTS OF THE DESIGN FOR EFFICIENTMANUFACTURE
The cost has always beenvery important for themajority of products. This has
been the case especially for “standard” products where price often is an order
winner. An order winner is a product feature that is very important for getting
the order from the customer. For more advanced products, performance and
quality have been order winners and the cost has often been of limited
importance. The price has instead been an order qualifier. That is, the
128 A DIAGNOSTIC DEVICE FOR HELICOBACTER PYLORI INFECTION
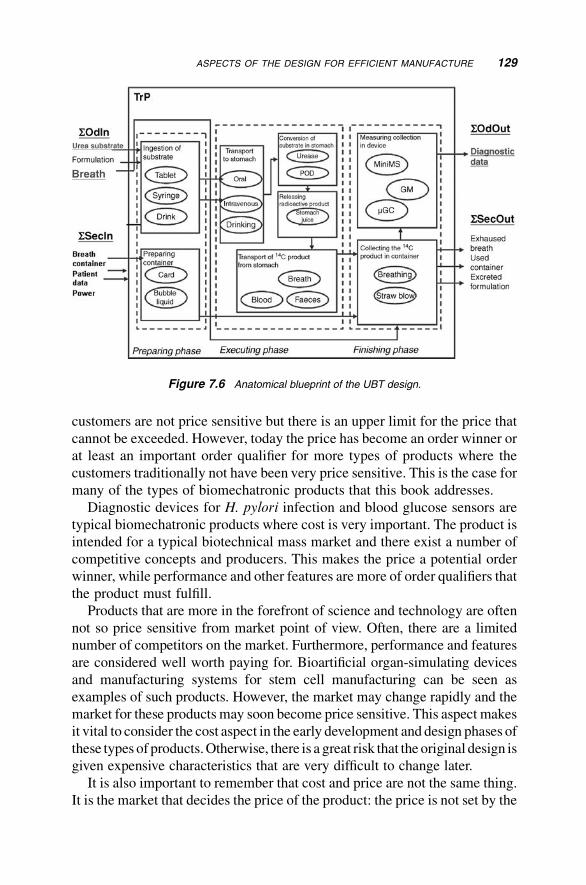
customers are not price sensitive but there is an upper limit for the price that
cannot be exceeded. However, today the price has become an order winner or
at least an important order qualifier for more types of products where the
customers traditionally not have been very price sensitive. This is the case for
many of the types of biomechatronic products that this book addresses.
Diagnostic devices for H. pylori infection and blood glucose sensors are
typical biomechatronic products where cost is very important. The product is
intended for a typical biotechnical mass market and there exist a number of
competitive concepts and producers. This makes the price a potential order
winner, while performance and other features are more of order qualifiers that
the product must fulfill.
Products that are more in the forefront of science and technology are often
not so price sensitive from market point of view. Often, there are a limited
number of competitors on the market. Furthermore, performance and features
are considered well worth paying for. Bioartificial organ-simulating devices
and manufacturing systems for stem cell manufacturing can be seen as
examples of such products. However, the market may change rapidly and the
market for these products may soon become price sensitive. This aspect makes
it vital to consider the cost aspect in the early development and design phases of
these types of products.Otherwise, there is a great risk that the original design is
given expensive characteristics that are very difficult to change later.
It is also important to remember that cost and price are not the same thing.
It is the market that decides the price of the product: the price is not set by the
Figure 7.6 Anatomical blueprint of the UBT design.
ASPECTS OF THE DESIGN FOR EFFICIENT MANUFACTURE 129
cost. The greater the positive difference between price and cost, the greater
will be the profits for the selling company.However, a change inmarket due to,
for example, new competitorsmay result in a rapid decrease in price. Thismay
result in huge difficulties for a company if the costs are too high and it is
difficult to reduce them quickly.
There exist two major means to achieve a cost-efficient product design.
These are as follows:
. A concurrent and integrated design process.
. Use of design for manufacturing/assembly tools.
A concurrent and integrated design process is a process where the product
and the manufacturing system for the product are designed concurrently
and integrated by a cross-functional team with complementing competences
and knowledge [17] (see also Chapter 2.7.1). The decisions that govern the
main costs are often taken very early in the development and/or design
process. This makes it vital that the manufacturing engineers are involved
from the very beginning of the development and design of new products. It is
vital that the manufacturing engineers are given a real influence decision-
making power on the design of the product. The biomechatronic design
methodology in this book can act as an important instrument for supporting the
communication between the designers and the manufacturing engineers.
There has been a lot of work done in the field of tools for design for
manufacturing, assembly and costs (DfM, DfA, and DfC). One of the most
influential researchers in this field is G. Boothroyd. Automatic Assembly,
coauthored by him with C. Poli and L. Murch and published in 1982, was one
of the first books that addressed this area [20]. It started a development that has
had a large impact on both the industrial and the academic fields. He then
published many more books on the subject, often teaming with P. Dewhurst.
The DfM tools are often very useful, but they normally focus on the later
stages of the design process where the main costs already have been decided.
Therefore, it is important to combine a concurrent and integrated design
process with the use of design for manufacturing/assembly tools. The two
approaches complement each other.
Two researchers that have had a great impact on product design and
development are Ulrich and Eppinger [17]. They stress the importance of
design for manufacturing. Their DfM method includes the following steps:
. Estimate the manufacturing costs
. Reduce component costs
. Reduce assembly costs
130 A DIAGNOSTIC DEVICE FOR HELICOBACTER PYLORI INFECTION
. Reduce the manufacturing support costs
. Consider the impact of DfM decisions on other factors
The biomechatronicmethodology can be combinedwith thisDfMmethod, for
example, for estimation of consequences that different alternative concepts
have for the costs. The methodology can act as a support for the task of
performing these estimations.
7.5 CONCLUSIONS
The biomechatronic design methodology has, as discussed in this chapter,
been applied on a device that exemplifies a composite of biology, biochemical
and microbial conversion, pharmaceutical ingestion, radionuclide physics,
micromechanics, medical diagnostics, and measurement technology. The
breadth of techniques applied within the same device with its supporting
consumables is apparent. A consequence of this is that the design alternatives
and the possibilities to generate solutions are numerous. This strongly justifies
mobilization of efficient design tools.
This example should have highlighted the utility of the mechatronic design
methodology for a distinctly biology-driven device. The preference for one
design solution is revealed early and further confirmed with the different
design tools applied.
In this case, an already existing device has been selected to illuminate the
advantages of the methodology. Not so surprising, the product development
done in these UBT systems has today reached a stage of completion that this
basic example confirms.
On the one hand, the generated analysis shows that the selection of
components has been done wisely within the boundaries given. On the other
hand, the results also suggest that the anatomy can still be refined, provided
new components are invented.
REFERENCES
1. Qureschi, W.A., Graham, D.Y. (1997) Diagnosis and management of Helico-
bacter pylori infection. Clin. Cornerstone 1, 18–28.
2. Brown, L.M. (2000) Helicobacter pylori, epidemiology and routes of transmis-
sion. Epidemiol. Rev. 22, 283–297.
3. Peura, D.A. (1995) Helicobacter pylori, a diagnostic dilemma or a dilemma of
diagnostics. Gastroenterology 109, 313–315.
REFERENCES 131
4. Cirak, M.Y., Aky€on, Y., M�egraud, F. (2007) Diagnosis of Helicobacter pylori.Helicobacter 12(Suppl. 1), 4–9.
5. Krogfelt, K.A., Lehours, P., Megraud, F. (2005). Diagnosis of Helicobacter
pylori infection. Helicobacter 10(Suppl. 1), 5–13.
6. Rautelin, H., Lehours, P., Megraud, F. (2003) Diagnosis of Helicobacter pylori
infection. Helicobacter 8(Suppl. 1), 13–20.
7. Zagari, R.M., Bazzoli, F. (2003) Helicobacter pylori testing in patients with
peptic ulcer bleeding. Digest. Liver Dis. 35, 215–216.
8. Lee, J.M., Breslin, N.P., Fallon, C., O’Morain, C.A. (2000) Rapid urease tests
lack sensitivity in Helicobacter pylori diagnosis when peptic ulcer disease
presents with bleeding. Am. J. Gastroenterol. 95, 1166–1170.
9. Hegedus, O., Ryden, J., Rehnberg, A.S., Nilsson, S., Hellstrom, P.M. (2002)
Validated accuracy of a novel urea breath test for rapid Helicobacter pylori
detection and in-office analysis. Eur. J. Gastroenterol. Hepatol. 14,
513–520.
10. Borody, T.J., Wettstein, A.R., Campbell, J., Torres, M., Hills, L.A., Herdman, K.
J., Pang, G, Ramrakha, S. (2008) Rapid and superior diagnosis of H. pylori
infection by 14C-urea Heliprobe� test versus the PYtest�. Gastroenterology,
134(4), Supplement 1, A-329.
11. Gisbert, J.P., Pajares, J.M. (2004) 13C-urea breath test in the diagnosis of
Helicobacter pylori infection: a critical review. Aliment Pharmacol. Ther. 20,
1001–1017.
12. Ya~nez, P., Madrazo-de la Garza, A., P�erez-P�erez, G., Cabrera, L., Mu~noz, O.,Torres, J. (2000) Comparison of invasive and noninvasive methods for the
diagnosis and evaluation of eradication of Helicobacter pylori infection in
children. Arch. Med. Res. 31, 415–421.
13. €Ozdemir, E., Karabacak, N.I., Degertekin, B., Cirak, M., Dursun, A., Engin, D.,€Unal, S., €Unl€u, M. (2008) Could the simplified 14C breath test be a new standard
in noninvasive diagnosis of Helicobacter pylori infection? Ann. Nucl. Med. 22,
611–616.
14. Jonaitis, L.V., Kiudelis, G., Kup�cinskas, L. (2007) Evaluation of a novel 14C-ureabreath test “Heliprobe” in diagnosis of Helicobacter pylori infection. Medicina
(Kaunas) 43(1), 32–35.
15. Kuloglu, Z., Kansu, A., Kirsaclioglu, C.T., €Ust€undag, G., Aysev, D., Ensari, A.,K€uc€uk, N.€O., Nurten, G. (2008) A rapid lateral flow stool antigen immunoassay
and 14C-urea breath test for diagnosis and eradication of Helicobacter pylori
infection in children. Diagn. Microbiol. Infect. Dis. 62, 351–356.
16. €Ozt€urk, E., Yesilova, Z., Ilgan, S., Arslan, N., Erdil, A., Celasun, B., €Ozg€uven,M.,
Daglap, K., Ovali, €O., Bayhan, H. (2003) A new practical low-dose 14C urea
breath test for the diagnosis of Helicobacter pylori infection: clinical validation
and comparisonwith standard tests.Eur. J. Nucl.Med.Mol. Imag. 30, 1457–1462.
17. Ulrich, K.T., Eppinger, S.D. (2008) Product Design and Development, 4th
edition, McGraw-Hill, New York.
132 A DIAGNOSTIC DEVICE FOR HELICOBACTER PYLORI INFECTION

18. Derel€ov, M., Detterfelt, J., Bj€orkman, M., Mandenius, C.F. (2008) Engineering
design methodology for bio-mechatronic products. Biotechnol. Prog. 24,
232–244.
19. Hubka, V., Eder, W.E. (1988) Theory of Technical Systems, A Total Concept
Theory for Engineering Design, Springer-Verlag, Berlin.
20. Boothroyd,G., Poli, C.,Murch, L.E. (1982)Automatic Assembly,MarcelDekker
Inc.
REFERENCES 133

8Microarray Devices
This chapter discusses the design of microarray devices. First, the principles
and historical development of the microarrays are described and which
methods predominates the applications (Section 8.1). Then, the needs of
analysis are specified (Section 8.2). Finally, the design ofmicroarrays for these
needs is evaluated using the biomechatronic methodology (Sections 8.3).
8.1 PRINCIPLES, METHODS, AND APPLICATIONSOF MICROARRAYS
8.1.1 Principles and Technology
During the mid-1990s, oligonucleotide chips, or DNA chips in short, devel-
oped as a newmethodology of analyzing genes from a biological sample on a
small surface. The novelty of the inventionwas that for the first time it became
possible to analyze many genes in parallel [1,2]. The very large number of
cellular genes that thewhole genome sequencing processed in the cell, opened
up new experimental possibilities paving the way for functional genomic and
transcriptomoic analysis. The variety of applications, especially in medicinal
Biomechatronic Design in Biotechnology: A Methodology for Development ofBiotechnological Products, First Edition. Carl-Fredrik Mandenius and Mats Bjorkman.� 2011 John Wiley & Sons, Inc. Published 2011 by John Wiley & Sons, Inc.
135
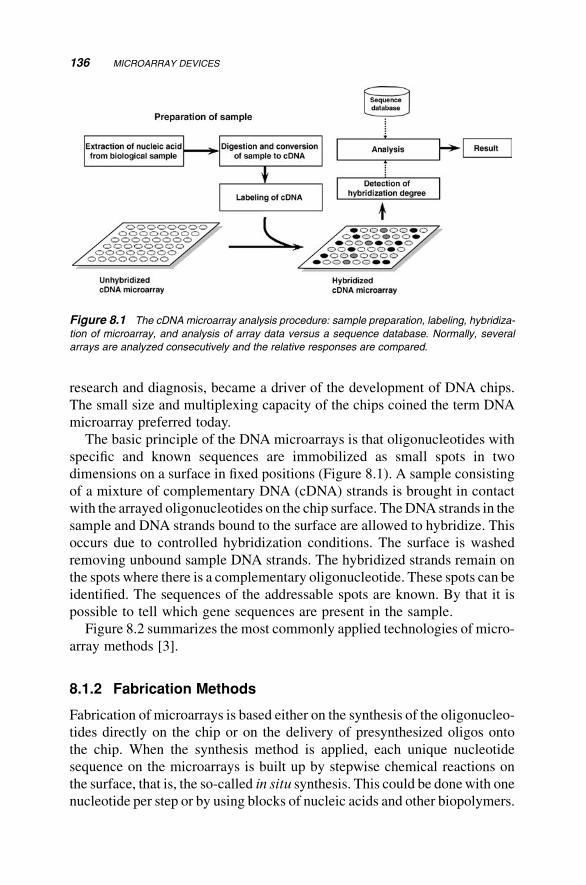
research and diagnosis, became a driver of the development of DNA chips.
The small size and multiplexing capacity of the chips coined the term DNA
microarray preferred today.
The basic principle of the DNA microarrays is that oligonucleotides with
specific and known sequences are immobilized as small spots in two
dimensions on a surface in fixed positions (Figure 8.1). A sample consisting
of a mixture of complementary DNA (cDNA) strands is brought in contact
with the arrayed oligonucleotides on the chip surface. TheDNA strands in the
sample and DNA strands bound to the surface are allowed to hybridize. This
occurs due to controlled hybridization conditions. The surface is washed
removing unbound sample DNA strands. The hybridized strands remain on
the spots where there is a complementary oligonucleotide. These spots can be
identified. The sequences of the addressable spots are known. By that it is
possible to tell which gene sequences are present in the sample.
Figure 8.2 summarizes the most commonly applied technologies of micro-
array methods [3].
8.1.2 Fabrication Methods
Fabrication of microarrays is based either on the synthesis of the oligonucleo-
tides directly on the chip or on the delivery of presynthesized oligos onto
the chip. When the synthesis method is applied, each unique nucleotide
sequence on the microarrays is built up by stepwise chemical reactions on
the surface, that is, the so-called in situ synthesis. This could be donewith one
nucleotide per step or by using blocks of nucleic acids and other biopolymers.
Figure 8.1 The cDNA microarray analysis procedure: sample preparation, labeling, hybridiza-
tion of microarray, and analysis of array data versus a sequence database. Normally, several
arrays are analyzed consecutively and the relative responses are compared.
136 MICROARRAY DEVICES
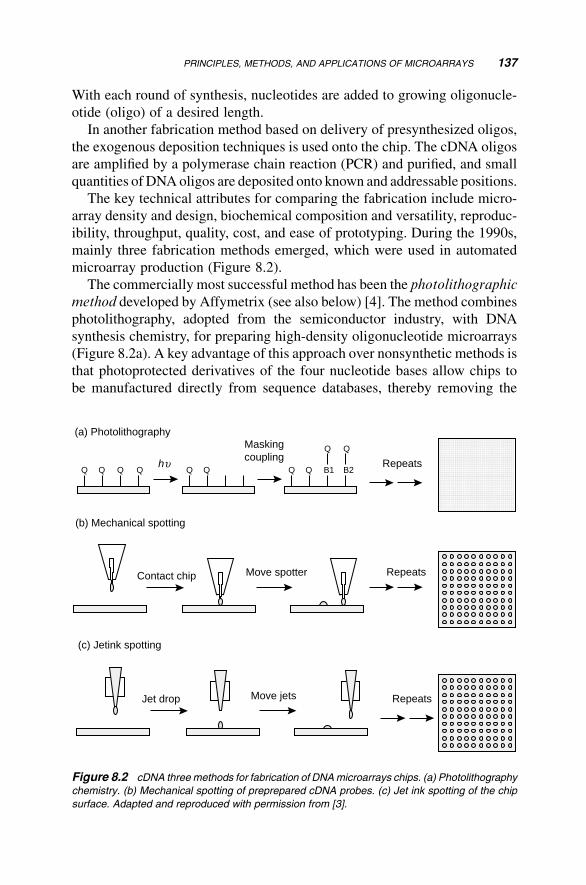
With each round of synthesis, nucleotides are added to growing oligonucle-
otide (oligo) of a desired length.
In another fabrication method based on delivery of presynthesized oligos,
the exogenous deposition techniques is used onto the chip. The cDNA oligos
are amplified by a polymerase chain reaction (PCR) and purified, and small
quantities of DNAoligos are deposited onto known and addressable positions.
The key technical attributes for comparing the fabrication include micro-
array density and design, biochemical composition and versatility, reproduc-
ibility, throughput, quality, cost, and ease of prototyping. During the 1990s,
mainly three fabrication methods emerged, which were used in automated
microarray production (Figure 8.2).
The commercially most successful method has been the photolithographic
method developed by Affymetrix (see also below) [4]. The method combines
photolithography, adopted from the semiconductor industry, with DNA
synthesis chemistry, for preparing high-density oligonucleotide microarrays
(Figure 8.2a). A key advantage of this approach over nonsynthetic methods is
that photoprotected derivatives of the four nucleotide bases allow chips to
be manufactured directly from sequence databases, thereby removing the
(a) Photolithography
Q Q Q Q Q Q Q Q
Q Q
B1
Maskingcoupling
Contact chip
Jet drop Move jets
Move spotter
B2Repeats
Repeats
Repeats
hυ
(b) Mechanical spotting
(c) Jetink spotting
Figure 8.2 cDNA three methods for fabrication of DNAmicroarrays chips. (a) Photolithography
chemistry. (b) Mechanical spotting of preprepared cDNA probes. (c) Jet ink spotting of the chip
surface. Adapted and reproduced with permission from [3].
PRINCIPLES, METHODS, AND APPLICATIONS OF MICROARRAYS 137
uncertain and burdensome aspects of sample handling and tracking. Another
advantage of the photolithographic approach is that the use of synthetic
reagents minimizes chip-to-chip variation by ensuring a high degree of
precision in each coupling cycle. One disadvantage of this approach is,
however, the need for photomasks, which are expensive and time consuming
to design and build.
Another approach for fabrication is mechanical microspotting
(Figure 8.2b). Microspotting, a miniaturized version of earlier DNA spotting
techniques, encompasses deposition of premade biochemical substances on
solid surfaces by printing small quantities, to enable automated microarray
production. Printing is accomplished by direct surface contact between the
printing substrate and a deliverymechanism that contains an array of tweezers,
pins, or capillaries that serve to transfer the biochemical samples to the
surface.
A third fabrication method for microarrays is the “drop-on-demand”
delivery approach (Figure 8.2c). The most elaborate version of the method is
ink jetting, a technique that utilizes piezoelectric and other forms of
propulsion, to transfer biochemical substances from miniature nozzles to
a solid surface. Similar to the microspotting approach, drop-on-demand
technologies allow high-density gridding of virtually any biomolecule of
interest, including cDNAs, genomic DNAs, antibodies, and small mole-
cules. Ink jetting-based methods are developed at several centers,
including Incyte Pharmaceuticals (Palo Alto, CA, USA) and Protogene
(Palo Alto, CA, USA).
8.1.3 Companies Developing Microarrays
Today, several manufacturers of DNA microarrays compete on the market.
Figure 8.3 shows few of these. One of the pioneering companies developing
microarrays was Affymetrix (Santa Clara, CA, USA). The company offers
today a number of microarray chips based on its own technology. The
considerable flexibility of its products and manufacturing methods allows
the design of the arrays to be tailored for their intended use, such as whole-
genome transcriptome mapping, gene expression profiling, or custom geno-
typing [5]. Except its standard assortment, a custom service exists where
researchers can design their own arrays for organisms not covered by existing
products and for specialized or directed studies [5].
Another company, Agilent Technologies (Santa Clara, CA, USA), man-
ufactures a variety of customized oligonucleotide microarrays for use in their
multiple two-color microarray applications [6]. Agilent manufactures micro-
arrays via an in situ synthesis procedure based on inkjet printing of nucleotide
precursor molecules and chemical processing of each added nucleotide layer.
138 MICROARRAY DEVICES
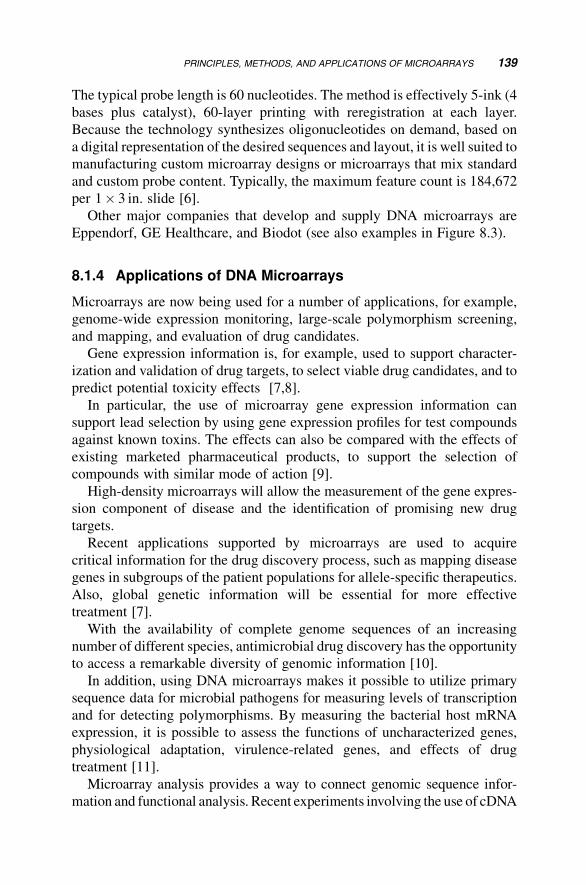
The typical probe length is 60 nucleotides. The method is effectively 5-ink (4
bases plus catalyst), 60-layer printing with reregistration at each layer.
Because the technology synthesizes oligonucleotides on demand, based on
a digital representation of the desired sequences and layout, it is well suited to
manufacturing custom microarray designs or microarrays that mix standard
and custom probe content. Typically, the maximum feature count is 184,672
per 1� 3 in. slide [6].
Other major companies that develop and supply DNA microarrays are
Eppendorf, GE Healthcare, and Biodot (see also examples in Figure 8.3).
8.1.4 Applications of DNA Microarrays
Microarrays are now being used for a number of applications, for example,
genome-wide expression monitoring, large-scale polymorphism screening,
and mapping, and evaluation of drug candidates.
Gene expression information is, for example, used to support character-
ization and validation of drug targets, to select viable drug candidates, and to
predict potential toxicity effects [7,8].
In particular, the use of microarray gene expression information can
support lead selection by using gene expression profiles for test compounds
against known toxins. The effects can also be compared with the effects of
existing marketed pharmaceutical products, to support the selection of
compounds with similar mode of action [9].
High-density microarrays will allow the measurement of the gene expres-
sion component of disease and the identification of promising new drug
targets.
Recent applications supported by microarrays are used to acquire
critical information for the drug discovery process, such as mapping disease
genes in subgroups of the patient populations for allele-specific therapeutics.
Also, global genetic information will be essential for more effective
treatment [7].
With the availability of complete genome sequences of an increasing
number of different species, antimicrobial drug discovery has the opportunity
to access a remarkable diversity of genomic information [10].
In addition, using DNA microarrays makes it possible to utilize primary
sequence data for microbial pathogens for measuring levels of transcription
and for detecting polymorphisms. By measuring the bacterial host mRNA
expression, it is possible to assess the functions of uncharacterized genes,
physiological adaptation, virulence-related genes, and effects of drug
treatment [11].
Microarray analysis provides a way to connect genomic sequence infor-
mation and functional analysis. Recent experiments involving the use of cDNA
PRINCIPLES, METHODS, AND APPLICATIONS OF MICROARRAYS 139
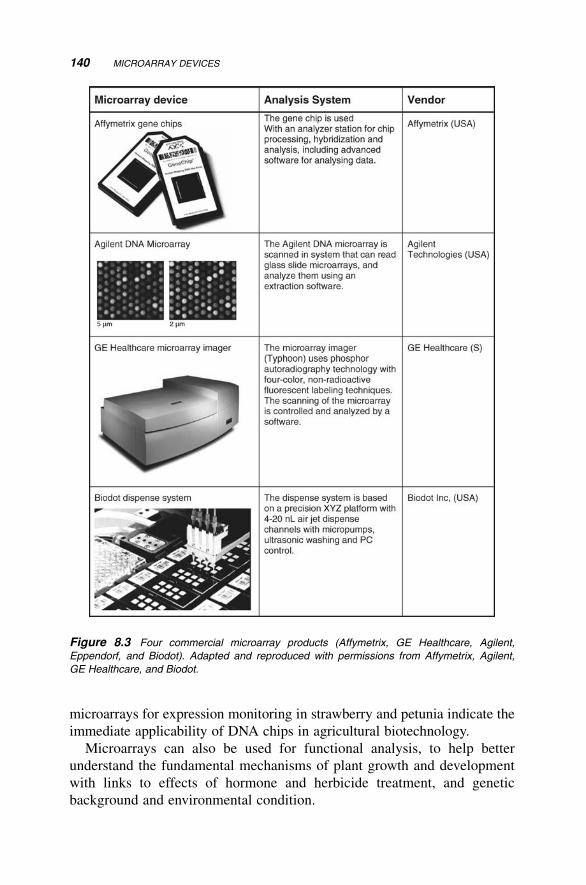
microarrays for expression monitoring in strawberry and petunia indicate the
immediate applicability of DNA chips in agricultural biotechnology.
Microarrays can also be used for functional analysis, to help better
understand the fundamental mechanisms of plant growth and development
with links to effects of hormone and herbicide treatment, and genetic
background and environmental condition.
Figure 8.3 Four commercial microarray products (Affymetrix, GE Healthcare, Agilent,
Eppendorf, and Biodot). Adapted and reproduced with permissions from Affymetrix, Agilent,
GE Healthcare, and Biodot.
140 MICROARRAY DEVICES
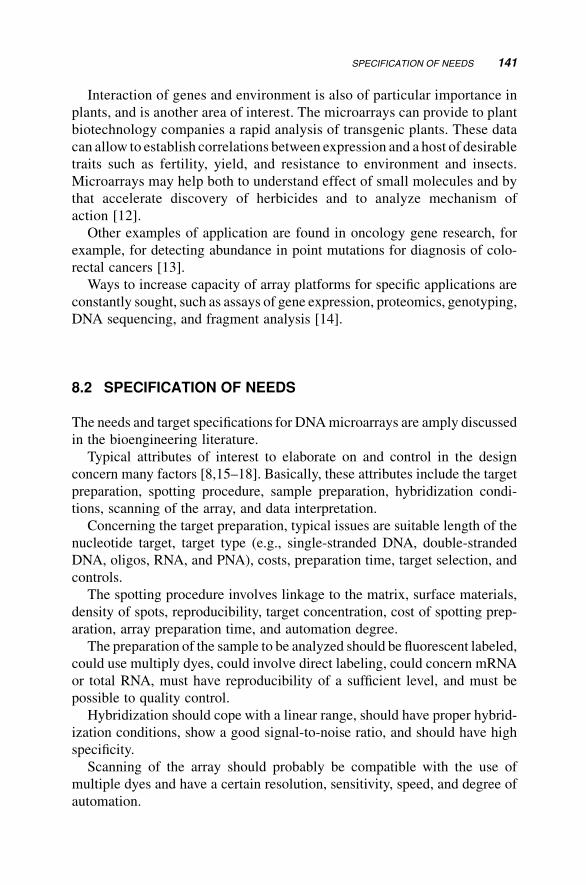
Interaction of genes and environment is also of particular importance in
plants, and is another area of interest. The microarrays can provide to plant
biotechnology companies a rapid analysis of transgenic plants. These data
can allow to establish correlations between expression and a host of desirable
traits such as fertility, yield, and resistance to environment and insects.
Microarrays may help both to understand effect of small molecules and by
that accelerate discovery of herbicides and to analyze mechanism of
action [12].
Other examples of application are found in oncology gene research, for
example, for detecting abundance in point mutations for diagnosis of colo-
rectal cancers [13].
Ways to increase capacity of array platforms for specific applications are
constantly sought, such as assays of gene expression, proteomics, genotyping,
DNA sequencing, and fragment analysis [14].
8.2 SPECIFICATION OF NEEDS
The needs and target specifications for DNAmicroarrays are amply discussed
in the bioengineering literature.
Typical attributes of interest to elaborate on and control in the design
concern many factors [8,15–18]. Basically, these attributes include the target
preparation, spotting procedure, sample preparation, hybridization condi-
tions, scanning of the array, and data interpretation.
Concerning the target preparation, typical issues are suitable length of the
nucleotide target, target type (e.g., single-stranded DNA, double-stranded
DNA, oligos, RNA, and PNA), costs, preparation time, target selection, and
controls.
The spotting procedure involves linkage to the matrix, surface materials,
density of spots, reproducibility, target concentration, cost of spotting prep-
aration, array preparation time, and automation degree.
The preparation of the sample to be analyzed should be fluorescent labeled,
could use multiply dyes, could involve direct labeling, could concern mRNA
or total RNA, must have reproducibility of a sufficient level, and must be
possible to quality control.
Hybridization should cope with a linear range, should have proper hybrid-
ization conditions, show a good signal-to-noise ratio, and should have high
specificity.
Scanning of the array should probably be compatible with the use of
multiple dyes and have a certain resolution, sensitivity, speed, and degree of
automation.
SPECIFICATION OF NEEDS 141
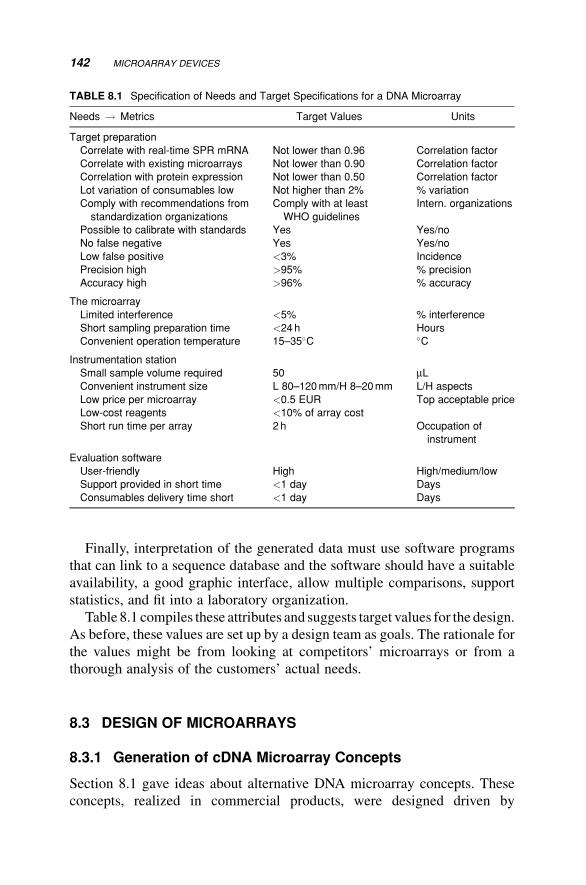
Finally, interpretation of the generated data must use software programs
that can link to a sequence database and the software should have a suitable
availability, a good graphic interface, allow multiple comparisons, support
statistics, and fit into a laboratory organization.
Table 8.1 compiles these attributes and suggests target values for the design.
As before, these values are set up by a design team as goals. The rationale for
the values might be from looking at competitors’ microarrays or from a
thorough analysis of the customers’ actual needs.
8.3 DESIGN OF MICROARRAYS
8.3.1 Generation of cDNA Microarray Concepts
Section 8.1 gave ideas about alternative DNA microarray concepts. These
concepts, realized in commercial products, were designed driven by
TABLE 8.1 Specification of Needs and Target Specifications for a DNA Microarray
Needs ! Metrics Target Values Units
Target preparation
Correlate with real-time SPR mRNA Not lower than 0.96 Correlation factor
Correlate with existing microarrays Not lower than 0.90 Correlation factor
Correlation with protein expression Not lower than 0.50 Correlation factor
Lot variation of consumables low Not higher than 2% % variation
Comply with recommendations from
standardization organizations
Comply with at least
WHO guidelines
Intern. organizations
Possible to calibrate with standards Yes Yes/no
No false negative Yes Yes/no
Low false positive <3% Incidence
Precision high >95% % precision
Accuracy high >96% % accuracy
The microarray
Limited interference <5% % interference
Short sampling preparation time <24h Hours
Convenient operation temperature 15–35�C �C
Instrumentation station
Small sample volume required 50 mLConvenient instrument size L 80–120mm/H 8–20mm L/H aspects
Low price per microarray <0.5 EUR Top acceptable price
Low-cost reagents <10% of array cost
Short run time per array 2 h Occupation of
instrument
Evaluation software
User-friendly High High/medium/low
Support provided in short time <1 day Days
Consumables delivery time short <1 day Days
142 MICROARRAY DEVICES
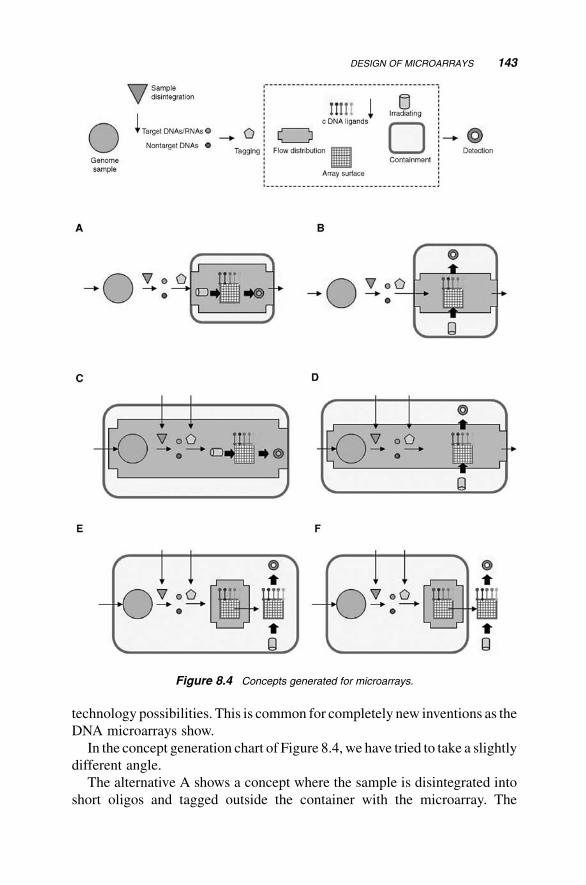
technology possibilities. This is common for completely new inventions as the
DNA microarrays show.
In the concept generation chart of Figure 8.4, we have tried to take a slightly
different angle.
The alternative A shows a concept where the sample is disintegrated into
short oligos and tagged outside the container with the microarray. The
Figure 8.4 Concepts generated for microarrays.
DESIGN OF MICROARRAYS 143
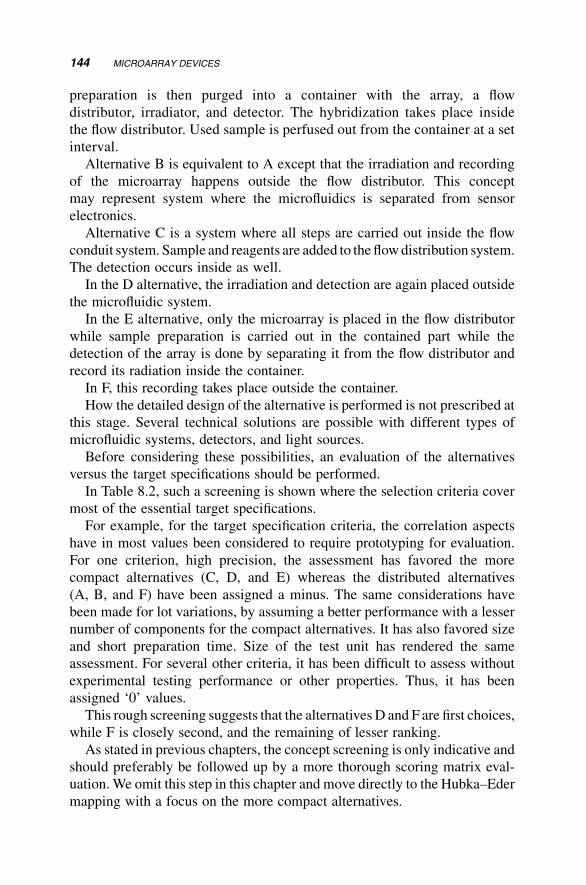
preparation is then purged into a container with the array, a flow
distributor, irradiator, and detector. The hybridization takes place inside
the flow distributor. Used sample is perfused out from the container at a set
interval.
Alternative B is equivalent to A except that the irradiation and recording
of the microarray happens outside the flow distributor. This concept
may represent system where the microfluidics is separated from sensor
electronics.
Alternative C is a system where all steps are carried out inside the flow
conduit system. Sample and reagents are added to the flowdistribution system.
The detection occurs inside as well.
In the D alternative, the irradiation and detection are again placed outside
the microfluidic system.
In the E alternative, only the microarray is placed in the flow distributor
while sample preparation is carried out in the contained part while the
detection of the array is done by separating it from the flow distributor and
record its radiation inside the container.
In F, this recording takes place outside the container.
How the detailed design of the alternative is performed is not prescribed at
this stage. Several technical solutions are possible with different types of
microfluidic systems, detectors, and light sources.
Before considering these possibilities, an evaluation of the alternatives
versus the target specifications should be performed.
In Table 8.2, such a screening is shown where the selection criteria cover
most of the essential target specifications.
For example, for the target specification criteria, the correlation aspects
have in most values been considered to require prototyping for evaluation.
For one criterion, high precision, the assessment has favored the more
compact alternatives (C, D, and E) whereas the distributed alternatives
(A, B, and F) have been assigned a minus. The same considerations have
been made for lot variations, by assuming a better performance with a lesser
number of components for the compact alternatives. It has also favored size
and short preparation time. Size of the test unit has rendered the same
assessment. For several other criteria, it has been difficult to assess without
experimental testing performance or other properties. Thus, it has been
assigned ‘0’ values.
This rough screening suggests that the alternatives D and F are first choices,
while F is closely second, and the remaining of lesser ranking.
As stated in previous chapters, the concept screening is only indicative and
should preferably be followed up by a more thorough scoring matrix eval-
uation. We omit this step in this chapter and move directly to the Hubka–Eder
mapping with a focus on the more compact alternatives.
144 MICROARRAY DEVICES
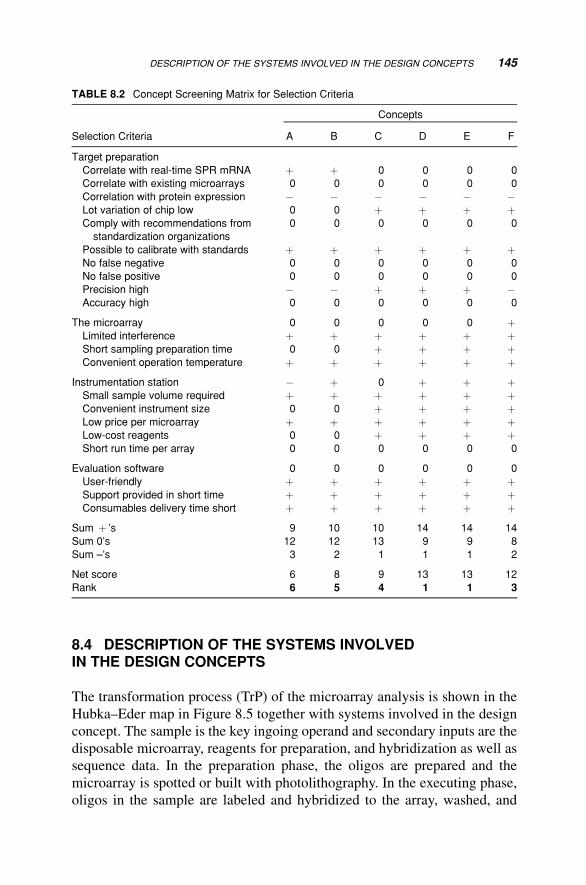
8.4 DESCRIPTION OF THE SYSTEMS INVOLVEDIN THE DESIGN CONCEPTS
The transformation process (TrP) of the microarray analysis is shown in the
Hubka–Eder map in Figure 8.5 together with systems involved in the design
concept. The sample is the key ingoing operand and secondary inputs are the
disposable microarray, reagents for preparation, and hybridization as well as
sequence data. In the preparation phase, the oligos are prepared and the
microarray is spotted or built with photolithography. In the executing phase,
oligos in the sample are labeled and hybridized to the array, washed, and
TABLE 8.2 Concept Screening Matrix for Selection Criteria
Selection Criteria
Concepts
A B C D E F
Target preparation
Correlate with real-time SPR mRNA þ þ 0 0 0 0
Correlate with existing microarrays 0 0 0 0 0 0
Correlation with protein expression � � � � � �Lot variation of chip low 0 0 þ þ þ þComply with recommendations from
standardization organizations
0 0 0 0 0 0
Possible to calibrate with standards þ þ þ þ þ þNo false negative 0 0 0 0 0 0
No false positive 0 0 0 0 0 0
Precision high � � þ þ þ �Accuracy high 0 0 0 0 0 0
The microarray 0 0 0 0 0 þLimited interference þ þ þ þ þ þShort sampling preparation time 0 0 þ þ þ þConvenient operation temperature þ þ þ þ þ þ
Instrumentation station � þ 0 þ þ þSmall sample volume required þ þ þ þ þ þConvenient instrument size 0 0 þ þ þ þLow price per microarray þ þ þ þ þ þLow-cost reagents 0 0 þ þ þ þShort run time per array 0 0 0 0 0 0
Evaluation software 0 0 0 0 0 0
User-friendly þ þ þ þ þ þSupport provided in short time þ þ þ þ þ þConsumables delivery time short þ þ þ þ þ þ
Sum þ ’s 9 10 10 14 14 14
Sum 0’s 12 12 13 9 9 8
Sum –’s 3 2 1 1 1 2
Net score 6 8 9 13 13 12
Rank 6 5 4 1 1 3
DESCRIPTION OF THE SYSTEMS INVOLVED IN THE DESIGN CONCEPTS 145
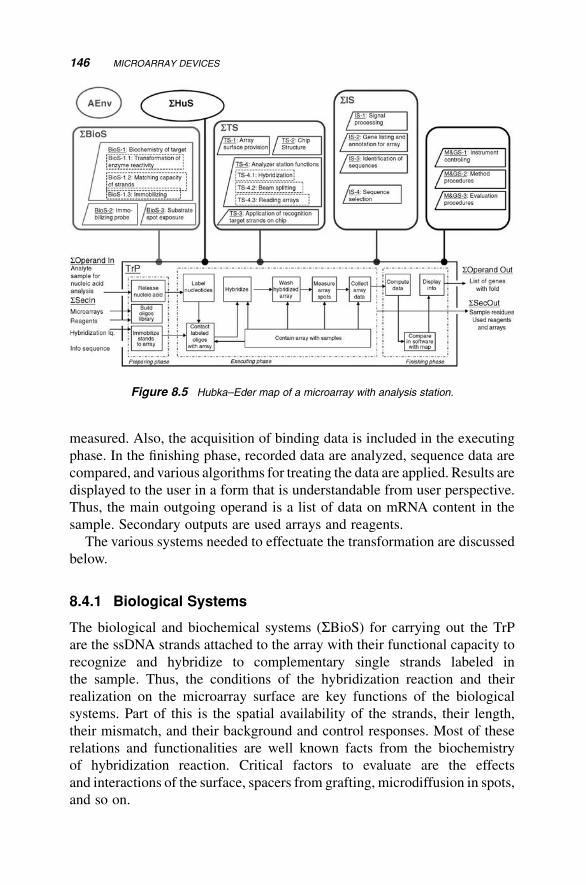
measured. Also, the acquisition of binding data is included in the executing
phase. In the finishing phase, recorded data are analyzed, sequence data are
compared, and various algorithms for treating the data are applied. Results are
displayed to the user in a form that is understandable from user perspective.
Thus, the main outgoing operand is a list of data on mRNA content in the
sample. Secondary outputs are used arrays and reagents.
The various systems needed to effectuate the transformation are discussed
below.
8.4.1 Biological Systems
The biological and biochemical systems (SBioS) for carrying out the TrP
are the ssDNA strands attached to the array with their functional capacity to
recognize and hybridize to complementary single strands labeled in
the sample. Thus, the conditions of the hybridization reaction and their
realization on the microarray surface are key functions of the biological
systems. Part of this is the spatial availability of the strands, their length,
their mismatch, and their background and control responses. Most of these
relations and functionalities are well known facts from the biochemistry
of hybridization reaction. Critical factors to evaluate are the effects
and interactions of the surface, spacers from grafting, microdiffusion in spots,
and so on.
Figure 8.5 Hubka–Eder map of a microarray with analysis station.
146 MICROARRAY DEVICES
8.4.2 Technical Systems
The technical systems (STS) to be used on the TrP are a combination of surface
functions, irradiation and detection devices, and reaction chemistry to couple
the inorganic part of the surface to the biological molecules, that is, the
oligonucleotides. It is also the microfluidics, microelectronics integrated into
the devices, and containment functions. Within the microfluidic functions,
transportation of liquids is a key element. The detection function is possible to
further consider here, using photochemistry, fluorescence, or electronic trans-
duction of signals. The fabrication of the microarray surface as discussed in
Figure 8.2 is part of the functionality provided by the technical system and
subsystems. Thus, what appears as the dominating focus in the microarray
literature is consequently just one of the important issues in the design of the
microarray concept.
8.4.3 Information System
The information systems (SIS) involved are the signal processing, addressingthe spot (coordinates) on the array, the recorded chip, and the process of
analyzing the data versus sequence database information. This is donewith the
help of software algorithms and procedures that the software prescribes based
on bioinformatics theory and application. This part is today a science of its
own, partly owing to the access to the array technology and also due to intrinsic
knowledge about biostatistical methods.
8.4.4 Management and Goal Systems and the Human Systems
The management of the whole microarray analysis is probably embedded in
the expert system, running the steps in the microarray transformation process,
initiating analysis, and handling data inputs from the operator/scientist
running the analysis.
The role of the humans is significant here. It is the performer of the analysis
that must be able to manage the system. Thus, the SHuS entity is more
prominent here. It is probably a teamof scientists or clinicians that are going to
use the microarray for a particular analytical purpose/goal.
The SM&GS and the SHuS thus become very interactive in the perfor-
mance of the analysis. It is rather obvious that the utility of the microarray
strongly depends on its operability in this context.
8.4.5 Active Environment
The active environment (AEnv) includes the biological sample. Here, the
variation in the cell and the cellular responses becomes an integral part of the
DESCRIPTION OF THE SYSTEMS INVOLVED IN THE DESIGN CONCEPTS 147
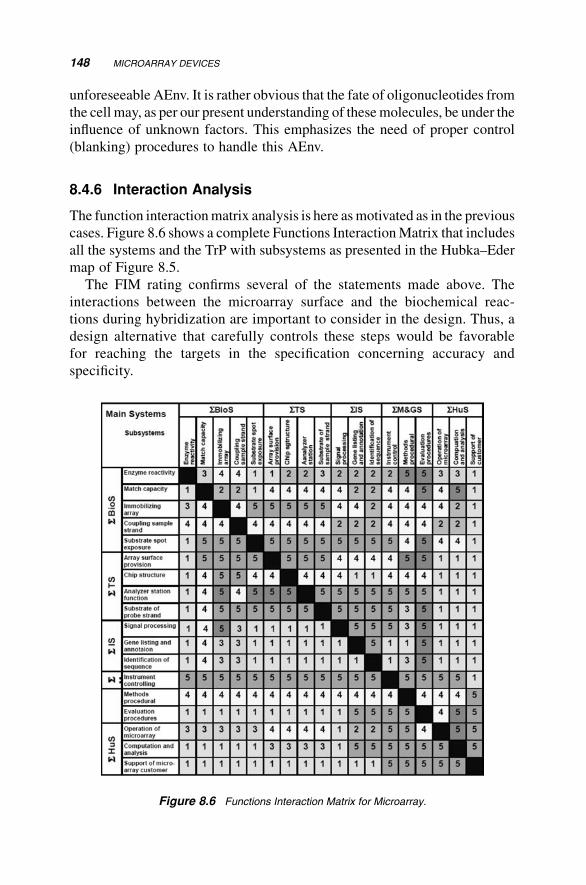
unforeseeable AEnv. It is rather obvious that the fate of oligonucleotides from
the cell may, as per our present understanding of thesemolecules, be under the
influence of unknown factors. This emphasizes the need of proper control
(blanking) procedures to handle this AEnv.
8.4.6 Interaction Analysis
The function interactionmatrix analysis is here asmotivated as in the previous
cases. Figure 8.6 shows a complete Functions InteractionMatrix that includes
all the systems and the TrP with subsystems as presented in the Hubka–Eder
map of Figure 8.5.
The FIM rating confirms several of the statements made above. The
interactions between the microarray surface and the biochemical reac-
tions during hybridization are important to consider in the design. Thus, a
design alternative that carefully controls these steps would be favorable
for reaching the targets in the specification concerning accuracy and
specificity.
Figure 8.6 Functions Interaction Matrix for Microarray.
148 MICROARRAY DEVICES
The importance of the fabrication technology of the microarray is visible.
The interactions that are involved in this are the properties of the materials,
devices of spotting, and the liquid properties of the solutions to be transformed
or transported. In the choice of techniques, detailed FIM ranking can reveal
preferences of available techniques for spotting jet ink application of pho-
tolithographic alternatives.
8.5 CONCLUSIONS
Muchof the cDNAchip development has been done fromadesign engineering
perspectivewhere, as it appears in the literature, the design approach has been
systematic and structural. The examples given in this chapter have been
collected from presentations and reports from several of the SMEs that are
behind the efficient development of new microarray devices. We believe that
the involvement of engineering from the fields of micromechanics and
microelectronics has been pivotal for to this development. If so, this chapter
should be regarded as a retrospect confirmation of a sound design approach for
a biotechnology product. It follows truly the biomechatronic concept
by uniting functional biological molecules (nucleotides) and mechatronics
(the chips).
This chapter has entirely dealt with DNA microarray design issues.
However, microarray technology encompasses additional opportunities for
parallelized biointeraction-based analysis. Of particular relevance are
protein microarrays with the expressed proteins that are analyzed by using
immunorecognition or other molecular recognition mechanisms [19–22].
The combination of mRNA data, from a DNA microarray, with the data for
the processed mRNA product brings the full picture of the expression
profile. The power to analyze all expressed proteins on the same chip is
undeniable.
Other ascents in the application of chips are steps toward whole cells, for
example, cellular chips [23].
The market success of microarrays should stimulate the development of
new design variants and further development of existing methods. The
biomechatronic design approach is in that context of particular help.
REFERENCES
1. Hoheisel, J.D. (1997)Oligomer-chiptechnology.Trend.Biotechnol.15,465–469.
2. Ramsay, G. (1998) DNA chips: state of the art. Nat. Biotechnol. 16, 40–44.
REFERENCES 149
3. Schena, M., Heller, R.A., Theriault, T.P., Konrad, K., Lachenmeier, E.,
Davis, R.W. (1998) Microarrays: biotechnology’s discovery platform for func-
tional genomics. Trend. Biotechnol. 16, 301–306.
4. Fodor SPA, Rend JL, Pirrung MC, Stryer L, Tsai Lu A, Solas D (1991)
Light-directed, spatially addressable parallel chemical synthesis. Science
251, 767–773.
5. Dalma-Weiszhausz, D.D., Warrington, J., Tanimoto, E.Y., Miyada, C.G.
(2006) The Affymetrix GeneChip� platform: an overview. Meth. Enzymol.
410, 3–28.
6. Wolber, P.K., Collins, P.J., Lucas, A.B., DeWitte, A., Shannon, K.W. (2006) The
Agilent in situ-synthesized microarray platform. Meth. Enzymol. 410, 28–57.
7. Braxton, S., Bedilion, T. (1998) The integration of microarray information in the
drug development process. Curr. Opin. Biotechnol. 9, 643–649.
8. Lennon, G.G. (2000) High-throughput gene expression analysis for drug dis-
covery. Drug Discov. Today 5, 59–66.
9. Loferer, H. (2000)Mining bacterial genomes for antimicrobial targets.Mol.Med.
Today 6, 470–474.
10. Cummings, C.A., Relman, D.A. (2000) Using DNA microarrays to study
host–microbe interactions. Emerg. Infect. Dis. 6, 513–525.
11. Lemieux, B., Aharoni, A., Schena,M. (1998) Overview ofDNA chip technology.
Mol. Breeding 4, 277–289.
12. Soper, S.A.,Hashimoto,M.,Situma,C.,Murphy,M.C.,McCarley,R.L.,Cheng,Y.
W., Barany, F. (2005) Fabrication of DNA microarrays onto polymer substrates
using UV modification protocols with integration into microfluidic platforms for
the sensing of low-abundant DNA point mutations. Methods 37, 103–113.
13. Ricco, A.J., Boone, T.D., Fan, Z.H., Gibbons, I., Matray, T., Singh, S., Tan, H.,
Tian, T., Williams, S.J. (2002) Application of disposable plastic microfluidic
device arrays with customized chemistries to multiplexed biochemical assays.
Biochem. Soc. Trans. 30, 73–78.
14. vanHal, N.L.W., Vorst, O., vanHouwelingen, A.M.M.L., Kok, E.J., Peijnenburg,
A., Aharoni, A., van Tunen, A.J., Keijer, J. (2000) The application of DNA
microarrays in gene expression analysis, J. Biotechnol. 78, 271–280.
15. Yoshino, M., Matsumura, T., Umehara, N., Akagami, Y., Aravindan, S., Ohno, T.
(2006) Engineering surface and development of a new DNA microarray chip.
Wear 260, 274–286.
16. Hughes, T.R., Shoemaker, D.D. (2001) DNA microarrays for expression profil-
ing. Curr. Opin. Chem. Biol. 5, 21–25.
17. Waliraff, G.M., Huisberg,W. D., Brock, P. J. (2000) Lithographic techniques for
the fabrication of oligonucleotide arrays. J. Photopolym. Sci. Technol. 13,
551–558.
18. Situma, C., Hashimoto, M., Soper, S.A. (2006) Merging microfluidics with
microarray-based bioassays. Biomol. Eng. 23, 213–231.
150 MICROARRAY DEVICES

19. Mitchell, P. (2002) A perspective on protein microarrays. Nat. Biotechnol. 20,
225–229.
20. Stears, R.L., Mantinsky, T., Schena, M. (2003) Trends in microarray analysis.
Nat. Med. 9, 140–145.
21. Weller,M.G. (2003) Classification of proteinmicroarrays and related techniques.
Anal. Bioanal. Chem. 375, 15–17.
22. Oh, S.J., Hong, B.J., Choi, K.Y., Park, J.W. (2006) Surfacemodification for DNA
and protein microarrays. Omics 10, 327–343.
23. Kolchinsky, A.M., Gryadunov, D.A., Lysov, Y.P., Mikhailovich, V.M.,
Nasedkina, T.V., Turygin, A.Y., Rubina, A.Y., Barsky, V.E., Zasedatelev, A.S.
(2004) Gel-based microchips, history and prospects.Mol. Biol. (Russ.) 38, 4–13.
REFERENCES 151

9Microbial and Cellular
Bioreactors
The chapter begins with an update of the development of bioreactors during
the 1970s–1990s (Section 9.1). The typical needs of the bioreactor users,
whether they are academic researchers or they are industrial manufacturers of
bioproducts, are discussed and specified (Section 9.2). The conventional
bioreactor models that these needs have resulted in are analyzed from a
biomechatronic design perspective. These are exemplified for two well-
known bioreactor applications: fungal penicillin fermentation and protein
production by mammalian cells (Section 9.3). Finally, recent trends in
bioreactor design are analyzed and discussed with examples from micro-
bioreactors and bioreactors for culturing tissue cells, stem cells, and plant cells
(Section 9.4). Throughout the chapter, theHubka–Edermapping is applied for
identifying the key issues of this versatile design topic.
9.1 BIOREACTOR DEVELOPMENT DURING THE 1970s–1990s
In a broad sense, bioreactors can be considered as any technical device that
carries out biological reactions in a sufficiently controlled manner. Biological
reactions can take place in a wide range of biomolecular and cellular
systems: as single enzymes, bacterial and other microbial cells, animal cells,
Biomechatronic Design in Biotechnology: A Methodology for Development ofBiotechnological Products, First Edition. Carl-Fredrik Mandenius and Mats Bjorkman.� 2011 John Wiley & Sons, Inc. Published 2011 by John Wiley & Sons, Inc.
153
mammalian cells, human cells and tissues [1,2], stem cells [3], genevectors, or
plant cells [4].
Preferably, the cell culture is a well-defined monoculture. However, in
industrial practice, often multicultures are the actual biological systems due to
impure culture handling, large-scale culture systems, or spontaneous culture
changes. Sometimes multicellular systems are used intentionally, for example,
in solid-state fermentations [5] and wastewater treatment processes.
Numerous bioreactor setups and configurations of various technical designs
have been developed during the past decades. Industry has quite often
propelled the development of bioreactor apparatuses, mostly with the purpose
of using them in a particular manufacturing process.
This has resulted in a variety of bioreactor designs for diverse types of cells,
such as airlift reactors, membrane reactors, hollow-fiber reactors, and bior-
eactors for microcarrier cultures and immobilized cells (Figure 9.1). The
bioreactor developments during the 1970s–1990s are comprehensively de-
scribed and reviewed in a number of books and articles (see, for example,
Refs [6–8]).
In food biotechnology applications in particular, bioreactors exhibit a
variety of configurations. The food industry has often remained with tradi-
tional and old-fashion bioreactor types. This is the case especially both in
small-scale wine and beer production and in solid-state fermentation of food
products [5]. Today, the food industry mostly uses modern bioreactors for
large-scale production, in particular for dairy, wine, and other related food
products. The safety requirements and cost margins in the food industry are
different from, for example, drug manufacture. Thus, this requires critical
attention in the design work.
In the biopharmaceutical industry, bioreactors must meet very high
standards to comply with the requirements of the pharmaceutical regulatory
authorities. The production facility must adhere to Good Manufacturing
Practice (GMP) and allow proper validation procedures to be carried out.
Normally, the purity of the drug products must be very high, something which
cannot be reached in the bioreactor, so the bioconversion must adapt to the
subsequent downstream process. The use of mammalian cell cultures and
complex media has added new dimensions to the development. Together, this
results in significantly more expensive bioreactor designs, which, as a
consequence, emphasizes the need of finding economically optimal design
alternative.
The regulatory requirements of the bioreactor design for other types of
products, such as diagnostics, specialty biochemicals, industrial enzymes, and
commodity chemicals, are less demanding. The bioreactor types for these
bioproducts belong to the categories batch or continuous stirred, airlift, and
tower bioreactors, all well-established and well-characterized apparatuses.
154 MICROBIAL AND CELLULAR BIOREACTORS
Several commercial bioreactor products have high visibility on the
biotech product market. Companies such as Bioengineering, Applikon
Biotechnology, Infors, Brunswick, Stedim-Sartorius (B Braun), and GE
Healthcare (formerly Pharmacia Biotech) are well-known equipment
developers and vendors, especially for applications in pharmaceuticals and
diagnostics.
A rarer bioreactor application is the processing of plant cell cultures where
callus tissues from trees, fruits, or herbs are adapted to grow in suspension or
aggregated cultures for production of unique metabolites in the plant cells [4].
Recently, recombinant protein production in plant cells is also a new ap-
proach [17]. Plant cultures increase the demands on the bioreactor design since
they grow to high densities and create viscous liquids of media and suspended
cells.Diffusionofnutrients andgases in themedia in the reactors and separation
of formed products become critical for their operation and require that better
design solutions are accomplished. Also, the long time span of the plant cell
batches in the manufacture makes the sterility barrier a critical design issue.
In industrial process R&D work, especially in the biopharmaceutical
companies, bioreactors are well established. To test and optimize the biore-
actor operation, with respect to choice of strain or cell culture and to media
composition, and to optimize critical process, variables before scale-up are
economically necessary. Bioreactors for process development have become a
special category of bioreactors, which need to be better equipped and suited
for testing and optimization.
Research in biochemical engineering science has contributed significantly
to the understanding and improvement of the fundamentals of bioreactor
design. The research has uncovered important aspects of fluid dynamics of the
bioreactor by using sophisticated sensors and advanced mathematical model-
ing methods [18,19,20–23]. Today, training at engineering schools and
universities prepares newengineers for exploiting this understanding in design
work in biotechnology industry [24]. This has paved the way for new
conceptual bioreactor designs. These efforts have also been closely connected
to progress in tissue engineering, stem cell research, and other fields.
In recent years, theminiaturized bioreactors have become popular tools for
process development [25–27]. This scale-down approach has resulted in
micro- or even nanoliter reactor volumes [14]. The miniaturized bioreactors
usually serve as valuable tools for prestudies for the prediction of the
conditions on a larger production scale.
Devices thatmimichumanorgans,suchas liverandkidney,areoftenreferred
to as bioreactors, ormore precisely, organ-simulating bioreactor devices. The
design of these devices is treated in Chapter 12 owing to their quite different
aims,prerequisites,anddemands.Mostly, thesedevicesconsistofmulticellular
systems, which make them more difficult to design and operate.
BIOREACTOR DEVELOPMENT DURING THE 1970s–1990s 155
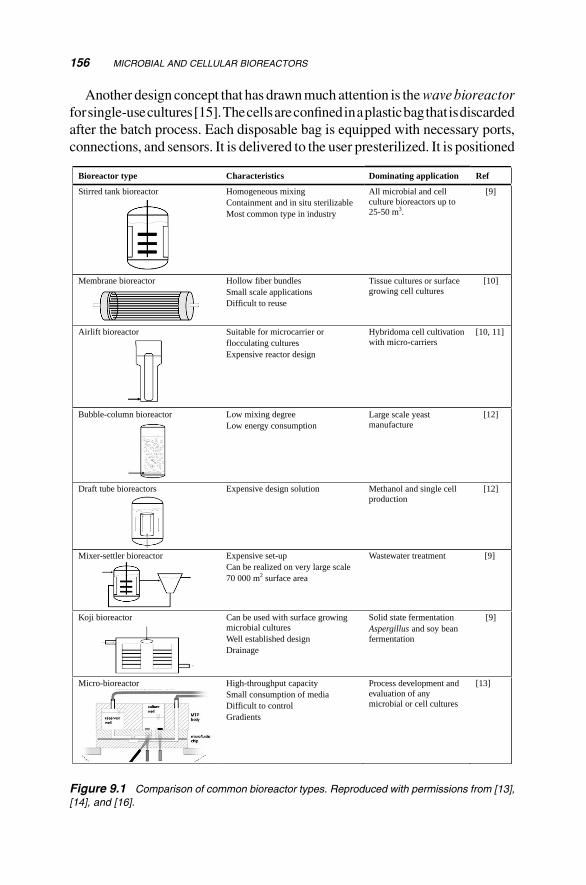
Another design concept that has drawnmuch attention is thewavebioreactor
forsingle-usecultures[15].Thecellsareconfinedinaplasticbagthatisdiscarded
after the batch process. Each disposable bag is equipped with necessary ports,
connections, and sensors. It is delivered to the user presterilized. It is positioned
Bioreactor type Characteristics Dominating application Ref
Stirred tank bioreactor Homogeneous mixing Containment and in situ sterilizable Most common type in industry
All microbial and cell culture bioreactors up to 25-50 m3.
[9]
Membrane bioreactor Hollow fiber bundles Small scale applications Difficult to reuse
Tissue cultures or surface growing cell cultures
[10]
Airlift bioreactor Suitable for microcarrier or flocculating cultures Expensive reactor design
Hybridoma cell cultivation with micro-carriers
[10, 11]
Bubble-column bioreactor Low mixing degree Low energy consumption
Large scale yeast manufacture
[12]
Draft tube bioreactors Expensive design solution Methanol and single cell production
[12]
Mixer-settler bioreactor Expensive set-up Can be realized on very large scale 70 000 m2 surface area
Wastewater treatment [9]
Koji bioreactor Can be used with surface growing microbial cultures Well established design Drainage
Solid state fermentation Aspergillus and soy bean fermentation
[9]
Micro-bioreactor High-throughput capacity Small consumption of media Difficult to control Gradients
Process development and evaluation of any microbial or cell cultures
[13]
Figure 9.1 Comparison of common bioreactor types. Reproduced with permissions from [13],
[14], and [16].
156 MICROBIAL AND CELLULAR BIOREACTORS
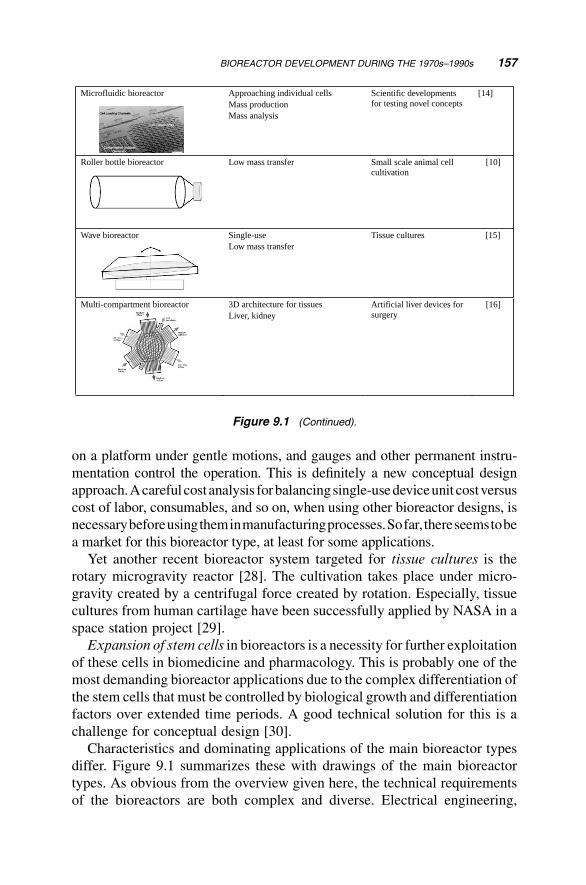
on a platform under gentle motions, and gauges and other permanent instru-
mentation control the operation. This is definitely a new conceptual design
approach.Acareful costanalysis forbalancingsingle-usedeviceunit costversus
cost of labor, consumables, and so on, when using other bioreactor designs, is
necessarybeforeusingtheminmanufacturingprocesses.Sofar, thereseemstobe
a market for this bioreactor type, at least for some applications.
Yet another recent bioreactor system targeted for tissue cultures is the
rotary microgravity reactor [28]. The cultivation takes place under micro-
gravity created by a centrifugal force created by rotation. Especially, tissue
cultures from human cartilage have been successfully applied by NASA in a
space station project [29].
Expansion of stem cells in bioreactors is a necessity for further exploitation
of these cells in biomedicine and pharmacology. This is probably one of the
most demanding bioreactor applications due to the complex differentiation of
the stem cells that must be controlled by biological growth and differentiation
factors over extended time periods. A good technical solution for this is a
challenge for conceptual design [30].
Characteristics and dominating applications of the main bioreactor types
differ. Figure 9.1 summarizes these with drawings of the main bioreactor
types. As obvious from the overview given here, the technical requirements
of the bioreactors are both complex and diverse. Electrical engineering,
Microfluidic bioreactor Approaching individual cells Mass production Mass analysis
Scientific developments for testing novel concepts
[14]
Roller bottle bioreactor Low mass transfer Small scale animal cell cultivation
[10]
Wave bioreactor Single-useLow mass transfer
Tissue cultures [15]
Multi-compartment bioreactor 3D architecture for tissues Liver, kidney
Artificial liver devices for surgery
[16]
Figure 9.1 (Continued).
BIOREACTOR DEVELOPMENT DURING THE 1970s–1990s 157
pneumatics, mechanics, software engineering, pumping technology, mixing,
measurement techniques, control methods, and user needs must be integrated
into one multifunctional system [31].
The aim of this chapter is to try to place these requirements in a conceptual
design context. The focus is on production of microbial and animal cells that
produce proteins and small biomolecules. All these bioreactors aim for large-
scale industrial production of the substances. The scales can be modest, as for
production of a particular monoclonal antibody, or as large as 200–1000m3
for yeast and bioethanol. By retrospectively analyzing the missions, target
specifications, and generated concepts of previous bioreactor designs, a
transparent view and understanding of them are gained.
9.2 MISSIONS, USER NEEDS, AND SPECIFICATIONSFOR BIOREACTORS
9.2.1 Design Mission and User Needs
Before considering the needs of the bioreactor users, it is wise to define the
mission of the particular bioreactor to be designed and from that detail the
needs in relation to that mission [32]. In Table 9.1, the essential needs for a
few bioreactor missions are shown.
The table shows how user needs of a bioreactor design vary significantly
depending on the intended use. Shall the bioreactor be used formanufacturing,
process development, education and training, or any other possible applica-
tion? The user needsmust also clarify what type of process and organisms that
are concerned, the scale of production, if high-throughput capacity is required,
if a certain product purity must be reached, and so on.
Themission and needs have significant impact on the ensuing design work.
For example, a bioreactor having the mission to be used for mammalian cell
cultures in a GMP facility allows to limit the design criteria to a lesser number
of requirements (i.e., it limits the “design space” or “design freedom”),while a
multipurpose bioreactor for education with other cell types and without GMP
demands changes the design criteria considerably. The consequences for
themanufacture of the bioreactor, the potentialmarket (i.e., number of users of
the bioreactor product), and the number of available applications vary.
9.2.2 Target Specifications
The user needs are reformulated as general specifications that the design
solution should fulfill. These specifications first put restrictions on the gen-
erationof concepts. Primarily, the identifiedneeds come frombasic knowledge
158 MICROBIAL AND CELLULAR BIOREACTORS
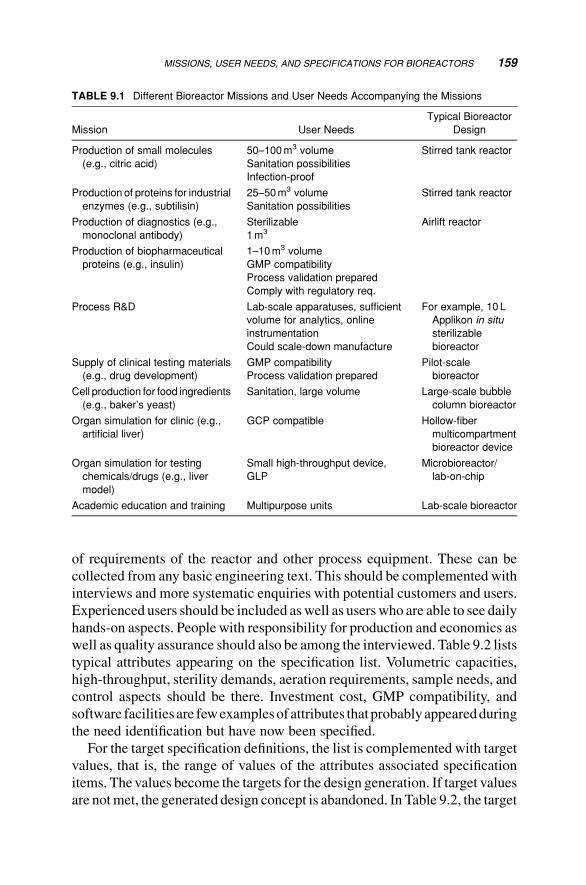
of requirements of the reactor and other process equipment. These can be
collected from any basic engineering text. This should be complemented with
interviews and more systematic enquiries with potential customers and users.
Experienced users should be included aswell as userswho are able to see daily
hands-on aspects. People with responsibility for production and economics as
well as quality assurance should also be among the interviewed. Table 9.2 lists
typical attributes appearing on the specification list. Volumetric capacities,
high-throughput, sterility demands, aeration requirements, sample needs, and
control aspects should be there. Investment cost, GMP compatibility, and
software facilities are fewexamplesof attributes thatprobablyappearedduring
the need identification but have now been specified.
For the target specification definitions, the list is complemented with target
values, that is, the range of values of the attributes associated specification
items. The values become the targets for the design generation. If target values
are notmet, the generated design concept is abandoned. In Table 9.2, the target
TABLE 9.1 Different Bioreactor Missions and User Needs Accompanying the Missions
Mission User Needs
Typical Bioreactor
Design
Production of small molecules
(e.g., citric acid)
50–100m3 volume
Sanitation possibilities
Infection-proof
Stirred tank reactor
Production of proteins for industrial
enzymes (e.g., subtilisin)
25–50m3 volume
Sanitation possibilities
Stirred tank reactor
Production of diagnostics (e.g.,
monoclonal antibody)
Sterilizable
1m3Airlift reactor
Production of biopharmaceutical
proteins (e.g., insulin)
1–10m3 volume
GMP compatibility
Process validation prepared
Comply with regulatory req.
Process R&D Lab-scale apparatuses, sufficient
volume for analytics, online
instrumentation
Could scale-down manufacture
For example, 10 L
Applikon in situ
sterilizable
bioreactor
Supply of clinical testing materials
(e.g., drug development)
GMP compatibility
Process validation prepared
Pilot-scale
bioreactor
Cell production for food ingredients
(e.g., baker’s yeast)
Sanitation, large volume Large-scale bubble
column bioreactor
Organ simulation for clinic (e.g.,
artificial liver)
GCP compatible Hollow-fiber
multicompartment
bioreactor device
Organ simulation for testing
chemicals/drugs (e.g., liver
model)
Small high-throughput device,
GLP
Microbioreactor/
lab-on-chip
Academic education and training Multipurpose units Lab-scale bioreactor
MISSIONS, USER NEEDS, AND SPECIFICATIONS FOR BIOREACTORS 159
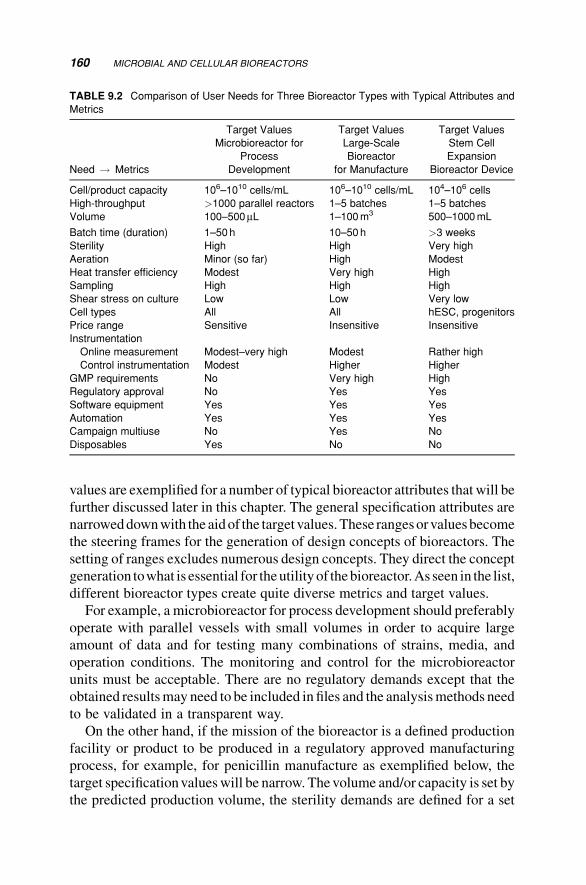
values are exemplified for a number of typical bioreactor attributes that will be
further discussed later in this chapter. The general specification attributes are
narroweddownwith the aidof the target values.These rangesorvaluesbecome
the steering frames for the generation of design concepts of bioreactors. The
setting of ranges excludes numerous design concepts. They direct the concept
generation towhat is essential for theutility of thebioreactor.As seen in the list,
different bioreactor types create quite diverse metrics and target values.
For example, a microbioreactor for process development should preferably
operate with parallel vessels with small volumes in order to acquire large
amount of data and for testing many combinations of strains, media, and
operation conditions. The monitoring and control for the microbioreactor
units must be acceptable. There are no regulatory demands except that the
obtained resultsmay need to be included in files and the analysismethods need
to be validated in a transparent way.
On the other hand, if the mission of the bioreactor is a defined production
facility or product to be produced in a regulatory approved manufacturing
process, for example, for penicillin manufacture as exemplified below, the
target specificationvalueswill be narrow. Thevolume and/or capacity is set by
the predicted production volume, the sterility demands are defined for a set
TABLE 9.2 Comparison of User Needs for Three Bioreactor Types with Typical Attributes and
Metrics
Target Values Target Values Target Values
Need ! Metrics
Microbioreactor for
Process
Development
Large-Scale
Bioreactor
for Manufacture
Stem Cell
Expansion
Bioreactor Device
Cell/product capacity 106–1010 cells/mL 106–1010 cells/mL 104–106 cells
High-throughput >1000 parallel reactors 1–5 batches 1–5 batches
Volume 100–500mL 1–100m3 500–1000mL
Batch time (duration) 1–50h 10–50h >3 weeks
Sterility High High Very high
Aeration Minor (so far) High Modest
Heat transfer efficiency Modest Very high High
Sampling High High High
Shear stress on culture Low Low Very low
Cell types All All hESC, progenitors
Price range Sensitive Insensitive Insensitive
Instrumentation
Online measurement Modest–very high Modest Rather high
Control instrumentation Modest Higher Higher
GMP requirements No Very high High
Regulatory approval No Yes Yes
Software equipment Yes Yes Yes
Automation Yes Yes Yes
Campaign multiuse No Yes No
Disposables Yes No No
160 MICROBIAL AND CELLULAR BIOREACTORS
batch time, the production strain and its requirement of media are known, and
so on. The customer can decide exactly what supervision facilities and
software process control system that are needed. Thus, a blueprint for a
customer-designed single-unit reactor may be generated.
For a bioreactor to be used for stem cell manufacturing, quite different
demands are outlined. The radically different methodology for expanding
surface growing stem cells, progenitor cells, or derived cardiac cell types
generates other design solutions. The boundaries caused by the differentiation
and redifferentiation of the stem cells, the possibility to monitor critical
biomarkers for characterizing the phenotype, and the sequential addition of
controlling factors for stimulating differentiation are examples of limiting
conditions for the stem cell bioreactor design.
Target specifications of this help the designers at the outset of the design
work. However, additional design tools must be used for detailing the design
options.
9.3 ANALYSIS OF SYSTEMS FOR CONVENTIONALBIOREACTORS
In the following sections, the systems and subsystems necessary for carrying
out the transformation process (TrP) in the bioreactor are described from a
biomechatronic design perspective. The TrP could be any bioconversion
process that is possible to carry out in a submerged microbial or cell culture
system, where nutrients are taken up and converted intometabolites or protein
products. The Hubka–Eder mapping is used to analyze the interactions
between the systems in a generalized way [33,34]. The biological and
technical systems entities are described more thoroughly since these are
pivotal in a bioreactor that performs biological conversions. To make the
discussion of the systems more concrete, two industrially well-known bio-
reactor systems are described in more detail in order to help the reader
recognize the systems in real production systems and to obtain examples of
how the biomechatronic design methodology is helpful for analyzing them.
The first case is a large-scale bioreactor for the production of penicillin G in a
metabolically engineeredPenicillium strain. The second case is a mammalian
cell culture bioreactor producing a recombinant protein using an engineered
Chinese ovary hamster (CHO) cell line.
9.3.1 Biological Systems in the Bioreactor
The main purpose of a bioreactor is to control the biological transformations
that take place in it – thus, many of the key components of the bioreactor are
ANALYSIS OF SYSTEMS FOR CONVENTIONAL BIOREACTORS 161
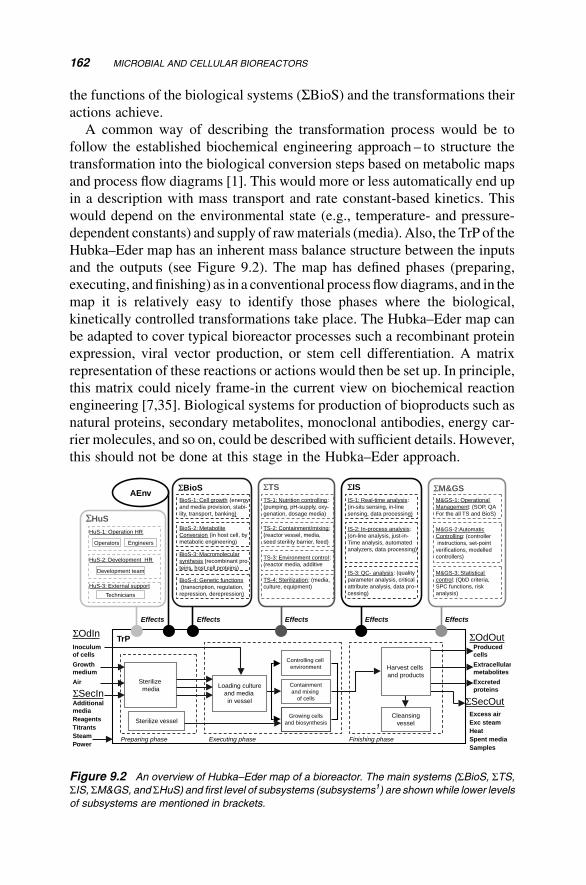
the functions of the biological systems (SBioS) and the transformations their
actions achieve.
A common way of describing the transformation process would be to
follow the established biochemical engineering approach – to structure the
transformation into the biological conversion steps based on metabolic maps
and process flow diagrams [1]. This would more or less automatically end up
in a description with mass transport and rate constant-based kinetics. This
would depend on the environmental state (e.g., temperature- and pressure-
dependent constants) and supply of rawmaterials (media). Also, the TrP of the
Hubka–Eder map has an inherent mass balance structure between the inputs
and the outputs (see Figure 9.2). The map has defined phases (preparing,
executing, andfinishing) as in a conventional process flowdiagrams, and in the
map it is relatively easy to identify those phases where the biological,
kinetically controlled transformations take place. The Hubka–Eder map can
be adapted to cover typical bioreactor processes such a recombinant protein
expression, viral vector production, or stem cell differentiation. A matrix
representation of these reactions or actions would then be set up. In principle,
this matrix could nicely frame-in the current view on biochemical reaction
engineering [7,35]. Biological systems for production of bioproducts such as
natural proteins, secondary metabolites, monoclonal antibodies, energy car-
rier molecules, and so on, could be described with sufficient details. However,
this should not be done at this stage in the Hubka–Eder approach.
ΣBioS ΣTS
ΣHuS
ΣIS ΣM&GS
Sterilize vessel
Inoculumof cells
Growthmedium
Air
ΣOdOutProducedcells
Extracellularmetabolites
Excretedproteins
Engineers
esahp gnihsiniFesahp gnitucexEesahp gniraperP
Loading cultureand media in vessel
ΣOdIn
AEnv
Effects Effects Effects Effects Effects
TrP
HuS-1: Operation HR
HuS-2: Development HR
HuS-3: External support
Development team
Technicians
Operators
Sterilizemedia
AdditionalmediaReagentsTitrantsSteamPower
Cleansingvessel
Controlling cell environment
Containmentand mixing
of cells
Growing cellsand biosynthesis
ΣSecIn
Harvest cells and products
ΣSecOutExcess airExc steamHeatSpent mediaSamples
TS-1: Nutrition controlling:(pumping, pH-supply, oxy-genation, dosage media)
TS-2: Containment/mixing:(reactor vessel, media, seed sterility barrier, feed)
TS-3: Environment control:(reactor media, additive
TS-4: Sterilization: (media, culture, equipment)
BioS-1: Cell growth (energy and media provision, stabi-lity, transport, banking)
BioS-2: Metabolite Conversion (in host cell, by metabolic engineering)
BioS-3: Macromolecular synthesis (recombinant pro-teins, host cell proteins)
BioS-4: Genetic functions(transcription, regulation,
repression, derepression)
IS-1: Real-time analysis:(in-situ sensing, in-line sensing, data processing)
IS-2: In-process analysis:(on-line analysis, just-in-Time analysis, automated analyzers, data processing)
IS-3: QC- analysis: (quality parameter analysis, criticalattribute analysis, data pro-cessing)
M&GS-1: Operational Management: (SOP, QAFor the all TS and BioS)
M&GS-2:Automatic Controlling: (controller instructions, set-point
verifications, modelledcontrollers)
M&GS-3: Statistical control: (QbD criteria, SPC functions, risk analysis)
Figure 9.2 An overview of Hubka–Eder map of a bioreactor. The main systems (SBioS, STS,SIS, SM&GS, and SHuS) and first level of subsystems (subsystems1) are shownwhile lower levels
of subsystems are mentioned in brackets.
162 MICROBIAL AND CELLULAR BIOREACTORS
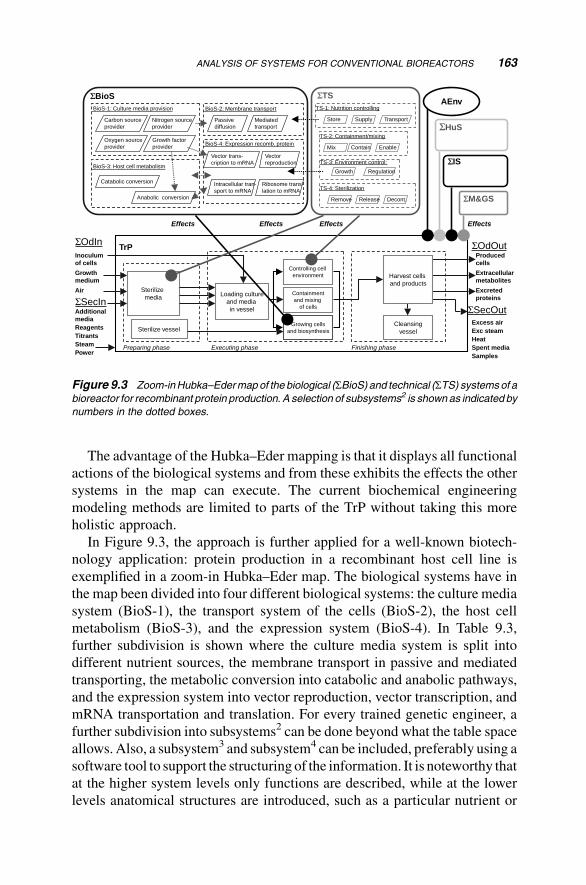
The advantage of the Hubka–Eder mapping is that it displays all functional
actions of the biological systems and from these exhibits the effects the other
systems in the map can execute. The current biochemical engineering
modeling methods are limited to parts of the TrP without taking this more
holistic approach.
In Figure 9.3, the approach is further applied for a well-known biotech-
nology application: protein production in a recombinant host cell line is
exemplified in a zoom-in Hubka–Eder map. The biological systems have in
the map been divided into four different biological systems: the culture media
system (BioS-1), the transport system of the cells (BioS-2), the host cell
metabolism (BioS-3), and the expression system (BioS-4). In Table 9.3,
further subdivision is shown where the culture media system is split into
different nutrient sources, the membrane transport in passive and mediated
transporting, the metabolic conversion into catabolic and anabolic pathways,
and the expression system into vector reproduction, vector transcription, and
mRNA transportation and translation. For every trained genetic engineer, a
further subdivision into subsystems2 can be done beyond what the table space
allows. Also, a subsystem3 and subsystem4 can be included, preferably using a
software tool to support the structuring of the information. It is noteworthy that
at the higher system levels only functions are described, while at the lower
levels anatomical structures are introduced, such as a particular nutrient or
ΣBioS ΣTS
ΣHuS
ΣIS
ΣM&GS
Sterilize vessel
Inoculumof cells
Growthmedium
Air
ΣOdOutProducedcells
Extracellularmetabolites
Excretedproteins
esahp gnihsiniFesahp gnitucexEesahp gniraperP
Loading cultureand media in vessel
ΣOdIn
AEnv
stceffEstceffEstceffEstceffE
TrP
Sterilizemedia
AdditionalmediaReagentsTitrantsSteamPower
Cleansingvessel
Controlling cell environment
Containmentand mixing
of cells
Growing cellsand biosynthesis
ΣSecIn
Harvest cells and products
ΣSecOutExcess airExc steamHeatSpent mediaSamples
TS-1: Nutrition controlling
TS-2: Containment/mixing
TS-3: Environment control:
TS-4: Sterilization
BioS-1: Culture media provision
BioS-3: Host cell metabolism
BioS-2: Membrane transport
BioS-4: Expression recomb. protein
Catabolic conversion
Anabolic conversion
Carbon sourceprovider
Nitrogen source provider
Oxygen sourceprovider
Growth factorprovider
Passivediffusion
Mediatedtransport
Vector trans-cription to mRNA
Vector reproduction
Intracellular tran-sport to mRNA
Ribosome trans-lation to mRNA
Store Supply Transport
Mix Contain Enable
Growth Regulation
Remove Release Decont.
Figure 9.3 Zoom-inHubka–Edermapof the biological (SBioS) and technical (STS) systemsof a
bioreactor for recombinant protein production. A selection of subsystems2 is shownas indicated by
numbers in the dotted boxes.
ANALYSIS OF SYSTEMS FOR CONVENTIONAL BIOREACTORS 163
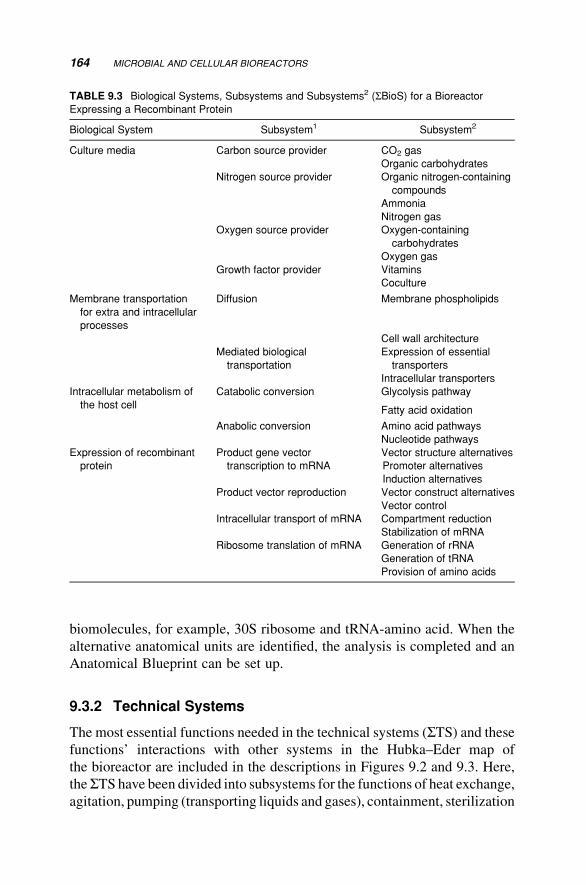
biomolecules, for example, 30S ribosome and tRNA-amino acid. When the
alternative anatomical units are identified, the analysis is completed and an
Anatomical Blueprint can be set up.
9.3.2 Technical Systems
The most essential functions needed in the technical systems (STS) and thesefunctions’ interactions with other systems in the Hubka–Eder map of
the bioreactor are included in the descriptions in Figures 9.2 and 9.3. Here,
theSTS have been divided into subsystems for the functions of heat exchange,
agitation, pumping (transporting liquids and gases), containment, sterilization
TABLE 9.3 Biological Systems, Subsystems and Subsystems2 (SBioS) for a Bioreactor
Expressing a Recombinant Protein
Biological System Subsystem1 Subsystem2
Culture media Carbon source provider CO2 gas
Organic carbohydrates
Nitrogen source provider Organic nitrogen-containing
compounds
Ammonia
Nitrogen gas
Oxygen source provider Oxygen-containing
carbohydrates
Oxygen gas
Growth factor provider Vitamins
Coculture
Membrane transportation
for extra and intracellular
processes
Diffusion Membrane phospholipids
Cell wall architecture
Mediated biological
transportation
Expression of essential
transporters
Intracellular transporters
Intracellular metabolism of
the host cell
Catabolic conversion Glycolysis pathway
Fatty acid oxidation
Anabolic conversion Amino acid pathways
Nucleotide pathways
Expression of recombinant
protein
Product gene vector
transcription to mRNA
Vector structure alternatives
Promoter alternatives
Induction alternatives
Product vector reproduction Vector construct alternatives
Vector control
Intracellular transport of mRNA Compartment reduction
Stabilization of mRNA
Ribosome translation of mRNA Generation of rRNA
Generation of tRNA
Provision of amino acids
164 MICROBIAL AND CELLULAR BIOREACTORS
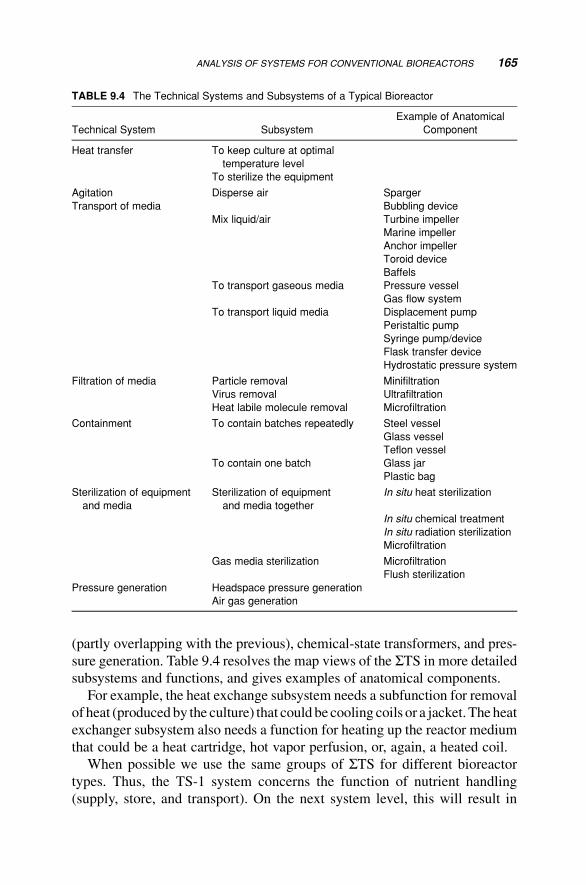
(partly overlapping with the previous), chemical-state transformers, and pres-
sure generation. Table 9.4 resolves the map views of the STS in more detailed
subsystems and functions, and gives examples of anatomical components.
For example, the heat exchange subsystem needs a subfunction for removal
of heat (produced by the culture) that could be cooling coils or a jacket.Theheat
exchanger subsystem also needs a function for heating up the reactor medium
that could be a heat cartridge, hot vapor perfusion, or, again, a heated coil.
When possible we use the same groups of STS for different bioreactor
types. Thus, the TS-1 system concerns the function of nutrient handling
(supply, store, and transport). On the next system level, this will result in
TABLE 9.4 The Technical Systems and Subsystems of a Typical Bioreactor
Technical System Subsystem
Example of Anatomical
Component
Heat transfer To keep culture at optimal
temperature level
To sterilize the equipment
Agitation Disperse air Sparger
Transport of media Bubbling device
Mix liquid/air Turbine impeller
Marine impeller
Anchor impeller
Toroid device
Baffels
To transport gaseous media Pressure vessel
Gas flow system
To transport liquid media Displacement pump
Peristaltic pump
Syringe pump/device
Flask transfer device
Hydrostatic pressure system
Filtration of media Particle removal Minifiltration
Virus removal Ultrafiltration
Heat labile molecule removal Microfiltration
Containment To contain batches repeatedly Steel vessel
Glass vessel
Teflon vessel
To contain one batch Glass jar
Plastic bag
Sterilization of equipment
and media
Sterilization of equipment
and media together
In situ heat sterilization
In situ chemical treatment
In situ radiation sterilization
Microfiltration
Gas media sterilization Microfiltration
Flush sterilization
Pressure generation Headspace pressure generation
Air gas generation
ANALYSIS OF SYSTEMS FOR CONVENTIONAL BIOREACTORS 165
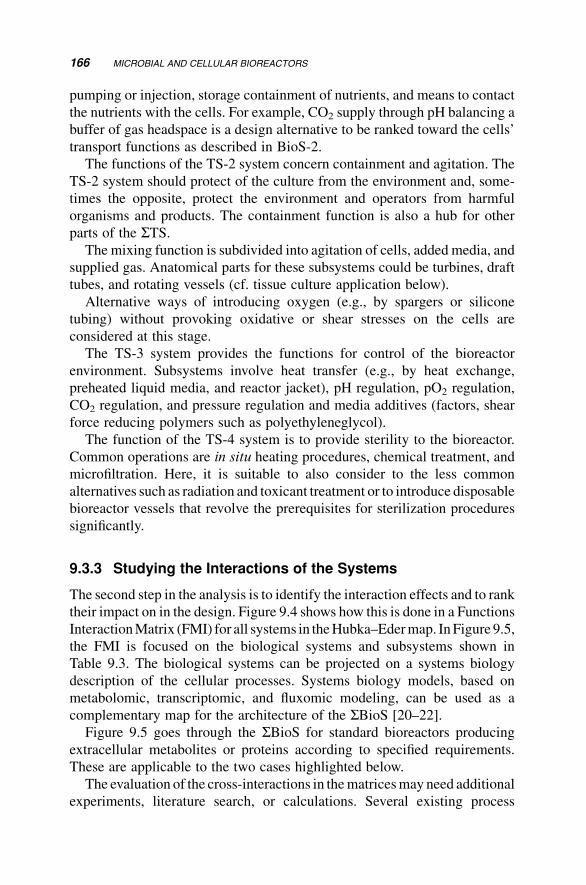
pumping or injection, storage containment of nutrients, and means to contact
the nutrients with the cells. For example, CO2 supply through pH balancing a
buffer of gas headspace is a design alternative to be ranked toward the cells’
transport functions as described in BioS-2.
The functions of the TS-2 system concern containment and agitation. The
TS-2 system should protect of the culture from the environment and, some-
times the opposite, protect the environment and operators from harmful
organisms and products. The containment function is also a hub for other
parts of the STS.The mixing function is subdivided into agitation of cells, added media, and
supplied gas. Anatomical parts for these subsystems could be turbines, draft
tubes, and rotating vessels (cf. tissue culture application below).
Alternative ways of introducing oxygen (e.g., by spargers or silicone
tubing) without provoking oxidative or shear stresses on the cells are
considered at this stage.
The TS-3 system provides the functions for control of the bioreactor
environment. Subsystems involve heat transfer (e.g., by heat exchange,
preheated liquid media, and reactor jacket), pH regulation, pO2 regulation,
CO2 regulation, and pressure regulation and media additives (factors, shear
force reducing polymers such as polyethyleneglycol).
The function of the TS-4 system is to provide sterility to the bioreactor.
Common operations are in situ heating procedures, chemical treatment, and
microfiltration. Here, it is suitable to also consider to the less common
alternatives such as radiation and toxicant treatment or to introduce disposable
bioreactor vessels that revolve the prerequisites for sterilization procedures
significantly.
9.3.3 Studying the Interactions of the Systems
The second step in the analysis is to identify the interaction effects and to rank
their impact on in the design. Figure 9.4 shows how this is done in a Functions
InteractionMatrix (FMI) for all systems in theHubka–Edermap. InFigure 9.5,
the FMI is focused on the biological systems and subsystems shown in
Table 9.3. The biological systems can be projected on a systems biology
description of the cellular processes. Systems biology models, based on
metabolomic, transcriptomic, and fluxomic modeling, can be used as a
complementary map for the architecture of the SBioS [20–22].
Figure 9.5 goes through the SBioS for standard bioreactors producing
extracellular metabolites or proteins according to specified requirements.
These are applicable to the two cases highlighted below.
The evaluation of the cross-interactions in thematricesmay need additional
experiments, literature search, or calculations. Several existing process
166 MICROBIAL AND CELLULAR BIOREACTORS
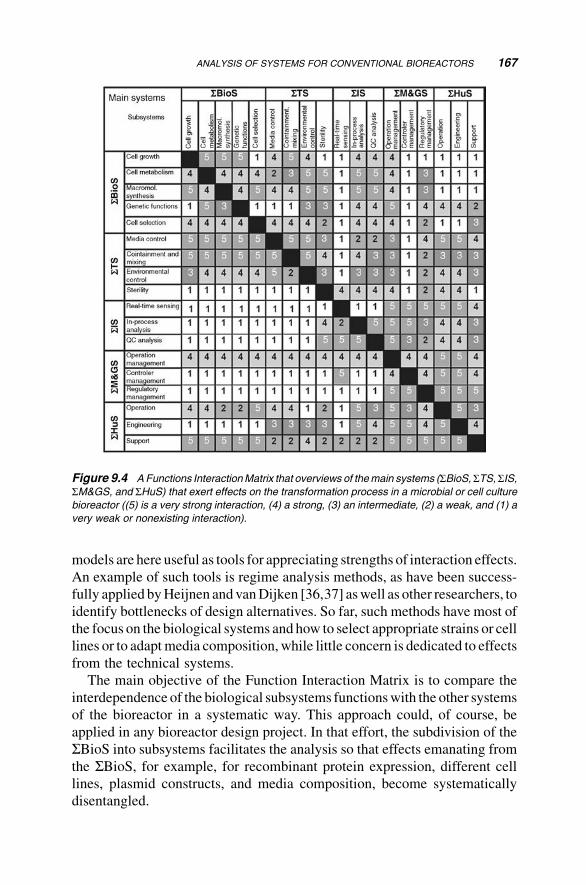
models are here useful as tools for appreciating strengths of interaction effects.
An example of such tools is regime analysis methods, as have been success-
fully applied byHeijnen and vanDijken [36,37] aswell as other researchers, to
identify bottlenecks of design alternatives. So far, such methods have most of
the focus on the biological systems and how to select appropriate strains or cell
lines or to adaptmedia composition, while little concern is dedicated to effects
from the technical systems.
The main objective of the Function Interaction Matrix is to compare the
interdependence of the biological subsystems functionswith the other systems
of the bioreactor in a systematic way. This approach could, of course, be
applied in any bioreactor design project. In that effort, the subdivision of the
SBioS into subsystems facilitates the analysis so that effects emanating from
the SBioS, for example, for recombinant protein expression, different cell
lines, plasmid constructs, and media composition, become systematically
disentangled.
Figure 9.4 AFunctions InteractionMatrix that overviews of themain systems (SBioS, STS,SIS,SM&GS, and SHuS) that exert effects on the transformation process in a microbial or cell culture
bioreactor ((5) is a very strong interaction, (4) a strong, (3) an intermediate, (2) a weak, and (1) a
very weak or nonexisting interaction).
ANALYSIS OF SYSTEMS FOR CONVENTIONAL BIOREACTORS 167
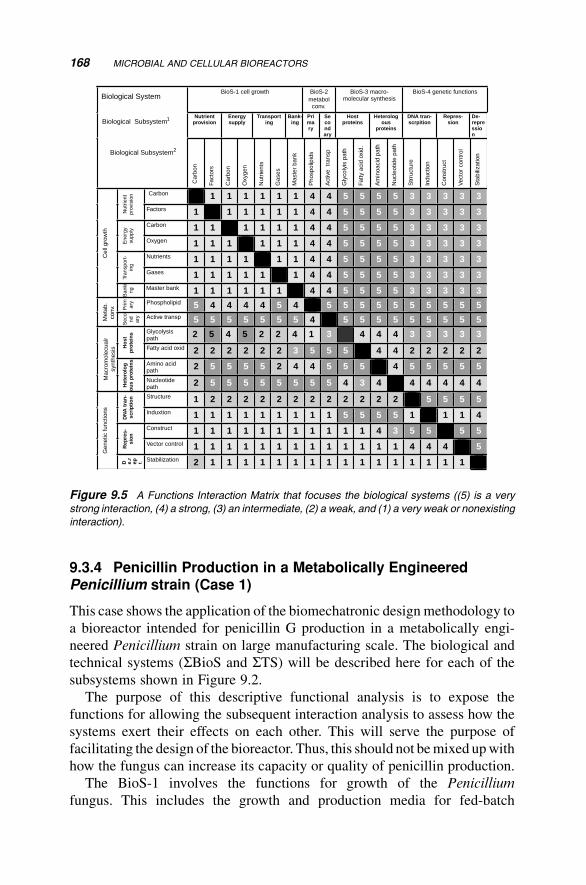
9.3.4 Penicillin Production in a Metabolically EngineeredPenicillium strain (Case 1)
This case shows the application of the biomechatronic design methodology to
a bioreactor intended for penicillin G production in a metabolically engi-
neered Penicillium strain on large manufacturing scale. The biological and
technical systems (SBioS and STS) will be described here for each of the
subsystems shown in Figure 9.2.
The purpose of this descriptive functional analysis is to expose the
functions for allowing the subsequent interaction analysis to assess how the
systems exert their effects on each other. This will serve the purpose of
facilitating the design of the bioreactor. Thus, this should not bemixed upwith
how the fungus can increase its capacity or quality of penicillin production.
The BioS-1 involves the functions for growth of the Penicillium
fungus. This includes the growth and production media for fed-batch
BioS-1 cell growth BioS-2metabol
conv.
BioS-3 macro-molecular synthesis
BioS-4 genetic functions
Nutrient provision
Energy supply
Transporting
Bank-ing
Primary
Secondary
Hostproteins
Heterologous
proteins
DNA tran-scrpition
Repres-sion
De-repression
Biological System
Biological Subsystem1
Biological Subsystem2
Car
bon
Fact
ors
Car
bon
Oxy
gen
Nut
rient
s
Gas
es
Mas
ter
bank
Pho
spol
ipid
s
Act
ive
tran
sp
Gly
coly
is p
ath
Fatty
aci
d ox
id.
Am
inoa
cid
path
Nuc
leot
ide
path
Str
ruct
ure
Indu
ctio
n
Con
stru
ct
Vec
tor
cont
rol
Sta
biliz
atio
n
Carbon 1 1 1 1 1 1 4 4 5 5 5 5 3 3 3 3 3
Nut
rient
prov
isio
n
Factors 1 1 1 1 1 1 4 4 5 5 5 5 3 3 3 3 3Carbon 1 1 1 1 1 1 4 4 5 5 5 5 3 3 3 3 3
Ene
rgy
supp
ly
Oxygen 1 1 1 1 1 1 4 4 5 5 5 5 3 3 3 3 3Nutrients 1 1 1 1 1 1 4 4 5 5 5 5 3 3 3 3 3
Tran
spor
t-in
g
Gases 1 1 1 1 1 1 4 4 5 5 5 5 3 3 3 3 3
Cel
l gro
wth
Ban
king
Master bank 1 1 1 1 1 1 4 4 5 5 5 5 3 3 3 3 3
Prim ar
y Phospholipid 5 4 4 4 4 5 4 5 5 5 5 5 5 5 5 5 5
Met
ab.
conv
.
Sec
ond ar
y Active transp 5 5 5 5 5 5 5 4 5 5 5 5 5 5 5 5 5Glycolysis path 2 5 4 5 2 2 4 1 3 4 4 4 3 3 3 3 3
Ho
st
pro
tein
s
Fatty acid oxid 2 2 2 2 2 2 3 5 5 5 4 4 2 2 2 2 2Amino acid path 2 5 5 5 5 2 4 4 5 5 5 4 5 5 5 5 5
Mac
rom
olec
ualr
synt
hesi
s
Het
ero
log
o
us
pro
tein
s
Nucleotidepath 2 5 5 5 5 5 5 5 5 4 3 4 4 4 4 4 4Structure 1 2 2 2 2 2 2 2 2 2 2 2 2 5 5 5 5
DN
A t
ran
-sc
rip
tio
n
Induxtion 1 1 1 1 1 1 1 1 1 5 5 5 5 1 1 1 4Construct 1 1 1 1 1 1 1 1 1 1 1 4 3 5 5 5 5
Rep
res-
sio
n
Vector control 1 1 1 1 1 1 1 1 1 1 1 1 1 4 4 4 5
Gen
etic
func
tions
D e.r
ep r. Stabilization 2 1 1 1 1 1 1 1 1 1 1 1 1 1 1 1 1
Figure 9.5 A Functions Interaction Matrix that focuses the biological systems ((5) is a very
strong interaction, (4) a strong, (3) an intermediate, (2) a weak, and (1) a very weak or nonexisting
interaction).
168 MICROBIAL AND CELLULAR BIOREACTORS
operation (BioS-1.1). Themain nutrient sources for sustaining optimal growth
are typically glucose, lactate, ammonia, and oxygen supplemented with a
selection of trace elements. The design of the composition of themedia could,
for example, be supported by using factorial design experiments [38]. The
sensitivity of the components for other systems for agitation method, mon-
itoring of rates, and so on are further commented on below.
The BioS-1 also involves the function for transport across the Penicillium
cell wall and membrane. This is a rate-limiting step. Growth rate cannot
exceed this capacity. Its relation to mixing and avoidance of oxygen or
nutrient-depleted zones in the vessel is critical.
The BioS-2 concerns the metabolite conversion in the fungal metabolism.
Themetabolism both for growth and for penicillin production is included. The
pathway to penicillin is of primarily concern (BioS-2.2). To enhance the flux
of the pathway to penicillin, a metabolic engineering approach can be carried
out by elevating the expression of bottleneck enzymes in the pathway. This
should be accomplished by the protein production system. Also, strain
development and selection is under the scope of the metabolic aspects of
BioS-2 for both cell mass growth and metabolite turnover.
The function of BioS-3 is to provide the Penicillium proteome. The
enzymes involved in the pathway to penicillin G is a separate subsystem
(BioS-3.2) here. Improvement of the Penicillium strain by metabolically
engineering through insertion of a plasmid gene cluster for the pathway
enzymes could result in a higher expression level and a higher penicillin
flux [20]. The excretion step of penicillin G is also of interest.
Issues of plasmid instability, plasmid number, promoter system, induction
method, and selection pressure are also important attributes of BioS-3
subsystems. Stabilizing agents or other means should be considered in the
design of the bioreactor.
The BioS-4 system concerns the complex functions of genetic regulation of
the filamentous Penicillium fungus. The cell cycle is partly well described in
general terms. Under consideration here are functions that could interact with
the other systems. This should be thoroughly scrutinized even if this seems at
this stage unlikely to influence design decisions.
The physiology of the fungus and how it interacts with the agitation of
the medium, the delayed diffusion, and the fouling effects on the walls
of equipment and detector surfaces are other cross-effects between subsystems,
both in the Hubka–Eder maps and the Functions Interaction Matrix (Fig-
ure 9.6) [39]. The physiology of the membrane and cell wall structures do also
affect extraction equilibrium balance of product molecule in the harvest and
recover phase of the TrP. Degradation of the penicillin product and of enhanced
enzymes in the penicillin pathway by protease activity is another biological
design issue that can be approachedby strain selection and genetic engineering.
ANALYSIS OF SYSTEMS FOR CONVENTIONAL BIOREACTORS 169
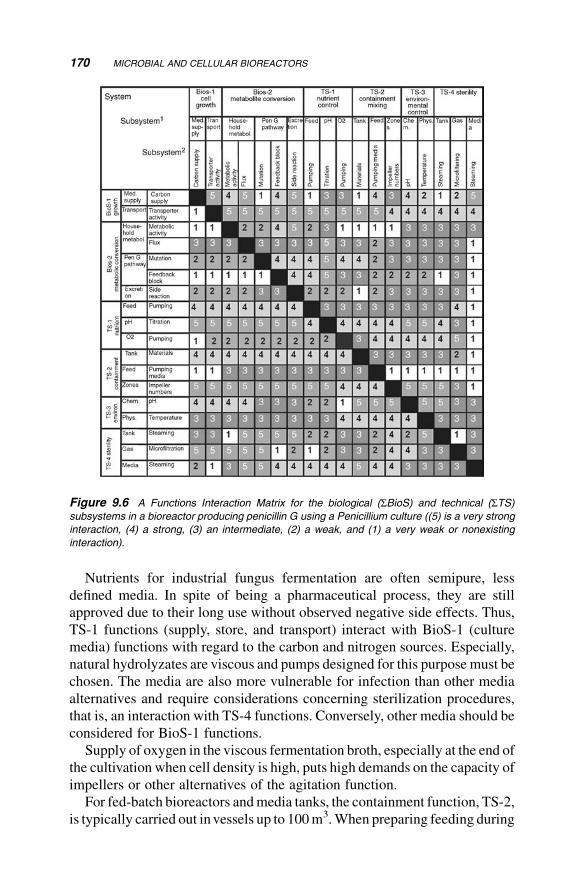
Figure 9.6 A Functions Interaction Matrix for the biological (SBioS) and technical (STS)subsystems in a bioreactor producing penicillin G using a Penicillium culture ((5) is a very strong
interaction, (4) a strong, (3) an intermediate, (2) a weak, and (1) a very weak or nonexisting
interaction).
Nutrients for industrial fungus fermentation are often semipure, less
defined media. In spite of being a pharmaceutical process, they are still
approved due to their long use without observed negative side effects. Thus,
TS-1 functions (supply, store, and transport) interact with BioS-1 (culture
media) functions with regard to the carbon and nitrogen sources. Especially,
natural hydrolyzates are viscous and pumps designed for this purpose must be
chosen. The media are also more vulnerable for infection than other media
alternatives and require considerations concerning sterilization procedures,
that is, an interaction with TS-4 functions. Conversely, other media should be
considered for BioS-1 functions.
Supply of oxygen in the viscous fermentation broth, especially at the end of
the cultivation when cell density is high, puts high demands on the capacity of
impellers or other alternatives of the agitation function.
For fed-batch bioreactors andmedia tanks, the containment function, TS-2,
is typically carried out invessels up to 100m3.When preparing feeding during
170 MICROBIAL AND CELLULAR BIOREACTORS
fed-batch phase of more than one influent flows require efficient sterilization
capacity (TS-4). The fed-batch time is more extended than for many other
fermentation processes, which also puts a burden on the sterility function.
Cleansing of the containment vessel of other parts of containment become
more demanding with clogging and fouling media and fungal suspension –
this can also be included in the sterilization and sanitation procedures.
The environment control functions, TS-3, are also affected by the state of
the extracellular system in the bioreactor for the same reasons.More gradients
are created both due to largevessel size and due to viscousmedia. Ifmore parts
are installed inside the vessel, stagnant zones with depletion of the media may
become abundant.
Means to optimize, monitor, and control the bioreactor are generated in the
STS, SIS, and SM&GS, which are further discussed in the following sections.
Again, this analysis of functions in a bioreactor design for a particular
application, large-scale penicillin manufacture, has the sole purpose of
sustaining the efficiency of the biomechatronic design approach when de-
signing a bioreactor system, and is not a way to analysis how to develop
the antibiotic bioprocess. That can also be done with the support of the
biomechatronic theory, but would then require an approach for structuring
the analysis other than above.
9.3.5 A Bioreactor System Producing a Recombinant Proteinin CHO Cell Culture (Case 2)
In this case, the biomechatronic designmethodology is applied to a bioreactor
for production of a recombinant protein by aCHOcell culture. Thismeans in a
number of differences in needs and conditions for the design. Still, the same
main systems as in the previous case are appropriate to analysis. But these
need to be supported by additional subsystem entities that represent the
specific functions of the mammalian cell physiology such as glycosylation,
chaperonin expression, apoptotic regulation, and surface attachment. Also,
the technical design of a bioreactor for mammalian cells requires special
attention in a number of ways.
For a mammalian cell culture, the functions of BioS-1, cell growth, have a
greater complexity. Especially, the BioS-1.2, that is, the media supply
function, concerns here the media of a larger number of components. It
could include, for example, two different nutrient compositions, one for
CHO cell growth and another for protein production. It could be growth in
serum or serum-free media. Since the media are significantly more complex
than the media for antibiotic production in fungi, they are supplied
with expensive physiology stimulating factors, something that significantly
increases the media cost. Consequently, this emphasizes its importance
in designing.
ANALYSIS OF SYSTEMS FOR CONVENTIONAL BIOREACTORS 171
The BioS-3, that is, the macromolecular synthesis function, is greatly
affected by amore complex proteome setup. For example, transporter proteins
located in external and internal membranes that take up the media compo-
nents, transfer metabolites and proteins, and excrete the product protein
constitute a huge complex network. The BioS-3 for the metabolic machinery
of the CHO cell is complex as well and includes only those cell functions
associated with cell propagation. The posttranslational functions are here
excluded, but instead found together with the other functions involved in
protein formation.
The functions for the expression machinery of the recombinant protein,
BioS-3.2, include the transfection of the cell line with a product protein-
expressing vector, its control functions, the genome integration mechanisms
and vector stabilization, the transcription and translationmechanisms, and the
glycosylation of the peptide in the endoplasmic reticulum and Golgi
compartments.
There are a number of design criteria that show dependence on other
subsystems of the bioreactor design. The interplay with shear forces is created
by the STS, the cell membrane properties, the mechanical stress, the oxygen
stress, and their propagation to other cell functions such as cell division rate,
onset of apoptosis, and cellolytic effects, and activation of hsp gene responses.
Additional functions possible to consider are stability of vector integration in
CHO cells, secretion from CHO cell of the recombinant glycoprotein,
chaperone functions, phosphorylation, and compartmentalization effects on
the CHO cells.
A general consideration for all mammalian cell cultures is the sensitivity to
shear stress, low oxygen transfer, and lower cell densities. These properties of
mammalian cells have been main issues in the development of cell culture
bioreactors. Thus, designing of theTS-1 functions to reduce harmful effects on
the cells has created solutions such as low shear-stress impellers (e.g., marine
impellers), oxygenation through porous silicone tubing, introduction of
protective polymers in the culture media, the use of microcarriers and airlift
oxygenation of these, and many other more or less intricate solutions. It is
obvious from this that the transformation functions of media, including gases,
require special attention.
The longculture times, sometimesup to30days (e.g., humanFactorVIIIwith
recombinant CHO cells) put higher demands on containment. This is a priority
since the economic consequence of lost batches due to infections is huge.
Investment in a more elaborate containment design pays off. The containment
functions on an anatomical level become matters of generating alternatives of
bearings, gaskets, pipe steaming, polishing of surfaces, and so on.
The sensitivity of the CHO cells to various forms of biological stresses in a
wider context needs to be addressed during the design of all STS. But it is in
172 MICROBIAL AND CELLULAR BIOREACTORS
particular in the functions executed by TS-4 where the extracellular envi-
ronment of the bioreactor can be designed in a better way to cope with
biological stress effects. Thus, the interconnections between the SBioS and
the TS-3 should be scrutinized thoroughly.
Mainly three interactions require special attention: (1) effects on the substrate
uptake, (2) effects on the metabolism of the cells, (3) and effects on the
recombinant protein product. First, the temperature gradients of the micro-
environment of the cells could potentially influence transport rates and
membrane fluidity and by that facilitate or impede the exchange of substrates,
factors, and so on. Depletion may elicit stressor molecules. Examples are heat
shock proteins (hsp 60 and hsp 70), chaperonins, and transmembrane gluco-
transferases [40].
Second, the apoptotic effects on the CHO cell have external elicitation
routes. Can these be alleviated by tuning the microenvironment? Can injec-
tions of factors be controlled?These questions touch upon the state of the art of
cell biology.
Third, can the conditions in the microenvironment be controlled so that
proteases degrade the recombinant product inside or outside the cell (e.g., due
to lytic release)?
The control possibilities of the microenvironment by STS-3 are limited to
pH and pO2, temperature, possibly pressing, shear forces, pCO2, and a few
measurable substances. To realize these control “loops,” SIS functions (see
below) must be added, some today nonexisting but subject for intensive
research.
The Functions Interaction Matrix in Figure 9.7 ranks the strengths of
interactions between the biological and the technical systems of the biore-
actor. These interactions require a thorough research of data and information,
but are still a time-saving effort compared to experimental trials with a low
growth rate CHO cell culture.
The two cases show the value of applying the biomechatronicmethodology
directly to the intended applications of the bioreactor product. By that, the user
needs become even more highlighted in the design, the added complexity of
the SBioS better integrated, and the potential problems the users will meet
anticipated, relieving the product support functions.
9.3.6 Information Systems
The exchange of information between the biological and the technical systems
in the bioreactor and the bioreactormanagement goes through the information
systems (SIS). Their functions are to acquire and interpret signals and presentthese signals in forms that are useful for monitoring and controlling the
transformation in the bioreactor toward set goals [41].
ANALYSIS OF SYSTEMS FOR CONVENTIONAL BIOREACTORS 173
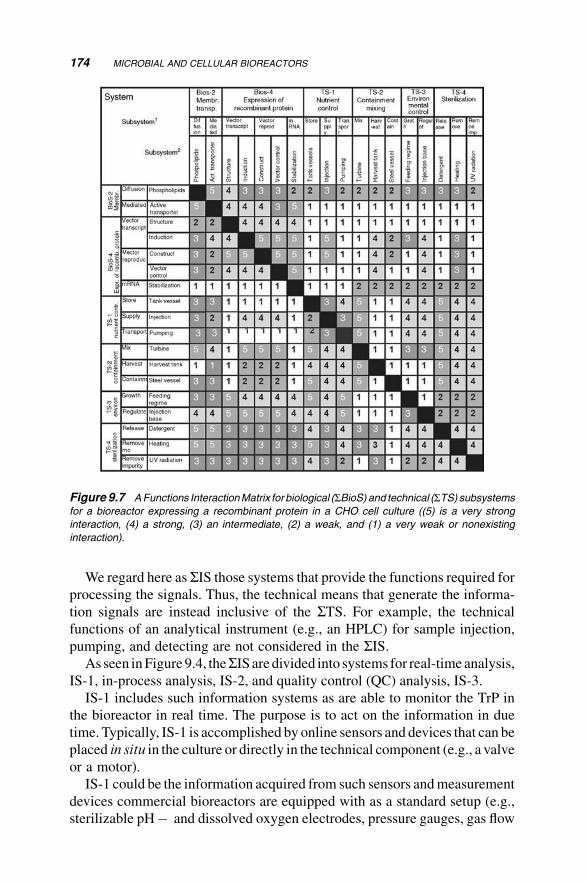
We regard here as SIS those systems that provide the functions required for
processing the signals. Thus, the technical means that generate the informa-
tion signals are instead inclusive of the STS. For example, the technical
functions of an analytical instrument (e.g., an HPLC) for sample injection,
pumping, and detecting are not considered in the SIS.As seen inFigure9.4, theSIS are divided into systems for real-timeanalysis,
IS-1, in-process analysis, IS-2, and quality control (QC) analysis, IS-3.
IS-1 includes such information systems as are able to monitor the TrP in
the bioreactor in real time. The purpose is to act on the information in due
time. Typically, IS-1 is accomplished by online sensors and devices that can be
placed in situ in the culture or directly in the technical component (e.g., a valve
or a motor).
IS-1 could be the information acquired from such sensors andmeasurement
devices commercial bioreactors are equipped with as a standard setup (e.g.,
sterilizable pH� and dissolved oxygen electrodes, pressure gauges, gas flow
Figure 9.7 AFunctions InteractionMatrix for biological (SBioS) and technical (STS) subsystems
for a bioreactor expressing a recombinant protein in a CHO cell culture ((5) is a very strong
interaction, (4) a strong, (3) an intermediate, (2) a weak, and (1) a very weak or nonexisting
interaction).
174 MICROBIAL AND CELLULAR BIOREACTORS
meters, temperature sensors for the reactor vessel, and temperature sensors for
sterilization monitoring). IS-1 could also be acquired from new solutions of
instrumentation or by combination of signals. One example of the latter is
software sensors [42].
Technically, standard setups and new solutions belong to subsystems of the
STS. When generating information, either they interact with other technical
subsystems (e.g., valve, pumps, and heat exchangers) or they interact directly
with subsystems of SBioS (e.g., microbial cells, metabolites, and proteins in
the culture medium).
IS-2 includes information acquired from in-process analysis. Here, we
mainly refer to offlinemeasurements carried out in the bioreactor by operators
or possibly by automated analyzers. This information is consequently a result
of interaction with people that should follow certain analytical protocols or by
machines programmed for certain analytical procedures. Both are external
from the physical bioreactor but could, after a time delay, result in interactions
with the bioreactor. Examples are dry weight samples from the bioreactor
measured by a technician in a spectrophotometer, or testing of glucose in the
medium using a dipstick.
The IS-3 includes information acquired from the QC laboratory. Typically,
this information is the result of analyses carried out with validated methods
required by regulatory demands. It could also be samples sent to the research
laboratory where advanced analysis methods are applied. The IS-3-derived
information has one thing in common with IS-2 that the information is
generated outside the bioreactor by other instruments and by humans (tech-
nicians and researchers) in lab facilities separately from the bioreactor. The
information may interact with the SBioS and STS but rarely in real time.
Instead, the information is used by the SM&GS for setting limits, establishing
procedures, and making decisions. Examples are gene sequence analysis,
GC-MS of glycosylated product forms, SDS-PAGE, immunoblotting meth-
ods, and so on.
In the IS-1, IS-2, and IS-3 systems, signal processing, data processing,
statistics, and modeling methods are useful and become subfunctions of
the SIS. The information systems could benefit from interacting in
between.
It is motivated to thoroughly consider the needs of the information.
The required information should be listed and characterized. In what ranges
should information be acquired, how fast, and with what precision and
accuracy? On the basis of these specifications should the information method
be selected. In Table 9.5, examples of information systems are given on two
subsystem levels. In the second level, analyticalmethods and instrumentations
arementioned. A priority of information needs is of value. Analytical sciences
can often provide alternative methods, but these must be evaluated toward
needs and demands.
ANALYSIS OF SYSTEMS FOR CONVENTIONAL BIOREACTORS 175
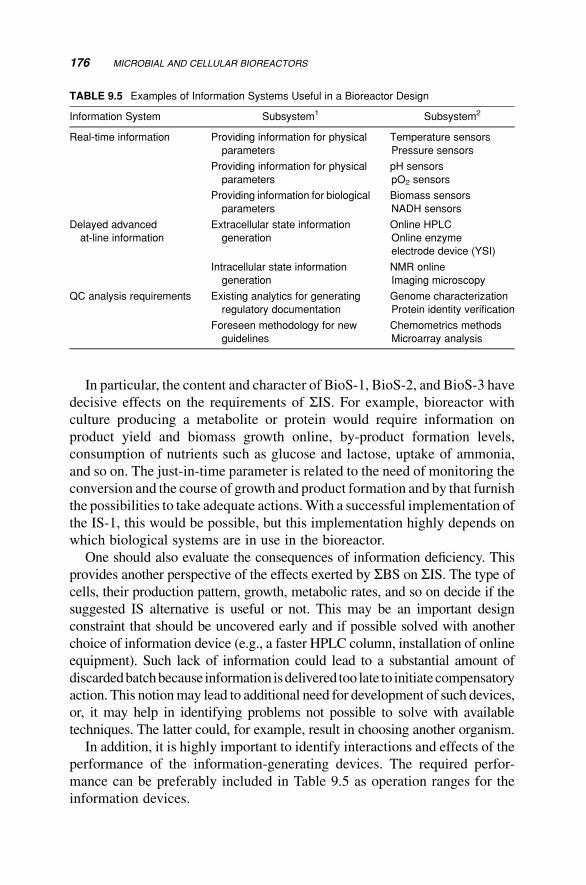
In particular, the content and character of BioS-1, BioS-2, and BioS-3 have
decisive effects on the requirements of SIS. For example, bioreactor with
culture producing a metabolite or protein would require information on
product yield and biomass growth online, by-product formation levels,
consumption of nutrients such as glucose and lactose, uptake of ammonia,
and so on. The just-in-time parameter is related to the need of monitoring the
conversion and the course of growth and product formation and by that furnish
the possibilities to take adequate actions.With a successful implementation of
the IS-1, this would be possible, but this implementation highly depends on
which biological systems are in use in the bioreactor.
One should also evaluate the consequences of information deficiency. This
provides another perspective of the effects exerted by SBS on SIS. The type ofcells, their production pattern, growth, metabolic rates, and so on decide if the
suggested IS alternative is useful or not. This may be an important design
constraint that should be uncovered early and if possible solved with another
choice of information device (e.g., a faster HPLC column, installation of online
equipment). Such lack of information could lead to a substantial amount of
discardedbatchbecause information isdelivered too late to initiatecompensatory
action. This notionmay lead to additional need for development of such devices,
or, it may help in identifying problems not possible to solve with available
techniques. The latter could, for example, result in choosing another organism.
In addition, it is highly important to identify interactions and effects of the
performance of the information-generating devices. The required perfor-
mance can be preferably included in Table 9.5 as operation ranges for the
information devices.
TABLE 9.5 Examples of Information Systems Useful in a Bioreactor Design
Information System Subsystem1 Subsystem2
Real-time information Providing information for physical
parameters
Temperature sensors
Pressure sensors
Providing information for physical
parameters
pH sensors
pO2 sensors
Providing information for biological
parameters
Biomass sensors
NADH sensors
Delayed advanced
at-line information
Extracellular state information
generation
Online HPLC
Online enzyme
electrode device (YSI)
Intracellular state information
generation
NMR online
Imaging microscopy
QC analysis requirements Existing analytics for generating
regulatory documentation
Genome characterization
Protein identity verification
Foreseen methodology for new
guidelines
Chemometrics methods
Microarray analysis
176 MICROBIAL AND CELLULAR BIOREACTORS
Process analytical technology (PAT) has highlighted biopharmaceutical
processing where the bioreactor is an integral part. In PAT, a number of SISissues are thoroughly attended [43]. For example, real-time monitoring and
data analysis are main concerns of PAT. We have devoted Chapter 13 entirely
to PAT and its role in manufacturing processes, with a wider perspective.
Clearly, PAT has a role in the basic design concepts of bioreactors.
9.3.7 Management and Goal Systems
The processed information from SIS is handled by the management and goal
systems (SM&GS). It is possible to distinguish subsystems that in a direct
way act on the information by furthering instructions to the STS for
correction states or conditions related to the SBioS. This can be done as
instructed in the Standard Operation Procedures (SOPs) where goal values
might be set. Typically, it is the operator at the plant that effectuates this
instruction initiated by the information delivered. Here, we refer this as a
function of M&GS-1.
The informationmay also be handled in an automated fashion, for example,
with a tuned feedback controllerwith a given set-point. The set-point could be a
result of previously established optimal operation conditions for the process. It
could also be set by ranges established from quality-by-design (QbD) inves-
tigations [44] (see also Chapter 13). We refer to these functions as M&GS-2.
SM&GShave also functions independent of theSIS. These include the lawsand regulations that must bemet for a bioreactor system. Here, we group these
into M&GS-3. For example, the regulatory authorities have strict regulatory
frameworks a bioreactor operating in a manufacturing process must comply
with. The Good Manufacturing Practice regulations should be applied to the
bioreactor system if it is producing pharmaceuticals. Other quality systems
could apply to other products. Environmental protection laws are other
examples. Several of the constraints have to be converted into operational
procedures that form the instructions of the SOPs of M&GS-1.
Recent initiative from the authorities concerning PATand QbD should also
be implemented byM&GS-3 [43,44]. In the QbD guidelines, the design space
and control space of the process to be carried out are established on the basis of
experiment studies. The PAT guidelines strongly recommend the use of online
monitoring and control, thus directly applicable to M&GS-2, IS-1, and STS(see also Chapter 13).
From these various functions in SM&GS, three levels of activities can be
distinguished:
. Basic management of the operations to reach acceptable performance of
the bioreactor.
ANALYSIS OF SYSTEMS FOR CONVENTIONAL BIOREACTORS 177
. Application of automated control methods based on process information.
. Integration of the operation into regulatory procedures from the plant
management, the process engineers (process R&D), according to regu-
latory guidelines.
The design solutions in SBioS and STS depend on the constraints and
possibilities that SM&GS can cope with. Thus, it is decisive to assess these
interactions and effects or at least to have in mind what is needed for these
aspects when selecting from generated design concepts.
In most cases, the prerequisites are that the basic management system for
operating the bioreactor may follow the SOP protocol according to GMP
guidelines, or any other manufacturing protocols. The effects of these plant
management procedures on STS, SIS, and SHuS should be tabulated actions
and checkpoints. This is congruent with most quality system and risk
management procedures as described in several industrial guidelines, in
particular for pharmaceutical manufacture.
The basic management is preferably carried out at the bioreactor via an
operator–computer interface. The management structure and checkpoints can
be built-in into the interface view. Of the more obvious interactions that are
displayed, this interface becomes to some extent a mirror of the TrP in the
Hubka–Eder map. In other words, the operator interface should prioritize the
most decisive interaction towardSTS andSBioS viaSIS. TheSM&GS should
then provide the means to effectuate the control and steering of the bioreactor.
Considering a single-unit bioreactor, the situation is relatively easy to
overview, while a bioreactor assembly in a plant magnifies the demands of
statistical process control (SPC) procedures. The limits for the SPC are set
beforehand, that is, as a result of process R&D or goals established by the
persons responsible for quality. By this, the goals are set for the operation of
the bioreactor. Examples of limits required to be set are temperature at
sterilization, noise levels of electrodes before replacement, overpressure
alarms, rate of impeller, warning temperatures for the culture, and pO2
electrode limits for feeding or mixing rate.
An integral part of the management is to take actions. If the actions can be
automated by feedback or feedforward control repeatability and consistency
of the actions can be expected. The control rules to be followed primarily
include basic control methodology, such as on–off controller, P, PI, or PID
controllers, or sequence controllers. Set-points and time schedules are nor-
mally a result of early development of the controller or more or less elaborate
tuning of them.
Sterilization schedules are based on real-time temperature and pressure
sensors (i.e., IS-1 and IS-2) and valve and steam generation from TS-4 (cf.
Figure 9.3). The effects of signal response times, noise, and accuracy are
178 MICROBIAL AND CELLULAR BIOREACTORS
interactions that have direct effects on the design of the controller. Choice and
spending on sensor quality devices become ranking criteria. The impact and
requirement on quality of sterilization is a design decision to be taken.
9.3.8 Human Systems
The human systems (SHuS) involved for carrying out the TrP can be divided
into those furnishing the operation functions of the bioreactor, HuS-1, those
providing or using the bioreactor for development functions, HuS-2, and those
responsible for the external technical support functions, HuS-3. It is easy to
identify groups of professionals in the SHuS (technicians, plant engineers,
developers, managers, and service technicians). However, at this stage, it is
more interesting to consider the functions these professionals furnish and how
those functions interact with other systems.
Clearly, the operation of the bioreactor and the HuS-1 interaction with
STS are highly important. The conditions vary much from an industrial
manufacturing environment to a research laboratory. The training and expe-
rience of the operators must be considered. The ease with which the devices
are operated, the access to information and data, and the expected actions to be
taken by operators and plant engineers determine several of the design criteria
placed on the systems. The choice of alternative within STS should conse-
quently be done with considerations of how SHuS will interact with them.
Asmentioned above, there aremany interactions between theSHuS and theSM&GS concerning information, control, and regulatory issues. The SHuSnormally initiate or supervise the issues under SM&GS. For example, the
plant engineers will take the responsibility of implementing and verifying the
rules and guidelines, while the development engineers will optimize para-
meters and investigate suitable control space. A sometimes neglected function
is support and maintenance by human systems. If these are not well trimmed,
operation will stall in the long-term perspective.
9.3.9 Active Environment
Unexpected effects exerted by the ambient surrounding on the subsystems and
TrP in the bioreactor are recurrently experienced by every process operator
with great distress. The term active environment (AEnv) covers everything
that can happen and cannot be properly explained and foreseen. The so-called
“biological variation,” usually meant as unreproducible or unanticipated
variations in the culture, falls within the category of effects exerted by the
active environment. Other effects are involuntary infections, impurities of
media, technical malfunctions of equipment, and so on. No doubt, this
ANALYSIS OF SYSTEMS FOR CONVENTIONAL BIOREACTORS 179
category of effects is a very important design factor to consider. Its negation by
cautious actions that are built into the design could be a potential quality
improvement of the bioreactor product.
One should be observant of the fact that theAEnv effects are also exerted on
embedded functions of STS and SIS and the propagation of these to SM&GS.
For example, the effects on response times of all the systems could have
considerable consequences. Growth from an infection on pH membrane or in
ultrafiltration units may retard the expected rate of response of purification
time. Fouling on mixers may change shear stress effects. The burden on
sterilization equipment is another effect that is difficult to anticipate. Others
are heat variation effects on HPLC and LC-MS equipment.
It may be difficult to realize all possible effects of temperature variation in
the ambient air or variation in the cooling water line. For example, effects
on such devices or parts that are not temperature controlled could be
easily disregarded. Effects on DO-electrode operation and “filtration con-
stants” for air filters in the bioreactor outlet are easy to forget. Another
example seldom controlled is fouling on heat exchangers affecting the heat
conduction number.
More long-term effects caused by ambient could be corrosion effects on
metal parts of the equipment. The risk estimates for such effects to interfere in
the performance of the bioreactor are of particular value to include in the
design decisions.
9.4 NOVEL BIOREACTOR DESIGNS
9.4.1 Microbioreactors
Scaling down of microbioreactors has been accomplished down to working
volumes below 50mL. The main reasons behind this development of micro-
bioreactors are the desire to carry out high-throughput testing of chemicals and
to facilitate bioprocess development by faster and more efficient testing
of strains and media components [45]. Other microbioreactor applications
considered are small-scale production and pharmaceutical development.When
including lab-on-a-chip applications in the microbioreactor concept, which is
definitely motivated, these possibilities become even more pronounced [46].
The design of miniaturized bioreactors makes an appropriate rearrange-
ment of the Hubka–Eder map. The purpose is to highlight critical obstacles
necessary to surpass (Figure 9.8). The physiochemical effects on cells
and microorganisms caused by the smaller dimensions must be understood
and handled with caution. In particular, gradients and interactions
with wall materials become sensitive design parameters. Therefore,
180 MICROBIAL AND CELLULAR BIOREACTORS
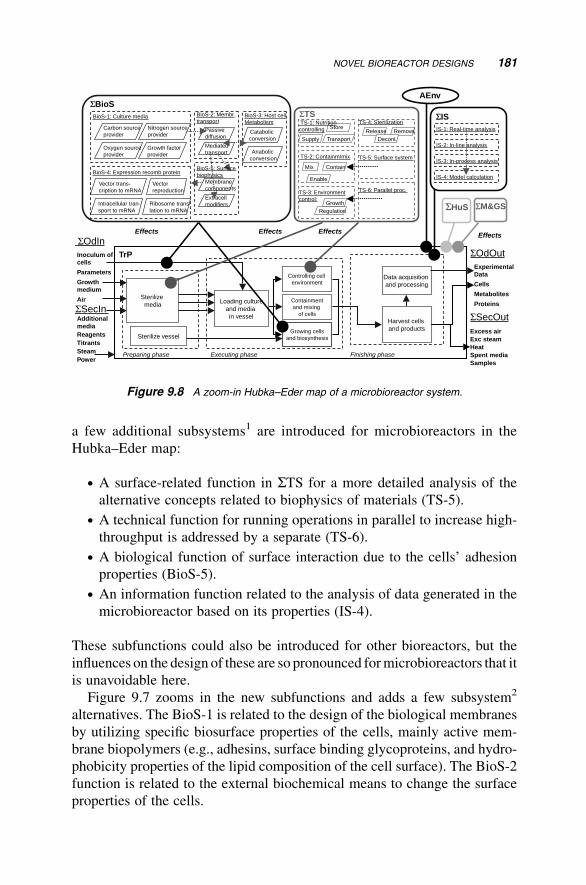
a few additional subsystems1 are introduced for microbioreactors in the
Hubka–Eder map:
. A surface-related function in STS for a more detailed analysis of the
alternative concepts related to biophysics of materials (TS-5).
. A technical function for running operations in parallel to increase high-
throughput is addressed by a separate (TS-6).
. A biological function of surface interaction due to the cells’ adhesion
properties (BioS-5).
. An information function related to the analysis of data generated in the
microbioreactor based on its properties (IS-4).
These subfunctions could also be introduced for other bioreactors, but the
influences on the design of these are so pronounced formicrobioreactors that it
is unavoidable here.
Figure 9.7 zooms in the new subfunctions and adds a few subsystem2
alternatives. The BioS-1 is related to the design of the biological membranes
by utilizing specific biosurface properties of the cells, mainly active mem-
brane biopolymers (e.g., adhesins, surface binding glycoproteins, and hydro-
phobicity properties of the lipid composition of the cell surface). The BioS-2
function is related to the external biochemical means to change the surface
properties of the cells.
Store
ΣBioSΣTS
ΣHuS ΣM&GS
Sterilize vessel
Inoculum of cells
Parameters
Growthmedium
Air
ΣOdOutExperimentalData
Cells
Metabolites
Proteins
esahp gnihsiniFesahp gnitucexEesahp gniraperP
Loading cultureand media in vessel
ΣOdIn
AEnv
stceffEstceffEstceffE Effects
TrP
Sterilizemedia
AdditionalmediaReagentsTitrantsSteamPower
Data acquisitionand processing
Controlling cell environment
Containmentand mixing
of cells
Growing cellsand biosynthesis
ΣSecInHarvest cells and products
ΣSecOutExcess airExc steamHeatSpent mediaSamples
TS-1: Nutrition controlling
TS-2: Containm/mix
TS-3: Environment control:
TS-4: SterilizationBioS-1: Culture media BioS-3: Host cell
MetabolismBioS-2: Membr.transport
BioS-4: Expression recomb protein
Catabolic conversion
Anabolicconversion
Carbon sourceprovider
Nitrogen source provider
Oxygen sourceprovider
Growth factorprovider
Passivediffusion
Mediatedtransport
Vector trans-cription to mRNA
Vector reproduction
Intracellular tran-sport to mRNA
Ribosome trans-lation to mRNA
Supply Transport
Mix Contain
Enable
GrowthRegulation
RemoveReleaseDecont.
BioS-5: Surfacebiophysics
Membranecomponents
Extracellmodifiers
ΣISIS-1: Real-time analysis
IS-2: In-line analysis
IS-3: In-process analysis
IS-4: Model calculation
TS-5: Surface system
TS-6: Parallel proc.
Figure 9.8 A zoom-in Hubka–Eder map of a microbioreactor system.
NOVEL BIOREACTOR DESIGNS 181
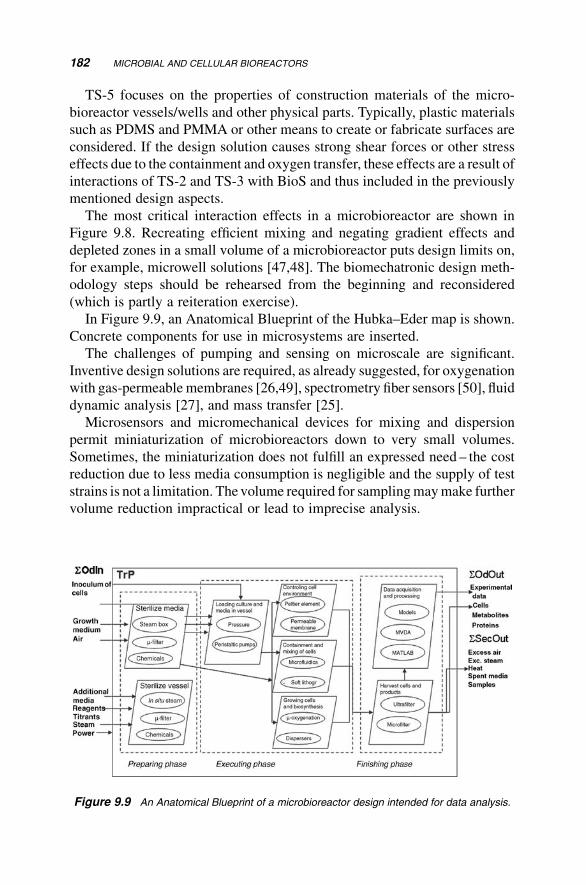
TS-5 focuses on the properties of construction materials of the micro-
bioreactor vessels/wells and other physical parts. Typically, plastic materials
such as PDMS and PMMA or other means to create or fabricate surfaces are
considered. If the design solution causes strong shear forces or other stress
effects due to the containment and oxygen transfer, these effects are a result of
interactions of TS-2 and TS-3 with BioS and thus included in the previously
mentioned design aspects.
The most critical interaction effects in a microbioreactor are shown in
Figure 9.8. Recreating efficient mixing and negating gradient effects and
depleted zones in a small volume of a microbioreactor puts design limits on,
for example, microwell solutions [47,48]. The biomechatronic design meth-
odology steps should be rehearsed from the beginning and reconsidered
(which is partly a reiteration exercise).
In Figure 9.9, an Anatomical Blueprint of the Hubka–Eder map is shown.
Concrete components for use in microsystems are inserted.
The challenges of pumping and sensing on microscale are significant.
Inventive design solutions are required, as already suggested, for oxygenation
with gas-permeablemembranes [26,49], spectrometry fiber sensors [50], fluid
dynamic analysis [27], and mass transfer [25].
Microsensors and micromechanical devices for mixing and dispersion
permit miniaturization of microbioreactors down to very small volumes.
Sometimes, the miniaturization does not fulfill an expressed need – the cost
reduction due to less media consumption is negligible and the supply of test
strains is not a limitation. The volume required for samplingmaymake further
volume reduction impractical or lead to imprecise analysis.
Figure 9.9 An Anatomical Blueprint of a microbioreactor design intended for data analysis.
182 MICROBIAL AND CELLULAR BIOREACTORS
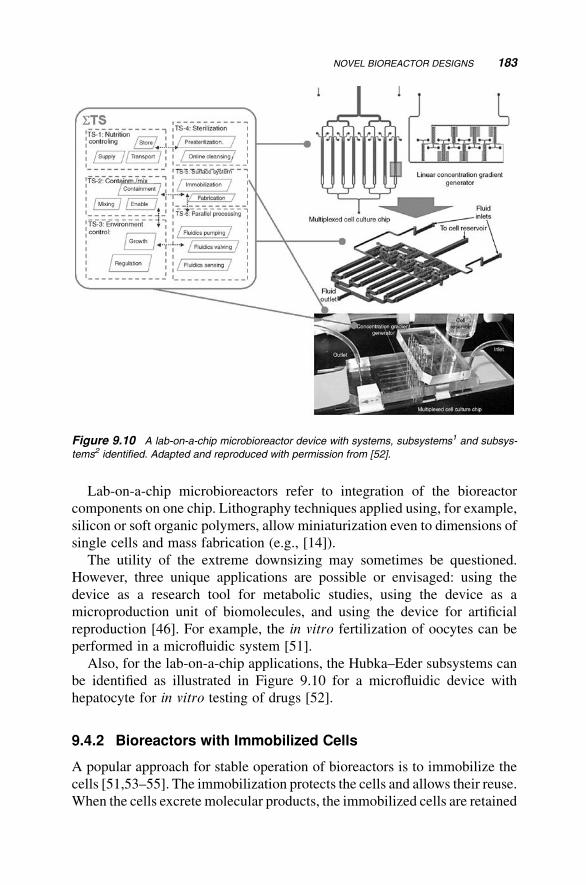
Lab-on-a-chip microbioreactors refer to integration of the bioreactor
components on one chip. Lithography techniques applied using, for example,
silicon or soft organic polymers, allow miniaturization even to dimensions of
single cells and mass fabrication (e.g., [14]).
The utility of the extreme downsizing may sometimes be questioned.
However, three unique applications are possible or envisaged: using the
device as a research tool for metabolic studies, using the device as a
microproduction unit of biomolecules, and using the device for artificial
reproduction [46]. For example, the in vitro fertilization of oocytes can be
performed in a microfluidic system [51].
Also, for the lab-on-a-chip applications, the Hubka–Eder subsystems can
be identified as illustrated in Figure 9.10 for a microfluidic device with
hepatocyte for in vitro testing of drugs [52].
9.4.2 Bioreactors with Immobilized Cells
A popular approach for stable operation of bioreactors is to immobilize the
cells [51,53–55]. The immobilization protects the cells and allows their reuse.
When the cells excrete molecular products, the immobilized cells are retained
Figure 9.10 A lab-on-a-chip microbioreactor device with systems, subsystems1 and subsys-
tems2 identified. Adapted and reproduced with permission from [52].
NOVEL BIOREACTOR DESIGNS 183
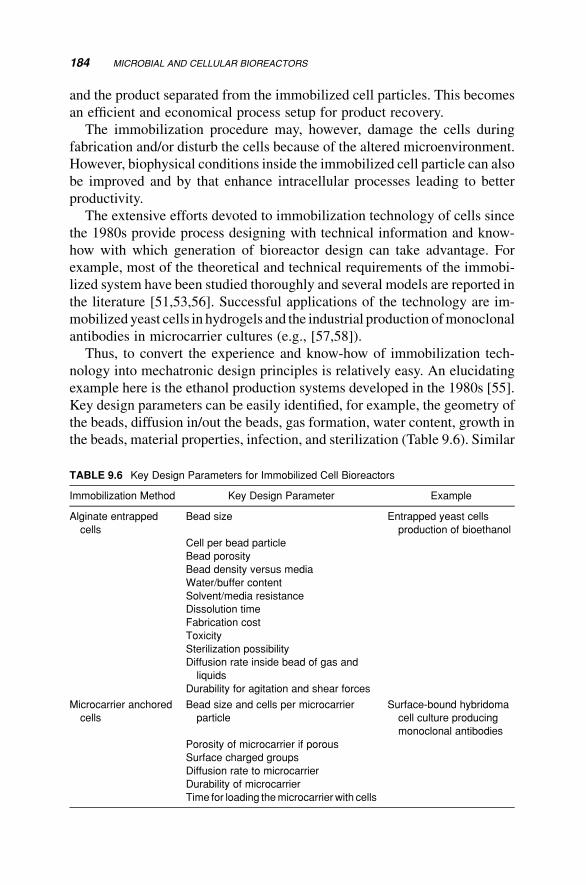
and the product separated from the immobilized cell particles. This becomes
an efficient and economical process setup for product recovery.
The immobilization procedure may, however, damage the cells during
fabrication and/or disturb the cells because of the altered microenvironment.
However, biophysical conditions inside the immobilized cell particle can also
be improved and by that enhance intracellular processes leading to better
productivity.
The extensive efforts devoted to immobilization technology of cells since
the 1980s provide process designing with technical information and know-
how with which generation of bioreactor design can take advantage. For
example, most of the theoretical and technical requirements of the immobi-
lized system have been studied thoroughly and several models are reported in
the literature [51,53,56]. Successful applications of the technology are im-
mobilized yeast cells in hydrogels and the industrial production ofmonoclonal
antibodies in microcarrier cultures (e.g., [57,58]).
Thus, to convert the experience and know-how of immobilization tech-
nology into mechatronic design principles is relatively easy. An elucidating
example here is the ethanol production systems developed in the 1980s [55].
Key design parameters can be easily identified, for example, the geometry of
the beads, diffusion in/out the beads, gas formation, water content, growth in
the beads, material properties, infection, and sterilization (Table 9.6). Similar
TABLE 9.6 Key Design Parameters for Immobilized Cell Bioreactors
Immobilization Method Key Design Parameter Example
Alginate entrapped
cells
Bead size Entrapped yeast cells
production of bioethanol
Cell per bead particle
Bead porosity
Bead density versus media
Water/buffer content
Solvent/media resistance
Dissolution time
Fabrication cost
Toxicity
Sterilization possibility
Diffusion rate inside bead of gas and
liquids
Durability for agitation and shear forces
Microcarrier anchored
cells
Bead size and cells per microcarrier
particle
Surface-bound hybridoma
cell culture producing
monoclonal antibodies
Porosity of microcarrier if porous
Surface charged groups
Diffusion rate to microcarrier
Durability of microcarrier
Time for loading themicrocarrier with cells
184 MICROBIAL AND CELLULAR BIOREACTORS
analysis can be applied on different microcarrier cultures such as hybridomas,
surface growing CHO cells, and other cell types.
9.4.3 Bioreactors for Tissue and Stem Cell Cultures
The recent progress of tissue engineering has been accompanied with
advanced technology for production of tissues in culturing devices. Also,
for these applications the bioreactor concept is exploited. The main reason is,
of course, that it is easy to reuse much of the experience of microbial and cell
culture reactors for chemicals and biopharmaceutical production onto
tissue cultivation. Aspects of oxygen transfer, mixing, containment, and
barriers for infection as well as the engineering mathematical theory are
applicable with little adaptation [2]. Tissue culture applications almost
always presuppose a three-dimensional microstructure of the tissue. This is
a striking difference from other bioreactors. Typical examples are cartilage
cells, hepatocytes, and neural cells, while erythrocytes and other blood cells
can be cultured in suspensions. When bioreactors are used for stem cells,
additional requirements must be considered, such as phenotype stability and
use of cocultures [59].Conceptual design issues for tissue reactor devices have
been discussed mainly from medical viewpoints but are still most rele-
vant [1,60]. The static three-dimensional cultures in tissues generate partly
other bioreactor concepts. For example, perfusion through membranes and
hollow-fibers are useful configurations for tissue systems [4,61]. The perfu-
sion is a transport process that is close to mass transfer of soluble nutrients,
metabolites, and stimulating factors across other physical barriers than in a
stirred suspension culture. The combination with scaffolds similar to immo-
bilization structures as mentioned above [62] is a key issue in the tissue
bioreactor design.
If the tissue cells are to be recovered, the procedures and cost and reuse
aspects change the boundary conditions of the design alternatives.
Manufacture of stem cells is covered in a separate chapter of this book
(Chapter 11). Since bioreactor engineering is indeed a central operation in
stem cell processes, the technical design requirements wementioned herewill
be further analyzed in the next chapter. Also, application of PAT and QbD
methodology may play a key role in unifying the many aspects of modeling,
analytics, and regulatory concerns [63]. Chapter 13 will highlight these
aspects further.
Stem cell culturing is today per se a wide area covering very diverse cell
types and culturing procedures [3,30]. Thus, bioreactors should be designed
according to the special conditions of the purpose of the stem cell cultures. A
variety of stem cell applications described in the literature span from
NOVEL BIOREACTOR DESIGNS 185
hematopoietic stem cells in suspension cultures to advanced progenitor
expansion systems in tissue-like bioreactor constructs [16].
The analytical instrumentation necessary for monitoring stem cell expan-
sion and differentiation in the bioreactor must have the capacity to capture
information about the histology, biomarker expression, andmorphology of the
cells [64,65].
9.4.4 Bioreactors for Plant Cell Cultures
Not yet so much used in industry but for many years in academic research
pursued actively are bioreactions with plant cell cultures. The plant cell
cultures are derived from callus preparations of the plant, then grown
in suspensions or aggregates, and are able to express unique compounds,
either from the secondary metabolism routes or, as has lately been done,
by genetically engineered plant cultures [17]. The design of the plant
cell bioreactors is complicated by the high viscosity of the culture, the
accumulation of the product inside the cells, the supply of nutrients
and oxygen, and the sterility requirements [9]. This has resulted in a number
of elaborated bioreactors tailored for plant cell culture conditions [4].
This includes stirred tank bioreactor, pneumatic bioreactors, wave bioreac-
tors, and also microbioreactors. By optimizing the mass transfer of media
and oxygen, these designs have provided functional solutions to very vul-
nerable and in time extended plant cell cultures. Effects on oxygen consump-
tion, aggregate formation, the difficult rheology of the plant cells, shear
sensitivity, and foam and wall effects have been addressed. Using in situ
sensing has been difficult due to limited optical transparency. Solutions with
electronic nose and other noninvasive methods have become new design
solutions [66].
For plant cell cultures, the SBioS are characterized by low growth rate,
substrate uptake rates, and product formation rates. Critical issues are
susceptibility to infections, optimal pH is favorable for many invasive
bacteria, and plant cell cultures. The fouling effects on bioreactor walls and
separation and sensor membranes are other interaction effects caused by plant
cell cultures that restrict the choice of STS alternatives. The anatomic view of
the critical functional steps may be differently analyzed for plant cell
bioreactors. The power consumption for agitation is high, which may lead
to another consideration of the trade-off between cost and agitation
equipment.
Recovery of the plant cell products such as intracellular secondary meta-
bolites or recombinant proteins is more demanding. Although this is a design
issue for the downstreamprocess (seeChapters 8 and 15), there are aspects that
186 MICROBIAL AND CELLULAR BIOREACTORS
can influence the bioreactor design (e.g., the use ofmedia components is easier
to separate).
9.5 CONCLUSIONS
The functional design analysis focuses on a number of critical issues and
attributes for the selection of design alternatives. The outcome of the analysis
may sometimes seem too obvious and brings about the sentiment that the
conclusion of the analysis could have been much easier without the detailed
disentanglement of already established facts.
This would be understandable, but still a wrong conclusion. The purpose of
the detailed functional analysis is to uncover the nonestablished notions.
These are found in those regions of the analysis that have not been devoted to
intensive and challenging research as been the situation with genetic engi-
neering, cell culture technology, and genomics.
Thus, the perhaps tedious analysis of how various technical means such as
heat exchanger and impellers may possibly affect a sophisticated intracellular
pathway analysis in the cell could be easily overlooked. We believe that
several of the designmatrices in this respect are self-explanatory. The outcome
of the comparative analysis of the alternatives and the ranking of themwill risk
of becoming downprioritized at early R&D work.
The systematic cross-connection of the TrP stages and substages with the
acting systems could in the same way cause the feeling of drawing obvious
conclusion in a scholarly fashion, as a self-appreciating art of its own.
The breakdown of the systems into subsystems and smaller parts should be
done by keeping the functions as much as possible and not changing the
technical means too soon. This is sometimes difficult to realize 100%. When
reaching the level of sub-subsystems, we recommend introducing the means
for effectuating the functions.
REFERENCES
1. Martin, I., Smith, T., Wendt, D. (2009) Bioreactor-based roadmap for the
translation of tissue engineering strategies into clinical products. Trend. Bio-
technol. 27, 495–502.
2. P€ortner, R., Nagel-Heyer, S., Goepfert, C., Adamietz, P., Meenen, N.M. (2005)
Bioreactor design for tissue engineering. J. Biosci. Bioeng. 100, 235–245.
3. King, J.A., Miller, W.M. (2007) Bioreactor development for stem cell expansion
and controlled differentiation. Curr. Opin. Chem. Biol. 11, 394–398.
REFERENCES 187
4. Eibl, R., Eibl, D. (2008) Design of bioreactors suitable for plant cell and tissue
cultures. Phytochem. Rev. 7, 593–598.
5. Robinson, T., Nigam, P. (2003) Bioreactor design for protein enrichment
of agricultural residues by solid state fermentationBiochem. Eng. J. 13, 197–203.
6. Atkinson, B., Manituva, F. (1991) Biochemical Engineering and Biotechnology
Handbook, 2nd edition, Stockton Press, New York.
7. Nielsen, J., Villadsen, J. (1994) Bioreaction Engineering Principles, Plenum
Press, New York.
8. Doran, P.M. (1995)Bioprocess Engineering Principles, Academic Press, London.
9. Shuler, M.L., Kargi, F. (2002) Bioprocess Engineering: Basic Concepts, 2nd
edition, Prentice Hall, Englewood Cliffs, NJ.
10. Freshney, R.I. (1992) Animal Cell Cultures: A Practical Approach, IRL Press
and Oxford University Press, Oxford.
11. Freshney R.I. (2005) Culture of Animal Cells, Wiley and Sons, Inc, New Jersey.
12. McNeil, B., Harvey, L.M. (1990) Fermentation: A Practical Approach, IRL
Press and Oxford University Press, Oxford.
13. Funke, M., Buchenauer, A., Schnakenberg, U., Mokwa, W., Diederichs, S.,
Mertens, A., M€uller, C., Kensy, F., B€uchs, J. (2010) Microfluidic biolector,
microfluidic bioprocess control in microtiter plates. Biotechnol. Bioeng. 107,
497–505.
14. Lee, P.J., Hung, P.J., Rao, V.M., Lee, L.P. (2006) Nanoliter scale microbioreactor
array for quantitative cell biology. Biotechnol. Bioeng. 94, 5–14.
15. Singh, V. (1999) Disposable bioreactor for cell culture using wave-induced
agitation. Cytotechnol. 30, 149–158.
16. Schmelzer E., Mutig K., Schrade P., Bachmann S., Gerlach J.C., Zeilinger K.
(2009) Effect of human patient plasma ex vivo treatment on gene expression and
progenitor cell activation of primary human liver cells in multi-compartment 3D
perfusion bioreactors for extra-corporeal liver support. Biotechnol. Bioeng. 103,
817–827.
17. Huang, T.K., McDonald, K.A. (2009) Bioreactor engineering for recombinant
protein production in plant cell suspension cultures. Biochem. Eng. J. 45,
168–184.
18. Revstedt, J., Fuchs, L., Tr€aga�rdh, C. (1998) Large eddy simulations of the
turbulent flow in a stirred reactor Chem. Eng. Sci. 53, 4041–4053.
19. Simmons, M.J.H., Zhu, H., Bujalski, W., Hewitt, C.J., Nienow, A.W. (2007)
Mixing in a model bioreactor using agitators with a high solidity ratio and deep
blades. Chem. Eng. Res. Design 85, 551–559.
20. Rokem, J.S., Eliasson Lantz, A., Nielsen J. (2007) Systems biology of antibiotics
production by microorganisms. Nat. Prod. Rep. 24, 1262–1287.
21. Tyo, K.E., Alper, H.S., Stephanopoulos, G.N. (2007) Expanding the
metabolic engineering toolbox:more options to engineer cells.TrendBiotechnol.
25, 133.
188 MICROBIAL AND CELLULAR BIOREACTORS
22. Stephanopoulos, G.N., Aristidou, A.A., Nielsen, J. (1998) Metabolic Engineer-
ing: Principles and Methodologies, Academic Press, San Diego, USA.
23. Hutmacher, D.W., Singh, H. (2008) Computational fluid dynamics for improved
bioreactor design and 3D culture. Trend Biotechnol. 26, 166–172.
24. Bracewell, D., Gernaey, K.V., Glassey, J., Hass, V.C., Heinzle, E., Mandenius, C.
F., Olsson, I.M., Racher, A., Staby, A., Titchener-Hooker, N. (2010) Report and
recommendation of a workshop on education and training for measurement,
monitoring, modelling and control (M3C) in biochemical engineering. Biote-
chnol. J. 5, 359–367.
25. Buchenauer, A., Hofmann, M.C., Funke, M., B€uchs, J., Mokwa,W., Schnaken-
berg, U. (2009) Micro-bioreactors for fed-batch fermentations with integrated
online monitoring and microfluidic devices. Biosens. Bioelectron. 24,
1411–1416.
26. Lye, G.J., Ayazi-Shamlou, P., Baganz, F., Dalby, P.A., Woodley, J.M. (2003)
Accelerated design of bioconversion processes using automated microscale
processing techniques. Trend. Biotechnol. 21, 29–37.
27. Lamping, S.R., Zhang, H., Allen, B., Ayazi Shamlou, P. (2003) Design of
prototype miniature bioreactor for high throughput automated bioprocessing.
Chem. Eng. Sci. 58, 747–758.
28. Ohyabu, Y., Kida, N., Kojima, H., Taguchi, T., Tanaka, J., Uemura, T. (2006)
Cartilaginous tissue formation from bonemarrow cells using rotating wall vessel
(RWV) bioreactor. Biotechnol. Bioeng. 95, 1003–1008.
29. Duke, J., Daane, E., Arizpe, J., Montufar-Solis, D. (1996) Chondrogenesis in
aggregates of embryonic limb cells grown in a rotating wall vessel. Adv. Space
Res. 17, 289–293.
30. Jensen, J., Hyllner, J., Bj€orquist, P. (2009) Human embryonic stem cell tech-
nologies and drug discovery J. Cell. Physiol. 219, 513–519.
31. Marks, D.M. (2003) Equipment design considerations for large scale cell culture.
Cytotechnology 42, 21–33.
32. Ulrich, K.T., Eppinger, S.D. (2007) Product Design and Development. 3rd
edition, McGraw-Hill, New York.
33. Mandenius, C.F., Bj€orkman, M. (2010) Design principles for biotechnology
product development. Trend. Biotechnol. 28, 230–236.
34. Derel€ov, M., Detterfelt, J., Bj€orkman, M., Mandenius, C.F. (2008) Engineering
design methodology for bio-mechatronic products. Biotechnol. Prog. 24,
232–244.
35. Barrett, C.L., Kim, T.Y., Kim, H.U., Palsson, B.Ø., Lee, S.Y. (2006) Systems
biology as a foundation for genome-scale synthetic biology. Curr. Opin. Bio-
technol. 17, 488–492.
36. Heijnen, J.J., van Dijken, J.P. (1992) In search of a thermodynamic description of
biomass yields for the chemotrophic growth of microorganisms. Biotechnol.
Bioeng. 39, 833–858.
REFERENCES 189
37. van Heijden, R.T.J.M., Heijnen, J.J., et al. (1994) Linear constraint relations in
biochemical reaction systems I. Classification of the calculability and the
balanceability of conversion rate. Biotechnol. Bioeng. 43, 3–10.
38. Mandenius, C.F., Brundin, A. (2008) Bioprocess optimization using design-of-
experiments methodology (DoE). Biotechnol. Prog. 24, 1191–1203.
39. Haack, M.B., Olsson, L., Hansen, K., Eliasson, Lantz, A. (2006) Change in
hyphal morphology of Aspergillus oryzae during fed-batch cultivation. Appl.
Microbiol. Biotechnol. 70, 482–487.
40. Mosbach, K. (ed.) (1988) Immobilized Enzymes and Cells: Methods in
Enzymology, Academic Press, New York., pp. 135–137.
41. Mandenius, C.F. (2004) Recent developments in the monitoring, modeling and
control of biological production systems. Bioproc. Biosyst. Eng. 26, 347–351.
42. Warth, B., Rajkai, G., Mandenius, C.F. (2010) Evaluation of software sensors for
on-line estimation of culture conditions in an Escherichia coli cultivation
expressing a recombinant protein. J. Biotechnol. 147, 37–45.
43. United States Food and Drug Administration, (FDA). (2004) Guidance for
Industry: PAT a Framework for Innovative Pharmaceutical Manufacturing and
Quality Assurance. Available at http://www.fda.gov/cvm/guidance/published.
html.
44. Mandenius, C.F., Graumann, K., Schultz, T.W., Premsteller, A., Olsson, I.M.,
Periot, E., Clemens, C., Welin, M. (2009) Quality-by-design (QbD) for biotech-
nology-related phamaceuticals. Biotechnol. J. 4, 600–609.
45. Sch€apper, D., Alam, M.N., Szita, N., Eliasson, Lantz A., Gernaey, K.V. (2009)
Application of microbioreactors in fermentation process development: a review.
Anal. Bioanal. Chem. 395, 679–695.
46. Le Gac, S., van den Berg, A. (2010) Single cell as experimentation units in
lab-on-a-chip devices. Trend Biotechnol. 28, 55–62.
47. Kumar, S., Wittmann, C., Heinzle, E. (2004) Minibioreactors. Biotechnol. Lett.
26, 1–10.
48. Kensy, F., Engelbrecht, C., B€uchs, J. (2009) Scale-up from microtiter plate
to laboratory fermenter: evaluation by on-line monitoring techniques of growth
and protein expression inEscherichia coli andHansenula polymorpha fermenta-
tions. Microb. Cell Fact. 8, 68, 1–15.
49. Zanzotto, A., Szita, N., Boccazzi, P., Lessard, P., Sinskey, A.J., Klavs, F. Jensen,
K.F. (2004) Membrane-aerated microbioreactor for high-throughput bioproces-
sing. Biotechnol. Bioeng. 87, 243–254.
50. Ferstl, W., Klahn, T., Schweikert, W., Billeb, G., Schwarzer, M., Loebbecke, S.
(2007) Inline analysis in microreaction technology: a suitable tool for process
screening and optimization. Chem. Eng. Technol. 30, 370–378.
51. Sadani, Z., Wacogne, B., Pieralli, C., Roux, C., Gharbi, T. (2005) Microsystems
and microfluidics devices for single cell oocyte transportation and trapping:
towards the automation of in vitro fertilization. Sens. Acuat. A Phys. 121,
364–372.
190 MICROBIAL AND CELLULAR BIOREACTORS
52. Toh, Y.C., Lim, T.C., Tai, D., Xiao, G., van Noort, D., Yu, H. (2009)
A microfluidic 3D hepatocyte chip for drug toxicity testing. Lab Chip 9,
2026–2035.
53. Qiu, Q.Q., Ducheyne, P., Ayyaswamy, P.S. (1999) Fabrication, characterization
and evaluation of bioceramic hollow microspheres used as microcarriers
for 3-D bone tissue formation in rotating bioreactors. Biomaterials 20,
989–1001.
54. Moo-Young, M. (ed.) (1988) Bioreactor Immobilized Enzymes and Cells:
Fundamentals and Applications, Elsevier Applied Science, London.
55. Lother, A.M., Oetterer, M. (1995) Microbial cell immobilization applied to
alcohol production: a review. Rev. Microbiol. 26, 151–159.
56. Goswami, J., Sinskey, A.J., Steller, H., Stephanopoulos, G.N., Wang, D.I. (1999)
Apoptosis in batch cultures of Chinese hamster ovary cells. Biotechnol. Bioeng.
62, 632–640.
57. Hu, J.C., Athanasiou, K.A. (2005) Low-density cultures of bovine chondrocytes:
effects of scaffold material and culture system. Biomaterials 26, 2001–2012.
58. Nettles, D.L., Elder, S.H., Gilbert, J.A. (2002) Potential use of chitosan as a cell
scaffold material for cartilage tissue engineering. Tissue Eng. 8, 1009–1016.
59. Godara, P., McFarland, C.D., Nordon, R.E. (2008) Design of bioreactors for
mesenchymal stem cell tissue engineering. J. Chem. Technol. Biotechnol. 83,
408–420.
60. Minuth, W.W., Strehl, R., Schumacher, K. (2004) Tissue factory: conceptual
design of amodular system for the in vitro generation of functional tissues.Tissue
Eng. 10, 285–294.
61. Simon, J. (2008) The status of membrane bioreactor technology. Trend Bio-
technol. 26, 109–116.
62. Khademhosseini, A., Langer, R., Borenstein, J., Vacanti, J.P. (2006) Microscale
technologies for tissue engineering and biology. Proc. Nat. Acad. Sci. USA 103,
2480–2487.
63. Mandenius, C.F., Bj€orkman, M. (2009) Process analytical technology (PAT) and
quality-by-design (QbD) aspects on stem cell manufacture.Eur. Pharm. Rev. 14,
32–37.
64. Kirouac, D.C., Zandstra, P.W. (2008) The systematic production of cells for cell
therapies. Stem Cell 3, 369–381.
65. Thomas, R.J., Anderson, D., Chandra, A., Smith, N.M., Young, L.E., Williams,
D., Denning, C. (2009) Automated, scalable culture of human embryonic stem
cells in feeder-free conditions. Biotechnol. Bioeng. 102, 1636–1644.
66. Komaraiah, P., Navratil,M., Carlsson,M., Jeffers, P., Brodelius,M., Brodelius, P.
E., Kieran, P.M., Mandenius, C.F. (2004) Growth behaviour in plant cell cultures
based on emissions detected by a multisensor array. Biotechnol. Prog. 20,
1245–1250.
REFERENCES 191

10Chromatographic
Protein Purification
This chapter discusses the design of chromatographic purification systems for
proteins from the laboratory to the production scale. First, a background and the
present state of the art of existing protein purification systems, including the
basic chromatographymethodology, are given (Section 10.1). Then, user needs
of protein purification systems are analyzed and specified (Section 10.2). On
the basis of these needs and specifications, biomechatronic design methodo-
logy is applied (Section 10.3) and exemplified for two cases, the design of (1) a
large-scale system for manufacturing a specified protein (Section 10.4) and
(2) a micropurification system using a lab-on-a-chip design (Section 10.5).
10.1 BACKGROUND OF CHROMATOGRAPHICPROTEIN PURIFICATION
As an alternative to other unit operations for protein separation, such as
membrane filtration or centrifugation, chromatographic separations are quite
often the preferred choice of method [1].
The principle, to use a stationary phase that is able to selectively adsorb or
partition the components in amobile phase resulting in their separation, can be
applied in a variety of ways [2,3]. Different stationary phases based on ligands
Biomechatronic Design in Biotechnology: A Methodology for Development ofBiotechnological Products, First Edition. Carl-Fredrik Mandenius and Mats Bjorkman.� 2011 John Wiley & Sons, Inc. Published 2011 by John Wiley & Sons, Inc.
193
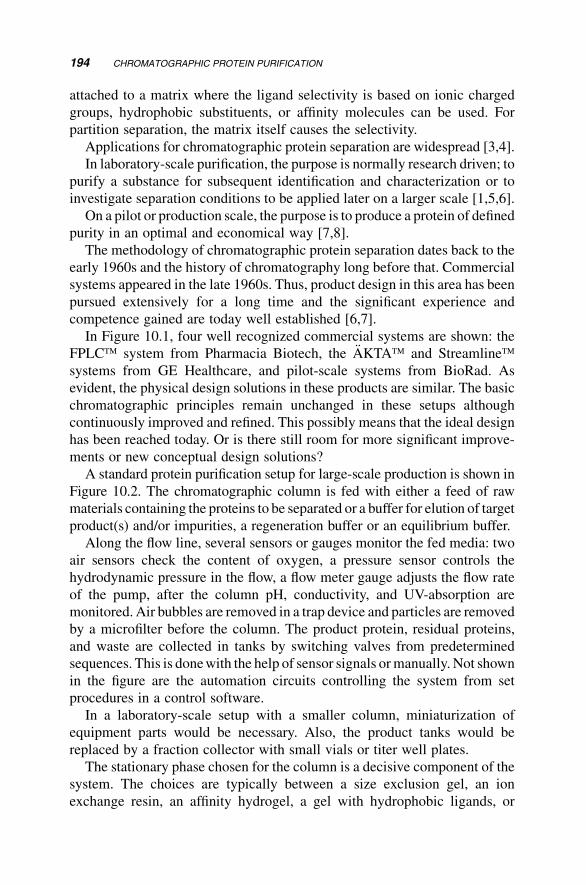
attached to a matrix where the ligand selectivity is based on ionic charged
groups, hydrophobic substituents, or affinity molecules can be used. For
partition separation, the matrix itself causes the selectivity.
Applications for chromatographic protein separation are widespread [3,4].
In laboratory-scale purification, the purpose is normally research driven; to
purify a substance for subsequent identification and characterization or to
investigate separation conditions to be applied later on a larger scale [1,5,6].
On a pilot or production scale, the purpose is to produce a protein of defined
purity in an optimal and economical way [7,8].
The methodology of chromatographic protein separation dates back to the
early 1960s and the history of chromatography long before that. Commercial
systems appeared in the late 1960s. Thus, product design in this area has been
pursued extensively for a long time and the significant experience and
competence gained are today well established [6,7].
In Figure 10.1, four well recognized commercial systems are shown: the
FPLC� system from Pharmacia Biotech, the €AKTA� and Streamline�systems from GE Healthcare, and pilot-scale systems from BioRad. As
evident, the physical design solutions in these products are similar. The basic
chromatographic principles remain unchanged in these setups although
continuously improved and refined. This possibly means that the ideal design
has been reached today. Or is there still room for more significant improve-
ments or new conceptual design solutions?
A standard protein purification setup for large-scale production is shown in
Figure 10.2. The chromatographic column is fed with either a feed of raw
materials containing the proteins to be separated or a buffer for elution of target
product(s) and/or impurities, a regeneration buffer or an equilibrium buffer.
Along the flow line, several sensors or gauges monitor the fed media: two
air sensors check the content of oxygen, a pressure sensor controls the
hydrodynamic pressure in the flow, a flow meter gauge adjusts the flow rate
of the pump, after the column pH, conductivity, and UV-absorption are
monitored. Air bubbles are removed in a trap device and particles are removed
by a microfilter before the column. The product protein, residual proteins,
and waste are collected in tanks by switching valves from predetermined
sequences. This is donewith the help of sensor signals ormanually. Not shown
in the figure are the automation circuits controlling the system from set
procedures in a control software.
In a laboratory-scale setup with a smaller column, miniaturization of
equipment parts would be necessary. Also, the product tanks would be
replaced by a fraction collector with small vials or titer well plates.
The stationary phase chosen for the column is a decisive component of the
system. The choices are typically between a size exclusion gel, an ion
exchange resin, an affinity hydrogel, a gel with hydrophobic ligands, or
194 CHROMATOGRAPHIC PROTEIN PURIFICATION
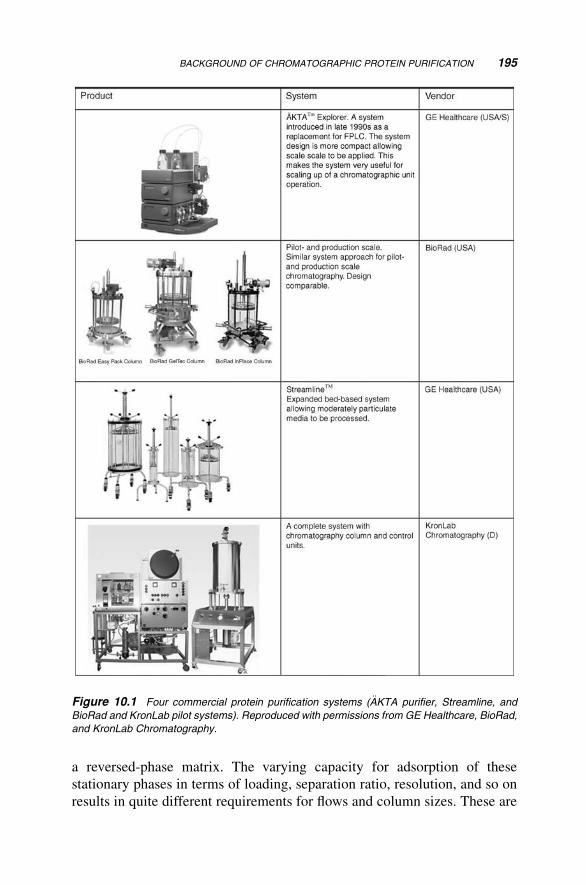
a reversed-phase matrix. The varying capacity for adsorption of these
stationary phases in terms of loading, separation ratio, resolution, and so on
results in quite different requirements for flows and column sizes. These are
Figure 10.1 Four commercial protein purification systems ( €AKTA purifier, Streamline, and
BioRad and KronLab pilot systems). Reproduced with permissions from GE Healthcare, BioRad,
and KronLab Chromatography.
BACKGROUND OF CHROMATOGRAPHIC PROTEIN PURIFICATION 195
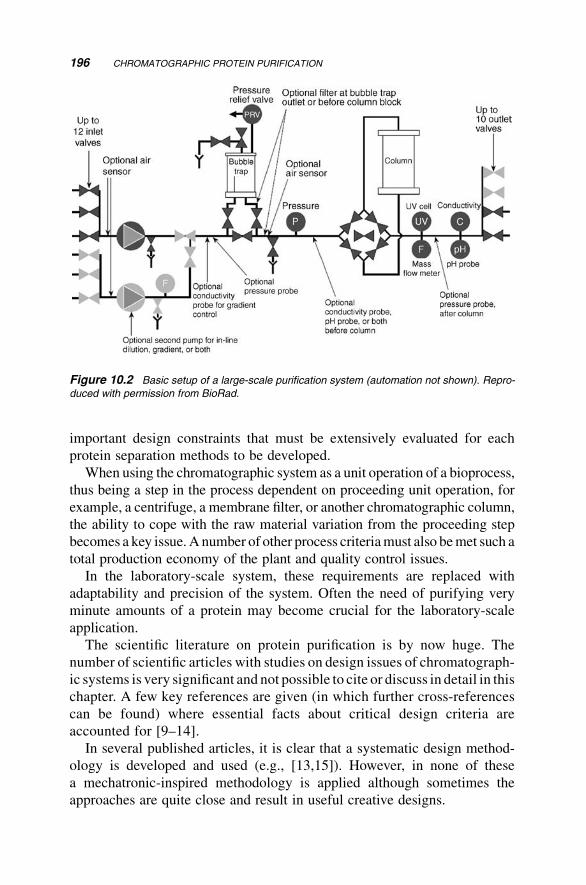
important design constraints that must be extensively evaluated for each
protein separation methods to be developed.
When using the chromatographic system as a unit operation of a bioprocess,
thus being a step in the process dependent on proceeding unit operation, for
example, a centrifuge, a membrane filter, or another chromatographic column,
the ability to cope with the raw material variation from the proceeding step
becomes a key issue.A number of other process criteriamust also bemet such a
total production economy of the plant and quality control issues.
In the laboratory-scale system, these requirements are replaced with
adaptability and precision of the system. Often the need of purifying very
minute amounts of a protein may become crucial for the laboratory-scale
application.
The scientific literature on protein purification is by now huge. The
number of scientific articles with studies on design issues of chromatograph-
ic systems is very significant and not possible to cite or discuss in detail in this
chapter. A few key references are given (in which further cross-references
can be found) where essential facts about critical design criteria are
accounted for [9–14].
In several published articles, it is clear that a systematic design method-
ology is developed and used (e.g., [13,15]). However, in none of these
a mechatronic-inspired methodology is applied although sometimes the
approaches are quite close and result in useful creative designs.
Figure 10.2 Basic setup of a large-scale purification system (automation not shown). Repro-
duced with permission from BioRad.
196 CHROMATOGRAPHIC PROTEIN PURIFICATION
10.2 SPECIFICATION OF NEEDS FOR PROTEINPURIFICATION SYSTEMS
From the account above, it may appear that needs for protein purification
systems are too dispersed for setting up a general specification.However, also
at this stage of designing it is possible and useful to provide guidelines for
structuring the analysis of needs. Since the theory of chromatography is
thoroughly treated in terms of engineering parameters, these can be easily
listed and ranges for their target values established [16–20, 21]. Desirable
levels of loadingcapacityof the column, throughput, separation factors, plate
number of column, volume of column including width and length, and flow
rates can be defined for the separation method [22–26]. Several of these
parameters are interdependent and can be adapted from the basic textbooks
on chromatography [27–29]. Thus, optimization of the method comes as a
development stage in the setup that the design should anticipate.
The needs imposed on the separation gel itself should also be included in the
specification table. For affinity gels, ranges of affinity parameters (e.g., affinity
constantsKa andKd and the affinity rate constants kon and koff) can be defined.
The loading capacity of the gel (e.g., gram protein per gram coupled gel) can
be defined, for example, using literature values.
For hydrophobic interaction chromatography (HIC) gels and ion exchange
resins similar gel capacity parameter could be given.
More difficult parameters to define are rheological properties, robust-
ness to variation of the raw materials, nonspecific adsorption effects, and
longevity of the column and the gel. These parameters are highly
dependent on the variation of the materials and must necessarily be tested
in experiments.
Needs that are less quantifiable such as convenience of operation, durability
of equipment, which online sensors/meters should be included, which control
loops should be established, what level of automation should be integrated are
set by yes/no or with rough estimates (high/medium/low).
For example, sterility barriers are in pharmaceutical production regulated
by authorities and are therefore obviously necessary design criteria. Estab-
lished sterility tests can be used in the specification. GMP rules according to
existing guidelines can be included.
Construction materials should be specified thereby counteracting potential
effects from aggressive raw materials and elution, regeneration, and equil-
ibration buffers. These media may have detrimental effects on materials used
for columns, valves, and pumps. The media composition is to large extent
known (acidic and alkaline solutions and solvents). Thus, stainless steel
columns may be necessary and Teflon valves and tubing required to satisfy
robustness and longevity needs.
SPECIFICATION OF NEEDS FOR PROTEIN PURIFICATION SYSTEMS 197
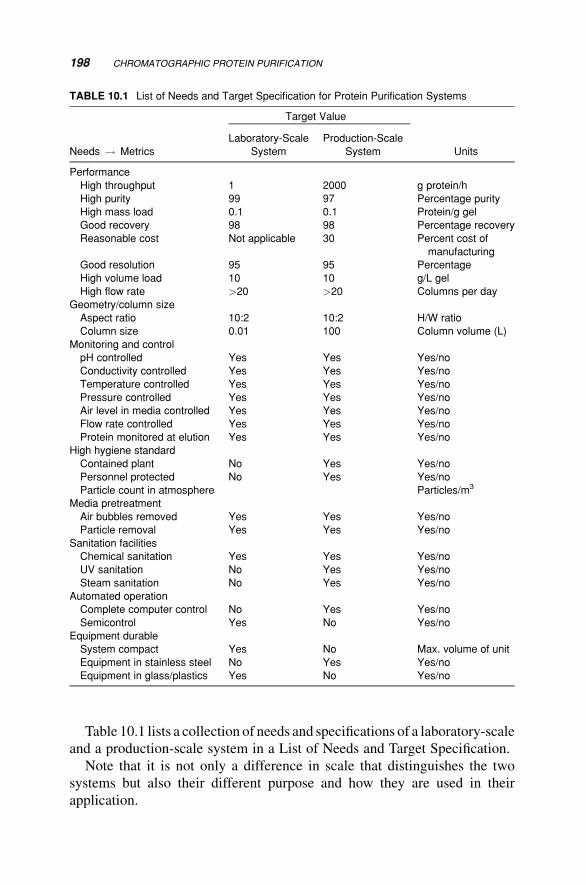
Table 10.1 lists a collection of needs and specifications of a laboratory-scale
and a production-scale system in a List of Needs and Target Specification.
Note that it is not only a difference in scale that distinguishes the two
systems but also their different purpose and how they are used in their
application.
TABLE 10.1 List of Needs and Target Specification for Protein Purification Systems
Target Value
Needs ! Metrics
Laboratory-Scale
System
Production-Scale
System Units
Performance
High throughput 1 2000 g protein/h
High purity 99 97 Percentage purity
High mass load 0.1 0.1 Protein/g gel
Good recovery 98 98 Percentage recovery
Reasonable cost Not applicable 30 Percent cost of
manufacturing
Good resolution 95 95 Percentage
High volume load 10 10 g/L gel
High flow rate >20 >20 Columns per day
Geometry/column size
Aspect ratio 10:2 10:2 H/W ratio
Column size 0.01 100 Column volume (L)
Monitoring and control
pH controlled Yes Yes Yes/no
Conductivity controlled Yes Yes Yes/no
Temperature controlled Yes Yes Yes/no
Pressure controlled Yes Yes Yes/no
Air level in media controlled Yes Yes Yes/no
Flow rate controlled Yes Yes Yes/no
Protein monitored at elution Yes Yes Yes/no
High hygiene standard
Contained plant No Yes Yes/no
Personnel protected No Yes Yes/no
Particle count in atmosphere Particles/m3
Media pretreatment
Air bubbles removed Yes Yes Yes/no
Particle removal Yes Yes Yes/no
Sanitation facilities
Chemical sanitation Yes Yes Yes/no
UV sanitation No Yes Yes/no
Steam sanitation No Yes Yes/no
Automated operation
Complete computer control No Yes Yes/no
Semicontrol Yes No Yes/no
Equipment durable
System compact Yes No Max. volume of unit
Equipment in stainless steel No Yes Yes/no
Equipment in glass/plastics Yes No Yes/no
198 CHROMATOGRAPHIC PROTEIN PURIFICATION
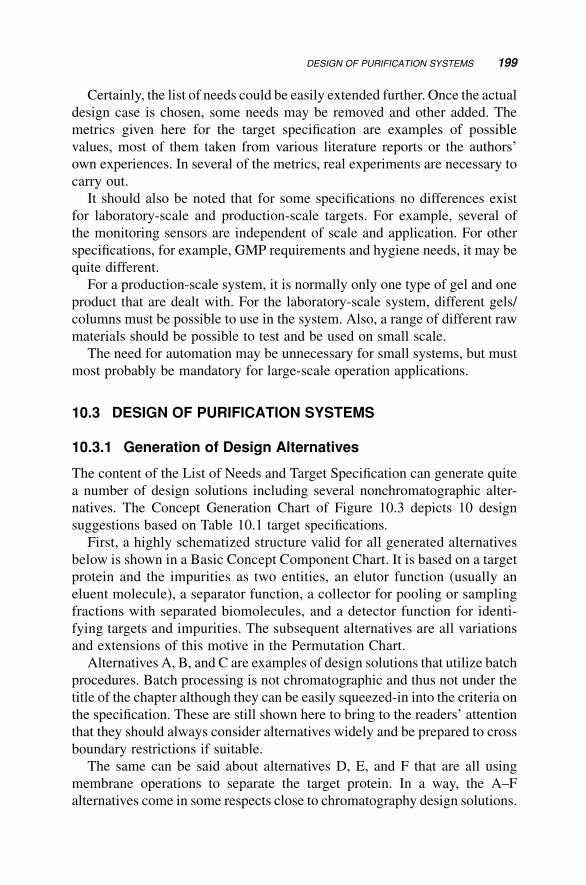
Certainly, the list of needs could be easily extended further. Once the actual
design case is chosen, some needs may be removed and other added. The
metrics given here for the target specification are examples of possible
values, most of them taken from various literature reports or the authors’
own experiences. In several of the metrics, real experiments are necessary to
carry out.
It should also be noted that for some specifications no differences exist
for laboratory-scale and production-scale targets. For example, several of
the monitoring sensors are independent of scale and application. For other
specifications, for example, GMP requirements and hygiene needs, it may be
quite different.
For a production-scale system, it is normally only one type of gel and one
product that are dealt with. For the laboratory-scale system, different gels/
columns must be possible to use in the system. Also, a range of different raw
materials should be possible to test and be used on small scale.
The need for automation may be unnecessary for small systems, but must
most probably be mandatory for large-scale operation applications.
10.3 DESIGN OF PURIFICATION SYSTEMS
10.3.1 Generation of Design Alternatives
The content of the List of Needs and Target Specification can generate quite
a number of design solutions including several nonchromatographic alter-
natives. The Concept Generation Chart of Figure 10.3 depicts 10 design
suggestions based on Table 10.1 target specifications.
First, a highly schematized structure valid for all generated alternatives
below is shown in a Basic Concept Component Chart. It is based on a target
protein and the impurities as two entities, an elutor function (usually an
eluent molecule), a separator function, a collector for pooling or sampling
fractions with separated biomolecules, and a detector function for identi-
fying targets and impurities. The subsequent alternatives are all variations
and extensions of this motive in the Permutation Chart.
Alternatives A, B, and C are examples of design solutions that utilize batch
procedures. Batch processing is not chromatographic and thus not under the
title of the chapter although they can be easily squeezed-in into the criteria on
the specification. These are still shown here to bring to the readers’ attention
that they should always consider alternatives widely and be prepared to cross
boundary restrictions if suitable.
The same can be said about alternatives D, E, and F that are all using
membrane operations to separate the target protein. In a way, the A–F
alternatives come in some respects close to chromatography design solutions.
DESIGN OF PURIFICATION SYSTEMS 199
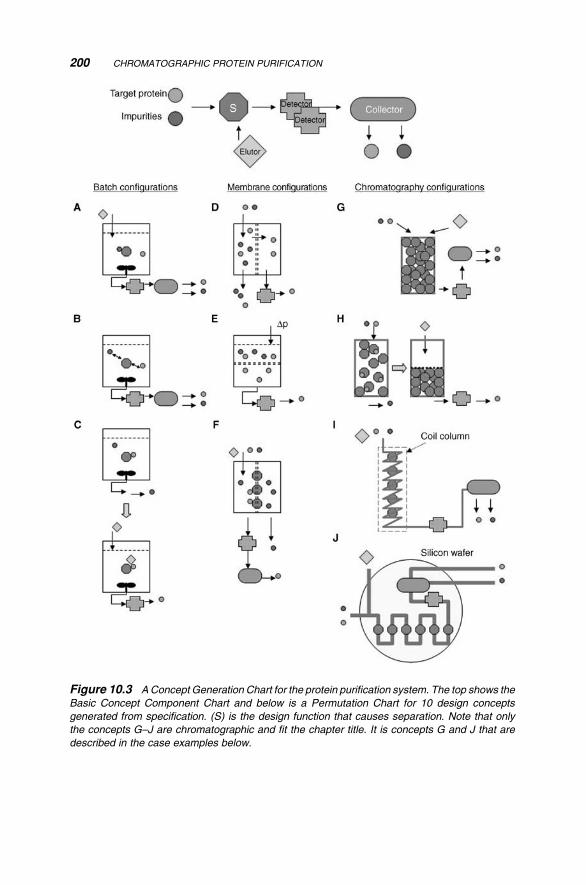
Figure 10.3 AConcept Generation Chart for the protein purification system. The top shows the
Basic Concept Component Chart and below is a Permutation Chart for 10 design concepts
generated from specification. (S) is the design function that causes separation. Note that only
the concepts G–J are chromatographic and fit the chapter title. It is concepts G and J that are
described in the case examples below.
200 CHROMATOGRAPHIC PROTEIN PURIFICATION
Alternative A is a batch reactor where a separator function is immersed into
the medium together with the target protein and impurities. The separator
prefers the target protein while the impurities pass by. The detector checks the
performance and assists the collector to pool the molecules.
Alternative B reverses the preference of the separator, that is, takes up the
impurities and allows the target protein to pass by.
In alternative C, the batch procedure is carried out stepwise. First, the
molecules are adsorbed to the separator. In the second step, the molecules are
selectively separated by additions of eluent(s).
In alternativeD, a selectivemembrane is introduced that can sieve the target
from the impurities. It is set up in a tubular flow column.
Alternative E is the design solution but here a pressure drives the transport
across the selective membrane.
In alternative F, the membrane is reinforced with a separator (e.g., an
antibody ligand) that supports the separation at the membrane surface.
The chromatographic alternatives have all a mobile phase containing the
target protein and impurities and a stationary phase with the separator.
Alternative G is a typical chromatography column and alternative H is an
expanded bed affinity chromatography system framed into this conceptual
view.
In alternative I, the column is a capillary coil filled with a separator
function, either grafted to the column wall or filled in the void of the column.
Alternative J is an attempt to try to realize the systemon a siliconwaferwith
lab-on-a-chip technology. It is consequently a significant miniaturization of
the system that leads to interesting implications.
Additional concept alternatives are no doubt possible. We think that these
10 should bring out the scope of the methodology.
In the following, we will pursue the chromatography inspired design
approach in its entirety.
10.3.2 Screening the Design Alternatives
As in previous chapters of this book, we compare the generated alternatives in
a Concept Screening Matrix (Table 10.2). We have here limited the screening
to those alternatives that involve chromatographic purification and added two
other alternatives (A and D) for comparisons. As selection criteria, the needs
from the List of Needs and Targets Specifications are used. Some of the
selection criteria are difficult to compare. Then “0” scores are given (e.g., the
criteria are excluded).
The screening outcome ranks alternatives G and I highest. Interestingly, the
expanded bed alternative is ranked fourth. And the batch and membrane
alternatives are both inferior to the chromatographic solutions.
DESIGN OF PURIFICATION SYSTEMS 201
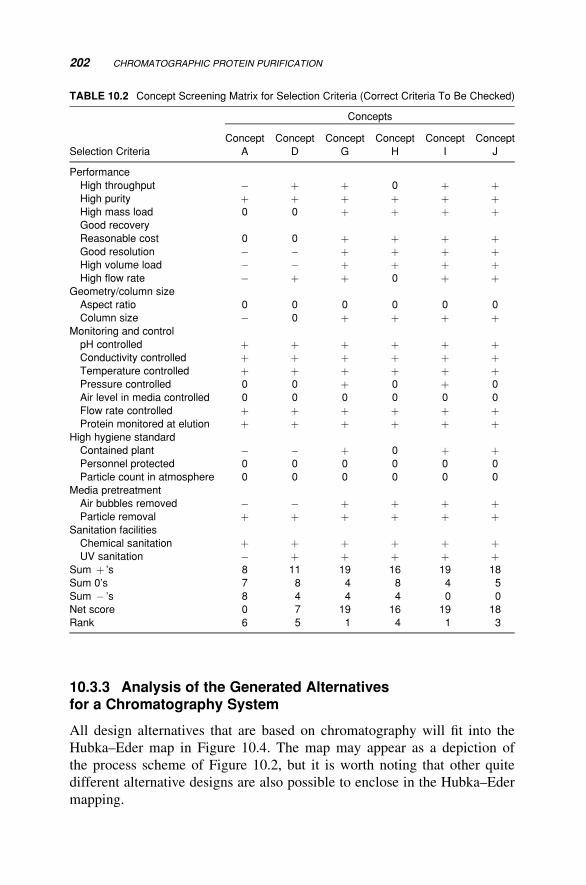
10.3.3 Analysis of the Generated Alternativesfor a Chromatography System
All design alternatives that are based on chromatography will fit into the
Hubka–Eder map in Figure 10.4. The map may appear as a depiction of
the process scheme of Figure 10.2, but it is worth noting that other quite
different alternative designs are also possible to enclose in the Hubka–Eder
mapping.
TABLE 10.2 Concept Screening Matrix for Selection Criteria (Correct Criteria To Be Checked)
Concepts
Selection Criteria
Concept
A
Concept
D
Concept
G
Concept
H
Concept
I
Concept
J
Performance
High throughput � þ þ 0 þ þHigh purity þ þ þ þ þ þHigh mass load 0 0 þ þ þ þGood recovery
Reasonable cost 0 0 þ þ þ þGood resolution � � þ þ þ þHigh volume load � � þ þ þ þHigh flow rate � þ þ 0 þ þ
Geometry/column size
Aspect ratio 0 0 0 0 0 0
Column size � 0 þ þ þ þMonitoring and control
pH controlled þ þ þ þ þ þConductivity controlled þ þ þ þ þ þTemperature controlled þ þ þ þ þ þPressure controlled 0 0 þ 0 þ 0
Air level in media controlled 0 0 0 0 0 0
Flow rate controlled þ þ þ þ þ þProtein monitored at elution þ þ þ þ þ þ
High hygiene standard
Contained plant � � þ 0 þ þPersonnel protected 0 0 0 0 0 0
Particle count in atmosphere 0 0 0 0 0 0
Media pretreatment
Air bubbles removed � � þ þ þ þParticle removal þ þ þ þ þ þ
Sanitation facilities
Chemical sanitation þ þ þ þ þ þUV sanitation � þ þ þ þ þ
Sum þ ’s 8 11 19 16 19 18
Sum 0’s 7 8 4 8 4 5
Sum � ’s 8 4 4 4 0 0
Net score 0 7 19 16 19 18
Rank 6 5 1 4 1 3
202 CHROMATOGRAPHIC PROTEIN PURIFICATION
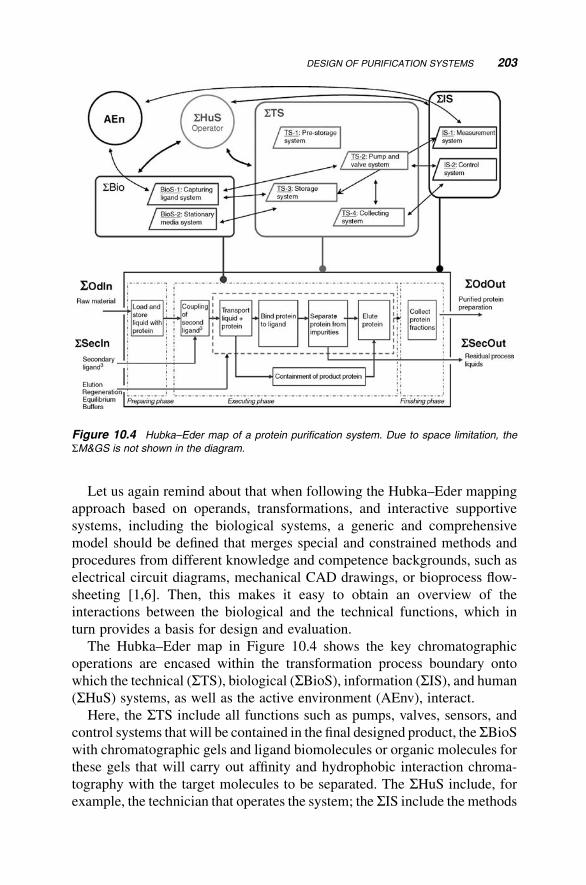
Let us again remind about that when following the Hubka–Eder mapping
approach based on operands, transformations, and interactive supportive
systems, including the biological systems, a generic and comprehensive
model should be defined that merges special and constrained methods and
procedures from different knowledge and competence backgrounds, such as
electrical circuit diagrams, mechanical CAD drawings, or bioprocess flow-
sheeting [1,6]. Then, this makes it easy to obtain an overview of the
interactions between the biological and the technical functions, which in
turn provides a basis for design and evaluation.
The Hubka–Eder map in Figure 10.4 shows the key chromatographic
operations are encased within the transformation process boundary onto
which the technical (STS), biological (SBioS), information (SIS), and human
(SHuS) systems, as well as the active environment (AEnv), interact.
Here, the STS include all functions such as pumps, valves, sensors, and
control systems that will be contained in the final designed product, the SBioSwith chromatographic gels and ligand biomolecules or organic molecules for
these gels that will carry out affinity and hydrophobic interaction chroma-
tography with the target molecules to be separated. The SHuS include, for
example, the technician that operates the system; the SIS include the methods
Figure 10.4 Hubka–Eder map of a protein purification system. Due to space limitation, the
SM&GS is not shown in the diagram.
DESIGN OF PURIFICATION SYSTEMS 203
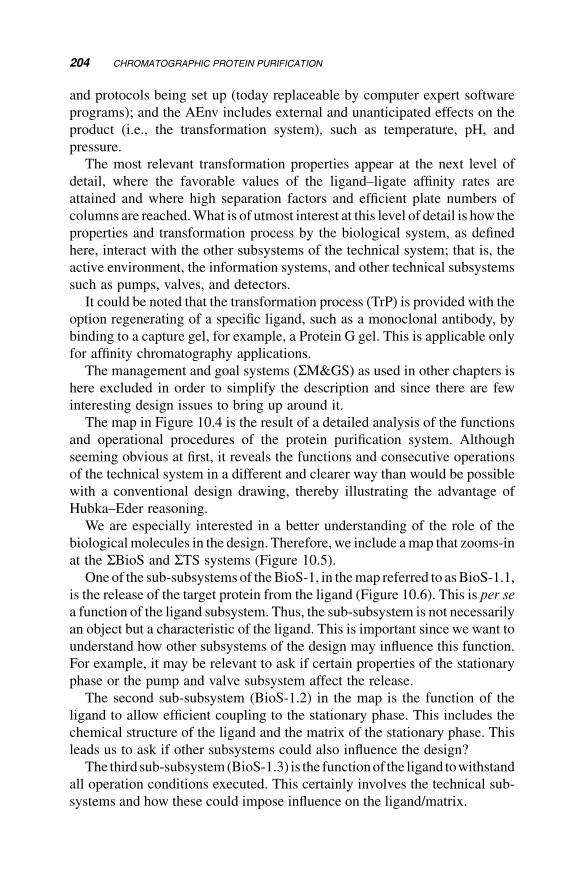
and protocols being set up (today replaceable by computer expert software
programs); and the AEnv includes external and unanticipated effects on the
product (i.e., the transformation system), such as temperature, pH, and
pressure.
The most relevant transformation properties appear at the next level of
detail, where the favorable values of the ligand–ligate affinity rates are
attained and where high separation factors and efficient plate numbers of
columns are reached.What is of utmost interest at this level of detail is how the
properties and transformation process by the biological system, as defined
here, interact with the other subsystems of the technical system; that is, the
active environment, the information systems, and other technical subsystems
such as pumps, valves, and detectors.
It could be noted that the transformation process (TrP) is provided with the
option regenerating of a specific ligand, such as a monoclonal antibody, by
binding to a capture gel, for example, a Protein G gel. This is applicable only
for affinity chromatography applications.
The management and goal systems (SM&GS) as used in other chapters is
here excluded in order to simplify the description and since there are few
interesting design issues to bring up around it.
The map in Figure 10.4 is the result of a detailed analysis of the functions
and operational procedures of the protein purification system. Although
seeming obvious at first, it reveals the functions and consecutive operations
of the technical system in a different and clearer way than would be possible
with a conventional design drawing, thereby illustrating the advantage of
Hubka–Eder reasoning.
We are especially interested in a better understanding of the role of the
biologicalmolecules in the design. Therefore, we include amap that zooms-in
at the SBioS and STS systems (Figure 10.5).
One of the sub-subsystemsof theBioS-1, in themap referred to asBioS-1.1,
is the release of the target protein from the ligand (Figure 10.6). This is per se
a function of the ligand subsystem. Thus, the sub-subsystem is not necessarily
an object but a characteristic of the ligand. This is important since we want to
understand how other subsystems of the design may influence this function.
For example, it may be relevant to ask if certain properties of the stationary
phase or the pump and valve subsystem affect the release.
The second sub-subsystem (BioS-1.2) in the map is the function of the
ligand to allow efficient coupling to the stationary phase. This includes the
chemical structure of the ligand and the matrix of the stationary phase. This
leads us to ask if other subsystems could also influence the design?
The third sub-subsystem(BioS-1.3) is the functionof the ligand towithstand
all operation conditions executed. This certainly involves the technical sub-
systems and how these could impose influence on the ligand/matrix.
204 CHROMATOGRAPHIC PROTEIN PURIFICATION
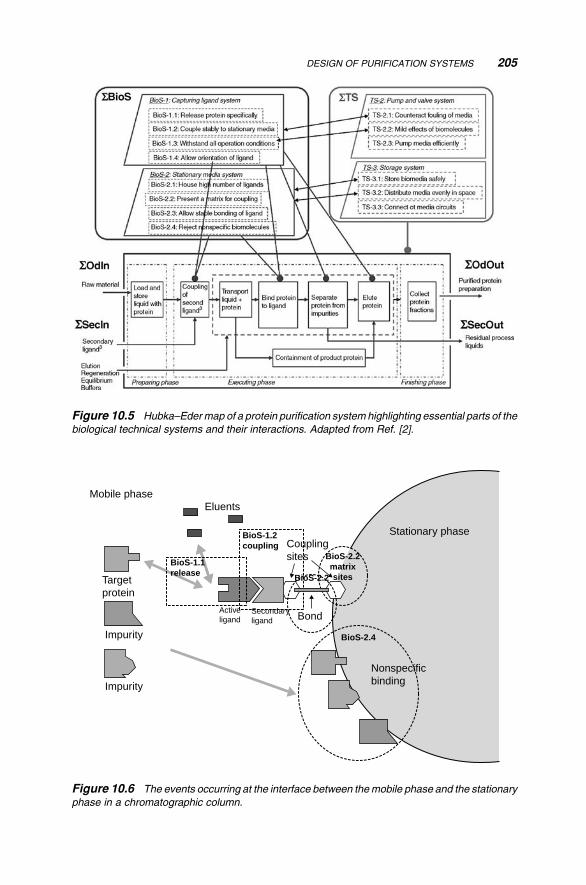
Figure 10.5 Hubka–Edermap of a protein purification systemhighlighting essential parts of the
biological technical systems and their interactions. Adapted from Ref. [2].
Stationary phase
Bond
Couplingsites
Activeligand
EluentsMobile phase
Targetprotein
Impurity
Impurity
Secondaryligand
Nonspecificbinding
BioS-2.4
BioS-2.2matrixsitesBioS-2.2
BioS-1.2coupling
BioS-1.1release
Figure 10.6 The events occurring at the interface between themobile phase and the stationary
phase in a chromatographic column.
DESIGN OF PURIFICATION SYSTEMS 205
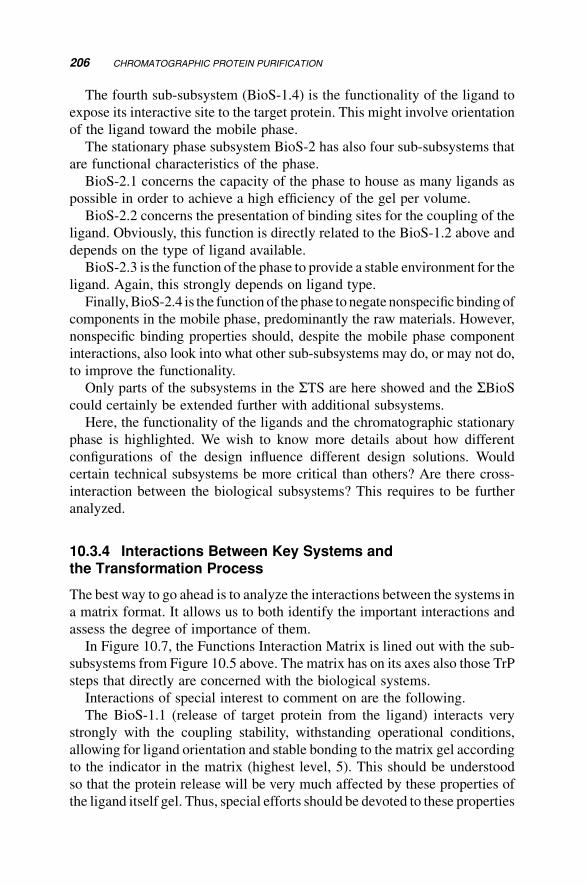
The fourth sub-subsystem (BioS-1.4) is the functionality of the ligand to
expose its interactive site to the target protein. This might involve orientation
of the ligand toward the mobile phase.
The stationary phase subsystem BioS-2 has also four sub-subsystems that
are functional characteristics of the phase.
BioS-2.1 concerns the capacity of the phase to house as many ligands as
possible in order to achieve a high efficiency of the gel per volume.
BioS-2.2 concerns the presentation of binding sites for the coupling of the
ligand. Obviously, this function is directly related to the BioS-1.2 above and
depends on the type of ligand available.
BioS-2.3 is the function of the phase to provide a stable environment for the
ligand. Again, this strongly depends on ligand type.
Finally,BioS-2.4 is the functionof the phase to negate nonspecific bindingof
components in the mobile phase, predominantly the raw materials. However,
nonspecific binding properties should, despite the mobile phase component
interactions, also look into what other sub-subsystems may do, or may not do,
to improve the functionality.
Only parts of the subsystems in the STS are here showed and the SBioScould certainly be extended further with additional subsystems.
Here, the functionality of the ligands and the chromatographic stationary
phase is highlighted. We wish to know more details about how different
configurations of the design influence different design solutions. Would
certain technical subsystems be more critical than others? Are there cross-
interaction between the biological subsystems? This requires to be further
analyzed.
10.3.4 Interactions Between Key Systems andthe Transformation Process
The best way to go ahead is to analyze the interactions between the systems in
a matrix format. It allows us to both identify the important interactions and
assess the degree of importance of them.
In Figure 10.7, the Functions Interaction Matrix is lined out with the sub-
subsystems from Figure 10.5 above. The matrix has on its axes also those TrP
steps that directly are concerned with the biological systems.
Interactions of special interest to comment on are the following.
The BioS-1.1 (release of target protein from the ligand) interacts very
strongly with the coupling stability, withstanding operational conditions,
allowing for ligand orientation and stable bonding to the matrix gel according
to the indicator in the matrix (highest level, 5). This should be understood
so that the protein release will be very much affected by these properties of
the ligand itself gel. Thus, special efforts should be devoted to these properties
206 CHROMATOGRAPHIC PROTEIN PURIFICATION
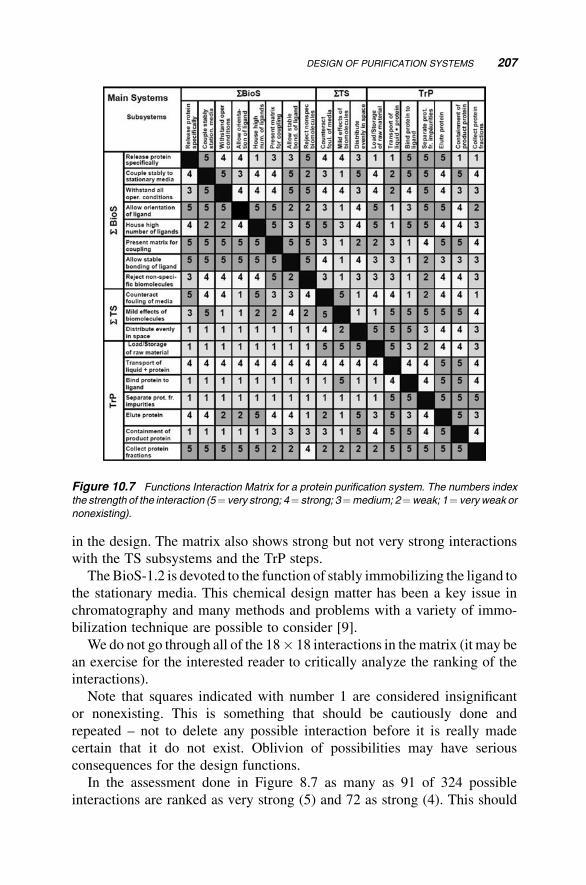
in the design. The matrix also shows strong but not very strong interactions
with the TS subsystems and the TrP steps.
TheBioS-1.2 is devoted to the function of stably immobilizing the ligand to
the stationary media. This chemical design matter has been a key issue in
chromatography and many methods and problems with a variety of immo-
bilization technique are possible to consider [9].
We do not go through all of the 18� 18 interactions in thematrix (it may be
an exercise for the interested reader to critically analyze the ranking of the
interactions).
Note that squares indicated with number 1 are considered insignificant
or nonexisting. This is something that should be cautiously done and
repeated – not to delete any possible interaction before it is really made
certain that it do not exist. Oblivion of possibilities may have serious
consequences for the design functions.
In the assessment done in Figure 8.7 as many as 91 of 324 possible
interactions are ranked as very strong (5) and 72 as strong (4). This should
Figure 10.7 Functions Interaction Matrix for a protein purification system. The numbers index
the strength of the interaction (5¼ very strong; 4¼ strong; 3¼medium; 2¼weak; 1¼ very weak or
nonexisting).
DESIGN OF PURIFICATION SYSTEMS 207
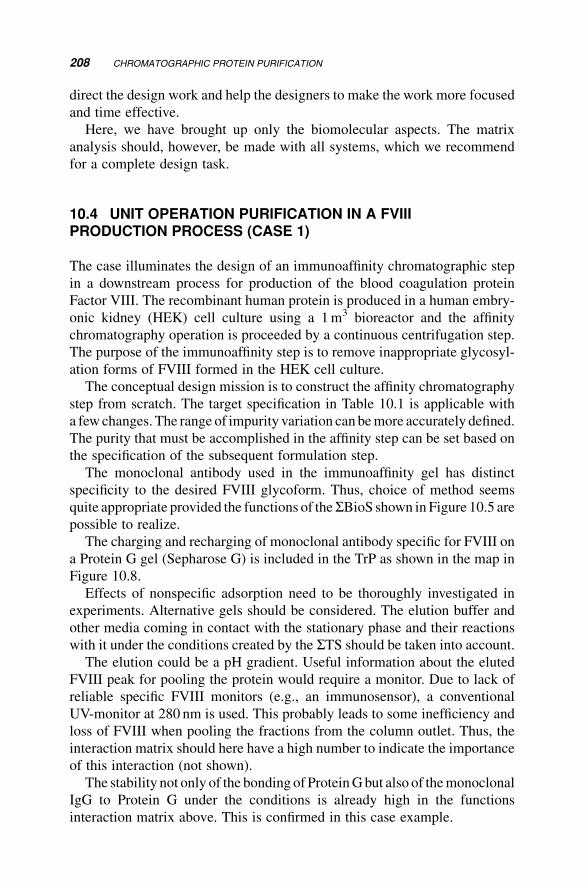
direct the design work and help the designers to make the work more focused
and time effective.
Here, we have brought up only the biomolecular aspects. The matrix
analysis should, however, be made with all systems, which we recommend
for a complete design task.
10.4 UNIT OPERATION PURIFICATION IN A FVIIIPRODUCTION PROCESS (CASE 1)
The case illuminates the design of an immunoaffinity chromatographic step
in a downstream process for production of the blood coagulation protein
Factor VIII. The recombinant human protein is produced in a human embry-
onic kidney (HEK) cell culture using a 1m3 bioreactor and the affinity
chromatography operation is proceeded by a continuous centrifugation step.
The purpose of the immunoaffinity step is to remove inappropriate glycosyl-
ation forms of FVIII formed in the HEK cell culture.
The conceptual design mission is to construct the affinity chromatography
step from scratch. The target specification in Table 10.1 is applicable with
a fewchanges. The range of impurity variation can bemore accurately defined.
The purity that must be accomplished in the affinity step can be set based on
the specification of the subsequent formulation step.
The monoclonal antibody used in the immunoaffinity gel has distinct
specificity to the desired FVIII glycoform. Thus, choice of method seems
quite appropriate provided the functions of theSBioS shown in Figure 10.5 arepossible to realize.
The charging and recharging of monoclonal antibody specific for FVIII on
a Protein G gel (Sepharose G) is included in the TrP as shown in the map in
Figure 10.8.
Effects of nonspecific adsorption need to be thoroughly investigated in
experiments. Alternative gels should be considered. The elution buffer and
other media coming in contact with the stationary phase and their reactions
with it under the conditions created by the STS should be taken into account.
The elution could be a pH gradient. Useful information about the eluted
FVIII peak for pooling the protein would require a monitor. Due to lack of
reliable specific FVIII monitors (e.g., an immunosensor), a conventional
UV-monitor at 280 nm is used. This probably leads to some inefficiency and
loss of FVIII when pooling the fractions from the column outlet. Thus, the
interaction matrix should here have a high number to indicate the importance
of this interaction (not shown).
The stability not only of the bonding of ProteinGbut also of themonoclonal
IgG to Protein G under the conditions is already high in the functions
interaction matrix above. This is confirmed in this case example.
208 CHROMATOGRAPHIC PROTEIN PURIFICATION
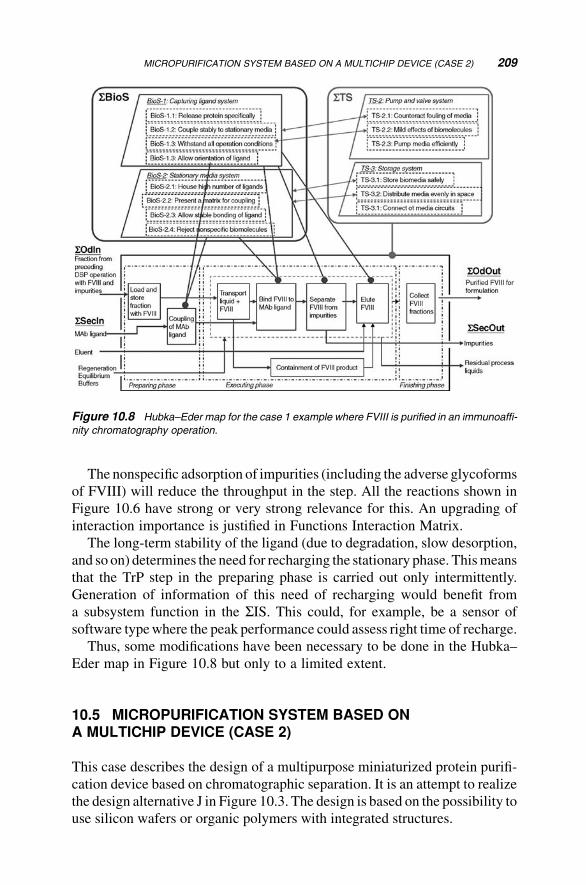
The nonspecific adsorption of impurities (including the adverse glycoforms
of FVIII) will reduce the throughput in the step. All the reactions shown in
Figure 10.6 have strong or very strong relevance for this. An upgrading of
interaction importance is justified in Functions Interaction Matrix.
The long-term stability of the ligand (due to degradation, slow desorption,
and so on) determines the need for recharging the stationary phase. Thismeans
that the TrP step in the preparing phase is carried out only intermittently.
Generation of information of this need of recharging would benefit from
a subsystem function in the SIS. This could, for example, be a sensor of
software typewhere the peak performance could assess right time of recharge.
Thus, some modifications have been necessary to be done in the Hubka–
Eder map in Figure 10.8 but only to a limited extent.
10.5 MICROPURIFICATION SYSTEM BASED ONA MULTICHIP DEVICE (CASE 2)
This case describes the design of a multipurpose miniaturized protein purifi-
cation device based on chromatographic separation. It is an attempt to realize
the design alternative J in Figure 10.3. The design is based on the possibility to
use silicon wafers or organic polymers with integrated structures.
Figure 10.8 Hubka–Eder map for the case 1 example where FVIII is purified in an immunoaffi-
nity chromatography operation.
MICROPURIFICATION SYSTEM BASED ON A MULTICHIP DEVICE (CASE 2) 209
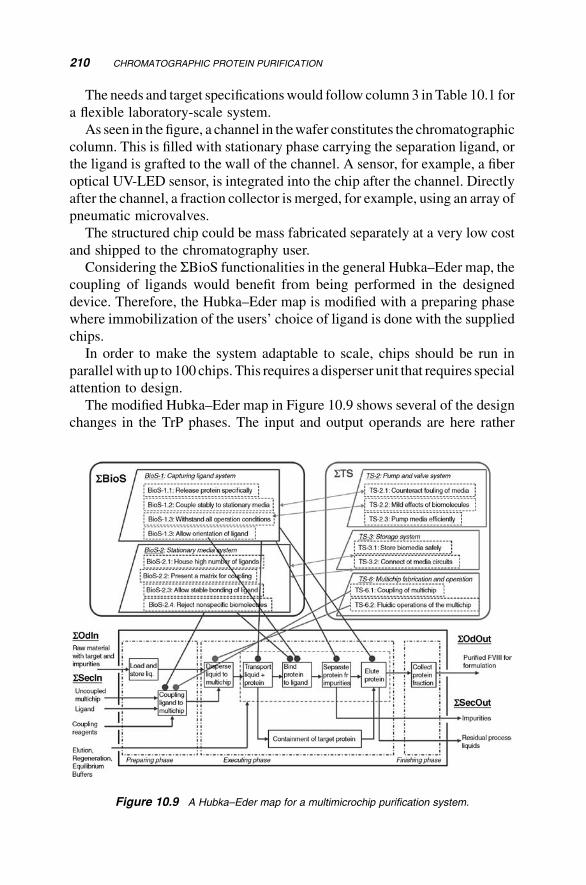
The needs and target specificationswould follow column 3 in Table 10.1 for
a flexible laboratory-scale system.
As seen in the figure, a channel in thewafer constitutes the chromatographic
column. This is filled with stationary phase carrying the separation ligand, or
the ligand is grafted to the wall of the channel. A sensor, for example, a fiber
optical UV-LED sensor, is integrated into the chip after the channel. Directly
after the channel, a fraction collector is merged, for example, using an array of
pneumatic microvalves.
The structured chip could be mass fabricated separately at a very low cost
and shipped to the chromatography user.
Considering the SBioS functionalities in the general Hubka–Eder map, the
coupling of ligands would benefit from being performed in the designed
device. Therefore, the Hubka–Eder map is modified with a preparing phase
where immobilization of the users’ choice of ligand is done with the supplied
chips.
In order to make the system adaptable to scale, chips should be run in
parallelwith up to 100 chips. This requires a disperser unit that requires special
attention to design.
The modified Hubka–Eder map in Figure 10.9 shows several of the design
changes in the TrP phases. The input and output operands are here rather
Figure 10.9 A Hubka–Eder map for a multimicrochip purification system.
210 CHROMATOGRAPHIC PROTEIN PURIFICATION
different. The STS is provided with a subsystem function for the chip
preparation andTS1with a subsystem for operating the dispersion subprocess.
A powerful option with the chip is to integrate sensors. Today’s state of the
art of the lab-on-a-chip technology furnishes a multitude of sensor chip
applications where different electronic and optical sensors are integrated
in-line (e.g., pH, pO2, conductivity, NIR, UV, fluorescence, visible absorp-
tion). These possibilities are attractive for a chromatographic separation
microchip. They should form subsystems of the STS entity and be analyzed
cross-connectively with the other systems. The miniaturization results in
much shorter optical path lengths. Thus, the sensitivity must cope with this to
be useful.
The capacity of each chip is minute compared to a conventional chroma-
tography column. This is a function of the volume of the chip channel and the
amount of gel that can be filled in it. The rheology of the flow is typically
laminar and the space velocity should follow what is characteristic for large-
scale columns.
The interactions in Figure 10.9 also highlight nonspecific effects. The
column channel in silicone (or organic polymer) presents another interface.
The volume/surface area ratio is quite different making the influence of
the channel surface much more significant than what is experienced in
a conventional column. Counteractions must be considered, such as coating
the channel surface with suitable surface-active substituents. This may be
specified in the chip fabrication method; otherwise, it can be included in the
preparing phase as an additional subprocess in the TrP.
10.6 CONCLUSIONS
Design of large-scale protein chromatography purification is already well
established. It may therefore seem unnecessary to try to create additional
design guidelines for further development.
Nevertheless, conceptual mechatronic design theory is not introduced in
this area of bioengineering and should in our view be considered.
In retrospect, many of the separation methods amply described in the past
might have been realized earlier than what actually happened.
The two case examples illuminate applications that are close to reality of
today. The lab-on-a-chip technology is delivering new ideas and methods –
some directly applied to separation of molecules. For the large number of
applications there, a systematic approach is of benefit.
Theother case example, scale-upandadaptationof adownstreamoperation,
may seem as a routine matter. Still, we strongly emphasize that this should be
done systematically and not ad hoc as is often the case in daily practice.
CONCLUSIONS 211
Perhaps the best advice is to take in all steps in the mechatronic method-
ology, even a few may lead to faster improvements.
REFERENCES
1. Harrison, R.G., Todd, P., Rudge, S.R., Petrides, D.P. (2003) Bioseparation
Science and Engineering, Oxford University Press, Oxford.
2. Derel€ov, M., Detterfelt, J., Bj€orkman, M., Mandenius, C.F. (2008) Engineering
design methodology for biomechatronic products. Biotechnol. Prog. 24,
232–244.
3. L., Janson, J. (eds.) (1998) Protein Purification: Principles, High Resolution
Methods and Applications, 3rd edition (2011) Wiley, New York.
4. Rehm, H.J., Reed, G., P€uhler, A., Stadler, P. (1989–1999) Biotechnology, 2ndedition, Vols. 1–12, Wiley-VCH Verlag GmbH, Weinheim.
5. Anonymous Antibody Purification Handbook, Amersham Pharmacia Biotech,
Uppsala, 2000.
6. Sofer, G.K., Nystr€om, L.E. (1989) Process Chromatography, A Practical Guide,
Academic Press, London.
7. Peters,M.S., Timmerhaus, K.D.,West, R.E. (2003)Plant Design and Economics
for Chemical Engineers, 5th edition, McGraw-Hill, New York.
8. Atkinson, A.C., Tobias, R.D. (2008) Optimal experimental design in chroma-
tography. J. Chromatogr. A 1177, 1–11.
9. Hermanson, G.T., Mallia, A.K., Smith, P.K. (1992) Immobilized Affinity Ligand
Techniques, Academic Press, San Diego.
10. Roe, S. (2001) Protein Purification Techniques: A Practical Approach (Prac-
tical Approach Series), Oxford University Press.
11. Doran, P.M. (1995) Bioprocess Engineering Principles, Academic Press,
New York.
12. Hage, D.S., Cazes, J. (2006)Handbook of Affinity Chromatography, 2nd edition
(Chromatographic Science Series), Taylor & Francis.
13. Simpson, R.J. (2004) Purifying Proteins for Proteomics: A Laboratory Manual,
Cold Spring Harbor Laboratory Press, New York.
14. Robert, K. (1994) Protein Purification. Principles and Practice Series: Springer
Advanced Texts in Chemistry, 3rd edition, Springer, Berlin.
15. Bailon, P. (2000) Affinity Chromatography: Methods and Protocols (Methods in
Molecular Biology), Humana Press.
16. Subramanian, G. (1991) Preparative and Process-Scale Liquid Chromatogra-
phy, Ellis Horwood Ltd, Chichester, UK.
17. Nilsson, M., Harang, V., Bergstrom, M., Ohlson, S., Isaksson, R., Johansson, G.
(2004) Determination of protein–ligand affinity constants from direct migration
time in capillary electrophoresis. Electrophoresis 25, 1829–1836.
212 CHROMATOGRAPHIC PROTEIN PURIFICATION
18. Schlinge, D., Scherpian, P., Schembecker, G. (2010) Comparison of process
concepts for preparative chromatography. Chem. Eng. Sci. 65, 5373–5381.
19. Sun, Y., Liu, F.F., Shi, Q.H. (2009) Approaches to high-performance preparative
chromatography of proteins. Adv. Biochem. Eng. Biotechnol. 113, 217–254.
20. Nagrath, D., Messac, A., Bequette, B.W., Cramer, S.M. (2004) A hybrid model
framework for the optimization of preparative chromatographic processes.
Biotechnol. Prog. 20, 162–178.
21. Levison, P.R. (2003) Large-scale ion-exchange column chromatography of
proteins. Comparison of different formats. J. Chromatogr. B 790, 17–33.
22. Kaltenbrunner, O., Jungbauer, A., Yamamoto, S. (1997) Prediction of preparative
chromatography performance with a very small column. J. Chromatogr. A 760,
41–53.
23. Jungbauer, A., Hackl, S., Yamamoto, S. (1994) Calculation of peak profiles in
preparative chromatography of biomolecules. J. Chromatogr. A 658, 399–406.
24. Jungbauer, A. (1993) Chromatography of biomolecules. J. Chromatogr. 639,
3–16.
25. Whitley, R.D., Van Cott, K.E., Wang, N.H.L. (1993) Analysis of nonequilibrium
adsorption/desorption kinetics and implications for analytical and preparative
chromatography. Ind. Eng. Chem. Res. 32, 149–159.
26. Yamamoto, S., Nomura, M., Sano, Y. (1990) Preparative chromatography
of proteins: design calculation procedure for gradient and stepwise elution.
J. Chromatogr. 512, 89–100.
27. Mazsaroff, I., Regnier, F.E. (1986) An economic analysis of performance in
preparative chromatography of proteins. J. Liq. Chromatogr. 9, 2563–2583.
28. Righezza, M., Chretien, J.R. (1993) Factor analysis of experimental design in
chromatography. Part XIV. Chromatographia 36, 125–129.
29. Makrodimitris, K., Fernandez, E.J., Woolf, T.B., O’Connell, J.P. (2005)
Simulation and experiment of temperature and cosolvent effects in reversed
phase chromatography of peptides. Biotechnol. Prog. 21, 893–896.
REFERENCES 213

11Stem Cell Manufacturing
This chapter discusses application of the biomechatronic designmethodology
for stem cell manufacturing systems. First, the state of the art of stem cell
manufacturing is overviewed with emphasis on illuminating the vast
complexity of this type of bioprocessing (Section 11.1). The multitude of
requirements and needs this advanced technology is accompanied with is
discussed and a few examples of target specification tables are shown
(Section 11.2). The design methodology is applied with these constraints
and various design alternatives are evaluated using the methodology
(Section 11.3). Finally, a specific case for human embryonic stem cell (hESC)
expansion is shown to exemplify the principles (Section 11.4).
11.1 STATE OF THE ART OF STEM CELL MANUFACTURING
Themanufacturing of stem cells is today in its infancy [1,2,3]. It is thus timely
to apply established modern methods for design to the systems and processes
formanufacturing stem cells and stem cell-derived products and, in particular,
to do that with biomechatronic design methodology as a tool [4,5]. This could
be a challenging possibility for stem cell R&D companies that intend to
Biomechatronic Design in Biotechnology: A Methodology for Development ofBiotechnological Products, First Edition. Carl-Fredrik Mandenius and Mats Bjorkman.� 2011 John Wiley & Sons, Inc. Published 2011 by John Wiley & Sons, Inc.
215
transform their established cells and cell lines into bioproducts that should be
reliably and efficiently manufactured according to current GoodManufactur-
ing Practice (GMP) and in compliance with safety and ethical regulatory
directives and guidelines from the European Commission, FDA, EMA, and
other regulatory authorities [6–10]. This is especially motivated for clinical-
grade products for cell therapy applications where derived organ cell types are
to be transplanted into a patient [9,11]. Application of stem cells in the drug
discovery and development process must also reach high standards in order to
be able to deliver relevant materials in toxicity testing and other preclinical
studies [12,13].
The variety of procedural alternatives for propagation, expansion, differ-
entiation, preservation, and characterization of stem cells makes the design
task very complex. The need to adapt, refine, and optimize to satisfy the
demands of good process economy, high-quality cell products, and regulatory
compliance justifies the mobilization of the most powerful design methods.
In the common procedure for producing stem cells materials (e.g., hESC
and hESC-derived products), the first step in the preparation is to enzymati-
cally digest the inner cell mass of embryonic blastocytes [14]. The isolated
cell mass is spread on a layer of growth-inhibited mouse fibroblast feeder
cells in tissue culture dishes. After 1 or 2 weeks, the outgrown cells from the
inner cell mass are isolated, bymanual dissection or enzymatic treatment, and
transferred to new culture dishes for further growth in an undissociated
cellular state. The feeder cells provide endogen differentiation inhibitors that
hinder the stem cells to differentiate further [2].
The stability of the differentiation state of cell culture is monitored
through characterizing specific biomarker molecules, typically cell surface
proteins (e.g., SSEA-3/4, Oct3/4, and Nanog), which indicate that the cell
mass remains in the undifferentiated state [15]. Additional characterization
and control methods could be efficient to use, for example, gene array
analyses, flow cytometry, and other methods [2].
If the final product of the process is undifferentiated stem cells, the
characterized cells are isolated and further expanded under controlled
conditions as seen in Figure 11.1. As much as 100 passages can be attained
if the appropriate inhibition factors are added to the process [13].
If the final product is a particular organ cell type, a continuing well-defined
differentiation protocol ensues in a stepwise procedure of propagation and
isolation of the cells. The added differentiation factors and the culture
conditions applied stimulate the cells to develop into progenitor cell states
and further to matured cells from which the desired cell type is isolated (see
Figure 11.1). This part of the process may take another 2–4 weeks. Very
important for a precise control of the development of the cells is to continue
characterization of biomarker molecules, now others are characteristic for the
216 STEM CELL MANUFACTURING
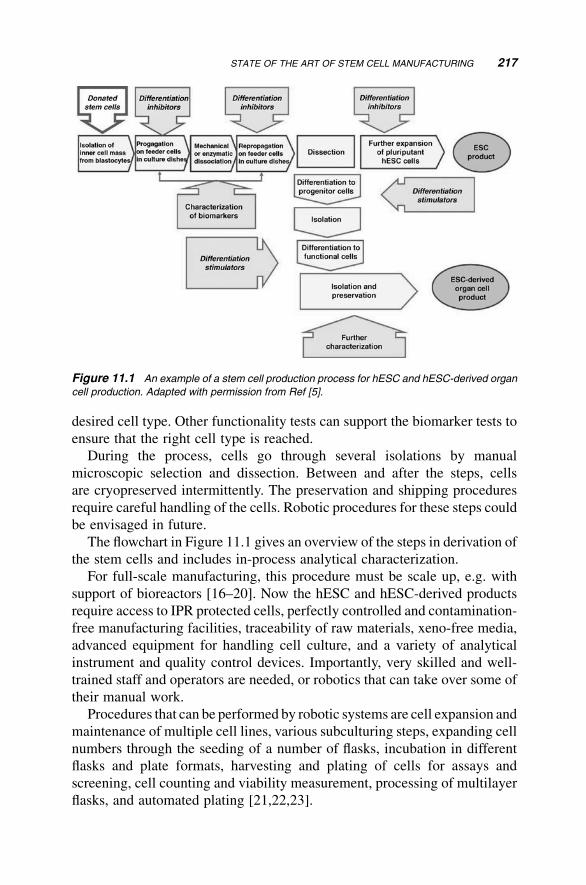
desired cell type. Other functionality tests can support the biomarker tests to
ensure that the right cell type is reached.
During the process, cells go through several isolations by manual
microscopic selection and dissection. Between and after the steps, cells
are cryopreserved intermittently. The preservation and shipping procedures
require careful handling of the cells. Robotic procedures for these steps could
be envisaged in future.
The flowchart in Figure 11.1 gives an overview of the steps in derivation of
the stem cells and includes in-process analytical characterization.
For full-scale manufacturing, this procedure must be scale up, e.g. with
support of bioreactors [16–20]. Now the hESC and hESC-derived products
require access to IPR protected cells, perfectly controlled and contamination-
free manufacturing facilities, traceability of raw materials, xeno-free media,
advanced equipment for handling cell culture, and a variety of analytical
instrument and quality control devices. Importantly, very skilled and well-
trained staff and operators are needed, or robotics that can take over some of
their manual work.
Procedures that can be performed by robotic systems are cell expansion and
maintenance of multiple cell lines, various subculturing steps, expanding cell
numbers through the seeding of a number of flasks, incubation in different
flasks and plate formats, harvesting and plating of cells for assays and
screening, cell counting and viability measurement, processing of multilayer
flasks, and automated plating [21,22,23].
Figure 11.1 An example of a stem cell production process for hESC and hESC-derived organ
cell production. Adapted with permission from Ref [5].
STATE OF THE ART OF STEM CELL MANUFACTURING 217
Other important functions the scaled-up system could or should include are
as follows:
. Quality control of cell banks
. Quality control of input materials (culture media, factors, and
consumables)
. Quality control methods for manufactured cells (monitoring biomarkers,
functional testing of final cells, genomic analyses, histological analyses,
microscopy, and flow cytometry methods)
. Cryopreservation procedures (deep freezers for preserving cell materials
at various stages of the process)
. Isolation procedures (dissection in microscopy, enzyme treatments)
. Preservation/storage of the product and shipping procedures
The manufacturing must also be performed in clean rooms to reduce the risk
for contamination.
All this requires extensive validation and reconsideration of effects caused
by the scaled-up manufacturing systems [24].
11.2 NEEDS AND TARGET SPECIFICATIONS FOR SCALED-UPSTEM CELL MANUFACTURING
The needs and requirements of a stem cellmanufacturing process should in the
biomechatronic design methodology we apply be listed and specified with
target values.
The List of Target Specifications in Table 11.1 lists important needs
as mentioned in the above section. The needs in the table are presented as
metrics. A few additional needs with metrics are included in the table, such
as use of PAT/QbD [6,25], something that we will elaborate more thoroughly
in Chapter 13.
Target values are set, such as the qualitative values (e.g., “Yes/No”) or
quantitative values (e.g., time and costs for batches and the attained efficiency
by automation of the procedures).
The target values given in the table are examples and indicators of what
could be typical values in a particular process.
Depending on the type of stem cell manufacturing process, both the final
cell product and the starting embryonic stem cell material can vary signifi-
cantly and must be defined for each process. In Figure 11.2, three alternative
process configurations are shown. Consequently, the List of Target Specifica-
tions will look different for each of these process configurations.
218 STEM CELL MANUFACTURING
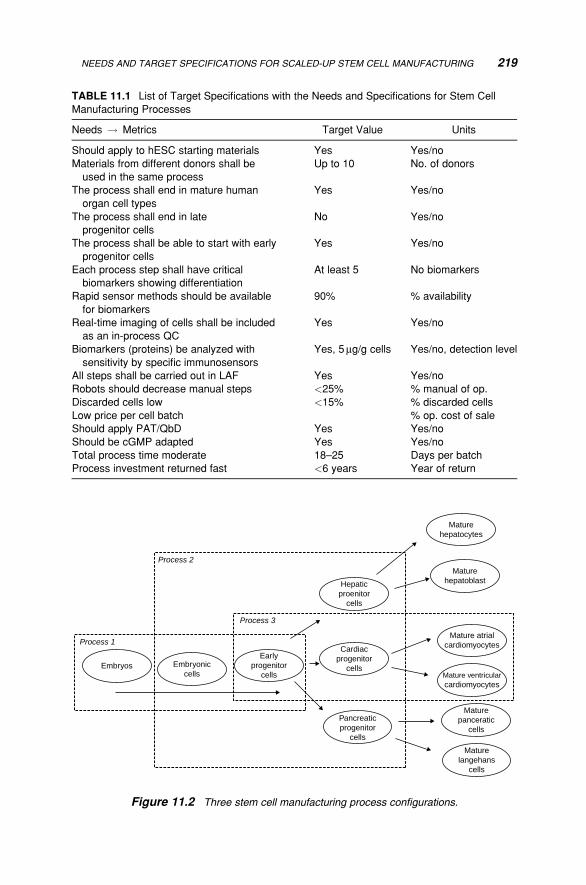
TABLE 11.1 List of Target Specifications with the Needs and Specifications for Stem Cell
Manufacturing Processes
Needs ! Metrics Target Value Units
Should apply to hESC starting materials Yes Yes/no
Materials from different donors shall be
used in the same process
Up to 10 No. of donors
The process shall end in mature human
organ cell types
Yes Yes/no
The process shall end in late
progenitor cells
No Yes/no
The process shall be able to start with early
progenitor cells
Yes Yes/no
Each process step shall have critical
biomarkers showing differentiation
At least 5 No biomarkers
Rapid sensor methods should be available
for biomarkers
90% % availability
Real-time imaging of cells shall be included
as an in-process QC
Yes Yes/no
Biomarkers (proteins) be analyzed with
sensitivity by specific immunosensors
Yes, 5mg/g cells Yes/no, detection level
All steps shall be carried out in LAF Yes Yes/no
Robots should decrease manual steps <25% % manual of op.
Discarded cells low <15% % discarded cells
Low price per cell batch % op. cost of sale
Should apply PAT/QbD Yes Yes/no
Should be cGMP adapted Yes Yes/no
Total process time moderate 18–25 Days per batch
Process investment returned fast <6 years Year of return
Process 1
Process 2
Embryos Embryoniccells
Earlyprogenitor
cells
Cardiacprogenitor
cells
Pancreaticprogenitor
cells
Process 3
Hepaticproenitor
cells
Maturehepatocytes
Maturehepatoblast
Mature atrialcardiomyocytes
Maturepanceratic
cells
Maturelangehans
cells
Mature ventricularcardiomyocytes
Figure 11.2 Three stem cell manufacturing process configurations.
NEEDS AND TARGET SPECIFICATIONS FOR SCALED-UP STEM CELL MANUFACTURING 219
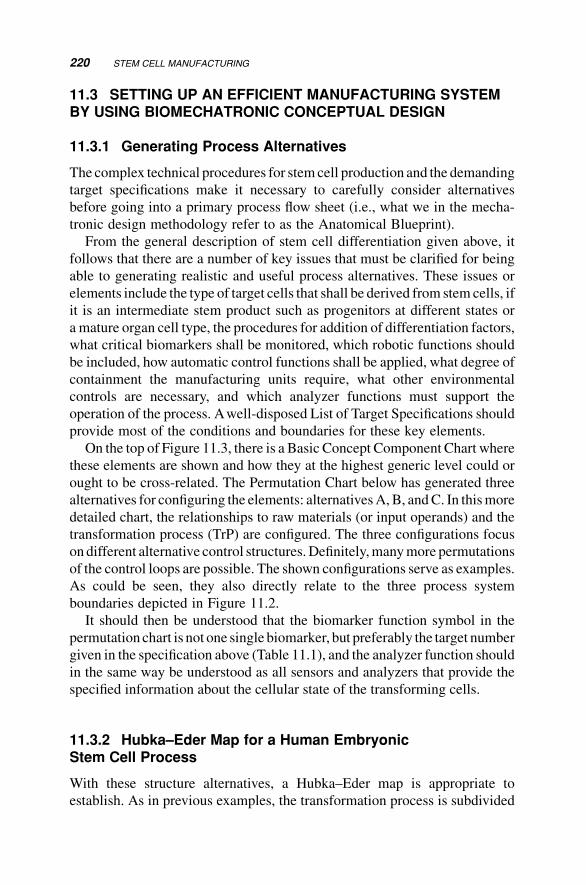
11.3 SETTING UP AN EFFICIENT MANUFACTURING SYSTEMBY USING BIOMECHATRONIC CONCEPTUAL DESIGN
11.3.1 Generating Process Alternatives
The complex technical procedures for stemcell production and the demanding
target specifications make it necessary to carefully consider alternatives
before going into a primary process flow sheet (i.e., what we in the mecha-
tronic design methodology refer to as the Anatomical Blueprint).
From the general description of stem cell differentiation given above, it
follows that there are a number of key issues that must be clarified for being
able to generating realistic and useful process alternatives. These issues or
elements include the type of target cells that shall be derived from stem cells, if
it is an intermediate stem product such as progenitors at different states or
a mature organ cell type, the procedures for addition of differentiation factors,
what critical biomarkers shall be monitored, which robotic functions should
be included, how automatic control functions shall be applied, what degree of
containment the manufacturing units require, what other environmental
controls are necessary, and which analyzer functions must support the
operation of the process. Awell-disposed List of Target Specifications should
provide most of the conditions and boundaries for these key elements.
On the top of Figure 11.3, there is a Basic Concept Component Chart where
these elements are shown and how they at the highest generic level could or
ought to be cross-related. The Permutation Chart below has generated three
alternatives for configuring the elements: alternativesA,B, andC. In thismore
detailed chart, the relationships to raw materials (or input operands) and the
transformation process (TrP) are configured. The three configurations focus
on different alternative control structures.Definitely,manymore permutations
of the control loops are possible. The shown configurations serve as examples.
As could be seen, they also directly relate to the three process system
boundaries depicted in Figure 11.2.
It should then be understood that the biomarker function symbol in the
permutation chart is not one single biomarker, but preferably the target number
given in the specification above (Table 11.1), and the analyzer function should
in the same way be understood as all sensors and analyzers that provide the
specified information about the cellular state of the transforming cells.
11.3.2 Hubka–Eder Map for a Human EmbryonicStem Cell Process
With these structure alternatives, a Hubka–Eder map is appropriate to
establish. As in previous examples, the transformation process is subdivided
220 STEM CELL MANUFACTURING
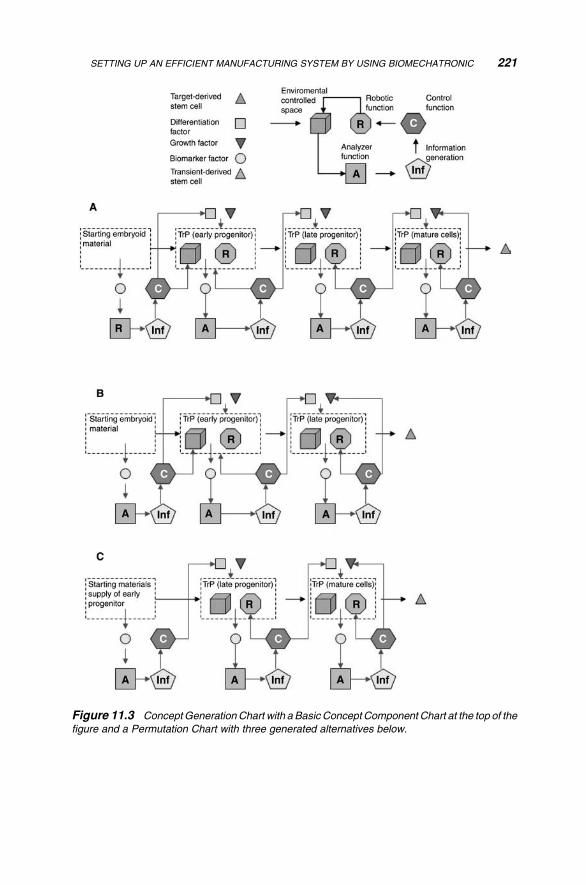
Figure 11.3 ConceptGeneration Chart with a Basic Concept Component Chart at the top of the
figure and a Permutation Chart with three generated alternatives below.
SETTING UP AN EFFICIENT MANUFACTURING SYSTEM BY USING BIOMECHATRONIC 221
into a preparing, executing, and finishing phase (Figure 11.4). The dominating
phase is the executing phase, which coincides largely with the flow scheme of
Figure 11.1. The preparing phase is the handling of the exclusive starting raw
material – the embryonic stem cells – and how they are taken care of in the cell
bank. It also includes the pretreatment and preparation of cell media.
The finishing phase structures how to storage the produced target cells and
maintaining them until use. It also includes the procedure of shipping the cells
to the user (e.g., a clinic or a toxicology test laboratory).
The in- and out-operands are defined as well. The hESC material is the
obvious primary input operand together with cell media and growth and
differentiation factors. Secondary inputs could be analytical information
about cell state, which can adapt the protocol to the TrP or individual customer
demands. Out-operands are primarily the derived target cells and character-
ization data about them. Secondary outputs are residual cells and wasted
media.
The SBioS is the hESC on a functional level. This includes their func-
tionality in terms of storage ability (BioS-1), their ability of self-renewal
(BioS-2), and their expression of characteristic biomarkers (BioS-3). Another
important part of the SBioS is the functions of the media factors on the
differentiation process (BioS-4). Here, we are including a vast number of
factors with a variety of biological effects on the stem cells. These functions
are, of course, the most essential knowledge embedded in the design of a stem
cell process and the result of recent stem cell research and should be detailed to
Figure 11.4 A Hubka–Eder map showing the design of a stem cell manufacturing process.
Adapted from Ref. [6].
222 STEM CELL MANUFACTURING
a deeper level in subsystemsn to a degree as relevant for the TrP. This might be
a very demanding work and treated here.
Belonging to the SBioS is also the basic culture media (BioS-5), normally
a combination of biological, organic, and inorganic molecules. Their biologi-
cal effects on the propagation of the stem cells should be a key function of the
SBioS entity.
The immunosensors mentioned above need to carry out immunoactive
functions for biomarker detection. The system analysis should bring the
understanding of the interactions between these process analytical functions
and the TrP. Consequently, these functions are also very important to consider
as a SBioS subsystem.
The STS have many more subsystems than is possible to include in the
figure. The complete Hubka–Eder map must however do that.
Important STS subsystems are the functions of the automated handling of
liquids by robots (TS-1), the preservation and containment of cells (TS-2), the
analytical and imaging devices (TS-2), and the process computer signaling
and programs for effectuating the operations (TS-4). All other technical
equipment involved in the TrP that have essential functions also become
separate technical subsystems. These are the technical subsystems for car-
rying out functions for centrifugation of cells, incubation, laminar flow
containment, microscopic investigation of cells, micromanipulation of stem
cells on plates, dispersion, autopipetting, heating, cooling, and so on. These
subfunctions are having key effects on the other subsystems and their mutual
interactions are very important to capture.
Especially, both the effects that the technical subsystems have on theSBioSand the effects caused bySBioS onSTS should be studied systematically. This
includes, of course, both the intended and the unintended effects.
SIS include the sensor functions with respect to the information content
they create (IS-1), the biomarker information as a fingerprint of the cellular
state (IS-2), image analysis data created in, for example, fluorescence
microscopes (IS-3), and genomics and transcriptomics data from microarray
testing carried out (IS-4).
TheSIS subsystems are in all cases connected to a technical subsystem that
can generate information technically. Other important interactions are with
SBioS and with databases for data storage.
SM&GS include typical process management issues: GMP (M&GS-1),
StandardOperation Procedures (M&GS-2), and riskmanagement (M&GS-3),
following ICH guidelines. Here, other regulatory practices such as PAT and
QbD can also be included as further discussed in Chapter 13.
SM&GS have important functions in controlling procedures through
automatic controllers, for example, embedded in the robots. The controling
is to a large extent a technical subsystemmatter, but the choice of set-points or
SETTING UP AN EFFICIENT MANUFACTURING SYSTEM BY USING BIOMECHATRONIC 223
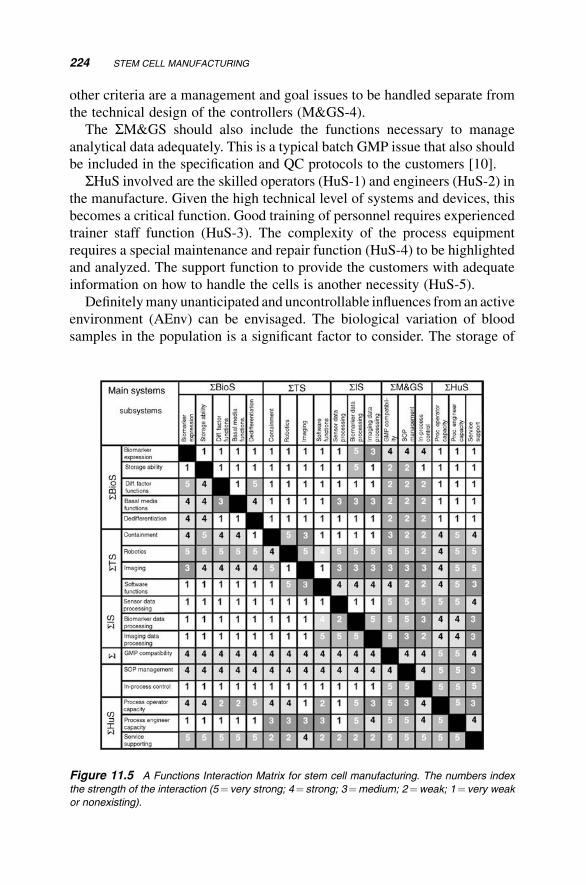
other criteria are a management and goal issues to be handled separate from
the technical design of the controllers (M&GS-4).
The SM&GS should also include the functions necessary to manage
analytical data adequately. This is a typical batch GMP issue that also should
be included in the specification and QC protocols to the customers [10].
SHuS involved are the skilled operators (HuS-1) and engineers (HuS-2) in
the manufacture. Given the high technical level of systems and devices, this
becomes a critical function. Good training of personnel requires experienced
trainer staff function (HuS-3). The complexity of the process equipment
requires a special maintenance and repair function (HuS-4) to be highlighted
and analyzed. The support function to provide the customers with adequate
information on how to handle the cells is another necessity (HuS-5).
Definitelymany unanticipated and uncontrollable influences from an active
environment (AEnv) can be envisaged. The biological variation of blood
samples in the population is a significant factor to consider. The storage of
Figure 11.5 A Functions Interaction Matrix for stem cell manufacturing. The numbers index
the strength of the interaction (5¼ very strong; 4¼ strong; 3¼medium; 2¼weak; 1¼ very weak
or nonexisting).
224 STEM CELL MANUFACTURING
more or less sensitive enzymes and other reagents where climate conditions
may affect the shelf life may vary considerably. The climate variation may
also influence the performance of the sensor. Sensitivity to humidity and
temperature effects on the reaction rates of the analytical conversions need
consideration.
The large number of interactions taking place in the complete stem cell
manufacturing process motivates the use of a Functions Interaction Matrix.
Figure 11.5 shows an example of the Functions Interaction Matrix for
a stem cell process where the main subsystems are included.
As seen, the interactions assessed as very strong and strong are many. Note
the unsymmetric character of the interactions. For example, the biological
systems have little or no impact on the technical systemswhereas the technical
systems have in the majority of their interactions significant influence. This
could, for example, be that the performance of a robotic subsystem that should
handle the cell culture may be decisive for the cells’ state after the operation
(volume precision and mechanical stress).
11.4 CONCLUSIONS
This chapter has highlighted some of the specific characteristics of hESC
manufacture that need extensive attention for a further exploitation of the
hESC technology into successful products. Here, a systematic inspired
approach can be especially rewarding from both the regulators’ perspective
and the manufacturers’ perspective. To employ the methodology of manu-
facturing systems design may then be a good way to avoid unnecessary costs
and delays in the development.
A manufacturing facility for hESC products should most probably be
flexible for production of different final products, for example, different
hESC-derived cell types or undifferentiated hESCmaterials from a particular
hESC line. The typical customerswill havevarying demands depending on the
purpose of the produced cell material (for clinical-grade use, for drug testing,
etc.). The quantity of the cells required will vary considerably over time. The
distribution/shipping conditions will be more or less demanding. A hESC
manufacturer may, of course, specialize on certain customers and cell types.
However, from a manufacturing engineering perspective, an interesting
question is how to make a robust flexible manufacturing system that can
copewith the varying demands in order to be as competitive as possible on the
market. The demands for repeatability of the production batches imply that
robots should be used instead of human operators whenever possible since the
variability and risk for mistakes due to monotonous and repetitive work are
much smaller for robotic systems than for human operators.
CONCLUSIONS 225
However, many of the inherent criteria of the regulatory demands are
manifested in themechatronic design approach. It is an example of a scientific
method and a tool for knowledgemanagement and knowledge analysis, albeit
not by using traditional knowledge management tools.
Several features can be envisaged as typical in hESCmanufacturing – high
demands on robust flexibility, long-time contracts, and very small volumes of
bioproducts with an unusually high price. This is in contrast to most other
traditional areas where Hubka–Eder mapping is applied.
REFERENCES
1. Sartipy, P., Bj€orquist, P., Strehl, R., Hyllner, J. (2007) The application of human
embryonic stem cell technologies to drug discovery. Drug Discov. Today 12,
688–699.
2. Ameen, C., Strehl, R., Bj€orquist, P., Lindahl, A., Hyllner, J., Sartipy, P. (2008)Human embryonic stem cells: current technologies and emerging industrial
applications. Crit. Rev. Oncol. Hematol. 65, 54–80.
3. Adewumi, O., et al. (2007) Characterization of human embryonic stem cell lines
by the international stem cell initiative. Nat. Biotechnol. 25, 803–816.
4. Derel€ov, M., Detterfelt, J., Bj€orkman, M., Mandenius, C.F. (2008) Engineering
design methodology for bio-mechatronic products. Biotechnol. Prog. 24,
232–244.
5. Mandenius, C.F., Bj€orkman, M. (2010) Mechatronic design principles for
biotechnology product development. Trends Biotechnol. 28(5), 230–236.
6. Mandenius, C.F., Bj€orkman, M. (2009) Process analytical technology (PAT) and
Quality-by-Design (QbD) aspects on stem cellmanufacture.Eur. Pharm. Rev. 14
(1), 32–37.
7. von Tigerstrom, B.J. (2008) The challenge of regulatory stem cell-based
products. Trends Biotechnol. 26, 653–658.
8. European Commission (2004) Directive of the European Parliament and of the
Council of 31March 2004 on setting standards of quality and safety for donation,
procurement, testing, processing, preservation, storage and distribution of human
tissues and cells. E. C. Directive 2004/23.
9. Federal Drug and Food Administration (USA) (2008) Content and Review of
Chemistry, Manufacturing, and Control (CMC) Information for Human Somatic
Cell Therapy Investigational New Drug Applications (INDs), FDA.
10. Unger, C., Skottman, H., Blomberg, P., Dilber, M.S., Hovatta, O. (2008) Good
manufacturing practice and clinical-grade human embryonic stem cell lines.
Hum. Mol. Genet. 17, R48–R53.
11. Kirouac, D.C., Zandstra, P.W. (2008) The systematic production of cells for cell
therapies. Cell Stem Cell 3, 369–381.
226 STEM CELL MANUFACTURING
12. Khetani, S.R., Bhatia, S.N. (2008) Microscale culture of human liver cells for
drug development. Nat. Biotechnol. 26, 120–127.
13. Jensen, J., Hyllner, J., Bj€orquist, P. (2009) Human embryonic stem cell tech-
nology and drug discovery. J. Cell Physiol. 219, 513–519.
14. Str€om, S., Inzunza, J., Grinnemo, K.H., Holmberg, K., Matalainen, E.,
Str€omberg, A.M., Blennow, E., Hovatta, O. (2007) Mechanical isolation of inner
cellmass is effective in derivation of new human embryonic stem cell lines.Hum.
Reprod. 22, 3051–3058.
15. Chang, K.H., Zandstra, P.W. (2004) Quantitative screening of embryonic stem
cell differentiation: endoderm formation as a model. Biotechnol. Bioeng. 88,
287–298.
16. Zeilinger, K., et al. (2002) Three-dimensional co-culture of primary human liver
cells in bioreactors for in vitro drug studies: effects of the initial cell quality on
the long-term maintenance of hepatocyte-specific functions. Altern. Lab. Anim.
30, 525–538.
17. Lee, P.J., Hung, P.J., Lee, L.P. (2007) An artificial sinusoid with a microfluidic
endothelial-like barrier for primary hepatocyte culture. Biotechnol. Bioeng. 97,
1340–1346.
18. Lee, P.J., Hung, P.J., Rao, V.M., Lee, L.P. (2006) Nanoliter scale microbioreactor
array for quantitative cell biology. Biotechnol. Bioeng. 94, 5–14.
19. Toh, Y.C., Lim, T.C., Tai, D., Xiao, G., van Noort, D., Yu, H. (2009) A
microfluidic 3D hepatocyte chip for drug toxicity testing. Lab Chip 9,
2026–2035.
20. King, J.A., Miller, W.M. (2007) Bioreactor development for stem cell expansion
and controlled differentiation. Curr. Opin. Chem. Biol. 11, 394–398.
21. Narkilahti, S., Rajala, K., Pihlajam€aki, H., Suuronen, R., Hovatta, O., Skottman,
H. (2007)Monitoring and analysis of dynamic growth of human embryonic stem
cells, comparison of automated instrumentation and conventional culturing
methods. Biomed. Eng. Online 6(11), 1–8.
22. The Automation Partnership, Cambridge, UK http://www.automationpartner-
ship.com/
23. Drake, R.A.L., Oakeshott, R.B.S. (2005) Smart cell culture, European Patent
Application EP 1598415.
24. Thomas, R.J., Anderson, D., Chandra, A., Smith, N.M., Young, L.E., Williams,
D., Denning, C. (2009) Automated, scalable culture of human embryonic stem
cells in feeder-free conditions. Biotechnol. Bioeng. 102, 1636–1644.
25. Mandenius, C.F., Derel€ov, M., Detterfelt, J., Bj€orkman, M. (2007) Process
analytical technology and design science. Eur. Pharm. Rev. 12, 74–80.
REFERENCES 227

12Bioartificial Organ-Simulating Devices
This chapter describes the application of the biomechatronic design
methodology to bioartificial devices for simulating organs in a body, prefer-
ably the human organs. First, the development of these devices during the past
20 years is summarized (Section 12.1). Then, the design methodology is
applied to the devices for various applications (Section 12.2). Finally, the
device that has attracted most attention, the bioartificial liver, is analyzed
in detail (Section 12.3). General conclusions are drawn on how the bio-
mechatronic design methods and tools best can support the design of new
organ-simulating devices.
12.1 INTRODUCTION
What is the difference between bioartificial organ devices and the cellular
bioreactors described in Chapter 9? The striking difference is, without doubt,
that the bioartificial organ devices, often also referred to as bioreactor systems,
have quite another purpose of use: instead of producing materials, such as
small molecules, proteins, or cells, the artificial organ devices shall replace a
living human or animal organ by a mimic that sufficiently recreates the
essential functions of the natural organ.
Biomechatronic Design in Biotechnology: A Methodology for Development ofBiotechnological Products, First Edition. Carl-Fredrik Mandenius and Mats Bjorkman.� 2011 John Wiley & Sons, Inc. Published 2011 by John Wiley & Sons, Inc.
229
However, the bioartificial organ devices must not necessarily recreate all of
the functions of the natural organ; only those that are needed for the particular
applications they are aimed for, for example, replacement therapy, toxicity
testing, or extracorporal support.
So far, the majority of the bioartificial organ devices are mimics of the liver
and the essential functions of the liver [1–3], while mimics of the kidney
and other vital organs have not yet been successfully applied to the same
extent [4,5].
One of the most advanced applications, so far, is the use of bioartificial
human liver devices in transplantation surgery where it supports the human
liver functions for periods of up to 1 day. Thismay sound as a relativelymodest
operation time for a bioreactor, but then one must bear in mind that the
requirements for its use in clinical practice are significantlymore stringent than
most other applications [6]. For other bioartificial liver bioreactor applications,
for example in toxicity testing, the critical hepatotoxicity pathways are
possible to maintain for periods of up to 60 days in scaled down devices [7].
In Figure 12.1, six bioartificial organ-simulating devices for liver or kidney
cells are shown that illuminate the variation of design solutions that have
unfolded during the past years.
One of these systems, a bioartificial liver support device developed at
Charit�e Universit€atsmedizin Berlin, has successfully been applied in trans-
plantation surgery [6]. The system is commercially available since 2000 (Stem
Cell Systems GmbH, Berlin, Germany).
Most of the bioartificial liver systems can be categorized as small-scale liver
prototypes with slightly varying designs based on multicompartment con-
cepts. Several of these have been developed by Bader and coworkers at the
University of Leipzig [8,9]. These multicompartment bioreactors have also
been demonstrated with other organ tissues [9].
Microscale mimics of liver [10,11] and kidney [12,13] have, so far, only
been realized in proof-of-concept research. Especially, the integrated “lab-on-
a-chip” configurations succeed in recreating many of the intricate micro-
structures of the human liver due to the ability of the chips to miniaturize
channels to dimensions on the scale of capillaries [10].
The recreation of the 3D architecture of the organ tissue with various
scaffolds has become a key element of the design, which has been elaborated
by many research groups [14]. Different biomaterials have been investigated
such as alginate hydrogels, biocompatible organic polymers, and various
natural materials. The driving design principle has been to access a porous
microstructure that imitates typical dimensions and distances in the tissue;
between different cell types, between ducts and capillaries, or other cellular
structures that form the tissue. Recently, nanobiotechnology and microlitho-
graphic techniques have been exploited (cf. Figure 12.4).
230 BIOARTIFICIAL ORGAN-SIMULATING DEVICES
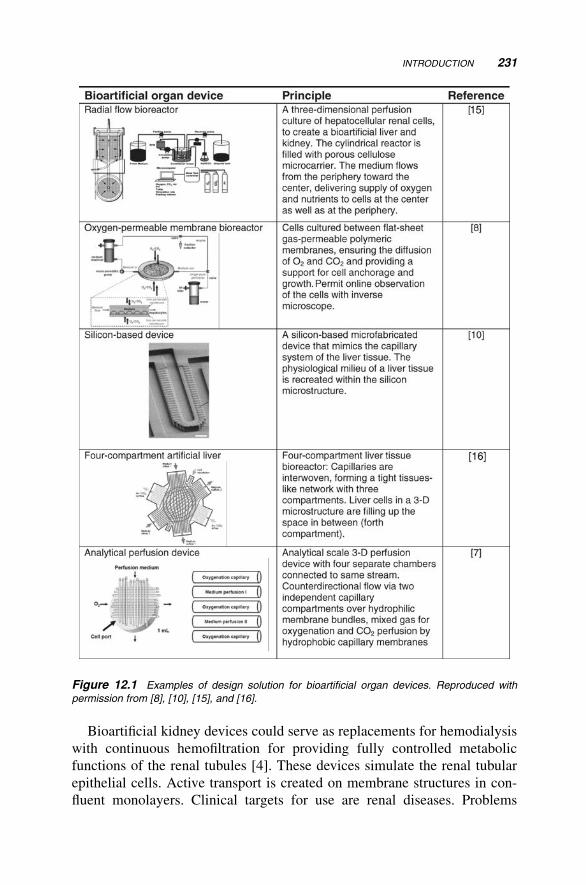
Bioartificial kidney devices could serve as replacements for hemodialysis
with continuous hemofiltration for providing fully controlled metabolic
functions of the renal tubules [4]. These devices simulate the renal tubular
epithelial cells. Active transport is created on membrane structures in con-
fluent monolayers. Clinical targets for use are renal diseases. Problems
Figure 12.1 Examples of design solution for bioartificial organ devices. Reproduced with
permission from [8], [10], [15], and [16].
INTRODUCTION 231
encountered for good functional properties of the devices are antithrombo-
genic properties, and transport capacities of the tubular system. Connections
of hemofilter devices with different membranes have been tested in various
setups with a varying degree of success [17–19]. Attempts to realize devices
with renal stem cells/progenitor cells with human origin and with higher
relevance are new avenues under investigation [13].
In this chapter, we show how the biomechatronic design methodology can
be applied to human organ-simulating devices, with preference for the human
liver. Two examples of existing designs are analyzed in detail: a four-
compartment bioartificial liver bioreactor (from the Charit�e Universit€atsme-
dizinBerlin,Germany) [1,3,6] and a perfusion bioreactor for primary liver cell
(from the University of Leipzig, Germany) [20,21].
12.2 DESIGN OF BIOARTIFICIAL ORGAN-SIMULATIONDEVICES
The following section describes the basic requirements for the organ-
simulating devices using the biomechatronic design methodology and design
tools as outlined in Chapter 4. The main purpose here is to set the constraints
for the design issues and relate these to the biological and medical
expectations.
12.2.1 Needs and Specifications
As described in the Section 12.1, bioartificial organ-simulating devices are a
heterogeneous group of constructions with a wide variation in requirements.
Especially in this case, it seems motivated to detail the needs and target
specifications of the design.
The purpose of the design and the ensuing product development for an
artificial organ device must begin with the formulation of a clear mission. For
example, this could be to develop a bioartificial organ device for clinical
applications or to develop a bioartificial liver device for testing pharmaco-
logical effects of a new drug in vitro.
The needs of the users may then include specific needs related to critical
conditions for surgery, or specific critical needs for pharmacological assess-
ments of the drug, such as safety and efficacy aspects, in vitro toxicity testing
such as acute and repeated toxicity, or organ-specific toxicity.
For liver devices, several needs are common for all users while some are
specifically related to the application [22–27]. Drug testing, for example,
requires multiple tests and high reproducibility and repeated toxicity testing
requires homeostasis of cells. Maintaining functional hepatic cells with the
232 BIOARTIFICIAL ORGAN-SIMULATING DEVICES
desired phenotype is a particularly important feature for drug evaluation and a
necessity for meeting regulatory requirements.
The varying needs may generate the question if a bioartificial organ
platform product should be designed that could meet all three main applica-
tions, or, if instead three separate stand-alone devices should be designed.
The different user needs are provided with target specifications. In the List
of Target Specifications in Table 12.1, the target specifications are either
qualitative metrics with a discrete value or quantitativemetrics with a discrete
value, an upper or a lower limit, or a defined range [28].
Identification of appropriate metrics depends on application and organ and
different potential users have at this stage of development diverse opinions
about what are the necessary levels.
Sometimes, the target values are optimistic wishes rather than realistic
goals. This is especially true for some of the hepatocyte properties, such as the
longevity of the liver cells’ homeostasis.
The List of Target Specifications given in Table 12.1 sets the values that we
will use in the subsequent conceptual analysis. It is based on experience from
our own data and on literature studies. However, every new design task
requires a new set of values.
From the target specifications, several conceptual design solutions can
more or less directly be generated. Several of these have already been realized
previously. The Concept Generation Chart of Figure 12.2 depicts six such
concepts. These are chosen to illuminate characteristic design concepts that
exhibit diverse technical solutions that are stringently different in design in
order to show the methodology (Figure 12.2). Thus, it should be realized thatseveral other conceptual designs also could be generated. It should also be
noted that the concept generation should not bring ready design architectures
showing the physical components of the concept. Instead, the functions should
be exposed allowing further elaboration and combination.
The upper part of Figure 12.2 shows a Basic Concept Component Chart
where the functions of the organ bioreactor are described from itsmost generic
components. These shall be possible to permute or recombine in a number of
inventive configurations. The lower part of the figure, the Permutation Chart,
shows the six alternatives that were generated.
Alternative A is a concept based on more or less a conventional lab-scale
bioreactor with the hepatocytes grown in particulate 3D scaffold structures.
The media (nutrients, gases) are perfused through the reactor countercurrent
and the environment in the reactor is controlled as in a lab-scale reactor
with sensors for pH, dissolved oxygen, and temperature. Previous studies
have demonstrated similar devices based on this concept using, for example,
porous microcarriers [29] or cage-like containers [15] used as support for
hepatocyte cultures.
DESIGN OF BIOARTIFICIAL ORGAN-SIMULATION DEVICES 233
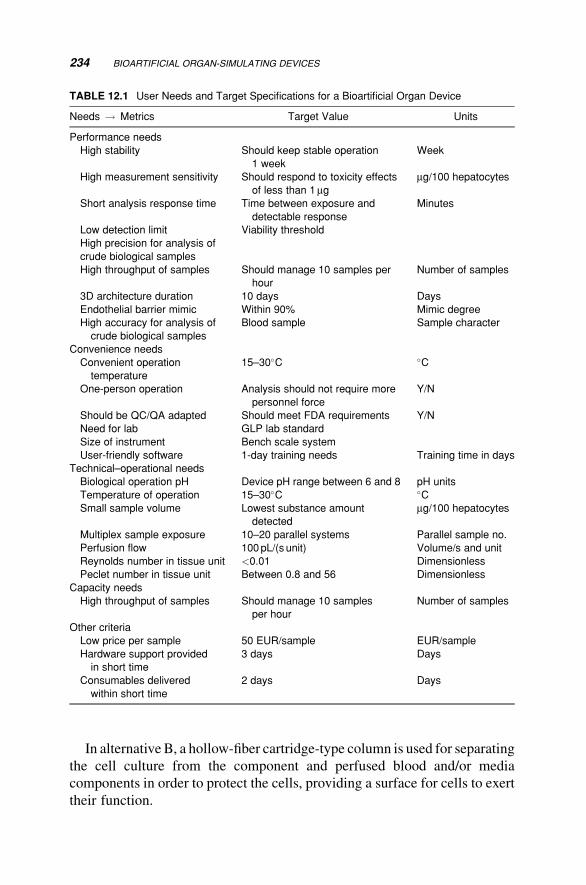
In alternative B, a hollow-fiber cartridge-type column is used for separating
the cell culture from the component and perfused blood and/or media
components in order to protect the cells, providing a surface for cells to exert
their function.
TABLE 12.1 User Needs and Target Specifications for a Bioartificial Organ Device
Needs ! Metrics Target Value Units
Performance needs
High stability Should keep stable operation
1 week
Week
High measurement sensitivity Should respond to toxicity effects
of less than 1mgmg/100 hepatocytes
Short analysis response time Time between exposure and
detectable response
Minutes
Low detection limit Viability threshold
High precision for analysis of
crude biological samples
High throughput of samples Should manage 10 samples per
hour
Number of samples
3D architecture duration 10 days Days
Endothelial barrier mimic Within 90% Mimic degree
High accuracy for analysis of
crude biological samples
Blood sample Sample character
Convenience needs
Convenient operation
temperature
15–30�C �C
One-person operation Analysis should not require more
personnel force
Y/N
Should be QC/QA adapted Should meet FDA requirements Y/N
Need for lab GLP lab standard
Size of instrument Bench scale system
User-friendly software 1-day training needs Training time in days
Technical–operational needs
Biological operation pH Device pH range between 6 and 8 pH units
Temperature of operation 15–30�C �CSmall sample volume Lowest substance amount
detected
mg/100 hepatocytes
Multiplex sample exposure 10–20 parallel systems Parallel sample no.
Perfusion flow 100pL/(s unit) Volume/s and unit
Reynolds number in tissue unit <0.01 Dimensionless
Peclet number in tissue unit Between 0.8 and 56 Dimensionless
Capacity needs
High throughput of samples Should manage 10 samples
per hour
Number of samples
Other criteria
Low price per sample 50 EUR/sample EUR/sample
Hardware support provided
in short time
3 days Days
Consumables delivered
within short time
2 days Days
234 BIOARTIFICIAL ORGAN-SIMULATING DEVICES
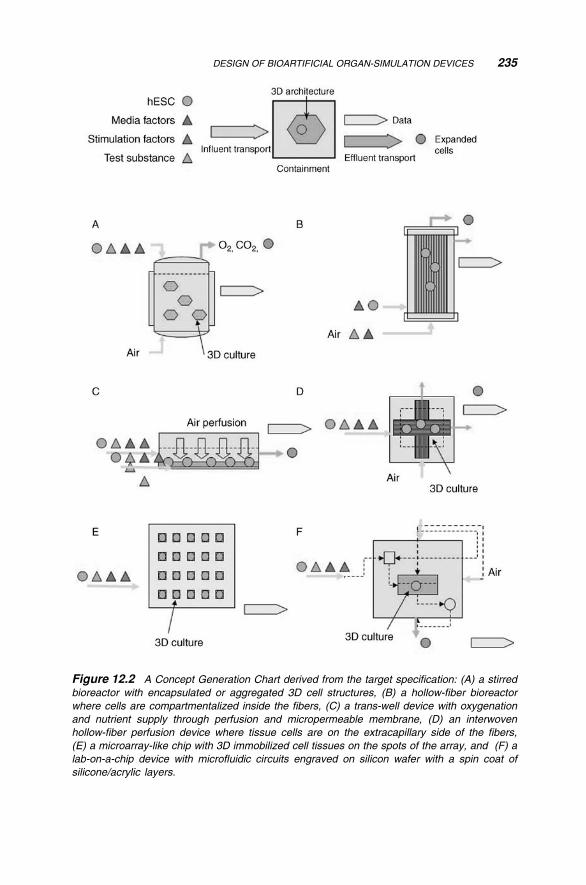
Figure 12.2 A Concept Generation Chart derived from the target specification: (A) a stirred
bioreactor with encapsulated or aggregated 3D cell structures, (B) a hollow-fiber bioreactor
where cells are compartmentalized inside the fibers, (C) a trans-well device with oxygenation
and nutrient supply through perfusion and micropermeable membrane, (D) an interwoven
hollow-fiber perfusion device where tissue cells are on the extracapillary side of the fibers,
(E) a microarray-like chip with 3D immobilized cell tissues on the spots of the array, and (F) a
lab-on-a-chip device with microfluidic circuits engraved on silicon wafer with a spin coat of
silicone/acrylic layers.
DESIGN OF BIOARTIFICIAL ORGAN-SIMULATION DEVICES 235
In alternative C, amuch simpler device is generated by letting cells grow on
amembrane and be oxygenatedwhile small openvessels contain the liver cells
and nutrients, all enclosed in a controlled environment (a trans-well). For
example, the container could be amicroplatewith a gas-permeablemembrane
at the bottom of each well and placed an incubator as demonstrated by
Schmitmeier et al. [30].
The hollow-fiber concept is furthered into the alternative D where a
multicompartment reactor device with the gas and liquid phase are separated
independent of cell hepatocyte culture. Awell-known device designed based
on this concept is the Charit�e four-compartment bioreactor [1,3].
The alternative E concept is an array device where liver cells with
appropriate functionality are dispersed on separated small areas and perfused
with components as addressed by microfluidics. By this, the required func-
tions for the testing purpose are achieved. In this system, the organ cells could
be engineered to express functional genes relevant for the application.
If all functional components can be housed in the same block of suitable
materials, the separate functional parts abovemay be realized in amicrofluidic
plastic unit that then can be significantly reduced in size (alternativeF). Recent
work demonstrates that this is possible and allows quite small dimensions and
ability to handle hepatocyte cultures for testing drugs [11]. The design concept
can be refined into a sandwich-membrane reactor where nutrients are perfused
by pumps as recently demonstrated [30].
A separate cell-containing unit with the purpose of supplying a user with
ready-to-use cells in a single-use unit is shown in several of the concepts in
Figure 12.2. The single-use unit is docked with a permanent unit with all
necessary control functions.
Thus, the examples in the figure have quite different capacities and different
construction materials are used. For example, Example A is a conventional
glass-type bioreactor similar to those described in Chapter 9. Examples B, C,
and D are based on membrane operations. Examples E and F make use of soft
lithography in organic polymer materials.
12.2.2 Evaluation of the Design Concepts
Based on the target specifications, the six concepts are screened (Table 12.2)
and scored (Table 12.3). A selection of the target specifications from
Table 12.1 are accounted for in Table 12.2 where the six concepts are
compared at three levels (� ; 0; þ ). The matrix screening scores of the
concepts single out the Perfusion and Lab-chip concepts. The scoring also
indicates that the microarray concept is relatively acceptable. These three
concepts are therefore chosen for further testing. It should be stressed that at
this stage the scoring is mostly based on literature data and few experimental
236 BIOARTIFICIAL ORGAN-SIMULATING DEVICES
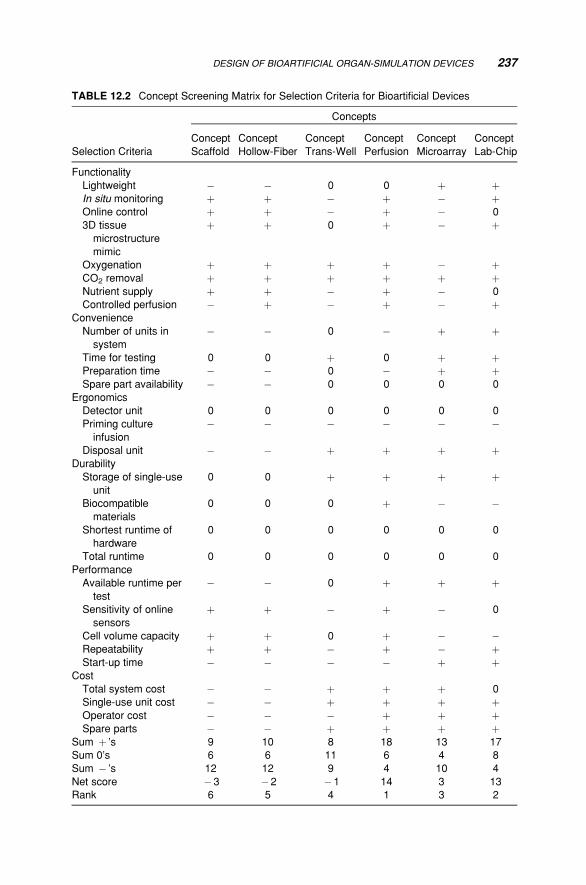
TABLE 12.2 Concept Screening Matrix for Selection Criteria for Bioartificial Devices
Concepts
Selection Criteria
Concept
Scaffold
Concept
Hollow-Fiber
Concept
Trans-Well
Concept
Perfusion
Concept
Microarray
Concept
Lab-Chip
Functionality
Lightweight � � 0 0 þ þIn situ monitoring þ þ � þ � þOnline control þ þ � þ � 0
3D tissue
microstructure
mimic
þ þ 0 þ � þ
Oxygenation þ þ þ þ � þCO2 removal þ þ þ þ þ þNutrient supply þ þ � þ � 0
Controlled perfusion � þ � þ � þConvenience
Number of units in
system
� � 0 � þ þ
Time for testing 0 0 þ 0 þ þPreparation time � � 0 � þ þSpare part availability � � 0 0 0 0
Ergonomics
Detector unit 0 0 0 0 0 0
Priming culture
infusion
� � � � � �
Disposal unit � � þ þ þ þDurability
Storage of single-use
unit
0 0 þ þ þ þ
Biocompatible
materials
0 0 0 þ � �
Shortest runtime of
hardware
0 0 0 0 0 0
Total runtime 0 0 0 0 0 0
Performance
Available runtime per
test
� � 0 þ þ þ
Sensitivity of online
sensors
þ þ � þ � 0
Cell volume capacity þ þ 0 þ � �Repeatability þ þ � þ � þStart-up time � � � � þ þ
Cost
Total system cost � � þ þ þ 0
Single-use unit cost � � þ þ þ þOperator cost � � � þ þ þSpare parts � � þ þ þ þ
Sum þ ’s 9 10 8 18 13 17
Sum 0’s 6 6 11 6 4 8
Sum � ’s 12 12 9 4 10 4
Net score �3 �2 �1 14 3 13
Rank 6 5 4 1 3 2
DESIGN OF BIOARTIFICIAL ORGAN-SIMULATION DEVICES 237
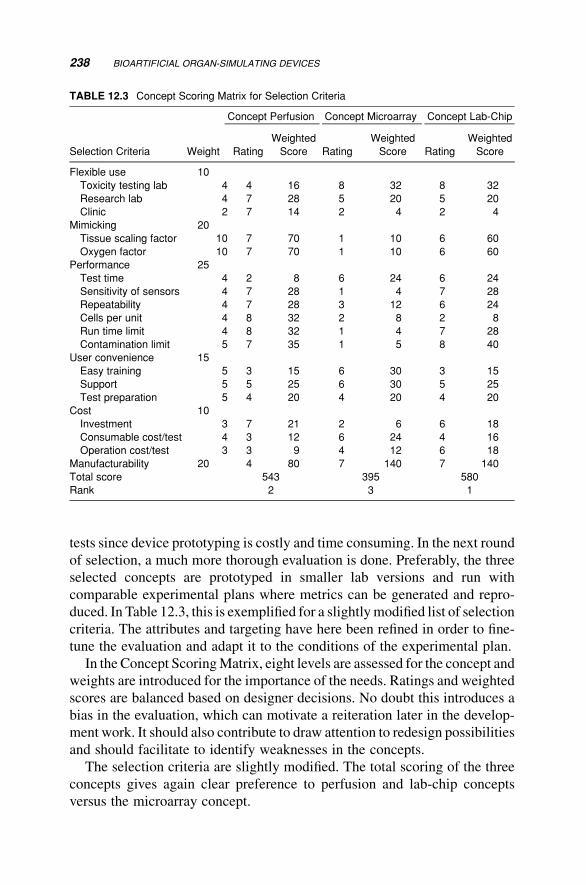
tests since device prototyping is costly and time consuming. In the next round
of selection, a much more thorough evaluation is done. Preferably, the three
selected concepts are prototyped in smaller lab versions and run with
comparable experimental plans where metrics can be generated and repro-
duced. In Table 12.3, this is exemplified for a slightlymodified list of selection
criteria. The attributes and targeting have here been refined in order to fine-
tune the evaluation and adapt it to the conditions of the experimental plan.
In the Concept ScoringMatrix, eight levels are assessed for the concept and
weights are introduced for the importance of the needs. Ratings and weighted
scores are balanced based on designer decisions. No doubt this introduces a
bias in the evaluation, which can motivate a reiteration later in the develop-
ment work. It should also contribute to draw attention to redesign possibilities
and should facilitate to identify weaknesses in the concepts.
The selection criteria are slightly modified. The total scoring of the three
concepts gives again clear preference to perfusion and lab-chip concepts
versus the microarray concept.
TABLE 12.3 Concept Scoring Matrix for Selection Criteria
Concept Perfusion Concept Microarray Concept Lab-Chip
Selection Criteria Weight Rating
Weighted
Score Rating
Weighted
Score Rating
Weighted
Score
Flexible use 10
Toxicity testing lab 4 4 16 8 32 8 32
Research lab 4 7 28 5 20 5 20
Clinic 2 7 14 2 4 2 4
Mimicking 20
Tissue scaling factor 10 7 70 1 10 6 60
Oxygen factor 10 7 70 1 10 6 60
Performance 25
Test time 4 2 8 6 24 6 24
Sensitivity of sensors 4 7 28 1 4 7 28
Repeatability 4 7 28 3 12 6 24
Cells per unit 4 8 32 2 8 2 8
Run time limit 4 8 32 1 4 7 28
Contamination limit 5 7 35 1 5 8 40
User convenience 15
Easy training 5 3 15 6 30 3 15
Support 5 5 25 6 30 5 25
Test preparation 5 4 20 4 20 4 20
Cost 10
Investment 3 7 21 2 6 6 18
Consumable cost/test 4 3 12 6 24 4 16
Operation cost/test 3 3 9 4 12 6 18
Manufacturability 20 4 80 7 140 7 140
Total score 543 395 580
Rank 2 3 1
238 BIOARTIFICIAL ORGAN-SIMULATING DEVICES
Thus, these two concepts are further developed, prototyped, and analyzed
with Hubka–Eder mapping.
12.3 ANALYSIS OF BIOARTIFICIAL LIVER SYSTEMS
Two of the highlighted design solutions above are here further analyzed by
applying a Hubka–Eder mapping [31,32].
The transformation process with in- and out-transport is consequently
restricted to the influent blood/nutrients/test compounds, gasses the conver-
sions carried out by the hepatocytes/coculture and the contacting transfer of
these parts.
Also included in the TrP process is the generation of signals, physical (e.g.,
heat, vision), chemical (e.g., metabolites), or biological (e.g., protein release).
The purpose of the model, to analyze the interaction between the systems
and the parts thereof, follows.
12.3.1 Biological Systems
The functionalities of the biological systems (SBioS) of the device vary
considerably depending on application. If toxicity testing is the purpose, the
desired functionality of the cells is to carry out by the metabolic conversions
that the cell type is specialized in. However, for the two conceptual designs
discussed here, the actingSBioS have the same functional properties. Thus, the
same description of the SBioS becomes necessary [33].
Especially for the liver, this is thoroughly described in the toxicology
science. The phase I and II enzymes for conversion of xenobiotic compounds
are typically composed of three to eight enzymatic steps. Transferases
conjunct the xenobiotics to adducts and transporter proteins excrete these
from the cell. This chain of enzymatic steps exerts the functionality. The
expression mechanisms for creating the functionality are both partly known
and partly unknown. Control of the liver functionality is possible through
epigenetic factors and other differentiation factors.
Cell–cell communication is believed to have a key role in the development
of the functional state of the liver cell. Cocultures of liver cells that balance
phenotypic cells favor this development. These cocultures require a scaffold
that can recreate the cellular tissue structure.
Thus, the SBioS of a bioartificial organ-simulating device of a human liver
should have these functional capacities: the SBioS should provide phenotypichepatocytes (BioS-1), allow propagation on cocultured feeder cells (BioS-7),
exhibit a 3Darchitecture realized by a biocompatiblemicrostructure (BioS-7),
and should provide a biochemical microenvironment that furnishes the
ANALYSIS OF BIOARTIFICIAL LIVER SYSTEMS 239
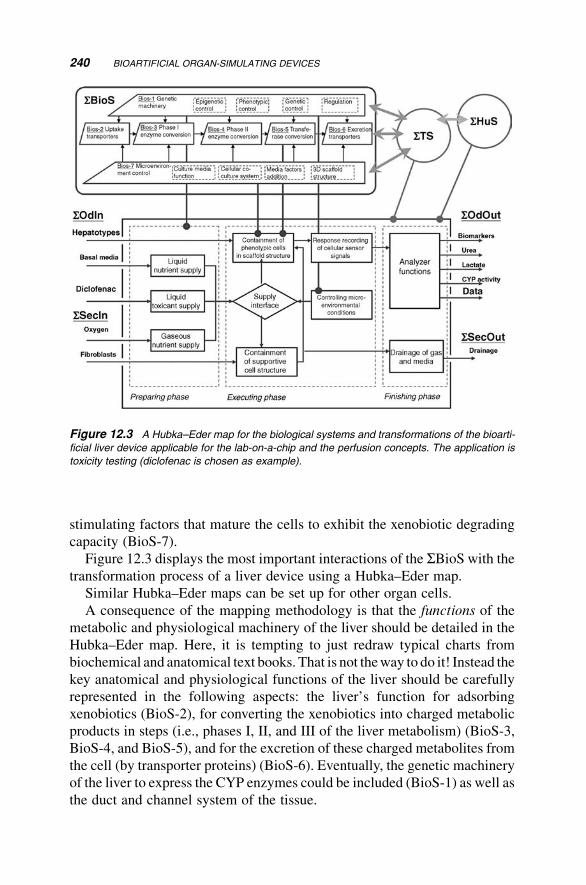
stimulating factors that mature the cells to exhibit the xenobiotic degrading
capacity (BioS-7).
Figure 12.3 displays the most important interactions of the SBioS with the
transformation process of a liver device using a Hubka–Eder map.
Similar Hubka–Eder maps can be set up for other organ cells.
A consequence of the mapping methodology is that the functions of the
metabolic and physiological machinery of the liver should be detailed in the
Hubka–Eder map. Here, it is tempting to just redraw typical charts from
biochemical and anatomical text books. That is not theway to do it! Instead the
key anatomical and physiological functions of the liver should be carefully
represented in the following aspects: the liver’s function for adsorbing
xenobiotics (BioS-2), for converting the xenobiotics into charged metabolic
products in steps (i.e., phases I, II, and III of the liver metabolism) (BioS-3,
BioS-4, and BioS-5), and for the excretion of these charged metabolites from
the cell (by transporter proteins) (BioS-6). Eventually, the genetic machinery
of the liver to express the CYP enzymes could be included (BioS-1) as well as
the duct and channel system of the tissue.
Figure 12.3 A Hubka–Eder map for the biological systems and transformations of the bioarti-
ficial liver device applicable for the lab-on-a-chip and the perfusion concepts. The application is
toxicity testing (diclofenac is chosen as example).
240 BIOARTIFICIAL ORGAN-SIMULATING DEVICES
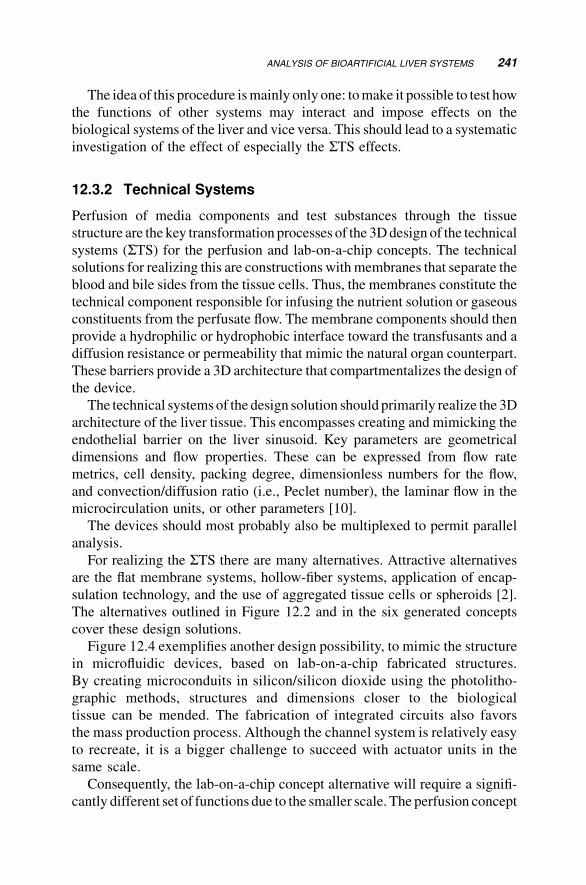
The idea of this procedure ismainly only one: tomake it possible to test how
the functions of other systems may interact and impose effects on the
biological systems of the liver and vice versa. This should lead to a systematic
investigation of the effect of especially the STS effects.
12.3.2 Technical Systems
Perfusion of media components and test substances through the tissue
structure are the key transformation processes of the 3Ddesign of the technical
systems (STS) for the perfusion and lab-on-a-chip concepts. The technical
solutions for realizing this are constructions withmembranes that separate the
blood and bile sides from the tissue cells. Thus, the membranes constitute the
technical component responsible for infusing the nutrient solution or gaseous
constituents from the perfusate flow. The membrane components should then
provide a hydrophilic or hydrophobic interface toward the transfusants and a
diffusion resistance or permeability that mimic the natural organ counterpart.
These barriers provide a 3D architecture that compartmentalizes the design of
the device.
The technical systems of the design solution should primarily realize the 3D
architecture of the liver tissue. This encompasses creating and mimicking the
endothelial barrier on the liver sinusoid. Key parameters are geometrical
dimensions and flow properties. These can be expressed from flow rate
metrics, cell density, packing degree, dimensionless numbers for the flow,
and convection/diffusion ratio (i.e., Peclet number), the laminar flow in the
microcirculation units, or other parameters [10].
The devices should most probably also be multiplexed to permit parallel
analysis.
For realizing the STS there are many alternatives. Attractive alternatives
are the flat membrane systems, hollow-fiber systems, application of encap-
sulation technology, and the use of aggregated tissue cells or spheroids [2].
The alternatives outlined in Figure 12.2 and in the six generated concepts
cover these design solutions.
Figure 12.4 exemplifies another design possibility, to mimic the structure
in microfluidic devices, based on lab-on-a-chip fabricated structures.
By creating microconduits in silicon/silicon dioxide using the photolitho-
graphic methods, structures and dimensions closer to the biological
tissue can be mended. The fabrication of integrated circuits also favors
the mass production process. Although the channel system is relatively easy
to recreate, it is a bigger challenge to succeed with actuator units in the
same scale.
Consequently, the lab-on-a-chip concept alternative will require a signifi-
cantly different set of functions due to the smaller scale. The perfusion concept
ANALYSIS OF BIOARTIFICIAL LIVER SYSTEMS 241
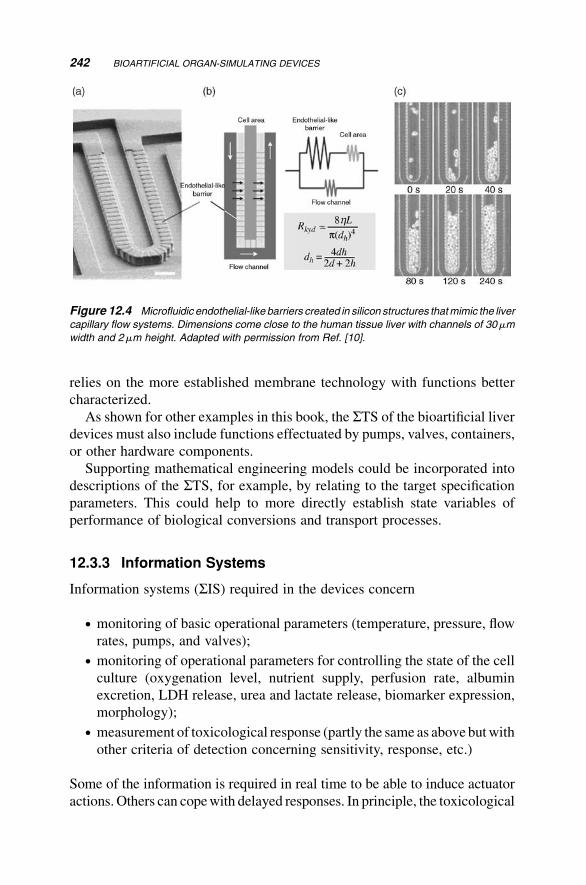
relies on the more established membrane technology with functions better
characterized.
As shown for other examples in this book, the STS of the bioartificial liver
devices must also include functions effectuated by pumps, valves, containers,
or other hardware components.
Supporting mathematical engineering models could be incorporated into
descriptions of the STS, for example, by relating to the target specification
parameters. This could help to more directly establish state variables of
performance of biological conversions and transport processes.
12.3.3 Information Systems
Information systems (SIS) required in the devices concern
. monitoring of basic operational parameters (temperature, pressure, flow
rates, pumps, and valves);
. monitoring of operational parameters for controlling the state of the cell
culture (oxygenation level, nutrient supply, perfusion rate, albumin
excretion, LDH release, urea and lactate release, biomarker expression,
morphology);
. measurement of toxicological response (partly the same as abovebutwith
other criteria of detection concerning sensitivity, response, etc.)
Some of the information is required in real time to be able to induce actuator
actions. Others can copewith delayed responses. In principle, the toxicological
Figure 12.4 Microfluidic endothelial-like barriers created in silicon structures thatmimic the liver
capillary flow systems. Dimensions come close to the human tissue liver with channels of 30mm
width and 2mm height. Adapted with permission from Ref. [10].
242 BIOARTIFICIAL ORGAN-SIMULATING DEVICES
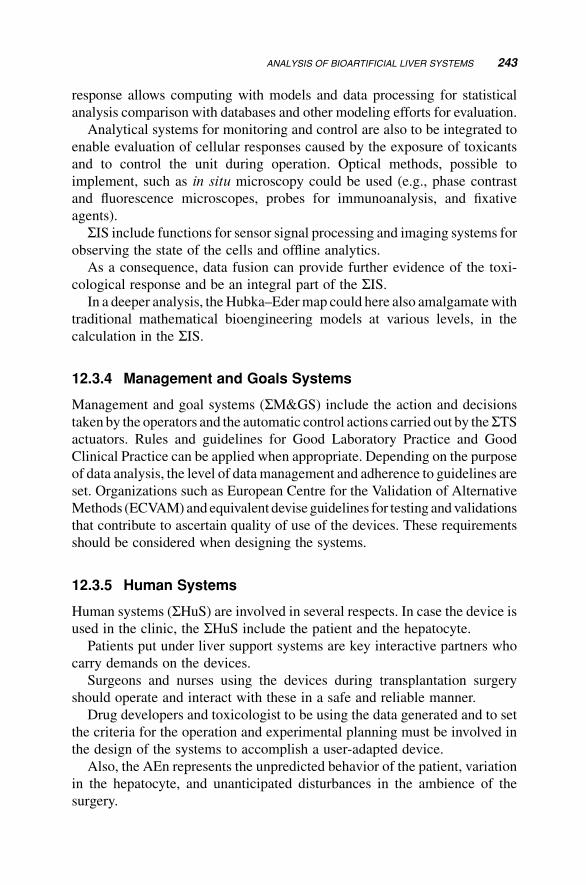
response allows computing with models and data processing for statistical
analysis comparison with databases and other modeling efforts for evaluation.
Analytical systems for monitoring and control are also to be integrated to
enable evaluation of cellular responses caused by the exposure of toxicants
and to control the unit during operation. Optical methods, possible to
implement, such as in situ microscopy could be used (e.g., phase contrast
and fluorescence microscopes, probes for immunoanalysis, and fixative
agents).
SIS include functions for sensor signal processing and imaging systems for
observing the state of the cells and offline analytics.
As a consequence, data fusion can provide further evidence of the toxi-
cological response and be an integral part of the SIS.In a deeper analysis, theHubka–Edermap could here also amalgamatewith
traditional mathematical bioengineering models at various levels, in the
calculation in the SIS.
12.3.4 Management and Goals Systems
Management and goal systems (SM&GS) include the action and decisions
taken by the operators and the automatic control actions carried out by theSTSactuators. Rules and guidelines for Good Laboratory Practice and Good
Clinical Practice can be applied when appropriate. Depending on the purpose
of data analysis, the level of datamanagement and adherence to guidelines are
set. Organizations such as European Centre for the Validation of Alternative
Methods (ECVAM)andequivalent deviseguidelines for testing andvalidations
that contribute to ascertain quality of use of the devices. These requirements
should be considered when designing the systems.
12.3.5 Human Systems
Human systems (SHuS) are involved in several respects. In case the device isused in the clinic, the SHuS include the patient and the hepatocyte.
Patients put under liver support systems are key interactive partners who
carry demands on the devices.
Surgeons and nurses using the devices during transplantation surgery
should operate and interact with these in a safe and reliable manner.
Drug developers and toxicologist to be using the data generated and to set
the criteria for the operation and experimental planning must be involved in
the design of the systems to accomplish a user-adapted device.
Also, the AEn represents the unpredicted behavior of the patient, variation
in the hepatocyte, and unanticipated disturbances in the ambience of the
surgery.
ANALYSIS OF BIOARTIFICIAL LIVER SYSTEMS 243
Additional subdiagrams detailing SHuS as for SBioS as in Figure 10.3
would further improve and expand the analysis with additional refinements
and testing of user preferences. With this description of the system functions,
an anatomical depiction could be done.
12.4 CONCLUSIONS
In this chapter, we have applied the biomechatronic design methodology to a
more complicated biological system than in the previous chapters—to awhole
human organ, the liver. Still, the design principles are applied in the sameway.
It shows the strength and flexibility of the mechatronic design tools; they can
be applied to any engineering system with the guiding principle of describing
the functions and their interactionswith the transformations. It is applicable to
the bioartificial liver bioreactor for clinical or toxicology use, or any other
organ. For example, the working scheme can be applied similarly to human
kidney [30], cardiac cells [34], and pancreas as well as neural cell systems of
the brain and can be modeled according to the same principles.
Despite the complexity of a human organ, it is relatively simple to rearrange
the concepts into the modified established mechatronic models also for a
biomedical application. As long as the biological knowledge exists and is
accessible, it is also possible to represent it in the mechatronic models.
Two alternative product uses have beenmentioned. The analysis has shown
that the design architectures had in commonmany of the user-needs either for
clinic or in vitro toxicity testing.
A crucial discriminator for the selection of the concept is if the product
should be delivered to the customer ready for usewith cells andmedia or if the
device should be a tool with which the user itself shall provide hepatocytes or
cocultures, differentiation media, and so on, or combinations thereof. This
definitely puts different demands on the product design and its manufacture.
In the design solution, it is of value to also consider manufacturing benefits/
costs in the concept screening phase. The benefit of manufacturing in lesser
number of subunits should be evaluated and, if convenient, an architecture
with fewer steps be used.
The mechatronic methodology intends not only speed up the development
process but also increase the quality of design solution at early stage and avoid
flaws.
REFERENCES
1. Gerlach, J.C. (1996) Development of a hybrid liver support system. Int. J. Artif.
Organs 19, 645–654.
244 BIOARTIFICIAL ORGAN-SIMULATING DEVICES
2. Diekmann, S., Bader, A., Schmitmeier, S. (2006) Present and future develop-
ments in hepatic tissue engineering for liver support systems: state of the art and
future developments of hepatic cell culture techniques for the use in liver support
systems, Cytotechnology 50, 163–179.
3. Zeilinger, K., Holland, G., Sauer, I.M., Efimova, E., Kardassis, D., Obermayer,
N., Liu, M., Neuhaus, P., Gerlach, J.C. (2004) Time course of primary liver cell
reorganization in three-dimensional high-density bioreactors for extracorporeal
liver support: an immunohistochemical and ultrastructural study. Tissue Eng. 10,
1113–1124.
4. Saito, A., Aung, T., Sekiguchi, K., Sato, Y., Vu, D.M., Inagaki, M., Kanai, G.,
Tanaka, R., Suzuki, H., Kakuta, T. (2006) Status and perspective of bioartificial
kidneys. J. Artif. Organs 9, 130–135.
5. Minuth, W.W., Strehl, R., Schumacher, K. (2004) Tissue factory, conceptual
design of amodular system for the in vitro generation of functional tissues.Tissue
Eng. 10, 285–294.
6. Gerlach, J.C., Zeilinger, K., Sauer, I.M., Mieder, T., Naumann, G., Grnwald, A.,
Pless, G., Holland, G., Mas, A., Vienken, J., Neuhaus, P (2002) Extracorporeal
liver support: porcine or human cell based systems? Int. J. Artif. Organs 25,
1013–1018.
7. Schmelzer, E., Triolo, F., Turner,M.E., Thompson, R.L., Reid, L.M., Gridelli, B.,
Gerlach, J.C., Zeilinger, K. (2010) Three-dimensional perfusion bioreactor
culture supports differentiation of human fetal liver cells. Tissue Eng. Part A
16, 2007–2016.
8. De Bartolo, L., Salerno, S., Morelli, S., Giorno, L., Rende, M., Memoli, B.,
Procino, A., Andreucci, V.E., Bader, A., Drioli, E. (2006) Long-term mainte-
nance of human hepatocytes in oxygen-permeable membrane bioreactor.
Biomaterials 27, 4794–4803.
9. Vozzi, F., Heinrich, J.M., Bader,A.,Ahluwalia, A.D. (2008)Connected culture of
murine hepatocytes and HUVEC in a multicompartmental bioreactor. Tissue
Eng. Part A 14, 1–9.
10. Lee, P.J., Hung, P.J., Lee, L.P. (2007) An artificial sinusoid with a microfluidic
endothelial-like barrier for primary hepatocyte culture. Biotechnol. Bioeng. 97,
1340–1346.
11. Toh,Y.C., Lim, T.C., Tai,D.,Xiao,G., vanNoort,D.,Yu,H. (2009)Amicrofluidic
3D hepatocyte chip for drug toxicity testing. Lab Chip 9, 2026–2035.
12. Minuth, W.W., Denk, L., Hu, K. (2007) The role of polyester interstitium
and aldosterone during structural development of renal tubules in serum free
medium. Biomaterials 28, 4418–4428.
13. Minuth, W.W., Denk, L., Castrop, H. (2008) Generation of tubular superstruc-
tures by piling of renal stem/progenitor cells. Tissue Eng. Part C 14, 3–13.
14. Khademhosseini, A., Langer, R., Borenstein, J., Vacanti, J.P. (2006) Microscale
technologies for tissue engineering and biology. Proc. Natl. Acad. Sci. (USA)
103, 2480–2487.
REFERENCES 245
15. Iwahori, T., Matsuno, N., Johjima, Y., Konno, O., Akashi, I., Nakamura, Y.,
Hama, K., Iwamoto, H. (2005) Radial flow bioreactor for the creation of
bioartificial liver and kidney. Transplant. Proc. 37, 212–214.
16. Schmelzer E., Mutig K., Schrade P., Bachmann S., Gerlach J.C., Zeilinger K.
(2009) Effect of human patient plasma ex vivo treatment on gene expression and
progenitor cell activation of primary human liver cells in multi-compartment 3D
perfusion bioreactors for extra-corporeal liver support. Biotechnol. Bioeng. 103,
817–827.
17. Saito, A., Sugiura, S., Takagi, T., Ogawa, H., Minaguchi, J., Teraoka, S.,
Ota, K. (1995) Maintaining low concentration of plasma b2-microglobulin
with continuous slow hemofiltration. Nephrol. Dial. Transplant. 10 (Suppl.
3), 52–56.
18. Saito, A. (2004) Research in the development of a wearable bioartificial kidney
with a continuous hemofilter and a bioartificial tubule device using tubular
epithelial cells. Artif. Organs 28, 58–63.
19. Sato, Y, Terashima, M, Kagiwada, N, Aung, T, Inagaki, M, Kakuta, T, Saito, A.
(2005) Evaluation of proliferation and functional differentiation of LLC-PK1
cells on porous polymer membranes for the development of a bioartificial renal
tubule device. Tissue Eng. 11, 1506–1515.
20. Bader, A., Fr€uhauf, N., Zech, K., Haverich, A., Borlak, J.T. (1998) Development
of a small-scale bioreactor for drug metabolism studies maintaininng hepato-
specific functions. Xenobiotica 28, 815–825.
21. Bader, A., De Bartolo, L., Haverich, A. (2000) High level benzodiazepine
and ammonia clearance by flat membrane bioreactors with porcine liver cells.
J. Biotechnol. 81, 95–105.
22. Duke, J., Daane, E., Arizpe, J., Montufar-Solis, D. (1996) Chondrogenesis in
aggregates of embryonic limb cells grown in a rotating wall vessel. Adv. Space
Res. 17, 289–293.
23. Jensen, J., Hyllner, J., Bj€orquist, P. (2009) Human embryonic stem cell
technologies and drug discovery J. Cell. Physiol. 219, 513–519.
24. Zanzotto, A., Szita, N., Boccazzi, P., Lessard, P., Sinskey, A.J., Jensen, K.F.
(2004) Membrane-aerated microbioreactor for high-throughput bioprocessing.
Biotechnol. Bioeng. 87, 244–254.
25. Lee, P.J., Hung, P.J., Rao, V.M., Lee, L.P. (2006) Nanoliter scale microbioreactor
array for quantitative cell biology. Biotechnol. Bioeng. 94, 5–14.
26. Leclerc, E., Baudoin, R., Corlu, A., Griscom, L., Duval, J.L., Legallais, C. (2007)
Selective control of liver and kidney cells migration during organotypic cocul-
tures inside fibronectin-coated rectangular silicone microchannels. Biomaterials
28, 1820–1829.
27. Gerlach, J.C., Zeilinger, K., Patzer, J.F. (2008) Bioartificial liver systems: why,
what, whither? Regen. Med. 3, 575–595.
28. Ulrich, K.T., Eppinger, S.D. (2008) Product Design and Development, 4th
edition, McGraw-Hill, New York.
246 BIOARTIFICIAL ORGAN-SIMULATING DEVICES
29. Miranda, J.P., Rodrigues, A., Tost~oes, R.M., Zimmerman, H., Carrondo, M.J.T.,
Alves, P.M. (2010) Extending hepatocyte functionality for drug testing applica-
tions using high viscosity alginate encapsulated 3D cultures in bioreactors.
Tissue Eng. Part C Methods [Epub ahead of print].
30. Schmitmeier, S., Langsch, A., Jasmund, I., Bader, A (2006) Development and
characterization of a small-scale bioreactor based on a bioartificial hepatic
culture model for predictive pharmacological in vitro screening. Biotechnol.
Bioeng. 95, 1198–1206.
31. Hubka, V., Eder, W.E. (1988) Theory of Technical Systems, A Total Concept
Theory for Engineering Design, Springer-Verlag, Berlin.
32. Hubka, V. Eder, W.E. (1996) Design Science, Springer-Verlag, Berlin.
33. Derel€ov, M., Detterfelt, J., Bj€orkman, M., Mandenius, C.F. (2008) Engineering
design methodology for bio-mechatronic products. Biotechnol. Prog. 24,
232–244.
34. Khait, L., Hecker, L, Radnoti, D., Birla, R.K. (2008) Micro-perfusion for cardiac
tissue engineering: development of a bench-top system for the culture of primary
cardiac cells. Ann. Biomed. Eng. 36, 713–725.
REFERENCES 247

13Applications to ProcessAnalytical Technologyand Quality by Design
This chapter discusses the design of systems for process analytical technology
(PAT) and their integration into the principles of quality by design (QbD).
Thus, the chapter is different from the rest since it describes design of whole
complex systems and not artifacts in the form of products such as instruments
or apparatuses. First, a general introduction is given highlighting the strong
regulatory connections with PATand QbD (Section 13.1). Then the needs and
specifications are discussed in the light of the participating actors, that is, the
manufacturers, the regulators, the suppliers, and the customers (Section 13.2).
These needs and specifications are then further discussed from the conceptual
designmethodologyviewpoint (Section 13.3). Finally, a framework for design
methods of PAT/QbD systems for a manufacturing facility is suggested
(Sections 13.4).
13.1 PAT AND QbD CONCEPTS
The concept of PAT is described as a system for designing, analyzing,
and controling pharmaceutical manufacture through timely measurements
(i.e., during processing) of critical quality and performance attributes for
incoming and intermediate materials and of the process operation itself with
Biomechatronic Design in Biotechnology: A Methodology for Development ofBiotechnological Products, First Edition. Carl-Fredrik Mandenius and Mats Bjorkman.� 2011 John Wiley & Sons, Inc. Published 2011 by John Wiley & Sons, Inc.
249
the goal of ensuring the final product quality [1,2]. It is often understood that
“analytical technology” in PAT should be viewed in a broad sense and include
chemical, physical, microbiological, mathematical, and risk assessment
analyses conducted in an integrated manner. Thus, PAT requires significant
interscientific understanding. By this, many current and new tools must be
made available that can enable scientific, risk-managed pharmaceutical
development, manufacture, and quality assurance. These tools, when used
as a system, can provide an effective and efficient means for acquiring
information to facilitate process understanding, develop risk mitigation
strategies, attain continuous improvement, and share knowledge and other
information.
Appropriate tools to achieve this objective as stated by the United States’
Food and Drug Administration (FDA) [1] and other regulatory agencies are as
follows:
. Multivariate data acquisition and analysis.
. Modern process analyzers or process analytical chemistry.
. Process and endpoint monitoring and control.
. Continuous improvement and knowledge management.
An appropriate combination of some, or all, of these toolsmay be applicable to
a single-unit operation, or to an entire manufacturing process, and its quality
assurance. It is frequently the case that adjacent quality concepts for phar-
maceutical quality systems such as the International Conference on Harmo-
nization (ICH) guidelines are mentioned in parallel including risk analysis,
quality management schedules, testing principles, and Good Manufacturing
Practice [3–7]. These ideas, guidance, and rules should be merged with
existing, often very well-established process engineering principles emanat-
ing from basic pharmaceutical technology, chemical process engineering,
analytical chemistry, and biotechnology. This wide range of scientific and
technology know-how easily becomes overwhelming and contradictive, in
particular proving it extremely hard to efficiently overview and handle for
design tasks that have purely economical and quality-related objectives and
needs.
Figure 13.1 gives a simplified view of how PAT interacts in a pharmaceu-
tical process, versus raw material attributes (RMAs), critical process para-
meters (CPPs), and critical quality attributes (CQAs). This principle view of
PAT needs further analysis if we should be able to apprehend how to go on.
In this chapter, we suggest that the reasoning and thinking of mechatronic
design methodology could be the way to implement PATwith the current PAT
and QbD ambitions and with the main purpose of avoiding inefficient
250 APPLICATIONS TO PROCESS ANALYTICAL TECHNOLOGY AND QUALITY BY DESIGN
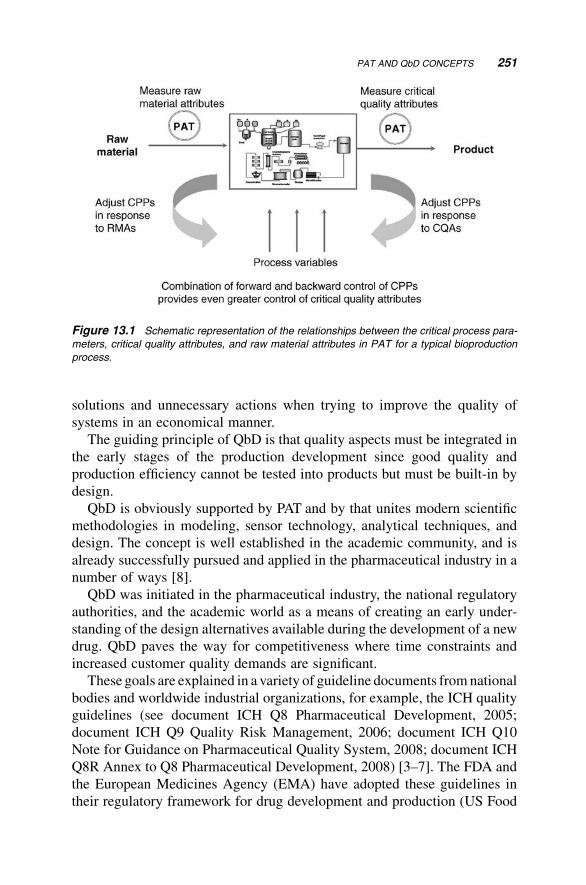
solutions and unnecessary actions when trying to improve the quality of
systems in an economical manner.
The guiding principle of QbD is that quality aspects must be integrated in
the early stages of the production development since good quality and
production efficiency cannot be tested into products but must be built-in by
design.
QbD is obviously supported by PAT and by that unites modern scientific
methodologies in modeling, sensor technology, analytical techniques, and
design. The concept is well established in the academic community, and is
already successfully pursued and applied in the pharmaceutical industry in a
number of ways [8].
QbD was initiated in the pharmaceutical industry, the national regulatory
authorities, and the academic world as a means of creating an early under-
standing of the design alternatives available during the development of a new
drug. QbD paves the way for competitiveness where time constraints and
increased customer quality demands are significant.
These goals are explained in a variety of guideline documents fromnational
bodies and worldwide industrial organizations, for example, the ICH quality
guidelines (see document ICH Q8 Pharmaceutical Development, 2005;
document ICH Q9 Quality Risk Management, 2006; document ICH Q10
Note for Guidance on Pharmaceutical Quality System, 2008; document ICH
Q8R Annex to Q8 Pharmaceutical Development, 2008) [3–7]. The FDA and
the European Medicines Agency (EMA) have adopted these guidelines in
their regulatory framework for drug development and production (US Food
Figure 13.1 Schematic representation of the relationships between the critical process para-
meters, critical quality attributes, and raw material attributes in PAT for a typical bioproduction
process.
PAT AND QbD CONCEPTS 251
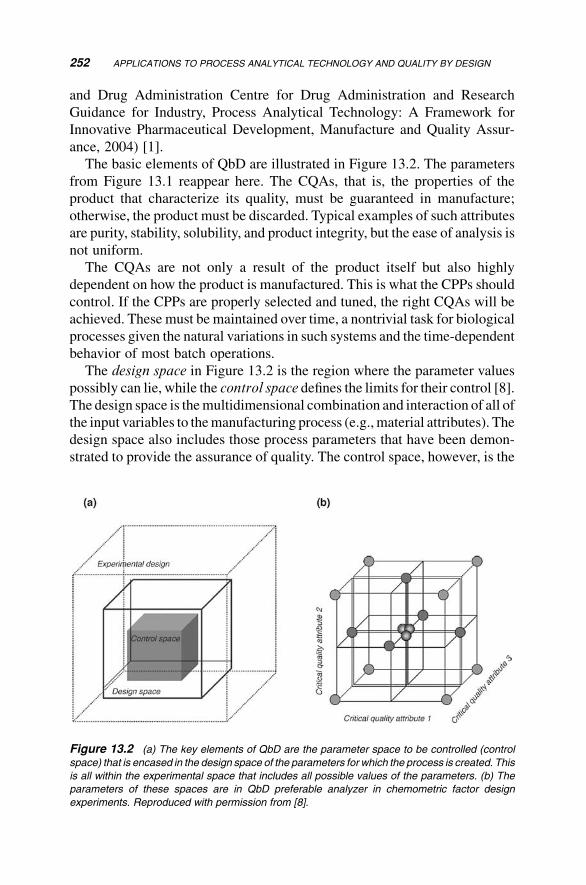
and Drug Administration Centre for Drug Administration and Research
Guidance for Industry, Process Analytical Technology: A Framework for
Innovative Pharmaceutical Development, Manufacture and Quality Assur-
ance, 2004) [1].
The basic elements of QbD are illustrated in Figure 13.2. The parameters
from Figure 13.1 reappear here. The CQAs, that is, the properties of the
product that characterize its quality, must be guaranteed in manufacture;
otherwise, the product must be discarded. Typical examples of such attributes
are purity, stability, solubility, and product integrity, but the ease of analysis is
not uniform.
The CQAs are not only a result of the product itself but also highly
dependent on how the product is manufactured. This is what the CPPs should
control. If the CPPs are properly selected and tuned, the right CQAs will be
achieved. These must be maintained over time, a nontrivial task for biological
processes given the natural variations in such systems and the time-dependent
behavior of most batch operations.
The design space in Figure 13.2 is the region where the parameter values
possibly can lie, while the control space defines the limits for their control [8].
The design space is themultidimensional combination and interaction of all of
the input variables to themanufacturing process (e.g.,material attributes). The
design space also includes those process parameters that have been demon-
strated to provide the assurance of quality. The control space, however, is the
Figure 13.2 (a) The key elements of QbD are the parameter space to be controlled (control
space) that is encased in the design space of the parameters for which the process is created. This
is all within the experimental space that includes all possible values of the parameters. (b) The
parameters of these spaces are in QbD preferable analyzer in chemometric factor design
experiments. Reproduced with permission from [8].
252 APPLICATIONS TO PROCESS ANALYTICAL TECHNOLOGY AND QUALITY BY DESIGN
subsection of the design space where the manufacturer chooses to operate
the process. To do this successfully, a detailed and time-dependent under-
standing is essential. This is where manufacturing practice and scientific
methodology meet and where science can, if applied wisely, contribute
significantly. To accomplish this, we need reliable process analytical tools.
PAT, as stated above, also covers those methods that are useful for designing,
analyzing, and controling manufacturing through timely measurements (i.e.,
during processing) of all critical quality and performance attributes of raw and
in-process materials and processes, with the goal of ensuring final product
quality. Hence, statistical methods, such as factorial design, become of
particular value.
Since the term “analytical” includes chemical, physical, microbiological,
and mathematical aspects, as well as risk analysis, the system complexity
grows significantly. With typical PAT tools that enable scientific, risk-
managed pharmaceutical development, manufacture, and quality assurance,
interactions and effects require thorough scrutiny. The biomechatronic design
methodology can provide this.
13.2 NEEDS OF THE PAT/QbD PLAYERS AND RESULTINGSPECIFICATIONS
Several different players are involved in PATand QbDwork. One group is the
regulators who have initiated the PAT/QbD procedures and through guidance
documents directed the industrial manufacturers to apply these. They also
inspect the manufacturers’ diligence of using them correctly. The manufac-
turers may find the guidelines appealing and helpful to improve the quality of
their products, but they will also take into account total costs and operational
process economy. The suppliers and vendors of PAT tools and other supportive
equipment for enabling PAT is another group of players involved with largely
parallel interests. Finally, the customers and customer organizations for drugs
would probably welcome PAT and enhancement of the criteria for its use if
prices remain stable.
The ICH guidelines, which arewritten concertedly by the drug industry and
the United States, the European and the Japanese regulatory authorities have
already set out the essential parts of what becomes the list of needs and
requirements of PAT/QbD systems.
Table 13.1 (for PAT) and Table 13.2 (forQbD) try to be a bit more distinct in
analyzing the diverse needs in terms of target specifications of the different
stakeholders rather than the guidelines. Some needs entirely concern with
technical requirements, others aremorewide or elusive and somewhat difficult
to assess and put strict metrics on.
NEEDS OF THE PAT/QbD PLAYERS AND RESULTING SPECIFICATIONS 253
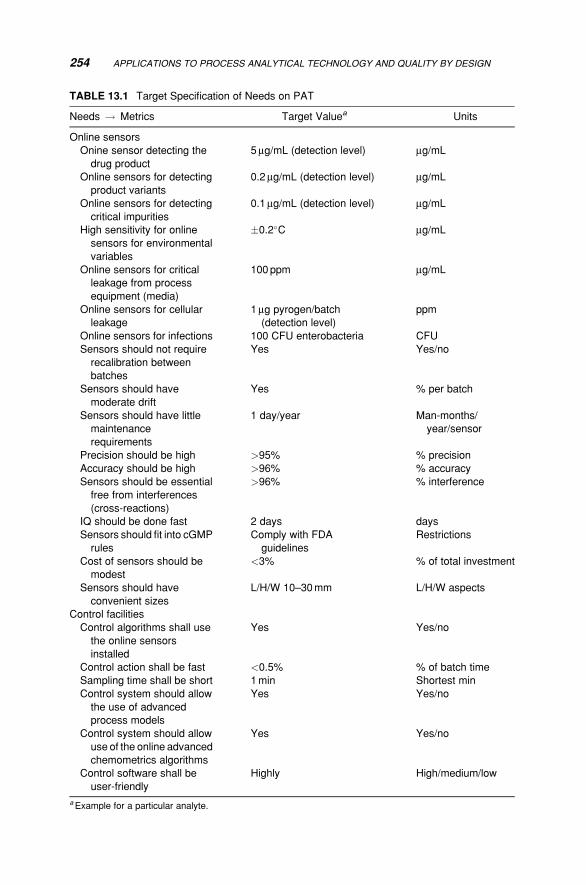
TABLE 13.1 Target Specification of Needs on PAT
Needs ! Metrics Target Valuea Units
Online sensors
Onine sensor detecting the
drug product
5mg/mL (detection level) mg/mL
Online sensors for detecting
product variants
0.2mg/mL (detection level) mg/mL
Online sensors for detecting
critical impurities
0.1mg/mL (detection level) mg/mL
High sensitivity for online
sensors for environmental
variables
�0.2�C mg/mL
Online sensors for critical
leakage from process
equipment (media)
100 ppm mg/mL
Online sensors for cellular
leakage
1mg pyrogen/batch
(detection level)
ppm
Online sensors for infections 100 CFU enterobacteria CFU
Sensors should not require
recalibration between
batches
Yes Yes/no
Sensors should have
moderate drift
Yes % per batch
Sensors should have little
maintenance
requirements
1 day/year Man-months/
year/sensor
Precision should be high >95% % precision
Accuracy should be high >96% % accuracy
Sensors should be essential
free from interferences
(cross-reactions)
>96% % interference
IQ should be done fast 2 days days
Sensors should fit into cGMP
rules
Comply with FDA
guidelines
Restrictions
Cost of sensors should be
modest
<3% % of total investment
Sensors should have
convenient sizes
L/H/W 10–30mm L/H/W aspects
Control facilities
Control algorithms shall use
the online sensors
installed
Yes Yes/no
Control action shall be fast <0.5% % of batch time
Sampling time shall be short 1min Shortest min
Control system should allow
the use of advanced
process models
Yes Yes/no
Control system should allow
use of the online advanced
chemometrics algorithms
Yes Yes/no
Control software shall be
user-friendly
Highly High/medium/low
aExample for a particular analyte.
254 APPLICATIONS TO PROCESS ANALYTICAL TECHNOLOGY AND QUALITY BY DESIGN
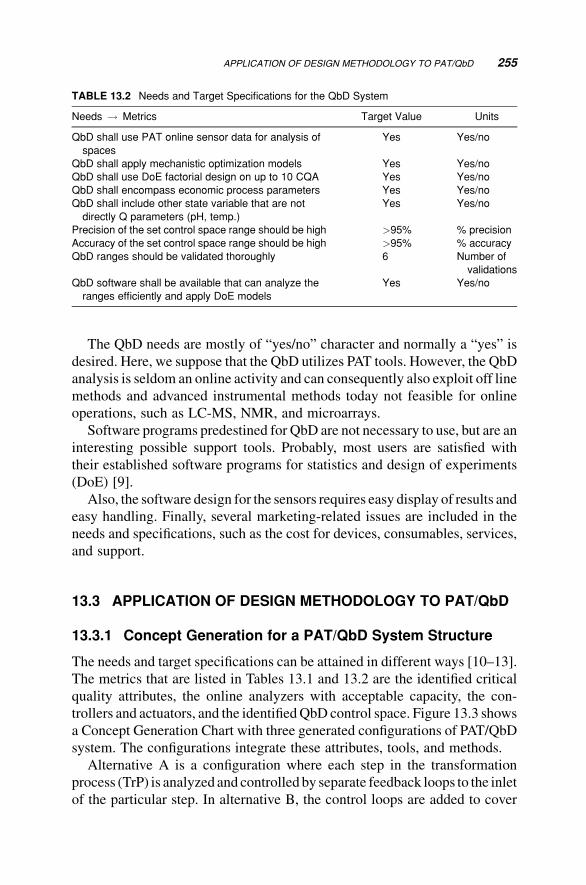
The QbD needs are mostly of “yes/no” character and normally a “yes” is
desired. Here, we suppose that the QbD utilizes PAT tools. However, the QbD
analysis is seldom an online activity and can consequently also exploit off line
methods and advanced instrumental methods today not feasible for online
operations, such as LC-MS, NMR, and microarrays.
Software programs predestined for QbD are not necessary to use, but are an
interesting possible support tools. Probably, most users are satisfied with
their established software programs for statistics and design of experiments
(DoE) [9].
Also, the software design for the sensors requires easy display of results and
easy handling. Finally, several marketing-related issues are included in the
needs and specifications, such as the cost for devices, consumables, services,
and support.
13.3 APPLICATION OF DESIGN METHODOLOGY TO PAT/QbD
13.3.1 Concept Generation for a PAT/QbD System Structure
The needs and target specifications can be attained in different ways [10–13].
The metrics that are listed in Tables 13.1 and 13.2 are the identified critical
quality attributes, the online analyzers with acceptable capacity, the con-
trollers and actuators, and the identifiedQbD control space. Figure 13.3 shows
a Concept Generation Chart with three generated configurations of PAT/QbD
system. The configurations integrate these attributes, tools, and methods.
Alternative A is a configuration where each step in the transformation
process (TrP) is analyzed and controlled by separate feedback loops to the inlet
of the particular step. In alternative B, the control loops are added to cover
TABLE 13.2 Needs and Target Specifications for the QbD System
Needs ! Metrics Target Value Units
QbD shall use PAT online sensor data for analysis of
spaces
Yes Yes/no
QbD shall apply mechanistic optimization models Yes Yes/no
QbD shall use DoE factorial design on up to 10 CQA Yes Yes/no
QbD shall encompass economic process parameters Yes Yes/no
QbD shall include other state variable that are not
directly Q parameters (pH, temp.)
Yes Yes/no
Precision of the set control space range should be high >95% % precision
Accuracy of the set control space range should be high >95% % accuracy
QbD ranges should be validated thoroughly 6 Number of
validations
QbD software shall be available that can analyze the
ranges efficiently and apply DoE models
Yes Yes/no
APPLICATION OF DESIGN METHODOLOGY TO PAT/QbD 255
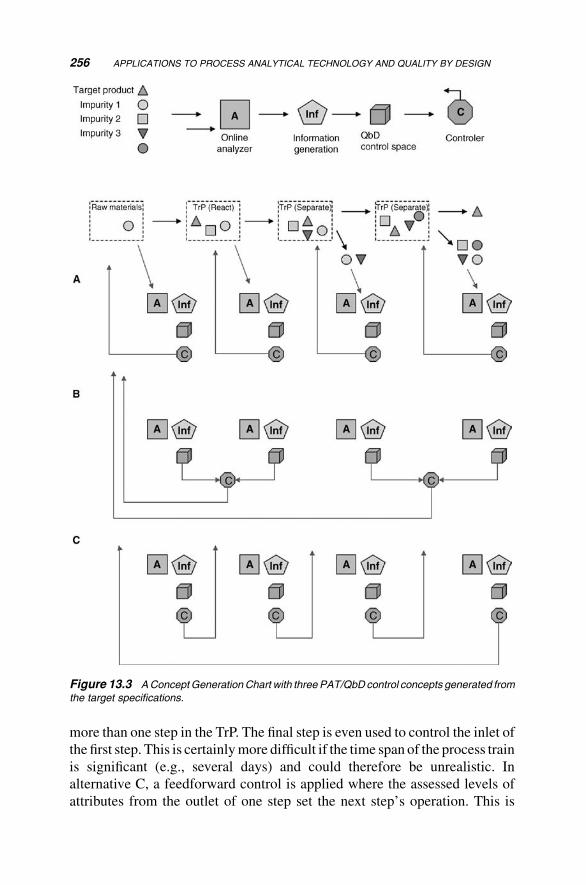
more than one step in the TrP. The final step is even used to control the inlet of
the first step. This is certainlymore difficult if the time span of the process train
is significant (e.g., several days) and could therefore be unrealistic. In
alternative C, a feedforward control is applied where the assessed levels of
attributes from the outlet of one step set the next step’s operation. This is
Figure 13.3 AConceptGeneration Chart with three PAT/QbDcontrol concepts generated from
the target specifications.
256 APPLICATIONS TO PROCESS ANALYTICAL TECHNOLOGY AND QUALITY BY DESIGN
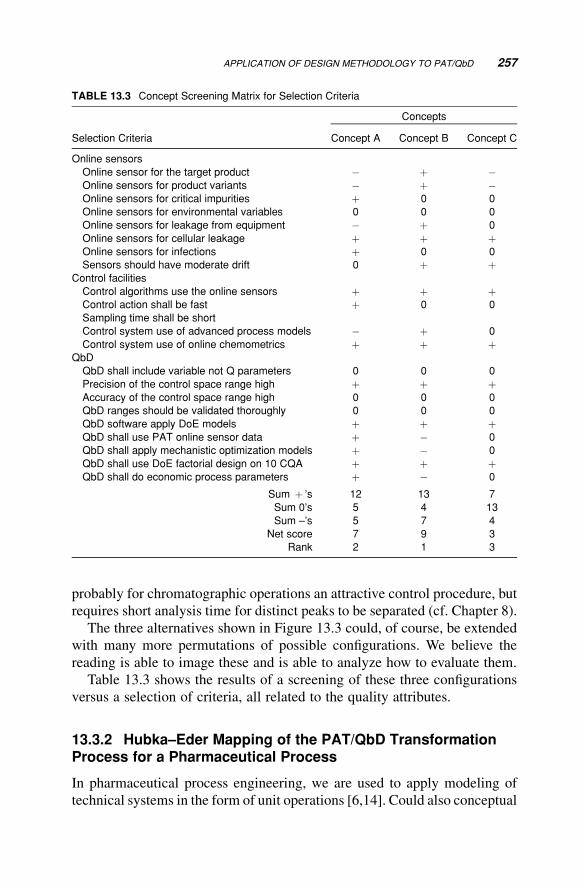
probably for chromatographic operations an attractive control procedure, but
requires short analysis time for distinct peaks to be separated (cf. Chapter 8).
The three alternatives shown in Figure 13.3 could, of course, be extended
with many more permutations of possible configurations. We believe the
reading is able to image these and is able to analyze how to evaluate them.
Table 13.3 shows the results of a screening of these three configurations
versus a selection of criteria, all related to the quality attributes.
13.3.2 Hubka–Eder Mapping of the PAT/QbD TransformationProcess for a Pharmaceutical Process
In pharmaceutical process engineering, we are used to apply modeling of
technical systems in the form of unit operations [6,14]. Could also conceptual
TABLE 13.3 Concept Screening Matrix for Selection Criteria
Selection Criteria
Concepts
Concept A Concept B Concept C
Online sensors
Online sensor for the target product � þ �Online sensors for product variants � þ �Online sensors for critical impurities þ 0 0
Online sensors for environmental variables 0 0 0
Online sensors for leakage from equipment � þ 0
Online sensors for cellular leakage þ þ þOnline sensors for infections þ 0 0
Sensors should have moderate drift 0 þ þControl facilities
Control algorithms use the online sensors þ þ þControl action shall be fast þ 0 0
Sampling time shall be short
Control system use of advanced process models � þ 0
Control system use of online chemometrics þ þ þQbD
QbD shall include variable not Q parameters 0 0 0
Precision of the control space range high þ þ þAccuracy of the control space range high 0 0 0
QbD ranges should be validated thoroughly 0 0 0
QbD software apply DoE models þ þ þQbD shall use PAT online sensor data þ � 0
QbD shall apply mechanistic optimization models þ � 0
QbD shall use DoE factorial design on 10 CQA þ þ þQbD shall do economic process parameters þ � 0
Sum þ ’s 12 13 7
Sum 0’s 5 4 13
Sum –’s 5 7 4
Net score 7 9 3
Rank 2 1 3
APPLICATION OF DESIGN METHODOLOGY TO PAT/QbD 257
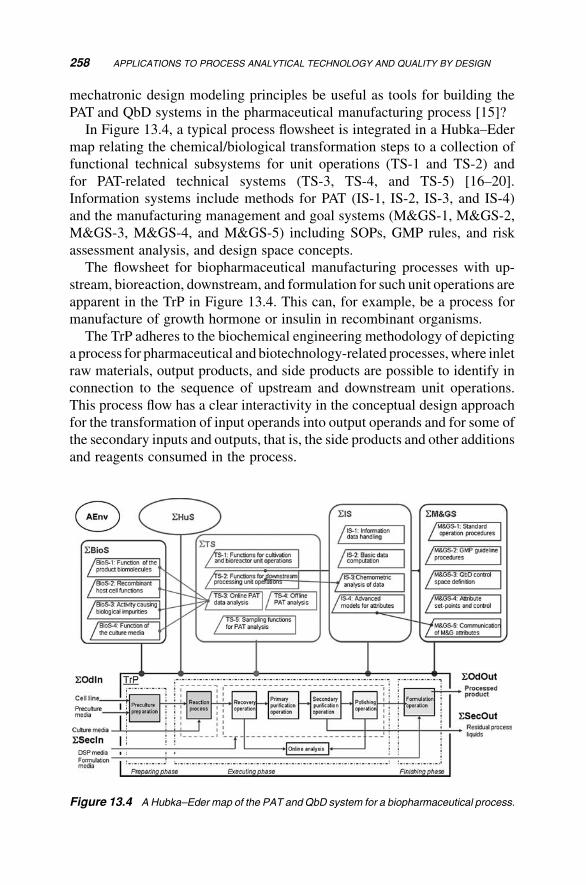
mechatronic design modeling principles be useful as tools for building the
PAT and QbD systems in the pharmaceutical manufacturing process [15]?
In Figure 13.4, a typical process flowsheet is integrated in a Hubka–Eder
map relating the chemical/biological transformation steps to a collection of
functional technical subsystems for unit operations (TS-1 and TS-2) and
for PAT-related technical systems (TS-3, TS-4, and TS-5) [16–20].
Information systems include methods for PAT (IS-1, IS-2, IS-3, and IS-4)
and the manufacturing management and goal systems (M&GS-1, M&GS-2,
M&GS-3, M&GS-4, and M&GS-5) including SOPs, GMP rules, and risk
assessment analysis, and design space concepts.
The flowsheet for biopharmaceutical manufacturing processes with up-
stream, bioreaction, downstream, and formulation for such unit operations are
apparent in the TrP in Figure 13.4. This can, for example, be a process for
manufacture of growth hormone or insulin in recombinant organisms.
The TrP adheres to the biochemical engineering methodology of depicting
a process for pharmaceutical and biotechnology-related processes,where inlet
raw materials, output products, and side products are possible to identify in
connection to the sequence of upstream and downstream unit operations.
This process flow has a clear interactivity in the conceptual design approach
for the transformation of input operands into output operands and for some of
the secondary inputs and outputs, that is, the side products and other additions
and reagents consumed in the process.
Figure 13.4 A Hubka–Eder map of the PAT and QbD system for a biopharmaceutical process.
258 APPLICATIONS TO PROCESS ANALYTICAL TECHNOLOGY AND QUALITY BY DESIGN
What is not shown in theTrP are themachines of the technical systems since
these are not transformed but remain as effect-creating tools for the process;
the transformations of properties PAT aims to identify are not visible either.
In this view, the SBioS entity highlights the complexity introduced by
biological conversions that take place in biotechnology-related pharmaceu-
tical manufacture. This justifies an analysis of the participating biological
systems. This could be a recombinant host cell (BioS-2) expressing a
protein that is being synthesized in the cellular machinery into main products
(BioS-1), the correct molecular forms of the protein in the final product
formulation (output operand) and side products, such as clipped forms or
oxidized forms (secondary outputs) (BioS-3). The culture media have an
important PAT-related role as well (BioS-4). Thus, the SBioS of the cell are
subsystems, functioning as biological technical unit operations that perform
certain biological transformations. Other biological systems relevant for PAT
may also be included, such as separate enzyme steps or cell banking.
The technical systems are divided into two types: those carrying out the
steps in the transformation process (in the flowsheet in Figure 13.4 sterili-
zation units, bioreactors, homogenizer, and chromatography separation units)
and those required for analyzing the properties of the operands and their
intermediates in the TrP. It should be noted that this links directly to the ICH
harmonized guidelines for testing: Q6A for chemical substances and Q6B for
biologics.
In Figure 13.4, these PATmethods are TS-3, TS-4, and TS-5 and are typical
enabling technologies as in the PAT view expressed in the FDA guidance [21].
Other important parts of PAT housed in the SIS entity, such as chemometrics,
multivariate methods, automatic control, and statistical process control
methods, are, in mathematical sense, intellectual knowledge systems to be
implemented in software. Clearly, these information systems are key func-
tions in PAT.
Management and goal systems (SM&GS) are needed in every industrial
manufacturing process. Here, management systems especially cover process
operations controlled by batch protocols, SOPs, and GMP rules. Goal systems
are connected to design space identification with boundaries implemented in
quality system and risk management.
Also, aspects of the human users of PAT should be addressed in the SHuSentity. This is also the case for AEnv. We do not bring up these more or less
obvious aspects in this chapter.
13.3.3 Analysis of Effects
The functions of the management and goal systems should exert effects on
how to operate the technical systems, the unit operations of the STS, and the
APPLICATION OF DESIGN METHODOLOGY TO PAT/QbD 259
PATrelevant parts ofSTS, so that the systems transform the rawmaterials into
products that fulfill defined ranges of quality attributes. SM&GS exert their
effects based on a risk management process including identification, analysis,
evaluation, reduction, and acceptance of risks in the manufacturing process as
defined in ICH guideline Q9 that results in instructions to the systems that
should affect and correct the transformation process.
However, the risk management process must use information created from
PAT, through analytical methods, instruments, and data analysis functions
such as chemometrics methods, statistical process control, and multivariate
analysis. Therefore, SIS and STS also exert reciprocal effects on the risk
management function in SM&GS.
The interrelations between SIS and SM&GS are also strikingly apparent
when defining the design space, with the multidimensional combination and
interaction of input variables (e.g., material attributes) and process parameters
that have been demonstrated to provide assurance of quality.
In particular, chemometrics methods such as factorial design and design of
experiments should be useful – methodologies encompassed in SIS. The riskmanagement process, based on interactions with the information systems and
methods that interact with the transformation process through technical
systems, should set the accepted control space boundaries and activate control
algorithms and technical systems of the unit operations to establish a closed
loop control between process parameters and quality attributes.
In biotechnology-related pharmaceutical processes, interactionswithSBioSare highly integrated and certainly require thorough analysis. In particular, the
quality attributes generated and/or controlled by the biological system(s) need
to be highlighted and defined in design space.
The Functions Interaction Matrix in Figure 13.5 further analyzes the
interactions between the systems and the TrP.
13.4 APPLYING MECHATRONIC DESIGN ON A PATSYSTEM FOR ONLINE SOFTWARE SENSING IN ABIOPROCESS (CASE)
The Hubka–Eder mapping approach to PAT is in this case applied to a
bioprocess for production of green fluorescent protein (GFP) in a
recombinant Escherichia coli culture. PAT is applied with software sensors
that monitor online critical quality parameters of the culture. Analysis is
framed into a full production process with proceeding downstream and
formulation operations.
By software sensor herewemean an online sensor that provides a signal to a
software algorithm that is based on amodel that derives more relevant process
260 APPLICATIONS TO PROCESS ANALYTICAL TECHNOLOGY AND QUALITY BY DESIGN
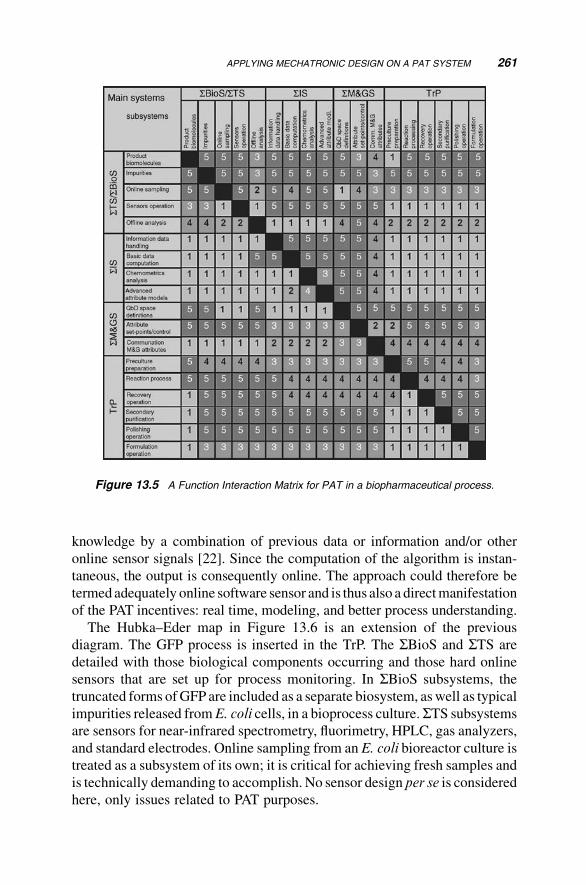
knowledge by a combination of previous data or information and/or other
online sensor signals [22]. Since the computation of the algorithm is instan-
taneous, the output is consequently online. The approach could therefore be
termedadequately online software sensor and is thus also a directmanifestation
of the PAT incentives: real time, modeling, and better process understanding.
The Hubka–Eder map in Figure 13.6 is an extension of the previous
diagram. The GFP process is inserted in the TrP. The SBioS and STS are
detailed with those biological components occurring and those hard online
sensors that are set up for process monitoring. In SBioS subsystems, the
truncated forms ofGFP are included as a separate biosystem, aswell as typical
impurities released fromE. coli cells, in a bioprocess culture. STS subsystems
are sensors for near-infrared spectrometry, fluorimetry, HPLC, gas analyzers,
and standard electrodes. Online sampling from an E. coli bioreactor culture is
treated as a subsystem of its own; it is critical for achieving fresh samples and
is technically demanding to accomplish. No sensor design per se is considered
here, only issues related to PAT purposes.
Figure 13.5 A Function Interaction Matrix for PAT in a biopharmaceutical process.
APPLYING MECHATRONIC DESIGN ON A PAT SYSTEM 261
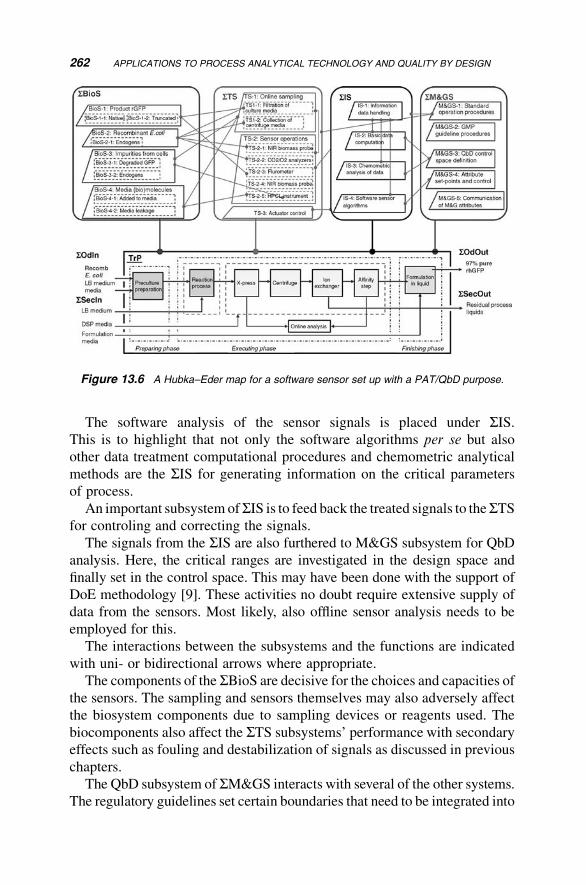
The software analysis of the sensor signals is placed under SIS.This is to highlight that not only the software algorithms per se but also
other data treatment computational procedures and chemometric analytical
methods are the SIS for generating information on the critical parameters
of process.
An important subsystem ofSIS is to feed back the treated signals to theSTSfor controling and correcting the signals.
The signals from the SIS are also furthered to M&GS subsystem for QbD
analysis. Here, the critical ranges are investigated in the design space and
finally set in the control space. This may have been done with the support of
DoE methodology [9]. These activities no doubt require extensive supply of
data from the sensors. Most likely, also offline sensor analysis needs to be
employed for this.
The interactions between the subsystems and the functions are indicated
with uni- or bidirectional arrows where appropriate.
The components of the SBioS are decisive for the choices and capacities ofthe sensors. The sampling and sensors themselves may also adversely affect
the biosystem components due to sampling devices or reagents used. The
biocomponents also affect the STS subsystems’ performance with secondary
effects such as fouling and destabilization of signals as discussed in previous
chapters.
The QbD subsystem of SM&GS interacts with several of the other systems.
The regulatory guidelines set certain boundaries that need to be integrated into
Figure 13.6 A Hubka–Eder map for a software sensor set up with a PAT/QbD purpose.
262 APPLICATIONS TO PROCESS ANALYTICAL TECHNOLOGY AND QUALITY BY DESIGN
the quality design. Chemometrics DoE procedures are as mentioned above
applied in establishing preferred ranges for the set control space. The set-points
of the CQA used to span out the control space are fed back to the TS control
subsystem where these will be applied by actuators in the individual process
units.
Software sensors are in this PAT approach a resourceful solution for PAT
design.
It extends the alternatives of applying the capacities of the arsenal of
computational methods advised to be used in PAT and QbD.
The Hubka–Eder map illuminates the benefit of having a systematic design
methodology as support for configuring the PATmethods in the concrete case.
13.5 CONCLUSIONS
Current regulatory issues, manufacturing principles, practices around process
analytical technology, and quality by design call for a dedicated design of
these systems. Differences in scientific and engineering backgrounds, as well
as in ways to describe systems, sometimes disguise important effects and
interconnections of new ideas and changes. To counteract this, this last chapter
suggests integration of experiences from conceptual design science. This can
provide common and comprehensive design tools that apply to seemingly
complex and diverse issues.
The chapter has provided a brief structure of how to start this design
approach. A detailed knowledge of the actual process is however necessary to
establish before setting up a real case. The key elements of this should follow
the general structure as outlined here, but they could also use several of the
other tools presented in this book, for example zoom-inHubka–Edermaps and
anatomical blueprints.
It is important to say that the biomechatronic design methodology should
not be regarded as a replacement methodology but as a set of tools for
which the main purpose is to complement, and thereby contribute to both
understanding and efficiency and reliability.
REFERENCES
1. United States’ Food and Drug Administration (FDA) (2004) Guidance for
Industry, PAT: A Framework for Innovative Pharmaceutical Manufacturing and
Quality Assurance, http://www.fda.gov/cvm/guidance/published.html.
2. Mandenius, C.F. (2006) Process analytical technology in biotechnology. Eur.
Pharm. Rev. 11, 69–76.
REFERENCES 263
3. International Conference on Harmonization of Technical Requirements for
Registration of Pharmaceuticals for Human Use (1999). ICH Harmonized
Tripartite Guideline for Specifications, Test Procedures and Acceptance Criteria
for Chemical Substances. Document ICH Q6A.
4. International Conference on Harmonization of Technical Requirements for
Registration of Pharmaceuticals for Human Use (1999). ICH Harmonized
Tripartite Guideline for Specifications, Test Procedures and Acceptance Criteria
for Biotechnological/Biological Products. Document ICH Q6B.
5. International Conference on Harmonization of Technical Requirements for
Registration of Pharmaceuticals for Human Use (2000) ICH Harmonized
Tripartite Guideline for Good Manufacturing Practice (GMP) for Active Phar-
maceutical Ingredients. Document ICH Q7.
6. International Conference on Harmonization of Technical Requirements for
Registration of Pharmaceuticals for Human Use (2005) ICH Harmonized
Tripartite Guideline for Pharmaceutical Development. Document ICH Q8.
7. International Conference on Harmonization of Technical Requirements for
Registration of Pharmaceuticals for Human Use (2005) ICH Harmonized
Tripartite Guideline for Quality Risk Management. Document ICH Q9.
8. Mandenius, C.F., Graumann, K., Schultz, T.W., Premsteller, A., Olsson, I.M.,
Periot, E., Clemens, C., Welin, M. (2009) Quality-by-design (QbD) for
biotechnology-related phamaceuticals. Biotechnol. J. 4, 600–609.
9. Mandenius, C.F., Brundin, A. (2008) Bioprocess optimization using design-of-
experiments methodology (DoE). Biotechnol. Prog. 24, 1191–1203.
10. Pahl, G., Beitz,W. (1996)EngineeringDesign: A Systematic Approach, Springer,
Berlin.
11. Roozenburg, N.F.M., Eekels, J. (1996) Product Design: Fundamentals and
Methods, John Wiley & Sons Ltd., Chichester.
12. Ullman, D.G. (2003) TheMechanical DesignProcess, 3rd edition,McGraw-Hill,
New York.
13. Ulrich, K.T., Eppinger, S.D. (2004) Product Design and Development, 3rd
edition, McGraw-Hill, New York.
14. Mandenius, C.F. (2004) Recent developments in the monitoring, modelling
and control of biological production systems. Bioproc. Biosyst. Eng. 26,
347–351.
15. Mandenius, C.F., Derelov, M., Detterfelt, J., Bjorkman, M. (2007) Process
analytical technology and design science. Eur. Pharm. Rev. 12(3), 74–80.
16. Mandenius, C.F., Bj€orkman, M. (2009) Process analytical technology (PAT) and
quality-by-design (QbD) aspects on stem cell manufacture.Eur. Pharm. Rev. 14,
32–37.
17. Derel€ov, M., Detterfelt, J., Bj€orkman, M., Mandenius, C.F. (2008) Engineering
design methodology for bio-mechatronic products. Biotechnol. Prog. 24,
232–244.
264 APPLICATIONS TO PROCESS ANALYTICAL TECHNOLOGY AND QUALITY BY DESIGN

18. Hubka, V., Eder, W.E. (1988) Theory of Technical Systems: A Total Concept
Theory for Engineering Design, Springer, Berlin.
19. Hubka, V., Eder,W.E. (1992) Engineering Design: General ProceduralModel of
Engineering Design, Heurista, Z€urich.
20. Hubka, V., Eder, W.E. (1996) Design Science, Springer, Berlin.
21. Glassey, J., Gernaey, K.V., Clemens. C., Schulz. T., Oliveira. R., Striedner. G.,
Mandenius, C.F. (2011) Process analytical technology (PAT) for biopharmaceu-
ticals. Biotechnol. J., in press.
22. Warth, B., Rajkai, R., Mandenius, C.F. (2010) Evaluation of software sensors for
on-line estimation of culture conditions in an Escherichia coli cultivation
expressing a recombinant protein. J. Biotechnol. 147, 37–45.
REFERENCES 265

Glossary
Active Environment The active environment (AEnv) is the unknown
environmental effect that exerts unanticipated influences on the transforma-
tion of a process. It is used in designmethodology for analyzing such potential
effects on the transformation process and other systems in the design.
Affinity Chromatography Affinity chromatography is a common chro-
matographic method in which the unique biological specificity of the analyte
and ligand interaction is utilized for separation. It is often used for protein
purification.
Anatomical Blueprint TheAnatomical Blueprint is a diagram showing the
components and component alternatives that are available for the functions of
the design. The diagram shall show the possible interrelations between the
alternative components.
Attribute or Quality Attribute The term is used especially for describing
quality parameters. In systems engineering, quality attributes are nonfunc-
tional requirements used to evaluate the performance of a system.
Basic Concept Component Chart A Basic Concept Component Chart is a
generic chart of the basic functions of the concept involved in the design. The
chart is used for generating alternative solutions to the concept.
Biomechatronic Design in Biotechnology: A Methodology for Development ofBiotechnological Products, First Edition. Carl-Fredrik Mandenius and Mats Bj€orkman.� 2011 John Wiley & Sons, Inc. Published 2011 by John Wiley & Sons, Inc.
267
Biological Systems All biological systems (SBioS), such as tissues, cells,
microbes, subcellular units, and biomolecules, which can influence the
transformation process of a designed product. The biological systems can
often be an ingoing operand to the transformation process.
Biomechatronic Product A product where biological and biochemical,
technical, human, management and goal, and information systems are com-
bined and integrated in order to accomplish a mission that fulfils a specific
need. A biomechatronic product includes a biological, a mechanical, and an
electronic part.
Bioprocess A bioprocess is a process that uses complete living cells or their
components to obtain desired products. Well-known examples of such
products are bioethanol, beer, wine, penicillin, insulin, vinegar, fermented
milk, citric acid, and industrial enzymes.
Bioreactor An apparatus used to carry out any kind of bioprocess. Exam-
ples include fermenters and enzyme reactors.
Biosensor A device that uses specific biochemical reactions mediated by
isolated enzymes, immunosystems, tissues, organelles, or whole cells to
detect chemical compounds usually by electrical, thermal, or optical signals.
Cell Culture A cell culture is a suspension of growing or resident cells. In
biotechnology, the term cell culture technology is often used to refer to an
animal or plant cell culture for production purpose.
ChineseHamster OvaryCells Chinese hamster ovary (CHO) cells are cell
lines derived from the ovary of the Chinese hamster. They are often used
in biological and medical research and commercially in the production of
therapeutic proteins.
Chromatography Chromatography is a chemical method for separation in
which the components to be separated are distributed between two phases, one
of which is stationary (stationary phase) while the other (the mobile phase)
moves in a definite direction. Chromatography is used for analytical and
preparative purposes. It is a common method for purification of proteins.
Conceptual Design Conceptual design is the first phase of a design where
drawings are the primary focus, which comprise simple plans and sections.
These simple drawings should be able to lend themselves easily to more
specific sets of plans.
Concept Generation Concept generation is the process for generating
design concepts from the user needs. The ambition is to generate many
alternative concepts for a subsequent evaluation of these with different design
tools.
Concept Generation Chart A Concept Generation Chart is the combined
chart of a Basic Concept Component Chart and a Permutation Chart.
268 GLOSSARY
Together, these charts are efficient tools for the generation of conceptual
alternatives.
Constraint Constraints in design refer to such states that restrict or confine
the design possibilities within certain prescribed bounds. The constraints are
therefore important to define in any design process.
Critical Process Parameter The term critical process parameter (CPP) is
commonly used in process analytical technology and quality by design for
those parameters that can influence the critical quality attributes of a
manufactured pharmaceutical during the manufactured product. The CPPs
are necessary to actively control to reach the desired quality.
Critical Quality Attribute The term critical quality attribute (QCA) is
commonly used in process analytical technology and quality by design for
those properties that are critical defining the quality of the manufactured
pharmaceutical product. The QCA needs to be monitored and controlled in
appropriate ways.
Customer Need Customer need is the need that the customers or users have
on a particular product to be designed. These needs are thoroughly collected
through enquiries and other means, and then carefully analyzed in order to
structure the concept generation.
Design The noun design refers to a specification of an object, manifested by
an agent, intended to accomplish goals, under a particular environment, using
a set of primitive components, satisfying a set of requirements, subject to
constraints. The verb design refers to the creation of a design, under an
environment where the designer operates.
Design for Manufacturing The term design for manufacturing (DfM)
refers to the general engineering art of designing products in such a way that
they are easy to manufacture. The basic idea exists in almost all engineering
disciplines, but the details, of course, differ widely depending on the
manufacturing technology.
Embryonic Stem Cell Embryonic stem cells (ESCs) are pluripotent stem
cells derived from the inner cell mass of the blastocyst, an early-stage embryo.
Human embryos reach the blastocyst stage 4–5 days postfertilization, atwhich
time they consist of 50–150 cells. Because isolating the embryoblast or inner
cell mass results in the death of the fertilized human embryo, this raises ethical
issues.
Functions Interaction Matrix A Functions Interaction Matrix (FIM)
ranks the importance of all possible interactions that can occur between
the system and the transformations of the designed product. This is done
in a two-dimensional matrix for the functions and subfunctions of the
systems.
GLOSSARY 269
Good Manufacturing Practice Good Manufacturing Practice (GMP) is a
part of a quality system covering the manufacture and testing of active
pharmaceutical ingredients, diagnostics, foods, pharmaceutical products, and
medical devices. GMPs are guidelines that outline the aspects of production
and testing that can impact the quality of a product. Many countries have
framed legislations making it mandatory for pharmaceutical and medical
device companies to follow GMP procedures, and have created their own
GMP guidelines in line with their legislations.
High-Performance Liquid Chromatography High-performance liquid
chromatography (HPLC) is a chromatographic technique that can separate
a mixture of compounds and is used in biochemistry and analytical chemistry
to identify, quantify, and purify the individual components of the mixture.
Hubka–EderMap AHubka–Eder map is a graphical representation of the
functions of the product to be designed. It is based on the transformation that
the product carries out and shows how a variety of systems are responsible for
and influence the transformation. With a zoom-in Hubka–Eder map, a deeper
andmore detailed graphical representation is done. TheHubka–Edermaps are
one of the useful tools in the biomechatronic design methodology.
Human Embryonic Kidney Cells Human embryonic kidney (HEK) cells,
also often referred to as HEK cells, are specific cell lines originally derived
from human embryonic kidney cells grown in tissue culture. HEK cells are
very easy to grow and transfect very readily and have been widely used in cell
biology research for many years. They are also used by the biotechnology
industry to produce therapeutic proteins and viruses for gene therapy.
Human Systems Human systems (SHuS) are the individuals involved in
carrying out the transformations, such as plant operators at the manufacturing
units, or customers using the end-product.
Information Systems Information systems (SIS) comprise the information
or software methods used for monitoring and controlling the transformations.
They use technical devices such as analytical instruments and sensors for
acquiring the information.
Ingoing Operands Ingoing operands (SOdIn) are the ingoing materials
and/or information that are to be transformed and to be part of the end-product.
Examples are raw material components or data.
List of Target Specifications The specifications, especially the target
specifications, are compiled in a List of Target Specifications that structures
the specifications in a way that can be used in the biomechatronic analysis.
Management and Goal Systems The goals and management systems
(SM&GS) set goals and the management activities necessary for carrying
out the transformations. This includes, for example, set-points of controllers
270 GLOSSARY
and statistical process control methods. It also includes the management
procedures and the regulatory guidelines and restrictions for the product and
production process.
Mechatronic Product Amechatronic product is a product where the fields
of mechanical, electronic, computer, control, and systems design engineering
are combined in order to design a useful product.
Microarray Amicroarray is a microscale device able to analyze in several
parallel species. Common microarrays are DNA microarrays and protein
microarrays. These are based onmolecular recognition between the species to
be analyzed and a recognizing biomolecule on the array. By this arrangement,
a microarray is similar to a biosensor.
Outgoing Operands The outgoing operands (SOdOut) are the outgoing
materials and/or information. These are results of the transformations and are
parts of the end-product(s).
Permutation Chart A Permutation Chart is a diagram with design alter-
natives generated from the Basic Concept Component Chart. The alternatives
are often generated by permutation of the basic components. Togetherwith the
Basic Concept Component Chart, it forms the Concept Generation Chart.
Process Analytical Technology Process analytical technology (PAT) has
been defined by the United States Food and Drug Administration as a
mechanism to design, analyze, and control pharmaceutical manufacturing
processes through the measurement of Critical Process Parameters that affect
critical quality attributes.
Prototyping The term prototyping is used in engineering to test the
functionality of a part or device. A prototype is an original type, form, or
instance of something serving as a typical example, basis, or standard for other
things of the same category. The most common use of the word prototype is a
functional, although experimental, version of a nonmilitary machine (e.g.,
automobiles, domestic appliances, and consumer electronics) whose de-
signers would like to have it built by mass production means, as opposed
to a mock-up, which is an inert representation of a machine’s appearance,
often made of some nondurable substance.
Quality by Design Quality by design (QbD) is a procedure recommend by
many regulatory authorities for building in quality into the manufacture of
pharmaceuticals. QbD is based on using critical quality attributes of the
product that characterize its quality such as purity, stability, solubility, and
product integrity. These are controlled by the critical process parameters that,
if properly selected and tuned, achieve the right quality.
ScoringMatrix or Concept ScoringMatrix A ScoringMatrix or Concept
Scoring Matrix is a matrix table where evaluation criteria such as quality
GLOSSARY 271
attributes or other performance properties are assessed for the design alter-
natives. Each criterion is assessed for each alternative and assigned a
numerical value. The criteria can have weight factors for their importance.
The Scoring Matrix assessment has been preceded by a Screening Matrix
assessment of the alternatives.
Screening Matrix or Concept Screening Matrix A Screening Matrix or
Concept Screening Matrix is a matrix table where criteria such as quality
attributes or other performance properties are assessed for the design alter-
natives. Each criterion is assessed for each alternative and assigned a
qualitative estimate (Yes/No or þ /0/� ). The total score of the assessed
criteria determines the ranking of the alternatives. The screening is usually
continued with a Scoring Matrix assessment.
Secondary Inputs Secondary inputs (SecIn) are secondary ingoing materi-
als and/or information that are necessary for transforming the ingoing
operands but are not included in the final product(s).
Software Sensors A software sensor is a combination of hardware sensors
with estimation algorithms implemented in software, used to provide online
estimations of unmeasurable variables. The software sensors are useful for
monitoring and control of bioprocesses.
Specification The specification is a transformation of the user needs of
a product or service. The specification is defined by quantitative measures.
The unit can be “Yes” or “No.” The specifications can be further refined with
target specification where value or ranges are set that a designed product
should meet. The specifications can be compiled in a List of Target
Specifications.
Surface Plasmon Resonance Surface plasmon resonance (SPR) is an
optical effect occurring in thinmetal films on surfaces. The effect is associated
with the refractive index of the surface. This has been utilized as a sensitive
detection principle in biosensors. In particular, it is applied in immunosensing
where it is used to monitor interactions between antigen and antibodies.
Systematic Design Systematic design refers to a process of design that
looks not only at the problem that needs to be overcome but also at the
surrounding environment (natural and anthropogenic) and other systems that
are linked to the problem. As such, systematic design is the basis for a lot of
appropriate technology. Trial and error and technological evolution are other
methods of arriving at a solution appropriate for a system—these are often the
basis for vernacular technology. Systematic design, on the other hand, tries to
eliminate the time required for these processes and create a solution in one go.
In reality, some combination of approaches is the best—that is, systematic
design with prototyping.
272 GLOSSARY
Technical Systems Technical systems (STS) are those systems necessary
for carrying out the transformation process. This may be manufacturing
machines such as a motor, valves, sensors, and detectors and other in the
final product. The technical systems are seldom not consumed in the
transformation.
Tools of Design Tools of design are those tools a design team shall use to
accomplish the design of a newproduct. These tools are explained inChapter 4
of this book.
Transformation Process The transformation process (TrP) is the process
that converts, reacts, or rearranges the ingoing operands resulting in an end-
product. The TrP is a result of the actions and effects caused by all of the
systems involved.
Urea Breath Testing Urea breath testing (UBT) is a clinical method for
testing the occurrence of stomach ulcer causing bacteria. The method is
further described in Chapter 7.
User Needs or Table of User Needs User needs are the requirements of the
products to be designed as described by the users and others that can judge
these needs. The needs are complied in a Table of User Needs in a well-
structured order.
GLOSSARY 273


Index
abstraction, 28, 29
procedure, 30
Accu-CheckTM, 69
accuracy, 70
active environment, 47, 267
bioreactor, 179
glucose sensor, 79
microarray, 147
protein purification, 203
surface plasmon resonance, 94
urea breath test, 128
activity, 18
AEnv. see active environment
affinity capture, 73
affinity chromatography, 267
affinity parameters, 197
Affymetrix, 137, 138
agilent, 138
agitation, 164
airlift bioreactor, 154, 156
alginate entrapped cells, 184
amperometric detection, 68
analysis, 27
anatomical, 166
Anatomical Blueprint, 50, 51,
62, 267
biosensor, 182
glucose sensor, 81
stem cell manufacture, 220
urea breath test, 129
animal cells, 153
antibiotic bioprocess, 171
antibiotics, 42
artificial liver device, 44
assembly tool, 130
at-line, 176
attribute, 52, 267
automatic analyzer, 175
Biomechatronic Design in Biotechnology: A Methodology for Development ofBiotechnological Products, First Edition. Carl-Fredrik Mandenius and Mats Bjorkman.� 2011 John Wiley & Sons, Inc. Published 2011 by John Wiley & Sons, Inc.
275
Basic Concept Component Chart, 50,
53, 54, 267
Basic Concept Component Diagram, 54
Beitz, 38
beta scintillator, 126
biacore, 85, 87, 88, 91, 94, 108
bifunctional coupler, 101
bioartificial liver, 6
bioartificial liver device, 6
bioartificial organ-simulating
device, 129, 229
alginate hydrogel, 230
Basic Concept Component
Chart, 233
biological systems, 239
Concept Generation Chart, 233, 235
Concept Scoring Matrix, 238
Concept Screening Matrix, 237
convenience, 234, 237
3D architecture, 241
3D scaffold, 233
ergonomics, 237
Good Clinical Practice, 243
Good Manufacturing Practice, 243
hemodialysis, 231
hepatocyte, 233
hollow fiber, 234, 241
Hubka–Eder map, 239, 340
Human Systems, 243
information system, 242
in situ microscopy, 243
kidney, 230
lab-on-a-chip, 230, 241
lab-scale reactor, 233
liver, 230
management and goal systems, 243
microlithography, 230
microstructure, 230
oxygenation, 236
perfusion, 236, 238
Permutation Chart, 233
renal tubule, 231
single-use, 236
target specification, 232
technical systems, 241
transplantation surgery, 230
user need, 234
biochemical engineering, 155
biochemical system, 58
biodiesel, 42
bioengineering, 42
training, 38
bioethanol, 42
biological component, 37
biological energy, 22
biological feature, 37
biological material, 44
biological reactions, 153
biological systems, 40, 45, 161, 268
bioreactor, 161
glucose sensor, 77
microarray, 146
protein purification, 203
surface plasmon resonance, 93, 94, 97
urea breath test, 125
biology area, 40
biology science, 40
biomechatronics, 38
definition, 4
design methodology, 9
methodology, 34, 135
product, 4, 7, 8, 9, 10, 34, 268
system, 6, 37
tool, 35
biopharmaceutical industry, 154
bioprocess, 268
biopsy, 115
bioreactor, 7, 60, 268
active environment, 179
apoptotic, 171, 173
apparatus, 154
biological transformation, 161
biomarker, 186
cellular, 153
chaperonin, 171
dissolved oxygen electrode, 180
Functions Interaction Matrix, 166,
167 169, 170, 173, 174
glycosylation, 171
high-throughput capacity, 158
276 INDEX
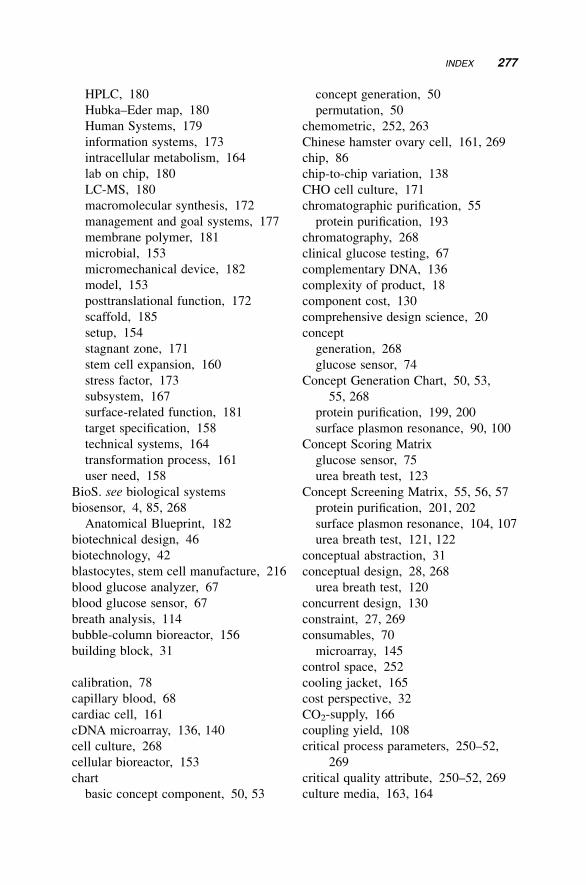
HPLC, 180
Hubka–Eder map, 180
Human Systems, 179
information systems, 173
intracellular metabolism, 164
lab on chip, 180
LC-MS, 180
macromolecular synthesis, 172
management and goal systems, 177
membrane polymer, 181
microbial, 153
micromechanical device, 182
model, 153
posttranslational function, 172
scaffold, 185
setup, 154
stagnant zone, 171
stem cell expansion, 160
stress factor, 173
subsystem, 167
surface-related function, 181
target specification, 158
technical systems, 164
transformation process, 161
user need, 158
BioS. see biological systems
biosensor, 4, 85, 268
Anatomical Blueprint, 182
biotechnical design, 46
biotechnology, 42
blastocytes, stem cell manufacture, 216
blood glucose analyzer, 67
blood glucose sensor, 67
breath analysis, 114
bubble-column bioreactor, 156
building block, 31
calibration, 78
capillary blood, 68
cardiac cell, 161
cDNA microarray, 136, 140
cell culture, 268
cellular bioreactor, 153
chart
basic concept component, 50, 53
concept generation, 50
permutation, 50
chemometric, 252, 263
Chinese hamster ovary cell, 161, 269
chip, 86
chip-to-chip variation, 138
CHO cell culture, 171
chromatographic purification, 55
protein purification, 193
chromatography, 268
clinical glucose testing, 67
complementary DNA, 136
complexity of product, 18
component cost, 130
comprehensive design science, 20
concept
generation, 268
glucose sensor, 74
Concept Generation Chart, 50, 53,
55, 268
protein purification, 199, 200
surface plasmon resonance, 90, 100
Concept Scoring Matrix
glucose sensor, 75
urea breath test, 123
Concept Screening Matrix, 55, 56, 57
protein purification, 201, 202
surface plasmon resonance, 104, 107
urea breath test, 121, 122
conceptual abstraction, 31
conceptual design, 28, 268
urea breath test, 120
concurrent design, 130
constraint, 27, 269
consumables, 70
microarray, 145
control space, 252
cooling jacket, 165
cost perspective, 32
CO2-supply, 166
coupling yield, 108
critical process parameters, 250–52,
269
critical quality attribute, 250–52, 269
culture media, 163, 164
INDEX 277
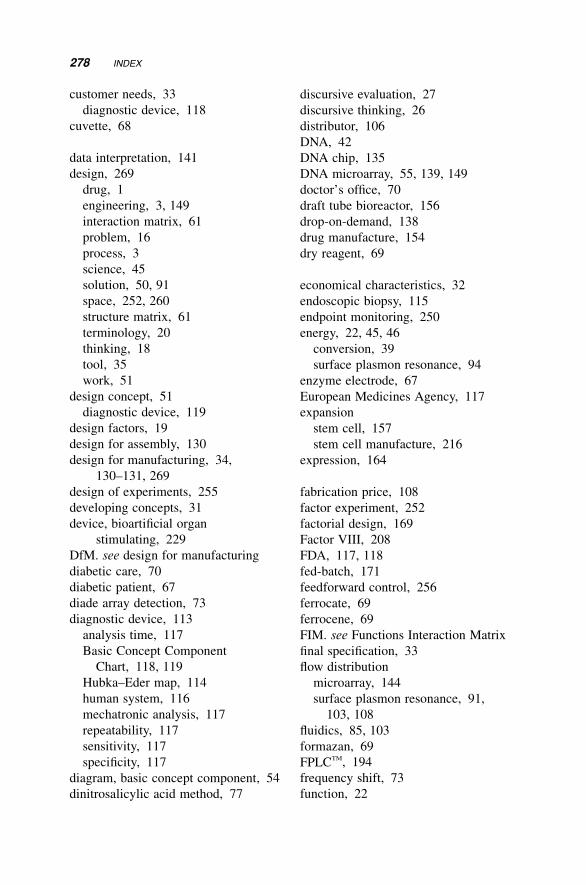
customer needs, 33
diagnostic device, 118
cuvette, 68
data interpretation, 141
design, 269
drug, 1
engineering, 3, 149
interaction matrix, 61
problem, 16
process, 3
science, 45
solution, 50, 91
space, 252, 260
structure matrix, 61
terminology, 20
thinking, 18
tool, 35
work, 51
design concept, 51
diagnostic device, 119
design factors, 19
design for assembly, 130
design for manufacturing, 34,
130–131, 269
design of experiments, 255
developing concepts, 31
device, bioartificial organ
stimulating, 229
DfM. see design for manufacturing
diabetic care, 70
diabetic patient, 67
diade array detection, 73
diagnostic device, 113
analysis time, 117
Basic Concept Component
Chart, 118, 119
Hubka–Eder map, 114
human system, 116
mechatronic analysis, 117
repeatability, 117
sensitivity, 117
specificity, 117
diagram, basic concept component, 54
dinitrosalicylic acid method, 77
discursive evaluation, 27
discursive thinking, 26
distributor, 106
DNA, 42
DNA chip, 135
DNA microarray, 55, 139, 149
doctor’s office, 70
draft tube bioreactor, 156
drop-on-demand, 138
drug manufacture, 154
dry reagent, 69
economical characteristics, 32
endoscopic biopsy, 115
endpoint monitoring, 250
energy, 22, 45, 46
conversion, 39
surface plasmon resonance, 94
enzyme electrode, 67
European Medicines Agency, 117
expansion
stem cell, 157
stem cell manufacture, 216
expression, 164
fabrication price, 108
factor experiment, 252
factorial design, 169
Factor VIII, 208
FDA, 117, 118
fed-batch, 171
feedforward control, 256
ferrocate, 69
ferrocene, 69
FIM. see Functions Interaction Matrix
final specification, 33
flow distribution
microarray, 144
surface plasmon resonance, 91,
103, 108
fluidics, 85, 103
formazan, 69
FPLCTM, 194
frequency shift, 73
function, 22
278 INDEX
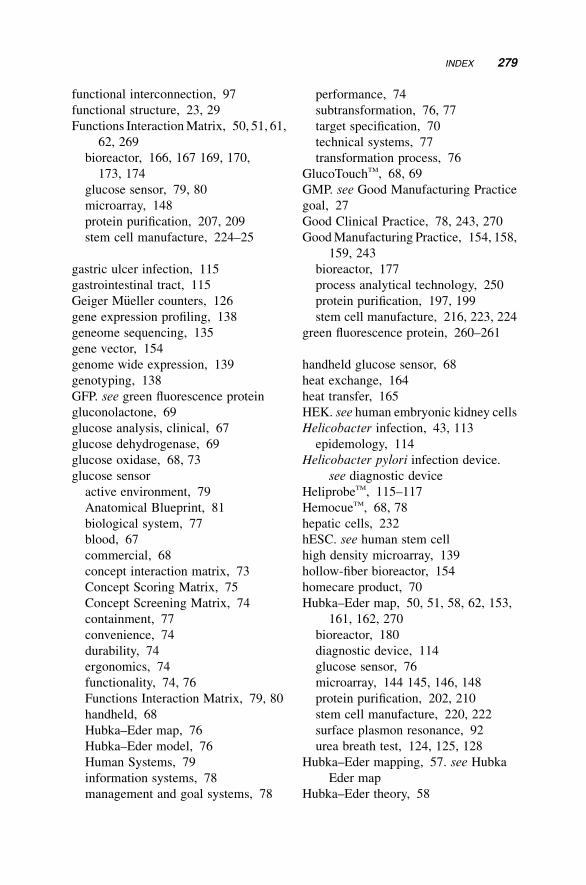
functional interconnection, 97
functional structure, 23, 29
Functions InteractionMatrix, 50, 51, 61,
62, 269
bioreactor, 166, 167 169, 170,
173, 174
glucose sensor, 79, 80
microarray, 148
protein purification, 207, 209
stem cell manufacture, 224–25
gastric ulcer infection, 115
gastrointestinal tract, 115
Geiger M€ueller counters, 126
gene expression profiling, 138
geneome sequencing, 135
gene vector, 154
genome wide expression, 139
genotyping, 138
GFP. see green fluorescence protein
gluconolactone, 69
glucose analysis, clinical, 67
glucose dehydrogenase, 69
glucose oxidase, 68, 73
glucose sensor
active environment, 79
Anatomical Blueprint, 81
biological system, 77
blood, 67
commercial, 68
concept interaction matrix, 73
Concept Scoring Matrix, 75
Concept Screening Matrix, 74
containment, 77
convenience, 74
durability, 74
ergonomics, 74
functionality, 74, 76
Functions Interaction Matrix, 79, 80
handheld, 68
Hubka–Eder map, 76
Hubka–Eder model, 76
Human Systems, 79
information systems, 78
management and goal systems, 78
performance, 74
subtransformation, 76, 77
target specification, 70
technical systems, 77
transformation process, 76
GlucoTouchTM, 68, 69
GMP. see Good Manufacturing Practice
goal, 27
Good Clinical Practice, 78, 243, 270
GoodManufacturing Practice, 154, 158,
159, 243
bioreactor, 177
process analytical technology, 250
protein purification, 197, 199
stem cell manufacture, 216, 223, 224
green fluorescence protein, 260–261
handheld glucose sensor, 68
heat exchange, 164
heat transfer, 165
HEK. see human embryonic kidney cells
Helicobacter infection, 43, 113
epidemology, 114
Helicobacter pylori infection device.
see diagnostic device
HeliprobeTM, 115–117
HemocueTM, 68, 78
hepatic cells, 232
hESC. see human stem cell
high density microarray, 139
hollow-fiber bioreactor, 154
homecare product, 70
Hubka–Eder map, 50, 51, 58, 62, 153,
161, 162, 270
bioreactor, 180
diagnostic device, 114
glucose sensor, 76
microarray, 144 145, 146, 148
protein purification, 202, 210
stem cell manufacture, 220, 222
surface plasmon resonance, 92
urea breath test, 124, 125, 128
Hubka–Eder mapping, 57. see Hubka
Eder map
Hubka–Eder theory, 58
INDEX 279
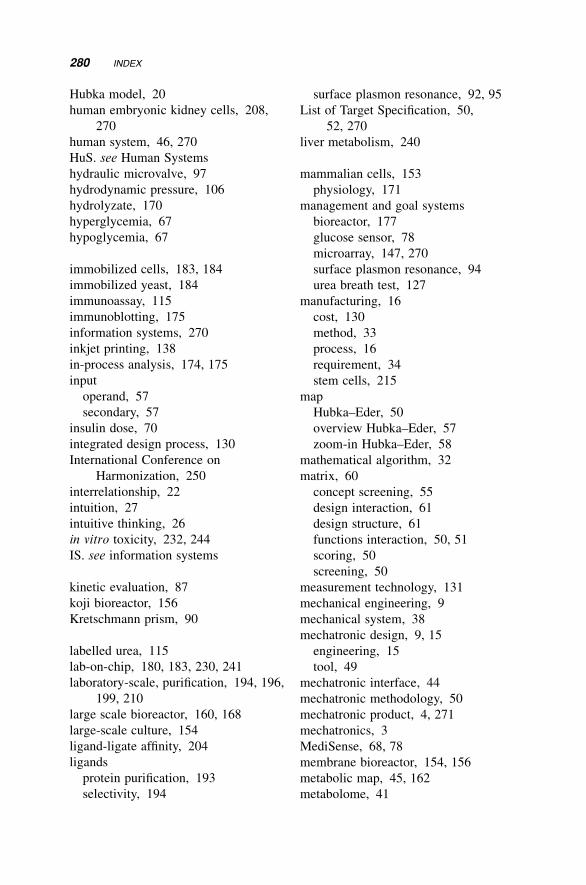
Hubka model, 20
human embryonic kidney cells, 208,
270
human system, 46, 270
HuS. see Human Systems
hydraulic microvalve, 97
hydrodynamic pressure, 106
hydrolyzate, 170
hyperglycemia, 67
hypoglycemia, 67
immobilized cells, 183, 184
immobilized yeast, 184
immunoassay, 115
immunoblotting, 175
information systems, 270
inkjet printing, 138
in-process analysis, 174, 175
input
operand, 57
secondary, 57
insulin dose, 70
integrated design process, 130
International Conference on
Harmonization, 250
interrelationship, 22
intuition, 27
intuitive thinking, 26
in vitro toxicity, 232, 244
IS. see information systems
kinetic evaluation, 87
koji bioreactor, 156
Kretschmann prism, 90
labelled urea, 115
lab-on-chip, 180, 183, 230, 241
laboratory-scale, purification, 194, 196,
199, 210
large scale bioreactor, 160, 168
large-scale culture, 154
ligand-ligate affinity, 204
ligands
protein purification, 193
selectivity, 194
surface plasmon resonance, 92, 95
List of Target Specification, 50,
52, 270
liver metabolism, 240
mammalian cells, 153
physiology, 171
management and goal systems
bioreactor, 177
glucose sensor, 78
microarray, 147, 270
surface plasmon resonance, 94
urea breath test, 127
manufacturing, 16
cost, 130
method, 33
process, 16
requirement, 34
stem cells, 215
map
Hubka–Eder, 50
overview Hubka–Eder, 57
zoom-in Hubka–Eder, 58
mathematical algorithm, 32
matrix, 60
concept screening, 55
design interaction, 61
design structure, 61
functions interaction, 50, 51
scoring, 50
screening, 50
measurement technology, 131
mechanical engineering, 9
mechanical system, 38
mechatronic design, 9, 15
engineering, 15
tool, 49
mechatronic interface, 44
mechatronic methodology, 50
mechatronic product, 4, 271
mechatronics, 3
MediSense, 68, 78
membrane bioreactor, 154, 156
metabolic map, 45, 162
metabolome, 41
280 INDEX
M&GS. see management and goal
systems
microarray
active environment, 147
addressable spot, 136
attribute, 141
automation degree, 141
biological systems, 146
conduit system, 144
density of spots, 141
design, 139
device, 135, 271
evaluation software, 142
fabrication technology, 149
Functions Interaction Matrix, 148
host mRNA expression, 139
Hubka–Eder map, 144, 145, 146, 148
hybridization condition, 141
information systems, 147
in situ synthesis, 136
instrument station, 142, 145
interaction analysis, 148
irradiation, 144
jet ink, spotting, jet ink, 137, 149
light source, 144
management and goal systems, 147
mechanical spotting, 137
microdiffusion, 146
of needs, 142
nucleotide target length, 141
photochemistry, 147
preparation time, 141
prototyping, 144
signal-to-noise ratio, 141
technical systems, 147
transformation process, 145
microbial bioreactor, 153
microbial cells, 153
microbioreactors, 153, 159, 160
bioreactor, 180
microcarrier culture, 184
microchamber, 106
microenvironment, 125
bioreactor, 173
microfluidic bioreactor, 157
micromechanics, 131
microsensor, 182
microspotting microarray, 138
microstructure, 230
function, 100
miniaturized bioreactor, 155, 180
minimizing production cost, 19
minimum space, 19
minimum weight, 19
mixer settler bioreactor, 156
monoculture, 154
morphological matrix, 97, 99
multi-compartment bioreactor, 157
multivariate data acquisition, 250
NADH, 69
nanobiotechnology, 230
needs of user, 51
surface plasmon resonance, 88
oligonucleotide, 136
chip, 135
microarray, 148
OneTouchTM, 68
on-off controller, 178
operand
input, 57, 270
output, 57, 271
protein purification, 203
stem cell manufacture, 222
optical design, 154
optical handling, 19
organ simulating bioreactor, 155
organ simulating device, 229
orientation of ligand, 206
output
operand, 57
residual, 57
secondary, 57
overview Hubka–Eder map, 57
Pahl, 38
Pasteur, 7
penicillin G, 168–170
penicillin manufacture, 160
INDEX 281
Penicillium, 161, 168
Permutation Chart, 50, 53, 54, 55, 271
diagnostic device, 118, 120
protein purification, 199, 200
stem cell manufacture, 220–21
urea breath test, 128
peroxidase, 69
personal medicine, 38
pharmaceutical development, 251
pharmaceutical process, 170
pharmaceutical quality systems, 251
pH balancing, 166
photoemitter, 73
photolithographic, 149
photolithographic method, 137
photometric detection, 68
PID controller, 178
plant cell
bioreactor, 186
culture, 155, 186
plasmid, 167
pneumatic bioreactor, 186
point-of-care testing, 68
polymerase chain reaction, 115
Precision Plus, 68, 69
principle solution, 29
process analytical technology, 249, 271
biochemical engineering, 258
bioreactor, 177
Concept Generation Chart, 255–6
Concept Screening Matrix, 257
Functions Interaction Matrix, 261
Good Manufacturing Practice, 258–9
Hubka Eder map, 257–8, 260, 262
information systems, 262
need, 253–5
operand, 259
performance attribute, 249
pharmaceutical process, 257
process flow sheet, 258
Standard Operation
Procedure, 258–9
stem cell manufacture, 218
system, 55
target specification, 253–5
technical subsystems, 258
transformation process, 255
process development, 160
process flow diagram, 162
process validation, 159
product, biomechatronic, 4
production cost, 18
production system, 8
product life cycle, 17
protein purification, 193, 207, 208
active environment, 203
affinity hydrogel, 194€AKTATM, 194
automation, 198
batch configuration, 200
biological systems, 203
chromatography configuration, 200
computer-aided design, 203
Concept Generation Chart, 199, 200
conductivity, 194
Functions Interaction Matrix, 207,
209
geometry, 198
Hubka–Eder map, 202, 210
Human Systems, 203
hydrophobic interaction, 197
immunoaffinity, 208
immobilization, 102
information systems, 203
ion exchange, 197
large scale, 193, 196
list of needs, 198, 199, 201
membrane configuration, 200
mobile phase, 205–206
monitoring, 198
multimicrochip, 210
performance, 198
protein G, 204, 208
purification, 198, 201
reversed phase, 195
rheology, 197
sanitation, 198
size exclusion, 194
stationary phase, 205
sterility, 197
282 INDEX
StreamlineTM, 194
technical systems, 203
transformation process, 203, 204
proteome, 169
psychology, 25
QbD. see quality by design
quality by design, 177, 249, 271
stem cell manufacture, 218
quality control, 174, 175, 176
stem cell manufacture, 218
quality risk management, 251
quartz crystal, 4
microbalance, 5, 6, 73
radioactive urea, 119
rate controlled conversion, 125
raw material attribute, 250–51
real time analysis, 174
recombinant insulin, 38
recombinant protein, 164, 171
regime analysis, 167
regulatory guidelines, 178
regulatory requirement, 154
residual output, 57
rheological study, 108
RNA, 42
robustness, 95
roller bottle bioreactor, 157
rotary microgravity bioreactor, 157
score, 34
scoring matrix, 50, 271
urea breath test, 120
screening, 56
screening matrix, 50, 272
secondary input, 57, 272
secondary output, 57, 272
selection criteria, 74
sensor
blood glucose, 67
chip, 85
concept, 71
HemocueTM, 72
performance, 70
surface, 90, 105, 106
surface concept, 104
surface, design, 100
shear-stress, 172
signal, 22, 45, 46
signal transmission, 39
single unit reactor, 161
software design, 70
software sensor, 260, 272
solid-state fermentation, 154
SOP. see Standard Operation Procedure
spacer, 102
microarray, 146
specification, 29, 34, 51
surface plasmon resonance, 88
spotting procedure, 141
SPR. see surface plasmon resonance
SpreetaTM, 86, 87, 91
Standard Operation Procedure, 7
bioreactor, 178
stem cell manufacture, 223
statistical method, 253
statistical process control, 178
stem cell, 154
bioreactor, 185
cryopreservation, 217, 218
derived organ cell, 43
derived products, 215
stem cell manufacture, 215, 216
Anatomical Blueprint, 220
Basic Concept Component
Chart, 220–21
biomarker, 216
cell bank, 218
cryopreservation, 217, 218
differentiation factor, 222
Functions Interaction Matrix, 224–25
Hubka–Eder map, 220, 222
isolation, 218
needs, 218, 219
preservation, 216
progenitor cells, 161
regulatory authorities, 216
robotic, 217, 225
secondary outputs, 222
INDEX 283
stem cell manufacture (Continued )
target cells, 220
technical subsystems, 223
transformation process, 220
undifferentiated, 216
sterilization, 164
stirred tank, 106, 156
structure analysis, 28
subfunction, 45
subgoal, 27
subneed, 52
surface chemistry, 97
surface plasmon resonance, 73, 94, 272
active environment, 94
alternatives, 92
analysis response time, 108
antigen-antibody interaction, 86
Basic Concept Component Chart, 90,
100
bench-top instruments, 88
biacore, 85
biological systems, 93, 94, 97
biosensor, 85
chip, 86
compartment, 91
Concept Generation Chart, 90, 100
conditioning, 100, 102
critical performance criteria, 95
design alternatives, 89
detection, 85
limit, 108
disposable unit, 88
epitope mapping, 97
evaluation matrix, 98–99
evanescence, 93
executing phase, 93
flow cell containment, 91
flow circuitry, 108
fluidics, 85
Hubka–Eder map, 92
hydrogel film, 95
information systems, 93
lithography fabrication, 106
management and goal systems, 94
materials, 22, 45, 46
microfluidics, 87
need of user, 88
Permutation Chart, 91
prism, 86
prototype, 103
recognition molecule, 92
residual reagent, 93
secondary input, 93
secondary ligand, 100, 102
sensor chip, 85
software, 88
software processing, 95
specification, 88
target analyte, 97
target specification, 89
technical systems, 93
transformation process, 92
surface-sensitive interaction, 85
sustainable aspect, 17
sustainable development, 3
synthesis, 28
systematic approach, 26
system boundary, 22
systems biology, 39, 45
Table of User Needs, 50, 51, 52
target
microarray, 142
preparation, microarray, 142, 145
target specification, 33
accuracy, 71
diagnostic device, 118
glucose sensor, 70
list, 50
microarray, 141
precision, 71
stem cell manufacture, 218,
219, 220
surface plasmon resonance, 89
task, 18
technical systems, 21, 44, 57, 272
bioreactor, 164
glucose sensor, 77
microarray, 147
protein purification, 203
284 INDEX
surface plasmon resonance, 93
urea breath test, 127
technical task, 21
tissue cells, 153
bioreactor, 185
tool
biomechatronic, 35
design, 35, 273
transcriptome mapping, 138
transfer of materials, 39
transformation process, 57, 62, 272
bioreactor, 161
glucose sensor, 76
microarray, 145
protein purification, 203, 204
stem cell manufacture, 220
urea breath test, 124
translation machinery, 45
trascriptome, 41
TrP. see transformation process
TS. see technical systems
two-color microarray, 138
UBT. see urea breath test
Ulrich and Eppinger approach, 33, 51
ultraviolet absorption, 194
urea breath test, 115, 273
active environment, 128
Anatomical Blueprint, 128
biological systems, 124
Concept Scoring Matrix, 123
Hubka–Eder map, 124, 125, 128
Human Systems, 127
information systems, 127
management and goal systems, 127
pH control, 126
secondary inputs, 124
technical systems, 126
transformation process, 124
user needs, 33, 50, 53, 273
table of, 50, 51, 52
vector production, 163
venous blood, 69
wave bioreactor, 157
whole blood, 69
workflow diagram, 50
working methodology, 26
working principle, 29
World Health Organization, 70, 117
xenobiotics, 239
zoom-in Hubka–Eder map, 58–59
bioreactor, 163
INDEX 285