eba report on smes and sme supporting · pdf fileeba report on smes and sme supporting factor...
TRANSCRIPT

EBA REPORT ON SMES AND SME SUPPORTING FACTOR
EBA/OP/2016/04
23 MARCH 2016

EBA REPORT ON SMES AND SME SUPPORTING FACTOR
1
Contents
List of figures 3
Executive Summary 8
Main findings 8
Conclusion and recommendations 10
1. Introduction 15
2. Market developments and sources of SME financing 17
SME financing in the EU 17 2.1
SMEs’ reliance on bank financing 18 2.2 Other sources of finance for SMEs 20 2.3 Policies to Support SME Access to Finance in the EU 25 2.4
3. Riskiness of SMEs in the EU over a full economic cycle 28
Measuring SME riskiness 28 3.1 Default rates 31 3.2 Financial ratios as an indicator of riskiness 34 3.3
Industry indicators of riskiness 38 3.4 Asset correlations as an indicator of systematic risk 40 3.5
Asset correlations 40 3.5.1 Regulatory treatment of SMEs in the current framework 42 3.5.2
4. SME lending trends and conditions 45
SME lending trends 45 4.1 Evolution of SME lending over the cycle 45 4.1.1 Heterogeneity of lending across banks 54 4.1.2
SME lending conditions 56 4.2 Interest rates 56 4.2.1 Collateral 59 4.2.2 Survey results on lending conditions 60 4.2.3
5. SME SF – Application 66
Background and rationale 66 5.1 Application of the SME SF 67 5.2 Impact of the SME SF on capital ratios 68 5.3
6. SME SF – Consistency of own funds requirements with lending trends and conditions 75
Bank capital and lending behaviour – Literature review 75 6.1 Data 76 6.2
Methodology 79 6.3 Results 80 6.4

EBA REPORT ON SMES AND SME SUPPORTING FACTOR
2
7. Consistency of SME riskiness with own funds requirements 83
Methodology 83 7.1 Data 85 7.2 Results 88 7.3
8. Conclusions and policy recommendations 95
Conclusions 95 8.1 Policy recommendations 96 8.2
9. References 99
Annex 1: Selected recitals and articles from the European legal framework 105
Annex 2: Data considerations – SME definition and data sources 108
Annex 3: Application of the SME SF 112
Annex 4: Summary of responses from the consultation on the EBA discussion paper on SMEs and SME SF 116
Annex 5: Technical background on the consistency of own funds requirements with lending trends 120
Annex 6: Spanish study to assess the impact of SME SF 130
Annex 7: Technical background on the consistency of own funds requirements with riskiness 132

EBA REPORT ON SMES AND SME SUPPORTING FACTOR
3
List of figures
Figure 1. Percentage of employment and value added represented by SMEs in the EU, 2014 18
Figure 2. Use of various sources of finance in the EU 28 by enterprise size 19
Figure 3. SMEs’ use of credit lines, bank overdrafts or credit card overdraft, by country 20
Box 1. Commerzbank’s SME structured bond 2013 22
Box 2. Euro Secured Notes Issuer (ESNI) 2014 22
Figure 4. Outstanding European securitisation by collateral type 23
Figure 5. Securitisation: SME European balance outstanding by country of collateral 24
Figure 6. Measures of riskiness as provided by selected EU countries 32
Figure 7. Correlations of riskiness measures and GDP growth 34
Figure 8. Level indicators 37
Figure 9. Composite index: Simple average of five normalised financial ratios 38
Figure 10. SME value added and number of people employed, by industry 39
Figure 11. Composite index by firm size and industry 39
Figure 12. Correlations of composite index by firm size and industry with GDP growth 40
Figure 13. Estimated asset correlation subject to firm size (turnover in EUR million) 41
Figure 14. Regulatory treatment of SME exposures under the SA and the IRBA 44
Figure 15. New lending to SMEs in the euro area and other EU countries 46
Figure 16. Mean annual growth rates in new SME lending 48
Figure 17. New bank lending to SMEs in the euro area as a share of total lending and GDP 49
Figure 18. New bank lending to SMEs as a share of total bank loans to enterprises 49
Figure 19. New annual bank lending to SMEs as a share of GDP 50
Figure 20. Monthly outstanding loans to enterprises in the euro area 50
Figure 21. Change in outstanding loans to enterprises, pre- and post crisis, in the euro area 51
Figure 22. Lending stocks of SME loans in selected EU countries 52
Figure 23. SME exposures in capital constrained vs capital unconstrained banks 55
Figure 24. SME exposures in high NPL vs low NPL banks 56
Figure 25. Bank interest rates to NFCs in the euro area 57
Figure 26. Interest rate spread between SMEs and larger NFCs in selected countries 57
Figure 27. Bank interest rates (min, max, median and spread) for SME loans in the euro area 58
Figure 28. Bank interest rates to NFCs in the euro area, by maturity 59

EBA REPORT ON SMES AND SME SUPPORTING FACTOR
4
Figure 29. Share of volume of loans with collateral and guarantees in total loans by loan size 60
Figure 30. Obstacles to receiving a bank loan for SMEs in the EU 28 61
Figure 31. Obstacles to receiving a bank loan for SMEs in the EU 28 61
Figure 32. Financing obstacles in the EU 28, by enterprise size 62
Figure 33. Changes in terms and conditions of banks loans granted to EU 28 enterprises 63
Figure 34. Developments in bank loan supply in the euro area 64
Figure 35. Changes in credit standards and in demand for loans or credit lines 64
Figure 36. Share of exposures to SMEs and exposures subject to SME SF in bank portfolios 68
Figure 37. Increase in CET1 capital ratio following the application of the SME SF 69
Figure 38. Distribution of the EBA reporting banks by increase in CET1 capital ratio 69
Figure 39. Increase in CET1 capital ratio with the application of the SME SF 70
Figure 40. Capital relief in the EU with the application of the SME SF 71
Figure 41. Capital relief for smaller banks vs the EBA sample 73
Figure 42. Credit constrained firms before and after the introduction of the SME SF 78
Figure 43. Illustration of framework to compare estimated and Basel III RWAs 84
Figure 44. Default rates by rating over time (all size classes) 86
Figure 45. Default rates by firm size (turnover) over time (all rating classes) 86
Figure 46. SME loans eligible for SME SF in relation to total loans (in per cent) 87
Figure 47. Average total differences of capital requirements in the Basel III and CRR/CRD IV IRBA and SA for France (in per cent) 90
Figure 48. Average total differences of capital requirements in the Basel III and CRR/CRD IV IRBA and SA for Germany (in per cent) 91
Figure 49. Relative differences of the IRBA capital requirements 92
Figure 50. Estimated asset correlation subject to amount owned (amount owned in EUR million) 93
Figure 51. Comparison of EU SME definition and definition of exposures subject to the SME SF 109
Figure 52. Overview of data sources 110
Figure 53. Exposure classes eligible for the SME SF 112
Figure 54. Summary of published Q&As related to the interpretation and application of the SME SF (Article 501 of the CRR) 114
Figure 55. Data sample based on the SAFE 121
Figure 56. Summary statistics 123
Figure 57. SME access to bank financing following the introduction of the SME SF 124

EBA REPORT ON SMES AND SME SUPPORTING FACTOR
5
Figure 58. SME access to finance following the introduction of the SME SF – Components of credit constrained 127
Figure 59. SME access to finance following the introduction of the SME SF – Firm size heterogeneity 128
Figure 60. SME access to finance following the introduction of the SME SF – Countries affected more severely vs less severely by the crisis 129
Figure 61. Relative growth of SMEs credit vs large firms 131
Figure 62. Overview applied data bases for Germany and France 132
Figure 63. GLMM single factor estimates for asset correlations subject (in per cent) 135
Figure 64. ML estimates for asset correlations subject (in per cent) 135
Figure 65. GLMM multi-factor covariance matrices estimates (in per cent) 136
Figure 66. Asset correlation with respect to exposure (in per cent) 137
EBA REPORT ON SMES AND SME SUPPORTING FACTOR
6
Abbreviations
ACPR Autorité de contrôle prudentiel et de résolution (French Prudential Supervisory Authority)
AFME Association for Financial Markets in Europe
ASRF Asymptotic single risk factor (model)
BACH Bank for Accounts of Companies Harmonised
BCBS Basel Committee on Banking Supervision
BLS Bank lending survey
CCB Capital conservation buffer
CET1 Common Equity Tier 1
COREP Common reporting (ITS on supervisory reporting)
CRD Capital Requirements Directive
CRR Capital Requirements Regulation
CMBS(s) Commercial mortgage-backed security(ies)
CMU Capital Markets Union
COSME European Commission programme for the Competitiveness of Small and Medium-sized Enterprises
EAD Exposure at default
EBA European Banking Authority
EBITDA Earnings before interest, taxes, depreciation and amortisation
ECB European Central Bank
EIB European Investment Bank
EIF European Investment Fund
EU European Union
FE Fixed effects
FINREP Financial reporting (ITS on supervisory reporting)
GDP Gross domestic product
GLMM Generalised linear mixed model
IRBA Internal ratings-based approach
LGD Loss given default

EBA REPORT ON SMES AND SME SUPPORTING FACTOR
7
MFI Monetary financial institutions
ML Maximum likelihood
NCA National competent authority
NFCs Non-financial corporations
NPL Non-performing loan
OMT Outright monetary transaction (programme)
PD Probability of default
RMBS(s) Residential mortgage-backed security(ies)
RW Risk weight
RWA Risk-weighted asset
(R)SA (Revised) standardised approach
R&I Research and innovation
SAFE (ECB’s and European Commission’s) Survey on the Access to Finance of Enterprises
SIFMA The Securities Industry and Financial Markets Association
SME SF SME supporting factor
SME(s) Small and medium-sized enterprise(s)
TREA Total risk exposure amount
EBA REPORT ON SMES AND SME SUPPORTING FACTOR
8
Executive Summary
Following the introduction of stricter capital rules by the CRR and CRD IV, and in the context of credit tightening after the financial crisis, a capital reduction factor for loans to SMEs—the so-called SME SF—was introduced by the CRR to allow credit institutions to counterbalance the rise in capital requirements resulting from the CCB, and to provide an adequate flow of credit to this particular group of companies. While the CCB will be gradually phased-in from 2016 to 2019,1 the SME SF was implemented as early as 2014, thus currently reducing the capital requirements for exposures to SMEs in comparison with the pre-CRR/CRD IV framework.
In this context, the EBA is mandated to report to the European Commission (the Commission) on the following:2 a) an analysis of the evolution of lending trends and conditions for SMEs ; (b) an analysis of the effective riskiness of EU SMEs over a full economic cycle; and (c) the consistency of own funds requirements laid down in the CRR for credit risk on exposures to SMEs, with the outcomes of the analysis under points (a) and (b). The current report aims to fulfil this mandate and provide a detailed account and analysis on these points.
Throughout the report, limitations in terms of SME data quality and availability were considered when interpreting the data.
Main findings
SMEs are key players in the EU economy in terms of their share in employment and value added. Nevertheless, they remain largely reliant on bank-related lending (e.g. credit lines and banks loans, leasing) to finance their activities. In fact, other sources of financing, such as equity finance, capital markets debt and securitisation, although available, are not as widely used yet, or are only used through special public support schemes.
Lending trends for both SMEs and large firms have been severely marked by the financial crisis, with a significant credit contraction since 2008. Following the financial crisis, SME3 bank lending has suffered a significant backdrop in volumes, from a peak of EUR 95 billion in mid-2008 to approximately EUR 54 billion in 2013/2014.4 Despite positive growth, SME lending remained below its pre-crisis level. Bank lending to larger corporates, on the other hand—after experiencing stronger increase before 2008, followed by a decrease—has already recovered to its 2003/2004 pre-crisis volumes. Despite the common trend, there are big differences across countries both in terms of the growth in new lending and in terms of SME lending stock. Differences in SME lending are also present across banks. The EBA supervisory data shows that better capitalised banks lend
1 It must be noted that some Member States front-loaded the conservation buffer at its full value of 2.5 per cent of total risk exposures, without allowing for any phasing-in. 2 Article 501(5) of the CRR (Annex 1). 3 For the purpose of this analysis, SMEs are proxied by loans up to and including EUR 1 million. Large enterprises are proxied by loans over EUR 1 million. 4 This is the average monthly new lending for 2013/2014, based on data from the ECB MFI interest rate statistics.

EBA REPORT ON SMES AND SME SUPPORTING FACTOR
9
more to both SME and other borrowers.5 At the same time, banks with higher shares of SME or large firm NPLs lend less to that group of borrowers.
Similarly to lending volumes, lending conditions have also been marked by the global financial crisis. Interest rates are generally higher for SMEs than for large companies. The spread between interest rates for loans below EUR 1 million—used as a proxy for SME loans—and loans above this threshold has risen from an average of 0.89 percentage point in the period up until 2008 to an average of 1.34 percentage points since 2009. The low interest rate environment should be kept in mind as a dominant factor in this regard. In addition, survey responses suggest that other lending conditions, such as charges and fees as well as collateral requirements, were also tightened in the post-crisis period, although empirical evidence shows that there was no change over time in the volume of loans using collateral and guarantees.
Over recent years, access to finance has remained of greater concern to SMEs than to large enterprises. The survey results show that approximately 16% of SMEs experience some issues with bank loan financing (discouraged to apply, rejected, too high a cost, or have received only part of the loan), compared to 10% of large corporates. The obstacles to finance vary also by firm size within the SME sector, with micro and small firms being most affected.
In line with these trends, both SMEs’ and large firms’ riskiness show a cyclical pattern, with default rates increasing during downturns and decreasing during upswings. In comparison, small enterprises tend to be riskier than large firms throughout the cycle. Medium enterprises, on the contrary, show a lower risk compared to large firms. During the recessionary phase of the cycle, the indicators deteriorate for firms of all sizes, but more severely in case of small enterprises compared to both medium and large companies. Medium-sized firms are consistently the relatively best performing, less risky players. Looking at systematic risk (i.e. a dependence on system-wide factors or the state of the economy), the majority of studies and empirical evidence for Germany and France suggest that asset correlation increases with firm size. These results, although less robust, are also confirmed for Ireland. The current capital requirements reflect, to a certain extent, this difference in asset correlations between SMEs and large firms.
In the context of SMEs’ dependence on bank lending and given the increased regulatory burden following the financial crisis, a capital discount (i.e. SME SF) of 0.7619 was introduced in January 2014. This factor allows the reduction of capital requirements on SME loans with the aim of freeing up regulatory capital to deploy for further SME lending and to improve SME lending conditions. The rationale of the SF is also based on the fact that capital requirements could be one of many factors affecting lending decisions. The capital relief resulting from the application of the SME SF led to an increase of 0.16 percentage points of an average CET1 ratio of 13.1% (weighted).6 The increase goes up to 0.21 percentage points if we consider only credit RWAs. In absolute terms, the application of the SME SF means that, in total, the minimum required capital has been reduced by approximately EUR 11.7 billion as of the third quarter of 2015. The
5 The better capitalised banks, measured as those banks passing the EBA 2014 stress test, have higher lending growth than the less capitalised banks. Hence, banks with higher levels of over-capitalisation compared to regulatory requirements—be this for reasons of the business model, conservatism or other reasons—appear more able to support lending. Please also see section 5.1 for more details on the academic literature, which also considers this case. 6 As reported in COREP by the EBA reporting banks in the third quarter of 2015.

EBA REPORT ON SMES AND SME SUPPORTING FACTOR
10
additional data collected suggests that the impact of the SME SF on the capital ratios of smaller banks not included in the EBA reporting varies across countries, and—in the majority of cases—is larger than for the EBA reporting banks.
In light of the introduction of the SME SF and in order to assess the consistency of own funds requirements with SME riskiness and lending trends, the EBA has launched two empirical projects.
The first empirical study tried to identify the credit supply effects related to the introduction of the SME SF based on survey data on SMEs’ perceptions of lending trends and conditions. The study did not identify any increase in access to finance for SMEs relative to large firms following the introduction of the SME SF. Similarly, there is no evidence that bank financing conditions on loans and credit lines (e.g. interest rates, size, maturity, and collateral required) improved to a greater extent for SMEs than for large firms after the introduction of the SME SF. However, other developments (such as the introduction of the CRR/CRD IV) hamper, to some extent, the identification of this effect.
Additionally, the study found that smaller and younger firms have a higher probability of being credit constrained than large and older firms. Firms with decreased financial costs, improved credit history and improved general economic outlook in the past 6 months are less likely to be credit constrained. Firms’ legal status and ownership do not seem to matter for the likelihood of obtaining bank financing. As expected, a higher unemployment rate and banks’ perception of risk in a certain country are associated with a higher probability of firms being denied credit or quantity rationed.
The second empirical study investigated the consistency of own funds requirements with the riskiness of SMEs. This study addresses the question of the relative calibration of capital requirements associated with the exposures of SMEs in two countries (France and Germany). The results suggest that under CRR/CRD IV, the SME SF is consistent with the lower systematic risk of SMEs for all exposure classes in the SA and for corporate SMEs in the IRBA. However, for the IRBA retail loans, the capital reductions associated with the SME SF lead to relative capital requirements that are lower than those suggested by the systematic risk. As a result, after the application of the SME SF, the relative regulatory RWs are in line with the empirical ones in the IRBA corporate exposure class and in the SA, but are lower than the empirical ones in the IRBA retail exposure class, suggesting that these exposures may not be sufficiently capitalised relative to large corporates.
Additionally, the study did not find empirical evidence supporting the limit of EUR 1.5 million for the amount owed, which is currently used for the application of the SME SF in accordance with Article 501 of the CRR.
Conclusion and recommendations
Given the current findings presented in the report, there is no evidence that the SME SF has provided additional stimulus for lending to SMEs compared the large corporates (comparison group). In particular, according to the results presented, SMEs have faced the same probability to

EBA REPORT ON SMES AND SME SUPPORTING FACTOR
11
be credit constrained as large firms in the period following the introduction of the SME SF.7 The EBA, however, also recognises that it may be too early to draw any strong conclusions from its analysis, given the limitations of the data available for the assessment, as well as the relatively recent introduction of the SME SF. Anecdotal evidence provided by the financial industry indicates that the implementation may take longer in order to be fully integrated into the decision-making process of institutions. Moreover, overlaying developments (such as the introduction of CRR/CRD IV) hampered, to some extent, the identification of the effect of the SME SF. The use of large firms as a control group is a further limitation of the study, but is also the best reference given the data limitations.8
The EBA analysis on the calibration of the credit risk framework on a limited sample of SME loans from three EU countries (primarily looking at asset correlation) also provided mixed evidence. On the one hand, an analysis of the relative capital requirements stemming from the IRBA indicated that the SME SF may be justified for SMEs in the IRBA corporate exposure class, given that the current IRBA calibration tended to be conservative compared to the riskiness of these exposures. Similarly, the SME SF may be justified under the SA for both corporate and retail exposure classes. On the other hand, the calibration for the IRBA retail exposure class was found to be correct without the application of the SME SF. This study has covered a limited number of countries; therefore, the representativeness of the sample for the entire EU could not be achieved. Consequently, a more complete conclusion of a systematic overestimation across all EU Member States for all SME exposures may not be inferred, and thus neither does the study fully justify nor fully reject the SME SF for this purpose.9
Finally, the EBA notes that the SME SF appears to have been introduced by legislators as a precautionary measure in order to not jeopardise lending to the SME sector, and thereby does not aim to be solely a prudential measure. In light of this, should legislators decide to keep the current framework, the EBA considers that it is crucial to continue the monitoring of the SME SF.
Some of the results mentioned above may call into question the appropriateness of the SME SF from a prudential standpoint, which is in line with the findings of the EBA (2012) report. At the same time, the EBA notes that it may be too premature to assess the full potential impact of the measure with regard to stimulating lending. The limitations presented above have prevented one from drawing firm conclusions. Therefore, it cannot be ruled out that the measure serves its primarily non-prudential purpose of ensuring funding to the SME sector during the implementation of the prudential framework. Hence, in order to draw firmer conclusions, the EBA believes it would be necessary to assess the impact of the SME SF over a longer period.
7 A study based on Spanish data showed slightly different results. In this study, after the introduction of the SME SF—which, in the case of Spain, was in September 2013 (4 months before the CRR)—SME lending grew more relative to large corporations. The relative growth of credit for SMEs versus other corporates shifts from not being statistically significant before the reform to being so after it. The results of this analysis were presented in the Bank of Spain Financial Stability Report 05/2014. 8 SMEs that are not eligible for the SME SF would be the best option. Such information, however, is not available in any EU-level databases. 9 It should also be noted that this study (along with many others) has found PD rates to be higher for SMEs than for larger corporates. Nevertheless, the report does not analyse whether the lower asset value correlations of SMEs (suggesting a lower RW for some SMEs) are significant enough to outweigh the level of unexpected loss compared to large corporates.

EBA REPORT ON SMES AND SME SUPPORTING FACTOR
12
Recommendation 1: Continued monitoring and a reassessment of the SME SF is crucial to understand its impact on SME lending
Looking forward, continuing monitoring of the SME Supporting Factor is crucial to understand how the SME Supporting Factor is applied and what its impact on SME lending is.
Collection of further data on exposures subject to the SME Supporting Factor based on COREP will provide an important source of information. However it is equally important that a repeated assessment of the SME Supporting Factor is conducted both in terms of impact on lending and consistency with riskiness, which would also imply that new or better data should be available.
As regard lending data, no significant changes are expected in terms of quality and availability of actual lending trends data around the time of introduction of the SME SF. Given the delayed implementation of the SME SF, a longer time series of the SAFE survey may provide some additional information on the impact.10 A potential positive development could be the harmonization of the SME definition (see Recommendation 4) as it would allow the analysis of bank lending to SMEs subject to the SME Supporting Factor relative to SMEs in general.
As regards the consistency of capital requirements with riskiness, a repeated assessment should be considered once the RWs reviewed by Basel are introduced. Indeed a review of the SA RWs is currently under way and expected to be finalized by end 2016. Moreover, longer time series of default rates may be available for other EU countries to extend the analysis.
Recommendation 2: A more comprehensive approach is necessary for the review of risk weights
In cases of miscalibration of risk weights, a more comprehensive approach should be taken in adjusting the capital treatment of SMEs.
In accordance with the EBA’s opinion on SME proposals for CRD IV submitted to the European Commission in June 2012, the EBA proposes the “introduction of a “supporting discount”, which would not act on risk weights, but would be applied at the end of the process of the capital calculation”, hence without altering the current risk-weights.
The application of the SME Supporting Factor should ensure that the consistency of RWs within the capital requirements framework is not altered to lead to undercalibration. However the analysis in the report showed that the impact of reduced capital requirements on the relative calibration differs by portfolio, leading to a potential under calibration in the case of the IRBA retail class, but being justified in the case of the SA and the IRBA corporate class.
EBA believes that the more general issue of over-calibration and adjustments to RWs should be
10 It has to be noted that the ECB quantitative easing that started in 2015 will make the identification of a credit supply effect due to the SME SF more difficult.

EBA REPORT ON SMES AND SME SUPPORTING FACTOR
13
pursued through a more comprehensive review of the RWs, and not through the application of a fixed discount factor to all SME exposure, which may not be sensitive enough to differences in portfolios. Indeed, this works has already started at Basel level, and in the most recent proposal the exposures to SMEs in the corporate exposure class would receive an 85% risk weight while SMEs exposures in the retail exposure class would continue to receive a 75% risk weight.
Recommendation 3: Review of the amount owed limit criterion and in the application of the SME SF to understand its purpose and cost of application
Further analysis should be conducted on the amount owed limit set for the application of the SME SF.
The limit of EUR 1.5 million of amount owed in Article 501 CRR is different from the Retail threshold of EUR 1 million amount owed, and is only used for the purpose of the SME SF. At the same time, in the consultation conducted by the EBA in July 2015, the industry has requested an increase of the limit for the amount owed for the SME SF application, because, according to the respondents, the current EUR 1.5 million threshold captures only the very small SMEs.
Preliminary analysis of the asset correlation based on data from France and Germany shows no evidence that the limit of EUR 1.5 million for the amount owed, as set out in Article 501 of the CRR, would be indicative of any change in the riskiness of SMEs.
Further work is needed to consider whether the limit is justified compared to the EUR 1 million threshold already existing in the CRR or to a different threshold, together with a clear justification of its purpose and an assessment of the additional burden on institutions to identify and monitor this threshold, which is only used for the purpose of SME SF.
Recommendation 4: Harmonisation of SME definition in the CRR
To improve the data availability and relevance, the harmonization of SME definition in the CRR should be considered.
The EBA Supervisory data, which collects data on the compliance of banks with the CRR provided some insights into the application of the SME Supporting Factor. Despite collecting data also on SMEs, such information could not be used due to the lack of a harmonized definition.
The CRR provides a definition for SMEs for the application of the SF in Article 501 of the CRR. However, it does not provide a specific definition of SMEs in the SA or in the IRBA, and the SME exposures do not constitute a specific exposure class. The findings of the EBA (2012) report show that each institution uses its own definition, which most of the times is different from the EU recommendation 2003/361.
The harmonisation of the SME definition would lead to better implementation and consistency in

EBA REPORT ON SMES AND SME SUPPORTING FACTOR
14
the regulation and comparable data on SMEs, and hence could be used for the monitoring of SME lending, riskiness and the impact of the application of the SME Supporting Factor. This would also allow building a more comprehensive data set on SME riskiness. This harmonisation can, in the view of the EBA, only be obtained through legislative changes, which can subsequently be adopted in the reporting framework.
Factors that may justify different SME definitions across institutions, such as the size of the economy, the bank size and/or bank business model should be considered when conducting such harmonisation. In line with the regulatory principles, the benefits of such harmonization should also be weighed against the costs and burden to the institutions.

EBA REPORT ON SMES AND SME SUPPORTING FACTOR
15
1. Introduction Following the introduction of stricter capital rules by the CRR11 and CRD IV,12 and in the context of the credit tightening after the financial crisis, a capital reduction factor for loans to SMEs—the so-called SME SF—was introduced by the CRR.13 The aim of this capital requirements discount is to counterbalance the rise in capital requirements resulting from the CCB14 for SME loans and hence support SME lending. According to Recital 44 of the CRR, credit institutions should effectively use the capital relief produced through the SME SF for the exclusive purpose of providing an adequate flow of credit to SMEs established in the EU.
The EBA has the mandate to report to the Commission on the following:15 a) an analysis of the evolution of the lending trends and conditions for SMEs […]; (b) an analysis of the effective riskiness of EU SMEs over a full economic cycle; and (c) the consistency of own funds requirements laid down in the CRR for credit risk on exposures to SMEs, with the outcomes of the analysis under points (a) and (b). In fulfilling its mandate, the EBA will provide input to the Commission’s own report on the impact of own funds requirements as set out in the Regulation on lending to SMEs.
The EBA has already produced a report in 2012 prior to the introduction of the SME SF.16 In this report, the EBA analysed the appropriateness of RWs for SME lending, testing the scenario of a reduction of the RWs by one third (technically, the SME SF) in relation to the then prevailing regulation, and the impact of this on banking credit and the soundness of the financial system. The report concluded that there was no sufficient evidence that could support a reduction in SME loan RWs as a permanent change in the framework. Additionally, the EBA 2012 report recommended that if such a measure is to be introduced, it should be in the form of a capital discount that would apply at the end of the capital calculation. Furthermore, the aim of this discount should be not to alter the risk assessment, but to promote lending to the SME sector. Hence, this discount requires regular monitoring and should be reversed as soon as the economy enters a positive phase of the business cycle and lending to SMEs grows.
Given that the SME SF was introduced in January 2014 with the entry into force of the CRR/CRD IV (and thus with numerous other regulatory changes), assessing and singling out its effect on lending is not straightforward. In this regard, a Call for Evidence and Discussion Paper was published in July 2015 with the aim of initiating a preliminary discussion on the implementation of 11 Regulation (EU) No 575/2013 of the European Parliament and of the Council of 26 June 2013 on prudential requirements for credit institutions and investment firms and amending Regulation (EU) No 648/2012. 12 Directive 2013/36/EU of the European Parliament and of the Council of 26 June 2013 on access to the activity of credit institutions and the prudential supervision of credit institutions and investment firms, amending Directive 2002/87/EC and repealing Directives 2006/48/EC and 2006/49/EC. 13 Article 501 of the CRR (Annex 2). 14 EBA (2012), Assessment of SME Proposals for CRD IV/CRR. 15 Article 501(5) of the CRR (Annex 2). 16 EBA (2012), Assessment of SME Proposals for CRD IV/CRR.

EBA REPORT ON SMES AND SME SUPPORTING FACTOR
16
the SME SF and to collect evidence from the industry and other stakeholders on the impact of the SME SF. As a result of the consultation, 32 responses were received, of which 25 were public and can be found published on the EBA website. The results of this collection of evidence and discussion are incorporated in this report, and are also presented in Annex 4.
When producing the report, particular attention had to be given to the data considerations and limitations. Any analysis that focuses on SMEs encounters obstacles when it comes to timely and quality data. These obstacles are faced due to, on the one hand, the diversity of SME definitions applied in different countries and institutions, and, on the other hand, the fragmented statistical data. In combination, these two limitations require a pragmatic interpretation of data. Annex 2 provides an overview of the SME definitions, limitations and data sources used in this report. The EBA will continue to consider this aspect throughout the report.
The report is structured in six sections and also includes an Introduction (section 1) and a final section with conclusions and recommendations (section 8). The Introduction provides the background for the EBA mandate and the report, including the consultation with the industry and the data limitations encountered. Section 2 provides an overview of the market developments and sources of financing for SMEs. The third section assesses the riskiness of EU SMEs over the cycle and, in this regard, addresses the EBA mandate in accordance with point (b) of Article 501 (5) of the CRR. Section 4 looks at the lending trends and conditions for SME bank lending, and addresses the EBA mandate on point (a) of the same article. Section 5 looks at the SME SF, the rationale for its introduction, and issues related to its application. This section also looks at the supervisory data to show the impact of this factor on institutions’ capital. Finally, sections 6 and 7 assess the consistency between own funds requirements and SME riskiness on the one hand, and SME lending trends and conditions on the other hand, hence addressing the EBA mandate in accordance with point (c) of Article 501 of the CRR. Conclusions and policy recommendations are made in section 8 and references are provided in section 9.

EBA REPORT ON SMES AND SME SUPPORTING FACTOR
17
2. Market developments and sources of SME financing This section provides an overview of SMEs in the EU and their main sources of finance. It identifies bank lending as the main source of financing for SMEs, and hence the reason why SMEs were hit particularly strongly by the banking crisis.
SME financing in the EU 2.1
Across the EU 28 in 2014, some 22.3 million SMEs17 in the non-financial business sector employed 89.9 million people and generated EUR 3 715 trillion in value added, which means that 99 out of every 100 businesses are SMEs, as are two in every three employees and 58 cents in every euro of value added.18 While micro SMEs (less than 10 employees) count for 92.7% of all SMEs, employment and value added across SMEs is more equally distributed. Significant differences are also apparent across countries.
Figure 1 provides a picture of the weight of SME enterprises within each Member State in terms of both employment and value added. While Greece is the Member State where the largest share of employment is absorbed by SME enterprises (approximately 87%), the United Kingdom is the economy where SMEs have the smallest employment share and the only Member State where this share appears to be below 60%. Interestingly, countries do not rank similarly in terms of value added shares, suggesting that employment and value added do not necessarily move together.
Representing 99.8% of all businesses, SMEs constitute a very diverse group. While medium enterprises account for only 1% of total SMEs, they contribute to almost a third of total value added that is generated by this group. Size, ownership, autonomy, age and industry—among other factors—have a strong impact on the business profile of the firm. The definition of SME is also a crucial matter. While a common EU definition allows cross-country comparability, it may not reflect the true size of the firms. Firms of similar turnover size may belong to different size groups in different countries. The market in (say) Malta is very different from the market in Germany and the definitions used should reflect this.
17 SMEs are defined based on the number of employees (1-9: micro; 10-49: small; 50-249: medium), which is different from the definition applied in the Article 501 of the CRR. Please see Annex 2 for more details. 18 The size of SMEs in the economy is determined through the GDP production approach, which sums the outputs of various economic activities, minus the value of intermediate consumption and consumption of fixed capital. The value added of SMEs is the value of the output produced by SMEs, deducting the intermediate consumption used to produce it.

EBA REPORT ON SMES AND SME SUPPORTING FACTOR
18
Figure 1. Percentage of employment and value added represented by SMEs in the EU, 2014
A: Employment B: Value added
Note: This refers to the non-financial business sector. Size categories are based on the number of employees (1-9: micro; 10-49: small; 50-249: medium). Source: The Commission’s 2014/2015 Annual Report on European SMEs.
SMEs’ reliance on bank financing 2.2
Firms in the EU remain largely reliant on bank financing. Wehinger (2012), for example, shows that EU firms are 75-80% bank financed, compared to just 25% in the US. This is particularly true for SMEs. Figure 2Error! Reference source not found. presents the share of European SMEs (and large firms, for comparison) that used various sources of finance:
Bank financing (overdrafts and loans) and leasing/hire-purchasing are the most used and relevant sources of finance for European SMEs – In the 6-month period to September 2015, bank overdrafts were used by 32.5% of micro, 39.2% of small and 44% of medium enterprises, while bank loans were used by 13.4% of micro, 21.0% of small and 27.7% of medium enterprises.
The use of leasing appears to be highly dependent on firm size, with 11.6% of micro, 27.1% of small, and 37% of medium enterprises using this form of finance.

EBA REPORT ON SMES AND SME SUPPORTING FACTOR
19
Other forms of finance are less used by SMEs – Of the remaining forms of finance available, trade credit is used by 21% of SMEs (across all SME size groups), grants and subsidised bank loans by 8.7%, factoring by 7.0% and non-bank loans by 9.7%. Debt securities and equity capital are used the least, with 1.1% and 1.8% of SMEs using this type of finance respectively.
Figure 2. Use of various sources of finance in the EU 28 by enterprise size
April-September 2015
Note: Size categories are based on the number of employees (1-9: micro; 10-49: small; 50-249: medium; 250+: large). This is expressed as the percentage of respondents that used a given source of finance in the preceding 6 months. Source: The Commission’s SAFE.
There are also considerable cross-country differences in finance use. For the main sources of finance employed by SMEs (bank overdrafts, bank loans, leasing/hire-purchasing and trade credit), Figure 3 presents usage rates by country. Overdraft usage ranges from over 45% in Malta, Ireland, Denmark and Italy to less than 20% in Estonia and Greece. For bank loans, large differences are also evident, with rates of over 25% evident in France and Belgium and below 10% in Hungary and Estonia. Leasing/hire-purchasing is most employed in Germany (35.7%), Latvia (34.8%) and Poland (33.7%), and is least used in Cyprus (6.6%) and Italy (7.7%). Finally, for trade credit, usage ranges from above 40% in Cyprus, the United Kingdom, Malta and Ireland to less than 5% in Hungary.
Indeed, differences in finance across countries may be explained not only by the availability of financing sources but also by the different composition of the SMEs in the EU countries, as financing needs of different types of SMEs vary. For example, start-ups are less likely to revert to bank lending and more likely to use some type of equity financing, due to their riskier profile.

EBA REPORT ON SMES AND SME SUPPORTING FACTOR
20
Figure 3. SMEs’ use of credit lines, bank overdrafts or credit card overdraft, by country
April-September 2015
A: Bank overdraft B: Bank loan
C: Trade credit D: Leasing or hire-purchase
Source: The Commission’s SAFE.
Other sources of finance for SMEs 2.3
Apart from bank financing, which represents the largest share of SME financing, alternative sources of financing are also available to SMEs, although these are used on a smaller scale.
Bank-intermediated capital market funding
Bank-intermediated capital market funding (i.e. structured finance) is an integral part of properly functioning capital markets, particularly in the case of the European SME sector where the underwriting role of credit institutions has traditionally played a dominant role. The February 2015 Green Paper of the Commission on the CMU considers both covered bonds and securitisations as important alternative sources of funding for banks and diversification

EBA REPORT ON SMES AND SME SUPPORTING FACTOR
21
opportunities for investors, improving the overall channelling of savings towards the real economy. These instruments, however, are still limited in their outreach.
Covered Bonds
As documented in the EBA (2014) Report on EU Covered Bond Frameworks and Capital Treatment, almost all EU Member States have developed specific national legal/regulatory frameworks governing the issuance of covered bonds. Compliance with these different national frameworks implies compliance with Article 52(4) of the Directive 2009/65/EC,19 which represents the first EU regulatory recognition of the covered bond mechanism. Provided that they comply with additional requirements for collateral eligibility and disclosures to investors, as mandated in Article 129 of the CRR, covered bonds compliant with the directive receive a preferential capital treatment—i.e. they attract lower RWs under the SA and lower minimum regulatory LGD under the IRBA.
At the national level, legal/regulatory covered bond frameworks clearly specify, in most of the cases, which asset classes are eligible to collateralise covered bonds. As documented in the EBA Report on EU Covered Bond Frameworks and Capital Treatment, as of July 2014, almost none of the national frameworks allow for SME exposures to be included in cover pools (EBA, 2014).20
At the EU level, Article 129 of the CRR only grants preferential capital treatment to those bonds that are collateralised under specific conditions by: residential or commercial mortgages, guaranteed residential loans, exposures to public sector entities, ship mortgages, own issued RMBSs or CMBSs, and exposures to credit institutions.
Both the national regimes in Member States and the EU framework partly reflect the European tradition of covered bond issuance, which has, for a very long time, focused on real estate mortgage exposures and exposures to public sector entities.21 Some Member States have recently amended or are currently in the process of amending their covered bond legislation to expand the list of eligible assets and include exposures to SME borrowers.
Contractual structured bonds/notes
Outside the national regulatory framework for covered bonds compliant with the UCITS Directive, certain national financial markets have seen the introduction of structured bonds/notes issued by credit institutions and backed by SME loans. Box 1 and Box 2 below present a short summary of the Commerzbank’s SME structured bond (2013) initiative and the French Euro Secured Note initiative. While the first one resulted in a funding tool similar to the covered bond, albeit fully
19 Directive 2009/65/EC of the European Parliament and of the Council of 13 July 2009 on the coordination of laws, regulations and administrative provisions relating to undertakings for collective investment in transferable securities (UCITS): http://eur-lex.europa.eu/legal-content/en/ALL/?uri=CELEX:32009L0065. 20 See Table 7 on page 31 of that report. 21 Outside the EU, Turkey appears to be the only country with a legal/regulatory covered bond framework that allows for SME exposures among eligible collateral. SME-backed covered bonds have been issued in Turkey since 2007.
EBA REPORT ON SMES AND SME SUPPORTING FACTOR
22
based on contractual law, the second initiative resulted in a mobilisation of illiquid SME exposures for repo transaction purposes or market placement purposes.
Box 1. Commerzbank’s SME structured bond 2013
Commerzbank is the first institution in the EU to issue, in 2013, a structured bond (fully based on contractual law and not a covered bond—due to the lack of dedicated legal/regulatory framework) backed by loans to SMEs. A 5-year legal maturity bond was issued, backed by a EUR 5 billion pool of loans to approximately 700 mid-cap enterprises (i.e. enterprises with an average revenue level of around EUR 500 million). The transaction was structured so as to achieve segregation of the underlying loans within a special purpose vehicle (SPV)—a true sale process similar to the securitisation process—purchasing the loans from Commerzbank and guaranteeing the covered bonds issued by Commerzbank itself to market investors. The covered bond allowed Commerzbank to pay investors a spread that was lower than its senior unsecured funding spread.
Box 2. Euro Secured Notes Issuer (ESNI) 2014
In April 2014, the securitisation company ESNI has issued the first structured note for an outstanding amount of EUR 2.6 billion and maturities up to 3 years.
The Euro Secured Note is not a securitisation note, as there is not any risk tranching and all issued notes are granted the same level of seniority. It responds to the dual recourse principle of the covered bond, as it grants investors recourse to both the issuing banks and the collateral used to secure the notes. The company (SPV) was granted a security right over the SME loans originating from five French originators, meeting the eligibility criteria for Eurosystem refinancing operations and rated by Banque de France. The programme was structured to allow for as many independent compartments (independent segregated pools) of exposures as there are issuers willing to refinance. The SPV is, in principle, open to all European issuers. The SME loans remain on the balance sheets of their originators; however, in the case of default of the originators, the SPV is transferred ownership of the SME loans, as in the French covered bond legislation. The Euro Secured Notes issued by the ESNI are either placed on the market or used for repo transactions with central banks or in the interbank market.
SME securitisation
Unlike the covered bond and other structured bonds, securitisation is a funding technique that does not grant investors the so-called dual recourse—i.e. the securitisation investor has recourse on the credit claims/receivables that back the securitisation notes, but does not have any claim against the originator of the securitisation.22 Securitisation can be used primarily for funding purposes, but also for risk transfer and hence risk/balance sheet management purposes.
22 In addition, securitisation can either be traditional (or cash securitisation) (i.e. the ownership of the securitised exposures is transferred to an SPV against cash proceeds) or synthetic (i.e. the originator keeps the securitised exposures on its balance sheet; however, the credit risk stemming from these exposures is absorbed by—i.e.

EBA REPORT ON SMES AND SME SUPPORTING FACTOR
23
As shown in Figure 4 below, SME loans have consistently represented a relatively minor share of the outstanding European securitisation market, although increasing since 1999 to today. Whereas SME loans represented approximately 2.5% of the small securitisation market back in 1999, they today represent 7.5% of the outstanding amount, the largest class of underlying exposures being constantly represented by residential mortgage loans.
Figure 4. Outstanding European securitisation by collateral type
Note: ABS – asset-backed securities; CDO - collateralised debt obligations; CMBS – commercial mortgage backed securities; SME – SME securitisation; WBS – whole business securitisation. Source: AFME/SIFMA.
The pre-crisis (before 2008) SME securitisation market was dominated by Spain and Germany. The issued securitisation notes were mostly placed with market investors. An important share of the market, particularly in Germany, was represented by synthetic securitisations, where the support of the KfW promotional bank played an important role. In the post-crisis securitisation market, SME securitisations, as securitisations backed by other asset classes, were predominantly retained by originator institutions with the aim of exchanging the notes within repo transactions with central banks to obtain liquidity. In terms of market share, Spain has maintained its position while Italy has replaced Germany (see Figure 5 on the next page).
transferred to—a credit risk mitigation provider). Synthetic transactions are predominantly carried out for risk transfer, rather than funding, purposes.
0
500
1 000
1 500
2 000
2 500
1999
2000
2001
2002
2003
2004
2005
2006
2007
2008
2009
2010
2011
2012
2013
2014
ABS CDO CMBS SME WBS
EUR bns

EBA REPORT ON SMES AND SME SUPPORTING FACTOR
24
Figure 5. Securitisation: SME European balance outstanding by country of collateral
2015Q2 (second quarter 2015)
Source: AFME/SIFMA.
In the post-crisis market environment, several different factors are mentioned as potential impediments to the development of a large SME securitisation market. Among these factors, the following are contingent by nature: i) the availability of large volumes of ‘extraordinary’ central bank liquidity assistance, leading institutions in Europe to have less recourse to market funding; ii) the subdued demand for finance from SME borrowers, due to the overall weak macroeconomic scenario in Europe; and, in particular, iii) the relatively negative performance of SME loans (i.e. high NPL figures) in some countries where SME securitisation has taken place. On the other hand, the current condition of persistently low interest rates in the market may facilitate SME securitisation by allowing issuers to pay lower yields to securitisation investors, and therefore increase the profit made on the difference between the interest received on the securitised loans and the interest paid to securitisation investors.
Other market participants have mentioned more structural impediments to SME securitisation. Among these are: i) the regulatory uncertainty on securitisation that has materialised in the recent past, in the period leading to the publication of several regulatory packages, including the revised Basel Securitisation Framework, the Solvency II capital charges on securitisation, and the European technical standards on disclosure for structured finance instruments; ii) the regulatory unlevel playing field of securitisation vs other similar instruments; iii) the inherent complexity of SME exposures in terms of heterogeneity (e.g. size, performance, type of collateral); and iv) the lack of sufficient standardisation of information on SMEs’ credit risk performance and track records.
It should be noted that beyond the term securitisations described above, short-term securitisations and, in particular, asset-backed commercial paper (ABCP) transactions play a relevant role in the financing of SMEs in certain European jurisdictions. This is due to the fact that, according to AFME data as of 2014Q4 in the Europe, Middle East and Africa region, almost 50% of the Commercial Paper (whose maturity is capped at 1 year) issued by ABCP transactions tends to

EBA REPORT ON SMES AND SME SUPPORTING FACTOR
25
be collateralised by short-dated trade receivables, often sold to the ABCP conduit by SME corporate sellers. The total ABCP market in Europe is smaller than the term securitisation market, with issuance in 2014 reaching almost EUR 200 billion.
Capital market debt financing
Issuance of corporate debt on capital markets has traditionally been a source of finance only accessible to large corporates and the high end of the SME spectrum (see Figure 4 and Figure 5 above). This is due to a series of reasons, including costs of public issuance on listed markets, difficulties in reaching critical issuance volumes by individual enterprises, and lack of an investor base.
Certain initiatives at the national level have attempted to promote debt finance on capital markets for SME enterprises, including the mini-bond initiative in Italy, whereby (since 2012) the legal and tax treatment of bond issuance by non-listed companies has been simplified relative to the past, and an ad-hoc multilateral trading facility (ExtraMOT Pro) within the stock exchange has been set up to facilitate bonds issuance for deals with a maximum volume of EUR 50 million.23 While the market is still at its infancy, banks and other institutional investors are increasingly setting up funds aimed at investing in mini-bonds. A similar initiative has been taken in Spain in 2013 with the setting up of the private multilateral trading facility MARF (Alternative Fixed-Income Market), where listed and non-listed enterprises can issue fixed-income securities with a minimum denomination of EUR 100 000.24 Already (since 2010 in Germany and later in France and the UK), similar markets for retail bonds had been set up.
Policies to Support SME Access to Finance in the EU 2.4
In addition to the above-mentioned initiatives, there is a wide range of support across the EU for SMEs in various sectors and at different stages of the growth life cycle. The EIB Group, comprised the EIB and EIF, is the main European body supporting business lending throughout the EU. Within the EIB Group, the EIF specialises in SME finance market intervention and improves SME financing through equity investments, guarantees, securitisation and microfinance. The EIB directly supports SME financing by channelling low cost funding through financial intermediaries in the EU (the ‘on-lending’ model). The risks associated with these intermediated loans, and the final decision to lend, remains with the intermediary institutions (the EIB has no direct contractual relationship with the SME). The intermediary, however, channels the favourable conditions of EIB funding through to the final borrower.
For equity financing, the EIF has, to date, invested in over 500 private equity and venture capital funds that support SMEs at every stage of the business life cycle, from turning high-risk basic research into marketable products through to growth capital. Specific support includes the EIF’s 23 In order to be able to access the platform where mini-bonds are traded, a given issuer does not have to comply with the listing prospectus requirement of the Prospectus Directive, but it simply has to publish the financial statements of the last 2 years (the least of which has to be audited), the rating of the company if available (although not required) and technical specifications of the bond under consideration. 24 Disclosure requirements are similar in nature to the ones related to mini-bonds in Italy.

EBA REPORT ON SMES AND SME SUPPORTING FACTOR
26
Mezzanine Facility for Growth, which is a EUR 1-billion fund for more mature businesses. The Equity Facility for Growth (part of the COSME) is expected to invest equity capital worth EUR 4 billion in expansion and growth-stage SMEs over the period 2014-2020. The InnovFin SME Venture Capital Facility under the Commission’s Horizon 2020 programme focuses on investments in risk-capital funds that, in turn, provide equity financing to SMEs and small midcaps in their start-up and early stages. Other InnovFin products target business angels, midcaps, and large firms, universities, R&I infrastructures and other entities. Other examples include the European Angels Fund, which supports innovative SMEs by matching investments made by business angels (currently operating in Germany, Spain and Austria, but to be rolled-out in other European countries).
The EIF—acting on behalf of the Commission—also helps to increase the lending capacity of financial intermediaries by guaranteeing part of the expected losses of their loans and leases. The Loan Guarantee Facility under the COSME programme has a budget of EUR 700 million and is expected to support EUR 21 billion of debt financing for SMEs over the period 2014-2020.
Another example is the InnovFin SME Guarantee Facility (under the Commission’s Horizon 2020 programme), which guarantees 50% of the credit risk incurred by the EIF’s financial intermediaries (banks, leasing companies and guarantee institutions), as well as provides guarantees to financial intermediaries for lending to innovation-intensive SMEs and small midcaps mainly for amounts over EUR 150 000 over the same period.
Over the period 2014-2020, it is expected that InnovFin products will make more than EUR 24 billion of financing available for R&I by small, medium and large companies, and the promoters of research infrastructures. This finance is expected to support up to EUR 48 billion of final R&I investments. At least one-third may be absorbed by SMEs.
Through the European Progress Microfinance Facility, the EIF also provides loans, equity and guarantees to microfinance intermediaries throughout the EU, which on-lend to micro enterprises (on loans up to EUR 25 000). The facility aims to increase access to finance for the unemployed, and targets disadvantaged individuals, including those at risk of social exclusion. Following the success of this facility, the EIF is currently implementing the EaSI Guarantee Financial Instrument.25
Finally, the recently announced European Fund for Strategic Investments (EFSI) is a partnership between the Commission and the EIB Group that is designed to revive investment in the real economy. The EFSI’s initial funding of EUR 21 billion is expected to generate EUR 315 billion in total investments over the next 3 years. Approximately one quarter of this initial budget will be allocated to SMEs, with the EIF managing all SME supports through equity investments and guarantees.
25 The name comes from the Commission’s new Programme for Employment and Social Innovation – “EaSI”

EBA REPORT ON SMES AND SME SUPPORTING FACTOR
27
SMEs are key players in the EU economy in terms of their share in employment and value added. Nevertheless, they remain largely reliant on bank-related lending (e.g. credit lines and banks loans, leasing) to finance their activities. In fact, other sources of financing, such as equity finance, capital markets debt and securitisation, although available, are not as widely used yet, or are only used through special public support schemes.

EBA REPORT ON SMES AND SME SUPPORTING FACTOR
28
3. Riskiness of SMEs in the EU over a full economic cycle The EBA has the mandate to assess the riskiness of SMEs in the EU over the economic cycle in accordance with Article 501 of the CRR. To address this mandate, this section first provides an overview of the main drivers and measures of riskiness based on the existing academic literature. In the second part, the section assesses SME riskiness over the cycle based on various measures and available data. Finally, the section provides a discussion on the systematic risk of SMEs and the capital treatment of SME riskiness in the regulatory framework for capital requirements.
Measuring SME riskiness 3.1
The mandate in the CRR states that the EBA should assess the SME riskiness over the cycle, but does not clearly define the term ‘riskiness’.26 Riskiness (or risk), in accordance with the traditional definition, is (on the one hand) the frequency of occurrence of the ‘risky event’ (probability) in a predetermined period and the extent of the consequences that the event generates (magnitude). In this regard, the direct measure of the risk of a loan defaulting would be the PD over a period of time (generally 1 year) or the observed historical default rates and the loss incurred when the default occurs (LGD).
Default rates are the most direct way of measuring the probability of riskiness, and are used in most academic literature dealing with SME riskiness (for example, Dietsch and Petey (2002) and Acharya, Bharath and Anand (2007)). Data on default rates is generally collected by NCAs at the national level. In many countries, data is collected directly from banks in credit registries. However, there are significant cross-country differences in the definitions of ‘default’ used and, as there is no single harmonised source of default data for the EU, this drawback does not allow the analysis of riskiness based on default rates at the EU level.
In cases where the default rate data is not available, riskiness can be measured by reverting to the analysis of the main drivers that determine the riskiness. These drivers are the factors that are normally used in the credit risk models to predict the PD. These factors can be divided into two main groups:
Idiosyncratic risk factors – These determine the risk that an individual SME will default, which is specific to the unique characteristics of that SME. These factors include aspects such as the specific financial situation of the company, management style of the owner and so on.
Systematic (system-wide) risk factors – These capture the risk that an SME will default as a result of the specific state of the economy, country and/or business cycle within its industrial
26 The mandate provided by the CRR does not define ‘cycle’ either. For the purpose of this section, we will define ‘cycle’ as a period of a complete economic cycle considering the cyclicality of major economic factors. In particular, it should include at least 10 years, or, in cases when less data is available, a period of at least 5 years that includes a downturn (the financial crisis).

EBA REPORT ON SMES AND SME SUPPORTING FACTOR
29
sector. Systematic risk factors affect all borrowers to a certain degree. The systematic risk can be measured in terms of asset correlation, which is the key driver for the capital requirements of the IRBA of Basel III.
Most models designed to predict defaults, and hence assess SME riskiness, focus on both these types of risk by combining (in their models) variables that cover both idiosyncratic and systematic risk factors. Such variables may include financial ratios, the industrial sector, macroeconomic variables, previous credit history and so on. This approach is commonly used in credit scorings and bank internal models to assess the PD.
However, idiosyncratic and systematic risks are not the only factors taken into account when assessing the riskiness of firms. Factors that affect the LGD, such as the value of collateral, recovery costs and time in case of default, are also considered by institutions when lending. While these factors do not directly affect the PD,27 they are given important weight as they have an impact on the final loss incurred by the institution.
To identify the level of riskiness, a variety of methods are proposed by the literature that aims at assessing the risk of a company, but not all of them can be applicable to the assessment of SME riskiness. For example, the Merton model, which estimates the credit risk of a firm as the distance between the value of its assets and the value of its debt, cannot be used for SMEs due to the lack of data on SME asset values. Indeed, assessing SME riskiness is a task often perceived as different in nature by financial institutions themselves, as several characteristics distinguish SME credit risk from the risk of larger companies (Dietsch and Petey, 2002): (i) there is no liquid market for trading SME loans, so there is no information on their current market value; (ii) bank SME loan portfolios generally include large amounts of small loans that render individual assessments of loans unfeasible; and (iii) data limitations are a major constraint to the modelling of SME credit risk.
With regard to the latter issue, in general, data on SMEs is scarce and the SMEs themselves are opaque in terms of information. On the one hand, there is little information on the value of SMEs due to the fact that they are not listed and there is no liquid market for their assets. On the other hand, the SMEs themselves often do not have information that can be provided to the creditor and easily interpreted and translated into a riskiness assessment. These so-called information asymmetries that exist between the institution and the SME lead to adverse selection and moral hazard, and require the institution to apply a certain margin of conservatism to its estimation of SME riskiness. The heterogeneity of SMEs compared to large companies creates even further barriers to the institutions’ abilities to fully understand their risk profile.28
In light of these limitations, a number of approaches were proposed in the academic literature. Balance sheet information was used by Altman to build a model that predicted the defaults of 27 An exception would be the case of moral hazard, when an SME that is more likely to default if it is guaranteed by a protection provider, and hence does not have the same incentives to return the debt. 28 In this regard, relationship banking could help reduce these information asymmetries and, in particular, has been found to be more a resilient and efficient model during downturns when lending is constrained and negatively affects the smaller lenders in particular (Beck, Degryse, De Haas and van Horen, 2014).

EBA REPORT ON SMES AND SME SUPPORTING FACTOR
30
SMEs using multivariate analysis. He identified five categories of financial ratios that, combined, have the highest prediction power on the riskiness of SMEs, namely: 1) working capital to total assets; 2) retained earnings to total assets ratio; 3) EBITDA to total assets; 4) market value of equity to book value of total debt ratio; and 5) sales to total assets ratio. Later, Altman and Sabato (2007), using a logit regression technique on panel data of over 2 000 firms, developed a 1-year default prediction model with an out-of-sample prediction power of almost 30% higher than that of a generic corporate model.29 These indicators have been subsequently shown to be important predictors of defaults in other studies specific to Europe (McCann and McIndoe-Calder, 2012; Martinho and Antunes, 2012).
In addition to financial ratios, industry-level and jurisdiction-level factors (macroeconomic variables) may also impact SME riskiness. In fact, these effects generally describe the cyclical nature of the SME riskiness—i.e. the dependence of the SME riskiness on the business cycle of the economy or the industrial sector in which they operate. Acharya et al. (2007), Schleifer and Vishny (1992), and Fidrmuc and Heinz (2009) show that industry has a significant impact on the riskiness of companies. This is due, on the one hand, to the specifics of each sector and, on the other hand, to sector business cycles and contagion effect within the sector.
Asset correlations are a measure of systematic risk and, in the majority of asset correlation studies, are based on default rates from various sources (hence, they rely on the availability of default rate data).30 Another common method is the estimation of asset correlations based on equity prices. However, when it comes to estimating asset correlations for SMEs, using default rate data is considered more appropriate as the publicly traded firms for which stock prices are available are not representative of banks’ entire credit portfolios and thus cannot truly form a comprehensive data set for SME loans.31
The dependence of asset correlations on firm size and creditor quality (i.e. rating), which is also incorporated in the Basel II/III IRBA Corporate RW formula, is assessed by several studies.32 Lopez (2004) finds a positive size dependence of asset correlations estimated from equity prices for multiple regions (World, Japan, the US, Europe). Düllmann and Scheule (2006) use a time series of
29 This method has some limitations, such as the fact that predictors should be normally distributed. 30 As default events are scarce, asset correlations estimates based on default rates are sometimes supplemented by using credit rating transition data. Examples for this approach can be found in van Landschoot (2007) and Kalkbrener and Onwunta (2009). Studies that rely on the joint direction of rating changes to estimate asset correlations include Fu et al. (2004), Akhavein, Kocagil and Neugebauer (2005) and Cassart, Castro, Langendries and Alderweireld (2007). 31 As the empirical literature indicates, estimates based on historical default data are usually lower than the ones used in the IRBA and those based on equity prices. In a simulation study, Düllmann, Kunisch and Küll (2010) find that using equity prices produces lower estimation errors and is thus preferential if both sources are available. However, estimating asset correlations based on default rates produces more robust estimates against model misspecifications. The publicly traded firms for which stock prices are available, however, do not ideally represent banks’ entire credit portfolios and thus cannot truly form a comprehensive data set for SME loans. Furthermore, as Akhavein, Kocagil and Neugebauer (2005) point out, equity prices tend to also include systematic information that is not credit related. Thus, correlations based on stock prices are likely to be overestimated. From their comprehensive literature review, Chernih, Henrad and Vanduffel (2010) conclude that observed defaults are a priori the best possible data source, as long as a sufficiently long data history is available. 32 The following literature review pays special attention to recently published articles on the dependency of asset correlations on firm size. A comprehensive overview of asset correlation studies can be found in Berg, Gehra and Kunisch (2011) and Düllmann and Koziol (2013).

EBA REPORT ON SMES AND SME SUPPORTING FACTOR
31
default rates of German firms for the years 1991 to 2000, and find that asset correlation increases with firm size for all the considered rating classes. In contrast, Dietsch and Petey (2004) find that for French and German SMEs, ‘asset correlations decrease significantly on average with the SME size’, while a comparison between SMEs and large corporates points towards higher asset correlations for large corporates as compared to SMEs.
In recent years, the analysis of firm size as a driver of asset correlations has been extended to further regions (Japan, the US, the UK, Italy and Canada) and more refined data sets (e.g. Düllmann and Koziol, 2014). The majority of studies suggest a positive relationship between asset correlations and firm size (Düllmann and Koziol, 2014; Hashimoto, 2009; Bams, Pisa and Wolf, 2014; Lee et al., 2013). For a portfolio of Canadian high-risk SME loans, Haddad (2013) fails to find a clear pattern for the behaviour of asset correlations in relation to credit exposure. For Italian SMEs, the results of Gabbi and Vozzella (2013) suggest a J-shaped relationship between asset correlation and company size—i.e. for the smallest companies, asset correlations and size are negatively interconnected, while for medium companies, the relationship shows a positive pattern.
Default rates 3.2
Default rates are the most direct measure of riskiness. Data on default rates, however, is limited at an EU level so the information on default rates in this section was provided by EU Member States on a best-effort basis and where data over a full economic cycle was available. All the data was analysed in relation to the GDP of the respective Member State in order to establish a link with the business cycle. This data should be considered with caution, given that no detailed information is available based on the industrial sector and, in some cases, only default rate indexes have been provided. Moreover, since the data covers only four EU countries, where such data is available over a period long enough to be considered a ‘cycle’ (as defined in the previous section), it is not possible to make general conclusions about the entire EU based on this information.
Four countries provided some type of data on default rates available over a full economic cycle: France, Italy, Romania and Spain (Figure 6). The data takes different formats and uses different SME definitions, which means that information is not comparable across countries. Nevertheless, it is possible to observe the evolution of defaults of SMEs vs larger companies over the cycle—and, in case of Romania, also of SMEs of different sizes—in relation to the GDP growth of the country.
In all cases, all companies show cyclicality in relation to the downturns represented by the GDP growth. Figure 7, which presents the correlations between default rates or other measures provided and the GDP growth, shows that there are differences between SMEs and large companies. For Romania and Spain, the negative correlation between default rates and GDP growth is higher for SMEs than large firms. In Italy and France, on the other hand, the relationship is opposite: SMEs show a lower correlation compared to large companies. Given the diverse measure used for riskiness, it is difficult to make any conclusions based on this information.

EBA REPORT ON SMES AND SME SUPPORTING FACTOR
32
Figure 6. Measures of riskiness as provided by selected EU countries
A. France: 1-year default rates and GDP growth
Source: Banque de France; ECB Statistical Warehouse.
B. Italy: Bad debt ratio and GDP growth
Note: Data covers all Italian banks. SMEs are defined according to: i) loan size (< or > EUR 500 000), and ii) borrower type (including only firms and excluding household and public/financial sector entities). Bad debt ratio is defined as non-annualised, non-seasonally adjusted average quarterly flows of bad debts to SMEs divided by the stock of loans to SMEs at the end of the previous quarter; GDP growth is calculated over 1 year based on working day and seasonally adjusted GDP, based on domestic currency (including conversion to current currency made using a fixed parity). Source: Bank of Italy’s public statistical database Base Dati Statistica (BDS); ECB’s Statistical Warehouse. https://sdw.ecb.europa.eu/browseSelection.do?DATASET=1&DATASET=2&FREQ=Q&REF_AREA=190&node=9484571
-2
-1
0
1
2
3
0.0
0.4
0.8
1.2
1.6
2.0
2005 2006 2007 2008 2009 2010 2011 2012 2013 2014
SMEs (lhs) Large firms (lhs) GDP growth (rhs)
Per centPer cent

EBA REPORT ON SMES AND SME SUPPORTING FACTOR
33
C. Romania: 1-year default rates and GDP growth
Note: SMEs are defined based on EU recommendation 2003/361. The rate of default was calculated over 1 year for companies’ payments overdue for more than 90 days over the previous 12 months; GDP growth is calculated over 1 year based on working day and seasonally adjusted GDP, based on domestic currency (including conversion to current currency made using a fixed parity). Source: National Bank of Romania – Financial Stability Department; ECB Statistical Warehouse. https://sdw.ecb.europa.eu/browseSelection.do?DATASET=1&DATASET=2&FREQ=Q&REF_AREA=190&node=9484571
D. Spain: Default rate index (base year 2000 = 100) and GDP growth
Note: SMEs are defined based on EU recommendation 2003/361. The borrower is considered to have defaulted if it is 90 days overdue, failing to meet its financial obligations on a certain loan or if, with a high probability, it is considered to be unable to meet its contractual loan obligations. GDP growth is calculated over 1 year based on working day and seasonally adjusted GDP, based on domestic currency (including conversion to current currency made using a fixed parity). Source: Banco de España’s Central Credit Register; ECB Statistical Warehouse. https://sdw.ecb.europa.eu/browseSelection.do?DATASET=1&DATASET=2&FREQ=Q&REF_AREA=190&node=9484571

EBA REPORT ON SMES AND SME SUPPORTING FACTOR
34
Figure 7. Correlations of riskiness measures and GDP growth
Jurisdiction
Riskiness measure
Time span Correlation with GDP growth
Micro Small Medium Total SMEs
Large
France Default rates (Banque de
France definition)
2005-2014 n.a. n.a. n.a. -0.31 -0.55
Italy Bad debt ratio March 1996-November 2015
n.a. n.a. n.a. -0.10 -0.20
Romania Default rates (EU definition)
December 2015- June 2015
-0.72 -0.67 -0.47 -0.74 -0.21
Spain Default rate Index
2000-2014 n.a. n.a. n.a. -0.94 -0.84
Note: ‘n.a.’ stands for ‘not available’. Source: Calculated based on data provided by the NCAs.
Financial ratios as an indicator of riskiness 3.3
Given the rather limited data on default rates, further analysis was conducted based on the main drivers of defaults. This section, in particular, looks at the financial ratios of SMEs and large companies over the cycle using data from the European BACH. BACH provides financial information for non-financial companies monitored by the Central Balance Sheet Offices of national central banks. Currently, 11 countries contribute to the BACH database,33 seven of which have been contributing to the database for the entire reporting period 2000-2013.34 The presence of a size breakdown in the BACH database allows investigating the risk profile of firms by size over time.35 The possibility to further distinguish between small and medium SMEs constitutes an enhancement with respect to a similar analysis presented in the EBA (2012).36
33 These are Austria, Belgium, the Czech Republic, Germany, the Netherlands, Spain, France, Italy, Poland, Portugal and Slovakia. 34 The Czech Republic (2002-2013), the Netherlands (2008-2013), Poland (2005-2013) and Slovakia (2005-2013) have been contributing to the database for a more limited period of time. In turn, the change in the composition of countries over time may affect the value of the figures reported in this section. Replicating the analyses on a balanced sample for the period 2005-2013 does not seem to have a major effect on the results. Data for 2014 are only available for Belgium and Portugal, so they have not been incorporated (as of 27 November 2015). 35 The BACH database breaks down firms by turnover in the following size categories: small – less than EUR 10 million; medium – between EUR 10 and 50 million; and large – above EUR 50 million. 36 A comprehensive description of the key features of the BACH database, as well as of its general limitations related to the differences in institutional background, accounting rules and sample composition can be found in Annex 3 of the EBA (2012).

EBA REPORT ON SMES AND SME SUPPORTING FACTOR
35
The riskiness of a SME—i.e. the probability that a given firm defaults—is gauged through the five financial ratios identified in Altman and Sabato (2006), specifically (for SMEs): profitability, leverage, activity, liquidity and coverage.37 They have been proxied using the closest indicator available in the BACH database (Figure 8). The country-level financial ratios have been aggregated using a weighted average of the country-level financial ratios, using total assets as weights.
Using the values over the period 2000-2013, we note that the profitability ratio has dramatically collapsed for both large firms and SMEs in the period 2008-2009, and then had a partial rebound afterwards; nonetheless, the profitability of neither large firms nor SMEs have closed the gap with the pre-crisis figures, both picking up in 2007. The wedge in profitability—the ratio of EBITDA over total assets has been used as a proxy—between large firms and SMEs has widened in post-crisis years; conversely, this difference tended to be small in pre-crisis years, with SMEs outperforming large firms in the early 2000-2003.
The activity ratio has evolved differently for large firms and SMEs in the sample period. According to BACH figures, large firms’ activity ratios have remained pretty stable over time: the ratio of net turnover over total assets has been almost constantly above 100%, with the exception of the crisis years 2009 to 2010. Contrary to this, SME faced a sheer drop in their activity in the sample period: the value of net turnover over total assets has declined from 110% in 2000 to 78% in 2013. Small firms account for this sharp contraction in SME activity: the ratio has almost halved over the period 2000 to 2013 (while medium firms’ activities are closer to large firms).
The dynamics of coverage (which is defined as the ability to service private debt) for both large firms and SMEs has shown a common cyclical path, with two peak episodes in 2004/2005 and 2010; the financial tensions for both large firms and SMEs tightened in crisis years (2008-2009). The ability to service their private debt has proven to be a higher hurdle for SMEs; nonetheless, recent SME coverage levels show pre-crisis levels, while the equivalent indicator for large firms has not fully absorbed the crisis reduction and it is still below the pre-crisis values. Similar to the discussion presented for the activity indicator, medium-sized SMEs show a pattern closer to large firms, while smaller SMEs have constantly underperformed all other peers.
According to BACH data, SMEs are less leveraged (and thus better capitalised) than large firms. SME capitalisation has steadily improved over the sample period 2000-2013, with smaller SMEs displaying the best performance. Large firms’ capitalisation has shown a similar pattern, although the wedge with SMEs has widened since 2008.
As for liquidity, SMEs seem to outperform larger firms. The endowment of more liquid current assets on the total assets has been constantly larger for SMEs with respect to large firms. Nonetheless, SMEs’ liquidity has been worsening over the sample period; smaller SMEs
37 We rely on the following BACH built-in ratios for the proxies of profitability (EBITDA/total assets), activity (net turnover/total assets), coverage (EBITDA/interest on financial debts), leverage (total equity/total assets), and liquidity (current assets/total assets). We use the inverse of the leverage proxy (i.e. by total equity/total assets) so that all financial ratios follow the same interpretation (an increase denotes a reduced risk of insolvency).
EBA REPORT ON SMES AND SME SUPPORTING FACTOR
36
have greatly contributed to this reduction, while medium-sized SMEs have shown a better performance. The fast decreasing trend of SMEs’ liquidity has almost closed the gap with the large firms’ liquidity indicator, whose reduction has been less acute over time.
According to the evidence presented, the analysis of the five indicators does not allow one to draw any final, clear conclusion about the relative riskiness of SMEs with respect to large firms. In particular, large firms seem to outperform SMEs for profitability, activity and coverage. Conversely, SMEs show a better profile for both leverage and liquidity.
The crisis seems to have hit hard on the creditworthiness of both SMEs and large firms. Most indicators (profitability, activity, liquidity, and coverage) fell sharply in the crisis years 2008-2009. The signs of the crisis are still vivid in the firms’ accounts. Few indicators (i.e. leverage and, to a lesser extent, coverage) show recent years’ values that are in line with pre-crisis levels, either due to recovery or a less pronounced drop during the crisis.
On the contrary, when analysing the indicators over a full economic cycle, all indicators for SMEs’ riskiness show a sharp worsening (except leverage). These indicators deteriorated more pronouncedly for SME than for large firms, and, despite lower starting values for SMEs, some of these indicators (activity, liquidity and—to a lesser extent—profitability) have not yet rebounded to pre-crisis levels. For the most part, the dynamics of these risk indicators over the cycle does not seem to present a significant difference between SMEs and large firms. Indeed, the latter has shown a similar deterioration in some risk profiles (i.e. profitability, coverage and—to a lesser extent—liquidity) during crisis years and has not returned to pre-crisis levels, with coverage and activity being two exceptions.
To further examine the difference in creditworthiness between SMEs and large firms, all the information deriving from the five financial ratios has been collapsed into a single index, built as the simple average of the normalised financial ratios.38 The analysis of the composite index seems to confirm the previous preliminary findings (Figure 9). Small enterprises tend to be riskier than large firms throughout the cycle. Medium enterprises, on the contrary, show a lower risk compared to large firms. During the recessionary phase of the cycle, the indicators deteriorate for firms of all sizes, but more severely in the case of small enterprises and less severely in the case of medium and large companies. Medium-sized firms are hence consistently the relatively best performing, less risky players.
38 Original indicators are expressed as percentages of various balance sheet items; therefore, they are not readily comparable, due to the different unit of measurement. To tackle this issue, we normalise the financial ratio X using rescaling, as in the following formula: Xre-scaled = (X-min(X))/(max(X)-min(X)). After normalisation, indicators can be easily compared and aggregated at a later stage.

EBA REPORT ON SMES AND SME SUPPORTING FACTOR
37
Figure 8. Level indicators
Indicator 1: Profitability indicator
EBITDA/total assets
Indicator 2: Activity ratio
Net turnover/total assets
Indicator 3: Coverage indicator
EBITDA/interest on financial debts
Indicator 4: Leverage indicator
Total equity/total assets
Indicator 5: Liquidity indicator
Current assets/total assets
Note: Indicators are broken down by firm size: small – annual turnover below EUR 10 million; medium – between EUR 10 and EUR 50 million) and large – rest of the sample. SME category includes small and medium size enterprises. The data is based on a non-balanced sample. Source: Own calculations based on the BACH database.
2
3
4
5
6
2000 2001 2002 2003 2004 2005 2006 2007 2008 2009 2010 2011 2012 2013
SME Small Medium Large
60
70
80
90
100
110
120
2000 2001 2002 2003 2004 2005 2006 2007 2008 2009 2010 2011 2012 2013
SME Small Medium Large
400
450
500
550
600
650
700
750
800
2000 2001 2002 2003 2004 2005 2006 2007 2008 2009 2010 2011 2012 2013
SME Small Medium Large
25
30
35
40
45
50
2000 2001 2002 2003 2004 2005 2006 2007 2008 2009 2010 2011 2012 2013
SME Small Medium Large
35
40
45
50
55
60
2000 2001 2002 2003 2004 2005 2006 2007 2008 2009 2010 2011 2012 2013
SME Small Medium Large

EBA REPORT ON SMES AND SME SUPPORTING FACTOR
38
Figure 9. Composite index: Simple average of five normalised financial ratios
Source: Own calculations based on the BACH database.
While aggregate indicators show a clear increase in riskiness for smaller firms over the cycle, the situation is more fragmented across countries. Some evidence at country level is provided in the IMF Global Financial Stability Report from October 2013, which conducted a study of the impact of demand and supply factors on credit growth in France, Italy, the United Kingdom and Spain. The study uses two indicators of relevance to the riskiness of firms: (1) debt-to-equity ratio to capture the effect of debt overhang, which serves as an indicator of riskiness of SMEs from the viewpoint of banks on the supply side and may also constrain firms to take additional debt from the demand side, and (2) firms’ return on assets to capture firms’ creditworthiness and the ability of firms to fund investment projects internally.
Industry indicators of riskiness 3.4
Other factors may also affect the level of riskiness. For example, Martinho and Antunes (2012) use z-scores on the national databases39 to show that the probability of credit failure does not change with firm size. Instead, they find differences in the z-scores of firms by branches of activity, with the lowest credit quality in the construction and real estate sectors for firms of all sizes. Additionally, they find the worst credit quality (for large firms) in the transportation sector, as well as micro firms in the restaurant and hotels and mining and quarrying businesses.
Indeed, the average riskiness of firms varies by industrial sector. As a result, the concentration of SMEs in certain industries may simply reflect this allocation of firms by sector. Using the BACH database, the composite index can be compared across industries for all companies. The composite index was found to be highest for ‘professional, scientific and technical activities’ and ‘wholesale and retail trade’, followed by ‘manufacturing’, ‘mining’ and quarrying’, ‘education’ and ‘construction’. The lowest composite indices are in ‘real estate’ and ‘transportation and storage’. At the same time, in the EU, SMEs are generally more concentrated in wholesale and retail trade, 39 Simplified Corporate Information and Central Credit Register.

EBA REPORT ON SMES AND SME SUPPORTING FACTOR
39
manufacturing and construction (Figure 10). This could partly explain the differences between SMEs and large firms.
Figure 10. SME value added and number of people employed, by industry
EU 28, 2012
Note: Industries are ordered according to their share in the number of people employed. 2012 is the latest available year. Source: Eurostat, Annual Enterprise Statistics.
Focusing on the three industries with the highest concentration of SMEs in terms of employment and value added, differences can be observed across industries and firm size relative to the GDP growth of the EU countries. Figure 11 shows that the evolution of the composite index varies also by industry and even by firm size within the same industry. Figure 12 shows that the correlation of the composite index by firm size and industry with GDP growth (averaged across countries) is, in general, the highest for smaller companies, with the exception of manufacturing companies.
Figure 11. Composite index by firm size and industry
Source: Own calculations based on the BACH database.
A: Manufacturing B: Construction C: Trade
0.2
0.3
0.4
0.5
0.6
0.7
0.8
2000
2001
2002
2003
2004
2005
2006
2007
2008
2009
2010
2011
2012
2013
All sizes Small Medium Large
0.2
0.3
0.4
0.5
0.6
0.7
0.8
0.9
2000
2001
2002
2003
2004
2005
2006
2007
2008
2009
2010
2011
2012
2013
All sizes Small Medium Large
0.2
0.3
0.4
0.5
0.6
0.7
2000
2001
2002
2003
2004
2005
2006
2007
2008
2009
2010
2011
2012
2013
All sizes Small Medium Large

EBA REPORT ON SMES AND SME SUPPORTING FACTOR
40
Figure 12. Correlations of composite index by firm size and industry with GDP growth
Average across countries
Source: Own calculations based on the BACH database.
Asset correlations as an indicator of systematic risk 3.5
The capital requirements framework (Basel/CRR) aims to align regulatory capital requirements more closely with underlying risks. In this regard, the intention of the framework is to reflect the riskiness of the assets, including SME loans, in their regulatory treatment. This section looks, on the one hand, at the current regulatory treatment of SMEs in terms of asset correlations and, on the other hand, at the empirical evidence. Further discussion on the consistency of own funds requirements (defined by asset correlations) with riskiness of SMEs is provided in section 7.
Asset correlations 3.5.1
In the current RW formulas for capital charges, which are based on the ASRF model (Gordy, 2003), systematic (or system-wide) risks that affect all borrowers to a certain degree—such as industry or regional risks—are modelled with only one (the ‘single’) systematic risk factor.40 Systematic (system-wide) risk factors that capture the risk that an SME will default as a result of the specific state of the economy, country and/or business cycle within its industrial sector can be measured by estimating asset correlations.
40 Since ASRF models are derived from ‘ordinary’ credit portfolio models by the law of large numbers, when a portfolio consists of a large number of relatively small exposures, idiosyncratic risks associated with individual exposures tend to cancel out one another and only systematic risks that affect many exposures have a material effect on portfolio losses. The model specification was subject to an important restriction in order to fit supervisory needs: it should be portfolio invariant (BCBS, 2015).
0
0.1
0.2
0.3
0.4
0.5
0.6
0.7
Small Medium Large Small Medium Large Small Medium Large
Manufacturing Construction Wholesale and retailtrade; repair; repair of
motor vehicles andmotorcycles

EBA REPORT ON SMES AND SME SUPPORTING FACTOR
41
Using the historical default rates of France and Germany, estimations of asset correlations are presented in Figure 13. The data and the methodology used for the estimation are described in Annex 7.41
Figure 13. Estimated asset correlation subject to firm size (turnover in EUR million)
Note: More information on the standard errors of asset correlations is provided in Annex 7. Source: Dietsch et al. (forthcoming)
The overall results are consistent across Germany and France, and are robust for different estimators (Figure 13 and Figure 63 to Figure 65 in the Annex). The main result is that large corporates (Basel definition: corporates with a turnover of EUR 50 million) face a considerable higher systematic risk than SMEs (Figure 13); more precisely, the asset correlations for large corporates are estimated twice as high as the asset correlations for SME loans. These estimation results show that there is a structural difference between loans to large corporates and SME loans. For SME loans, the systematic risk does not vary significantly with the turnover. This is in line with the existent academic literature, which finds that asset correlations increase with firm size.
The estimations were also conducted for Ireland and Italy. The first preliminary asset correlation estimates based on Irish data, albeit being less robust and based on a comparatively shorter time series, seem to support the findings for Germany and France. The result implies that Irish large corporates are significantly more exposed to systematic risk than SMEs.42 The methodology was replicated for Italian data,43 but it did not produce statistically significant estimates.
41 For more details, please refer to Dietsch, Düllmann, Fraisse, Koziol and Ott (2015). 42 The results of the estimations are not presented in this report, as they are less robust. Nevertheless, the structural difference in asset correlation between small and large firms is evident. 43 The estimation of asset correlations for Italian SME loans was based on default rate data from the Italian credit register; this information was complemented with rating information from a rating system developed internally at Bank of Italy and illustrated in Chionsini, Fabi, and Laviola (2005), ‘Credit risk analysis: a model for corporate default probability estimation and its applications’ (original title: ‘Analisi del Rischio di Credito: Un Modello per la Stima della Probabilità di Insolvenza delle Imprese e Applicazioni’, Bank of Italy, mimeo.). The time series covers semi-annual data from 2002 to 2012.
0.4%
0.6%
0.8%
1.0%
1.2%
1.4%
1.6%
1.8%
2.0%
0.5 1.125 1.75 3.25 3.75 10 12.5 32.5 35 >50
DE FR

EBA REPORT ON SMES AND SME SUPPORTING FACTOR
42
Regulatory treatment of SMEs in the current framework 3.5.2
Within the basic capital requirements model, the riskiness of a borrower is identified by the RW assigned to the EAD, which then allows determining the capital required to be held by the bank. Both in case of the SA and the IRBA, in the current framework, the regulatory RW applied to the SME exposures is determined based on the exposure class to which the SME belongs and, in case of the IRBA, also on parameters that capture different aspects of the overall riskiness of the exposure in IRBA (including the asset correlation).
SA: Capital charge = EAD*regulatory RW * 8%
IRBA: Capital charge = EAD * regulatory RW function (PD; LGD; M; ρ) * 8%
Typically, SMEs exposures—when the SME is defined according to the EU 2003 Recommendation44—will be assigned to corporate or retail exposure classes. In the case of the SA, these exposures may also be assigned to the exposure class ‘secured by immovable property’, where such collateral has been provided. Figure 14 sets out the allocation criteria and the general RW treatment of exposures to SMEs under the corporate and retail exposure classes. As shown in the figure, SME loans typically receive a differentiated treatment with respect to large enterprises—either because they can be classified as retail exposures or due to their reduced size—when they are allocated to the corporate exposure class.45
More specifically, when it comes to asset correlations, the underlying assumption in the IRBA is that SME exposures are less dependent on systematic risk factors and hence have lower asset correlations:
As corporate exposures, the asset correlation of SME exposures is adjusted downwards with a factor that depends on the firm’s turnover (Article 153 of the CRR);
As retail exposures, SMEs—as well as any other retail exposure—get a reduced asset correlation coefficient that is meant to capture a reduced dependency of the default of retail customers on the economic cycle. In general, asset correlations decrease with increasing PD46—i.e. the higher the idiosyncratic (individual) risk components of a borrower, the less the default risk of the borrower depends on the overall state of the economy and more on individual risk drivers (BCBS, 2005).
It should also be noted that the report does not analyse whether the lower asset value correlations of SMEs (suggesting a lower RW for some SMEs) is significant enough to outweigh the level of unexpected loss compared to large corporates.
44 Commission Recommendation 2003/361/EC of 6 May 2003 concerning the definition of micro, small and medium-sized enterprises. 45 For more details on the model and the underlying assumptions, see: Basel (2006), International Convergence of Capital Measurement and Capital Standards. 46 This is the case for the corporate and the other retail exposure classes in the IRBA. The residential mortgages and qualifying revolving retail exposures are assigned a flat asset correlations value.
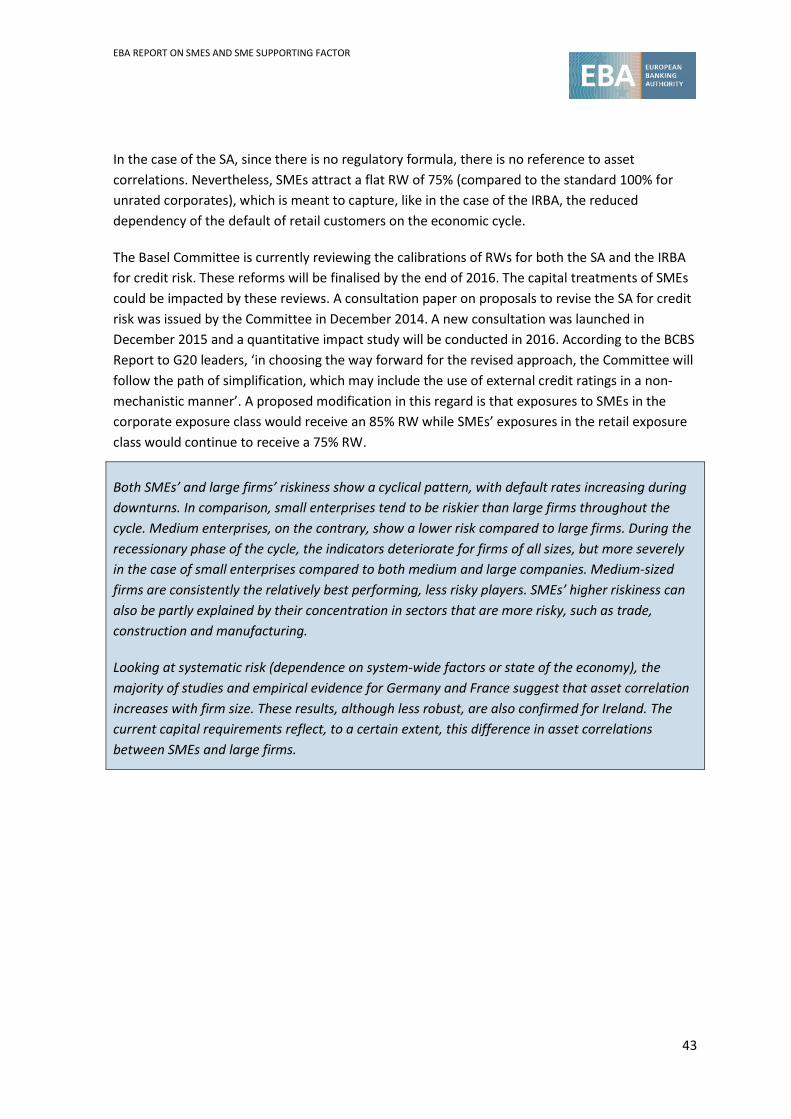
EBA REPORT ON SMES AND SME SUPPORTING FACTOR
43
In the case of the SA, since there is no regulatory formula, there is no reference to asset correlations. Nevertheless, SMEs attract a flat RW of 75% (compared to the standard 100% for unrated corporates), which is meant to capture, like in the case of the IRBA, the reduced dependency of the default of retail customers on the economic cycle.
The Basel Committee is currently reviewing the calibrations of RWs for both the SA and the IRBA for credit risk. These reforms will be finalised by the end of 2016. The capital treatments of SMEs could be impacted by these reviews. A consultation paper on proposals to revise the SA for credit risk was issued by the Committee in December 2014. A new consultation was launched in December 2015 and a quantitative impact study will be conducted in 2016. According to the BCBS Report to G20 leaders, ‘in choosing the way forward for the revised approach, the Committee will follow the path of simplification, which may include the use of external credit ratings in a non-mechanistic manner’. A proposed modification in this regard is that exposures to SMEs in the corporate exposure class would receive an 85% RW while SMEs’ exposures in the retail exposure class would continue to receive a 75% RW.
Both SMEs’ and large firms’ riskiness show a cyclical pattern, with default rates increasing during downturns. In comparison, small enterprises tend to be riskier than large firms throughout the cycle. Medium enterprises, on the contrary, show a lower risk compared to large firms. During the recessionary phase of the cycle, the indicators deteriorate for firms of all sizes, but more severely in the case of small enterprises compared to both medium and large companies. Medium-sized firms are consistently the relatively best performing, less risky players. SMEs’ higher riskiness can also be partly explained by their concentration in sectors that are more risky, such as trade, construction and manufacturing.
Looking at systematic risk (dependence on system-wide factors or state of the economy), the majority of studies and empirical evidence for Germany and France suggest that asset correlation increases with firm size. These results, although less robust, are also confirmed for Ireland. The current capital requirements reflect, to a certain extent, this difference in asset correlations between SMEs and large firms.

EBA REPORT ON SMES AND SME SUPPORTING FACTOR
44
Figure 14. Regulatory treatment of SME exposures under the SA and the IRBA
Eligibility Regulatory treatment
SA
Corporate Not eligible for retail or any other exposure class.47
Same treatment as large firms: Rated: Risk-weighted based on rating. Unrated: Maximum RW between 100% and sovereign RW.
Retail
Defined as SME (as defined by the institution) or natural person; SME (as defined by the institution) or natural person: Amount owed to institution and its parent undertakings capped at EUR 1 million; Exposure should be one of a significant number of exposures with similar characteristics, such that the risks associated with such lending are substantially reduced.
Different treatment compared to large firms: All retail: Flat 75% RW.
IRBA
Corporate Not eligible for retail or any other exposure class.48
Different treatment compared to large firms: Corporates with an annual turnover below EUR 50 million: Asset correlation coefficient includes a size adjustment.49
Retail
Defined as SME (as defined by the institution) or natural person; SME (as defined by institution): Amount owed to institution and its parent undertakings capped at EUR 1 million; The exposures should be consistently treated by institutions in their risk management over time and, in a similar manner, they should not be managed individually (as in the corporate exposure class), and each should represent one of a significant number of similarly managed exposures.
Different treatment compared to large firms: Retail exposures secured by immovable property collateral: Flat asset correlation coefficient of 15%. Qualifying revolving retail exposures: Flat asset correlation coefficient of 4%. Other retail: Asset correlation coefficient based on formula50 (3%-16%).
Note: Please refer to the CRR for a more detailed account of the treatment of SMEs under the SA and the IRBA. Source: Compiled based on the CRR.
47 Please refer to the CRR for the more detailed specifications. 48 Please refer to the CRR for the more detailed specifications. 49 The asset correlation coefficient for the corporate exposure class is 12%-24%. The application of the size adjustment allows one to reduce it down to 8%-20%, depending on size (turnover) and PD. The formula for the asset correlation coefficient for IRBA corporate exposures is provided in Article 153 of the CRR. 50 The formula for the asset correlation coefficient for IRBA retail exposures is provided in Article 154 of the CRR.

EBA REPORT ON SMES AND SME SUPPORTING FACTOR
45
4. SME lending trends and conditions This section of the report focuses on the analysis of the lending trends and conditions for SMEs. The first part analyses the general trend of new lending to SMEs, lending stocks and consistency with rejection rates. The second part looks at lending conditions (with a main focus on interest rates), as well as other terms of conditions.51
SME lending trends 4.1
This section looks at lending trends mainly based on the ECB data for the euro area countries and SME lending data in selected non-euro area countries to analyse SME lending over the cycle. To complement this information, the EBA supervisory data is used to analyse differences in SME lending across banks.
Evolution of SME lending over the cycle 4.1.1
The volume of new lending to SMEs in the euro area has declined since 2008, the beginning of the economic and financial crisis. As shown in Panel A of Figure 15, between 2003 and 2008, monthly new lending to SMEs—proxied by loans to NFCs of up to, and including, EUR 1 million52—in the euro area increased and peaked at about EUR 95 billion in mid-2008. Since then, consistent declines are observed up until 2012, at which point new lending appears to have stabilised at approximately EUR 54 billion (mean monthly lending for 2013/2014). The ECB data does not include non-euro area countries, but a similar time series (based on loan size proxies of SMEs) was provided by the Czech Republic.53 Similar to the ECB data, the trend in Panel B of Figure 15 shows an increase in lending of large size loans before a reversal of a trend towards the end of 2008, when the financial crisis started.
New lending to large companies show a stronger increase before the crisis and a decrease thereafter. The decline was particularly pronounced in the 2 years following the beginning of the financial crisis. In addition, unlike SME lending, volume of lending to large companies has already recovered to its 2003-2004 pre-crisis level. The faster recovery of large companies may be explained by the access to alternative sources of financing, such as bond financing, as the role of bonds in euro area corporate financing has consistently increased during the last decades. 54
51 This section will focus on lending outcomes, without further separation of factors determining the lending into supply and demand factors. Disentangling the role of each of these factors is a difficult task due to several reasons: credit demand and supply are unobservable, and there are factors that drive both demand and supply (e.g. economic growth). Hence, the identification of factors determining demand vs supply is not straightforward. 52 It should be noted that loan size, on the one hand, may not contain all SME loans (as they may be part of the retail/household categories in the monetary statistics) and, on the other hand, may also contain some ‘non-SME’ loans. 53 Other countries do not have data on new SME lending or started collecting it only recently. 54 This increase has been 760%, from about EUR 500 billion in January 1999 to EUR 4.3 trillion in November 2014 (ECB)

EBA REPORT ON SMES AND SME SUPPORTING FACTOR
46
Figure 15. New lending to SMEs in the euro area and other EU countries
3-month moving average
A. Euro area
Note: New lending is defined as ‘loans other than revolving loans and overdrafts, convenience and extended credit card debt’ to NFCs; SMEs are proxied by loans up to and including EUR 1 million. Large enterprises are proxied by loans over EUR 1 million. Source: ECB MFI interest rate statistics.
B. Czech Republic
Note: SMEs are proxied by loans without overdrafts, credit cards and revolving up to CZK 30 million (approximately EUR 1.1 million). Large enterprises are proxied by loans over CZK 30 million. The loans are converted based on the exchange rate at the end of period. Source: Monetary statistics of the Czech Republic.
0
500
1 000
1 500
2 000
2 500
3 000
Mar
-04
Aug-
04Ja
n-05
Jun-
05No
v-05
Apr-0
6Se
p-06
Feb-
07Ju
l-07
Dec-
07M
ay-0
8Oc
t-08
Mar
-09
Aug-
09Ja
n-10
Jun-
10No
v-10
Apr-1
1Se
p-11
Feb-
12Ju
l-12
Dec-
12M
ay-1
3Oc
t-13
Mar
-14
Aug-
14Ja
n-15
Global financial crisis Introduction of the CRRUp to CZK 30 million (~EUR 1.2 million) Over CZK 30 million (~EUR 1.2 million)
EUR million

EBA REPORT ON SMES AND SME SUPPORTING FACTOR
47
Both graphs show, for reference, the beginning of the global financial crisis (2008Q4-2009Q4) as a key event that triggered the credit contraction, and the period when the CRR is applied in the EU. It is to be noted, however, that other important events and programmes that may have an impact on lending were introduced in this period, but are not presented in the graphs for simplicity reasons. Among these, in August 2012, the ECB announced that it would undertake OMTs in secondary, sovereign bond markets, aimed ‘at safeguarding an appropriate monetary policy transmission and the singleness of the monetary policy’. According to a recent study (Ferrando et al., 2015), this measure had an immediate positive impact on access to finance during the first 6 months after the announcement of the ECB’s OMT programme in countries that were affected more severely by the crisis.55 These additional factors should be kept in mind when interpreting the lending trends.
Besides the general trend, there is significant heterogeneity in the new lending across countries. Using, as a basis, the observed lending trends before and after the crisis, Figure 16 presents the mean growth rate in annual new lending in the euro area and the Czech Republic for equal periods of time pre- and post 2008, as well as the mean growth rate after 2014 (when the CRR was implemented in the EU). The majority of countries showed positive new lending growth between 2004 and 2007—in particular, Ireland (mean annual growth of 23.8%), France (17.5%), Italy (8.9%), Finland (9.1%) and Belgium (4.1%). Between 2008 and 2013, negative mean annual growth rates are observed for all countries (except Belgium56 and Austria). In this regard, Ireland, Slovenia and Spain show the largest reductions in annual new lending, with mean growth rates of -21.7%, -9.9% and -15.9% respectively. Overall, countries showing the strongest rise in new lending were not necessarily those countries where the lending flow declined the most. After the introduction of the CRR, the growth rate varies across countries.
55 This effect is particularly strong after the exclusion from the control group of German firms, which experienced a remarkable short-run improvement in credit access during the period due to a return in confidence in the domestic banking system 56 In the case of Belgium, the growth in SME lending is largely attributed to a newly introduced public guarantee scheme.

EBA REPORT ON SMES AND SME SUPPORTING FACTOR
48
Figure 16. Mean annual growth rates in new SME lending
Note: Mean growth rates are based on the average year-on-year growth in monthly new lending to SMEs in euro area countries, and in quarterly new lending to SMEs in the Czech Republic. For euro area countries, new lending is defined as ‘loans other than revolving loans and overdrafts, convenience and extended credit card debt’ to NFCs; SMEs are proxied by loans up to and including EUR 1 million. Data for Estonia, Lithuania, Slovakia and Slovenia are not available for the period 2003-2007. Expressed as an average of monthly year-on-year growth rates over the specified periods. *In the case of the Czech Republic, new lending is defined as loans without overdrafts, credit cards and revolving to NFCs. SMEs are proxied by loans up to CZK 30 million (approximately EUR 1.1 million). Source: ECB MFI interest rate statistics, Monetary Statistics of the Czech Republic.
The share of new SME lending in total new lending has decreased in the period 2004-2008 from one third to almost one fifth, showing that large corporations accounted for the major part of credit growth before the crisis (Figure 17). Since the beginning of the financial crisis, the share in SME lending has steadily increased and, in 2014, its share reached 28%—close to its pre-crisis level—of total bank loans to NFCs in the euro area. On a country basis (Figure 18), this is the case for Germany, Spain, Ireland, and Portugal. The share of SME loans even surpassed its pre-crisis level in Belgium, France, Italy, Lithuania and the Netherlands, which was, however, caused by less new lending to larger corporates than to SMEs. In other countries, the share of SME loans remained below pre-crisis levels mainly due to an increase in new lending to larger corporates while lending to SMEs was less strong in 2014.
As a share of GDP, new lending was steady at about 11% before 2008 but then declined consistently up until 2014 to less than 7% (Figure 17). The largest percentage point declines are registered in Spain, Slovenia, Cyprus and Ireland (Figure 19). In contrast, the change between the periods 2003-2007 and 2008-2013 is relatively more stable across countries, with the exception of Spain and Portugal (which show large declines) and Slovenia (which shows large increases).

EBA REPORT ON SMES AND SME SUPPORTING FACTOR
49
Figure 17. New bank lending to SMEs in the euro area as a share of total lending and GDP
Note: New lending is defined as ‘loans other than revolving loans and overdrafts, convenience and extended credit card debt’ to NFCs; SMEs are proxied by loans up to and including EUR 1 million. Source: ECB MFI interest rate statistics and Eurostat (quarterly national accounts).
Figure 18. New bank lending to SMEs as a share of total bank loans to enterprises
Note: New lending is defined as ‘loans other than revolving loans and overdrafts, convenience and extended credit card debt’ to NFCs; SMEs are proxied by loans up to and including EUR 1 million. Source: ECB MFI interest rate Statistics.
0
10
20
30
40
50
60
2004-2008 2009-2013 2014-Oct 2015
Per cent

EBA REPORT ON SMES AND SME SUPPORTING FACTOR
50
Figure 19. New annual bank lending to SMEs as a share of GDP
Note: New lending defined as ‘loans other than revolving loans and overdrafts, convenience and extended credit card debt’ to NFCs; SMEs are proxied by loans up to and including EUR 1 million. GDP data for Luxembourg refers to 2013. Source: ECB MFI interest rate statistics and Eurostat (quarterly national accounts).
Given the above trends in lending flows, declines in lending stocks are expected. Total volume of outstanding loans both to small and large companies, shown in Figure 20, declined in January 2015 by approximately 12% (down to EUR 4.3 trillion) compared to the peak in January 2009 (EUR 4.9 trillion).57 As the data does not differentiate between small and large loans, the actual share of SMEs in the total outstanding loans is not known. Given, however, a higher decrease in new SME lending compared to large corporates, it is expected that the SME share in outstanding loans also decreased.
Figure 20. Monthly outstanding loans to enterprises in the euro area
Note: Outstanding loans are defined as ‘outstanding amounts at the end of the period (stocks)’ for all loan amounts. Source: ECB MFI interest rate statistics.
57 Stock data includes lending to all NFCs (including larger firms). It is not possible to differentiate between SMEs and large firms in this data series.
0
1
2
3
4
5
6
Global financial crisis Introduction of the CRR Outstanding loans
EUR trillion

EBA REPORT ON SMES AND SME SUPPORTING FACTOR
51
It appears that the decreases in post-crisis lending stocks are larger in countries that experienced the highest pre-crisis expansions. This relationship can be observed in Figure 21, which shows, on the x-axis, the percentage increase in stocks in January 2009 relative to January 2003. The y-axis shows the percentage decrease in stocks in January 2015 relative to January 2009. For example, Ireland, Spain and Slovenia show both the largest pre-crisis expansions and subsequent post-crisis contractions.
Figure 21. Change in outstanding loans to enterprises, pre- and post crisis, in the euro area
Note: Outstanding loans are defined as ‘outstanding amounts at the end of the period (stocks)’ for all loan amounts. The x-axis shows the percentage change in stocks in January 2009 relative to January 2003. The y-axis shows the percentage decrease in stocks in January 2015 relative to January 2009. For Slovenia and Slovakia, the base year is 2004 and 2006 respectively, due to missing data for these countries before these dates. Data are monthly. Source: ECB MFI interest rate statistics.
Additional data on lending stocks was provided by EU countries (Figure 22). Almost all countries that provided the data use the 2003 EU definition of SMEs, which means it is comparable across countries. In the case of Poland and Slovakia, only the employment criterion of the EU definition is applied (employment should not exceed 250 employees). The data shows that there were significant differences in the trends of lending stocks in the EU countries after the crisis.
In Belgium, Poland, France and Slovakia, SME stocks have increased consistently after the crisis. In the case of Belgium and Slovakia, where a more granular breakdown by size is available, data shows that the increase was mainly accounted for by lending to micro firms. In Latvia and Romania, on the other hand, micro firms experienced a steep decline in lending following the crisis, which contrasts with a milder decline and recovery in the lending for small and medium firms.

EBA REPORT ON SMES AND SME SUPPORTING FACTOR
52
Figure 22. Lending stocks of SME loans in selected EU countries
A. Belgium B. France
C. Ireland (total and core SMEs)
-
10
20
30
40
50
60
70
Jul-0
5Ja
n-06
Jul-0
6Ja
n-07
Jul-0
7Ja
n-08
Jul-0
8Ja
n-09
Jul-0
9Ja
n-10
Jul-1
0Ja
n-11
Jul-1
1Ja
n-12
Jul-1
2Ja
n-13
Jul-1
3Ja
n-14
Jul-1
4Ja
n-15
Jul-1
5
EUR
Billi
on
Global financial crisis Introduction of the CRR
Micro Small
Medium Large
-
50
100
150
200
250
300
350
400
450
Jul-0
5
Jan-
06
Jul-0
6
Jan-
07
Jul-0
7
Jan-
08
Jul-0
8
Jan-
09
Jul-0
9
Jan-
10
Jul-1
0
Jan-
11
Jul-1
1
Jan-
12
Jul-1
2
Jan-
13
Jul-1
3
Jan-
14
Jul-1
4
Jan-
15
Jul-1
5
EUR
Billi
on
Global financial crisis Introduction of the CRR
SMEs Large
-
20
40
60
80
100
120
140
160
180
Jun-
05Fe
b-06
Oct
-06
Jun-
07Fe
b-08
Oct
-08
Jun-
09Fe
b-10
Oct
-10
Jun-
11Fe
b-12
Oct
-12
Jun-
13Fe
b-14
Oct
-14
Jun-
15
EUR
Billi
on
Global financial crisis Introduction of the CRRSME Large
-
5
10
15
20
25
30
35
40
Jun-
05
Feb-
06
Oct
-06
Jun-
07
Feb-
08
Oct
-08
Jun-
09
Feb-
10
Oct
-10
Jun-
11
Feb-
12
Oct
-12
Jun-
13
Feb-
14
Oct
-14
Jun-
15
EUR
Billi
on
Global financial crisis Introduction of the CRR
SME - Core Large-Core
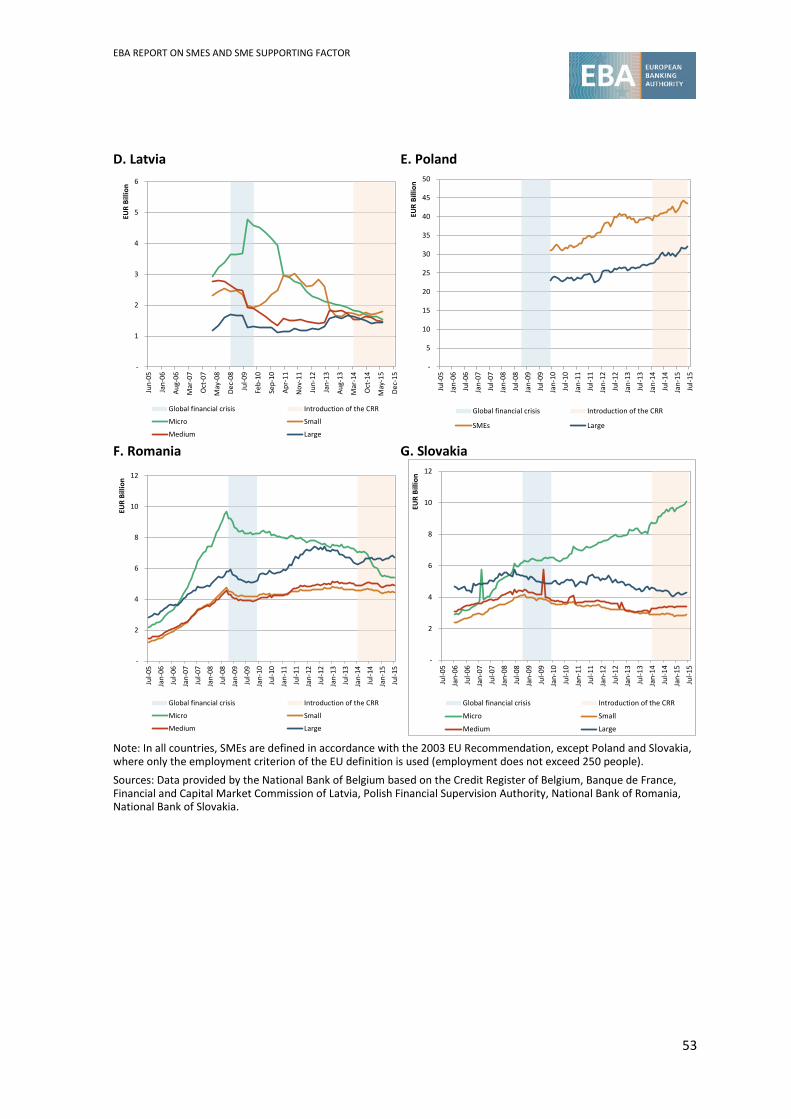
EBA REPORT ON SMES AND SME SUPPORTING FACTOR
53
D. Latvia E. Poland
F. Romania G. Slovakia
Note: In all countries, SMEs are defined in accordance with the 2003 EU Recommendation, except Poland and Slovakia, where only the employment criterion of the EU definition is used (employment does not exceed 250 people). Sources: Data provided by the National Bank of Belgium based on the Credit Register of Belgium, Banque de France, Financial and Capital Market Commission of Latvia, Polish Financial Supervision Authority, National Bank of Romania, National Bank of Slovakia.
-
1
2
3
4
5
6
Jun-
05
Jan-
06
Aug-
06
Mar
-07
Oct
-07
May
-08
Dec-
08
Jul-0
9
Feb-
10
Sep-
10
Apr-
11
Nov
-11
Jun-
12
Jan-
13
Aug-
13
Mar
-14
Oct
-14
May
-15
Dec-
15
EUR
Billi
on
Global financial crisis Introduction of the CRR
Micro Small
Medium Large
-
5
10
15
20
25
30
35
40
45
50
Jul-0
5
Jan-
06
Jul-0
6
Jan-
07
Jul-0
7
Jan-
08
Jul-0
8
Jan-
09
Jul-0
9
Jan-
10
Jul-1
0
Jan-
11
Jul-1
1
Jan-
12
Jul-1
2
Jan-
13
Jul-1
3
Jan-
14
Jul-1
4
Jan-
15
Jul-1
5
EUR
Billi
onGlobal financial crisis Introduction of the CRR
SMEs Large
-
2
4
6
8
10
12
Jul-0
5
Jan-
06
Jul-0
6
Jan-
07
Jul-0
7
Jan-
08
Jul-0
8
Jan-
09
Jul-0
9
Jan-
10
Jul-1
0
Jan-
11
Jul-1
1
Jan-
12
Jul-1
2
Jan-
13
Jul-1
3
Jan-
14
Jul-1
4
Jan-
15
Jul-1
5
EUR
Billi
on
Global financial crisis Introduction of the CRR
Micro Small
Medium Large
-
2
4
6
8
10
12
Jul-0
5Ja
n-06
Jul-0
6Ja
n-07
Jul-0
7Ja
n-08
Jul-0
8Ja
n-09
Jul-0
9Ja
n-10
Jul-1
0Ja
n-11
Jul-1
1Ja
n-12
Jul-1
2Ja
n-13
Jul-1
3Ja
n-14
Jul-1
4Ja
n-15
Jul-1
5
EUR
Billi
on
Global financial crisis Introduction of the CRR
Micro Small
Medium Large

EBA REPORT ON SMES AND SME SUPPORTING FACTOR
54
Heterogeneity of lending across banks 4.1.2
This section investigates bank-level heterogeneity in the supply of credit to both SMEs and large firms. In contrast to the ECB data presented in this section, the EBA supervisory data used for this analysis is only available for the period after the introduction of the SME SF—i.e. from first to third quarter of 2014 for COREP and FINREP, respectively. In order to compare SME lending, we split the sample of banks based on different criteria: (i) the results of the stress tests, and (ii) level of NPLs. Another relevant criterion would be the business model of the bank. However, due to lack of information within the EBA, this breakdown of banks will not be conducted.
In Figure 23, the sample of banks reporting to the EBA is split in two groups. One group includes 24 banks that failed the 2014 EBA stress tests58 (labelled as ‘constrained banks’ throughout this section). The second group includes the banks that participated and passed the 2014 EBA stress tests (‘unconstrained banks’). To ensure that the trends are not being driven by a specific set of countries, the figures also present the exposures of capital unconstrained banks that are operating in the same countries as those in which capital constrained banks operate—except Germany.59
The results from the bank-level EBA supervisory data in Figure 23 indicate that:
Capital constrained banks decrease both SME and large firm exposures from first quarter of 2014 to the second quarter of 2015. Capital unconstrained banks respective exposures, however, follow the opposite trend. This evidence is consistent with the existing academic literature that suggests that, despite the short-term costs in terms of credit supply reduction that increased capital requirements may entail, higher bank capital ultimately makes bank lending more robust and stable over time (see section six);
While the decrease in large firm exposures is roughly of the same magnitude as the decrease in SME exposures for capital constrained banks, the increase in large firm exposures is considerably higher than the increase in SME exposures for capital unconstrained banks.
58 See the full report on the 2014 Stress Test Results here: http://www.eba.europa.eu/documents/10180/669262/2014+EU-wide+ST-aggregate+results.pdf 59 Germany is excluded in order to perform a robustness test, as it can be argued that capital constrained banks can be concentrated in a few countries and we want to remove this potential confounding factor when comparing them with capital unconstrained banks. We removed Germany from this additional robustness test because there is only one German bank that failed the EBA stress tests in 2014 and because Germany is overall different from the rest of the countries that have banks that failed the stress tests.

EBA REPORT ON SMES AND SME SUPPORTING FACTOR
55
Figure 23. SME exposures in capital constrained vs capital unconstrained banks
2014Q1 (first quarter 2014) = 100
SME expsoures Large firm exposures
Source: The EBA supervisory data.
Figure 24 explores the differences between high NPL and low NPL banks. For this purpose, the sample of EU banks is split into three groups according to their NPL ratios in the third quarter of 2014 (i.e. high, medium, low), and then SME and large firm exposures in the high and low NPL groups of banks are compared.60 Similar to the previous exercise, to ensure that the trends are not being driven by a specific set of countries, the figures also present the exposures of low NPL banks that are operating in the same countries as those in which high NPL banks operate—except Germany.
The results suggest that while banks with high SME NPLs as a percentage of total loans decrease their SME exposures from the third quarter of 2014 to the second quarter of 2015, banks with low SME NPLs increase them when analysed in the same period. The same holds when considering high vs low large firm NPL banks and their respective large firm exposures.
60 When analysing SME exposures, we consider SME NPLs divided by total loans to construct the three groups of banks. Instead, we define the NPL ratio as large firm NPLs divided by total loans when looking at large firm exposures.
85
90
95
100
105
110
115
2014Q1 2014Q2 2014Q3 2014Q4 2015Q1 2015Q285
90
95
100
105
110
115
2014Q1 2014Q2 2014Q3 2014Q4 2015Q1 2015Q2
Constrained banks
Unconstrained banks
Unconstrained banksoperating in the samecountries asconstrained banks

EBA REPORT ON SMES AND SME SUPPORTING FACTOR
56
Figure 24. SME exposures in high NPL vs low NPL banks
2014Q1 (first quarter 2014) = 100
SME expsoures Large Firm exposures
Source: The EBA supervisory data.
SME lending conditions 4.2
This section first looks at interest rates (for which data is available) for the euro area and several non-euro area countries. Second, it looks at collateral requirements based on available data. The section also looks at the evolution of perceptions of credit conditions based on survey results.
Interest rates 4.2.1
As far as lending conditions are concerned, interest rates are higher for SMEs than for larger firms. This difference has been exacerbated by the financial crisis and has not been resorbed since. In accordance with ECB MFI interest rate statistics (Figure 25), the most comprehensive data set for interest rates, bank interest rates are an average of 1.1 points higher for loans up to and including EUR 1 million (proxy for SME loans) than for loans over EUR 1 million (proxy for loans to large companies). This spread widened since the beginning of the financial crisis. It has risen from an average of 0.89 points up until 2008 to an average of 1.34 points since 2009. However, since 2014, the spread has declined. This decline is also the result of the prevailing monetary policies in the EU, where the interest rates have been kept low after the crisis to provide a boost to the economy.
Additional evidence on the differences across countries is provided in Figure 26. It presents examples for the largest euro area countries and shows that the spreads vary across countries, which may indicate that many factors affect interest rates, both on the demand side of the loan (e.g. how developed are other sources of financing, and riskiness of the borrower) and on the supply side of the loan (e.g. how ‘valuable’ is that client for the bank).
92
94
96
98
100
102
104
106
108
2014Q3 2014Q4 2015Q1 2015Q292
94
96
98
100
102
104
106
108
2014Q3 2014Q4 2015Q1 2015Q2
High NPL banks
Low NPL banks
High NPL banks inthe samecountries as lowNPL banks

EBA REPORT ON SMES AND SME SUPPORTING FACTOR
57
Figure 25. Bank interest rates to NFCs in the euro area
Note: The interest rate data presented in the graph does not take into account the cost of funding. SMEs are proxied by loans up to and including EUR 1 million. Large enterprises are proxied by loans over EUR 1 million. Source: ECB MFI interest rate statistics.
Figure 26. Interest rate spread between SMEs and larger NFCs in selected countries
3-month moving average
Note: SMEs are proxied by loans up to and including EUR 1 million. Expressed as 3-month moving averages. Source: ECB MFI interest rate statistics.
Interest rates charged to SMEs have been increasingly diverging within the euro area since the beginning of the financial crisis. As shown in Figure 27, from 2002 to 2008, the average spread between the highest and the lowest national rates is 2.3 percentage points. Since 2009, it has gone up to an average of 4.3 percentage points. In addition, while the euro area median interest rate was close to the minimum rate before the crisis, it has deviated from it since 2009, indicating

EBA REPORT ON SMES AND SME SUPPORTING FACTOR
58
that the upper rates concern more countries than before. However, both the minimum and the maximum rates have declined considerably since the beginning of the financial crisis.
The low interest rate environment should be kept in mind as a dominant factor in this regard. While an interest rate spread between loans to SMEs and large firms can still be observed in 2014, the low interest rate environment has led to lower interest rate levels for both types of firms with respect to the peak of the crisis. In some countries, the interest rate spread between SMEs and large firms has also ameliorated in recent periods.
Figure 27. Bank interest rates (min, max, median and spread) for SME loans in the euro area
Note: SME loans proxied by loans up to and including EUR 1 million. The interest rate data presented in the graph does not take into account the cost of funding. Source: ECB MFI interest rate statistics.
Broken down by maturity in order to differentiate short-term (up to 1 year) from long-term lending (over 1 year), statistics show that bank interest rates charged to SMEs are higher in all cases and that the financial crisis has widened the spread with larger firms for both short-term and long-term lending. However, since 2014, the spread has declined, as shown in Figure 28. SMEs are charged higher interest rates for short-term lending, and this spread has grown stronger since 2012 than the one within long-term lending. The compilation of short-term lending rates to NFCs needs to account for two technical factors: the importance of overdrafts as a main source of financing for firms in some large euro area economies, and the computation of an estimate of the share of long-term loans issued at floating rates, which are similar to short-term loans.
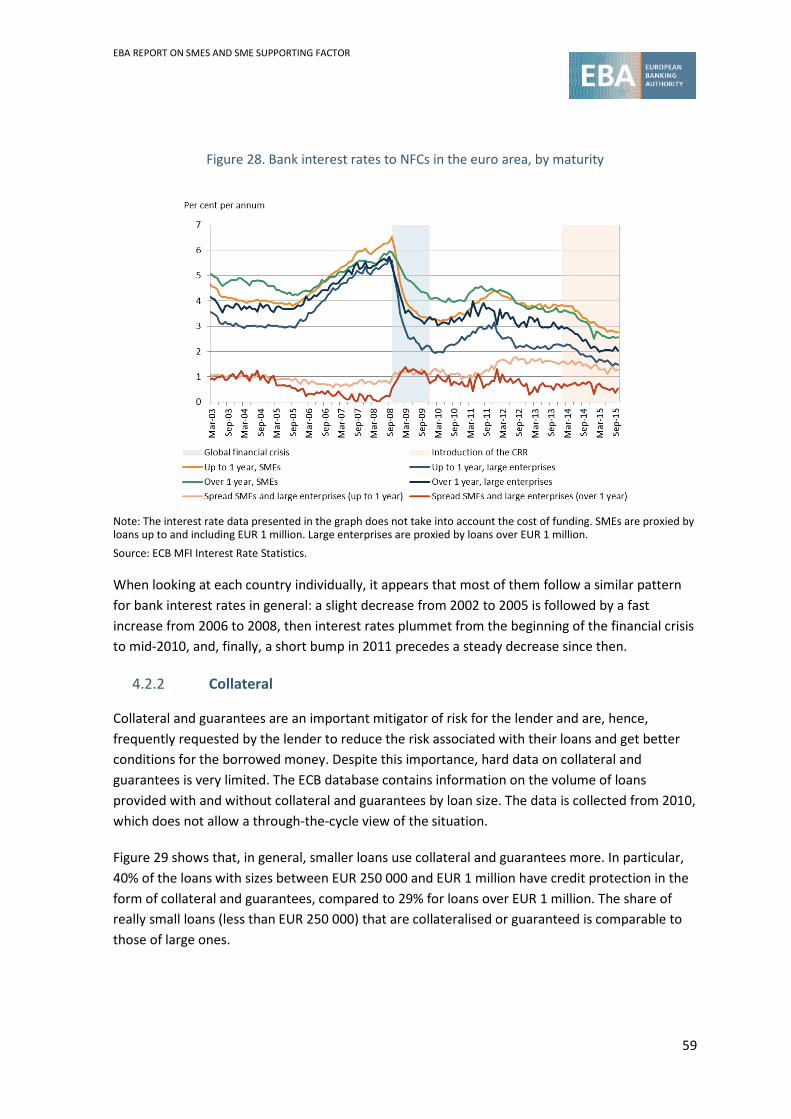
EBA REPORT ON SMES AND SME SUPPORTING FACTOR
59
Figure 28. Bank interest rates to NFCs in the euro area, by maturity
Note: The interest rate data presented in the graph does not take into account the cost of funding. SMEs are proxied by loans up to and including EUR 1 million. Large enterprises are proxied by loans over EUR 1 million. Source: ECB MFI Interest Rate Statistics.
When looking at each country individually, it appears that most of them follow a similar pattern for bank interest rates in general: a slight decrease from 2002 to 2005 is followed by a fast increase from 2006 to 2008, then interest rates plummet from the beginning of the financial crisis to mid-2010, and, finally, a short bump in 2011 precedes a steady decrease since then.
Collateral 4.2.2
Collateral and guarantees are an important mitigator of risk for the lender and are, hence, frequently requested by the lender to reduce the risk associated with their loans and get better conditions for the borrowed money. Despite this importance, hard data on collateral and guarantees is very limited. The ECB database contains information on the volume of loans provided with and without collateral and guarantees by loan size. The data is collected from 2010, which does not allow a through-the-cycle view of the situation.
Figure 29 shows that, in general, smaller loans use collateral and guarantees more. In particular, 40% of the loans with sizes between EUR 250 000 and EUR 1 million have credit protection in the form of collateral and guarantees, compared to 29% for loans over EUR 1 million. The share of really small loans (less than EUR 250 000) that are collateralised or guaranteed is comparable to those of large ones.

EBA REPORT ON SMES AND SME SUPPORTING FACTOR
60
Figure 29. Share of volume of loans with collateral and guarantees in total loans by loan size
Source: ECB MFI interest rate statistics.
An important aspect of lending conditions is also the share of loan effectively covered by collateral or guarantee. Such information, however, is not available. Some indication of the burden of collateral on SMEs is provided through access to finance surveys conducted by the ECB and Eurostat, and presented later in this section.
Survey results on lending conditions 4.2.3
Survey data on access to finance complement statistics on bank interest rates and collateral to show the SMEs’ and banks’ perceptions of lending conditions. At the European level, the BLS and the SAFE monitor credit standards and conditions to enterprises, including SMEs.
Over the recent years, access to finance has remained of greater concern to SMEs than to large enterprises, mainly because SMEs depend very much on bank financing. On average, as reported by euro area SMEs, access to finance has moved down over the years as the most pressing problem (Figure 30). In absolute terms, 10.4% of SMEs considered it the most important in 2014, while the number was 17% in 2009. However, there are great disparities by countries. In Greece, Ireland, Spain and Portugal, access to finance is a more pressing problem for SMEs than in Germany and Austria, where less than 10% of SMEs reported access to finance as the most pressing problem (not presented graphically).
According to the ECB’s and the Commission’s SAFE, in 2009-2015, about 24% of the EU SMEs that applied for a loan did not get the full finance they needed, compared to 14% for larger companies (Figure 30). In both cases, however, the share of firms that encountered some type of obstacles in obtaining finance has decreased significantly since 2009. In the most recent survey, around 8% of SME loan applications were rejected and 5.6% of companies received less than 75% of the amount they applied for. In addition, 1.6% declined the loan offer from the bank because they found the conditions unacceptable.
0
10
20
30
40
50
Jun-
10
Sep-
10
Dec-
10
Mar
-11
Jun-
11
Sep-
11
Dec-
11
Mar
-12
Jun-
12
Sep-
12
Dec-
12
Mar
-13
Jun-
13
Sep-
13
Dec-
13
Mar
-14
Jun-
14
Sep-
14
Dec-
14
Mar
-15
Jun-
15
Sep-
15
Up to and including EUR 0.25 million Over EUR 0.25 million and up to EUR 1 million
Over EUR 1 million
Per cent

EBA REPORT ON SMES AND SME SUPPORTING FACTOR
61
Figure 30. Obstacles to receiving a bank loan for SMEs in the EU 28
A: SMEs B: Large enterprises
Note: An enterprise is classified as an SME if its number of employees is lower than 250. Application outcomes are expressed as a percentage of all SMEs that applied for a bank loan in Panel A, and as a percentage of all large enterprises in Panel B. Access to finance as the most pressing problem is expressed as a percentage for all SMES in Panel A, and for all large enterprises in Panel B. Source: The Commission’s SAFE and the EBA calculations.
Overall, in 2015, approximately 6% of all SMEs were too discouraged to apply for a loan, because of anticipated rejection, a figure that has not changed significantly since 2009. Taken together with the loan applications that were either rejected or only partially served or refused by the SME, the survey results show that approximately 11% of SMEs experience some issues with bank loan financing, compared to 5% of large corporates (Figure 31). In both cases, the figures have decreased since 2009 by one third in the case of SMEs and by 50% for large corporates.
Figure 31. Obstacles to receiving a bank loan for SMEs in the EU 28
A: SMEs B: Large enterprises
Note: Expressed as a percentage of all SMEs for Panel A, and for all large enterprises for Panel B. An enterprise is classified as an SME if its number of employees is lower than 250. Source: The Commission’s SAFE and the EBA calculations.

EBA REPORT ON SMES AND SME SUPPORTING FACTOR
62
The obstacles to finance also vary by firm size within the SME sector (Figure 32). In 2015, all the size groups have shown a decrease in obstacles encountered when applying for a loan. This decrease comes after a general increase in the share of micro, small and medium-sized firms that encountered obstacles in 2014, compared to previous years. Looking at the full sample of SMEs (Panel B of Figure 33), the obstacle to finance (which also includes firms discouraged to apply for a loan) has increased in 2014 and decreased in 2015 for firms of all sizes, which shows that the recovery is affecting firms of all sizes.
Figure 32. Financing obstacles in the EU 28, by enterprise size
Net percentage of respondents; a positive number denotes an increase
A: Enterprises that applied for a loan B: All enterprises
Note: Financing obstacles refer to those applicants that applied for a bank loan but refused because the cost was too high, that applied but were rejected, and those that applied but only got a limited part of it. For Panel B, it also includes discouraged applicants (those that did not apply for fear of rejection). ‘Micro’ refers to enterprises with less than 10 employees, ‘small’ refers to companies between 10 and 50 employees, ‘medium’ to companies between 50 and 250, and ‘large’ to companies over 250 employees. Source: The Commission’s SAFE.
Turning to more specific loan conditions, on average, as reported by the euro area SMEs, charges and fees were substantially increasing over the whole 2009-2014 period. As shown in Figure 33, collateral requirements as perceived by the respondents of the survey were also increasing, to some extent at a slightly slower pace. Maturity and size of loan available were both rather stable at the EU level, given that a roughly equal share of SMEs that applied for a loan reported an increase and decrease in these terms over the 11 survey rounds. For large companies, size of the loan showed a small increase. Interest rates first increased at an accelerated pace, then were still evaluated as increasing but at a diminishing speed, and finally decreased in net terms in the last survey round. Again, there are great differences across countries in pace or direction of changes for the specific lending conditions.
Unfortunately, an important limitation of the SAFE data is the coverage period—data collection started only in 2009, so it is not possible to analyse the situation over the full economic cycle. However, some longer data series of the BLS could be compared with the SAFE results. Combining those two sources also offers an opportunity to look at the SME financing conditions and trends from both sides—from the banks’ point of view (BLS) and from the SMEs’ perspective (SAFE).

EBA REPORT ON SMES AND SME SUPPORTING FACTOR
63
Figure 33. Changes in terms and conditions of banks loans granted to EU 28 enterprises
Net percentage of respondents; a positive number denotes an increase
A: Large enterprises B: SMEs
Note: Expressed as a percentage of enterprises that had applied for bank loans (including subsidised bank loans), credit lines, bank overdrafts or credit card overdrafts. An enterprise is classified as an SME if its number of employees is lower than 250. H stands for “half year”. Source: The Commission SAFE.
Figure 34 shows that the perceptions regarding the tightening of credit supply of the banks responding to the BLS are in line with the perceptions of SMEs and large companies responding to the SAFE. It can be noticed that SMEs’ view is in line with the banks’ view on the tightening of credit standards for SME financing after the crisis, and sometimes even show a more pessimistic view of the situation than banks. In contrast, in the case of large companies—although, in general, the perceptions move in the same direction—the large companies’ view that credit supply is tightening is less pronounced compared to the view of the banks on the tightening of credit standards on loans to large companies. The clear co-movement of the responses from the SAFE and the BLS for both SMEs and large companies may indicate that the limited financial availability was a result of tightened lending conditions.
Similarly, according to the BLS data, the economic outlook for credit conditions has improved only recently from the banks’ perspective, with a larger number of banks indicating that the credit standards have been eased both for large companies and SMEs only in 2014 and 2015 (Figure 35). Banks’ perceptions of the demand for credit also show more optimism after 2014, when more banks thought the demand is increasing, relative to banks that thought it is going down. Before 2014, however, the view on credit demand has been shifting up and down, with peaks in demand before the crisis in 2007 and after the crisis in 2011, with subsequent drops during the crisis and after 2011.

EBA REPORT ON SMES AND SME SUPPORTING FACTOR
64
Figure 34. Developments in bank loan supply in the euro area
Net percentage of respondents
A: Large enterprises B: SMEs
Note: For the SAFE, an increase denotes higher availability of finance. For the BLS, an increase denotes a tightening in credit standards. The SAFE results concern the previous 6 months, while the BLS refers to the previous 3 months. The BLS figures are shifted one quarter backwards, to align with same reference date as the SAFE. The SAFE classifies an enterprise as SME if its number of employees is lower than 250, while the BLS considers as SMEs those enterprises whose annual net turnover is less than EUR 50 million. Source: The ECB SAFE and ECB BLS.
Figure 35. Changes in credit standards and in demand for loans or credit lines
Net percentage of respondents
A: Changes in credit standards B: Changes in demand
Note: This is 3-month backward looking. In Panel A, a positive value denotes a tightening in credit standards. Net percentages are defined as the difference between the sum of the percentages of banks responding ‘tightened considerably’ and ‘tightened somewhat’ and the sum of the percentages of banks responding ‘eased somewhat’ and ‘eased considerably’. In Panel B, a positive value denotes increased demand. Net percentages are defined as the difference between the sum of the percentages of banks responding ‘increased considerably’ and ‘increased somewhat’ and the sum of the percentages of banks responding ‘decreased somewhat’ and ‘decreased considerably’. Source: ECB BLS.
-60
-40
-20
0
20
40
60
80
2003
Q1
2004
Q2
2005
Q3
2006
Q4
2008
Q1
2009
Q2
2010
Q3
2011
Q4
2013
Q1
2014
Q2
2015
Q3
Per centPer cent
-40
-20
0
20
40
60
80
2003
Q1
2004
Q2
2005
Q3
2006
Q4
2008
Q1
2009
Q2
2010
Q3
2011
Q4
2013
Q1
2014
Q2
2015
Q3
Availabilityfinancing (SAFE)
Introduction ofthe CRR
Global financialcrisis
Credit standards(BLS)
Per centPer cent
-40
-20
0
20
40
60
80
2003
Q1
2003
Q4
2004
Q3
2005
Q2
2006
Q1
2006
Q4
2007
Q3
2008
Q2
2009
Q1
2009
Q4
2010
Q3
2011
Q2
2012
Q1
2012
Q4
2013
Q3
2014
Q2
2015
Q1
2015
Q4
Per cent
-40
-20
0
20
40
60
80
2003
Q1
2003
Q4
2004
Q3
2005
Q2
2006
Q1
2006
Q4
2007
Q3
2008
Q2
2009
Q1
2009
Q4
2010
Q3
2011
Q2
2012
Q1
2012
Q4
2013
Q3
2014
Q2
2015
Q1
2015
Q4
Globalfinancial crisis
Introduction ofthe CRR
Largeenterprises
SMEs
Per cent

EBA REPORT ON SMES AND SME SUPPORTING FACTOR
65
Lending trends of both SMEs and large firms have been severely marked by the financial crisis, with a significant credit contraction since 2008. Following the financial crisis, SME61 bank lending has suffered a significant backdrop in volume, from a peak of EUR 95 billion in mid-2008 to approximately EUR 54 billion in 2013/2014.62 Despite positive growth, SME lending remained below its pre-crisis level. Bank lending to larger corporates, on the other hand, after experiencing a stronger increase before 2008, followed by a decrease, already recovered to its 2003/2004 pre-crisis volumes. Despite the common trend, there are big differences across countries both in terms of growth in new lending and in terms of SME lending stock.
Differences in SME lending are also present across banks. The EBA supervisory data shows that better capitalised banks lend more to both SMEs and other borrowers, which is consistent with the existing academic literature. At the same time, banks with higher shares of SME or large firm NPLs lend less to that group of borrowers.
Similar to lending volumes, lending conditions have also been marked by the global financial crisis. Interest rates are generally higher for SMEs than for large companies. The spread between interest rates for loans below EUR 1 million—used as a proxy for SME loans—and loans above this threshold has risen from an average of 0.89 percentage points in the period up until 2008 to an average of 1.34 percentage points since 2009. The low interest rate environment should be kept in mind as a dominant factor in this regard. In addition, survey responses suggest that other lending conditions—such as charges and fees as well as collateral requirements—were also tightened in the post-crisis period, although empirical evidence shows that there was no change over time in the volume of loans using collateral and guarantees.
Over the recent years, access to finance has remained of greater concern to SMEs than to large enterprises. The survey results show that approximately 16% of SMEs experience some issues with bank loan financing (discouraged to apply, rejected, too a high cost, or received only part of the loan), compared to 10% of large corporates. The obstacles to finance vary also by firm size within the SME sector, with micro and small firms being the most affected.
61 For the purpose of this analysis SMEs are proxied by loans up to and including EUR 1 million. Large enterprises are proxied by loans over EUR 1 million 62 Average monthly new lending for 2013/2014 based on data from ECB MFI Interest Rate Statistics.

EBA REPORT ON SMES AND SME SUPPORTING FACTOR
66
5. SME SF – Application This section of the report provides an overview of the application of the SME SF, which was introduced by Article 501 of the CRR and its impact.
Background and rationale 5.1
The CRR has introduced a deduction in capital requirements for exposures to SMEs by applying the SME SF of 0.7619 to capital requirement. The purpose of the reduction is to allow credit institutions to increase lending to SMEs following the crisis, and to alleviate regulatory changes that were expected to have a disproportionate impact on SME lending.63 One justification for the introduction of the SF is to counterbalance the negative impact of the CCB introduced as part of the measures following the crisis. The rationale of the SF is, hence, also based on the fact that capital requirements could be one of many factors affecting lending decisions, as also confirmed by the industry in the consultation conducted in 2015 on the application of the SME SF (Annex 4). It should be noted however, while the CCB will be gradually phased-in from 2016 to 2019,64 the SME SF was implemented as soon as 2014, thus currently reducing the capital requirements for exposures to SMEs in comparison with the pre-CRR/CRD IV framework.
The current capital discount was introduced in the CRR/CRD IV following extensive discussions and following the recommendation of the EBA 2012 report, which assessed several proposals for supporting SME bank lending, including a reduction by one third of the RW for the retail exposure class and an increase of the threshold for retail from EUR 1 million to EUR 5 million for SMEs. The EBA recommended in the report that if such a measure is to be introduced, it should be in the form of a capital discount that would apply at the end of the capital calculation and which should be temporary rather than permanent, so as to be more effective as a measure to alleviate the cyclical effects of lending to SMEs during the crisis. This alleviation could be admitted due to the downturn during which this support was needed, and it should be gradually removed during the upward swing of the credit cycle.65 Furthermore, the aim of this discount should be not to alter the risk assessment, but to promote lending to the SME sector. Hence, this discount requires regular monitoring and should be reversed as soon as the economy enters a positive phase of the business cycle and lending to SMEs grows.
This capital discount—now widely called SME SF—came into effect in January 2014. The SME SF was introduced in the CRR as a permanent discount, as no provision mentions that it will be discontinued. Moreover, in accordance with the regulation, the SME SF is not linked to the business cycle and has been introduced with the purpose of supporting SME lending (Recital 44 of the CRR). 63 This objective of the SME SF is specified in Recital 44 of the CRR. The text of the Recital can be found in Annex 1. 64 It must be noted that some Member States front-loaded the conservation buffer at its full value of 2.5% of total risk exposures, without allowing for any phasing-in. 65 While this was the original recommendation, it has to be kept in mind that EU Member States’ business cycles are not synchronised and hence a removal of the SME SF in coordination with the business cycle may be too complex.

EBA REPORT ON SMES AND SME SUPPORTING FACTOR
67
Application of the SME SF 5.2
Application of the SME SF is limited to exposures to SMEs that satisfy all of the following eligibility criteria:
The loan is allocated to corporate exposures, retail exposures or exposures secured by immovable property. Exposures in default are excluded;
An SME is defined according to the 2003 Commission Recommendation66 (including the criterion that turnover must be below EUR 50 million), although the balance sheet and number of employee criteria in Article 2 of the Recommendation can be ignored. The text of the Recommendation can be found in Annex 3;
The total amount owed to the lending institution, its parent and subsidiary undertakings (including exposure in default, but excluding the claims secured on residential property) shall not exceed EUR 1.5 million. This threshold is different from the already existing quantitative threshold of EUR 1 million owed for the allocation of exposures to retail/corporate exposure classes.
Despite the specifications in the CRR, the scope of application of the SF is not always clear, and numerous questions have been submitted to the EBA via the formal Q&A online tool. Annex 5 amalgamates all the Q&As on SMEs and the interpretation and application of the SF to date. A short summary of the scope of implementation of the SME SF, taking into account the CRR provisions as well as all the relevant Q&As, is provided in Annex 3.
According to the latest COREP data (from third quarter 2015), the overall amount of exposures subject to the SME SF (original exposure amount for the EBA reporting banks in the third quarter of 2015) is approximately EUR 1.5 trillion, of which corporates (both in the SA and the IRBA) is EUR 487 billion, retail (both the SA and the IRBA) is EUR 932 billion, and secured by immovable property (only in the SA) is EUR 76 billion. In relative terms, the shares of exposures to SMEs (based on the institution-specific definition) and SME SF (SMEs subject to SF) in total corporate and total retail is shown in the figure below. SMEs subject to SF represent 4% of the aggregate corporate portfolios, 11% of the aggregate retail portfolios, and, in case of SA banks only, 6% of the aggregate exposures secured by immovable property. These figures have remained broadly constant since 2014.67
66 Commission Recommendation 2003/361/EC of 6 May 2003 concerning the definition of micro, small and medium-sized enterprises (Annex 1). 67 These figures are based on the COREP, which includes data from the EBA reporting banks.

EBA REPORT ON SMES AND SME SUPPORTING FACTOR
68
Figure 36. Share of exposures to SMEs and exposures subject to SME SF in bank portfolios
2015Q3 (third quarter of 2015)
Source: EBA supervisory data.
Impact of the SME SF on capital ratios 5.3
The SF is, in fact, introducing a 24% capital discount in the current capital charge of eligible SME exposures, cancelling for this sector the enhancement buffer introduced to face general financial stress. The effect of the SF on the capital ratios would hence depend largely on the amount of SME exposures that are subject to this discount.
An initial overview of the magnitude of the SME SF effect on the capital ratios of the EU banks—i.e. the capital relief associated with the implementation of the SF—can be gauged through the EBA supervisory data.68 The current data covers only banks reporting to the EBA, which represent the largest EU banks.69 The sample is consequently, to a large extent, reliant on banks using IRBA models, given that this tends to be the credit risk framework used by larger banks.
The application of the SME SF allowed banks to decrease their total RWAs,70 on average, by 1.2% in the first quarter of 2015, using total RWAs as weights.71 This decrease in RWAs can be interpreted in two ways, depending on how this decrease has been applied by the banks:
68COREP and FINREP. 69 The current data available to the EBA covers only a subset of banks that meet at least one the following reporting criteria: (i) the institution is one of the three largest institutions in a Member State measured by total assets, (ii) the institution’s total assets are in excess of EUR 30 billion, and (iii) the institution’s 4-year average of total assets is in excess of 20% of the 4-year average of a Member State’s GDP. Due to these restrictions, smaller institutions may not meet the criteria for the EBA reporting, and are thus not captured in the statistics computed by the EBA. 70 RWAs, in this context, are calculated as the TREA in accordance with Article 92(3) of the CRR. 71 2014Q4: Simple average – 1.3%; weighted average using TREA – 1.0%. 2015Q3: Simple average – 1.4%; weighted average using TREA – 1.2%.
0
2
4
6
8
10
12
14
16
18
Corporate (SA + IRBA) Retail (SA + IRBA) Secured by immovableproperty (SA)
SME exposures (unspecified definition)
Exposures subject to SME Supporting Factor
Per cent

EBA REPORT ON SMES AND SME SUPPORTING FACTOR
69
On the one hand, it translates in decreased capital requirements, and therefore an increase in the CET1 capital ratio;72
On the other hand, in absolute terms, this increase in CET1 capital ratio means that the banks have freed up capital resources that can be redeployed.
The data from the banks reporting to the EBA shows that the reduced capital requirements due to the application of the SME SF has translated in an average increase of 0.16 percentage points in the CET1 capital ratio of the reporting banks.73 This figure increases to 0.21 percentage points if only RWAs related to credit risk are taken into account (Figure 37). More than half of banks reporting exposures subject to the SME SF experienced an increase in the CET1 capital ratio below 0.2 percentage points in the third quarter of 2015 (Figure 38). The impact on other capital ratios is naturally even lower.
Figure 37. Increase in CET1 capital ratio following the application of the SME SF
All the EBA reporting banks, in percentage points
CET1 capital increase relative to: 2014Q4 2015Q3
Total RWA 0.13 0.16
Credit RWA 0.18 0.21
Source: EBA supervisory data.
Figure 38. Distribution of the EBA reporting banks by increase in CET1 capital ratio
CET1 ratio increase Number of reporting banks
Percentage of reporting banks
Less than 0.2 percentage points 76 54%
0.2 to 0.4 percentage points 35 25%
0.4 to 0.6 percentage points 15 11%
Higher than 0.6 percentage points 14 10% Total 140 100%
Note: Data refers to 2015Q3, and the sample does not include institutions that do not report exposures subject to the SME SF. Source: The EBA supervisory data.
Given that the reporting banks in the EBA sample have an average CET1 capital ratio of 13.1% in the third quarter of 2015 using TREA as weights, which is well above the current required
72 CET1 capital ratio = CET1/TREA 73 The average is based on the full sample of banks reporting to the EBA.

EBA REPORT ON SMES AND SME SUPPORTING FACTOR
70
minimum of 4.5%,74 the application of the SME SF has a small impact in terms of reducing the capital ratio on an aggregate level for the sample.
The same data by country shows that the capital relief due to the SME SF was not evenly distributed among the EU countries (Figure 39 below). Banks in smaller countries have generally experienced a larger relief and effective increase of their capital ratios, which may reflect a higher share of SME exposures in the institutions of these countries.
Figure 39. Increase in CET1 capital ratio with the application of the SME SF
A: 2014Q4 B:2015Q3
Notes: Countries are ordered according to increasing impact on CET1 capital ratio in 2014Q4. The country aggregates refer to the weighted average. The sample includes all reporting institutions, including those that did not apply the SME SF. 2014Q4 refers to data point model (DPM) 2.2, while 2015Q3 refers to DPM 2.3. Source: The EBA supervisory data.
In absolute terms, the application of the SME SF means that, in total, approximately EUR 11.7 billion75 of capital has been saved as of third quarter of 2015 as a result of reduced capital requirements, based on preliminary supervisory data. 74 The current high own funds may be an expectation of increased capital requirements, as several capital buffers are introduced in accordance with Article 160 of the CRD IV, which will start to come into full effect in 2016.

EBA REPORT ON SMES AND SME SUPPORTING FACTOR
71
About 60%76 of the capital relief is concentrated in the reporting banks of Italy, France and Spain. Capital relief in the reporting banks of the United Kingdom, the Netherlands and Germany is 10%, 5% and 5% respectively. The concentration of capital relief in a few countries may be explained, on the one hand, by the traditionally large SME sectors of the respective countries, but also by the more concentrated banking sector. For example, the capital relief refers only to the EBA reporting banks and, in many countries with a more decentralised banking system, a large part of capital relief may not be reflected in these figures, as smaller banks will not be included in the EBA reporting.
Furthermore, the COREP data shows that from the second quarter of 2015, there is an increase in the reported capital relief compared to the first five quarters, as shown in Figure 40 below. This difference could be, on the one hand, due to institutions applying the SF to more exposures (e.g. better ability to identify SMEs, and clarification of certain aspects of SME SF application) or more accurate reporting of the SME SF (e.g. updated and corrected COREP templates).
Figure 40. Capital relief in the EU with the application of the SME SF
Notes: This aggregate covers the capital relief from the EBA reporting institutions, excluding those whose parent company is subject to EBA reporting on a consolidated basis. This series is the result of joining data point model (DPM) 2.2 (valid from 2014Q1 to 2015Q1) with DPM 2.3.1 (2015Q3). Source: The EBA supervisory data.
The current data used for the calculation of capital savings are drawn from COREP and covers only a subset of the European banking system, namely those banks whose data is available to the EBA, based on certain criteria in terms of size.77 Due to these restrictions, smaller institutions may not
75 2014Q4: EUR 10.4 billion; 2015Q3: EUR 11.7 billion. These figures refer to the capital relief for the EBA reporting banks, excluding the EBA reporting entities whose parent company is subject to the EBA reporting on a consolidated basis. 76 2014Q4: 53.2%; 2015Q3: 58.8%. 77The institutions included in the EBA COREP reporting need to meet at least one of the following reporting criteria: a) The institution is one of the three largest institutions in a Member State, including banking groups on the highest level of consolidation and subsidiaries of foreign banking groups, measured by total assets upon which the competent
0
2
4
6
8
10
12
14
2014Q1 2014Q2 2014Q3 2014Q4 2015Q1 2015Q2 2015Q3
EUR billion

EBA REPORT ON SMES AND SME SUPPORTING FACTOR
72
be subject to the EBA reporting requirements and are thus not captured in the statistics computed by the EBA. However, evidence shows that smaller institutions may be more geared towards SME lending, as they may overcome opaqueness through relationship-based lending, and therefore may benefit more from the SME SF.78
To capture this missing information, the EBA requested that the NCAs provide the data on capital relief for the banks that are not reporting to the EBA.79 Out of 29 Member States, 23 countries responded to the data collection by providing data.80 The results are presented in Figure 41. It has to be noted that we defined the banks not reporting to the EBA as ‘smaller banks’, which may put institutions that are very different in terms of business models into one basket. This should be kept in mind when interpreting the data. In terms of the share of the smaller banks in the total assets of the banking sector, there is large variety across countries.
Overall, the data provided shows that the increase in CET1 ratio in the banks not reporting to the EBA is higher than for the EBA reporting banks in 12 cases and lower in 10 cases. In cases where the smaller banks show a higher increase in CET1 ratio in general, the difference is particularly prominent in Denmark, Germany and the Czech Republic, where the increase for smaller banks was more than four times higher compared to the EBA reporting banks.
Keeping in mind the limitation shown by the data submitted, it can be concluded that the COREP data available to the EBA can provide information on the capital relief and estimates of its impact on the capital ratios only for the EBA reporting banks, and this cannot be extrapolated to the entire banking sector. Given that the smaller banks also represent an important share of the banking sector in several EU countries, a separate, more detailed data collection would be required to assess the impact on these banks. The SME SF may be particularly relevant for these banks, as shown by the results of the current data collection.
authority has jurisdiction; b) the institution’s total assets are in excess of EUR 30 billion, both for institutions that represent the highest consolidation level of any given banking group and for non-EEA banking group subsidiaries; and c) the institution’s 4-year average of total assets is in excess of 20% of the 4-year average of a Member State’s GDP, both for institutions that represent the highest consolidation level of any given banking group and for non-EEA banking group subsidiaries. 78 Literature presenting evidence: Berger et al. (2005), Berger and Black (2011), Carter and McNulty (2005), Park (2008), and Choil (2014). 79 The data was requested for the full sample of smaller banks not included under the EBA reporting or for a representative sample of such banks. The data was requested in disaggregated format by institution (anonymised) with the option to provide aggregate information by country. Data was requested at the highest level of consolidation. 80 Two countries (Malta and the United Kingdom) did not provide data. One country (Norway) does not apply the CRR so it is excluded from the exercise. Two countries (Spain and the Netherlands) did not provide additional data. In the case of Spain, the EBA sample covers more than 90% of its financial system. Out of the 23 countries that submitted the data, 21 provided disaggregated data by institution and two provided aggregated data as a weighted average.
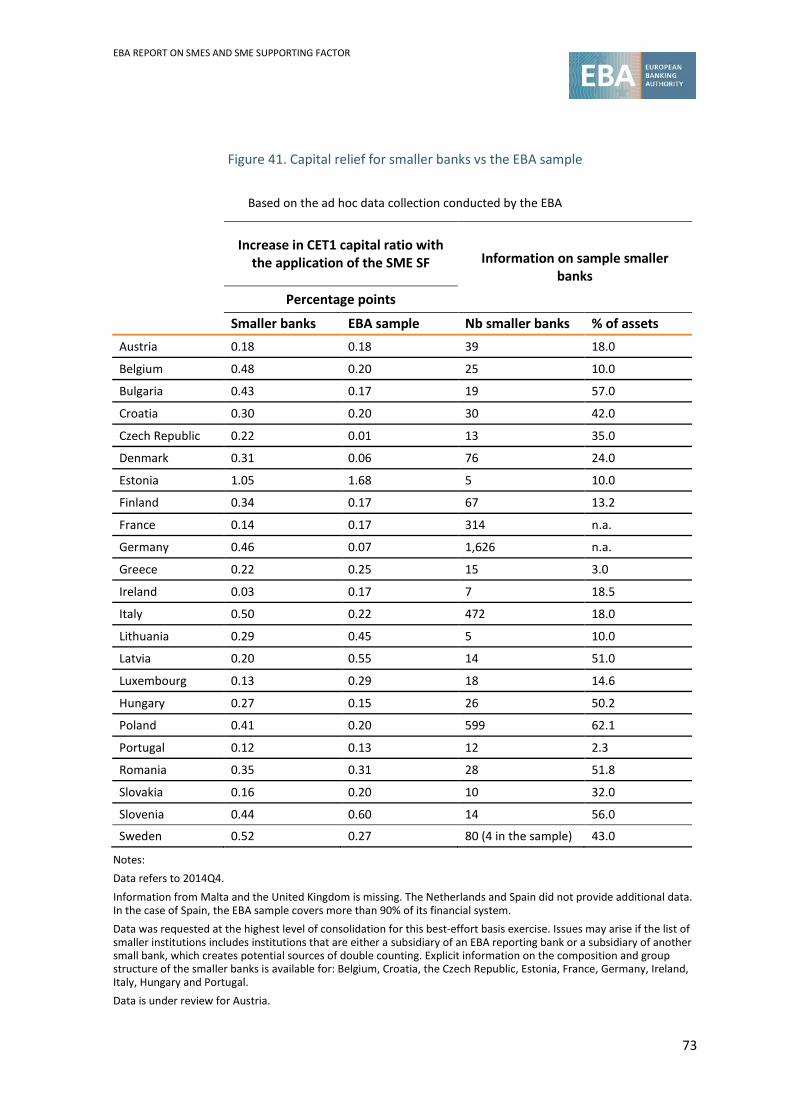
EBA REPORT ON SMES AND SME SUPPORTING FACTOR
73
Figure 41. Capital relief for smaller banks vs the EBA sample
Based on the ad hoc data collection conducted by the EBA
Increase in CET1 capital ratio with the application of the SME SF Information on sample smaller
banks
Percentage points
Smaller banks EBA sample Nb smaller banks % of assets Austria 0.18 0.18 39 18.0
Belgium 0.48 0.20 25 10.0
Bulgaria 0.43 0.17 19 57.0
Croatia 0.30 0.20 30 42.0
Czech Republic 0.22 0.01 13 35.0
Denmark 0.31 0.06 76 24.0
Estonia 1.05 1.68 5 10.0
Finland 0.34 0.17 67 13.2
France 0.14 0.17 314 n.a.
Germany 0.46 0.07 1,626 n.a.
Greece 0.22 0.25 15 3.0
Ireland 0.03 0.17 7 18.5
Italy 0.50 0.22 472 18.0
Lithuania 0.29 0.45 5 10.0
Latvia 0.20 0.55 14 51.0
Luxembourg 0.13 0.29 18 14.6
Hungary 0.27 0.15 26 50.2
Poland 0.41 0.20 599 62.1
Portugal 0.12 0.13 12 2.3
Romania 0.35 0.31 28 51.8
Slovakia 0.16 0.20 10 32.0
Slovenia 0.44 0.60 14 56.0
Sweden 0.52 0.27 80 (4 in the sample) 43.0
Notes: Data refers to 2014Q4. Information from Malta and the United Kingdom is missing. The Netherlands and Spain did not provide additional data. In the case of Spain, the EBA sample covers more than 90% of its financial system. Data was requested at the highest level of consolidation for this best-effort basis exercise. Issues may arise if the list of smaller institutions includes institutions that are either a subsidiary of an EBA reporting bank or a subsidiary of another small bank, which creates potential sources of double counting. Explicit information on the composition and group structure of the smaller banks is available for: Belgium, Croatia, the Czech Republic, Estonia, France, Germany, Ireland, Italy, Hungary and Portugal. Data is under review for Austria.

EBA REPORT ON SMES AND SME SUPPORTING FACTOR
74
In the context of SME dependence on bank lending and given the increased regulatory burden following the financial crisis, a capital discount (i.e. SME SF) of 0.7619 was introduced in January 2014. This factor allows the reduction of capital requirements on SME loans with the aim of freeing up regulatory capital to deploy for further SME lending and to improve SME lending conditions.
The capital relief resulting from the application of the SME SF led to an increase of 0.16 percentage points of an average CET1 ratio of 13.1% (weighted).81 The increase goes up to 0.21 percentage points if we consider only credit RWAs. In absolute terms, the application of the SME SF means that, in total, the minimum required capital has been reduced by approximately EUR 11.7 billion as of the third quarter of 2015. The additional data collected suggests that the impact of the SME SF on the capital ratios of the smaller banks not included in the EBA reporting varies across countries, and, in the majority of cases, is larger than for the EBA reporting banks.
81 As reported in COREP by the EBA reporting banks in 2015Q3.

EBA REPORT ON SMES AND SME SUPPORTING FACTOR
75
6. SME SF – Consistency of own funds requirements with lending trends and conditions In accordance with Article 501 of the CRR, the EBA is mandated to assess the consistency of own funds requirements with lending trends and conditions. This mandate is understood as the assessment of changes in SME lending trends and conditions following the introduction of the SME SF. This section examines these changes. The main objective of this analysis is to investigate whether the SME SF has achieved its goal of encouraging bank lending and reducing credit constraints of SMEs. This study also analyses which type of firms (i.e. micro, small and medium) was more affected by the potential credit supply shock, and whether there are systematic differences between countries that were affected more or less severely by the crisis.
Bank capital and lending behaviour – Literature review 6.1
The relationship between bank capital and lending dynamics has been extensively examined in the academic literature since the introduction of Basel I in 1988. These studies can be divided into two broad categories: (i) those investigating the (short-term) impact of shocks to regulatory minimum capital requirements on credit supply, and (ii) those investigating the impact of shocks to observed bank capital levels or ratios on lending.
On the former category, the current consensus in the literature is that increases in minimum capital requirements lead to a short-term contraction in lending volumes (Francis and Osborne, 2009; MAG, 2010; Brun et al., 2013; Noss and Tofano, 2014; Bridges et al. 2014; Aiyar et al., 2014, 2015a; Messonier and Monks, 2015). In addition, when faced with more stringent capital requirements, instead of cutting total lending, banks can reduce asset risk and hence decrease the supply of credit to only the riskiest borrowers (Berger and Udell, 1994; Albertazzi and Marchetti, 2010). This so-called ‘flight-to-safety’ effect is particularly problematic for SMEs, as they are more likely to be credit constrained when banks adjust their loan portfolios in response to negative shocks to their balance sheets (Popov and Udell, 2012; Duygan-Bump et al., 2015) and have difficulties in finding alternative sources of funding (Wehinger, 2014).
Despite the potential short-run costs in terms of lending contraction that increased regulatory capital requirements may entail, having better capitalised banks improves financial stability by increasing their buffers against losses and reducing risk-taking incentives (e.g. Aiyar et al., 2015b). In fact, the aim of stringent capital regulation is to increase banks’ resilience to future financial downturns and thus reduce the likelihood of a banking crisis, which, as both past history and recent events show, generates substantial economic and social costs. The objective is therefore to balance this trade-off: (i) protect the financial system against moral hazard and the cost of bank failures, and (ii) encourage banks to keep lending. In this respect, BCBS (2010), Miles et al. (2013)

EBA REPORT ON SMES AND SME SUPPORTING FACTOR
76
and Angelini et al. (2015) find that the economic costs associated with tighter capital and liquidity standards are considerably lower than the potential benefits in terms of reducing the probability of banking crises and associated banking losses.
Ultimately, the effect of bank capital on lending may be heterogeneous across banks, depending on how capitalised they are. If capital is indeed costly and banks do avoid raising new equity as a result, one should observe them keeping its use to the minimum. In practice, banks hold excess capital with respect to the minimum regulatory threshold. One possible explanation is that banks may keep additional capital buffers under any regulatory regime in order to preserve their future lending capacity (Repullo and Suarez, 2013). The latter argument is in line with empirical studies focusing on banks’ observed capital ratios that find a positive relationship between capital levels and lending (e.g. Berrospide and Edge, 2010; Carlson et al., 2013; Buch and Prieto, 2014). Similarly, Kapan and Minoiu (2015) use a sample of banks from 55 countries and show that better capitalised banks exposed to the financial crisis decreased loan supply less than other banks.
In short, empirical evidence suggests that while increased capital requirements may generate short-term costs in terms of credit supply contraction, higher capital enhances financial stability and makes bank lending more robust and stable over time, including in economic downturns.82
Data 6.2
To assess the consistency of own funds requirements with SME lending, trends and conditions, it is necessary to evaluate how lending to SMEs has changed as a result of the application of the SME SF, relative to lending to large firms (where this capital discount is not applicable). In this regard, data on SMEs and large firms’ lending before and after the application of the SME SF is used.83
The main database used in this study is the firm-level (micro data) version of the ECB’s and the Commission’s SAFE. The survey provides a harmonised and representative cross-country sample with access to financing information for both SMEs and large firms across the EU. It contains information on loan applications and respective bank lending decisions, therefore allowing us to identify the credit supply effects related to the introduction of the SME SF. This database also has information on firms’ structural characteristics (size, ownership, autonomy, age and industry), as well on their perception of current developments regarding economic and financing conditions. It covers only non-financial firms and excludes firms in agriculture, public administration and financial services. Most firms are interviewed only once, but there is a small subsample of firms
82 This argument is well summarised in Admati et al. (2013), who argue that ‘higher bank capital requirements provide for a smoothing of banks’ lending capacity, which is altogether beneficial even though at some moments, the requirement may be seen as temporarily constraining’ (p.7). 83 At an individual country level, a study attempting to assess the impact of the introduction of the capital reduction factor for SME loans has been conducted in Spain. The study finds that, following the introduction of the reduced capital requirements, lending to SMEs have increased for both existing and new SME bank clients. More details on the study are provided in Annex 6.

EBA REPORT ON SMES AND SME SUPPORTING FACTOR
77
present in several waves of the survey. The SAFE is published every 6 months and has been conducted 12 times between the first half of 2009 and March 2015.
This study makes use of three different samples of the SAFE in order to minimise the impact of data constraints and ensure the representativeness and robustness of the results (Figure 55 in Annex 5). The samples are: (i) the Eurozone sample, which covers SMEs and large firms in 11 euro area countries (Austria, Belgium, France, Finland, Germany, Greece, Ireland, Italy, the Netherlands, Portugal and Spain), (ii) the restricted Eurozone sample, which contains information for only five euro area countries (France, Germany, Italy, the Netherlands and Spain) and (iii) the EU sample, which covers 28 EU countries. More details on the data samples used are provided in Annex 5.
Following the academic literature using the SAFE to study firms’ access to finance (e.g. Casey and O’Toole, 2014; Ferrando et al., 2015), the main outcome variable (credit constrained) is defined as a dummy variable that equals 1 if (i) the firm’s application for a bank loan or credit line was denied, or if (ii) the firm received less than 75% of the amount it requested. It outcome variable equals 0 if the firm applied for bank financing and either got everything or more than 75% of the amount it requested.84 Figure 42 shows the evolution of credit constrained firms in the euro area (Panel A) and the EU (Panel B) samples. One period corresponds to a survey wave—i.e. 6 months. The figure shows that, as expected, SMEs are on average more credit constrained than large firms. However, access to finance seems, at first glance, to have improved by a similar magnitude for both SMEs and large firms following the introduction of the SME SF.
Descriptive statistics for the different variables used in this study are reported in Figure 56. All figures are weighted survey-based percentages that restore the proportions of the economic weight of each size class, economic activity and country. Of the firms that applied for bank financing, 19.6%, 19.5% and 17.5% are, on average, credit constrained in the Eurozone, restricted Eurozone and EU samples, respectively. Of these firms, 8% to 9% had their application for loan or credit line denied, and 10% to 12% were quantity rationed.
84 As in Casey and O’Toole (2014), the credit constrained variable does not consider firms that ‘refused the loan offer because the cost was too high’, as this may indicate that these firms do not have positive net present value (NPV) investment projects that can be undertaken profitably at the current market cost of capital, rather than a credit supply contraction per se. The number of firms that mention self-rationing is, nonetheless, relatively small—i.e. less than 1% of all firms in the SAFE and only 2% of the firms that did apply for credit.

EBA REPORT ON SMES AND SME SUPPORTING FACTOR
78
Figure 42. Credit constrained firms before and after the introduction of the SME SF
Panel A: Eurozone sample Panel B: EU sample
Source: The Commission’s SAFE and the EBA calculations.
Information on firm-specific characteristics is also reported in Figure 56. These characteristics control for credit demand by capturing the independent impact of firm-level heterogeneity related to important determinants of SME financing, such as firm type, ownership, size and age (e.g. Beck and Demirguc-Kunt, 2006). In the Eurozone sample, the majority of the 16 850 firms that applied for bank financing are autonomous (88.9%), individual or family-owned (78.8%) and more than 10 years old (82.6%). The survey includes mostly SMEs, distributed between micro (35.5%), small (19.8%) and medium (19.9%) enterprises. To capture the effect of firms’ operating conditions and their creditworthiness on credit demand, we also include several additional controls for the change in the firm’s capital, credit history, general economic outlook, profit, production costs, financial costs and debt to assets. In this respect, 29.7%, 28.5% and 27.8% of the firms report that their capital, credit history and profit improved in the last 6 months respectively, while 17.5% of firms indicate a better general economic outlook. Finally, 13.1%, 23.7% and 27.3% of the firms specify that their production costs, financial costs and debt to assets decreased. All the above statistics are comparable across the three samples.
With respect to country-level variables used to further distinguish between supply and demand, we include GDP growth, unemployment rate and the 10-year sovereign bond rate in each country to capture the effects of the overall economic climate, the domestic credit to GDP gap to control for leverage in the financial system (and thus potential debt overhang effects), and the level of concentration in the banking system as captured by the Herfindahl Index. All these indicators are collected from the ECB and Eurostat. In the Eurozone sample, GDP growth, unemployment rate and 10-year sovereign bond vary from -8.2% and 5.1%, 4.3% and 27.7%, and 0.5% and 24.6%, with respective averages over the sample period of 0.03%, 11.5% and 3.2%. Macroeconomic conditions (as captured by the above variables) are nonetheless, on average, better in the countries covered in the restricted Eurozone and EU samples. We also include a variable from the ECB BLS capturing banks’ perception of risk related to the general economic activity as a factor affecting their decisions when setting credit standards. It is expressed as a ‘diffusion index’ with higher values corresponding to higher perceptions of risk in each country. Finally, given that the
0
0.05
0.1
0.15
0.2
0.25
0.3
-5 -4 -3 -2 -1 0 1 2
Cred
it co
nstr
aine
d
Introduction of SME SF
0
0.05
0.1
0.15
0.2
0.25
0.3
-5 -4 -3 -2 -1 0 1Cr
edit
cons
trai
ned
Introduction of SME SF
SMEs
Large firms

EBA REPORT ON SMES AND SME SUPPORTING FACTOR
79
SME SF was introduced to offset the effect of the CCB, we also include a variable that is equal to 1 if the CCB was introduced in a specific country after a particular period, and 0 otherwise. Among the firms in the Eurozone, restricted Eurozone and EU samples, 7.9%, 8.8% and 8.7% respectively were operating in countries that have introduced the CCB.
Methodology 6.3
The impact of the SME SF on SMEs’ access to bank finance is examined by employing a difference-in-differences methodology using two sources of identifying variation: the time before and after the policy change, and the cross-section of firms affected and not affected by the introduction of the SME SF.85 The treatment group therefore consists of micro, small and medium-sized enterprises (i.e. turnover below EUR 50 million), while the control group is formed of large firms.86
As mentioned above, the main outcome variable, credit constrained, is defined as a dummy variable that equals 1 if the firm’s application for a bank loan or credit line was denied or if the firm received less than 75% of the amount it requested, and as 0 if firm applied for bank financing and either got everything or more than 75% of the amount it requested.
Given that the outcome variables used throughout the analysis are binary, the following equation is estimated using a probit model:
𝑃𝑃𝑃𝑃�𝐶𝐶𝑃𝑃𝐶𝐶𝐶𝐶𝐶𝐶𝐶𝐶 𝐶𝐶𝐶𝐶𝐶𝐶𝐶𝐶𝐶𝐶𝑃𝑃𝐶𝐶𝐶𝐶𝐶𝐶𝐶𝐶𝐶𝐶𝑖𝑖𝑖𝑖𝑖𝑖 = 1� =
= Φ�β(𝑆𝑆𝑆𝑆𝑆𝑆𝑖𝑖𝑖𝑖 ∗ 𝑃𝑃𝐶𝐶𝐶𝐶𝐶𝐶𝑖𝑖�+ 𝜆𝜆′𝑋𝑋𝑖𝑖𝑖𝑖𝑖𝑖 + 𝜑𝜑′𝑍𝑍𝑖𝑖𝑖𝑖 + 𝜔𝜔𝑖𝑖 + 𝛿𝛿𝑖𝑖 + 𝜀𝜀𝑖𝑖𝑖𝑖𝑖𝑖 ] (1)
Here, the treatment effect of interest is given by coefficient β, which captures the change in financing conditions for SMEs relative to large firms from the pre- to the post-treatment period. A negative coefficient would imply that, ceteris paribus, access to finance better improved for SMEs than for large firms after the introduction of the SME SF.
The specification includes additional time-varying country-level controls and time fixed-effects to control for variation in access to finance common to all firms (global shocks)—e.g. the effect of the OMT programme. Country fixed effects are used to eliminate any variation in credit access 85 A similar methodology is applied in Ferrando et al. (2015), who use both the SAFE and the BLS to examine the effect of sovereign stress and non-conventional monetary policy (i.e. the ECB’s OMT programme) on SMEs’ access to finance. See also the Bank of Spain Financial Stability Report 05/2014 for a similar analysis of the effect of the SME SF on credit supply (Annex 6). The latter study uses confidential Spanish Credit Registry Data to account for both observable firm-level characteristics and observable and non-observable bank-level characteristics that may affect bank lending. Despite the level of granularity of the data, their study is, however, country-specific by design. Instead, this report considers a harmonised cross-country sample of 11 euro area countries and 28 EU countries. 86 The choice of our research design and control group (large firms) is justified by the fact that (i) it is not possible to know what would have happened to SME financing in the EU in the case where the SME SF was not introduced in the first place and (ii) the measure was introduced in all countries of the EU with no exception—i.e. there are no SMEs that were not treated. Nevertheless, it is important to note that threats to the internal validity of the difference-in-differences estimator cannot come from either permanent differences in lending conditions between SMEs and large firms (e.g. SMEs are, on average, more credit constrained than large firms) or shared trends (as these are controlled for in the model).

EBA REPORT ON SMES AND SME SUPPORTING FACTOR
80
specific to a country. As in Ferrando et al. (2015), the model is further extended to include industry, industry-country and/or industry-time fixed effects when using the restricted Eurozone sample for which there is industry information for both SMEs and large firms. The model is described in more detail in Annex 5.
The results presented should be interpreted with all due caution, as it is not possible to identify exactly which SMEs benefited from the support measure. In addition, since the SME SF was introduced at the same time as the CRR, it is not possible to completely disentangle the effect of the SME SF from all the other regulatory changes introduced at the same time. The use of large firms as a control group is a further limitation of the study, but is also the best reference given the data limitations.87
Results 6.4
Figure 57 in Annex 5 presents the main results of this study where the estimation examines whether access to bank financing better improved (i.e. credit constraints decreased) for SMEs than for large firms after the introduction of the SME SF. Column (1) to (4) of Panel A report coefficient estimates of model (1) when using different sets of firm and country-level controls together with time (wave) and country fixed effects for the Eurozone sample. Column (5) and (6) of the same panel repeat the latter estimation, but with country-time fixed effects (i.e. a dummy for each country-wave combination) to ensure the results are not driven by unobserved time-varying country effects. All the regression results show a statistically insignificant coefficient on our variable of interest (𝑆𝑆𝑆𝑆𝑆𝑆𝑖𝑖𝑖𝑖 ∗ 𝑃𝑃𝐶𝐶𝐶𝐶𝐶𝐶𝑖𝑖). Consistent with the unconditional trends in Figure 42, this suggests that SMEs have an identical probability of being credit constrained when compared to large firms in the period after the introduction of the SME SF.
While a number of additional demand-side effects may have played a role in both the period before and after the introduction of the SME SF, we go to great lengths to identify the credit supply effect of this policy. In detail, Panel B estimates model (1) using the restricted Eurozone sample, for which we have industry information for both SMEs and large firms in France, Germany, Italy, the Netherlands and Spain. This allow us to employ an exhaustive set of FE to control for time-invariant industry characteristics (industry FE in columns (7) and (9)), differences in demand for credit in different industries in different countries (country-industry FE in columns (8), (10), (11) and (12)) and time-varying differences in credit demand in different industries (time-industry FE in column (11)). Finally, Panel C repeats the estimations in Panel A for the EU sample. All the results indicate that access to bank finance did not better improve for SMEs when compared to large firms post the introduction of the SME SF. This conclusion is consistent across the various models used and when considering both Eurozone and EU countries.88
87 Ideally, the control group should be SMEs not eligible for the application of the SME SF. 88 The results are also consistent (i) when using different waves to define the pre- and post periods, and (ii) when applying alternative econometric specifications—e.g. logit model, and a bivariate probit model with a selection to account for the fact that we only observe if a firm is credit constrained if it applies for credit in the first place. These results are not reported for brevity, but are available upon request.

EBA REPORT ON SMES AND SME SUPPORTING FACTOR
81
Focusing on the control variables included in the model, the estimation results across the three panels of Figure 57 show that smaller and younger firms have a higher probability of being credit constrained than large and older firms. In addition, firms with decreased financial costs, improved credit history and improved general economic outlook in the past 6 months are less likely to be credit constrained. Consistent with previous evidence (e.g. Ferrando et al., 2015), whether the firm is a stand-alone or a branch/subsidiary, and whether the firm is individually/family-owned or has a different ownership structure does not seem to matter for the likelihood of obtaining bank financing. As expected, higher unemployment rate and banks’ perception of risk in a certain country are associated with a higher probability of firms being denied credit or quantity rationed.
As a robustness check, Panel A and Panel B of Figure 58 analyse each of the components of the credit constrained variable separately. In detail, ‘application denied’ is a dummy equal to 1 if the firm’s application for a bank loan or credit line was denied, and 0 if the firm applied for bank financing and received all or some of the amount it requested. ‘Quantity rationed’ is a variable that equals 1 if the firm received less than 75% of the amount it requested, and 0 otherwise. The control variables and FE used in specifications (1) to (18) in each of the panels correspond to those of Figure 57. In brief, our previous conclusions hold, no matter the sample and outcome variable used to analyse access to bank financing.
Recent evidence indicates that formal constraints in the form of denied applications or quantity rationing by the bank can be less predominant than informal ones in some countries (e.g. Brown et al., 2011). In fact, many firms—particularly SMEs—are often discouraged from applying for financing in anticipation of a formal rejection by the bank which, as a result, keeps them out of official bank records and credit registers. Ultimately, such informal constraints can vary systematically across countries in such a way that results can become biased (Popov, 2015). To address this important point, we re-estimate model (1) with an outcome variable denoted ‘discouraged from applying’, which is equal to 1 if the firm was discouraged to apply for bank financing, and 0 if it did apply for it—no matter the outcome. We find that SMEs have an identical probability of being discouraged from applying when compared to large firms in the period after the introduction of the SME SF. In fact, our coefficient of interest is positive but not statistically different from zero in all the specifications considered. As a result, our previous results are not being driven by differences in informal constraints.
Figure 59 explores firm-size heterogeneity and investigates whether a particular type of firm (i.e. micro, small, medium) was indeed affected by the potential credit supply shock. Panel A compares micro and large firms before and after the introduction of the SME SF—i.e. the treatment group is now micro firms only, while the controls group is, as before, large firms. Panels B and C compare small and large firms, and medium and large firms, respectively. The size groups are defined by the four categories of the turnover variable in the SAFE database (see Figure 56). As before, the remaining control variables and FE used in specifications (1) to (18) in each of the panels correspond to those in Table 2. While the magnitude of the coefficients generally becomes smaller as the size of the firm being analysed increases, there are, however, no statistically

EBA REPORT ON SMES AND SME SUPPORTING FACTOR
82
significant differences across micro, small and medium enterprises when comparing these (individually) with large firms.
Finally, Figure 60 examines whether there are significant differences in credit access across SMEs and large firms following the introduction of the SME SF in countries that were affected more or less severely by the crisis. Ferrando et al. (2015), for instance, show that firms operating in countries where the banking sector has been affected most severely by the crisis were more likely to be credit rationed following the European sovereign debt crisis. We follow the latter study by analysing the Eurozone sample and considering Greece, Ireland, Italy, Portugal and Spain as countries affected more severely by the crisis and Austria, Belgium, Finland, France, Germany and the Netherlands as less affected. Panels A, B and C show the estimation results when considering the application denied, quantity rationed and credit constrained variables, respectively, to capture access to bank financing. The control variables and FE used in specifications (1) to (6) in each of the panels correspond to those of Table 2. Consistent with our previous findings, the estimation results show that access to finance did not better improve for SMEs when compared to large firms following the introduction of the SME SF in both groups of countries.
The firm-level (survey) results and bank-level trends suggest that there is no evidence that the SME SF has provided additional stimulus for lending to SMEs. Access to finance for SMEs slightly improved in the period following the introduction of the SME SF, but the change was not significantly different from the one relative to large firms. Similarly, there is no evidence that bank financing conditions on loans and credit lines (e.g. interest rates, size, maturity, collateral required) improved more for SMEs than for large firms after the introduction of the SME SF. However, other developments—such as the introduction of the CRR/CRD IV—hamper, to some extent, the identification of this effect.
Additionally, the study found that smaller and younger firms have a higher probability of being credit constrained than large and older firms respectively. In addition, firms with decreased financial costs, improved credit history and improved general economic outlook in the past 6 months are less likely of being credit constrained. Firms’ legal status and ownership do not seem to matter for the likelihood of obtaining bank financing. As expected, a higher unemployment rate and banks’ perception of risk in a certain country are associated with a higher probability of firms being denied credit or quantity rationed.

EBA REPORT ON SMES AND SME SUPPORTING FACTOR
83
7. Consistency of SME riskiness with own funds requirements In accordance with Article 501 of the CRR, the EBA is mandated to analyse the consistency of own funds requirements with the riskiness of SMEs. The study summarised below addresses the consistency of own funds requirements by assessing firm size as a driver of systematic credit risk in loans to SMEs, and compares the size of this effect with the capital relief granted to SME lending relative to large corporates in the regulatory minimum capital requirements of Basel III.89 In this study, large corporates (i.e. corporates with a turnover of more than EUR 50 million) are used as a benchmark, which means that they are assumed to be correctly calibrated in level. For the purpose of this study, comprehensive data sets were built to cover a significant part of the German and French SME and large corporate sector. For Germany, data from more than 1 500 banks in Germany were collected and, for France, the national credit register and the Banque de France rating system were used. Given the size of the sample, the length of the time series and the application of a fully consistent methodology, this analysis significantly improves on the previous ones in this area.
Methodology 7.1
ACPR, Deutsche Bundesbank and the ECB conducted an empirical analysis on the consistency of own funds requirements for bank loans to SMEs in France and Germany. The study builds on Düllmann and Koziol (2014) and Dietsch and Fraisse (2013) and addresses the consistency of own funds requirements by assessing firm size as a driver of systematic credit risk in loans to SMEs. As it is standard in the academic and regulatory literature, the asset correlation is used as the key measure of systematic risk. It also drives the systematic risk in the ASRF model of Gordy (2003), which is the basis of the regulatory minimum capital requirements in the IRBA of Basel III.
For the analysis of the own funds requirements, it is important to separate a potentially higher firm-specific (idiosyncratic) risk for SMEs—which is typically reflected in higher default probabilities—from a potentially lower systematic risk of SMEs. Since capital requirements in the ASRF model refer (by construction) to systematic risk only, lower asset correlations (and therefore lower systematic risk) compared to large firms would, ceteris paribus, also suggest lower capital requirements for SMEs. However, the capital requirements for an SME loan in the Basel III IRBA and the ASRF depend on both the default probability and the RW function in general, which, in turn, depends on the asset correlation value. As a consequence, lower systematic risk for SMEs can well be in line with higher capital requirements for SMEs if SMEs have higher default probabilities—i.e. higher firm-specific risk—than large firms.
2. An evaluation of regulatory capital requirements should distinguish between the level of capital and the relative difference against other asset classes. In the development of Basel II,
89 For more details, please refer to Dietsch, Düllmann, Fraisse, Koziol and Ott (2015).

EBA REPORT ON SMES AND SME SUPPORTING FACTOR
84
the second aspect—often referred to as ‘relative calibration’—was addressed first. It ensures that banks, ceteris paribus, have to hold more (less) capital for a more (less) risky asset, while the level calibration aims at determining the overall level of capital requirements.
The conducted analysis is very much in the spirit of previous analyses that were carried out for the relative calibration of Basel II; it explores the dependence of systematic risk on firm size and compares the size of this effect with the capital relief granted to SME lending in the regulatory minimum capital requirements of Basel III (Figure 43).90 The asset correlations are estimated based on the ASRF model underlying the IRBA capital requirements. We use large corporates (i.e. corporates with a turnover of more than EUR 50 million) as a benchmark, which means that they are assumed to be correctly calibrated in level. This is motivated by the fact that the BCBS has spent substantial effort on calibrating these portfolios due to their immense economic importance. For each size class, we therefore compare the relative difference (difference in capital requirements for this size class of SMEs relative to capital requirements for the benchmark—i.e. for large corporates) of both (1) capital requirements based on estimated asset correlations and (2) the current IRBA capital requirements. Comparing these two relative differences can provide useful information for an evaluation of the capital relief for SMEs granted in Basel III. If the relative differences of the capital requirements are larger for the capital requirements based on empirical asset correlations than for the IRBA capital requirements, there is potential for a capital relief for SME loans. This framework is applied in the same manner to a comparison with the (R)SA.
Figure 43. Illustration of framework to compare estimated and Basel III RWAs91
90 In this study, we consider only the relative calibration, as the appropriate level of regulatory capital cannot be satisfactorily assessed for the following two reasons. 1) The overall level of capital requirements was determined in the top-down calibration of the whole Basel II framework, also involving (for example) the 99.9% confidence level of the value at risk, the scaling factor of 1.06 for credit RWAs, and the benchmark maturity of 2.5 years. There is no reason to believe that this very different calibration goal will provide asset correlations similar to the estimates from the time series of default rates. 2) Gordy and Heitfield (2010) and Düllmann et al. (2010) show that asset correlation estimates can generate significant downward biases when the underlying time series of default rates are short. Through a relative comparison of asset correlation estimates for large companies with SMEs, both of which are affected by this estimation bias, we expect to mitigate the impact of this effect. 91 BM refers to the benchmark group (i.e. large corporates), while SME is used to denote SME loans. To differentiate the RWs calculated using the empirical asset correlations (left-hand side) from the regulatory RWs (right-hand side), the later are indexed BIII (for Basel III).

EBA REPORT ON SMES AND SME SUPPORTING FACTOR
85
The asset correlations (and the PDs) are estimated from historical default rates. To estimate the asset correlation (i.e. the factor sensitivity towards the unobservable latent systematic risk factor that represents the state of the economy in the ASRF framework), two different estimation techniques are used. The first is the GLMM single factor-estimator of Frey and McNeil (2003). In this framework, the rating information is treated as a fixed effect, while the latent systematic risk factor corresponds to the random effect that is estimated. This estimation technique is relatively robust against low populations of rating classes and allows obtaining one single asset correlation estimate per size class. The second estimator is the ML estimator of Gordy and Heitfield (2010), which can be used to estimate asset correlations and PDs for each rating/size bucket.92 As a robustness check, we also compute the asset correlations for a multifactor variant of the GLMM estimator. The estimation methodologies are described in detail in the Annex 7.
Data 7.2
This study applies a unique data set of SME lending for France and Germany.93 The two samples cover a significant proportion of loans to SMEs, as well as large corporates in the respective countries. The study exploits the time series of default data to estimate the asset correlation. As systematic risk is driven by the evolution of the credit cycle over time, the time series should capture at least a full economic cycle. By covering observations from 2005 to 2014 (Germany) and from 2004 to 2013 (France), each of the samples for the two countries encompasses both periods of economic growth and decline, including the financial crisis. Following the specifics of each of the national data sets, different definitions of default are used,94 which are consistent over time. The German data is based on the Basel II/III definition,95 whereas, in the French database, a combination of the judiciary definition and the banking definition of default is used.
92 The ML estimator is also used in the study of Düllmann and Koziol (2014). 93 Figure 62 in the Annex gives a summary of the two data sets. 94 Any aggregation of the two data sets is therefore not applicable. 95 ‘A default is considered to have occurred with regard to a particular obligor when either or both of the two following events have taken place. (1) The bank considers that the obligor is unlikely to pay its credit obligations to the banking group in full, without recourse by the bank to actions such as realising security (if held). (2) The obligor is past due more than 90 days on any material credit obligation to the banking group. Overdrafts will be considered as being past due once the customer has breached an advised limit or been advised of a limit smaller than current outstandings.’ (See Basel Committee on Banking Supervision (2006).) The data has been seasonally adjusted to avoid any potential influence from the provisioning practices of the banks.

EBA REPORT ON SMES AND SME SUPPORTING FACTOR
86
Figure 44. Default rates by rating over time (all size classes)
France Germany
Figure 45. Default rates by firm size (turnover) over time (all rating classes)
France Germany
The analysis is based on the ASRF model of Gordy (2003) that is also the foundation of the IRBA RW functions for credit exposures in the banking book. As the IRB RWs for corporate SMEs are driven by the PD and firm size, the two samples are clustered into size buckets and into rating buckets to capture not only the size dependence, but also the effect of diverging credit quality. The French sample, therefore, covers only firms that have been given a rating (including default grades) by the Banque de France rating department. The original rating scale of 10 grades is aggregated to four grades to ensure the robustness of the estimates. For the German sample, credit quality is measured in terms of the IRBA’s PDs, which are mapped to a consistent master scale of six rating grades that is collapsed to five rating classes. To differentiate between large corporates and SMEs and to explore a potential size dependence of asset correlation, firms are
0%
2%
4%
6%
8%
10%
12%
0.0%
0.5%
1.0%
1.5%
2.0%
2.5%
3.0%
2005 2006 2007 2008 2009 2010 2011 2012 2013 2014
I-II III IV V VIV and VI on
secondary axis
0%
1%
2%
3%
4%
5%
6%
7%
8%
0.0%
0.5%
1.0%
1.5%
2.0%
2.5%
3.0%
2005 2006 2007 2008 2009 2010 2011 2012 2013
1 2 3 4 4 on secondary axis
0.0%
0.5%
1.0%
1.5%
2.0%
2.5%
3.0%
3.5%
4.0%
2005 2006 2007 2008 2009 2010 2011 2012 2013 2014
0 - 1 Mio 1 - 2.5 Mio 2.5 - 5 Mio
5 - 20 Mio 20 - 50 Mio >50 Mio
0.0%
0.5%
1.0%
1.5%
2.0%
2.5%
2005 2006 2007 2008 2009 2010 2011 2012 20130.75 - 1.5 Mio 1.5 - 5 Mio 5 - 15 Mio15 - 50 Mio > 50 Mio

EBA REPORT ON SMES AND SME SUPPORTING FACTOR
87
further clustered according to their annual turnover. In line with Article 501 of the CRR on the SME SF, which uses the criterion turnover of Article 2 of Recommendation 2003/361/EG as the single criterion to identify SMEs the benchmark group, large corporates are firms with an annual turnover of more than EUR 50 million. The rich population of SMEs in both samples allows further distinguishing between additional SME size classes.
To assess the impact of the SME SF on regulatory capital requirements, both samples contain information on the outstanding loan volume (‘obligo’). For France, the obligo is measured in terms of regulatory exposure. As the data has been extracted from the French credit register, only borrowers with a minimum obligo of EUR 25 000 are covered. For Germany, the amount owed as defined in Article 501 of the CRR is used. The structural differences between the French and the German SME sectors are mirrored in the descriptive statistics presented in Figure 46, which depicts the percentage of SME SF eligible loans in each turnover class. In total, 86% of all loans towards French SMEs and 64% of all loans towards German SMEs are eligible for the application of the SME SF. The percentage of SME SF eligible loans decreases with firm size. The SME SF may be applied to nearly all of the French loans and roughly seven out of 10 loans to German firms in the smallest size class. In contrast, only half of the loans to German or French medium-sized corporates with a turnover of just below EUR 50 million are eligible to benefit from the SME SF.
Figure 46. SME loans eligible for SME SF in relation to total loans (in per cent)
France
Turnover in EUR million Retail Corporate
0.75-1.5 1.5-5 5-15 15-50 All
% of loans 96% 90% 67% 44% 86%
Germany
Turnover in EUR million Retail Corporate
0-1 1-2.5 2.5-5 5-20 20-50 All
% of loans 69% 68% 63% 55% 45% 64%
To achieve a significant coverage of the banking sectors in the EU, other countries have been invited to participate in the study or to provide data in the required format. Due to data availability constraints in most countries, however, there was little positive support. Italy agreed to apply a similar framework to national data from their credit register, but encountered several issues that are outlined below. In addition, one other smaller country (Ireland) provided data, albeit with a relatively short time series and a relatively small number of observations, which reduces the overall robustness of the estimations. Therefore, only a narrative on these results is presented in this report.

EBA REPORT ON SMES AND SME SUPPORTING FACTOR
88
Results 7.3
The results from the estimation of asset correlations were presented in section 2.5 and are consistent across Germany and France and robust for different estimators. The main result is that large corporates (Basel definition: corporates with turnover above EUR 50 million) face a considerably higher systematic risk than SMEs (Figure 13).
By comparing the size dependence of estimated capital requirements (i.e. based on empirical asset correlation estimates) with the size dependence hardwired into the corresponding IRBA capital requirements, the question of whether the size dependence of IRBA capital requirements is appropriate in light of the new empirical results can be answered. In the next step, the size dependence within the SA is investigated. For this purpose, the relative level of capital requirements implied by the asset correlation estimates is compared with the SA capital requirements. According to Basel III, the SA RW function is simply a step function, with a RW of 100% if the firm is treated as a corporate exposure and 75% if it is assigned to the retail portfolio—i.e. if the exposure to the borrower does not exceed EUR 1 million, which is comparable with a turnover of up to EUR 2.5 million.
After analysing Basel III capital requirements, this study focuses on the capital requirements according to CRR/CRD IV, including the SME SF. In doing so, the impact of the SME SF can be measured when we compare the size dependence of CRR RWs with the one of the estimated RWs. It is assumed that the SME SF is applied to all SME loans, which is a rather conservative assumption given that the percentages of all loans assigned to the SME SF amount to 64% for Germany and 86% for France (see Figure 46 in the previous section).
In order to quantify the deviation of the estimated and the regulatory RWs, the relative difference regarding the benchmark of large corporates is compared by subtracting the relative difference96 of the estimated capital requirements from the relative difference of the regulatory capital requirements. This difference, the total average difference (shown, for example, for Basel III capital requirements in the fourth row (C-A) in Figure 47 and Figure 48) determines whether the size dependence of Basel III or the CRR/CRD IV capital requirements complies with the one of the estimated capital requirements.97 Figure 47 and Figure 48 show the results for loans under the IRBA and the SA based on both the Basel III framework (C-A) and the CRR/CRD IV (C-B).
For the Basel III framework, both (relative) differences are negative and the absolute value of the difference for the empirical estimates is significantly higher than that of the difference for the regulatory numbers for loans assigned to the corporate portfolio. This may be interpreted as an indication that the empirical results, ceteris paribus, would support lower Basel III capital
96 The overall relative difference per size bucket is derived from the respective relative differences for each rating category by weighting with the number of loans. 97 The retail RW curve (other retail) has been applied for a turnover below EUR 2.5 million for Germany and EUR 1.5 million for France. Analyses of the BACH database from the European Committee of Central Balance Sheet Data Offices support the consideration of the first three turnover classes as other retail, as the average ratio of turnover to liabilities of credit institutions amounts to 3.1 in 2009, and EUR 1 million is the exposure threshold for the retail portfolio for Germany.

EBA REPORT ON SMES AND SME SUPPORTING FACTOR
89
requirements for SMEs. However, the gap between both relative differences from the benchmark is close to zero and is insignificant for loans in the IRBA retail portfolio, as we define average total differences below 10 percentage points as economically insignificant.
The results for the SA are considerably stronger and economically more significant than those for the IRBA under the Basel III framework. The estimated capital requirements differ to a much greater extent from the benchmark large corporates (-37% up to -56%) than the regulatory figures (0% up to -25%). For SMEs in the corporate portfolio, the results are directionally in line with those for the IRBA, but the average total differences are higher, up to a level of 56 percentage points. In comparison with the corporate portfolio, the empirical results for the SME loans in the retail portfolio indicate a lower, but economically significant, capital relief potential between 19 and 28 percentage points. To sum up, for all loans assigned to the SME portfolio, the empirical results suggest that the relative reduction compared to large firms is significantly higher than that reflected in the current capital requirements under the Basel III framework.
Under the CRR/CRD IV, the results in Figure 47 and Figure 48 indicate, for the IRBA, that SME SF is able to compensate for the difference between estimated and CRR/CRD IV capital requirements for loans in the corporate portfolio. For loans assigned to the retail portfolio, the SME SF increases the size dependence even higher than the estimated RWs suggest. The effect is almost zero for German loans, but is stronger for French loans. These results are likely to overstate the additional impact of the SME SF on regulatory RWs, as the assumption that all SME loans can be assigned to the SME SF appears to be very conservative in light of Figure 46.
In case of the CRR/CRD IV SA, the SME SF reduces the total differences between estimated and CRR/CRD IV capital requirements. For loans assigned to the corporate portfolio, the SME SF compensates for some part of the total differences, but some differences still remain. For retail loans, the differences are mostly captured by the SME SF, which means that the SME SF achieves the expected purpose.
The results are also valid when considering each rating class separately. Figure 49 shows the relative differences of the estimated and the Basel III (IRBA) RWs for each rating category. The relative differences are significantly negative for all loans assigned to the corporate portfolio. In each turnover class, the differences vary slightly, but the overall result turns out clearly. Against this background, the results are independent of the rating class, which means that the identified capital relief is determined for all rating classes of the borrowers.

EBA REPORT ON SMES AND SME SUPPORTING FACTOR
90
Figure 47. Average total differences of capital requirements in the Basel III and CRR/CRD IV IRBA and SA for France (in per cent)
IRBA
Turnover (in EUR million) Retail Corporate
0.75-1.5 1.5-5 5-15 15-50 BM
A Regulatory
Basel III -54.5% -22.1% -19.6% -8.7% 0.0%
B CRR/CRD IV -65.3% -40.6% -38.7% -30.4% 0.0%
C Estimated -43.5% -42.4% -40.8% -36.7% 0.0%
C-A Average total difference Basel III 11.0 p.p.*
-20.3 p.p.*
-21.2 p.p.*
-28.0 p.p.*
0.0 p.p.
C-B Average total difference CRR/CRD IV 21.8 p.p.* -1.8 p.p. -2.1 p.p. -6.2 p.p. 0.0 p.p.
SA
Turnover (in EUR million) Retail Corporate
0.75-1.5 1.5-5 5-15 15-50 BM
A Regulatory
Basel III -25.0% 0.0% 0.0% 0.0% 0.0%
B CRR/CRD IV -42.9% -23.8% -23.8% -23.8% 0.0%
C Estimated -43.5% -42.4% -40.8% -36.7% 0.0%
C-A Average total difference Basel III -18.5 p.p.*
-42.4 p.p.*
-40.8 p.p.*
-36.7 p.p.*
0.0 p.p.
C-B Average total difference CRR/CRD IV -0.6 p.p.
-18.6 p.p.*
-17.0 p.p.*
-12.9 p.p.*
0.0 p.p.
Note: The average total difference is calculated as the difference between the regulatory and estimated relative difference in RWAs. A negative difference means that the regulatory asset correlation leads to higher relative capital requirements than the RW based on estimated correlation (given the same level of other parameters). A positive difference means that the regulatory asset correlation leads to lower relative capital requirements than the RW based on estimated correlation (given the same level of other parameters). The values that are significant are marked with *. A difference is defined as significant if it is lower than -10 p.p. or higher than 10 p.p.

EBA REPORT ON SMES AND SME SUPPORTING FACTOR
91
Figure 48. Average total differences of capital requirements in the Basel III and CRR/CRD IV IRBA and SA for Germany (in per cent)
IRBA
Turnover (in EUR million) Retail Corporate
0-1 1-2.5 2.5-5 5-20 20-50 BM
A Regulatory
Basel III -53.7% -53.4% -22.1% -18.5% -7.4% 0.0%
B CRR/CRD IV -64.7% -64.5% -40.7% -37.9% -29.5% 0.0%
C Estimated -51.8% -52.8% -55.8% -42.0% -36.9% 0.0%
C-A Average total difference Basel III
1.9 p.p. 0.6 p.p. -33.6 p.p.*
-23.5 p.p.*
-29.5 p.p.*
0.0 p.p.
C-B Average total difference CRR/CRD IV
12.9 p.p.*
11.6 p.p.*
-15.1 p.p.*
-4.1 p.p.* -7.5 p.p.* 0.0 p.p.
SA
Turnover (in EUR million) Retail Corporate
0-1 1-2.5 2.5-5 5-20 20-50 BM
A Regulatory
Basel III -25.0% -25.0% 0.0% 0.0% 0.0% 0.0%
B CRR/CRD IV -42.9% -42.9% -23.8% -23.8% -23.8% 0.0%
C Estimated -51.8% -52.8% -55.8% -42.0% -36.9% 0.0%
C-A Average total difference Basel III
-26.8 p.p.*
-27.8 p.p.*
-55.8 p.p.*
-42.0 p.p.*
-36.9 p.p.*
0.0 p.p.
C-B Average total difference CRR/CRD IV
-8.9 p.p.
-9.9 p.p.
-32.0 p.p.*
-18.2 p.p.*
-13.1 p.p.*
0.0 p.p.
Note: The average total difference is calculated as the difference between the regulatory and estimated relative difference in RWAs. A negative difference means that the regulatory asset correlation leads to higher relative capital requirements than the RW based on estimated correlation (given the same level of other parameters). A positive difference means that the regulatory asset correlation leads to lower relative capital requirements than the RW based on estimated correlation (given the same level of other parameters). The values that are significant are marked with *. A difference is defined as significant if it is lower than -10 p.p. or higher than 10 p.p.

EBA REPORT ON SMES AND SME SUPPORTING FACTOR
92
Figure 49. Relative differences of the IRBA capital requirements
Based on asset correlation estimates and on Basel III capital requirements from the benchmark, ordered by rating and turnover class (in per cent)
France
Turnover in EUR million Retail Corporate
0.75-1.5 1.5-5 5-15 15-50 BM
Low risk 3 13.3% -22.6% -23.1% -29.3% 0.0%
4 6.9% -20.3% -20.9% -27.4% 0.0%
5 6.8% -18.6% -19.3% -26.4% 0.0%
High risk 6 15.5% -14.4% -15.5% -24.1% 0.0%
Germany
Turnover in EUR million Retail Corporate
0-1 1-2.5 2.5- 5 5-20 20-50 BM
Low risk I-II -1.2% -1.6% -36.9% -26.1% -31.0% 0.0%
III -3.5% -3.9% -33.8% -23.4% -29.1% 0.0%
IV 1.8% 1.4% -30.0% -20.1% -27.1% 0.0%
V 10.9% 10.5% -28.4% -18.7% -25.8% 0.0%
High risk VI 9.2% 8.7% -30.3% -20.1% -25.0% 0.0%
In order to fully analyse the adequacy of the SME SF, the threshold for its application needs to be taken into account. Thus, the study also aims to assess whether the systematic risk of SMEs depends on the amount owed (‘obligo’). Against this background, asset correlations are estimated with respect to the borrower’s loan volume, considering the different rating classes. The estimated asset correlations subject to obligo are shown in Figure 50 and Figure 66 in Annex 7. No empirical evidence supporting the limit of EUR 1.5 million currently implemented in Article 501 of the CRR is found for either Germany or France. This means that the limit of EUR 1.5 million for the amount owed set in the Article 501 of the CRR does not seem to be indicative of any change in riskiness for firms. Hence, further work would be required to understand whether the limit is justified, compared to the EUR 1 million threshold already existing in the CRR for the allocation of retail/corporate exposures or a different threshold.

EBA REPORT ON SMES AND SME SUPPORTING FACTOR
93
Figure 50. Estimated asset correlation subject to amount owned (amount owned in EUR million)
France Germany
The methodology described above was replicated on Italian data;98 nevertheless, the lack of statistically significant results prevents the use of the results to widen the coverage of the study on the consistency of own funds requirements with riskiness. Irrespective of the estimation methodology adopted, it was not possible to obtain statistically significant estimates for the asset correlation parameter for large corporates; the relatively small number of observations for the size class of large corporates is the main driver of this. The lack of a statistically significant coefficient crucially compromises the analyses. Indeed, as explained above, in the proposed methodology, large corporates serve as a benchmark that is essential for deriving relative differences between RWs; in turn, a flawed benchmark would invalidate the whole analysis.99
98 The assessment of the consistency of own funds requirements for Italian SME loans was based on default rate data from the Italian credit register; this information was complemented with rating information from a rating system developed internally at Bank of Italy and illustrated in Chionsini, Fabi and Laviola (2005), ‘Credit risk analysis: a model for corporate default probability estimation and its applications’ (original title: ‘Analisi del Rischio di Credito: Un Modello per la Stima della Probabilità di Insolvenza delle Imprese e Applicazioni’, Bank of Italy, mimeo.). The time series covers semi-annual data from 2002 to 2012. 99 The data issues presented above prevent replicating the full analysis carried over for other jurisdictions by using Italian data and considering large corporate (firms with an annual turnover greater than EUR 50 million) as a benchmark on a stand-alone basis. Nonetheless, it was possible to obtain some approximated results by relaxing the methodology assumptions and setting a new benchmark comprising not only large corporates, but also the larger of medium-sized firms (firms with an annual turnover in the EUR 20-50 million range). The evidence collected in this way for Italy seems to indicate that ML asset correlation estimates show diverging patterns across rating categories. For the majority of borrowing firms (representing the borrowers that were assigned better ratings), asset correlation estimates increase with firm size (identifying a positive relationship between systematic risk and firm size). Differently for a smaller proportion of the sample (representing the borrowers that were assigned the worse ratings), asset correlation is found to peak for medium-sized enterprises (representing firms with a turnover in the EUR 2.5-5 million range). The latter is not fully in line with the evidence collected for other countries, as well as with some academic literature related to Italian borrowers (e.g. Gabbi and Vozzella, 2013). The results seem to be mainly driven by either the specificities of the Italian sample (a relatively small number of very large corporates, which does not ensure an adequate coverage), as well as the smaller average dimensions of Italian firms with respect to other economies (which, in turn, may imply a different relation between the firms’ size distribution and the systematic factor, in this way affecting the results of the asset correlation estimation). Although deeply caveated, the reading of the empirically obtained pattern for the size
0.0%
0.2%
0.4%
0.6%
0.8%
1.0%
1.2%
1.4%
1.6%
Empi
rical
ass
et c
orre
latio
ns
SMEs Benchmark large corporates
0.0%
0.2%
0.4%
0.6%
0.8%
1.0%
1.2%
1.4%
1.6%
1.8%
2.0%
Empi
rical
ass
et c
orre
latio
ns
SMEs Benchmark large corporates

EBA REPORT ON SMES AND SME SUPPORTING FACTOR
94
The first preliminary asset correlation estimates based on Irish data support the findings for Germany and France, implying that the large Irish corporates are significantly more exposed to systematic risk than SMEs. However, due to a shorter time series and less robust results, this data could not be used to widen the coverage of the study on consistency of own funds requirements with riskiness.
The results for France and Germany suggest that, under CRR/CRD IV, the SME SF is consistent with the lower systematic risk of SMEs for all exposure classes in the SA, and for corporate SMEs in the IRBA. However, for IRBA retail loans, the capital reductions associated with the SME SF lead to relative capital requirements that are lower than those suggested by the systematic risk. As a result, after the application of the SME SF, the relative regulatory RWs are in line with the empirical ones in the IRBA corporate exposure class and the SA, but are lower than the empirical ones in the IRBA retail class, suggesting that these exposures may not be sufficiently capitalised relative to large corporates.
Additionally, the study did not find empirical evidence supporting the limit of EUR 1.5 million for the amount owed that is currently used for the application of the SME SF in accordance with Article 501 of the CRR.
dependence of the systematic risk of Italian SME loans seems to highlight some potential for reducing capital requirements for the IRBA and the SA retail exposure classes; at the same time, a capital reduction for the IRBA corporate exposure class does not seem fully backed by the empirical results on Italian data.

EBA REPORT ON SMES AND SME SUPPORTING FACTOR
95
8. Conclusions and policy recommendations In light of the findings of the analysis from the previous sections, this section draws the conclusions and provides recommendations.
Conclusions 8.1
Given the current findings presented in the report, there is no evidence that the SME SF has provided additional stimulus for lending to SMEs compared to large corporates (comparison group). In particular, according to the results presented, SMEs have faced the same probability of being credit constrained as large firms in the period following the introduction of the SME SF.100 The EBA, however, also recognises that it may be too early to draw any strong conclusions from its analysis, given the limitations of the data available for the assessment, as well as due to the relatively recent introduction of the SME SF. Anecdotal evidence provided by the financial industry indicates that the implementation may take longer in order to be fully integrated into the decision process of institutions. Moreover, overlaying developments—such as the introduction of the CRR/CRD IV—hampered, to some extent, the identification of the effect of the SME SF. The use of large firms as a control group is a further limitation of the study, but also the best reference given the data limitations.101
The EBA analysis on the calibration of the credit risk framework on a limited sample of SME loans from three EU countries, looking primarily at asset correlation, also provided mixed evidence. On the one hand, an analysis of the relative capital requirements stemming from the IRBA indicated that the SME SF may be justified for SMEs in the IRBA corporate exposure class, given that the current IRBA calibration tended to be conservative compared to the riskiness of these exposures. Similarly, the SME SF may be justified under the SA for both corporate and retail exposure classes. On the other hand, the calibration for the IRBA retail exposure class was found to be correct without the application of the SME SF. This study has covered a limited number of countries; therefore, the representativeness of the sample for the entire EU could not be achieved. Consequently, a more complete compilation of evidence of a systematic overestimation across all EU Member States for all SME exposures may not be inferred, and thus neither does the study fully justify nor fully reject the SME SF for this purpose.102
100 A study based on Spanish data showed slightly different results. In this study, after the introduction of the SME SF—which, in the case of Spain, was in September 2013 (4 months before the CRR)—SME lending grew more relative to large corporations. The relative growth of credit for SMEs vs other corporates shifts from not being statistically significant before the reform to being so after it. The results of this analysis were presented in the Bank of Spain Financial Stability Report 05/2014. 101 SMEs that are not eligible for the SME SF would be the best option. Such information, however, is not available in any EU-level databases. 102 It should also be noted that this study (along with many others) has found PD rates to be higher for SMEs than for larger corporates. Nevertheless, the report does not analyse whether the lower asset value correlations of SMEs

EBA REPORT ON SMES AND SME SUPPORTING FACTOR
96
Finally, the EBA notes that the SME SF appears to have been introduced by legislators as a precautionary measure in order to not jeopardise lending to the SME sector, and thereby does not aim to be solely a prudential measure. In light of this, should legislators decide to keep the current framework, the EBA considers that it is crucial to continue the monitoring of the SME SF.
Some of the results mentioned above may call into question the appropriateness of the SME SF from a prudential standpoint, which is in line with the findings of the EBA (2012) report. At the same time, the EBA notes that it may be too premature to assess the full potential impact of the measure with regard to stimulating lending. The limitations presented above have prevented one from drawing firm conclusions. Therefore, it cannot be ruled out that the measure serves its primarily non-prudential purpose of ensuring funding to the SME sector during the implementation of the prudential framework. Hence, in order to draw firmer conclusions, the EBA believes it would be necessary to assess the impact of the SME SF over a longer period.
Policy recommendations 8.2
Recommendation 1: Continued monitoring and a reassessment of the SME SF is crucial to understand its impact on SME lending
Looking forward, continuing monitoring of the SME Supporting Factor is crucial to understand how the SME Supporting Factor is applied and what its impact on SME lending is.
Collection of further data on exposures subject to the SME Supporting Factor based on COREP will provide an important source of information. However it is equally important that a repeated assessment of the SME Supporting Factor is conducted both in terms of impact on lending and consistency with riskiness, which would also imply that new or better data should be available.
As regard lending data, no significant changes are expected in terms of quality and availability of actual lending trends data around the time of introduction of the SME SF. Given the delayed implementation of the SME SF, a longer time series of the SAFE survey may provide some additional information on the impact.103 A potential positive development could be the harmonization of the SME definition (see Recommendation 4) as it would allow the analysis of bank lending to SMEs subject to the SME Supporting Factor relative to SMEs in general.
As regards the consistency of capital requirements with riskiness, a repeated assessment should be considered once the RWs reviewed by Basel are introduced. Indeed a review of the SA RWs is currently under way and expected to be finalized by end 2016. Moreover, longer time series of default rates may be available for other EU countries to extend the analysis.
(suggesting a lower RW for some SMEs) are significant enough to outweigh the level of unexpected loss compared to large corporates. 103 It has to be noted that the ECB quantitative easing that started in 2015 will make the identification of a credit supply effect due to the SME SF more difficult.

EBA REPORT ON SMES AND SME SUPPORTING FACTOR
97
Recommendation 1: Continued monitoring and a reassessment of the SME SF is crucial to understand its impact on SME lending
Recommendation 2: A more comprehensive approach is necessary for the review of risk weights
In cases of miscalibration of risk weights, a more comprehensive approach should be taken in adjusting the capital treatment of SMEs.
In accordance with the EBA’s opinion on SME proposals for CRD IV submitted to the European Commission in June 2012, the EBA proposes the “introduction of a “supporting discount”, which would not act on risk weights, but would be applied at the end of the process of the capital calculation”, hence without altering the current risk-weights.
The application of the SME Supporting Factor should ensure that the consistency of RWs within the capital requirements framework is not altered to lead to undercalibration. The analysis in the report showed that the impact of reduced capital requirements on the relative calibration differs by portfolio, leading to a potential under calibration in the case of the IRBA retail class, but being justified in the case of the SA and the IRBA corporate class.
EBA believes that the more general issue of over-calibration and adjustments to RWs should be pursued through a more comprehensive review of the RWs, and not through the application of a fixed discount factor to all SME exposure, which may not be sensitive enough to differences in portfolios. Indeed, this works has already started at Basel level, and in the most recent proposal the exposures to SMEs in the corporate exposure class would receive an 85% risk weight while SMEs exposures in the retail exposure class would continue to receive a 75% risk weight.
Recommendation 3: Review of the amount owed limit criterion and in the application of the SME SF to understand its purpose and cost of application
Further analysis should be conducted on the amount owed limit set for the application of the SME SF.
The limit of EUR 1.5 million of amount owed in Article 501 CRR is different from the Retail threshold of EUR 1 million amount owed, and is only used for the purpose of the SME SF. At the same time, in the consultation conducted by the EBA in July 2015, the industry has requested an increase of the limit for the amount owed for the SME SF application, because, according to the respondents, the current EUR 1.5 million threshold captures only the very small SMEs.
Preliminary analysis of the asset correlation based on data from France and Germany shows no evidence that the limit of EUR 1.5 million for the amount owed, as set out in Article 501 of the

EBA REPORT ON SMES AND SME SUPPORTING FACTOR
98
CRR, would be indicative of any change in the riskiness of SMEs.
Further work is needed to consider whether the limit is justified compared to the EUR 1 million threshold already existing in the CRR or to a different threshold, together with a clear justification of its purpose and an assessment of the additional burden on institutions to identify and monitor this threshold, which is only used for the purpose of SME SF.
Recommendation 4: Harmonisation of SME definition in the CRR
To improve the data availability and relevance, the harmonization of SME definition in the CRR should be considered.
The EBA Supervisory data, which collects data on the compliance of banks with the CRR provided some insights into the application of the SME Supporting Factor. Despite collecting data also on SMEs, such information could not be used due to the lack of a harmonized definition.
The CRR provides a definition for SMEs for the application of the SF in Article 501 of the CRR. However, it does not provide a specific definition of SMEs in the SA or in the IRBA, and the SME exposures do not constitute a specific exposure class. The findings of the EBA (2012) report show that each institution uses its own definition, which most of the times is different from the EU recommendation 2003/361.
The harmonisation of the SME definition would lead to better implementation and consistency in the regulation and comparable data on SMEs, and hence could be used for the monitoring of SME lending, riskiness and the impact of the application of the SME Supporting Factor. This would also allow building a more comprehensive data set on SME riskiness. This harmonisation can, in the view of the EBA, only be obtained through legislative changes, which can subsequently be adopted in the reporting framework.
Factors that may justify different SME definitions across institutions, such as the size of the economy, the bank size and/or bank business model should be considered when conducting such harmonisation. In line with the regulatory principles, the benefits of such harmonization should also be weighed against the costs and burden to the institutions.

EBA REPORT ON SMES AND SME SUPPORTING FACTOR
99
9. References Acharya, V. V., Bharath, S. T., & Srinivasan, A. (2007) Does industry-wide distress affect defaulted firms? Evidence from creditor recoveries. Journal of Financial Economics, Elsevier, 85(3).
Admati, A. R., DeMarzo, P. M., Hellwig, M. F., & Pfleiderer, P. C. (2013). Fallacies, irrelevant facts, and myths in the discussion of capital regulation: Why bank equity is not socially expensive. Max Planck Institute for Research on Collective Goods, 23.
Aiyar, S., Calomiris, C. W., & Wieladek, T. (2014). Does macro-prudential regulation leak? Evidence from a UK policy experiment. Journal of Money, Credit and Banking, 46(1), 181-214.
Aiyar, S., Calomiris, C. W., & Wieladek, T. (2015a). How does credit supply respond to monetary policy and bank minimum capital requirements? European Economic Review, forthcoming.
Aiyar, S., Calomiris, C. W., & Wieladek, T. (2015b). A primer on bank capital regulation: Theory, empirics, and policy. IMF Economic Review, forthcoming.
Albertazzi, U., & Marchetti, D. J. (2010). Credit supply, flight to quality and evergreening: An analysis of bank-firm relationships after Lehman. Bank of Italy Working Paper No. 756.
Altman E., & Sabato G. (2006). Modelling credit risk for SMEs: Evidence from the US market. Available at SSRN: http://ssrn.com/abstract=872336 or http://dx.doi.org/10.2139/ssrn.872336.
Angelini, P., Clerc, L., Cúrdia, V., Gambacorta, L., Gerali, A., Locarno, A., & Vlček, J. (2015). Basel III: Long-term impact on economic performance and fluctuations. The Manchester School, 83(2), 217-251.
Bams, W. F. M., Pisa, M., & Wolff, C. C. (2014). Modelling default correlation in a US retail loan portfolio. Centre for Economic Policy Research.
Bank of Spain (2014). Analysis of the impact on lending of the new capital requirements and the change in the definition of SMEs. Bank of Spain Financial Stability Report 05/2014.
BCBS – Basel Committee on Banking Supervision (2005). An explanatory note on the Basel II IRB risk weight functions.
BCBS (2006). International convergence of capital measurement and capital standard.
BCBS (2010). An assessment of the long-term impact of stronger capital and liquidity requirements (LEI report).
Beck, T., Degryse, H., De Haas, R., & van Horen, N. (2014). When arm’s length is too far: Relationship banking over the business cycle. European Bank of Reconstruction and Development Working Paper No. 169.

EBA REPORT ON SMES AND SME SUPPORTING FACTOR
100
Beck, T., & Demirguc-Kunt, A. (2006). Small and medium-size enterprises: Access to finance as a growth constraint. Journal of Banking & Finance, 30(11), 2931-2943.
Becker, B., & Ivashina, V. (2014). Cyclicality of credit supply: Firm level evidence. Journal of Monetary Economics, 62, 76-93.
Berg, T., Gehra, B., & Kunisch, M. (2011). A certification model for regulatory rrbitrage: Will regulatory arbitrage persist under Basel III? The Journal of Fixed Income, 21(2), 39-56.
Berger, A. N., & Udell, G. F. (1994). Did risk-based capital allocate bank credit and cause a “credit crunch” in the United States? Journal of Money, Credit and Banking, 585-628.
Berrospide, J. M., & Edge, R. M. (2010). The effects of bank capital on lending: What do we know, and what does it mean? International Journal of Central Banking, 6(34), 1-50.
Bridges, J., Gregory, D., Nielsen, M., Pezzini, S., Radia, A., & Spaltro, M. (2014). The impact of capital requirements on bank lending. Bank of England Working Paper No. 486.
Brown, M., Ongena, S., Popov, A., & Yeşin, P. (2011). Who needs credit and who gets credit in Eastern Europe? Economic Policy, 26(65), 93-130.
Brun, M., Fraisse, H., & Thesmar, D. (2013). The real effects of bank capital requirements. HEC Paris Research Paper No FIN-2013-988.
Buch, C. M., & Prieto, E. (2014). Do Better Capitalised Banks Lend Less? Long-run panel evidence from Germany. International Finance, 17(1), 1-23.
Carbo-Valverde, S., Rodriguez-Fernandez, F., & Udell, G. F. (2015). Trade credit, the financial crisis, and SME access to finance. Journal of Money, Credit and Banking, forthcoming.
Carlson, M., Shan, H., & Warusawitharana, M. (2013). Capital ratios and bank lending: A matched bank approach. Journal of Financial Intermediation, 22(4), 663-687.
Casey, E., & O’Toole, C. (2014). Bank lending constraints, trade credit and alternative financing during the financial crisis: Evidence from European SMEs. Journal of Corporate Finance, 27, 173-193.
Chernih, A., Henrard, L., & Vanduffel, S. (2010). Reconciling credit correlations. The Journal of Risk Model Validation, 4(2), 47-64.
Dietsch, M., & Fraisse, H. (2013). How different is the regulatory capital from the economic capital: the case of business loans portfolios held by the major banking groups in France. Débats économiques et financiers 1, ACPR.

EBA REPORT ON SMES AND SME SUPPORTING FACTOR
101
Dietsch, M., Düllmann, K., Fraisse, H., Koziol, P., & Ott, C. (2016). Support for the SME supporting factor – Multi-country empirical evidence on systematic risk factor for SME loans. Deutsche Bundesbank Discussion Paper Series, forthcoming.
Dietsch, M., & Petey, J. (2002). The credit risk in SME loans portfolios: Modelling issues, pricing, and capital requirements. Journal of Banking & Finance, 26, 303-322.
Dietsch, M., & Petey, J. (2004). Should SME exposures be treated as retail or corporate exposures? A comparative analysis of default probabilities and asset correlations in French and German SMEs. Journal of Banking & Finance, 28(4), 773-788.
Dietsch, M., & Petey, J. (2009). Sector concentration risk in SME credit portfolios: A multifactor approach. Unpublished Working Paper.
Düllmann, K., & Koziol, P. (2013). Evaluation of minimum capital requirements for bank loans to SMEs. Deutsche Bundesbank, Discussion Paper 22/2013.
Düllmann, K., & Koziol, P. (2014). Are SME loans less risky than regulatory capital requirements suggest? The Journal of Fixed Income, 23(4), 89-103.
Düllmann, K., Kunisch, M., & Küll, J. (2010). Estimating asset correlations from stock prices or default rates—Which method is superior? Journal of Economic Dynamics and Control, 34(11), 2341-2357.
Düllmann, K., & Scheule, H. (2006). Determinants of the asset correlations of German corporations and implications for regulatory capital. Unpublished Working Paper.
Duygan-Bump, B., Levkov, A., & Montoriol-Garriga, J. (2015). Financing constraints and unemployment: evidence from the Great Recession. Journal of Monetary Economics, 75, 89-105.
EBA – European Banking Authority (2012). Assessment of SME proposals for CRD IV/CRR.
EBA (2014). Report on EU covered bond frameworks and capital treatment, European Banking Authority.
EBA (2014). Results of 2014 EU-wide stress test (aggregate results), accessed at: http://www.eba.europa.eu/documents/10180/669262/2014+EU-wide+ST-aggregate+results.pdf
EBA (2015). Risk assessment of the European banking system, June 2015.
European Commission (2015). 2014/2015 Annual report on European SMEs.
European Commission (2015). Green paper of the European Commission on the Capital Markets Union.

EBA REPORT ON SMES AND SME SUPPORTING FACTOR
102
European Commission Recommendation 2003/361/EC of 6 May 2003 concerning the definition of micro, small and medium-sized enterprises.
Ferrando, A., Popov, A. A., & Udell, G. F. (2015). Sovereign stress, unconventional monetary policy, and SME access to finance. ECB Working Paper No. 1820.
Fidrmuc, J., & Hainz, C. (2009). Default rates in the loan market for SMEs: Evidence from Slovakia. Institute for Economic Research at the University of Munich, IFO Working Paper No.72.
Francis, W., & Osborne, M. (2009). Bank regulation, capital and credit supply: Measuring the Impact of Prudential Standards. Financial Services Authority Working Paper No. 36.
Frey, R., & McNeil, A. J. (2003). Dependent defaults in models of portfolio credit risk. Journal of Risk, 6, 59-92.
Gabbi, G., & Vozzella, P. (2013). Asset correlations and bank capital adequacy. The European Journal of Finance, 19(1), 55-74.
Gordy, M. B. (2003). A risk-factor model foundation for ratings-based bank capital rules. Journal of financial intermediation, 12(3), 199-232.
Gordy, M. B., & Heitfield, E. (2002). Estimating default correlations from short panels of credit rating performance data. Unpublished Working Paper.
Gordy, M. B., & Heitfield, E. (2010). Small sample estimation of models of portfolio credit risk, in: Kijima, M., Hara, C., Tanaka, K., and Muromachi, Y. (eds.). Recent advances in financial engineering. Singapore: World Scientific.
Haddad, J. M. (2013). Comprehensive correlation and capital estimates for a Canadian SME portfolio: Implications for Basel. Unpublished Working Paper.
Hashimoto, T. (2009). Asset correlation for credit risk analysis – Empirical study of default data for Japanese companies, 09-E-3. Bank of Japan.
Holton, S., Lawless, M., & McCann, F. (2014). Credit demand, supply and conditions: A tale of three crises. Applied Economics, 46 (2), 190-211.
IMF – International Monetary Fund (2013) Global financial stability report: Transition challenges to stability, October 2013. IMF, World Economic and Financial Surveys.
Jiménez, G., Ongena, S., Peydro, J. L., & Saurina, J. (2014). Macroprudential policy, countercyclical bank capital buffers and credit supply: Evidence from the Spanish dynamic provisioning experiments. European Banking Center Discussion Paper, 2012-011.
Kapan, T., & Minoiu, C. (2015). Balance sheet strength and bank lending during the global financial crisis. IMF Working Paper 13/102.

EBA REPORT ON SMES AND SME SUPPORTING FACTOR
103
Khwaja, A. I., & Mian, A. (2008). Tracing the impact of bank liquidity shocks: Evidence from an emerging market. The American Economic Review, 1413-1442.
Lee, S. C., Jiang, I. M., Chiu, B. H., & Cheng, H. C. (2012). Asset correlation and evidence from UK firms. International Research Journal of Applied Finance, 50, 50-64.
Lopez, J. A. (2004). The empirical relationship between average asset correlation, firm probability of default, and asset size. Journal of Financial Intermediation, 13(2), 265-283.
MAG – FSB/BCBS Macroeconomic Assessment Group (2010). Assessing the macroeconomic impact of the transition to stronger capital and liquidity requirements – Final report.
Martinho, R., & Antunes, A. (2012). A scoring model for Portuguese non-financial enterprises. Banco de Portugal Financial Stability Report, November 2012.
McCann, F., & McIndoe-Calder, T. (2012). Determinants of SME loan default: The importance of borrower-level heterogeneity. Central Bank of Ireland, Research Technical Paper 06/RT/12
McNeil, A. J., & Wendin, J. P. (2007). Bayesian inference for generalised linear mixed models of portfolio credit risk. Journal of Empirical Finance, 14 (2007), 131-149.
Mésonnier, J. S., & Monks, A. (2015). Did the EBA capital exercise cause a credit crunch in the euro area? International Journal of Central Banking, 11(3), 75-117.
Miles, D., Yang, J., & Marcheggiano, G. (2013). Optimal bank capital. The Economic Journal, 123(567), 1-37.
Noss, J., & Toffano, P. (2014). Estimating the impact of changes in aggregate bank capital requirements during an upswing. Bank of England Working Paper No. 494.
Popov, A. (2015). Monetary policy, bank capital and credit supply: a role for discouraged and informally rejected firms. International Journal of Central Banking, forthcoming.
Popov, A., & Udell, G. F. (2012). Cross-border banking, credit access, and the financial crisis. Journal of International Economics, 87(1), 147-161.
Repullo, R., & Suarez, J. (2013). The procyclical effects of bank capital regulation. Review of Financial Studies, 26(2), 452-490.
Schleifer, A., & Vishny, R. W. (1992). Liquidation values and debt capacity: A market equilibrium approach. Journal of Finance, American Finance Association, 47(4).
Wehinger, G. (2012). Bank deleveraging, the move from bank to market-based financing, and SME financing. OECD Journal: Financial Market Trends, 2012, 1.

EBA REPORT ON SMES AND SME SUPPORTING FACTOR
104
Wehinger, G. (2014). SMEs and the credit crunch: Current financing difficulties, policy measures and a review of literature. OECD Journal: Financial Market Trends, 2013, 2.

EBA REPORT ON SMES AND SME SUPPORTING FACTOR
105
Annex 1: Selected recitals and articles from the European legal framework REGULATION (EU) No 575/2013 OF THE EUROPEAN PARLIAMENT AND OF THE COUNCIL of 26 June 2013 on prudential requirements for credit institutions and investment firms […] (44) Small and medium-sized enterprises (SMEs) are one of the pillars of the Union economy
given their fundamental role in creating economic growth and providing employment. The recovery and future growth of the Union economy depends largely on the availability of capital and funding to SMEs established in the Union to carry out the necessary investments to adopt new technologies and equipment to increase their competitiveness. The limited amount of alternative sources of funding has made SMEs established in the Union even more sensitive to the impact of the banking crisis. It is therefore important to fill the existing funding gap for SMEs and ensure an appropriate flow of bank credit to SMEs in the current context. Capital charges for exposures to SMEs should be reduced through the application of a supporting factor equal to 0.7619 to allow credit institutions to increase lending to SMEs. To achieve this objective, credit institutions should effectively use the capital relief produced through the application of the supporting factor for the exclusive purpose of providing an adequate flow of credit to SMEs established in the Union. Competent authorities should monitor periodically the total amount of exposures to SMEs of credit institutions and the total amount of capital deduction.
[…]
Article 501
Capital requirements deduction for credit risk on exposures to SMEs
1. Capital requirements for credit risk on exposures to SMEs shall be multiplied by the factor 0.7619.
2. For the purpose of this Article:
(a) the exposure shall be included either in the retail or in the corporates or secured by mortgages on immovable property classes. Exposures in default shall be excluded;
(b) an SME is defined in accordance with Commission Recommendation 2003/361/EC of 6 May 2003 concerning the definition of micro, small and medium-sized enterprises (1). Among the criteria listed in Article 2 of the Annex to that Recommendation only the annual turnover shall be taken into account;
(c) the total amount owed to the institution and parent undertakings and its subsidiaries, including any exposure in default, by the obligor client or group of connected clients, but

EBA REPORT ON SMES AND SME SUPPORTING FACTOR
106
excluding claims or contingent claims secured on residential property collateral, shall not, to the knowledge of the institution, exceed EUR 1.5 million. The institution shall take reasonable steps to acquire such knowledge.
3. Institutions shall report to competent authorities every three months on the total amount of exposures to SMEs calculated in accordance with paragraph 2.
4. The Commission shall, by 28 June 2016, report on the impact of the own funds requirements laid down in this Regulation on lending to SMEs and natural persons and shall submit that report to the European Parliament and to the Council, together with a legislative proposal, if appropriate.
5. For the purpose of paragraph 4, the EBA shall report on the following to the Commission:
(a) an analysis of the evolution of the lending trends and conditions for SMEs over the period referred to in paragraph 4;
(b) an analysis of effective riskiness of Union SMEs over a full economic cycle;
(c) the consistency of own funds requirements laid down in this Regulation for credit risk on exposures to SMEs with the outcomes of the analysis under points (a) and (b).
B. COMMISSION RECOMMENDATION REGARDING SME DEFINITION
COMMISSION RECOMMENDATION of 6 May 2003 concerning the definition of micro, small and medium-sized enterprises
Article 1
1. This Recommendation concerns the definition of micro, small and medium-sized enterprises used in Community policies applied within the Community and the European Economic Area.
2. Member States, the European Investment Bank (EIB) and the European Investment Fund (EIF), are invited:
(a) to comply with Title I of the Annex for their programmes directed towards medium-sized enterprises, small enterprises or microenterprises;
[…]
ANNEX
TITLE I

EBA REPORT ON SMES AND SME SUPPORTING FACTOR
107
DEFINITION OF MICRO, SMALL AND MEDIUM-SIZED ENTERPRISES ADOPTED BY THE COMMISSION
Article 1
Enterprise
An enterprise is considered to be any entity engaged in an economic activity, irrespective of its legal form. This includes, in particular, self-employed persons and family businesses engaged in craft or other activities, and partnerships or associations regularly engaged in an economic activity.
Article 2
Staff headcount and financial ceilings determining enterprise categories
1. The category of micro, small and medium-sized enterprises (SMEs) is made up of enterprises which employ fewer than 250 persons and which have an annual turnover not exceeding EUR 50 million, and/or an annual balance sheet total not exceeding EUR 43 million.
2. Within the SME category, a small enterprise is defined as an enterprise which employs fewer than 50 persons and whose annual turnover and/or annual balance sheet total does not exceed EUR 10 million.
3. Within the SME category, a microenterprise is defined as an enterprise which employs fewer than 10 persons and whose annual turnover and/or annual balance sheet total does not exceed EUR 2 million.
[…]

EBA REPORT ON SMES AND SME SUPPORTING FACTOR
108
Annex 2: Data considerations – SME definition and data sources
Any analysis focused on SMEs encounters obstacles when it comes to timely and qualitative data. These obstacles are encountered due to, on the one hand, the diversity of SME definitions applied in different countries and institutions, and, on the other hand, due to the fragmented statistical data. In combination, these two limitations often do not allow having conclusive results and require a pragmatic interpretation of data. This Annex provides an overview of the SME definitions and data sources used in this report.
SME definition
There is no common SME definition applied across the entire EU. Different SME definitions are used in the EU Member States depending on the purpose and data availability, thus creating difficulties in having a common concept of an SME.
In the EU, we can identify the following SME definitions:
SME definition in accordance with the 2003 EU Recommendation (EU definition) – This definition was set by the Commission’s Recommendation 2003/361/EC of 6 May 2003 concerning the definition of micro, small and medium-sized enterprises, and defines micro, small and medium enterprises (or SMEs)104 based on the number of employees and turnover or balance sheet size (Annex 3). According to this Recommendation, Member States, the EIB and the EIF are invited to apply this definition for their programmes directed towards medium-sized enterprises, small enterprises or micro enterprises. This definition is used when analysing SME sources of finance (section 2), lending trends and conditions (section 4) and SME riskiness (section 3). However, given the limited data availability, it is often the case that proxies are used instead, such as the size of loan to approximate the size of the borrower (in these cases, a note explaining the proxy is provided). The same general definition is applied in the discussion of the general treatment of SMEs in the CRR.
Country-specific and bank-specific SME definitions – In practice, the SME definition applied varies with the size of the country in which the institution is domiciled or the institution applying the definition. According to the EBA (2012),105 for example, internationally active banks appear to often have different SME definitions for each and every country in which they operate, while non-internationally active smaller banks (typically using the SA) tend to share a common definition with other banks in their jurisdiction. Bank-specific definitions are used for the empirical analysis bank SME portfolios in Box 2 (section 5).
104 To be noted, micro enterprises are included in the definition of SMEs, although they are not allocated a letter in the abbreviation. 105 EBA (2012), Assessment of SME Proposals for CRD IV/CRR

EBA REPORT ON SMES AND SME SUPPORTING FACTOR
109
Exposures subject to SME SF – In view of the introduction of the capital discount to eligible SME exposures, certain criteria were set to ensure a consistent application of the factor in accordance with Article 501 of the CRR (Annex 2), resulting in a definition that is slightly different compared to the EU definition and defines an exposure, rather than an entity. In order for an exposure to be eligible for the SME SF, the borrower should meet all the requirements of the EU SME definition (except the employment headcount and the balance sheet size criteria), but the criteria also includes two other conditions: the exposure class and the total amount owed to the institution and its subsidiaries and parent undertakings by the client or the group of clients, as shown in the table below. This definition is used in the context of the application of the SME SF to SME exposures in section 5 of the report.
Figure 51. Comparison of EU SME definition and definition of exposures subject to the SME SF
Criteria EU SME
definition
Definition of exposures subject to
the SME SF
2003 EU Recommendation criteria
Turnover does not exceed EUR 50 million
Balance sheet size does not exceed EUR 50 million
Employs less than 250 people
Other criteria in accordance with the Recommendation
Exposure belongs to exposure classes corporate, retail or secured by immovable property in accordance with
Article 501 of the CRR
Amount owed to the institution, its parent undertakings and subsidiaries by the borrower and its group of
connected clients (as defined in Article 4(1)(39) of the CRR) does not exceed EUR 1 million (in accordance with
Article 501 of the CRR)
Source: Compiled based on the Commission’s Recommendation 2003/361/EC of 6 May 2003 concerning the definition of micro, small and medium-sized enterprises and Article 501 of the CRR. Please refer to the original documents for a more detailed account of the definitions applied.
Data sources and quality issues
Statistics on SMEs at the EU level tend to be fragmented. Issues of cross-country comparability are compounded with the various definitions of SME, limited historical data and uneven country coverage. Furthermore, the data still appears preliminary in some cases.
OR

EBA REPORT ON SMES AND SME SUPPORTING FACTOR
110
Against this background, the report draws from existing data sources to measure SME riskiness over a full economic cycle, together with SME lending trends and conditions (Figure 52). Harmonised data sets at the EU level are given preference as they follow common guidelines, enabling comparability across countries. When available, data from credit registers are used for individual case studies.
The identification of SMEs varies across sources. For example, the ECB’s SAFE classifies SMEs as those enterprises whose number of employees is lower than 250, while the ECB BLS considers those enterprises as SMEs whose annual net turnover is less than EUR 50 million. In some instances, there is no separate breakdown for SMEs, such as in the ECB Monetary and Financial Statistics. In those instances, SMEs are proxied by NFCs with a loan size below EUR 1 million.
Survey data is used to complement the discussion on SME lending conditions based on interest rate statistics. Soft data contributes to monitoring the evolution of credit standards and conditions, and are extensively used in the literature. However, some survey samples might not be representative, as the absence of SME bank loan rejections in some countries seem to suggest.
Different samples and SME definitions may lead to different conclusions. Due caution should be applied when comparing different data sources and interpreting the data.
Figure 52. Overview of data sources
Source Data set Area Caveats
EBA Supervisory data (COREP)
- Capital relief due to the SME SF
- SME lending
- Limited historical data: as of first quarter of 2014
- Still outstanding data quality issues
ECB MFI interest rate statistics
SME lending trends and conditions
- Limited country coverage: Euro area countries for trends
- No SME breakdown (proxied by NFCs under EUR 1 million)
The Commission
SAFE SME lending conditions Limited historical data: Annual in 2009, 2011, 2013 and 2014
ECB SAFE SME lending conditions
- Limited country coverage: Euro area
- Limited historical data: Semi-annual data from 2009H1 to 2014H2
ECB BLS SME lending conditions Limited country coverage: Estonia,

EBA REPORT ON SMES AND SME SUPPORTING FACTOR
111
Ireland, Austria and Finland not available for some measures
Eurostat Access to Finance survey
SME lending conditions Limited historical data: 2007 and 2010 (one-off survey)
Eurostat Economy and Finance database
Size of SMEs in the economy
European Committee of Central Balance Sheet Data Offices
BACH SME riskiness
- Limited country coverage: 11 countries
- Limited historical data for some countries
- Limited selection of financial ratios

EBA REPORT ON SMES AND SME SUPPORTING FACTOR
112
Annex 3: Application of the SME SF
Despite the specifications in the CRR, the scope of application of the SF is not always clear, and numerous questions have been submitted to the EBA via the formal Q&A online tool. Annex 5 amalgamates all the Q&As on SMEs, and the interpretation and application of the SF, that exists to date. A short summary of the scope of implementation of the SME SF, taking into account the CRR provisions as well as all the relevant Q&As, is provided below.
Scope of application of the SF
The allocation to exposure classes remains unchanged, irrespective of the application of the eligibility for the SME SF. An illustration of the asset classes that can be eligible for the application of the SME SF is presented in Figure 53 below.
Figure 53. Exposure classes eligible for the SME SF
A) SA
Regulatory portfolio Total amount owed*
Turnover or balance sheet
RWA for the unsecured part
Final RW after SME SF
SA corporate <= EUR 1.5 million <= EUR 50 million 100% if unrated
20-150% if rated
76.19% if unrated
SA retail <= EUR 1 million <= EUR 50 million 75% 57.14%
SA commercial real estate < EUR 1.5 million <= EUR 50 million 50%106 or 100% 38.095%
SA residential real estate < EUR 1.5 million <= EUR 50 million 35%107 or 100% 26.67%
B) IRBA
Regulatory portfolio Total amount owed* Turnover or balance sheet
IRBA SME corporate (excluding in default)
< EUR 1.5 million < EUR 50 million
IRBA SME retail (excluding in default)
<= EUR 1 million, if the obligor is not a natural person OR
Any, if the obligor is a natural person
< EUR 50 million
106 Where the conditions under Article 125 of the CRR are met and unless otherwise decided by the competent authority in accordance with Article 124(2) of the CRR. 107 Where the conditions under Article 126 of the CRR are met and unless otherwise decided by the competent authority in accordance with Article 124(2) of the CRR.
EBA REPORT ON SMES AND SME SUPPORTING FACTOR
113
Note: *Including any exposure in default by the obligor client or group of connected clients, but excluding claims and contingent claims secured on residential property collateral. Source: The EBA analysis.
Exposures in default shall be excluded. In particular, when an institution applies the transaction approach108 for retail exposures and some of the exposures of the same SME are classified as defaulted, the SF could only be applied on the performing exposures.
SME definition for the purpose of application of the SF
The criteria set in Article 501 of the CRR, including the turnover criterion for the SME definition and the total amount owed, should be met on an ongoing basis (Q&A 343 and Q&A 414). An institution therefore needs to have adequate information available on an ongoing basis, and should be able to adequately demonstrate its fulfilment to its competent authorities. Where an exposure is denominated in another currency than the euro, the institution may calculate the euro equivalent using any appropriate set of exchange rates updated with appropriate frequency (Q&A 417).
Amount owed for the purpose of application of the SF
Off-balance-sheet exposures should not be included in the calculation of the amount owed. In case of line of credit, only the drawn amount needs to be considered when checking against the EUR 1.5 million amount (Q&A 416). However, the exposure as a whole, including its undrawn part, can qualify as an exposure to an SME, provided that all eligibility criteria are met.
Regarding secured exposures, where an exposure is eligible for the application of the SF, the capital requirements are calculated by applying the SF on all exposures included in the retail, corporates or ‘secured by mortgages on immovable property’ classes, irrespective of whether credit risk mitigation techniques with substitution effects (e.g. guarantees) have reclassified the exposure for reporting purposes in another exposure class (Q&A 565).
The EUR 1.5 million amount owed threshold for the application of the SME SF is determined by excluding claims or contingent claims secured on residential property collateral on the one hand, and including any exposure in default on the other hand. This has the implication that an SME exposure can qualify for SME SF, even when the total amount owed is well above the threshold when claims against the obligor, which are secured by residential mortgage, are not excluded. For example, if an SME, assigned to the exposure class secured by immovable property, takes a loan of EUR 2 million with the bank, having a claim of EUR 1.8 million secured on residential property, this loan would be eligible for the application of the SME SF, even though it is above the EUR 1.5 million threshold.
108 The transaction approach refers to the case where a bank treats a default of a transaction solely as a default of that particular exposure, without contagion effect to other exposures of the same borrower. In contrast, the obligor approach means that the default of any exposure of the borrower will translate into the default of all exposures of that particular borrower.

EBA REPORT ON SMES AND SME SUPPORTING FACTOR
114
Figure 54. Summary of published Q&As related to the interpretation and application of the SME SF (Article 501 of the CRR)
Q&A Publication date Topic Question Response
27 SME definition How is SME defined?
Recommendation 2003/361/CE of 6 May 2003 provides guidance on the SME definition. For
purposes of Article 501, and as set out in detail in paragraph 2, point b thereof, they are
required to use the definition set out in that Recommendation.
343 31
January 2014
Conditions for application of
the SME SF
When is the turnover recorded: (i) at inception of the loan or (ii) on an
ongoing basis? What level of documentation/proof is
required, if any?
Since the possible relief in capital requirements under Article 501 of the CRR is limited to exposures to SMEs, it needs to be ensured that this privilege is not extended
inappropriately. An institution therefore needs to have adequate current information
available on an ongoing basis and should be able to adequately demonstrate the fulfilment
of this requirement to its competent authorities.
416 31
January 2014
The meaning of the
‘amount owed to the
institution’
How should institutions understand the ‘amount owed to the institution’
under Article 501(2)(c) in case of off-balance-sheet exposures to customers that have not yet been
used: exposure value (as understood in Article 111) or the nominal value (e.g.
credit line)?
In the case of a line of credit, only the drawn amount needs to be considered when checking
if the EUR 1.5 million limit is complied with.
Provided that all conditions of Article 501(2) of the CRR are met, the exposure as a whole
(including its undrawn part) can qualify as an exposure to an SME.
414 28 March
2014
Conditions for the
application of the SME SF
Should an institution stop using the factor 0.7619 as soon as the amount owed
to the SME enterprise exceeds EUR 1.5 million?
The conditions specified in Article 501(2) should be met on an ongoing basis.
Accordingly, if or as soon as the total amount defined in Article 501(2)(c) exceeds (for a given
client or group of connected clients) EUR 1.5 million to the knowledge of the
institution, the institution should stop using the factor of 0.7619.
257 4 April 2014
Calculation of capital
Should the factor of 0.7619 apply to capital
Capital requirements for credit risk refers to the risk-weighted exposure amounts set out in

EBA REPORT ON SMES AND SME SUPPORTING FACTOR
115
Q&A Publication date Topic Question Response
requirements for SMEs
under Article 501 of
the CRR
requirements or to RWAs? Article 92(3)(a) of Regulation (EU) No 575/2013 (CRR). Institutions should therefore calculate risk-weighted exposure amounts for
their qualifying SME exposures and then multiply these by the factor specified in
Article 501(1) of the CRR (0.7619). The reduced amount of risk-weighted exposures should
then be used in the calculation in accordance with Article 92(3)(a) of the CRR.
417 28 May
2014
Conversion of the total
amount owed to the
institution from national
currency to EUR
Which exchange rate should the institution use
to convert the amount owed to the institution
(mentioned in Article 501 point 2), and what
measure should be used if that amount does not
exceed EUR 1.5 million? Should it be converted to euros each day with the exchange rate from that
day, or should the exchange rate be fixed, for
example, from the day when the product was
sold?
This is an ongoing condition.
Where an exposure is denominated in a currency other than the euro, an institution may calculate the euro equivalent using any appropriate set of exchange rates, updated with an appropriate frequency, provided its
choice has no obvious bias and the approach used to choose the appropriate set of
exchange rates is consistently applied (e.g. euro spot exchange rate published on the ECB
website).
2565 4 July 2014
Treatment of SME SF in the
case of secured
exposures
How should the SME SF be treated in relation to secured exposures: a)
including all collaterals (i.e. also for guarantees; b) only for those collaterals which cause no risk transfer; or c)
only for the non-secured part?
Pursuant to Article 501(2)(a) of the CRR, in order to meet the eligibility requirements, the
exposures shall always be included either in the ‘retail’ or in the ‘corporates’ or ‘secured by
mortgages on immovable property’ classes irrespective of whether credit risk mitigation
techniques with substitution effects (e.g. guarantees) are reclassified for reporting
purposes to another exposure class.
Note: More details on the questions and answers provided are available on the EBA website.

EBA REPORT ON SMES AND SME SUPPORTING FACTOR
116
Annex 4: Summary of responses from the consultation on the EBA discussion paper on SMEs and SME SF
The EBA received 32 responses to the consultation on the EBA discussion paper and call for evidence on SMEs and the SME SF. The responses mainly cover the banking sector, but also leasing, factoring and the pawnbroker industry. Seven out of the 32 responses were directly from corporations, while the majority came from banking industry representatives (e.g. associations).
Overall, respondents suggest that the analysis in the EBA paper should be more granular and should cover both large and small banks, both banks using the IRBA and banks using the SA, as well as not only euro area countries but all EU countries. The respondents ask for a nuanced interpretation of the lending trends and SME riskiness, but, at the same time, admit a lack of data on SMEs.
Application of the SME SF
Capital relief from the application of the SME SF
The majority of respondents are in favour of the SME SF. One respondent argued that the deviation of the EU from the Basel framework reflects the principal of ‘local calibration within a clear set of global standards’ and several respondents thought that the impact of the SME SF on capital requirements is significant, especially for smaller banks and cooperative banks, which are generally better capitalised.
Most respondents highlight that the capital relief from the application of the SME SF is tracked using the COREP templates, with one single case mentioned where capital savings are included in internal solvency reporting. In addition, one association mentioned that the cooperative banks it represents pay great attention to the capital absorption generated by their loans and hence conduct an ex ante evaluation of the RW attached to different types of loans possible (also considering the SME SF), while one bank conducts monthly procedures for classifying customers and the identification of entities subject to the SME SF.
On the use of capital relief to support SME lending, no respondents provided a clear answer to this question and no evidence was provided on the mechanism of how capital relief is translated into SME lending.
Majority of respondents wrote that the SME SF has positively influenced SME lending. Referring to cooperative banks, one respondent highlighted that banks almost exclusively lending to SMEs channel these funds again to SMEs—given suitable demand for loans. Two respondents

EBA REPORT ON SMES AND SME SUPPORTING FACTOR
117
acknowledged that it is not possible to demonstrate an increase in lending due to the SME SF, as it has only recently implemented the SME SF. Several respondents suggested that the SME SF allowed the supply of loans to households and SMEs to remain unchanged despite higher capital requirements, although no evidence was provided in this regard.
SME definition and harmonisation
Overall, banks seem fully aware of the definition of SMEs, although they do have a different definition applied internally. Only one respondent indicated that its internal definition broadly maps the EU definition applicable to the SME SF.
Many respondents highlighted issues related to the reconciliation of their definition with the definition used for the SME SF, including uncertainty about the definition, differences in the management of SME loans by different business units (which may lead to different definitions internally) and limited availability of public financial information on SMEs.
The majority of respondents favour a harmonisation of the SME definition. However, their views on the design of such a definition differ—e.g. whether it should be more granular, less complex or not change at all compared to the current definition. So far, they have been aware of the specific definition for the SME SF, but their internal SME definitions are different and sometimes not perfectly aligned.
Three respondents thought a harmonisation of the SME definition should not be pursued due to the complexity and heterogeneity of the SME sector, local criteria applied to SME definitions in different jurisdictions, and material burden on banks’ data collection.
The EUR 1.5 million threshold
Most respondents explained that the identification of the amount owed is IT assisted and exposures subject to the SME SF are identified in a central database. One respondent explained that they follow an approach similar to the large exposure regime. One respondent also highlighted the exchange rate as an obstacle to the identification of the amount owed.
SME riskiness
Cyclicality of SMEs
There is no unanimous view on whether SMEs are less or more risky and whether they are less or more cyclical than larger enterprises. Respondents provide manifold other aspects, which they (or their members) consider in the risk assessment of SMEs, and admit that the lack of information about SMEs is a caveat. Most respondents also suggest that the analysis of SME riskiness should account for differences in industry and geography. The majority of respondents agree that SMEs are a heterogeneous group of companies when it comes to access to credit.
On the assessment of consistency of riskiness with own funds requirements – To focus on unexpected loss

EBA REPORT ON SMES AND SME SUPPORTING FACTOR
118
With regard to the assessment of the consistency of own funds requirements for credit risk on SME exposures, respondents agree that the analysis should be focused on the unexpected loss, as it is the type of loss being addressed by capital regulation (in contrast to the expected loss) and confirm that the chosen design of the study for Germany and France is appropriate for that purpose. Some respondents provide additional evidence that asset correlations are lower for SMEs than for large corporates. According to the responses, past losses were adequately covered by loan loss provisions.
Impact of SME SF on lending
Support for SME SF despite the lack of evidence of its impact
The majority of respondents are in favour of the SME SF and attribute the increase in new SME lending to the SME SF, although no quantification of the direct link is shown. They mainly argue that the SME SF works via its impact on the pricing of SME loans, as it reduces the cost of capital for these loans. In turn, the respondents voice their opinion that the implementation of the SME SF led to better pricing for SME loans. However, they admit that many other supply and demand factors impact the pricing decision as well. Some respondents report no impact of the SME SF on SME lending, and say that it is not considered in pricing nor have their lending policies changed due to the implementation of the SME SF.
A significant number of respondents argue that the fact that the SME SF was introduced as a temporary measure only has hindered the SME SF from having a more benign impact on SME lending volumes and conditions. They pledge that this would have been different if the SME SF had been introduced as a permanent measure in the first place.
While most respondents have IT systems in place to measure the reduction in capital due to the application of the SME SF, they mainly refer to COREP reporting. Respondents do not provide evidence that this capital relief is explicitly channelled into SME lending.
Acknowledgement of confounding effects
The majority of respondents stress that there are many confounding factors that may have an impact on lending to SMEs, such as macroeconomic development, other supply- and demand-side factors and other regulation and banking supervision. It is therefore difficult to isolate the impact of the SME SF on SME lending, to calibrate it and to reach a final conclusion on its effect.
No evidence supporting the translation of the SF into changes in credit policies or pricing
The majority of respondents acknowledged that capital requirements do not have a major role in the decision lending process, pricing or asset allocation, and hence it was not translated in any changes in the credit policies of the institution. Several respondents highlighted that the SME credit policies remained unchanged specifically due to the SME SF. Several respondents mentioned that the SF reduced the pricing of loans through the reduction of cost of funding, but no examples or evidence was provided.

EBA REPORT ON SMES AND SME SUPPORTING FACTOR
119
Other issues
Delayed implementation of the SME SF
During the consultation, the issue of application was raised. Several respondents highlighted that the SME SF may have not been fully implemented if: (i) they have anyway enough capital to meet the regulatory requirements (without the SME SF), (ii) the SME segment is small in their portfolio and/or (iii) the costs of implementing the SME SF (IT, administrative) exceed its benefit. This delayed implementation is one argument brought by the respondents for keeping the SF and for having an assessment at a later stage.

EBA REPORT ON SMES AND SME SUPPORTING FACTOR
120
Annex 5: Technical background on the consistency of own funds requirements with lending trends
Data
The main database used in this study is the firm-level (microdata) version of the ECB’s and the Commission’s SAFE. The survey provides a harmonised and representative cross-country sample with access to financing information for both SMEs and large firms across the EU. It contains information on loan applications and respective bank lending decisions, therefore allowing us to identify the credit supply effects related to the introduction of the SME SF.109 This database also has information on firms’ structural characteristics (size, ownership, autonomy, age and industry) as well as on their perception of current developments regarding economic and financing conditions. It covers only non-financial firms and excludes firms in agriculture, public administration and financial services. Most firms are interviewed only once, but there is a small subsample of firms present in several waves of the survey. The SAFE is published every 6 months and has been conducted twelve times between the first half of 2009 and March 2015.
This study makes use of three different samples of the SAFE in order to minimise the impact of data constraints and ensure representativeness and robustness of the results:
Eurozone sample – This is the main sample, which covers SMEs and large firms in 11 euro area countries (Austria, Belgium, France, Finland, Germany, Greece, Ireland, Italy, the Netherlands, Portugal and Spain) and is available for all the survey waves;
Restricted Eurozone sample – This contains industry information for both SMEs and large firms in addition to all the variables covered in the first sample, but for only five euro area countries (France, Germany, Italy, the Netherlands and Spain);
EU sample – This covers the 28 EU countries but for only four waves, which correspond to the rounds conducted by the Commission.
The Eurozone and restricted Eurozone samples are further matched with country-level data from the ECB BLS.110 109 The usage of firm-level survey data such as the SAFE to directly identify credit supply is becoming more established in recent years—e.g. Popov and Udell (2012), Holton et al. (2014), Casey and O’Toole (2014), and Ferrando et al. (2015). In the absence of unusual natural experiments that create an identifiable supply shock (e.g. Khwaja and Mian, 2008), other identification strategies employed in the literature to distinguish between supply and demand include: (i) exploiting credit registry data on firms that have multiple lenders in order to control for demand effects (e.g. Jimenez et al., 2014); examining the substitution between bank loans and capital market instruments, such as corporate bonds (Becker and Ivashina, 2014) (although this strategy can only be applied to firms with access to public debt markets); and (iii) using a disequilibrium model to identify credit constrained firms (e.g. Carbo-Valverde et al., 2015). 110 The country-level aggregate answers are published by the respective national central banks. Over the period 2009Q1 to 2015Q1, we have quarterly data on diffusion indices for 10 euro area countries—compared with the SAFE Eurozone sample, the data is only not available for Finland due to strict confidentiality agreements with their participating banks.

EBA REPORT ON SMES AND SME SUPPORTING FACTOR
121
In our benchmark analysis, we use all the available waves from April 2011 to March 2015 (waves 5 to 12) in order to ensure comparability of the time covered by the three SAFE samples and of the length of pre- and post-SME SF periods.111 In order to exclude the period in which the SME SF was introduced, we also do not consider wave 9 for Spain and wave 10 for all the other EU countries.112 This yields a total of 16 850, 11 480 and 11 068 observations of firms that applied for bank financing in the Eurozone, restricted Eurozone and EU samples respectively.
Figure 55. Data sample based on the SAFE
Sample Geographical coverage Time (survey waves) Industry-
level data
Matching the BLS
data
Eurozone sample
11 euro area countries (Austria, Belgium, France, Finland, Germany, Greece,
Ireland, Italy, the Netherlands, Portugal and Spain)
Waves 5 to 12 (2011H1 to 2014H2)
Excluding wave 9 for Spain, and wave 10 for all other countries
NO YES
Restricted Eurozone
sample
5 euro area countries (France, Germany, Italy, the
Netherlands and Spain)
Waves 5 to 12 (2011H1, 2012H1, 2013H1, 2014H1)
Excluding wave 9 for Spain, and wave 10 for all other countries
YES YES
EU sample 28 EU countries
Waves 5, 7, 9 and 11 (2011H1, 2012H1, 2013H1, 2014H1)
Excluding wave 9 for Spain, and wave 10 for all other countries
NO NO
Identification strategy
The impact of the SME SF on SME access to bank finance is examined by employing a difference-in-differences methodology using two sources of identifying variation: the time before and after the policy change, and the cross-section of firms affected and not affected by the introduction of the SME SF. The treatment group therefore consists of micro, small and medium-sized enterprises (i.e. turnover below EUR 50 million), while the control group is formed of large firms.
The choice of the research design and control group (large firms) is justified by the fact that (i) it is not possible to know what would have happened to SME financing in the EU in case the SME SF was not introduced in the first place and (ii) the measure was introduced in all countries of the EU with no exception—i.e. there are no SMEs that were not treated. Nevertheless, it is important to note that threats to the internal validity of the difference-in-differences estimator cannot come from 111 This is consistent with, for instance, Ferrando et al. (2015) that use waves 1 to 6 of the SAFE to study the effect of the sovereign debt crisis on access to finance, and waves 4 to 10 to analyse the effect of the OMT announcement. Robustness tests nonetheless confirm that our results are not sensitive to the window choice. 112 The regulation came into force in January 2014 for all EU countries except Spain, which introduced the SME SF earlier in September 2013 through national legislation.

EBA REPORT ON SMES AND SME SUPPORTING FACTOR
122
either permanent differences in lending conditions between SMEs and large firms (e.g. SMEs are, on average, more credit constrained than large firms) or shared trends, as these are controlled for in the model.
Given that the outcome variables used throughout the analysis are binary, we estimate the following equation using a probit model:
𝑃𝑃𝑃𝑃�𝐶𝐶𝑃𝑃𝐶𝐶𝐶𝐶𝐶𝐶𝐶𝐶 𝐶𝐶𝐶𝐶𝐶𝐶𝐶𝐶𝐶𝐶𝑃𝑃𝐶𝐶𝐶𝐶𝐶𝐶𝐶𝐶𝐶𝐶𝑖𝑖𝑖𝑖𝑖𝑖 = 1� =
= Φ�β(𝑆𝑆𝑆𝑆𝑆𝑆𝑖𝑖𝑖𝑖 ∗ 𝑃𝑃𝐶𝐶𝐶𝐶𝐶𝐶𝑖𝑖� + 𝜆𝜆′𝑋𝑋𝑖𝑖𝑖𝑖𝑖𝑖 + 𝜑𝜑′𝑍𝑍𝑖𝑖𝑖𝑖 +𝜔𝜔𝑖𝑖 + 𝛿𝛿𝑖𝑖 + 𝜀𝜀𝑖𝑖𝑖𝑖𝑖𝑖 ] (1)
Here, the treatment effect of interest is given by coefficient β, which captures the change in financing conditions for SMEs relative to large firms from the pre- to the post-treatment period. A negative coefficient would imply that, ceteris paribus, access to finance better improved for SMEs than large firms after the introduction of the SME SF.
𝐶𝐶𝑃𝑃𝐶𝐶𝐶𝐶𝐶𝐶𝐶𝐶 𝐶𝐶𝐶𝐶𝐶𝐶𝐶𝐶𝐶𝐶𝑃𝑃𝐶𝐶𝐶𝐶𝐶𝐶𝐶𝐶𝐶𝐶𝑖𝑖𝑖𝑖𝑖𝑖 is a dummy equal to 1 if the firm’s application for a bank loan or credit line was denied or if the firm received less than 75% of the loan amount it requested, and 0 if the firm applied for bank financing and either got everything or more than 75% of the amount.
𝑆𝑆𝑆𝑆𝑆𝑆𝑖𝑖𝑖𝑖 is the treatment assignment variable equal to 1 if firm i, domiciled in country j, is an SME, and to 0 if it is a large firm.113 𝑃𝑃𝐶𝐶𝐶𝐶𝐶𝐶𝑖𝑖 is the post-treatment indicator that (i) equals to 1 between October 2013 and March 2015 (waves 10 to 12) and to 0 otherwise for Spain (as a result of the earlier implementation of the capital discount), as well as (ii) equals to 1 between April 2014 and March 2015 (waves 11 to 12) and to 0 otherwise for all the other countries considered. SMEij and Postt are are not included in the above specification on their own because the effect of the former is subsumed in the vector of firm-level controls Xijt (through the inclusion of firm turnover dummies), and the effect of the latter is subsumed in the time (wave) FE.
Zjt is an additional vector of time-varying country-level controls. ωt are time fixed effects to control for variation in access to finance common to all firms (global shocks)—e.g. effect of the OMT programme. δj are country fixed effects to eliminate any variation in credit access specific to a country. As in Ferrando et al. (2015), the model above is further extended to include industry, industry-country and/or industry-time fixed effects when using the restricted Eurozone sample for which there is industry information for both SMEs and large firms. Standard errors are clustered at the country level.
113 An SME is here defined in accordance with Article 501 of the CRR in which only the annual turnover should be taken into account—i.e. a turnover of less or equal than EUR 50 million.

EBA REPORT ON SMES AND SME SUPPORTING FACTOR
123
Results tables
Figure 56. Summary statistics
Eurozone sample Restricted Eurozone sample EU sample
AT, BE, DE, ES, FI, FR, GR, IE, IT, NL, PT DE, ES, FR, IT, NL AT, BE, BG, CY, CZ, DE, DK, EE, ES, FI, FR, GR, HR, HU,
IE, IT, LT, LU, LV, MT, NL, PL, PT, RO, SE, SI, SK, UK N Mean SD Min Max N Mean SD Min Max N Mean SD Min Max Access to finance Credit Constrained 16 850 0.196 0.397 0 1 11 480 0.195 0.396 0 1 11 068 0.175 0.380 0 1 Application Denied 16 850 0.089 0.284 0 1 11 480 0.087 0.283 0 1 11 068 0.084 0.277 0 1 Quantity Rationed 16 850 0.116 0.320 0 1 11 480 0.116 0.320 0 1 11 068 0.099 0.298 0 1 Firm characteristics Firm Type (Autonomous; Branch or Subsidiary) 16 850 0.889 0.314 0 1 11 480 0.893 0.310 0 1 11 068 0.883 0.322 0 1 Individual or Family Owned 16 850 0.788 0.408 0 1 11 480 0.794 0.405 0 1 11 068 0.755 0.430 0 1 Micro Firm: Turnover less than EUR 2 million 16 850 0.355 0.479 0 1 11 480 0.357 0.479 0 1 11 068 0.342 0.474 0 1 Small Firm: Turnover between EUR 2 and 10 million 16 850 0.198 0.398 0 1 11 480 0.192 0.394 0 1
11 068 0.205 0.403 0 1
Medium Firm: Turnover between EUR 10 and 50 million 16 850 0.199 0.400 0 1 11 480 0.201 0.401 0 1
11 068 0.217 0.412 0 1
Large Firm: Turnover more than EUR 50 million 16 850 0.248 0.432 0 1 11 480 0.249 0.433 0 1 11 068 0.237 0.425 0 1 Age: Less than 2 years 16 850 0.011 0.104 0 1 11 480 0.011 0.107 0 1 11 068 0.014 0.119 0 1 Age: 2 years or more but less than 5 years 16 850 0.047 0.211 0 1 11 480 0.047 0.212 0 1 11 068 0.055 0.229 0 1 Age: 5 years or more but less than 10 years 16 850 0.116 0.321 0 1 11 480 0.118 0.322 0 1 11 068 0.124 0.329 0 1 Age: 10 years or more 16 850 0.826 0.379 0 1 11 480 0.824 0.381 0 1 11 068 0.807 0.395 0 1 Firm Capital Improved 16 850 0.297 0.457 0 1 11 480 0.295 0.456 0 1 11 068 0.334 0.472 0 1 Firm Credit History Improved 16 850 0.285 0.451 0 1 11 480 0.287 0.452 0 1 11 068 0.304 0.460 0 1 Firm General Economic Outlook Improved 16 850 0.175 0.380 0 1 11 480 0.176 0.381 0 1 11 068 0.199 0.399 0 1 Firm Profit Increased 16 820 0.278 0.448 0 1 11 462 0.275 0.446 0 1 11 043 0.337 0.473 0 1 Firm Production Costs Decreased 16 837 0.131 0.338 0 1 11 475 0.125 0.331 0 1 11 052 0.125 0.331 0 1 Firm Financial Costs Decreased 16 546 0.237 0.425 0 1 11 311 0.238 0.426 0 1 10 780 0.217 0.412 0 1 Firm Debt to Assets Decreased 16 728 0.273 0.445 0 1 11 392 0.272 0.445 0 1 10 964 0.287 0.453 0 1 Country characteristics GDP Growth 16 850 0.030 1.751 -8.24 5.09 11 480 0.135 1.484 -3.14 3.37 11 068 1.017 1.723 -8.21 8.62 10-year Sovereign Bond Yield 16 850 3.217 2.723 0.50 24.55 11 480 2.855 1.691 0.50 6.30 11 035 3.233 1.978 1.17 16.05 Domestic Credit to GDP Gap 16 850 -4.602 11.87 -48.86 53.52 11 480 -5.243 11.34 -37.59 10.16 10 971 -5.74 12.50 -54.52 53.52 Unemployment Rate 16 850 11.52 6.529 4.33 27.74 11 480 11.44 6.512 4.84 26.04 11 068 10.18 5.124 4.33 27.74 CCB 16 850 0.079 0.270 0 1 11 480 0.088 0.283 0 1 11 068 0.087 0.282 0 1 Concentration – Herfindahl Index 16 850 0.063 0.049 0.027 0.370 11 480 0.054 0.035 0.03 0.21 11 068 0.067 0.047 0.03 0.37 Banks Perception of Risk (BLS) 16 151 6.063 11.74 -20 75 11 480 4.735 8.090 -10 31.25 7 117 2.589 11.01 -20 75
Note: This table presents the weighted summary statistics for all the variables used in this study. The weights restore the proportions of the economic weight of each size class, economic activity and country. N is the number of observations and SD the standard deviation.

EBA REPORT ON SMES AND SME SUPPORTING FACTOR
124
Figure 57. SME access to bank financing following the introduction of the SME SF
Panel A: Eurozone sample
Note: This table reports the marginal effects from probit regressions of model (1). All regressions use sampling weights that restore the proportions of the economic weight of each size class, economic activity and country. Standard errors robust to heteroscedasticity and clustered at the country-level are in parentheses. *, ** and *** designate that the test statistic is significant at the 10%, 5% and 1% levels.
Dependent Variable: Credit Constrained (1) (2) (3) (4) (5) (6) SME x Post-SF 0.028 0.024 0.029 0.026 0.031 0.025 (0.020) (0.022) (0.021) (0.023) (0.021) (0.023)
Firm Type (Autonomous; Branch or Subsidiary) 0.009 0.009 0.009 0.008 0.007 0.007 (0.017) (0.017) (0.017) (0.017) (0.017) (0.017)
Individual or Family-Owned 0.006 0.004 0.006 0.002 0.005 0.003 (0.011) (0.011) (0.011) (0.011) (0.010) (0.011)
Micro Firm: Turnover less than EUR 2 million 0.095*** 0.088*** 0.095*** 0.089*** 0.096*** 0.090*** (0.018) (0.015) (0.018) (0.015) (0.018) (0.016)
Small Firm: Turnover between EUR 2 and 10 million 0.049*** 0.045*** 0.049*** 0.045*** 0.049*** 0.046***
(0.015) (0.014) (0.015) (0.014) (0.016) (0.015) Medium Firm: Turnover between EUR 10 and 50 million 0.028** 0.025* 0.028** 0.026* 0.028** 0.026*
(0.012) (0.013) (0.012) (0.013) (0.012) (0.014) Age: 2 years or more but less than 5 years -0.031 -0.034 -0.030 -0.034 -0.024 -0.028
(0.025) (0.031) (0.024) (0.029) (0.022) (0.029) Age: 5 years or more but less than 10 years -0.053 -0.052 -0.053 -0.051 -0.046 -0.045 (0.037) (0.039) (0.037) (0.039) (0.036) (0.039) Age: 10 years or more -0.090*** -0.088*** -0.090*** -0.088*** -0.082*** -0.081*** (0.024) (0.027) (0.024) (0.026) (0.022) (0.026) Firm Capital Improved -0.013 -0.011 -0.013 -0.011 -0.014 -0.011 (0.009) (0.013) (0.009) (0.013) (0.009) (0.012) Firm Credit History Improved -0.034*** -0.029*** -0.034*** -0.029*** -0.032*** -0.027*** (0.007) (0.008) (0.008) (0.009) (0.008) (0.009) Firm General Economic Outlook Improved -0.077*** -0.076*** -0.076*** -0.077*** -0.075*** -0.077*** (0.012) (0.012) (0.013) (0.012) (0.012) (0.012) Firm Profit Increased 0.001 -0.001 -0.001 (0.010) (0.010) (0.010) Firm Production Costs Decreased 0.053*** 0.052*** 0.052*** (0.007) (0.007) (0.006) Firm Financial Costs Decreased -0.074*** -0.074*** -0.072*** (0.009) (0.010) (0.009) Firm Debt to Assets Decreased 0.021* 0.020* 0.021** (0.011) (0.011) (0.011) GDP growth 0.006 0.009 (0.005) (0.006) 10-year Sovereign Bond Yield 0.002 -0.007 (0.006) (0.005) Domestic Credit to GDP Gap 0.001** 0.000 (0.000) (0.000) Unemployment Rate 0.021*** (0.007) CCB -0.055* (0.030) Concentration – Herfindahl Index -1.546 (0.941) Banks Perception of Risk (BLS) 0.001** (0.001) Time FE Yes Yes Yes Yes No No Country FE Yes Yes Yes Yes No No Country-Time FE No No No No Yes Yes Observations 16 850 16 400 16 850 15 719 16 850 16 400 Pseudo R-squared 0.0921 0.0984 0.0922 0.0988 0.0976 0.104

EBA REPORT ON SMES AND SME SUPPORTING FACTOR
125
Panel B: Restricted Eurozone sample
Note: This table reports marginal effects from probit regressions of model (1). All regressions use sampling weights that restore the proportions of the economic weight of each size class, economic activity and country. Standard errors robust to heteroscedasticity and clustered at the country-level are in parentheses. *, ** and *** designate that the test statistic is significant at the 10%, 5% and 1% levels.
Dependent Variable: Credit Constrained (7) (8) (9) (10) (11) (12) SME x Post-SF 0.039 0.037 0.029 0.028 0.037 0.028 (0.030) (0.030) (0.030) (0.030) (0.031) (0.030)
Firm Type (Autonomous; Branch or Subsidiary) 0.001 0.000 0.001 0.000 -0.001 -0.001 (0.018) (0.018) (0.018) (0.018) (0.018) (0.018)
Individual or Family-Owned -0.000 -0.002 -0.003 -0.004 -0.005 -0.004 (0.013) (0.013) (0.013) (0.013) (0.013) (0.013)
Micro Firm: Turnover less than EUR 2 million 0.091*** 0.093*** 0.084*** 0.085*** 0.084*** 0.084*** (0.019) (0.019) (0.019) (0.019) (0.019) (0.019)
Small Firm: Turnover between EUR 2 and 10 million 0.044** 0.045** 0.041** 0.041** 0.040** 0.039**
(0.020) (0.020) (0.020) (0.019) (0.019) (0.019) Medium Firm: Turnover between EUR 10 and 50 million 0.026 0.029 0.024 0.026 0.024 0.023
(0.021) (0.021) (0.021) (0.020) (0.020) (0.020) Age: 2 years or more but less than 5 years -0.041 -0.041 -0.046 -0.045 -0.046 -0.041
(0.037) (0.037) (0.038) (0.038) (0.038) (0.038) Age: 5 years or more but less than 10 years -0.066* -0.066* -0.066* -0.066* -0.066* -0.061* (0.035) (0.035) (0.036) (0.036) (0.036) (0.036) Age: 10 years or more -0.102*** -0.100*** -0.100*** -0.098*** -0.098*** -0.094*** (0.034) (0.033) (0.035) (0.035) (0.035) (0.035) Firm Capital Improved -0.009 -0.009 -0.006 -0.006 -0.005 -0.006 (0.012) (0.011) (0.012) (0.012) (0.012) (0.012) Firm Credit History Improved -0.034*** -0.035*** -0.027** -0.028** -0.029** -0.027** (0.012) (0.011) (0.012) (0.012) (0.012) (0.012) Firm General Economic Outlook Improved -0.081*** -0.081*** -0.078*** -0.078*** -0.078*** -0.077*** (0.014) (0.014) (0.014) (0.014) (0.014) (0.014) Firm Profit Increased -0.004 -0.005 -0.004 -0.005 (0.013) (0.012) (0.012) (0.012) Firm Production Costs Decreased 0.053*** 0.051*** 0.051*** 0.052*** (0.013) (0.013) (0.013) (0.012) Firm Financial Costs Decreased -0.074*** -0.073*** -0.074*** -0.074*** (0.015) (0.015) (0.014) (0.015) Firm Debt to Assets Decreased 0.020* 0.021** 0.020* 0.021** (0.011) (0.011) (0.010) (0.010) GDP Growth 0.017* 0.017* 0.017 0.017 0.019* (0.009) (0.009) (0.011) (0.011) (0.011) 10-year Sovereign Bond Yield 0.032*** 0.032*** 0.002 0.003 0.004 (0.011) (0.011) (0.019) (0.018) (0.018) Domestic Credit to GDP Gap 0.000 0.000 0.003 0.002 0.001 (0.001) (0.001) (0.004) (0.004) (0.004) Unemployment Rate 0.028** 0.028*** 0.029*** (0.011) (0.011) (0.011) CCB -0.040 -0.045 -0.054 (0.044) (0.044) (0.044) Concentration – Herfindahl Index 2.635 1.526 0.161 (6.140) (6.068) (5.997) Banks Perception of Risk (BLS) 0.002 0.002* 0.003** (0.001) (0.001) (0.001) Time FE Yes Yes Yes Yes No No Country FE Yes No Yes No No No Country-Time FE No No No No No Yes Industry FE Yes No Yes No No No Country-Industry FE No Yes No Yes Yes Yes Time-Industry FE No No No No Yes No Observations 11 480 11 480 11 213 11 213 11 213 11 213 Pseudo R-squared 0.0922 0.0955 0.0992 0.102 0.106 0.105

EBA REPORT ON SMES AND SME SUPPORTING FACTOR
126
Panel C: EU sample
Dependent Variable: Credit Constrained (13) (14) (15) (16) (17) (18) SME x Post-SF 0.001 -0.003 0.000 -0.004 -0.004 -0.009 (0.028) (0.029) (0.028) (0.029) (0.029) (0.029)
Firm Type (Autonomous; Branch or Subsidiary) 0.006 0.004 0.004 0.001 0.005 0.002 (0.016) (0.016) (0.016) (0.016) (0.016) (0.016)
Individual or Family-Owned 0.009 0.007 0.008 0.005 0.010 0.006 (0.013) (0.013) (0.013) (0.014) (0.013) (0.013)
Micro Firm: Turnover less than EUR 2 million 0.115*** 0.108*** 0.118*** 0.112*** 0.117*** 0.111*** (0.016) (0.014) (0.016) (0.014) (0.016) (0.014)
Small Firm: Turnover between EUR 2 and 10 million 0.063*** 0.060*** 0.065*** 0.064*** 0.067*** 0.065***
(0.015) (0.014) (0.016) (0.015) (0.016) (0.015) Medium Firm: Turnover between EUR 10 and 50 million 0.043*** 0.042*** 0.044*** 0.045*** 0.046*** 0.046***
(0.012) (0.011) (0.012) (0.011) (0.011) (0.011) Age: 2 years or more but less than 5 years -0.014 -0.027 -0.017 -0.028 -0.005 -0.019
(0.041) (0.041) (0.041) (0.041) (0.040) (0.040) Age: 5 years or more but less than 10 years -0.067 -0.076 -0.068 -0.076 -0.058 -0.067 (0.048) (0.049) (0.048) (0.049) (0.047) (0.048) Age: 10 years or more -0.109*** -0.114*** -0.109*** -0.114*** -0.100*** -0.106*** (0.034) (0.035) (0.034) (0.035) (0.032) (0.034) Firm Capital Improved -0.021** -0.018** -0.021** -0.016** -0.020** -0.016** (0.009) (0.008) (0.009) (0.008) (0.009) (0.008) Firm Credit History Improved -0.038*** -0.033*** -0.038*** -0.033*** -0.036*** -0.031*** (0.007) (0.009) (0.007) (0.009) (0.007) (0.009) Firm General Economic Outlook Improved -0.050*** -0.052*** -0.052*** -0.054** -0.051*** -0.053*** (0.017) (0.019) (0.019) (0.021) (0.018) (0.021) Firm Profit Increased -0.007 -0.006 -0.007 (0.010) (0.010) (0.010) Firm Production Costs Decreased 0.053*** 0.053*** 0.052*** (0.009) (0.009) (0.009) Firm Financial Costs Decreased -0.067*** -0.067*** -0.068*** (0.012) (0.012) (0.012) Firm Debt to Assets Decreased 0.019** 0.019** 0.019** (0.009) (0.009) (0.009) GDP growth 0.006 0.008 (0.007) (0.006) 10-year Sovereign Bond Yield -0.005 -0.000 (0.012) (0.011) Domestic Credit to GDP Gap 0.001 0.001* (0.001) (0.001) Unemployment Rate 0.012** (0.005) CCB -0.008 (0.016) Time FE Yes Yes Yes Yes No No Country FE Yes Yes Yes Yes No No Country-Time FE No No No No Yes Yes Observations 11 068 10 662 10 938 10 544 11 049 10 640 Pseudo R-squared 0.0925 0.0981 0.0932 0.100 0.100 0.107
Note: This table reports marginal effects from probit regressions of model (1). All regressions use sampling weights that restore the proportions of the economic weight of each size class, economic activity and country. Standard errors robust to heteroscedasticity and clustered at the country-level are in parentheses. *, ** and *** designate that the test statistic is significant at the 10%, 5% and 1% levels.

EBA REPORT ON SMES AND SME SUPPORTING FACTOR
127
Figure 58. SME access to finance following the introduction of the SME SF – Components of credit constrained
Panel A: Dependent variable – Application denied
(1) (2) (3) (4) (5) (6)
Eurozone sample: SME x Post-SF 0.003 -0.001 0.004 0.000 0.005 0.001 (0.013) (0.013) (0.013) (0.013) (0.013) (0.012) [16 850] [16 400] [16 850] [15 719] [16 850] [16 400]
(7) (8) (9) (10) (11) (12)
Restricted Eurozone sample: SME x Post-SF 0.004 0.002 0.000 -0.002 0.002 -0.002 (0.021) (0.020) (0.021) (0.020) (0.020) (0.020)
[11 480] [11 480] [11 213] [11 213] [11 213] [11 213]
(13) (14) (15) (16) (17) (18)
EU sample: SME x Post-SF 0.010 0.006 0.009 0.005 0.009 0.004 (0.017) (0.016) (0.017) (0.016) (0.018) (0.017)
[11 068] [10 662] [10 938] [10 544] [11 049] [10 640]
Panel B: Dependent variable – Quantity rationed
(1) (2) (3) (4) (5) (6)
Eurozone sample: SME x Post-SF 0.024* 0.023 0.024* 0.024 0.024* 0.021 (0.014) (0.015) (0.014) (0.015) (0.015) (0.015) [16 850] [16 400] [16 850] [15 719] [16 850] [16 400]
(7) (8) (9) (10) (11) (12)
Restricted Eurozone sample: SME x Post-SF 0.032 0.033 0.027 0.028 0.033 0.027 (0.023) (0.023) (0.023) (0.023) (0.024) (0.023)
[11 480] [11 480] [11 213] [11 213] [11 213] [11 213]
(13) (14) (15) (16) (17) (18)
EU sample: SME x Post-SF -0.004 -0.005 -0.004 -0.006 -0.009 -0.011 (0.022) (0.022) (0.021) (0.021) (0.021) (0.021)
[11 068] [10 662] [10 938] [10 544] [11 040] [10 640]
Panel C: Dependent variable – Discouraged from applying
(1) (2) (3) (4) (5) (6)
Eurozone sample: SME x Post-SF 0.032 0.028 0.031 0.024 0.035 0.030 (0.023) (0.023) (0.025) (0.025) (0.026) (0.025) [20 021] [19 408] [20 021] [18 686] [20 021] [19 408]
(7) (8) (9) (10) (11) (12)
Restricted Eurozone sample: SME x Post-SF 0.034 0.033 0.028 0.029 0.038 0.030 (0.031) (0.030) (0.031) (0.030) (0.031) (0.030)
[13 129] [13 129] [12 788] [12 788] [12 788] [12 788]
(13) (14) (15) (16) (17) (18)
EU sample: SME x Post-SF 0.015 0.012 0.009 0.005 0.021 0.016 (0.019) (0.019) (0.020) (0.020) (0.021) (0.021)
[13 070] [12 520] [12 916] [12 383] [13 070] [12 520]
Note: This table reports marginal effects from probit regressions of model (1). The control variables and FE used in specifications (1) to (18) in each of the panels correspond to those of Table 2. All regressions use sampling weights that restore the proportions of the economic weight of each size class, economic activity and country. Standard errors robust to heteroscedasticity and clustered at the country level are in parentheses and the number of observations in square brackets. *, ** and *** designate that the test statistic is significant at the 10%, 5% and 1% levels.

EBA REPORT ON SMES AND SME SUPPORTING FACTOR
128
Figure 59. SME access to finance following the introduction of the SME SF – Firm size heterogeneity
Panel A: Micro vs large firms
Dependent variable: Credit constrained (1) (2) (3) (4) (5) (6)
Eurozone Sample: Micro-firm x Post-SF 0.031* 0.026 0.032* 0.027 0.034* 0.027 (0.018) (0.020) (0.018) (0.021) (0.020) (0.022) [8 550] [8 268] [8 550] [7 921] [8 550] [8 268]
(7) (8) (9) (10) (11) (12)
Restricted Eurozone sample: Micro-firm x Post-SF 0.043 0.042 0.031 0.030 0.048 0.033 (0.032) (0.032) (0.033) (0.032) (0.034) (0.032)
[5 768] [5 768] [5 606] [5 606] [5 606] [5 606]
(13) (14) (15) (16) (17) (18)
EU sample: Micro-firm x Post-SF -0.002 -0.007 -0.003 -0.010 -0.008 -0.015 (0.036) (0.037) (0.036) (0.037) (0.038) (0.039)
[5 562] [5 303] [5 498] [5 244] [5 535] [5 277]
Panel B: Small vs large firms
Dependent variable: Credit constrained (1) (2) (3) (4) (5) (6)
Eurozone Sample: Small firm x Post-SF 0.021 0.021 0.020 0.021 0.018 0.016 (0.017) (0.017) (0.016) (0.017) (0.016) (0.015) [6 347] [6 202] [6 347] [5 924] [6 347] [6 202]
(7) (8) (9) (10) (11) (12)
Restricted Eurozone sample: Small firm x Post-SF 0.024 0.020 0.020 0.017 0.023 0.014 (0.026) (0.025) (0.026) (0.025) (0.026) (0.025)
[4 300] [4 300] [4 217] [4 217] [4 217] [4 217]
(13) (14) (15) (16) (17) (18)
EU sample: Small firm x Post-SF 0.011 0.009 0.011 0.009 -0.001 -0.004 (0.022) (0.022) (0.022) (0.022) (0.020) (0.020)
[4 198] [4 082] [4 162] [4 051] [4 187] [4 071]
Panel C: Medium vs large firms
Dependent variable: Credit constrained (1) (2) (3) (4) (5) (6)
Eurozone sample: Medium firm x Post-SF 0.015 0.011 0.012 0.009 0.008 0.004 (0.023) (0.024) (0.023) (0.024) (0.020) (0.022) [5 039] [4 962] [5 039] [4 782] [5 020] [4 943]
(7) (8) (9) (10) (11) (12)
Restricted Eurozone sample: Medium firm x Post-SF 0.014 0.013 0.007 0.007 0.014 0.003 (0.027) (0.026) (0.026) (0.026) (0.026) (0.025)
[3 766] [3 766] [3 714] [3 714] [3 714] [3 714]
(13) (14) (15) (16) (17) (18)
EU sample: Medium firm x Post-SF -0.009 -0.012 -0.011 -0.015 -0.014 -0.018 (0.019) (0.022) (0.020) (0.022) (0.019) (0.021)
[3 270] [3 197] [3 230] [3 159] [3 182] [3 112]
Note: This table reports marginal effects from probit regressions of model (1). The control variables and FE used in specifications (1) to (18) in each of the panels correspond to those of Table 2. All regressions use sampling weights that restore the proportions of the economic weight of each size class, economic activity and country. Standard errors robust to heteroscedasticity and clustered at the country-level are in parentheses and the number of observations in square brackets. *, ** and *** designate that the test statistic is significant at the 10%, 5% and 1% levels.

EBA REPORT ON SMES AND SME SUPPORTING FACTOR
129
Figure 60. SME access to finance following the introduction of the SME SF – Countries affected more severely vs less severely by the crisis
Panel A: Dependent variable – Application denied (1) (2) (3) (4) (5) (6)
More Affected Countries: SME x Post-SF -0.025 -0.034 -0.026 -0.035 -0.027 -0.036 (0.037) (0.037) (0.037) (0.037) (0.037) (0.037) [8 544] [8 350] [8 544] [8 350] [8 544] [8 350]
(1) (2) (3) (4) (5) (6)
Less Affected Countries: SME x Post-SF 0.021 0.019 0.022 0.020 0.019 0.018 (0.020) (0.020) (0.020) (0.020) (0.019) (0.018)
[8 306] [8 050] [8 306] [7 369] [8 306] [8 050]
Panel B: Dependent variable – Quantity rationed
(1) (2) (3) (4) (5) (6)
More Affected Countries: SME x Post-SF 0.023 0.016 0.024 0.016 0.023 0.015 (0.039) (0.039) (0.039) (0.039) (0.039) (0.039) [8 544] [8 350] [8 544] [8 350] [8 544] [8 350]
(1) (2) (3) (4) (5) (6)
Less Affected Countries: SME x Post-SF 0.025 0.023 0.026 0.027 0.025 0.023 (0.022) (0.022) (0.022) (0.023) (0.022) (0.022)
[8 306] [8 050] [8 306] [7 369] [8 306] [8 050]
Panel C: Dependent variable – Credit constrained
(1) (2) (3) (4) (5) (6)
More Affected Countries: SME x Post-SF 0.003 -0.011 0.004 -0.012 0.000 -0.014 (0.047) (0.048) (0.047) (0.048) (0.047) (0.048) [8 544] [8 350] [8 544] [8 350] [8 544] [8 350]
(1) (2) (3) (4) (5) (6)
Less Affected Countries: SME x Post-SF 0.047 0.043 0.049 0.050 0.048 0.044 (0.030) (0.031) (0.031) (0.032) (0.030) (0.030)
[8 306] [8 050] [8 306] [7 369] [8 306] [8 050]
Note: This table reports marginal effects from probit regressions of model (1) when using the Eurozone sample. Greece, Ireland, Italy, Portugal and Spain are defined as countries more severely affected by the crisis, and Austria, Belgium, Finland, France, Germany and the Netherlands as countries less severely affected by the crisis. The control variables and FE used in specifications (1) to (6) in each of the panels correspond to those of Table 2. All regressions use sampling weights that restore the proportions of the economic weight of each size class, economic activity and country. Standard errors robust to heteroscedasticity are in parentheses and the number of observations in square brackets. *, ** and *** designate that the test statistic is significant at the 10%, 5% and 1% levels.

EBA REPORT ON SMES AND SME SUPPORTING FACTOR
130
Annex 6: Spanish study to assess the impact of SME SF
The 2013 Law in Support of Entrepreneurs introduced in Spanish legislation anticipated, by 3 months, the entry into force of the European capital regulations related to the treatment of capital requirements for SMEs, by reducing capital requirements for new and existing loans, excluding unpaid positions, to all SMEs by 25%. To analyse whether SMEs were the type of firms who benefited most from the freeing up of funds that regulatory changes entailed, a model that compares the change in the credit committed to a SME in the financial system before and after September 2013 to that granted to a large corporation was developed. The results of this analysis were presented in the Bank of Spain Financial Stability Report 05/2014.
The exercise takes into account both observable and non-observable characteristics of the firms and non-observable characteristics of the bank that may influence the credit obtained by the firm. The regression also includes controls for macroeconomic variables. Foreseeably, before the entry into force of the regulatory change, being classified as an SME or not (i.e. being a corporate) implied no differential effect.
Two approaches were used:
Local approach considers exclusively the relation between each firm and the bank that usually provides it with financing. It tests whether, following the regulatory change, banks are granting more credit to their habitual customers. Firms with defaults have been stripped out of the statistical exercise, as the rebate on capital requirements is not applicable to them. Furthermore, to avoid potential distortions owing to the particular behaviour of the construction and real estate development sector, these firms are also excluded from the study. The estimated model is the following:
∆Ln�Commitmentijt� = α + βSMEij + Firm Controlsi + disp + ηj + εijt,
Here, Commitmentijt is the total committed credit by bank j to firm i from 2011Q4 to period t. SMEij is a dummy variable that takes the value of 1 if the company i is considered a SME to bank j and 0 otherwise. disp is a set of sector and province dummies. Firm Controlsi includes a set of firm characteristics large enough to avoid possible biases (leverage ratio, liquidity ratio, return on assets, past defaults, …). ηj are bank FE; and εijt is the error term. All firm variables referred to the end of 2011.
Aggregate approach analyses the change in the total volume of bank credit obtained by a firm. This approach tests whether SMEs obtain more loans from their habitual bank or from others. The proposed model is the following:
∆𝐿𝐿𝐶𝐶(𝐶𝐶𝐶𝐶𝐶𝐶𝐶𝐶𝐶𝐶𝐶𝐶𝐶𝐶𝐶𝐶𝐶𝐶𝐶𝐶𝑖𝑖𝑖𝑖) = 𝛼𝛼 + 𝛽𝛽𝑆𝑆𝑆𝑆𝑆𝑆𝑖𝑖 + 𝐹𝐹𝐶𝐶𝑃𝑃𝐶𝐶 𝐶𝐶𝐶𝐶𝐶𝐶𝐶𝐶𝑃𝑃𝐶𝐶𝐶𝐶𝐶𝐶𝑖𝑖 + 𝐶𝐶𝑖𝑖𝑖𝑖𝑖𝑖 + 𝜂𝜂𝑖𝑖𝑖𝑖 + 𝜀𝜀𝑖𝑖𝑖𝑖 ,

EBA REPORT ON SMES AND SME SUPPORTING FACTOR
131
Here, Commitmentiit is the total committed credit of firm i from 2011Q4 to period t. SMEi is a dummy variable that takes the value of 1 if the company i fits with the definition of SME under the new regulatory regime and 0 otherwise. disp is a set of sector and province dummies. Firm Controlsi includes the same set of firm characteristics as the local model. ηij are lead bank FE. εit is the error term.
The results presented in Figure 61 below should be interpreted with all due caution because it is not possible to identify exactly which SMEs benefited from the support measure, so the analysis is based exclusively on whether a firm can be classified as SME.
Commencing with the first (local) approach, Panel A shows the relative growth of credit to SMEs, compared to large corporations, for the different periods analysed. It can be seen how this coefficient is statistically significant as from third quarter of 2013, and reaches a value of 5.8% at the end of that year. Using the aggregate approach, Panel B shows that the relative growth of credit for SMEs vs other corporates shifts from not being statistically significant before the reform to being so after it. Moreover, the discrete estimation of this parameter in December stands at 7.9%, higher than that found under the local approach. This suggests that banks other than those that were already working with any specific SME (financing this firm) have begun to grant new credit, apart from the fact that SMEs are drawing down more credit from their traditional banks, as shown by the analysis at the local level.
Accordingly, and bearing in mind the limitations proper to this type of analysis, the results suggest that after third quarter of 2013, when regulatory changes took place, credit to SMEs compared to large corporations continued to grow (albeit at a markedly slower pace than in the period from fourth quarter of 2012 to third quarter of 2013). These results do not differ significantly if listed companies, which may have obtained financing through channels other than banks, are excluded from large corporations.
Figure 61. Relative growth of SMEs credit vs large firms
A: Local focus estimated effect B: Global focus estimated effect
Note: The dashed lines denote the confidence interval. Source: Bank of Spain (2014), Analysis of the impact on lending of the new capital requirements and the change in the definition of SMEs, Bank of Spain Financial Stability Report 05/2014.
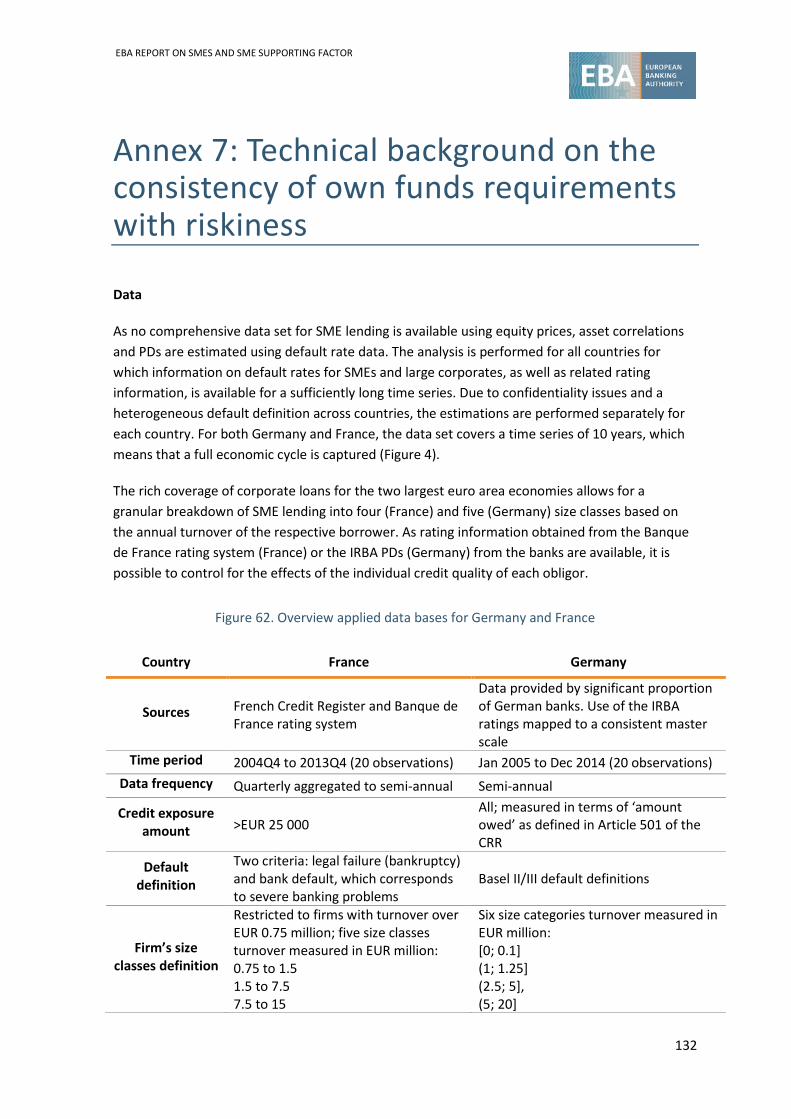
EBA REPORT ON SMES AND SME SUPPORTING FACTOR
132
Annex 7: Technical background on the consistency of own funds requirements with riskiness
Data
As no comprehensive data set for SME lending is available using equity prices, asset correlations and PDs are estimated using default rate data. The analysis is performed for all countries for which information on default rates for SMEs and large corporates, as well as related rating information, is available for a sufficiently long time series. Due to confidentiality issues and a heterogeneous default definition across countries, the estimations are performed separately for each country. For both Germany and France, the data set covers a time series of 10 years, which means that a full economic cycle is captured (Figure 4).
The rich coverage of corporate loans for the two largest euro area economies allows for a granular breakdown of SME lending into four (France) and five (Germany) size classes based on the annual turnover of the respective borrower. As rating information obtained from the Banque de France rating system (France) or the IRBA PDs (Germany) from the banks are available, it is possible to control for the effects of the individual credit quality of each obligor.
Figure 62. Overview applied data bases for Germany and France
Country France Germany
Sources French Credit Register and Banque de France rating system
Data provided by significant proportion of German banks. Use of the IRBA ratings mapped to a consistent master scale
Time period 2004Q4 to 2013Q4 (20 observations) Jan 2005 to Dec 2014 (20 observations) Data frequency Quarterly aggregated to semi-annual Semi-annual
Credit exposure amount >EUR 25 000
All; measured in terms of ‘amount owed’ as defined in Article 501 of the CRR
Default definition
Two criteria: legal failure (bankruptcy) and bank default, which corresponds to severe banking problems
Basel II/III default definitions
Firm’s size classes definition
Restricted to firms with turnover over EUR 0.75 million; five size classes turnover measured in EUR million: 0.75 to 1.5 1.5 to 7.5 7.5 to 15
Six size categories turnover measured in EUR million: [0; 0.1] (1; 1.25] (2.5; 5], (5; 20]

EBA REPORT ON SMES AND SME SUPPORTING FACTOR
133
Country France Germany
15 to 50 And over 50
(20; 5] And over 50
Number of rating grades 4, from 10 in the master scale 5, from 6 in the master scale
Estimation methodologies114
The asymptotic credit risk framework
The ASRF model belongs to the class of structural credit risk models devised by Merton (1974). In this approach, losses at the portfolio level can be defined as the sum of individual losses on defaulting loans in the portfolio, adjusted for the severity of individual losses; in other words, portfolio-level losses may be regarded as the sum of the losses given default for each individual
loan in the portfolio that goes unpaid. Thus, if ui is defined as the LGD of an obligor i and if is
defined as the default indicator variable of obligor i, then the total portfolio losses L may be defined as follows:
In structural credit risk models, default occurs if the value of an obligor’s assets is smaller than the value of the obligor’s debt that is due. Because asset and debt values may be difficult to observe, this framework has been extended by generalising the modelling of default as the crossing of an unobservable threshold.
Thus, default is triggered in this model if the ability-to-pay process 𝑌𝑌𝑖𝑖 of firm i falls below an exogenous default threshold𝛾𝛾𝑖𝑖. 𝑌𝑌𝑖𝑖 follows a standard normal distribution. It can be decomposed into the return of a systematic and unobservable factor X and an idiosyncratic firm-specific part 𝜀𝜀𝑖𝑖 :
𝑌𝑌𝑖𝑖 = �𝜌𝜌𝑖𝑖 𝑋𝑋 + �1 − 𝜌𝜌𝑖𝑖 𝜀𝜀𝑖𝑖
X and 𝜀𝜀𝑖𝑖 are independent for every obligor i and follow a Gaussian distribution. The factor loading
�𝜌𝜌𝑖𝑖 of the systematic risk factor can be interpreted either as the sensitivity against systematic risk or as the square root of the asset correlation 𝜌𝜌𝑖𝑖. For this analysis, the common assumption of a constant 𝜌𝜌𝑖𝑖 is applied. The Bernoulli variable 𝐿𝐿𝑖𝑖 describes if a credit event has occurred during the considered horizon (𝐿𝐿𝑖𝑖 = 1) or not (𝐿𝐿𝑖𝑖 = 0). It is important to differentiate between the unconditional and the conditional default probability. The unconditional default probability of obligor i for the time period t is defined as follows:
𝑃𝑃(𝐿𝐿𝑖𝑖 = 1) = 𝑃𝑃(𝑌𝑌𝑖𝑖 < 𝛾𝛾𝑖𝑖) = 𝛷𝛷(𝛾𝛾𝑖𝑖)
114 More details can be found in Dietsch et al. (2015).
iD1
∑=
=n
iDi i
uL1
1

EBA REPORT ON SMES AND SME SUPPORTING FACTOR
134
Here, 𝛷𝛷 denotes the cumulative distribution function of a standard normal distribution.
The implementation of the single model requires one to specify the dependence structure of the risk factor and to estimate the default thresholds and factor sensitivities. When using a random
effect specification of the risk factor, there is a correspondence between the conditional default probability and econometric approach grounding on GLMMs.
Econometric estimation of the portfolio’s credit risk parameters
Thus, to estimate default thresholds and risk factor sensitivities, we use a model that belongs to the class of GLMMs. This model combines fixed and random effects for observable and (latent) unobservable factors. Detailed presentations of GLMMs in credit risk modelling can be found in Frey and McNeil (2003) and McNeil and Wendin (2007).
If, in a general case, Y is defined as the (N × 1) vector of observed default data and if 𝛾𝛾 is defined as the (K × 1) vector of random effects, then the conditional expected default probability of obligor i may be expressed as follows:
𝑆𝑆[𝑌𝑌𝑖𝑖 = 1|𝛾𝛾] = 𝑔𝑔(𝑋𝑋𝑖𝑖𝛽𝛽 + 𝑍𝑍𝛾𝛾)
Here, g(·) is a differentiable monotonic link function, Yi is the default indicator variable for obligor i (Yi takes a value of 1 if there is a default, and equals 0 otherwise), X is a (N×P) matrix that contains the (observed) FE, and Z is the (N × K) design matrix for the random effects. In case of a single factor specification, K is equal to 1.
In the following application, we will consider the effect of a single random general factor and we will focus on the probit link function, as the normal distribution is the underlying link function that is assumed by the Basel II framework of credit risk; thus, g(x) = 𝛷𝛷 (x). The random effect is assumed to follow a standard normal distribution. In the equation above, β is the vector of parameters that is associated with FE. Considering a portfolio of N obligors who are categorised into r = 1, …, R (non-default) rating classes and given a vector 𝛾𝛾𝑖𝑖 of random effects, the conditional default probability of borrower i at time t may be expressed as follows:
𝑃𝑃(𝑌𝑌𝑖𝑖𝑖𝑖 = 1|𝛾𝛾𝑖𝑖) = 𝛷𝛷(𝑥𝑥𝑖𝑖𝑖𝑖′ 𝜇𝜇𝑟𝑟 + 𝑧𝑧′𝛾𝛾𝑖𝑖)
Here, µr denotes the vector of parameters from the fixed effect of the borrower’s rating class. If the rating scale is properly built, we expect these thresholds to be ordered and to increase as
credit quality decreases. In the above equation, is a (1 × R) vector of dummies
that defines the rating of borrower i during time period t. Because we assume that borrowers in a given size class are interchangeable, the estimation of this vector does not involve individual borrowers but instead uses the periodical default rates within segments. This approach leads to an assumption of borrower homogeneity for each credit rating that is examined.
In this application, we restrict the model to one random factor and one fixed factor (the firm’s rating). We assume that the general risk factor (the risk factor of the single factor model)
[ ]0,...1,...,0' =tix

EBA REPORT ON SMES AND SME SUPPORTING FACTOR
135
represents the impact on default rates of variations in general economic conditions. In this specification, the linear predictor in the regression contains an intercept term that randomly varies at the year level, the highest level in the modelling, where all other effects are nested in. In other words, a random intercept is drawn separately and independently for each year. This structure implies that a given obligor is only affected by the factor representative of general economic conditions.
Estimation results
Figure 63. GLMM single factor estimates for asset correlations subject (in per cent)
France Turnover
in EUR million
Retail Corporate
0.75-1.5 1.5-5 5-15 15-50 > 50
Estimates st. errors
0.56 (0.15)
00.59 (0.15)
0.62 (0.18)
0.69 (0.22)
1.36 (0.54)
Germany
Turnover in
EUR million
Retail Corporate
0-1 1-2.5 2.5-5 5-20 20-50 > 50
Estimates st. errors
0.57 (0.19)
0.57 (0.19)
0.51 (0.18)
0.80 (0.28)
0.92 (0.36)
1.84 (0.67)
Figure 64. ML estimates for asset correlations subject (in per cent)
France Turnover
in EUR million Retail Corporate
0.75-1.5 1.5-5 5-15 15-50 > 50
Low risk 1 p-value
1.41 (0.00)
1.22 (0.00)
0.69 (0.08)
0.57 (0.22)
3.16 (0.17)
2 p-value
0.72 (0.00)
0.70 (0.00)
0.80 (0.02)
0.64 (0.10)
1.99 (0.15)
3 p-value
0.61 (0.00)
0.60 (0.00)
1.59 (0.01)
1.18 (0.02)
6.26 (0.03)
High risk 4 p-value
0.79 (0.00)
0.94 (0.00)
0.71 (0.01)
0.94 (0.01)
3.02 (0.01)

EBA REPORT ON SMES AND SME SUPPORTING FACTOR
136
Germany
Turnover in EUR million
Retail Corporate 0-1 1-2.5 2.5-5 5-50 > 50
Low risk I-III p-value
0.85 (0.01)
0.68 (0.01)
0.75 (0.03)
0.61 (0.02)
1.79 (0.02)
IV p-value
0.58 (0.01)
0.74 (0.02)
0.52 (0.06)
0.53 (0.03)
2.10 (0.04)
High risk V-VI p-value
0.47 (0.01)
0.42 (0.01)
0.42 (0.02)
0.85 (0.01)
1.93 (0.02)
Figure 65. GLMM multi-factor covariance matrices estimates (in per cent)
France Var-Cov-Matrix for turnover
buckets (in EUR millions) 0.75-1.5 1.5-5 5-15 15-50 > 50
0.75-1.5 2.2% 2.4% 0.8% -0.9% -3.3%
1.5-5 2.4% 2.7% 1.0% -1.1% -3.9%
5-15 0.8% 1.0% 0.7% 0.4% -0.3%
15-50 -0.9% -1.1% 0.4% 2.1% 4.4%
>50 -3.3% -3.9% -0.3% 4.4% 10.3%
Germany
Var-Cov-Matrix for turnover buckets (in EUR millions) 0-1 1-2.5 2.5-5 5-20 20-50 > 50
0 -1 0.6% 0.4% 0.4% 0.4% 0.2% 0.5%
1-2.5 0.4% 1.0% 0.5% 0.5% 0.6% 0.7%
2.5-5 0.4% 0.5% 0.5% 0.6% 0.5% 0.7%
5-20 0.4% 0.5% 0.6% 0.7% 0.8% 1.0%
20-50 0.2% 0.6% 0.5% 0.8% 1.0% 1.2%
> 50 0.5% 0.7% 0.7% 1.0% 1.2% 1.7%

EBA REPORT ON SMES AND SME SUPPORTING FACTOR
137
Figure 66. Asset correlation with respect to exposure (in per cent)
France Obligo in
EUR million
< 0.1 0.1-0.25 0.25-0.5 0.5-1 1-1.5 1.5-2 2-2.5 > 2.5
Estimates 0.82 0.80 0.68 0.51 0.85 0.58 0.47 0.93 st. Errors 0.31 0.21 0.18 0.14 0.23 0.18 0.17 0.25
Germany
Obligo in EUR
million 0-0.05 0.05-0.1 0.1-0.25 0.25-0.5 0.5-1 1-1.5 1.5-2.5 > 2.5
Estimates 0.55 0.56 0.61 0.51 0.56 0.50 0.58 0.76 st. errors 0.22 0.23 0.24 0.20 0.23 0.26 0.31 0.40

EUROPEAN BANKING AUTHORITY
Floor 46 One Canada Square, London E14 5AA
Tel. +44 (0)207 382 1776 Fax: +44 (0)207 382 1771 E-mail: [email protected]
http://www.eba.europa.eu