e · the prediction of middle distillate fuel properties using liquid chromatography-proton nuclear...
TRANSCRIPT
7 technical
e.portUnited States ArmyBDcvoir Research, Development & Engineering ContorFort Belvoir, Virginia 22060-5606
. ,Report 2478
, ,The Predction of Middle Distillate Fueli, w Properties Using
Liquid Chromatography-ProtonNuclear Magnetic ResonanceSpectroscopy Data
Authored By: Dr. Madeline Swann
Report Date: June 1989
Distribution unlimited; approved for public release.
UNCLASSIFIEDSECURITY CLASSIFICATION OF THIS PAGE
REPORT DOCUMENTATION PAGE Form Approved
OMB No. 0704-0188Ia. REPORT SECURITY CLASSIFICATION lb. RESTRICTIVE MARKINGS
Unclassified None
2a. SECURITY CLASSIFICATION AUTHORITY 3. DISTRIBUTION/AVAILABILITY OF REPORTDistribution unlimited; approved for public release.
2b. DECLASSIFICATION/DOWNGRADING SCHEDULE
4. PERFORMING ORGANIZATION REPORT NUMBER(S) 5. MONITORING ORGANIZATION REPORT NUMBER(S)
6a. NAME OF PERFORMING ORGANIZATION 6b. OFFICE SYMBOL 7a. NAME OF MONITORING ORGANIZATIONBelvoir RD& E Center (f applicable)Fuels & Lubricants Division STRBE-VF6c. ADDRESS (City, State, and ZIP Code) 7b. ADDRESS (Ciy, State, and ZIP Code)
Fort Belvoir, VA 22060-5606
8a. NAME OF FUNDING/SPONSORING 8b. OFFICE SYMBOL 9. PROCUREMENT INSTRUMENT IDENTIFICATION NUMBERORGANIZATION (If applicable)
Sc. ADDRESS (City, State, andZIP Code) 10 SOURCE OF FUNDING NUMBERS
PROGRAM PROJECT TASK WORK UNITELEMENT NO. NO. NO. ACCESSION NO.
_ 627.33 AH20VM11. TITLE (Include Security Classification)The Prediction of Middle Distillate Fuel Properties Using Liquid Chromatography-Proton Nuclear Magnetic Resonance Spectrascopy Data (U)12. PERSONAL AUTHOR(S)
Dr. Madeline Swanm13a. TYPE OF REPORT 13b. TIME COVERED 14. DATE OF REPORT (Year, Month, Day) 15. PAGE COUNT
Final FROM 1987 TO .J.l . June 1989 6016. SUPPLEMENTARY NOTATION
17, OSATI CODES 18. SUBJECT TERMS (Continue on reverse if necessary and idenify by block number)FIELD GROUP SUB-GROUP Middle distillate fuels, liquid chromatography. Proton nuclear magnetic, ASTM test methods,
resonmce spectrascopy, Physical properties, chemical properties, Average molecular composition
19.IABSTRCT (Continue on reverse if necessary and identify by block number)
The research was initiated to support the Army's capability to identify the components of fuels which contribute to lowtemperature performance of fuels. Once the research had begun, was discovered that various physical properties of middledistillate fuels can be predicted. The LC-4- NMR technique waideveloped to prpdict physical properties based on chemicalsuctu present in the fuels. The prediction of properties is approached from a-roup property/'point of view. In the groupproperty approach, the structure of the molecule is examined for structural features which dicate the physical properties of thecompounds. In other words, the physical properties of a molecule or compound are determined by the number of types ofchemical groups, i.e., methyl, methylene, methine, etc., present. These LC-I.H NMR predicted property measurements werecompared to measurements obtained by the ASTM fuel tests. Most measurements were found to be within experimental error,
(Continued)
20. DISTRIBUTION/AVAILABILITY OF ABSTRACT 21. ABSTRACT SECURITY CLASSIFICATION['UNCLASSIFED/UNUMITED [f] SAME AS REPORT[:] DTIC USERS Unclassified
22aL NAME OF RESPONSIBLE INDIVIDUAL 22b. TELEPHONE (Include Area Code) 22c. Office SymbolHerbert K. Pollehn 703-664-3576 STRBE-VF
DD Form 1473, JUN 86 Previous editions are obsolete. SECURITY CLASSIFICATION OF THIS PAGEUNCLASSIFIEDi

'heresearch has demonstrated that the LC- IJ-I NMR approach for measuring various middle distillate fuel propertiescan be used as an alternative to the ASTM methods of fuel property measurement It has been shown that it is possibleto predict 17 physical properties with most of the predicted properties within the ;xperimental error of the measurementsobtained by the ASTM fuel tests. In addition, the LC-IH NMR approach offers other advantages over the ASTM testmethods. From this research, it can be seen that many physical properties can be determined in approximately 1 to 2hours with approximately 3 to 5 milliliters of sample fuel. To determine the same properties by ASTM test methods, itwould take approximately 50 hours and approximately " to 3 liters of fuel.
jJ
':!,.
ii
TABLE OF CONTENTS
Page
SECTION I BACKGROUND .................................................................. 1
SECTION II INTRODUCTION ................................ . ............................ 4
SECTION III RESULTS AND DISCUSSION ........................................... 6Computer Modeling of Pure Compounds ............................... 6LC-1H NMR Data Collection of Diesel Fuel Samples .......... 9
SECTION IV EXPERIMENTAL ......................... 15Equipm ent ............................................................................... 15Procedures .............................................................................. 16
SECTION V CONCLUSIONS ................ .....--............................. 18
REFERENCES ...... .. . ....... ... ....... . ............... ........... ............. ............... ... . .. 21
APPENDIX A LIST OF ILLUSTRATIONS .......................................... A-1
APPENDIX B EXAMPLE OF DATA COLLECTED FOR
EACH FUEL SAMPLE .................................................... B-1
TABLES
1 Correlation Coefficients of Predicted vs. Observed Values forCetane Number and Density of Compound or Chemical Class .............. 8
2 Correlation Coefficients of Physical Properties of Pure Compouds.......... 9
3 Summary of Fuel Physical Property Predictions ...................... 11
4 Comparison of ASTM Quoted Errors and LC- 1H NMR MethodStandard Deviation of Residuals ........................................................... 12
I!

EXECUTIVE SUMMARY
The research was initiated to support the Army's capability to identify the components of fuelswhich contribute to low temperature performance of fuels. It has been observed in the field that thequality of fuels can have serious consequences on the Department of Defense (DOD) mission bydegrading vehicles, equipment, and weapons components. It is mandatory that all factorsinfluencing operability be understood because it is essential that DOD's mission not be undulyinfluenced by short-term fluctuations in petroleum supplies.
Although this research was initiated because of cold weather operability problems in vehicles andequipment, it was discovered that various physical properties of middle distillate fuels, including thecloud point, can be predicted. The liquid chromatography-proton nuclear magnetic resonancespectrascopy (LC-IH NMR) technique developed can predict the following physical properties:cetane number (ASTM D613), cetane index (ASTM D976), density (ASTM D1298), specificgravity (ASTM D1298), pour point (ASTM D97), flash point (ASTM D93), viscosity(ASTM D445), filterability (ASTM D4539), heat of combustion (ASTM D240), cloud point(ASTM D2500), volume percent aromatics (ASTM D1319), residual carbon content (ASTM D524),and initial, 10%, 50%, 90%, and end boiling points (ASTM D86). It was also discovered that thistechnique provides chemical insight concerning the influence of chemical changes on the physicalproperties of the fuel. This led to expansion of the initial research goal. Therefore, the revised goalwas to develop a simple analytical technique which can be used to rapidly predict various physicalproperties of fuels.
The LC-IH NMR technique is now being developed to predict various physical properties of middledistillate fuels based on a single analytical technique. This methodology determines the averagemolecular composition data of the monocyclic and dicyclic aromatic, fluorene, and phenanthrenefractions. It also determines the fraction of total carbon for the alkane fraction. Finally, itdetermines, where applicable, the fraction of total carbon for the tricyclic or aromatic fraction. Theon-line LC-IH NMR data is also analyzed to give the following results: the molar quantities of eachtype of hydrogen and carbon present in the fuel samples, an average structure for each chemicalclass, and an average molecular structure for each class. Also, the 1H and 13C NMR analysisprovides aromaticity data.
Once the LC-1H NMR and13 C NMR data is collected and analyzed, the process of predictingphysical properties begins. This is the process of determining the relationship between chemicalstructures such as alkanes, monocyclic aromatics, dicyclic aromatics, etc., and physical propertiessuch as cloud point, density, cetane number, etc. The prediction of properties is approached from a"group property" point of view. This group property approach of using chemical properties tocalculate physical properties of classes of compounds has been utilized by chemists for severalyears. In the group property approach, the structure of the molecule is examined for structural
iv

features which dictate the physical properties of the compounds. In other words, the physicalproperties of a molecule or compound are determined by the number of types of chemical groupspresent such as methyl, methylene, methine, etc.
The LC-1H NMR approach was used in the chemical fingerprinting of middle fuel samples. Ageneral predictive equation, based on the average molecular properties of each class of compoundspresent in the fuels, was developed. Using this equation, 17 physical properties of middle distillatefuels were predicted. These LC-1H NMR predicted property measurements were compared tomeasurements obtained by the American Society for Testing and Materials (ASTM) fuel tests. Mostmeasurements were found to be within experimental error.
The research has demonstrated that the LC-1H NMR approach for measuring various middledistillate fuel properties be used as an alternative to the ASTM methods of fuel propertymeasurement. It has been shown that it is possible to predict 17 physical properties with most of thepredicted properties within the experimental error of the measurements obtained by the ASTM fueltests. In addition, the LC-1H NMR approach offers other advantages over the ASTM test methods.From this research, it can be seen that many physical properties can be determined in approximately1 to 2 hours with approximately 3 to 5 milliliters of sample fuel. To determine the same propertiesby ASTM test methods, it would take approximately 50 hours and approximately 1 to 3 liters offuel.
V

SECTION I. BACKGROUND
This research project was initiated because of cold weather operability problems in vehicles andequipment. When there are operability problems, the fuel is usually considered to be the source ofthese problems. Actually, low temperature operability of vehicles and equipment is a function of thefollowing inter-related variables:
" Vehicle/equipment fuel system design" Fuel composition* Mode of operation* Housekeeping or user/field practices
Cold weather inoperability occurs as a result of these variables individually and/or collectively notbeing adequately considered. When this research began, the major emphasis was on diesel fuelcomposition and its effects on low temperature opera iility of vehicles and equipment.
The manner in which diesel fuels are blended at the refineries from a diesel fuel pool and thesources of crude stocks will control their low temperature properties. 1 Fractions that contain normaland/or branched paraffinic hydrocarbons will have poorer low temperature properties because of thetendency for these waxy/paraffinic hydrocarbons to precipitate and become insoluable as thetemperature is decreased. All diesel fuels contain normal paraffins with chain lengths varying from10 to 25 carbon atoms (C10 -C25). At low temperatures, some of the paraffins (C10 or higher)precipitate as wax crystals.
The wax content will vary due to refinery processes used by different refineries and the crudefeedstocks. For example, Grade DF-2 diesel fuels usually contain 6 to 8 percent paraffin wax,depending on the refinery. Most refineries are not able to remove all of the normal paraffinhydrocarbons without greatly reducing product yields. Furthermore, removing too many paraffinswill lower the cetane number of the resulting fuels, as well as affecting other properties such asgravity, viscosity, etc., which are essential for diesel engine performance.
Generally at or above 20F, the wax will be in solution; however, at low temperatures, some of thiswax will precipitate out since the solubility of the wax is a direct function of temperature.Therefore, the manner in which the diesel fuels are blended at the refineries will control theiroperability at low temperatures.
When wax crystals first begin to precipitate, they appear as a dispersed cloud, called the cloud point.It is at this point that fuel operability problems may first occur.2 Therefore, the cloud point is themost important test property for defining low temperature operability of diesel fuels. It is when theambient temperature approaches the cloud point of the fuel that the potential for vehicle/equipmentinoperability will probably first occur.
1
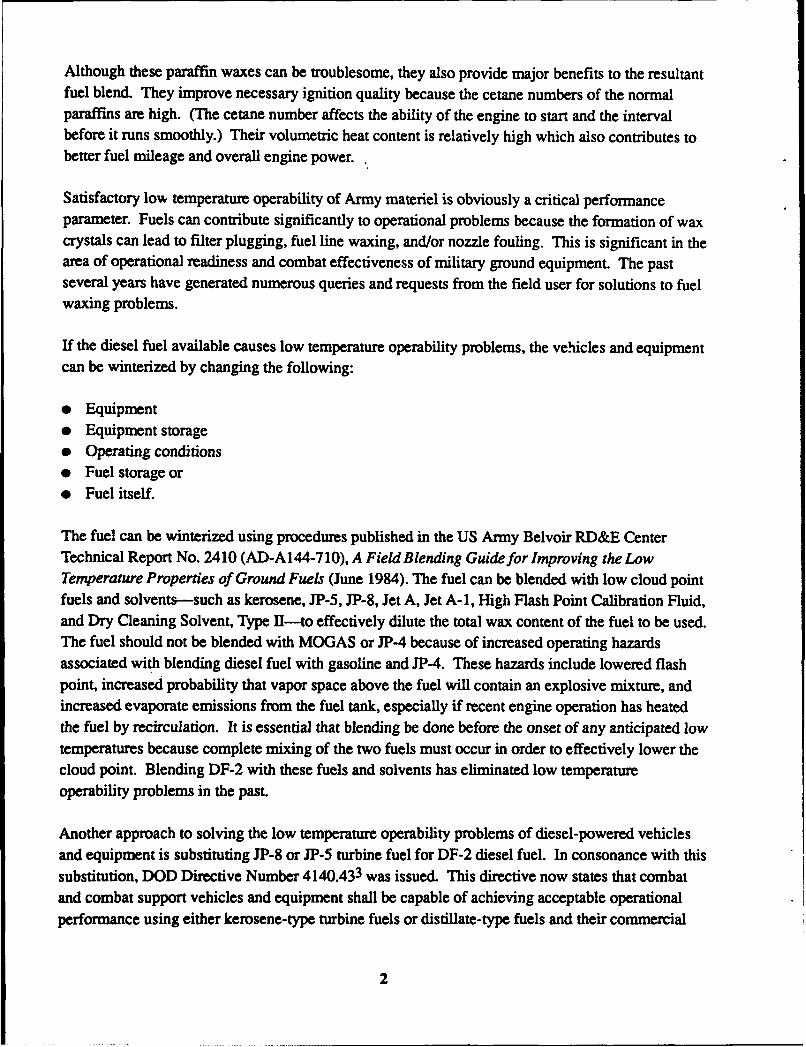
Although these paraffin waxes can be troublesome, they also provide major benefits to the resultantfuel blend. They improve necessary ignition quality because the cetane numbers of the normalparaffins are high. (The cetane number affects the ability of the engine to start and the intervalbefore it runs smoothly.) Their volumetric heat content is relatively high which also contributes tobetter fuel mileage and overall engine power.
Satisfactory low temperature operability of Army materiel is obviously a critical performanceparameter. Fuels can contribute significantly to operational problems because the formation of waxcrystals can lead to filter plugging, fuel line waxing, and/or nozzle fouling. This is significant in thearea of operational readiness and combat effectiveness of military ground equipment. The pastseveral years have generated numerous queries and requests from the field user for solutions to fuelwaxing problems.
If the diesel fuel available causes low temperature operability problems, the vehicles and equipmentcan be winterized by changing the following:
" Equipment" Equipment storage" Operating conditions" Fuel storage or" Fuel itself.
The fuel can be winterized using procedures published in the US Army Belvoir RD&E CenterTechnical Report No. 2410 (AD-A144-710), A Field Blending Guide for Improving the LowTemperature Properties of Ground Fuels (June 1984). The fuel can be blended with low cloud pointfuels and solvents-such as kerosene, JP-5, JP-8, Jet A, Jet A-1, High Flash Point Calibration Fluid,and Dry Cleaning Solvent, Type H-to effectively dilute the total wax content of the fuel to be used.The fuel should not be blended with MOGAS or JP-4 because of increased operating hazardsassociated with blending diesel fuel with gasoline and JP-4. These hazards include lowered flashpoint, increased probability that vapor space above the fuel will contain an explosive mixture, andincreased evaporate emissions from the fuel tank, especially if recent engine operation has heatedthe fuel by recirculation. It is essential that blending be done before the onset of any anticipated lowtemperatures because complete mixing of the two fuels must occur in order to effectively lower thecloud point. Blending DF-2 with these fuels and solvents has eliminated low temperatureoperability problems in the past.
Another approach to solving the low temperature operability problems of diesel-powered vehiclesand equipment is substituting JP-8 or JF-5 turbine fuel for DF-2 diesel fuel. In consonance with thissubstitution, DOD Directive Number 4140.433 was issued. This directive now states that combatand combat support vehicles and equipment shall be capable of achieving acceptable operationalperformance using either kerosene-type turbine fuels or distillate-type fuels and their commercial
2
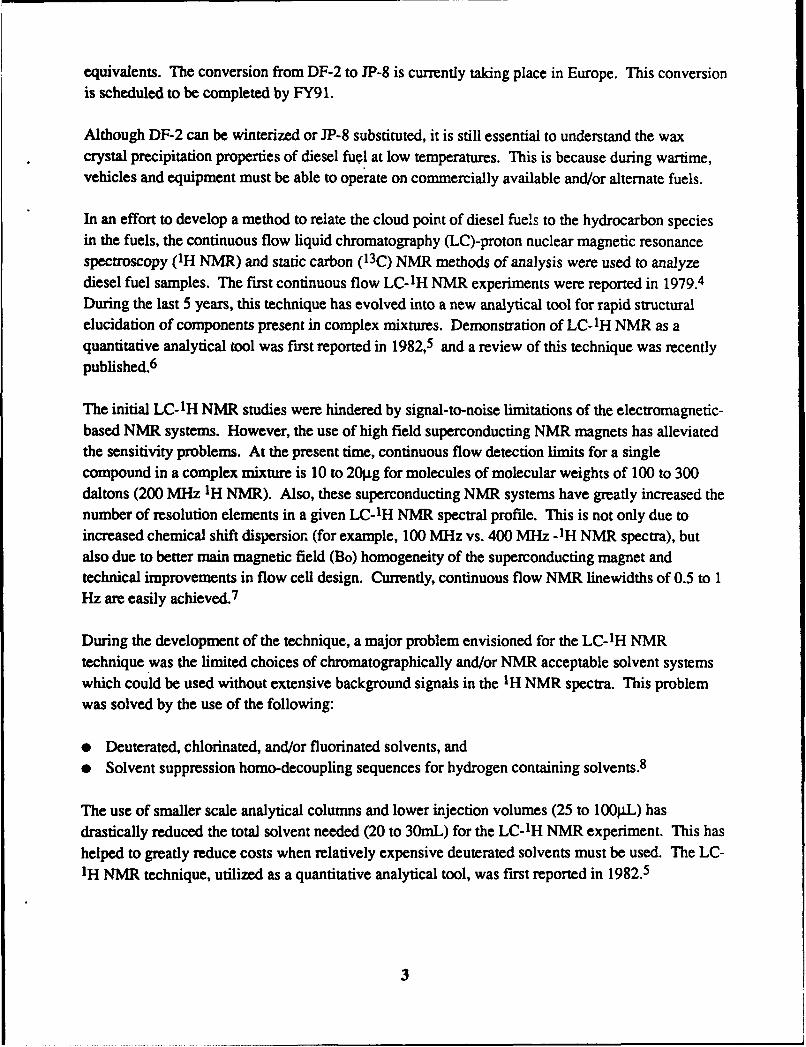
equivalents. The conversion from DF-2 to JP-8 is currently taking place in Europe. This conversionis scheduled to be completed by FY91.
Although DF-2 can be winterized or JP-8 substituted, it is still essential to understand the waxcrystal precipitation properties of diesel fuel at low temperatures. This is because during wartime,vehicles and equipment must be able to operate on commercially available and/or alternate fuels.
In an effort to develop a method to relate the cloud point of diesel fuels to the hydrocarbon speciesin the fuels, the continuous flow liquid chromatography (LC)-proton nuclear magnetic resonancespectroscopy (1H NMR) and static carbon (13C) NMR methods of analysis were used to analyzediesel fuel samples. The first continuous flow LC-1H NMR experiments were reported in 1979.4
During the last 5 years, this technique has evolved into a new analytical tool for rapid structuralelucidation of components present in complex mixtures. Demonstration of LC- IH NMR as aquantitative analytical tool was first reported in 1982,5 and a review of this technique was recentlypublished.6
The initial LC-1H NMR studies were hindered by signal-to-noise limitations of the electromagnetic-based NMR systems. However, the use of high field superconducting NMR magnets has alleviatedthe sensitivity problems. At the present time, continuous flow detection limits for a singlecompound in a complex mixture is 10 to 20gg for molecules of molecular weights of 100 to 300daltons (200 MHz 1H NMR). Also, these superconducting NMR systems have greatly increased thenumber of resolution elements in a given LC-AH NMR spectral profile. This is not only due toincreased chemical shift dispersion (for example, 100 MHz vs. 400 MHz -1H NMR spectra), butalso due to better main magnetic field (Bo) homogeneity of the superconducting magnet andtechnical improvements in flow cell design. Currently, continuous flow NMR linewidths of 0.5 to 1Hz are easily achieved. 7
During the development of the technique, a major problem envisioned for the LC-1H NMRtechnique was the limited choices of chromatographically and/or NMR acceptable solvent systemswhich could be used without extensive background signals in the IH NMR spectra. This problemwas solved by the use of the following:
* Deuterated, chlorinated, and/or fluorinated solvents, and• Solvent suppression homo-decoupling sequences for hydrogen containing solvents.8
The use of smaller scale analytical columns and lower injection volumes (25 to l00gL) hasdrastically reduced the total solvent needed (20 to 30mL) for the LC-IH NMR experiment. This hashelped to greatly reduce costs when relatively expensive deuterated solvents must be used. The LC-IH NMR technique, utilized as a quantitative analytical tool, was first reported in 1982.5
3

SECTION II. INTRODUCTION
As stated earlier, this research was initiated to support the Army's capability to identify thecomponents of fuels which contribute to low temperature performance of fuels. It is essential notonly for research and development efforts within this Center, but in the continuation of cooperativeprograms with Project Managers of vehicles, equipment, and weapon systems, such as the Abramstank and PATRIOT, for solving low temperature operational problems. In addition to determiningthe effects of diesel fuel components that contribute to low temperature inoperability, the purpose ofthe research was expanded to include attempting to elucidate the effects of the concentration ofvarious chemical species or classes of compounds in middle distillate fuels on the chemical,physical, and performance characteristics of these fuels. Examples of these chemical species are:alcanes, monocyclic aromatics, dicyclic aromatics, fluorenes, and phenanthrenes. With theprediction of the deterioration in the quality of diesel fuels in the future, which is well documentedin the literature, it is imperative that the effects of these chemical species on operability, which canbe related to physical properties-such as cloud point, viscosity, cetane number-be fullyunderstood. It has been seen in the field that the quality of fuels can have serious consequences onDOD's mission by degrading vehicles, equipment, and weapon systems performance and damagingcritical vehicles, equipment, and weapons components. DOD's highest priority goal in mobilityfuels technology is to achieve the capability of utilizing fuels which are now readily available andare projected to be available from the commercial sector. This is essential because DOD's missioncannot be unduly influenced by short-term fluctuations in petroleum supplies. Therefore, it ismandatory that all factors influencing operability be understood.
Although this research was initiated because of cold weather operability problems in vehicles andequipment, it was discovered that various physical properties of middle dintillate fuels, including thecloud point, can be predicted. The LC-AH NMR technique developed can predict the followingphysical properties:
*-'Cetane number, (ASTM D613)* 4Cetane index, (ASTM D976)*_Density-ASTM D1298)*tpecific gravit y ASTM D1298)* tour point,(ASTM D97)e Flash point (ASTM D93)0 Viscosi _ASTM D445)" ;-ifterability,(ASTM D4539)
" Heatofcombustion ASTM D240)Cloud pointJASTM D2500)
" \olume percent aromatics (ASTM D1319)* Siesidual carbon content,(ASTM D524)e Initial, 10%, 50%, 90% and endloiling points, (ASTM D86).
/4

It was also discovered that this technique provides chemical insight concerning the influence ofchemical changes on the fuel's physical properties. This led to expansion of the initial research goal.Therefore, the revised goal was to develop a simple analytical technique which can be used torapidly predict various physical properties of fuels.
The LC-1H NMR technique is now being developed to predict various physical properties of middledistillate fuels based on a single analytical technique. This methodology determines the averagemolecular composition data of the monocyclic and dicyclic aromatic, fluorene, and phenanthrenefractions. It also determines the fraction of total carbon for the alkane fraction. Finally, itdetermines, where applicable, the fraction of total carbon for the tricyclic or aromatic fraction. Theon-line LC-IH NMR data is also analyzed to give the following results: the molar quantities of eachtype of hydrogen and carbon present in the fuel samples, an average structure for each chemicalclass, and an average molecular structure for each class. A complete description of this averagemolecular approach has been published.6 Also, the 1H and 1 3 C NMR analysis provides aromaticitydata.
Once the LC-1H NMR andl 3C NMR data is collected and analyzed, the process of predictingphysical properties begins. This is the process of determining the relationship between chemicalstructures (alkanes, monocyclic aromatics, and licyclic aromatics) and physical properties (cloudpoint, density, and cetane number). The prediction of properties is approached from a "groupproperty" point of view. This group property approach of using chemical properties to calculatephysical properties of classes of compounds has been utilized by chemists for several years. In thegroup property approach, the structure of the molecule is examined for structural features whichdictate the physical properties of the compounds. In other words, the physical properties of amolecule or compound are determined by the number of types of chemical groups present-methyl,methylene, methine, etc. Although synergistic effects between the chemical compounds present in afuel could be important for some physical properties, it has been shown that a group propertyapproach is effective in the calculation of several physical properties of pure compounds. 9 Thegroup property approach has also been used in the calculation of physical properties of fuelmixtures. 10
The ASTM has developed standards for fuel property analysis. These ASTM methods arerecognized worldwide as being very accurate but may be tedious, as well as requiring largequantities of fuel sample. As a result, several alternatives to ASTM methods have been r oposed topredict fuel properties in a more timely manner, i.e., measurement of cloud point by DifferentialScanning CalorimetryI and an alternative to the ASTM engine test for the determination of cetanenumber. 12 There have also been efforts to measure only selected fuel properties and from theseproperties predict other physical properties of the fuel. 13
In this research, nuclear magnetic resonance spectroscopy was developed as a liquidchromatographic detector. The LC-1H NMR approach was used in the chemical fingerprinting of
5

middle distillate fuel samples. In this report, 17 physical properties of middle distillate fuels basedon average molecular structure obtained by LC-1H NMR analysis are reported. The predictions arebased on the group property approach. A general predictive equation, based on the averagemolecular properties of each class of compounds present in the fuels, was developed. These LC-1HNMR predicted property measurements were compared to measurements obtained by the ASTMfuel tests. Most measurements were found to be within experimental error.
SECTION II. RESULTS AND DISCUSSION
For several years, there has been interest in the various applications of NMR of flowing systems. 14
The interest has primarily been in the use of NMR as an on-line, continuous flow HPLC detector. 15
In this research, the NMR was used as an on-line, continuous flow HPLC detector (LC-1H NMR) in
the analysis of middle distillate fuel sampies.
For the purpose of this research, the average composition of a low boiling fuel sample is defined in
the following manner. For each hydrocarbon class, the absolute moles of each distinct carbon type
(with associated hydrogens) in a specified aliquot are determined. Examples of distinct carbontypes are:
" An unsubstituted aromatic ring carbon (which has one associated hydrogen), and" Substituted aromatic ring carbon (having no associated hydrogen).
It can be seen that each of these clearly constitute a separate type of carbon. After determining thenumber of moles of each carbon type in a fuel aliquot, it may be possible to normalize these data to
propose a hypothetical average molecular structure. Although the average structures, as definea by
this research, have no real significance themselves (because they are hypothetical constructs of thenormalized compositional data), quantities derived from the average structure (for example, averagemolecular weight) can be valuable. The major average compositional quantities discussed in this
report are defined in Figure 1 (Note: All figures are contained in Appendix A.)
The research correlating fuel properties and LC-1H NMR data has been divided into two parts:
computer modeling of pure compounds and LC-IH NMR data collection of middle distillate fuel
samples.
COMPUTER MODELING OF PURE COMPOUNDS
In attempting to predict physical properties of middle distillate fuels, the initial studies concentrated
on predicting the physical properties of pure compounds. This was done to gain insight regarding
structure-physical property relationships. The prediction of properties was approached from a"group property" point of view. This means that the structure of a molecule is examined for
6

structural features which dictate the physical properties of the compounds. The group property
approach is based on the following equation:
Pure Compound Property = 7 fXCT*Group Propertyx
where:
Property = cetane, density, etc.x = alkane, monocyclic, dicyclic, fluorene, and phenanthreneCT = Total moles carbon for class x
While examining these pure compounds, a computer data base was generated containingapproximately 80 compounds belonging to the chemical classes of alkanes, alkenes, cyclohexanes,
decalines, monocyclic aromatics, naphthalenes, and tetralins. The first physical propertiesinvestigated were cetane number and density because they were readily obtainable in a group
property approach. In all of the classes studied, it was determined that the dominate factors in the
calculation of these properties are the chain length of the molecule and the degree of branching. In
cyclic molecules, the degree of substitution on the ring is also found to be a dominate factor.
Next, formulas were developed for the classes to calculate the cetane number and density. For
alkanes, the NMR integration of the methylene (CH 2) chemical shift region determines the chainlength of the molecule. For the degree of branching in an alkane, the methine (CH) and quaternary
(CQ) carbons were used. The degree of branching of an alkane is defined as:
CH + 2*CQ
because each methine group indicates one branch and each quaternary group indicates two branches.From this, the following formula for predicting the cetane number of an alkane was derived:
Cetane Number = 1.04 [44.0 + 1.97 x CH2 - 23.96 (CH + 2 x *CQ)] - 2.38
This indicates that the cetane number of a base alkane is approximately 44.
Also, as the chain length increases in the molecule, the cetane number of the compound increases by
approximately five for each CH2 group. The previous formula also indicates that the cetane number
decreases by approximately 25 units for each branch on the molecule.
Similar formulas were developed h-, multiple regression analysis for each of the previously listed
compound or chemical classes. 71, correlation coefficients for these predictions are listed in
Table 1.
7

Table 1. Correlation Coefficients of Predicted vs. Observed Values forCetane Number and Density of Compounds or Chemical Classes
COMPOUND CLASS CETAINE NUMBER CORRELATION DENSITY CORRELATION
Alkanes 0.927 0.920Alkenes 0.858 0.997
Cyclohexanes 0.979 0.896
Decalins 0.973 0.987
Monocyclics 0.952 0.865Dicyclics 0.911 0.907Tetralins 0.911 0.999
Finally, the cetane number was predicted for a total of 73 compounds. As shown in Figure 2, thecorrelation coefficient was 0.9706.
The process was repeated for the prediction of density for each of the compounds in the basic set.The same structural parameters were found to be important in determining the density of eachcompound as in determining the cetane number. The following formula is used for predicting thedensity for an alkane:
Density = 1.02[0.67 + 0.0033 x CH2 + 0.0023 x (CH + 2 X *CQ)I - 0.139
The results of the compound classes are listed in Table 1. The density was predicted for a total of 63compounds. Shown in Figure 3 is the plot of predicted versus observed density values whichresulted in a correlation coefficient of 0.988.
The process was repeated to predict additional physical properties. Once the appropriate equation
for each property was determined, the predicted values were plotted versus the observed values.Then the correlation coefficients shown in Table 2 were derived.
8
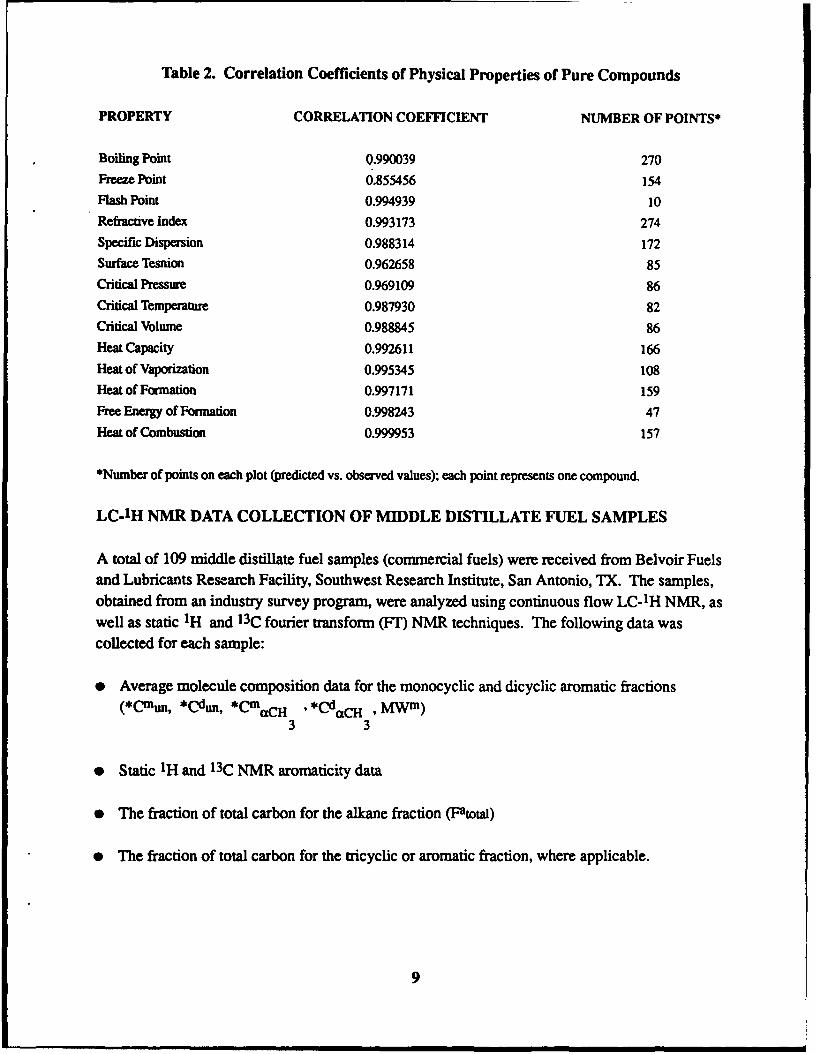
Table 2. Correlation Coefficients of Physical Properties of Pure Compounds
PROPERTY CORRELATION COEFFICIENT NUMBER OF POINTS*
Boiling Point 0.990039 270Freeze Point 0.855456 154
Flash Point 0.994939 10
Refractive Index 0.993173 274
Specific Dispersion 0.988314 172Surface Tesnion 0.962658 85
Critical Pressure 0.969109 86Critical Temperature 0.987930 82Critical Volume 0.988845 86
Heat Capacity 0.992611 166
Heat of Vaporization 0.995345 108Heat of Formation 0.997171 159
Free Energy of Formation 0.998243 47
Heat of Combustion 0.999953 157
*Number of points on each plot (predicted vs. observed values); each point represents one compound.
LC-1H NMR DATA COLLECTION OF MIDDLE DISTILLATE FUEL SAMPLES
A total of 109 middle distillate fuel samples (commercial fuels) were received from Belvoir Fuelsand Lubricants Research Facility, Southwest Research Institute, San Antonio, TX. The samples,obtained from an industry survey program, were analyzed using continuous flow LC-1 H NMR, aswell as static IH and 13C fourier transform (FT) NMR techniques. The following data wascollected for each sample:
e Average molecule composition data for the monocyclic and dicyclic aromatic fractions(*Cmun, *Cdun, *CmaCH , *Cd , MWm)
3 3
* Static IH and 1 3 C NMR aromaticity data
e The fraction of total carbon for the alkane fraction (Fatotal)
* The fraction of total carbon for the tricyclic or aromatic fraction, where applicable.
9

An example of the data collected for each sample is shown in Appendix B. From the above data,
the following properties were derived for each fuel sample:
* Average molecular composition data for each chromatographic fraction
* Molar amounts of each component
* Average molecular properties for a given class or carbon type present through integration.
From this data, the predictive equation (Equation 1, Figure 4) was developed for various fuelproperties. The equation is based on the average molecular properties of each class of compoundspresent in the fuel. A detailed explanation of the development of this predictive equation is includedin Section IV of this report.
At this time, the actual predictions of physical properties of middle distillate fuels began. First, theproperty of each class of the fuel was predicted using average structural data obtained by LC-NMRanalysis of the fuel. After the properties of the individual classes were determined, the property ofthe fuel was calculated by taking a weighted average of the properties of each class. The weighingfactor consisted of the fraction of carbon in the fuel which was present in each individual class.
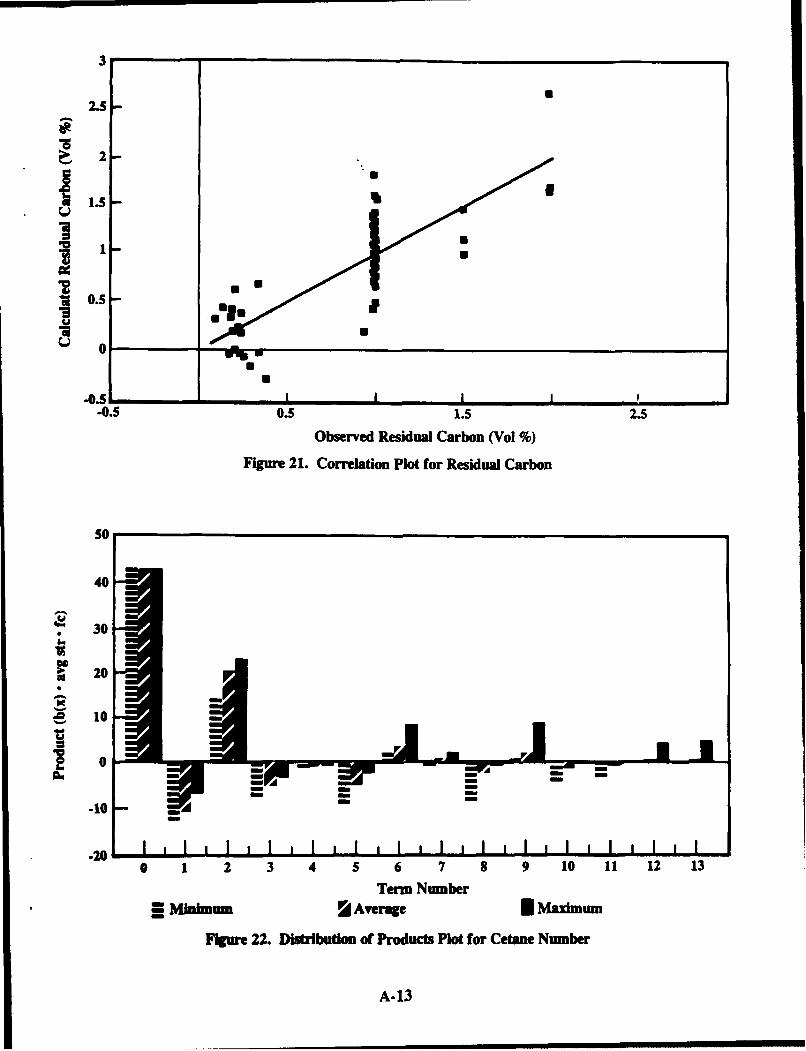
Using Equation 1 (Figure 4), 17 physical properties of the 109 fuel samples were predicted from theLC-IH NMR data. Table 3 summarizes the results. Although there was a total of 109 fuels in thedata base, values for all measured physical properties were not available for each of the fuels.However, the maximum number of fuels for which the ASTM physical property data were availablewas included in each correlation. The correlation plots (observed vs. calculated values) for the 17physical properties are shown in Figures 5 through 21.
10

Table 3. Summary of Fuel Physical Property Predictions
RANGE
PROPERTY r* NO* n*** OF VALUES UNITS
Cetane Number 0.9672 30 1 38 to 48 Cetane
Cetane Index 0.9789 65 1 37 to 57 Cetane
Density 0.9653 64 1 0.791 to 0.891 kg/L
Specific Gravity 0.9731 37 1 0.825 to 0.870 60/60°F
Initial Boiling Point 0.8995 64 -1 151 to 220 °C
Boiling Point: 10% 0.9393 67 -1 170 to 252 °C
Boiling Point: 50% 0.9532 104 -1 193 to 301 0C
Boiling Point 90% 0.9185 105 -1 224 to 373 °C
End Boiling Point 0.9142 102 -1 244 to 406 °C
Pour Point 0.9080 72 1 -43 to 10 °C
Flash Point 0.7129 103 1 36 to 83 °C
Cloud Point 0.9284 70 1 -29 to 14 °C
Viscosity 0.9517 104 1 1.1 to 4.3 cSt
Filterability 0.7970 38 1 9 to 78Heat of Combustion 0.9298 29 1 42.7 to 43.2 MJ/kg
Percent Aromatics 0.9733 70 1 14.8 to 42.1 vol %
Residual Carbon 0.8137 83 1 0.09 to 2 vol %
*r = correlation coefficient
**N = number of points (fuels)***n = function type exponent
Next, errors of each property prediction by the LC-1 H NMR technique were determined. The errorof the physical property prediction was given as the standard deviation of the residuals (cr) from theprediction. These values were compared to the reproducibility values of the ASTM methods for
determining each fuel property. The errors of each physical property prediction and thereproducibility of the ASTM methods are summarized in Table 4. It can be seen from this table that
most of the LC- 1H NMR predictions are within the experimental error of the ASTM measurement
for that property.
11

Table 4. Comparison of ASTM Quoted Errors and LC- 1H NMR MethodStandard Deviation of Residuals
ASTM ASTM* ASTM* CALCULATED
PROPERTY METHODS REPEATABILITY REPRODUCIBILITY Or UNITS
Ceane Number D613 0.7 2.9 0.85 Cetane
Cetane Index" D976 2.0 1.10 Cetane
Density D1298 0.0005 0.0012 0.005 kg/L
Specific Gravity D1298 0.0005 0.0012 0.002 60/60°F
Initial Boiling Point D86 2 5 5.88 OC
Boiling Point: 10% D86 2 5 6.25 °C
Boiling Point: 50% D86 2 5 9.91 O(
Boiling Point: 90% D86 2 5 18.8 c
End Boiling Point D86 2 5 20.6 OC
Pour Point D97 3 6 5.18 OC
Flash Point D93 5 10 9.47 OC
Cloud Point D2500 2 4 3.77 OC
Viscosity D445 0.05 0.24 0.27 c.St
Filterability** 19.1
Heat of Combustion D240 0.13 0.40 0.06 MJA*g
Peroent Aromatics D1319 1.4 3.0 1.85 vol %
Residual Carbon D524 0.16 0.26 0.29 vol %
The exact reproducibility and repeatability for the ASTM tests are dependent on the fuel class being tested and theexact conditions of the test. The values presented here are representative for the fuels utilized in this tudy.
* The cetane index is a correlation with the cetane number. Therefore, the error in cetane index is dependent on theerror in the cetane number. ASTM D976 quotes only the error shown here.
* The filterability data utilized for this study was a filterability index, and not the filterability measured byASTM D4539.
One feature of this method is that the data base compiled for the correlation of the fuel propertiescan include various classes of fuels. For example, Figure 7 illustrates the density predictions withthe individual fuels labeled JP-5, JP-8, and DF-2. Therefore, the plot of observed versus calculateddensity values indicates which predicted value corresponds to a fuel contained in a specific class.As a result, the ability exists to make the determination of a fuel class of a middle distillate fuel ofunknown origin based solely on the LC-1H NMR predicted density. This is a possibility for allphysical properties predicted by this technique.
Another feature of this method is that it is possible to directly determine the influence of eachchemical group type on an individual fuel property. The comparison between the values for theproduct of the average molecular structure parameter, fraction carbon parameter, and mixing
12
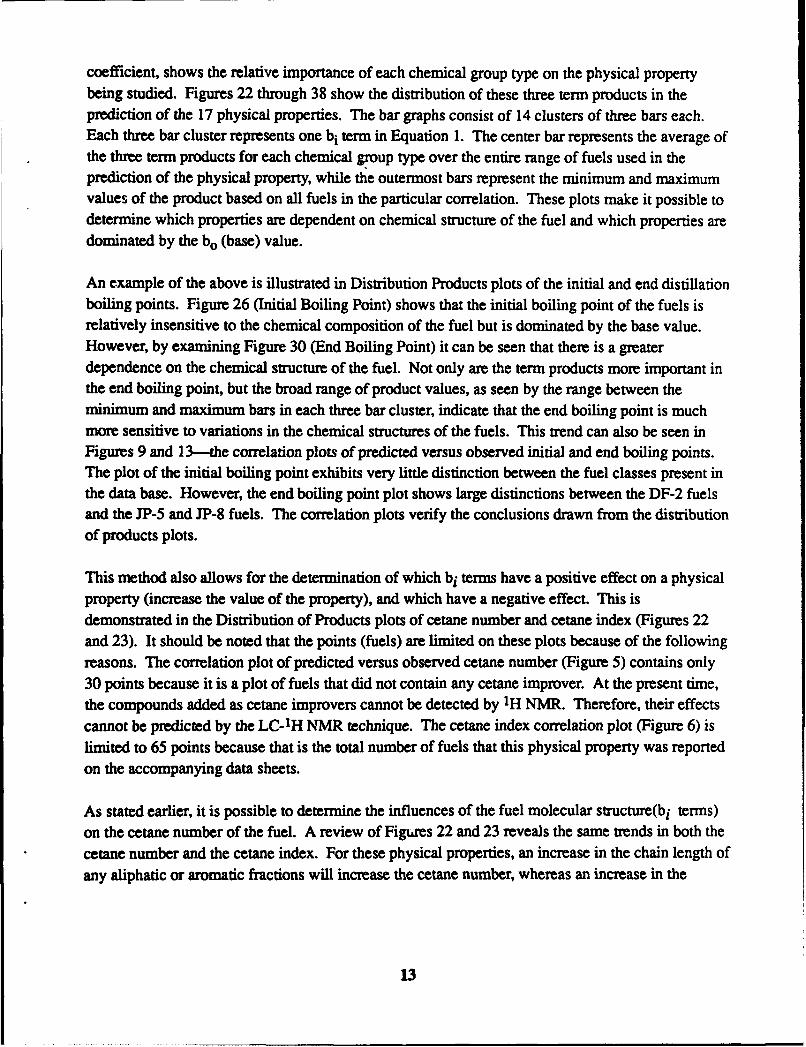
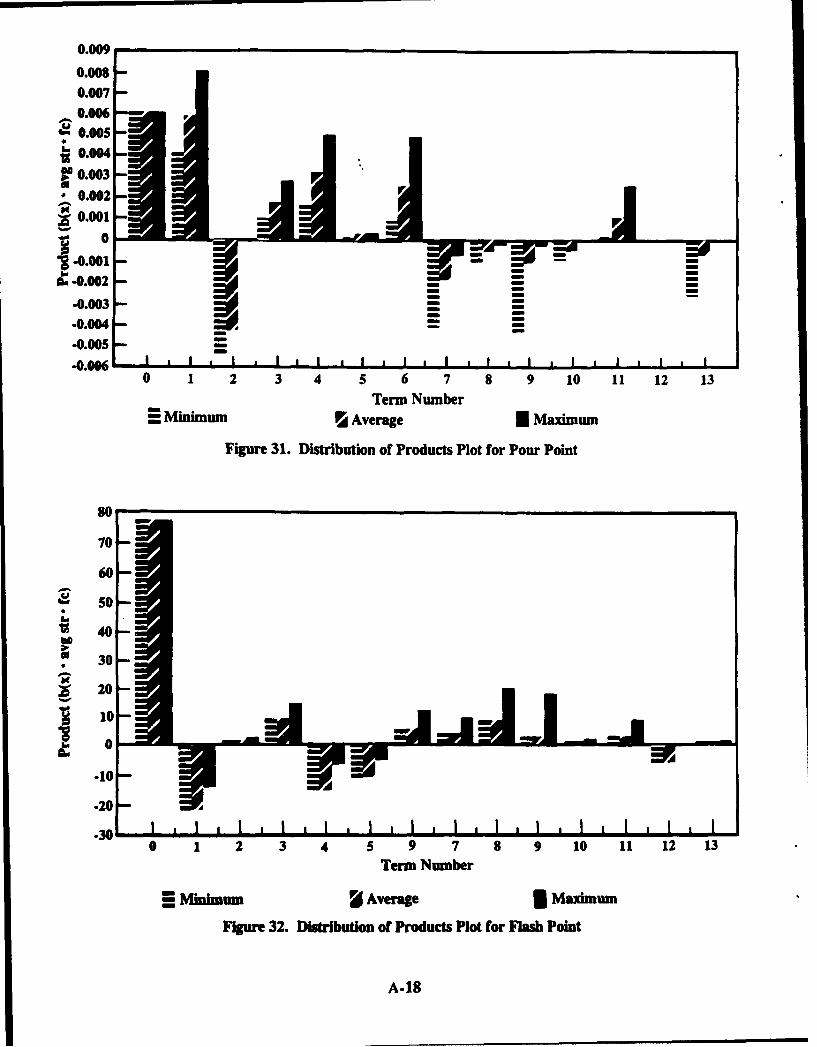
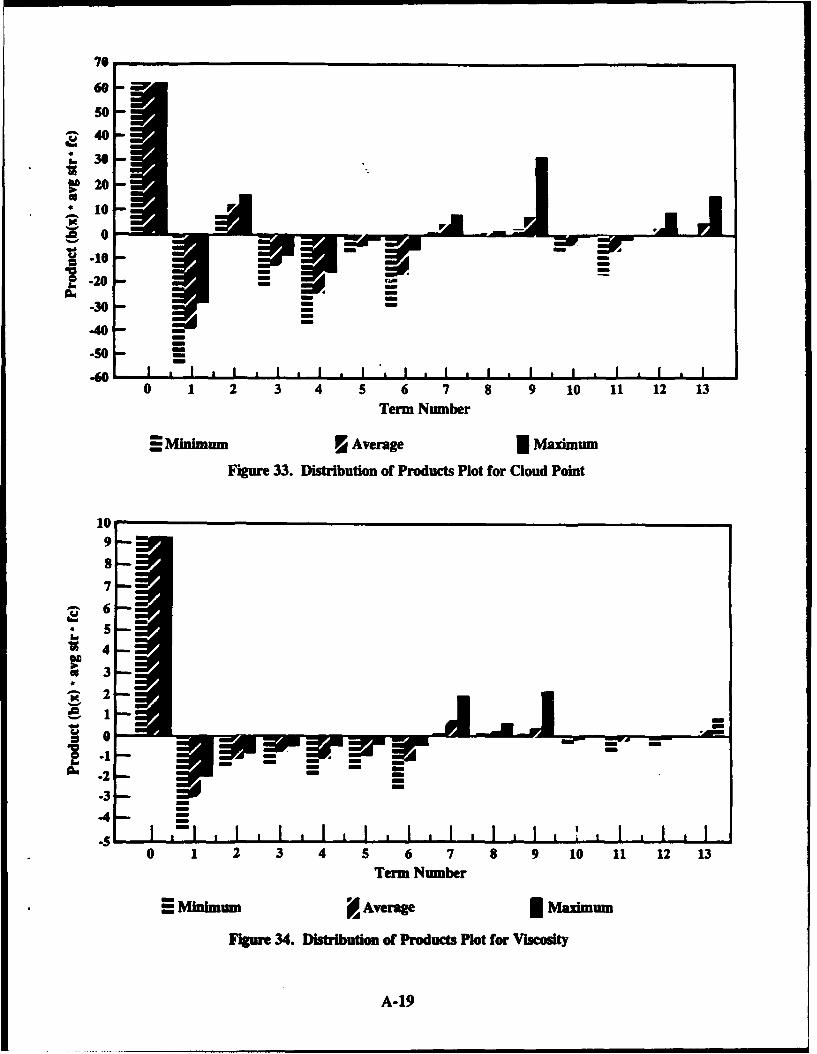
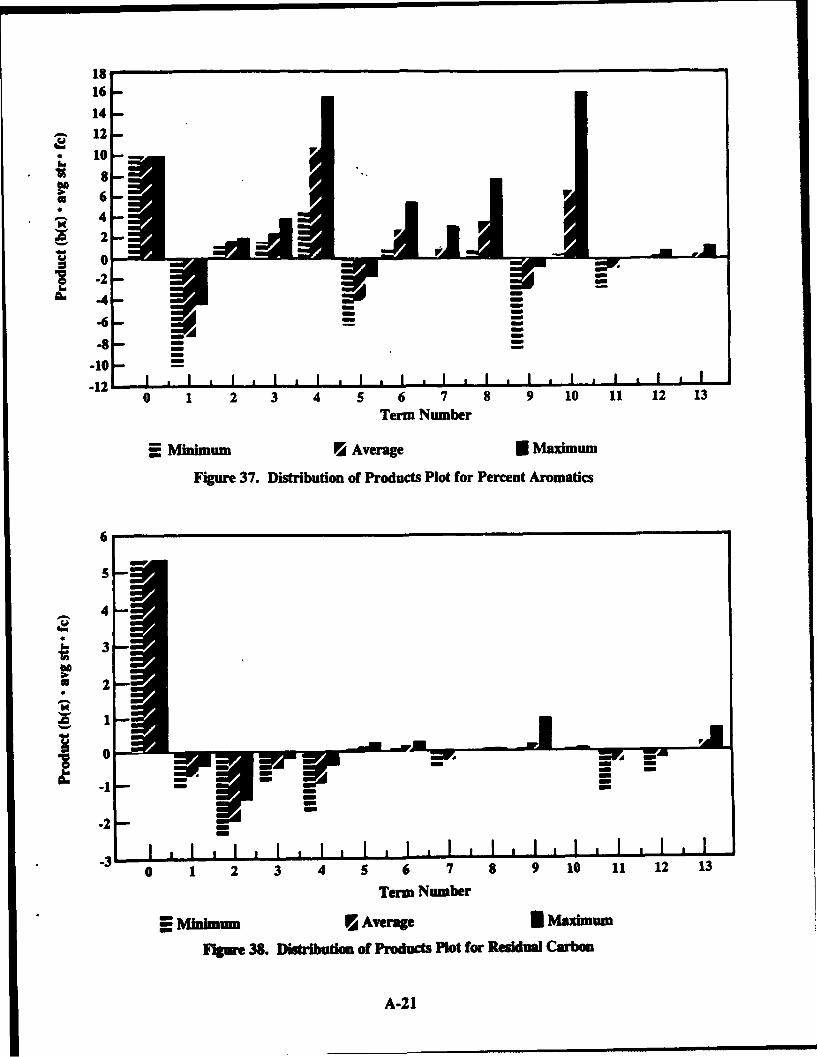
coefficient, shows the relative importance of each chemical group type on the physical propertybeing studied. Figures 22 through 38 show the distribution of these three term products in theprediction of the 17 physical properties. The bar graphs consist of 14 clusters of three bars each.Each three bar cluster represents one bi term in Equation 1. The center bar represents the average ofthe three term products for each chemical group type over the entire range of fuels used in theprediction of the physical property, while the outermost bars represent the minimum and maximumvalues of the product based on all fuels in the particular correlation. These plots make it possible todetermine which properties are dependent on chemical structure of the fuel and which properties aredominated by the bo (base) value.
An example of the above is illustrated in Distribution Products plots of the initial and end distillationboiling points. Figure 26 (Initial Boiling Point) shows that the initial boiling point of the fuels isrelatively insensitive to the chemical composition of the fuel but is dominated by the base value.However, by examining Figure 30 (End Boiling Point) it can be seen that there is a greaterdependence on the chemical structure of the fuel. Not only are the term products more important inthe end boiling point, but the broad range of product values, as seen by the range between theminimum and maximum bars in each three bar cluster, indicate that the end boiling point is muchmore sensitive to variations in the chemical structures of the fuels. This trend can also be seen inFigures 9 and 13-the correlation plots of predicted versus observed initial and end boiling points.The plot of the initial boiling point exhibits very little distinction between the fuel classes present inthe data base. However, the end boiling point plot shows large distinctions between the DF-2 fuelsand the JP-5 and JP-8 fuels. The correlation plots verify the conclusions drawn from the distributionof products plots.
This method also allows for the determination of which bi terms have a positive effect on a physicalproperty (increase the value of the property), and which have a negative effect. This isdemonstrated in the Distribution of Products plots of cetane number and cetane index (Figures 22and 23). It should be noted that the points (fuels) are limited on these plots because of the followingreasons. The correlation plot of predicted versus observed cetane number (Figure 5) contains only30 points because it is a plot of fuels that did not contain any cetane improver. At the present time,the compounds added as cetane improvers cannot be detected by 1H NMR. Therefore, their effectscannot be predicted by the LC-1H NMR technique. The cetane index correlation plot (Figure 6) islimited to 65 points because that is the total number of fuels that this physical property was reportedon the accompanying data sheets.
As stated earlier, it is possible to determine the influences of the fuel molecular structure(bi terms)on the cetane number of the fuel. A review of Figures 22 and 23 reveals the same trends in both thecetane number and the cetane index. For these physical properties, an increase in the chain length ofany aliphatic or aromatic fractions will increase the cetane number, whereas an increase in the
13
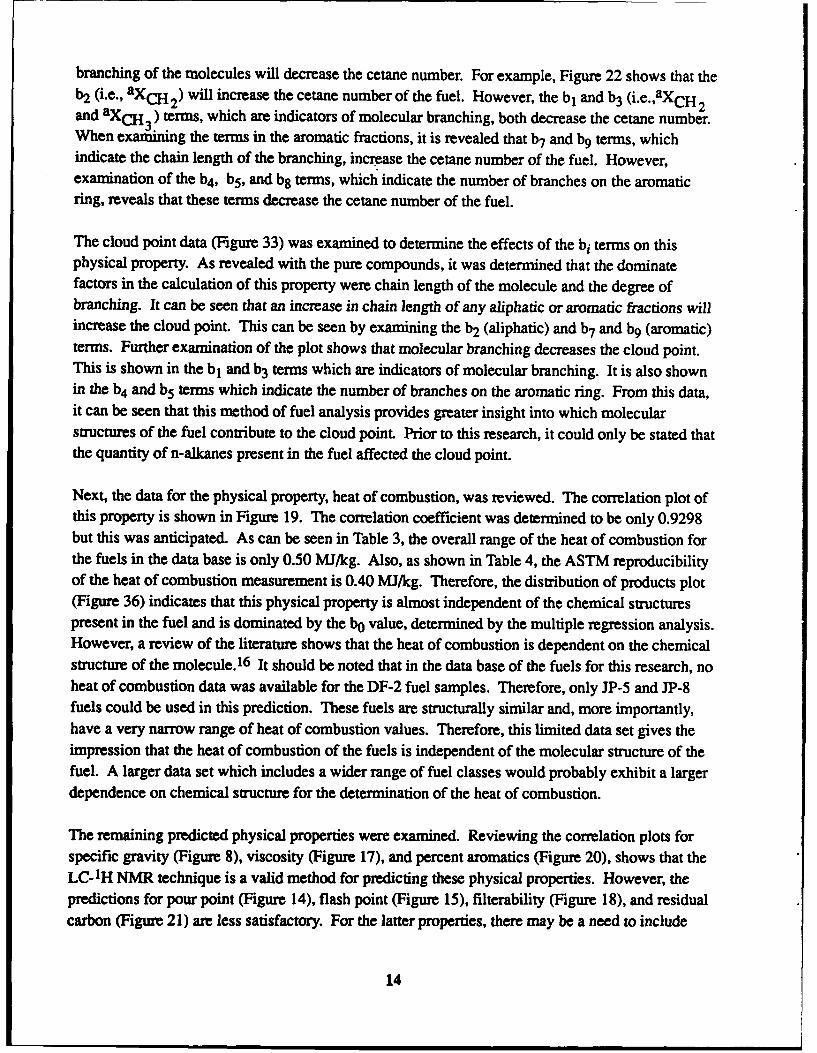
branching of the molecules will decrease the cetane number. For example, Figure 22 shows that theb2 (i.e., aXcH2 ) will increase the cetane number of the fuel. However, the b1 and b3 (i.e.,aXCH 2and aXcH3 ) terms, which are indicators of molecular branching, both decrease the cetane number.When examining the terms in the aromatic fractions, it is revealed that b7 and b9 terms, whichindicate the chain length of the branching, increase the cetane number of the fuel. However,examination of the b4 , b5, and b8 terms, which indicate the number of branches on the aromaticring, reveals that these terms decrease the cetane number of the fuel.
The cloud point data (Figure 33) was examined to determine the effects of the bi terms on thisphysical property. As revealed with the pure compounds, it was determined that the dominatefactors in the calculation of this property were chain length of the molecule and the degree ofbranching. It can be seen that an increase in chain length of any aliphatic or aromatic fractions willincrease the cloud point. This can be seen by examining the b2 (aliphatic) and b7 and b9 (aromatic)terms. Further examination of the plot shows that molecular branching decreases the cloud point.This is shown in the b, and b3 terms which are indicators of molecular branching. It is also shownin the b4 and b5 terms which indicate the number of branches on the aromatic ring. From this data,it can be seen that this method of fuel analysis provides greater insight into which molecularstructures of the fuel contribute to the cloud point. Prior to this research, it could only be stated thatthe quantity of n-alkanes present in the fuel affected the cloud point.
Next, the data for the physical property, heat of combustion, was reviewed. The correlation plot ofthis property is shown in Figure 19. The correlation coefficient was determined to be only 0.9298but this was anticipated. As can be seen in Table 3, the overall range of the heat of combustion forthe fuels in the data base is only 0.50 MJ/kg. Also, as shown in Table 4, the ASTM reproducibilityof the heat of combustion measurement is 0.40 MJ/kg. Therefore, the distribution of products plot(Figure 36) indicates that this physical property is almost independent of the chemical structurespresent in the fuel and is dominated by the b0 value, determined by the multiple regression analysis.However, a review of the literature shows that the heat of combustion is dependent on the chemicalstructure of the molecule. 16 It should be noted that in the data base of the fuels for this research, noheat of combustion data was available for the DF-2 fuel samples. Therefore, only JP-5 and JP-8fuels could be used in this prediction. These fuels are structurally similar and, more importantly,have a very narrow range of heat of combustion values. Therefore, this limited data set gives theimpression that the heat of combustion of the fuels is independent of the molecular structure of thefuel. A larger data set which includes a wider range of fuel classes would probably exhibit a largerdependence on chemical structure for the determination of the heat of combustion.
The remaining predicted physical properties were examined. Reviewing the correlation plots forspecific gravity (Figure 8), viscosity (Figure 17), and percent aromatics (Figure 20), shows that theLC-1H NMR technique is a valid method for predicting these physical properties. However, thepredictions for pour point (Figure 14), flash point (Figure 15), filterability (Figure 18), and residualcarbon (Figure 21) are less satisfactory. For the latter properties, there may be a need to include
14

additional experimental data (enlarging the fuel data base). Also, the accuracy of the experimentalmeasurement for some of these physical properties could be the reason for the less-than-satisfactorycorrelations.
The above results show that the LC-1H NMR technique is a reliable method for the prediction ofphysical properties of middle distillate fuel s. Table 4 shows a side-by-side comparison of thestandard deviation of the residuals from the LC-1 H NMR prediction of the fuel properties and theexperimental errors of the ASTM measurements of these properties. In many cases, it can be seenthat it is possible to predict physical properties of the fuel by LC-1H NMR analysis as accurately asby measuring the physical properties by ASTM methods. The LC-H NMR technique of theanalysis has the added advantage of requiring only approximately 3 to 5 milliliters of sample, andonly approximately 1 to 2 hours total analysis time, while the measurement of all 17 properties bythe ASTM methods would require approximately I to 3 liters of fuel sample and almost 50 hours ofanalysis time.
SECTION IV. EXPERIMENTAL
EQUIPMENT
A Whatman Magnum-9 silica gel-PAC column was used for all liquid chromatography (LC)separations. The packing in the column was silica gel derivatized to introduce amino and cyanofunctionalities to the surface. Retention of aromatic hydrocarbons on this type of column wasgenerally superior to standard silica gel columns. A special activation sequence was used to removepolar compounds. These compounds slowly bleed off with nonpolar solvents and create largebackground signals in the proton spectra. The following sequence of chemicals was used to removethis background: 50 mL of 10% acetonitrile-d 3 (99%-d, Aldrich) in chloroform-d (99.8%-d,Aldrich) was followed by 60 mL of chloroform-d. Then, the chromatographic solvent, 97.5%1, 1, 1-trichlorotrifluoroethane (Freon, Miller-Stephanson Chemicals Co.) and 2.5% chloroform-d,was pumped through the column. Column equilibration was usually achieved after 60 mL ofFreon/chloroform-d mixture had been pumped through the column.
There is a second source of background which is particular to semipreparative LC columns. Largeinternal diameter columns do not completely flush the alkane fraction because of partially stagnantregions near the inlet, outlet, and wall. This can result in a very small amount of aliphatic materialbeing present in the spectra of the aromatic fractions of the LC-AH NMR experiment. Therefore, forfuels of low aromaticity, the signal is intense enough to make an erroneously high measurement ofCH2 and CH3
1H integrals for alkyl aromatics. The method designed to correct the column is toinject a very low aromaticity fuel and measure the relative aliphatic signal intensities in each file.
15

The chromatographic solvent contained 0.05% (v/v) hexamethyldisiloxane (HMDS, Merck) as thechemical shift and quantitation reference. The solvent was not degreased because dissolved oxygenreduces proton spin-lattice relaxation time values to several seconds.
A Waters M-45 pump was used. The pump was equipped with a needle valve to create a 1000 psiback pressure because it requires back pressure to activate its pulse dampner. A Valco injectorequipped with a 100-pL sample loop was used. The sample loop was thoroughly flushed by rinsingwith 1 mL of solvent followed by 1 mL of fuel sample. All fuel samples were injected neat. Aguard column was used as a matter of course.
A Jeol FX-200 nuclear magnetic resonance spectrometer equipped with an Oxford 4.7-Tsuperconducting solenoid magnet (54mm bore) was used to obtain 1H spectra at 199.50 MHz. Aflow cell designed for quantitative work was used for all analysis. 17 A flow probe was designedspecifically for this type of analysis. 18
A TRS-80 Model I computer was used. A floppy disk system was used for data storage. Eachdiskette had sufficient storage for 58 (1024 point) LC-AH NMR spectra. The average compositionequations were incorporated in a BASIC program.
Aromaticity was measured from 13C spectra obtained at 50 MHz. To reduce 13C spin-latticerelaxation times for aromaticity measurements, tris (acetyl-acetonato) chromium (III), Cr(acac) 3,was added to each sample. Gated decoupling was for NOE suppression. To further ensurequantitative 13C spectra, long pulse delays were also used. All 13C spectra were run underconventional (spinning) conditions in 10-mm sample tubes.
PROCEDURES
A series of model compounds, designed to resemble typical components of diesel fuels, were madefrom reagent grade chemicals and were analyzed. An example of a model compound used isprepared by mixing 13.29g n-butyl-benzene, 18.47g n-petane, 10.16g m-xylene, 13.07g tetralin,95.70g n-nonane, 56.20g hexadecane, 200.40g isooctane, 43.65g n-hexane, 85.67g dodecane, and12.80g naphthalene. Also, 109 middle distillate fuel samples (77 DF-2, 18 JP-8, and 14 JP-5 fuels)which were supplied by Belvoir Fuels and Lubricants Research Facility at Southwest ResearchInstitute were analyzed. All samples were subjected to on-line LC-1 H NMR analysis withoutpretreatment.
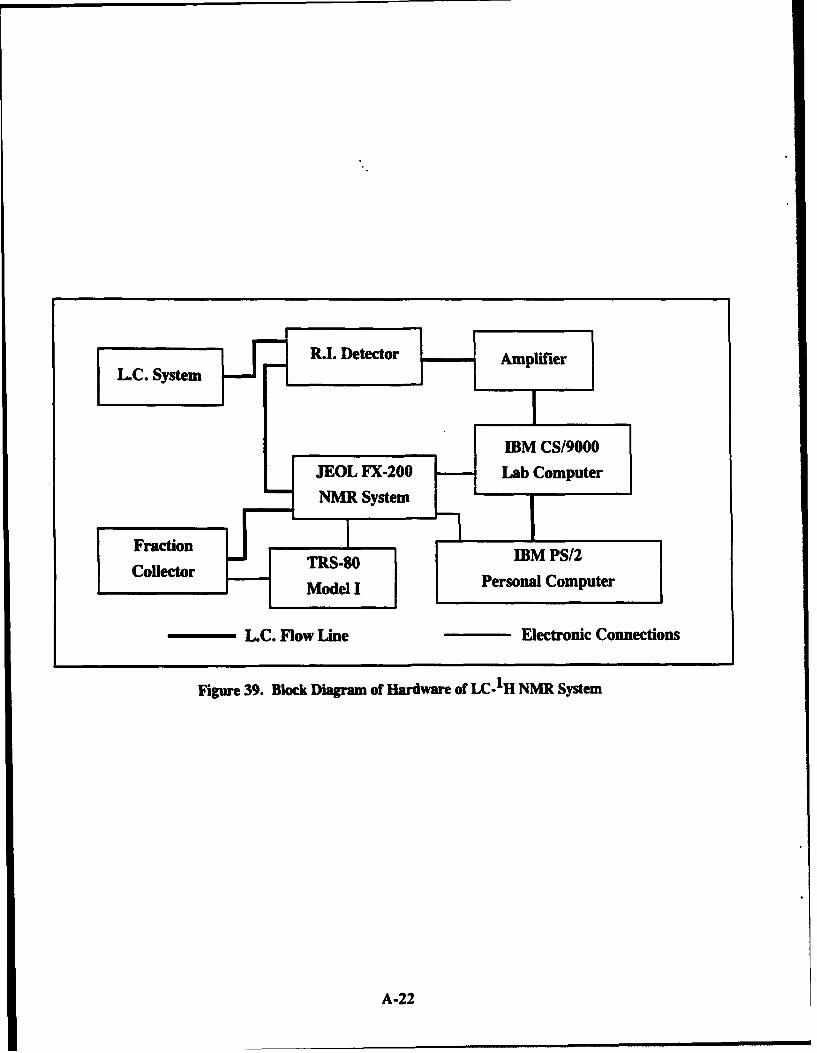
Figures 39 and 40 show block diagrams of the hardware and software of the LC-1H NMR system.In the LC-1H NMR approach, 1001L samples, model/pure compounds and neat fuels, were injectedon a semi-prep scale normal phase chromatographic column where the samples were separated intoalkane, moncyclic, and dicyclic chemical classes. These components passed through the refractiveindex detector. Then, the chromatographic eluent flowed directly into the superconducting NMR
16

magnet where 1H NMR spectra were obtained on the flowing eluent stream. These 1H NMRspectra were then integrated. Examples of LC and IH NMR spectra are shown in Figures 41 and 42.The approximate experimental time to obtain the LC-1H NMR data was 20 to 30 minutes. From theIH NMR, the data went to the computer for analysis. The LC-AH NMR data was transferred via an
RS-232 serial transfer line to an IBM PS/2. Model 60 personal computer where the averagestructural composition data, representative of the average of all chemical structures found in eachchromatographic fraction, was calculated.
The off-line IH NMR data was integrated and files containing average structure information weregenerated. These average molecular structure files were then compared to a set of files whichcontained the physical properties of each fuel determined by ASTM methods. These comparisonswere made in order to establish possible correlations. These correlations between the averagemolecular structure data and the physical properties of the fuels were analogous to the groupproperty predictions because the average molecular structure data provided by the LC-1H NMR wasa quantitative representation of the chemical groups present in the fuels.
The actual correlations were determined by multiple regression analysis of 13 LC-1H NMR derivedparameters and the physical properties of the fuels. The 13 LC-H NMR derived parameterscharacterized the chemical structure groups (Figure 43) present in the alkane, monocyclic, anddicycic chromatographic fractions of the fuel. The multiple regression analysis provided the 14mixing coefficients shown as b0 - b13 in Equation 1 (Figure 4). Note: The mixing coefficients werethe same for all the fuels when determining the same property, but not the same when determiningdifferent physical properties. This was the overall form for the equation produced by the multipleregression analysis. (A glossary of terms used in this equation is shown in Figure 1).
After regression coefficients were calculated, the resulting equation was for the calculation of thepredicted fuel property. This equation consisted of the 13 terms derived from LC-AH NMR data andthe b0 term. Actually, each of these 13 LC- IH NMR terms was a product of the following threeindividual terms:
* The average molecular structure group contribution (e.g., mC*UN)
" The mixing coefficient obtained in the multiple regression analysis (e.g., b4)
" The fraction of total carbon contained in the respective chemical class (e.g., mfc).
For example, if 30% of the total carbon in the fuel sample was contained in monocyclic aromaticmolecules and, on the average, each monocycic aromatic ring was mono substituted (mC*uN = 5),
the product for the mC*uN term would be (0.3 x 5 x b4). In other words, using this approach: the b0
terms defined a base value from which the individual molecular structures of a given fuel eitherincreased or decreased the value for the physical property of the fuel. These molecular structures,
17

combining with the fraction of total carbon present in each class, defined the unique differencesbetween individual fuels and therefore, dictated the physical properties of the individual fuel.
The value of the expotential n in Equation 1 was selected for a given physical property by thecomputer software. This allowed for the prediction of either the true fuel property or the reciprocalof the fuel property. For example, in predicting the initial boiling point, a value of n = -1 wasselected and the inverse of the initial boiling point was actually predicted. The correlation was thenperformed, resulting in the inverted predicted initial boiling point. This value was then inverted todetermine the true predicted initial boiling point, in *C. Table 3 summarized those propertiespredicted as an inverse function, where n = -1, and those which were predicted as a linear function,where n = 1.
SECTION V. CONCLUSIONS
The objective of this research was to develop a methodology to predict middle distillate fuelproperties based on a single analytical technique (LC-1H NMR). It resulted in the development of a"group property" approach to predict 17 physical properties of middle distillate fuels, i.e., DF-2,JP-8, and JP-5, from experimentally derived LC-1H NMR data. In this technique, the fuel wasseparated into chemical classes and the average molecular structure for each class was calculated.Predictive equations based on these average molecular structures were developed to predict physicalproperties of the fuel samples. The physical properties which can be determined by this techniqueare cetane number (ASTM D613), cetane index (ASTM D976), density (ASTM D1298), specificgravity (ASTM D1298), initial, 10%, 50%, 90%, and end boiling points (ASTM D86), pour point(ASTM D97), flash point (ASTM D93), cloud point (ASTM D2500), viscosity (ASTM D445),filterability (ASTM D4539), heat of combustion (ASTM D240), percent aromatics (ASTM D1319),and residual carbon (ASTM D524).
The initial research was conducted with model/pure compounds. The pure compounds were used togain insight regarding structure-physical property relationships. The predictions are based on a"group property" approach. This means that the structure of a molecule is first examined and thensearched for structural features which dictate the physical properties of the compound. Whenlooking at the structural formations present on the molecules, interest was particularly in structureswhich can be determined by NMR analysis.
While examining the pure compounds, a computer data base was generated which containedapproximately 80 compounds belonging to the chemical classes of alkanes, alkenes, cyclohexanes,decalins, monocyclic aromatics, naphtahalenes, and tetralins. While developing a technique topredict physical properties, it was determined that structural features-chain length of molecule,degree of branching, degree of substitution on the ring, etc.-affected physical properties.
18

Then formulas were developed by multiple regression analysis for each compound class to predictthe various physical properties--cetane number and density, etc. Once the prediction formulas weredeveloped, correlation coefficients for predicted versus observed values can be calculated as shownin Table 3.
After completing the work with the pure compounds, research with fuel samples began. A total of109 middle distillate fuels-77 DF-2, 18 JP-8, and 14 JP-5 fuels-were analyzed by theLC-1H NMR technique. The off-line 1H NMR data was integrated and files containing averagestructural information were generated by the computer software. This data was also analyzed by the"group property" approach. This approach was applicable because the average molecular structuredata derived from the LC-IH NMR was a quantitative representation of the chemical groups presentin the fuels. Therefore, correlations derived between the average molecular structure data and thephysical properties of the fuels were analogous to the group properties predictions.
The actual correlations derived in this research were accomplished by a multiple regression analysisof the 13 LC-IH NMR-derived parameters and the physical properties of the fuel. These 13 LC-1HNMR-derived parameters characterize the chemical structure groups in the chromatographicfractions in the fuels. Equation 1 (Figure 4) was the form for the equation produced by multipleregression analysis used to calculate physical properties of fuels. Once this equation was developed,correlation coefficients (shown in Table 3) were determined by the same procedures used todetermine the correlation coefficients of the pure compounds. Finally, the values for physicalproperties calculated by the LC-IH NMR were compared to values determined by ASTM methods.
This research allowed for establishment of a data base of fuel property values which can expand theresearch opportunities beyond predicting physical properties. Because this method has thecapability to distinguish fuel classes, it also allows the direct determination of the effect that eachchemical group has on an individual physical property. A comparison of the values for the productof the average molecular structure parameter, fraction carbon parameter, and mixing coefficientreveals the relative importance of each group type on the property being studied.
The insight gained by examining the chemical factors which determine each property is extremelyuseful in other studies. With the present predictive abilities, it is not only possible to analyze a fuelto determine the physical properties, but it would now be possible to calculate the chemicalstructures necessary to obtain a fuel with a desired set of physical properties. With the basicfundamental understanding of the role of molecular structure on a given physical property, it appearsfeasible to "tailor-make" or "tailor-design" a new fuel with the present computer algorithms. Inother words, it appears possible to be able to reverse the process and calculate the requiredmolecular compositional properties for a fuel based on input physical properties. Therefore, fuelscan be blended to have specific properties ("tailor-made").
19
The techniques developed in this research will allow the determination of physical properties of afuel blend before the two or more fuels have actually been mixed. The physical properties of amixture of fuels may be calculated by calculating the structures present in a theoretical mixture oftwo or more fuel samples. This blending is not limited only to the mixing of fuel samples. A fuelcan be blended with either a pure compound or a feedstock which allows specific tailoring of thephysical properties of the resultant mixture. Using the data base of fuels developed during thisresearch, it would be possible to build a library of available mixing feedstocks. Therefore, through alibrary search, it would be possible to choose the proper feedstock to achieve the desired physicalproperties of a given fuel blend.
The technique developed is not only limited to the fuel class, middle distillate fuels presented in thisreport, but it should be capable of predicting physical properties of fuels such as coal-derived liquidsand fuels boiling in the gasoline range. This would require a sufficient number of these fuels, withtheir physical properties, to be added to the existing data base of 109 fuels. Also by establishing adata base, the opportunity exists to determine the interrelationship between the different fuelproperties. For example, with middle distillate fuels, the changes in densities can be observed while
observing the changes in the cetane numbers of the fuels. As a result, the relationships between allof the independent physical properties can be determined by plotting the values of one physicalproperty against another for a series of fuels.
Finally, the LC-IH NMR technique and the resulting predictive methodology could possibly have animpact in consideration of "alternate fuels" -JP-5, JP-8, etc.-for equipment powered bycompression-ignition engines which specify the use of DF-2. In other words, if engine performancedifficulties are experienced, the LC-1H NMR approach could provide a rapid screening techniquefor determining potential problem areas.
This research demonstrated that the LC-1H NMR approach for measuring various middle distillatefuel properties can be used as an alternative to the ASTM methods of fuel property measurement. Ithas been shown that it is possible to predict 17 physical properties with most of the predictedproperties within the experimental error of the measurements obtained by the ASTM fuel tests.Also the LC-1H NMR approach offers other advantages over the ASTM test methods. From thisresearch, it can be seen that many physical properties can be determined in approximately 1 to 2hours with a fuel sample approximately 3 to 5 milliliters. To determine the same properties byASTM test methods, it would take approximately 50 hours and approximately 1 to 3 liters of fuel.
20

REFERENCES
1. F. J. Pass, C. Csoklish, and K. Wasti, Proceedings of the Seventh World Petroleum Congress,Volume 111, Applications and New Uses, Part 2, p. 129 (1967).
2. Mobil Tech Topics, File No. 2-3, Mobil Research and Development Corporation (Issued by theProduct Promotion Division of Mobil Oil Corporation).
3. "Department of Defense Liquid Hydrocarbon Fuel Policy for Equipment Design, Operation andLogistics Support," Department of Defense Directive Number 4140.43, March 11, 1988.
4. E. Bayer, K. Albert, M. Nieder, E. Groin, and T. Keller, Advances in Chromatography, (1979)
14., p. 525.
5. J. F. Haw, T. E. Glass, and H. C. Dor, Journal of Magnetic Resonance, (1982) 49, p. 22.
6. H. C. Dorn, Analytical Chemistry, (1984), 5, p. 747A.
7. J. F. Haw, T. E. Glass, and H. C. Dorn, Journal of Magnetic Resonance, (1982) 55, p. 22.
8. E. Bayer, K. Albert, M. Nieder, E. Groin, G. Wolff, and M. Rindlisbacher, Analytical Chemistry,(1982) 54, p. 1747.
9. 0. Gulder and B. Glavincevski, Ind. Eng. Chem. Prod. Res. Dev., (1986) 25(2), p. 156.
10. T. H. Defries, D. Indritz, and R. V. Kastrup, Ind, Eng. ReL, (1987) 26(2 , p. 188.
11. H. L. Heino, Thermochemica Acta, (1987) 114(l), p. 125.
12. S.-B. Chen, Ind. Eng. Chem. Prod. Res. Dev., (1986) 213., p. 392.
13. P. H. Kydd, C. J. Nowack, and S. Vining, Pre-Am. Chem. Soc. Div. Pet. Chem., (1987) 32 2, p.545.
14. J. F. Haw, T. E. Glass, D. W. Hausler, E. Motell, and H. C. Dom, Analytcal Chemistry, (1980)
5, p. 1920.
15. J. F. Haw, T. E. Glass, and H. C. Dor, Analytical Chemistry (1981) 51, p. 2327.
16. S. W. Benson, Thermal Kinetics, Wiley, New York, (1968).
17. H. C. Dorn and D. L. Wotten, Analytical Chemistry, (1976) 4, p. 2146.
18. J. F. Haw, T. E. Glass, and H. C. Horn, Analytical Chemistry, (1981) 51, p. 2332.
21
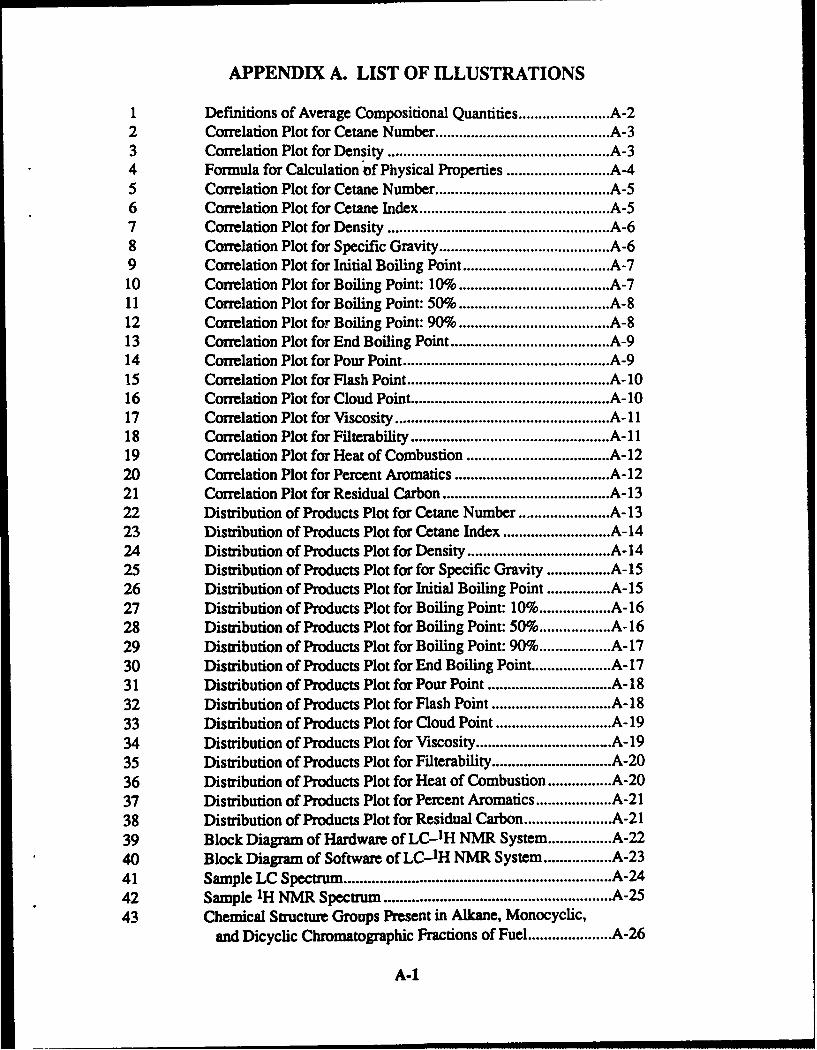
APPENDIX A. LIST OF ILLUSTRATIONS
1 Definitions of Average Compositional Quantities ....................... A-22 Correlation Plot for Cetane Number ............................................ A-33 Correlation Plot for Density ........................................................ A-34 Formula for Calculation of Physical Properties .......................... A-45 Correlation Plot for Cetane Number ............................................ A-56 Correlation Plot for Cetane Index ................................................ A-57 Correlation Plot for Density ........................................................ A-68 Correlation Plot for Specific Gravity ........................................... A-69 Correlation Plot for Initial Boiling Point ..................................... A-710 Correlation Plot for Boiling Point: 10% ...................................... A-711 Correlation Plot for Boiling Point: 50% ...................................... A-812 Correlation Plot for Boiling Point: 90% ...................................... A-813 Correlation Plot for End Boiling Point ........................................ A-914 Correlation Plot for Pour Point .................................................... A-915 Correlation Plot for Flash Point ................................................... A-1016 Correlation Plot for Cloud Point .................................................. A- 1017 Correlation Plot for Viscosity ................................................. A-1118 Correlation Plot for Filterability ............................................ A-1119 Correlation Plot for Heat of Combustion .................................... A-1220 Correlation Plot for Percent Aromatics ....................................... A-1221 Correlation Plot for Residual Carbon .................................... A- 1322 Distribution of Products Plot for Cetane Number ................. A-1323 Distribution of Products Plot for Cetane Index ........................... A- 1424 Distribution of Products Plot for Density .................................... A- 1425 Distribution of Products Plot for for Specific Gravity ........... A- 1526 Distribution of Products Plot for Initial Boiling Point ........... A-1527 Distribution of Products Plot for Boiling Point: 10% .................. A-1628 Distribution of Products Plot for Boiling Point: 50% .................. A-1629 Distribution of Products Plot for Boiling Point: 90% .................. A-1730 Distribution of Products Plot for End Boiling Point. ................... A- 1731 Distribution of Products Plot for Pour Point .......................... A- 1832 Distribution of Products Plot for Flash Point ......................... A-1833 Distribution of Products Plot for Cloud Point ........................ A-1934 Distribution of Products Plot for Viscosity ............................... A-1935 Distribution of Products Plot for Filterability .............................. A-2036 Distribution of Products Plot for Heat of Combustion ................ A-2037 Distribution of Products Plot for Percent Aromatics ................... A-2138 Distribution of Products Plot for Residual Carbon ...................... A-2139 Block Diagram of Hardware of LC- 1 H NMR System ................ A-2240 Block Diagram of Software of LC- 1H NMR System ................. A-2341 Sample LC Spectrum ............................................................. A-2442 Sample 1H NMR Spectrum ......................................................... A-2543 Chemical Structure Groups Present in Alkane, Monocyclic,
and Dicyclic Chromatographic Fractions of Fuel ..................... A-26
A-1
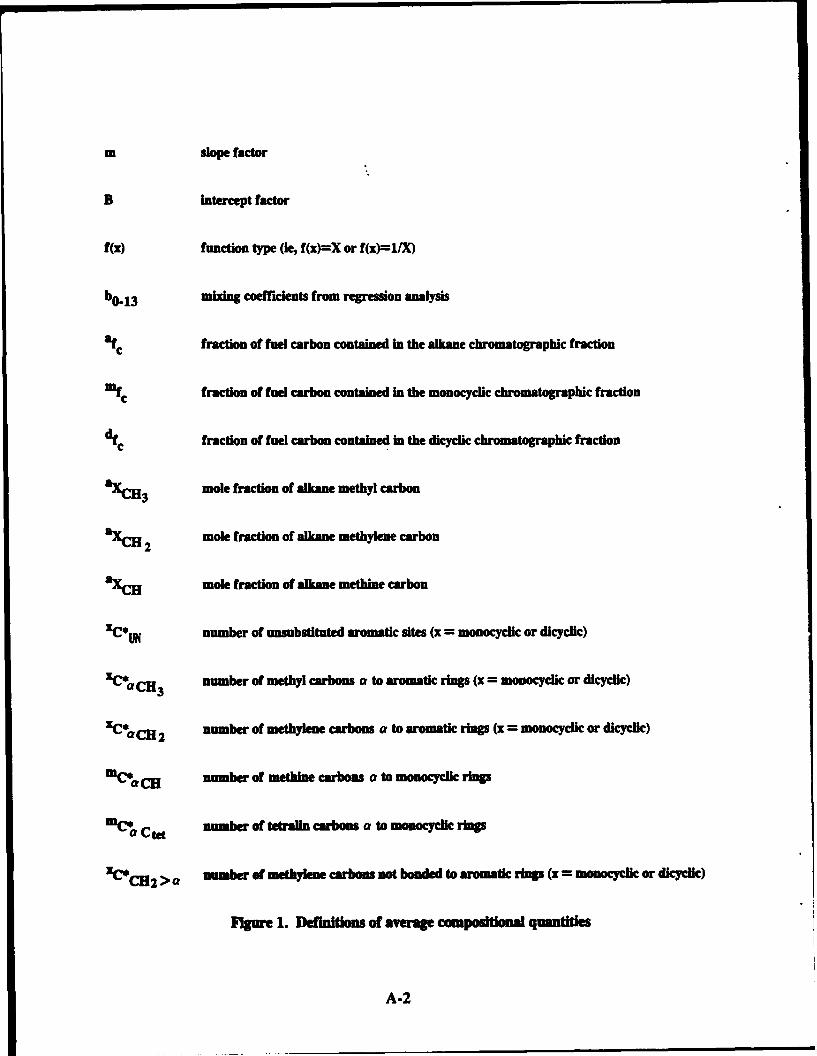
In slope factor
B intercept factor
f(x) function type (ie, f(x)=X or f(x)=1X)
b0-13 mixing coefficients from regression analysis
af€ fraction of fad carbon contained in thealkane chromatographic fraction
Mf€ fraction of fuel carbon contained in the monocyic chromatographic fraction
dfc fraction of fuel carbon contained in the dicyclic chromatographic fraction
aXCH3 mole fraction of lkane methyl carbon
aXCH 2 mole fraction of alkane methylen carbon
akH mole fraction of alkane methine carbon
XC* UNnumber of unsubstituted aromatic sites (x = monocyclic or dicyclic)
XC*a 3 number of methyl carbons a to aromatic rings (x = monocydic or dicyclic)
C.aCH2 number of methylene carbons a to aromatic rings (x = monocyclic or dicyclk)
MCI& C number of methine carbons a to monocycic rings
MC*C number of tetralln carbons a to monocyclic rings
XC CH2 > number of methylene carbons not bond"d to aromatic rings (x = monocyclic or dicycic)
Figure 1. Definitions of average cmpouitional quantities
A-2

110-
85 -
60 - '.3
Obevd tNme roPons-7
•Group Property Cetane
Figure 2. Correlation Plot for Cetane Number
1.1-
1.00-
.912 -
U. "02'
.818- %,.
.724 -
Number of Points = 63Correlation Coeff = 0 .9
A3 I I I13 .724 .818 .912 1.88 1 .1
Observed ty
•Avg Structure - DensityFiure 3. Correlation Plot for Density
A-3

A
+aca
+1
A
A Vq
+
U +
U . t- ?3aH+ + U
++
+
+
A.4

so
49
48
47
46Z 45
IV 4443) 43
42
41
39
38
37 -
36 I I I I I36 38 40 42 44 46 48 50
Observed Cetane Number
Figure 5. Correlation Plot for Cetane Number
60
58
52S6 -
48
42 •
40-
38
3634L,
34 38 42 46 50 54 S8
Observed Cetane Index
Fijgure 6. Correlation Plot for Cetane Index
A-5

0.90.89-
0.88
0.87-
S0.86-
0.85-I0.84-0.83-
~0.82-
.;0.81-
~30.80.79-
0.78-
0.77-
0.76 1 1 1 1 1 10.76 0.78 0.8 0.82 0.84 0.86 0.88 0.9
Observed Density (KgIL)m JP.5 0 JP-8 * DF-2
Figure 7. Correlation Plot for Density
0.89
0.88
S0.87
*'0.86-a a aa
0.85
u0.84
.30.83
0.82
0.811I0.81 0.83 0.85 0.87 0.89
Observed Specific Gravity (60/60F)
Figure 8. Correlation Plot for Specific Gravity
A-6

240
230
V 220
1210 -
200 -
~190
*-180 4
170-
160 -
15o
140 , I I L I140 160 ISO 200 220 240
Observed Initial Boiling Point (deg .C)a JP.5 0 JP-8 * DF-2
Figure 9. Correlation Plot for Initial Boiling Point
270
260 - a
250
230
220 - a a a
210- m
200
190 •
1NISO -
170 -
160 I I I I160 180 200 220 240 260
Observed 10% Boiling Point (-C)
Figre 10. Correlation Plot for Boiling Point- 10%
A-7

320
310-ur
300-
280-26270-agp
~260
250-W)240- s
230
.5220
10210 230 250 270 290 310
Observed 5O% Boiling Point ('C)
Figure 11. Correlation Plot for Boiling Point: 50%
420
400
380 -
~360 -a a
*~340-a
S320-a
300
~280-
~260-a
220-a
200 -1-200 240 280 320 360 400
Observed 90% Boiling Point (*C)
Figure 12. Correlation Plot for Boiling Point-~ 90%
A-8

460
440-
420-
400
380 I
1360o40 2
320 -
300
80 -
240
220 I I I I I220 260 300 340 380 420 460
Observed End Boiling Point (-C)a*JP.5 9JP-8 #DF.2
Figure 13. Correlation Plot for End Boiling Point
20m
1A-9
-10 N
was aUaU
AA-

100
90.
Au 70 -w sU
160 %
30 s0 70 90Observed Flash Point (*C)
Figure 15. Correlation Plot for Flash Point
20
10-
0 a
-A-1O

5
4-
3- I n
2-
1'
0 I I
0 2 4
Observed Viscosity (cSt)Figure 17. Correlation Plot for Viscosity
110
100-
90 U
so
70
=60-so-" "0-
50-'U 30 " 's
1*; 20-
10-
-- U0 •
.10U-20r I I I I I I I I I
-20 0 20 40 60 80 100
Observed Filterability
Figure 18. Correlation Plot for Filterability
A-11

43.3
~432
43.1-
j43-
42.9 -
142.8-
42.7 -
Q 42.6
42.5I
42.5 42.7 42.9 43.1 43.3
Observed Heat of Combustion (MJ/Kg)
Figure 19. Correlation Plot for Heat of Combustion
444240
_ 38-
36 -34-
, 28 - •m
26 •
2
22 1
16 -14 mm
121I14 is 22 26 30 34 38 42
Observed Percent Aromatics (Vol %)
Figure 20. Correlation Plot for Percent Aromatics
A-12
3
2.S
2
I. Mai~1.5
0.5.l
-0.5 0.5 1.5 2.
Observed Residual Carbon (Vol %)
Figure 21. Correlation Plot for Residual Carbon
40
.30
* 10
0
----
UI
-20 -- "---
0 1 2 3 4 5 6 7 8 9 10 ll 12 13
Term NCber
Minimum Average E Maximum
F igu re 22. Distribution of Pot lot for Cetane Number
A-13
.. . ..50 mm mmmmmmmm mm

s0
40
' 30-
S 20 ,
10
a -20
0 1 2 3 4 5 6 7 8 9 10 11 12 13Term Number
jMinimum riAverage *MaximumFigure 23. Distribution of Products Plot for Cetane Index
1.21.1
1
0.9
' 0.8'U 0.7
0- 0.6S 0.5
0.3
0.10
-0.1-0.2
0 1 2 3 4 5 6 7 8 9 10 11 12 13Term Number
EMinimum @P Average UMaximumFigur 24. Distribution of Products Plot for Density
A-14

1
0.8
0.7
• " 0.6
0.5
0.4
0.2
~M 0.1
0
-0.1
-0.20 1 2 3 4 5 6 7 8 9 10 11 12 13
Term Number
= Minimum 'd Average U Maximum
Figure 25. Distribution of Products Plot for Specific Gravity
0.009
0.008 -
0.007
0.006
4 0.005.oo
S0.004
0 0.003
0.002
0.00:
.0.002
-0.0030 1 2 3 4 5 6 7 8 9 10 11 12 13
Term Number= Minimum %I Average U Maximum
Figure 26. Distribution of Products Plot for Initial Boiling Point
A-I$

0.003
0.0025
0.002
0.0015
* 0.001.66-0.0005
0LS
. 0.0005 ---
-0.012
0 1 2 3 4 5 6 7 8 9 10 11 12 13Term Number
= Minimum 7A Average U Maximum
Figure 27. Distribution of Products Plot for Boiling Point: 10%
0.0025
0.002 -
L 0-o0s . _V
0.00 -
0}! -op a-EVA.
-0.0015
.0.001
-'0.0005
0 1 2 3 4 $ 6 7 8 9 10 11 12 13Term Number
minimum F, Average nMaximum
F'ire 28. Distribution of Products Plot for Boiling Point. 50%
A-16

0.003
0.0025 -
0.002-
L, o.ools -~0.001
6 0.00-
0"-0.0005 -
.0.001
-0.0015I t I I , I , I , I , , I I I I I0 1 2 3 4 5 6 7 8 9 10 11 12 13
Term Number
" Minimum P Average m Maximum
Figure 29. Distribution of Products Plot for Boiling Point: 90%
0.003
0.0025 -
0.0024I..
0.0015 -
0.001-
U0.0005-
0
-0.0005 m
.0.001 -
0 1 2 3 4 5 6 7 8 9 10 11 12 13
Term Number
E Minimum Average m aximum
Figure 30. Distribution of Products Plot for End Boiling Point
A-17
0.0090.008 -
0.007 -0.0060.005
. 0.0040.003
:0.0020.001-
0 rm
--0.001.ooo 0 ____ -
A
-0.002 - m -
-0.006
0 1 2 3 4 5 6 7 8 9 10 11 12 13Term Number
Minimum 0 Average i Maximum
Figure 31. Distribution of Products Plot for Pour Point
80
70
60so
40
. 30
20 2
.10- -- I
0 1 2 3 4 5 9 7 8 9 10 11 12 13Term Number
5 Minimum Average 3 Maximum
Figure 32. Distribution of Products Plot for Flash Point
A-18
70
6050
40
20
* 10
60-lo - w -
-20 --
-30
0 1 2 3 4 5 6 7 8 9 10 11 12 13Term Number
-- Minimum P Average 3 Maximum
Figure 33. Distribution of Products Plot for Cloud Point
109-8,
7
O 6 -L 5V 4
3S2
1
--
0 1 2 3 4 5 6 7 8 9 10 11 12 13Term Number
Minimum Average 3 Maximum
Figure 34. Distribution of Products Plot for Viscosity
A-19

600
500
L 300
* 200
4
.a100-
* 0
.100- A
2-
mmm -
m -
0 1 2 3 4 5 6 7 8 9 10 11 12 13Term Number
S Minimum Average *MaximumFigure 35. Distribution of Products Plot for Filterability
40
35
~.30-L
2S5
?20
X 10
I m
aw
5
0
0 1 2 3 4 5 6 7 8 9 10 11 12 13
Term Number
Minimum I Average U Maximum
Figure 36. Distribution of Products Plot for Heat of Combustion
A-20
18i16
14-A-1 12-
* 10
* 642A
0 oM-2-4-
-6 A
.10 -
-12 1 1 1 1 1 1 1 1 1 1 10 1 2 3 4 5 6 7 8 9 10 11 12 13
Term Number
- Minimum V Average U Madmum
Figure 37. Distribution of Products Plot for Percent Aromatics
6
5
4
2 --
I I I I , II I I, I , I, I , I , I . I . I
0 1 2 3 4 5 6 7 8 9 10 11 12 13
Term Number
Minimum O Average Maximum
Figure 38. Distributim of Products Plot for Residual Carbon
A.21
-~~~JO L.C.0 Flow LinemleterCnetos
Figure 39. Block Diagram of Hardware Of LO-H NMR System
A-22

Chromatographic LC-NMR Transfer X11C Software Software Software20
Data
BasePrpryC-M
LManagerI ilsO fe
Figure 40. Block Diaram of Software of LC-1H NMR System
A-23

F8.50 01/13/86
R
R R
Column: PACFlow Ratio: 1.92Scan Tune: 1.364Run ime: 45
0 4.5 9 13.5 18 22.5 27 31.5 36 40.5 45Time (Minutes)
Figure 41. Sample LC Spectrum
A-24

LC/1H NMR PROFILE FOR DFM (81-6)FILE NO. ALIPHATIC F'rrS RELATIVEX GAIN
2 A L -13 04 1
26 27 2
S A I\29
100
3 2 PPM 1 0
MONOCYCUIC AROMATIC FIES131
141
161
171
20 2
212
DICYCLIC AROMATIC FILES
27 111L A
28----- -
29 2
3028 6 4 2 0
PPMFigure 42. Sample 1H NMR Spectrum
A-25

a2
EE
-A-2

APPENDIX B.EXAMPLE OF DATA COLLECTED FOR EACH FUEL SAMPLE
Fuel F14
Source: Army
static 13C Aromaticity 1H Aromaticity
NMR
Data FX.200 0.197 FX.200 0.067
LC-1 NMR Quantitative Data:
Average Structural Parameters for Monocyclic Aromatic Fraction:
m In m m In I m In mMW mADSun C sub C aCH3 aCH2 C aCH Ca tet *C CH2> a *CH3> a
3.96 2.94 1.38 0.85 0.26 0.45 6.87 1.37 239.89 2.94
Average Structural Parameters for Dicydic Aromatic Fraction:
C d C d C d *C d *C d C d *C d *C d dMW dADS
un sub aCH3 aCH2 aCHI BH CH2>a CH3>a
6.33 1.77 1.50 0.27 0.00 2.00 0.09 .. 27 167.62 1.77
Average Structural Parameters for Fluorene Fraction:
f f *f f f * f fMW fADSn sub C C2 aCa BH C 2> CH3>
5.12 2.88 2.42 1.46 0.00 4.00 0.04 0.46 22538 2.88
Average Structural Parameters for Phenanthrene Fraction:
* P * P* P P P *C P* P * P PMW PADSUn sub aCH3 aCH2 aCi BH C MC2>a C Hi>a
7.93 2.07 1$7 0.50 0.00 4.00 0.65 0.50 233.54 2.07
B-I

Fuel: F14Source: Army
Absolute Number of Moles of Carbon and Fractional Aromaticity Data
CAr total ciotal fa Ftotal
Alkanes 0.0037213 0.604
Monocyclic 0.0005866 0.0016355 0.132 0.265Aromatics
Dicyclic 0.00005690 0.0007205 0.058 0.117Aromatics
Fluorenes 0.0000259 0.0000401 0.003 0.007
Phenanthrenes 0.0000358 0.0000474 0.004 0.008
fa = 0.197
Comments:
Other Physical Data
Predicted Smoke Point:Predicted Freezing Point:
Aromaticity.<Volume % >
Elemental Analysis: C H H (by NMR)
B-2

DISTRIBUTION FOR REPORT NO. 2478
DEPARTMENT OF DEFENSE 1 CommanderChemical Research R&D Center
Director, Technical Information ATTN: SMCCR-SPS (Tech Library)
Defense Advanced Research Projects Aberdeen Proving Ground, MD 21005Agency1400 Wilson Blvd. 1 Commander
Arlington, VA 22209 US Army Aberdeen Proving GroundATTN: STEAP-MT-U (GE Branch)
Director Aberdeen Proving Ground, MD 21005Defense Nuclear Agency 1 DirectorAITN: T1TL DrcoWashington, DC 20305 US Army Materiel Systems Analysis AgencyATN: AMXSY-MP
2 Defense Technical Information Center Aberdeen Proving Ground, MD 21005-5071
Cameron StationAITN: DTIC-FDAC 1 DirectorAlexandria, VA 22304-6145 US Ballistics Research Laboratory
ATTN: AMXBR-OD-ST (STINFO)
DEPARTMENT OF THE ARMY Aberdeen Proving Ground, MD 21005-5066
HQDA (DAMA-AOA-M) 1 DirectorWashington, DC 20310 US Army Engineer Waterways Experiment
Station
HQDA (DALO-TSM) ATrN: Chief, Library Branch
Washington, DC 20310 Technical Information CenterVicksburg, MS 39180
HQDA (DAEN-RDL)Washington, DC 20314 1 Cor-'manderUS Army Armament Research &
1 HQDA (DAEN-MPE-T) Development Command
Washington, DC 20314 ATTN: SMCAR-TSSDover, NJ 07801-5001
CommanderUS Army Missile Research & Development 1 CormpavderCommand US Army Troop Support & AviationATIN: AMSMI-PR Materiel Readiness CommandRedstone Arsenal, AL 35809 ATTN: DRSTS-MES (1)4300 Goodfellow Blvd.
1 Director St. Louis, MO 63120
Army Materials and Mechanics ResearchCenter 2 DirectorATN: AMXMR-RL Technical Library Petrol & Fld Svc DeptWatertown, MA 02172-0001 US Army Quartermaster SchoolFort Lee, VA 23801
Distribution-1

US Army Tank Automotive Command 1 HQDAATTN: DRSTA-TSL ODCSLOGWarren, MI 48090 DALO-TSE
Room 1E588, PentagonUS Army Laboratory Command Washington, DC 20310-0561AT7N: M. Levy SLCMT-MNMaterials Technology Laboratory 1 Plastics Technical Evaluation CenterWatertown, MA 02172-0001 ARRADCOM, Bldg 3401
Dover, NJ 07801US Army Laboratory CommandAITN: J. Wells SLCMT-MCZ I CommandantMaterials Technology Laboratory US Army Engineer SchoolWatertown, MA 02172-0001 ATZA-CDD
Fort Belvoir, VA 22060CommanderUS Army Electronics Research & 1 US Army AMCCOM
Development Command ATTN: Joseph MenkeATN: DELSD-L 1032 N. ThornwoodFort Monmouth, NJ 07703-5301 Davenport, IA 52804
1 President 1 CommanderUS Army Aviation Test Board Headquarters, 39th Engineer Bn (Cbt)A7TN: STEBG-PO Fort Devens, MA 01433Fort Rucker, AL 36360
1President
I US Army Aviation School Library US Army Airborne, Communications &PO Drawer 0 ElectronicsFort Rucker, AL 36360 ATTN: STEBF-ABTD
Fort Bragg, NC 28307HQ 193D Infantry Brigade (Panama)ATTN: AFZU-FE 1 PresidentAPO Miami 34004 US Army Armor and Engineer Board
ATN: ATZK-AE-PD-E2 Special Forces Detachment, Europe Fort Knox, KY 40121-5470
ATN: PBOAPO New York 09050 1 Director
ATrN: STSTO-TPP2 Engineer Representative Tobyhanna Army Depot
USA Research & Standardization Group Tobyhanna, PA 18466-5097(Europe)
Box 65 1 Commander and DirectorFPO 09510 USA FESA
ATTN: FESA-TSCommander Fort Belvoir, VA 22060Rock Island ArsenalAMlN: SARRI-LPLRock Island, IL 61299-7300
Distribution-2

1 HQ, USAEUR & Seventh Army 1 US Naval Oceanographic OfficeDeputy Chief of Staff, Engineer Navy Library/NSTL StationATTN: AEAEN-MT-P Bay St. Louis, MO 39522APO New York 09403
1 Library (Code L08A)1 Director Civil Engineering Laboratory
US Army TRADOC Naval Construction Battalion CenterSystems Analysis Activity Port Hueneme, CA 93043A7TN: ATAA-SL (Tech Library)White Sands Missile Range, NM 88002 1 Director
Earth Physics ProgramBELVOIR RD&E CENTER Code 464
Office of Naval ResearchCirculate Arlington, VA 222171 Commander STRBE-Z
Deputy Commander STRBE-ZD 1 Naval Training Equipment CenterTechnical Director STRBE-ZT ATTN: Technical LibraryAssoc Tech Dir (E&A) STRBE-ZTE Orlando, FL 32813Assoc Tech Dir (R&D) STRBE-ZTRExecutive Officer STRBE-ZX 3 Naval Sea Systems CommandSergeant Major STRBE-ZM ATTN: P. Schneider PMS377J1Advanced Systems Concept Dir STRBE-H Wasington, DC 20362-5101Program Planning Div STRBE-HPForeign Intelligence Div STRBE-HF 1 Naval Air Development CenterSystems and Concepts Div STRBE-HC ATTN: V. S. Agarwala, Code 6062
10 STRBE-V Warminster, PA 1897420 STRBE-VF3 ANQSK-BPG-G 3 David W. Taylor Naval Research Center3 Security Ofc (for liaison officers) STRBE-S ATIN: A. G. S. Morton2 Tech Library STRBE-BT Code 28131 Public Affairs Ofc STRBE-I Annapolis, MD 214021 Ofc of Chief Counsel STRBE-L
DEPARTMENT OF THE AIR FORCEDEPARTMENT OF THE NAVY
1 HQ USAF/RDPT1 Director ATTN: Commander
Physics Program (421) Washington, DC 20330Office of Naval ResearchArlington, VA 22217 1 HQ USAF/PREEU
Chief, Utilities Branch2 Commander Washington, DC 20330
Naval Facilities Engineering CommandDepartment of the Navy 1 HQ Air Force Engineering & Services CtrATN: Code 032-B Technical Library FL7050
062 Tyndall AFB, FL 32403200 Stovall StreetAlexandria, VA 22332
Distribution-3

US Air ForceWarner Robins Air Logistics CenterWR-ALC/MMEMWarner-Robins AFB, GA 31098
Chief, Lubrications BranchFuels & Lubrications DivATTN: AFWAI.POSLWright-Patterson AFB, OH 45433
Distribution.4