e-book infographic with figures of the dutch e-book market as per q1 2016
TRANSCRIPT
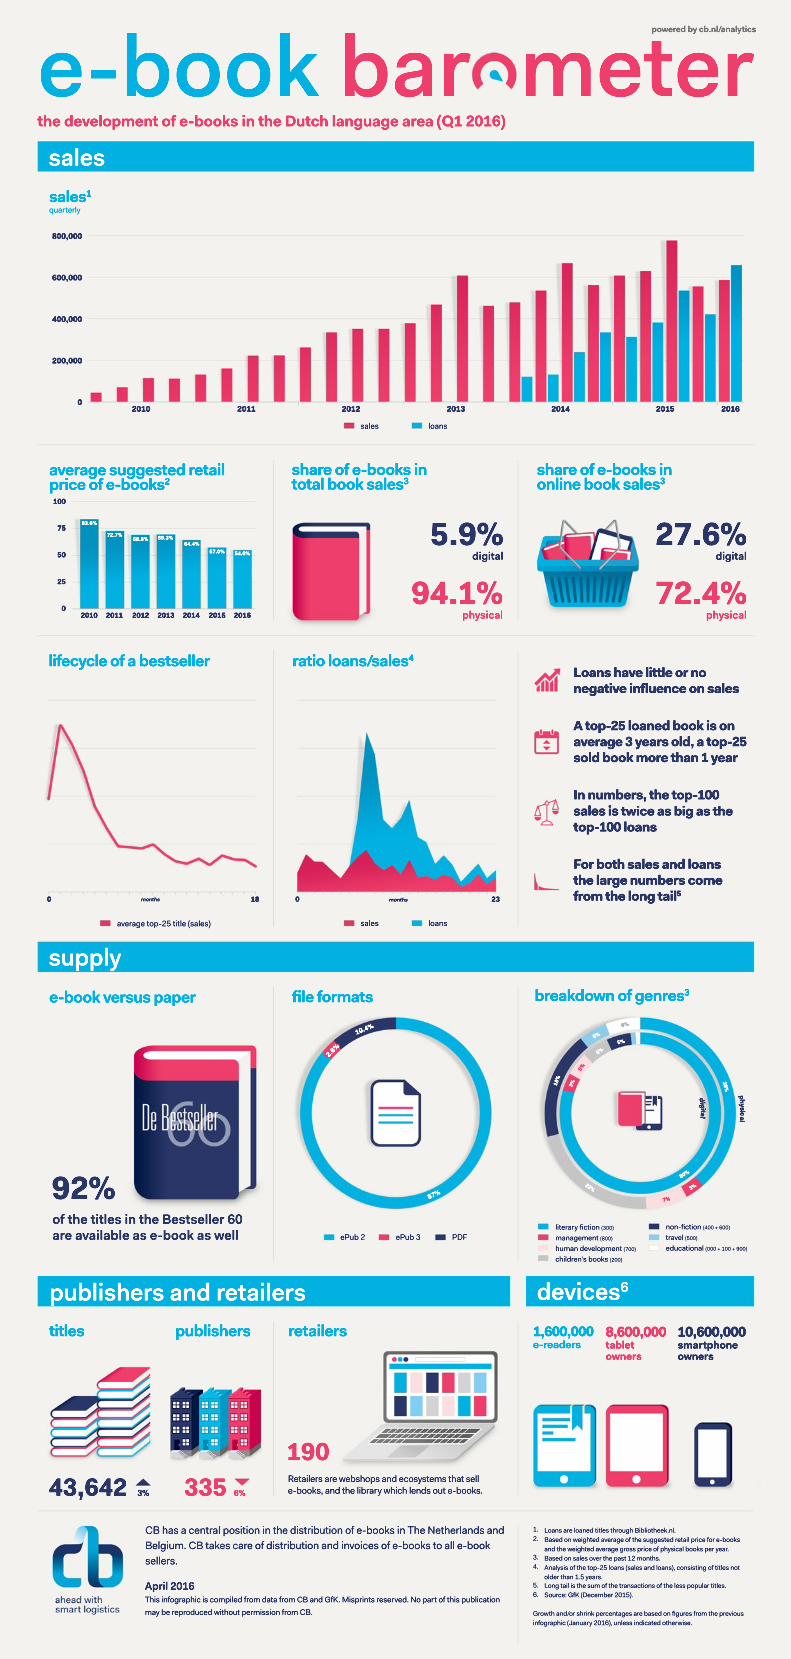
Loans are loaned titles through Bibliotheek.nl. Based on weighted average of the suggested retail price for e-booksand the weighted average gross price of physical books per year. Based on sales over the past 12 months.Analysis of the top-25 loans (sales and loans), consisting of titles notolder than 1.5 years.LLong tail is the sum of the transactions of the less popular titles.Source: GfK (December 2015).
1.2.
3.4.
5.6.
GGrowth and/or shrink percentages are based on gures from the previousinfographic (January 2016), unless indicated otherwise.
April 2016This infographic is compiled from data from CB and GfK. Misprints reserved. No part of this publicationmay be reproduced without permission from CB.
CB has a central position in the distribution of e-books in The Netherlands andBelgium. CB takes care of distribution and invoices of e-books to all e-booksellers.
10,600,000smartphoneowners
8,600,000tabletowners
1,600,000e-readers
Retailers are webshops and ecosystems that sell e-books, and the library which lends out e-books.
190
retailers
6%335
publishers
3%43,642
titles
devices6publishers and retailers
non-ction (400 + 600)travel (500)educational (000 + 100 + 900)
literary ction (300)management (800)human development (700)children’s books (200)
80%
3%5%
5%
5%
39%
3%
7%
22%
18%
5%
6%
digital
physi cal
breakdown of genres3
PDFePub 3ePub 2
87%
2.6%
10.4%
le formats
of the titles in the Bestseller 60are available as e-book as well
92%
e-book versus paper
supply
Loans have little or nonegative inuence on sales
A top-25 loaned book is onaverage 3 years old, a top-25sold book more than 1 year
In numbers, the top-100sales is sales is twice as big as the top-100 loans
For both sales and loans the large numbers comefrom the long tail5
loanssales
230
ratio loans/sales4
average top-25 title (sales)
180
lifecycle of a bestseller
72.4%physical
27.6%digital
share of e-books inonline book sales3
94.1%physical
5.9%digital
share of e-books intotal book sales3
2016201520142013201220112010
100
75
50
25
0
83.6%
72.7%68.8% 69.3%
64.4%57.0% 54.6%
average suggested retailprice of e-books2
loanssales
2016201520142013201220112010
800,000
600,000
400,000
200,000
0
sales1quarterly
salesthe development of e-books in the Dutch language area (Q1 2016)
e-book barometerpowered by cb.nl/analytics