dynamics of urban mobility
TRANSCRIPT
WP-2010-023
Dynamics of Urban Mobility: A Comparative analysis of megacities ofIndia
B. Sudhakara Reddy and P. Balachandra
Indira Gandhi Institute of Development Research, MumbaiDecember 2010
http://www.igidr.ac.in/pdf/publication/WP-2010-023.pdf
Dynamics of Urban Mobility: A Comparative analysis of megacities ofIndia
B. Sudhakara Reddy and P. BalachandraIndira Gandhi Institute of Development Research (IGIDR)
General Arun Kumar Vaidya Marg Goregaon (E), Mumbai- 400065, INDIA
Email (corresponding author): [email protected]
Abstract
This paper aims to analyse urban mobility patterns and consequent impacts on energy and environment
in India. We investigate the quantity of energy use in 23 metropolitan regions for the period 1981–2005
and present empirical results obtained using national and urban data sets. It explores the underlying
relationship among three dependent variables—energy intensity, type of mode and passenger km.
Patterns of energy consumption and CO2 emissions in private and public transport are examined. Some
policy recommendations are outlined to reduce urban transport energy use and greenhouse gases and
provide suggestions to achieve sustainable urban mobility.
Keywords:
Energy, Environment, Intensity, Transport, Urban
JEL Code:
Q4, L94, L95, L98
Acknowledgements:
i
WP-2010-023
Dynamics of Urban Mobility: A Comparative Analysis of Megacities of India
B. Sudhakara Reddy and P. Balachandra
Indira Gandhi Institute of Development Research, Mumbai
December 2010 http://www.igidr.ac.in/pdf/publication/WP-2010-023.pdf
Dynamics of Urban Mobility: A Comparative Analysis of Megacities of India B. Sudhakara Reddy and P. Balachandra
1 Introduction At the beginning of the 21st century, the world is facing many challenges and urbanization is one of them which is owing to the concentration of population in dense urban regions. As the cities expand, there is a consequential expansion of transportation needs. Urbanisation brings with it increased affluence which results in increased mobility. There is daily mobility of people from their homes to the work place, to accomplish domestic needs and undertake journeys for social needs such as visiting friends and shopping. Many of the cities can be defined as ‘automobile dependent’ with established high rates of automobile ownership and in particular private ownership. In developing countries where urbanisation rates are increasing, the combined effect of high rapid growth coupled with increased mobility and large increases in population is a cause for concern (Kenworthy, 2008). The automobile has truly revolutionised society over the past century bringing benefits of increased personal mobility and access to the broadest range of goods and services. However, it has many negative impacts including environmental damage caused by emissions of pollutants. Increased automobile usage also creates substantial externalities in the form of congestion, increased traffic noise, accidents and loss of urban environmental amenity (Banister 2002). In addition, it has social and distributional consequences such as increased usage of health facilities or school enrolment and providing more employment opportunities. Automobile usage has a significant impact on the economy since transportation accounts for the largest consumption of world’s petroleum. About half of the world’s petroleum is used by transportation, making it central to international concerns over energy security and political stability in energy-producing as well as consuming regions. Motorisation in urban India is growing faster than the population; automobile ownership growth rates are of the order of 15–20% per annum in most cities (Indiastat.com, 2008). As the urban population undertakes its daily mobility by a variety of transportation modes (local train, bus, car, etc.), the individual’s modal choice is governed by a complex set of factors, viz., physical, human, economic and social. The automobile seems to be the dominant transportation mode-choice with at least 85% of the total share of all journey-to-the office (Schafer, 1998). Even though public transport offers a competitive service, its market-share is constantly declining. In fact, there is a transition from public transit-orientated mobility towards private transport one (Pucher, et al. 2005). Motorcycles in particular, as well as cars, are burgeoning as major forms of personal mobility, while walking and bicycling, once very prominent in cities, have taken a back seat. The increased use of private means of transportation is a major factor directly linked to energy use and environmental quality. In India, the share of public transportation peaks among people living in the megapolis regions, where the supply networks and systems are appropriate (public transportation here includes trips done by bus and train) (World Bank, 2002). Post-1980, the use of motorcycle became an important factor in Indian metropolitan cities and, in particular, in
medium-sized ones. The expanding use of two wheelers (2W) in these cities is due to poor public transportation facilities. The younger population (20–35-age group), which accounts for nearly 60% of the population, use to rely mostly on 2-wheelers avoiding public transportation (IGIDR, 2008). Car driving is increasingly becoming dominating mode of transport in major cities. The dilemma policy makers are facing is: whether the policies should focus on accommodating growing levels of personal transport because driving more is apparently what the public wants or should the policies focus on limiting driving so as to reduce environmental and other costs? One obvious approach is to improve public transport facilities. Another is to improve quality of transit, bicycling, and walking, by enhancing accessibility and reducing mobility. The present paper tries to address these issues by analyzing the transport system in 23 million plus cities in India by systematic comparisons. The data consists of megapolis like Mumbai with 15 million population and a good public transport system, both road and railway-based, and an emerging one like Bangalore without a well-developed public transport even though road-based public transport has made some progress (Anon, 2008 and Sudhakara Reddy, 2000). Thus, major changes in the mode of use, which occurred during the period of investigation, 1980 to 2005 are discussed here. The objective of this study is to develop a set of mobility indicators (such as modal split, vehicle kilometers (VKM), passenger kilometers (PKM), vehicle density, and trips per mode) for use in Indian cities. The results are intended to assist the assessment of future road transportation demand and mobile-source emissions, in which the technical capabilities and data available may vary considerably. Although the present analysis has concentrated on motorised mobility, it highlights the potential of developing a better understanding of the relationship between vehicle population, pollution, mobility (private and public) and urbanisation. This will potentially provide a clearer framework for modelling the future development and policy choices facing any city. 2 Transport and Mobility One of the major challenges facing urban regions is to keep a high level of mobility. The cities can sustain only if they can ensure viable and efficient transport systems. With increasing motorization mobility increases. Mobility outside homes is related to a purpose. This purpose is to compensate the existence of local deficits of the origin at the destination. Mobility can therefore increase if local deficits (could be in terms of lack of opportunities for employment, education, shopping, etc.) and inadequate access to goods and services, increase due to poor urban planning, logistics and poor transportation management. All these deficits have to be compensated by physical mobility. In the midst of urban transport systems, public transport provides an answer to the mobility needs of common people and plays a crucial role1. This can be explained by its high share of trips, its social role and its contribution to reducing energy use and the damage caused to the environment.
In recent years there has been an intensified research concerning matters of transportation, accessibility and sustainability of urban environments (for a review, see van der Waals, 2000). It is often argued that mobility should be encouraged and there is nothing unsustainable in encouraging long-distance travel. Even though mobility is essential to the present lifestyle 1 Either people need to move towards the “access point” or “access point” itself has to move towards the people. This is one of the differences between “transport” and “mobility”.
needs, it should be done keeping the resource use in view, its efficiency, impacts and equity considerations. These require sustainable transportation policies to reduce the need for travel and make people aware of the costs of different modes of travel. Sustainable mobility can be achieved through less and better travel (comfort, quality, ambience, ease of access, cost, etc.) using less resources. Being able to understand sustainable mobility patterns of travel (private, public and non-motorised) and why they change at a city level, is clearly an interesting topic. There is a general agreement that the complex issue of travel behaviour—deeply integrated in most of our daily activities—is affected by a multitude of factors, for instance, availability and costs of transportation alternatives, incomes of the population and accessibility to transport (e.g. Vlek and Michon, 1992). Physical distances between activities affect the need for travel and the actual travel behaviour. Whilst many researchers develop models to understand the travel behaviour of individuals on a micro-scale, it is the collective manifestation of these individual travel decisions in terms of overall transport patterns observed within cities that are important for policy formulation. In a study of automobile ownership and especially automobile usage in four European cities for the European Commission, Wickham (2002) asserts that dependence on an automobile, at least as far as the journey-to-work is concerned, cannot be explained either by a city’s wealth or population density. The level of use of automobile (measured in terms of automobile ownership and extent to which travel to work is by automobile) is more a function of: (i) the extent and form of the road network, (ii) the maintenance of pre-existing public transport systems and the development of new forms of mass transit, and (iii) city planning, especially land planning and housing zoning policies. In the perspective of a comprehensive policy, a crucial issue is whether an increased accessibility to public transport could reduce ever-increasing personal transport. Some argue that if the physical distances and geographical separation between home and work could be compressed, then the need for daily travel would be cut back. Concepts such as "compact cities"2 and "containment strategies"3, have been launched emphasizing the spatial aspects of sustainable development (Breheny 1995). The theory behind this assumes close and direct links between the physical form of the city (the land use) and people's activities in time and space (Naess 1993, and Newman & Kenworthy, 1991). It is tempting to make a causal link among transport, population density, energy use and mobility. But even with highly aggregated data, the relationship seems to be complex. Certainly, all the high density cities might not be heavily automobile dependent and the low density ones much less so. In many cases, the relationship is not clear. In addition to helping to answer such questions as the link between transport and mobility, the city comparisons are useful in posing them. In light of the speed and potential consequences (economical, environmental and social) of urbanization across the world, posing and answering such questions is critical to making better 2 denotes planning goals and measures to promote more densely populated cities seen as a necessary condition for sustainability 3 imply that the future expansion of population, activities and interactions would be kept within the existing borders of the built-up to hamper the sprawl
and sustainable cities. Hence, the policies framed in this field have major consequences on the quality of life of inhabitants, competitiveness of organisations, efficiency of the retail sector and the kind of urban development. 3 Urban Transportation Scenario in India—an overview As stated above, the urban transport characteristics of India are proposed to be captured by studying the transport dynamics of 23 million-plus cities. The focus of this study is on the road transport and movement of people by motorized transport, either by public or personalized transport. The 23 cities included in the analysis account for about 33% of the Indian urban population as per 2001 census and about 28.5% of the total vehicles in 2005. 3.1 Data and Assumptions
The data on the economic and demographic characteristics of urban centres have been obtained from Indiastat.com (2008). The number of vehicles of various types in different urban centers has been obtained from the reports of Ministry of Shipping, Road Transport & Highways, Govt. of India (Anon 2008a). The information pertaining to energy consumption has been obtained from Indian Oil Corporation, a major refiner and marketer of petroleum products, largely owned by Government of India (Anon, 2008b). One of the objectives of this study is to develop various urban transport and mobility-related indicators to measure the effectiveness as well as sustainability aspect of the urban transport. Broadly, these indicators are related to mode of travel and transport, energy use and carbon emissions. Data are from secondary sources and a few logical assumptions were used to measure the indicators from the chosen cities. Table 1 summarizes different data and assumptions used for developing the indicators (Anon, 2008b, Singh, 2005, Singh, 2006, Anon, 2004, Baig, 2008, TERI, 2006). In addition to data presented here assumptions also have been used for this purpose: • The CO2 emission factor used is 2,496.6 g/l of petrol for petrol-based vehicles and 2856.4 g/l
of diesel for diesel-based vehicles. • The vehicle population in each city is given by the number of registered vehicles. All the
subsequent estimates of various indicators use this vehicle population estimate. We use a total eight of indicators to assess the temporal dynamics of urban mobility and compare them with similar indicators for India as a whole. The indicators used are:
(i) Passenger-carrying capacity per 1000 persons: It is measured in terms of total number of passenger seats in all the types of passenger vehicles available per 1000 population.
(ii) Public-Private-carrying capacity ratio: this is the ratio of carry capacity available in public transport vehicles to that in personalised vehicles.
(iii) Vehicle density by area: It is estimated by dividing the total passenger car units by the total area of the city or country.
(iv) Vehicle density by population: It is estimated by dividing the total passenger car units by the total population of the city or country.
(v) Energy intensity of travel is given by energy consumption per PKM
(vi) Energy intensity of transport is given as annual energy consumption per capita
(vii) Carbon intensity of travel is given by CO2 emissions per PKM
(viii) Carbon intensity of transport is given the annual CO2 emissions per capita
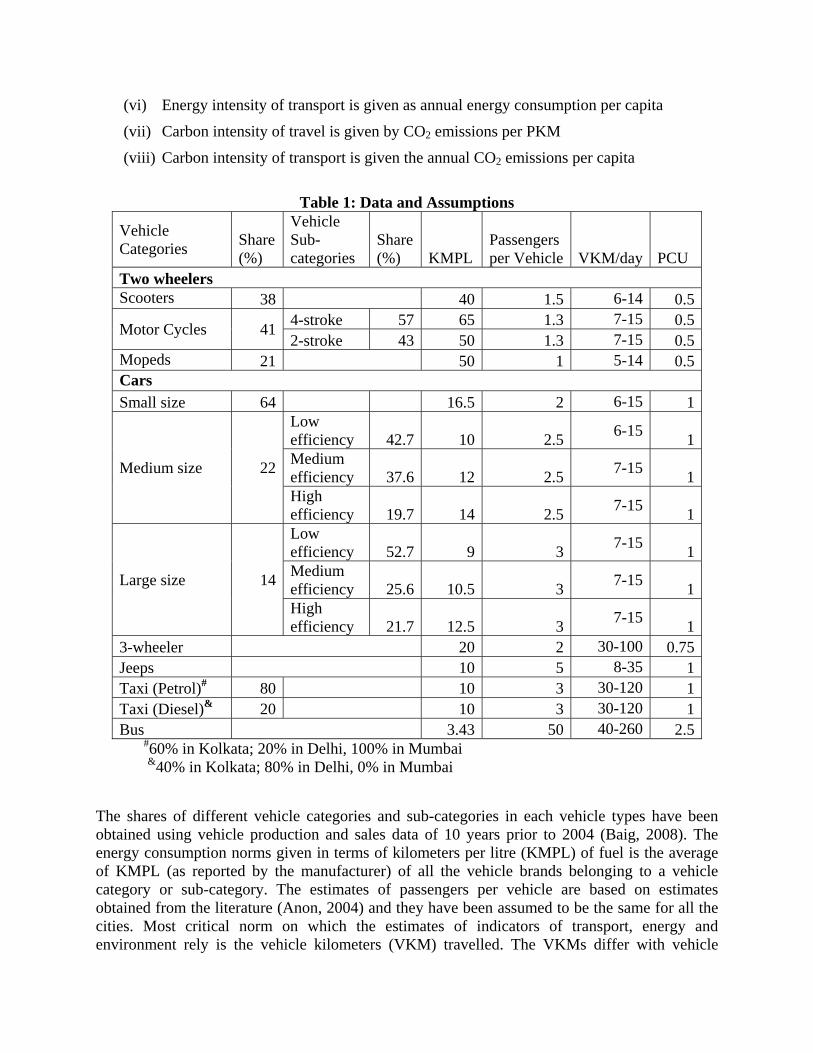
Table 1: Data and Assumptions
Vehicle Categories Share
(%)
Vehicle Sub-categories
Share (%) KMPL
Passengers per Vehicle VKM/day PCU
Two wheelers Scooters 38 40 1.5 6-14 0.5
Motor Cycles 41 4-stroke 57 65 1.3 7-15 0.52-stroke 43 50 1.3 7-15 0.5
Mopeds 21 50 1 5-14 0.5Cars Small size 64 16.5 2 6-15 1
Medium size 22
Low efficiency 42.7 10 2.5 6-15 1Medium efficiency 37.6 12 2.5 7-15 1High efficiency 19.7 14 2.5 7-15 1
Large size 14
Low efficiency 52.7 9 3 7-15 1Medium efficiency 25.6 10.5 3 7-15 1High efficiency 21.7 12.5 3 7-15 1
3-wheeler 20 2 30-100 0.75Jeeps 10 5 8-35 1Taxi (Petrol)# 80 10 3 30-120 1Taxi (Diesel)& 20 10 3 30-120 1Bus 3.43 50 40-260 2.5
#60% in Kolkata; 20% in Delhi, 100% in Mumbai &40% in Kolkata; 80% in Delhi, 0% in Mumbai
The shares of different vehicle categories and sub-categories in each vehicle types have been obtained using vehicle production and sales data of 10 years prior to 2004 (Baig, 2008). The energy consumption norms given in terms of kilometers per litre (KMPL) of fuel is the average of KMPL (as reported by the manufacturer) of all the vehicle brands belonging to a vehicle category or sub-category. The estimates of passengers per vehicle are based on estimates obtained from the literature (Anon, 2004) and they have been assumed to be the same for all the cities. Most critical norm on which the estimates of indicators of transport, energy and environment rely is the vehicle kilometers (VKM) travelled. The VKMs differ with vehicle
types, across cities and they are influenced by various other factors. Some of the influencing factors could be the general city travel behavior, access to public transport (or reliance on personalized transport), typical distances involved in accessing different livelihood/lifestyle opportunities, fuel prices, quality of road infrastructure. Thus, determining a single VKM norm for a given vehicle category or sub-category for all the cities is impossible and therefore we have opted for a range of estimates. The range has been determined based on KMPL norms, trip lengths, annual passenger kilometers and the city-wise consumption of petroleum products based on details provided by public-sector oil companies (Anon, 2005, Zhou and McNeil, 2009, Anon, 2008b, Singh, 2006, TERI, 2006). Thus, various cities will have different VKM norms used for same vehicle type. For example, the VKMs used for small cars in Kolkata was 6 km/day, it was 11 km/day in Bangalore, and it was 15 km/day in Delhi, The passenger car units (PCU) are a useful estimate to derive the congestion index and these have been obtained from Singh (2006). 3.2 Urban form, demographic structure and Transport
If we wish to study the linkages between development and motorised mobility, one has to analyse the relation among population, urbanisation and passenger transport. Between 1981 and 2005, India’s urban regions have exhibited significant increase in population. Even though some less-developed urban centres show regional variability, there has been a pronounced increase in both total population and the population density in the cities. Table 2 shows data on demographic and economic characteristics as well as automobile population of 23 urban centers (million plus cities) that contribute significantly to the urban transportation scene in India. There is a significant increase in the number of vehicles between 1981 and 2005. During the 25 year period ended in 2005, the vehicle population in India has increased by about 15 times, from 5.36 to 81.5 million vehicles, whereas the population has increased just by 1.7 times. The 23 urban centers accounted for about 28.5% of these vehicles in 2005, even though their population comprised only about 9.5% of the total. The largest share of vehicles registered was in Delhi (18%), followed by Bangalore (9.6%) and Chennai (9.3%). Among the major metros, Chennai, Hyderabad and Ahmedabad showed a high annual vehicle growth rate of over 12% during the 24-year period (1981–2005). It is worth noting that smaller cities like Coimbatore, Jaipur, Madurai, Nagpur and Surat too had annual vehicle growth rates exceeding 12% during this period. Among the mega cities, Mumbai and Kolkata had the distinction with least growth rates at about 6%. It is also notable that smaller urban centers like Ludhiana and Surat have higher automobile ownership (automobiles per 1,000 persons) than cities like Mumbai and Kolkata: 530 in Ludhiana compared to 69 in Mumbai and 64 in Kolkata where as the national average is 72. The lower automobile ownership in cities like Mumbai and Kolkata is due to the efficient public transport system provided by the suburban rail and metro rail systems respectively. A comparison of income and city transport shows that the rate of growth of passenger vehicle ownership (per 1000 population) is higher than that of income (Table 2). This is mainly because higher income in cities drives the increase in the number of passenger vehicles. For example, in 2005 the ratio of vehicle ownership per 1000 population for Delhi and Bangalore was four to five times higher than that of average for India. The high income levels of urban regions contribute to the growth of automobiles. However, the strength of the influence of per capita income as well as cost of automobile on automobile ownership is not clearly established at the household level. What is apparent is that while exerting some influence on this relationship, annual
average household income is not the sole measure that determines and drives private motorised mobility. Tables 2 and 3 show trends observed in urban characteristics. The 23 urban centers had a population of 36 million in 1981 which rose to 108 million by 2005 with a mean annual rate of increase of around 4.4% and the population density was about 7839 persons per sq. km (2005 figures). Among all urban centers, Hyderabad is the largest urban area with 1907 sq.km area followed by Delhi with 1483 sq. km. It is generally noticed that the population of a city and its area are inversely proportional, which means the larger the area, the less is population density. As the table shows, this is mostly applicable to Indian cities as well. Population density is high in metropolitan regions with Mumbai at one end (31,144) and Varanasi and Kolkata (244 and 661, respectively) at the other. According to Table 3, growth in vehicle population is more than twice that of actual population. In terms of vehicle density, major metro regions like Delhi, Mumbai, Chennai and Bangalore have a density of 1000–2500 vehicles per sq. km (except for Kolkata and Hyderabad) while in smaller cities. Ludhiana has the highest density (4.036 vehicles persons per sq. km.). Medium cities with very high personal automobile dependence and almost no role for public transportation have an average density of 2200 vehicles per sq. km. This shows that major metropolitan regions which can accommodate more vehicles in the present land area have very high automobile dependence characteristics. Although higher vehicle ownership is a consequence of increasing affluence it is also driven by urban structure and the need for private motorised mobility in the absence of good-quality public transport infrastructure. Urban form has also contributed to the growth in vehicle use, particularly in emerging cities such as Bangalore and Hyderabad whereas cities like Mumbai and Chennai have a clear urban structure with efficient public transportation system, where average urban vehicle density is far lower than emerging cities (vehicle density is 2841/sq.km in Bangalore and 2093/sq.km in Mumbai). However, even for these cities, urban structure by itself might not be the main driver in increasing automobile use.
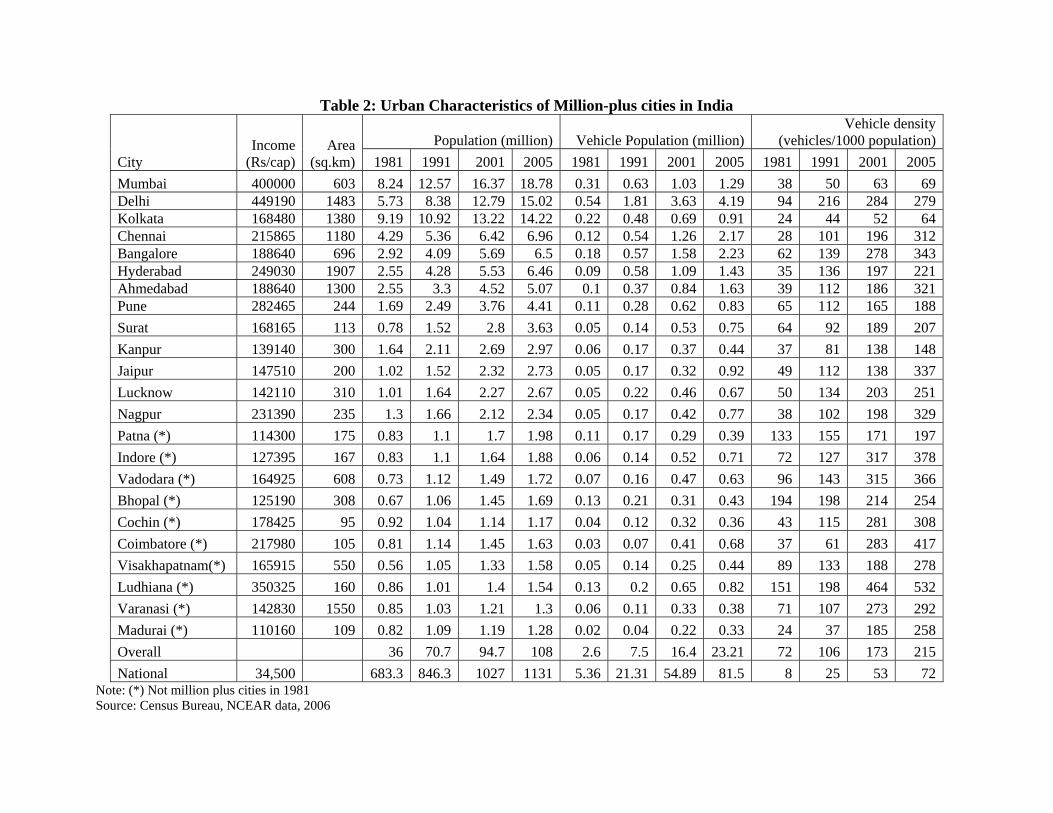
Table 2: Urban Characteristics of Million-plus cities in India
City Income
(Rs/cap) Area
(sq.km)Population (million) Vehicle Population (million)
Vehicle density (vehicles/1000 population)
1981 1991 2001 2005 1981 1991 2001 2005 1981 1991 2001 2005Mumbai 400000 603 8.24 12.57 16.37 18.78 0.31 0.63 1.03 1.29 38 50 63 69Delhi 449190 1483 5.73 8.38 12.79 15.02 0.54 1.81 3.63 4.19 94 216 284 279Kolkata 168480 1380 9.19 10.92 13.22 14.22 0.22 0.48 0.69 0.91 24 44 52 64Chennai 215865 1180 4.29 5.36 6.42 6.96 0.12 0.54 1.26 2.17 28 101 196 312Bangalore 188640 696 2.92 4.09 5.69 6.5 0.18 0.57 1.58 2.23 62 139 278 343Hyderabad 249030 1907 2.55 4.28 5.53 6.46 0.09 0.58 1.09 1.43 35 136 197 221Ahmedabad 188640 1300 2.55 3.3 4.52 5.07 0.1 0.37 0.84 1.63 39 112 186 321Pune 282465 244 1.69 2.49 3.76 4.41 0.11 0.28 0.62 0.83 65 112 165 188Surat 168165 113 0.78 1.52 2.8 3.63 0.05 0.14 0.53 0.75 64 92 189 207Kanpur 139140 300 1.64 2.11 2.69 2.97 0.06 0.17 0.37 0.44 37 81 138 148Jaipur 147510 200 1.02 1.52 2.32 2.73 0.05 0.17 0.32 0.92 49 112 138 337Lucknow 142110 310 1.01 1.64 2.27 2.67 0.05 0.22 0.46 0.67 50 134 203 251Nagpur 231390 235 1.3 1.66 2.12 2.34 0.05 0.17 0.42 0.77 38 102 198 329Patna (*) 114300 175 0.83 1.1 1.7 1.98 0.11 0.17 0.29 0.39 133 155 171 197Indore (*) 127395 167 0.83 1.1 1.64 1.88 0.06 0.14 0.52 0.71 72 127 317 378Vadodara (*) 164925 608 0.73 1.12 1.49 1.72 0.07 0.16 0.47 0.63 96 143 315 366Bhopal (*) 125190 308 0.67 1.06 1.45 1.69 0.13 0.21 0.31 0.43 194 198 214 254Cochin (*) 178425 95 0.92 1.04 1.14 1.17 0.04 0.12 0.32 0.36 43 115 281 308Coimbatore (*) 217980 105 0.81 1.14 1.45 1.63 0.03 0.07 0.41 0.68 37 61 283 417Visakhapatnam(*) 165915 550 0.56 1.05 1.33 1.58 0.05 0.14 0.25 0.44 89 133 188 278Ludhiana (*) 350325 160 0.86 1.01 1.4 1.54 0.13 0.2 0.65 0.82 151 198 464 532Varanasi (*) 142830 1550 0.85 1.03 1.21 1.3 0.06 0.11 0.33 0.38 71 107 273 292Madurai (*) 110160 109 0.82 1.09 1.19 1.28 0.02 0.04 0.22 0.33 24 37 185 258Overall 36 70.7 94.7 108 2.6 7.5 16.4 23.21 72 106 173 215National 34,500 683.3 846.3 1027 1131 5.36 21.31 54.89 81.5 8 25 53 72
Note: (*) Not million plus cities in 1981 Source: Census Bureau, NCEAR data, 2006
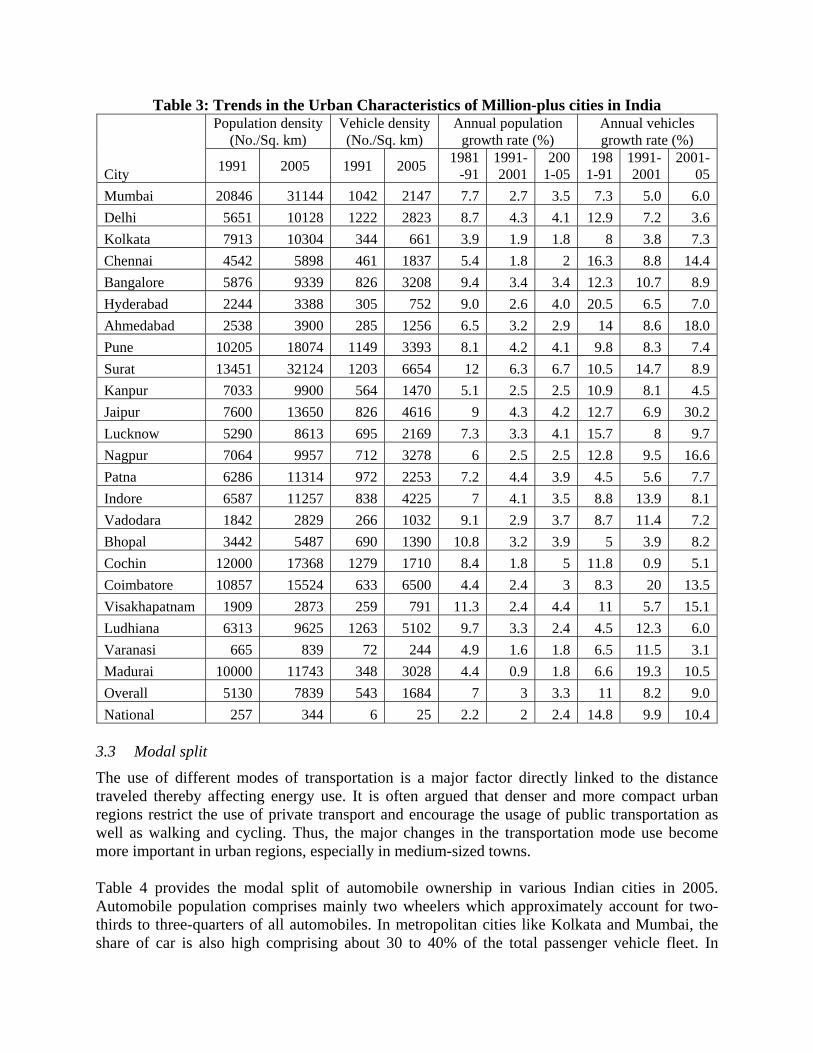
Table 3: Trends in the Urban Characteristics of Million-plus cities in India
City
Population density (No./Sq. km)
Vehicle density (No./Sq. km)
Annual population growth rate (%)
Annual vehicles growth rate (%)
1991 2005 1991 2005 1981-91
1991-2001
2001-05
1981-91
1991-2001
2001-05
Mumbai 20846 31144 1042 2147 7.7 2.7 3.5 7.3 5.0 6.0Delhi 5651 10128 1222 2823 8.7 4.3 4.1 12.9 7.2 3.6Kolkata 7913 10304 344 661 3.9 1.9 1.8 8 3.8 7.3Chennai 4542 5898 461 1837 5.4 1.8 2 16.3 8.8 14.4Bangalore 5876 9339 826 3208 9.4 3.4 3.4 12.3 10.7 8.9Hyderabad 2244 3388 305 752 9.0 2.6 4.0 20.5 6.5 7.0Ahmedabad 2538 3900 285 1256 6.5 3.2 2.9 14 8.6 18.0Pune 10205 18074 1149 3393 8.1 4.2 4.1 9.8 8.3 7.4Surat 13451 32124 1203 6654 12 6.3 6.7 10.5 14.7 8.9Kanpur 7033 9900 564 1470 5.1 2.5 2.5 10.9 8.1 4.5Jaipur 7600 13650 826 4616 9 4.3 4.2 12.7 6.9 30.2Lucknow 5290 8613 695 2169 7.3 3.3 4.1 15.7 8 9.7Nagpur 7064 9957 712 3278 6 2.5 2.5 12.8 9.5 16.6Patna 6286 11314 972 2253 7.2 4.4 3.9 4.5 5.6 7.7Indore 6587 11257 838 4225 7 4.1 3.5 8.8 13.9 8.1Vadodara 1842 2829 266 1032 9.1 2.9 3.7 8.7 11.4 7.2Bhopal 3442 5487 690 1390 10.8 3.2 3.9 5 3.9 8.2Cochin 12000 17368 1279 1710 8.4 1.8 5 11.8 0.9 5.1Coimbatore 10857 15524 633 6500 4.4 2.4 3 8.3 20 13.5Visakhapatnam 1909 2873 259 791 11.3 2.4 4.4 11 5.7 15.1Ludhiana 6313 9625 1263 5102 9.7 3.3 2.4 4.5 12.3 6.0Varanasi 665 839 72 244 4.9 1.6 1.8 6.5 11.5 3.1Madurai 10000 11743 348 3028 4.4 0.9 1.8 6.6 19.3 10.5Overall 5130 7839 543 1684 7 3 3.3 11 8.2 9.0National 257 344 6 25 2.2 2 2.4 14.8 9.9 10.4
3.3 Modal split
The use of different modes of transportation is a major factor directly linked to the distance traveled thereby affecting energy use. It is often argued that denser and more compact urban regions restrict the use of private transport and encourage the usage of public transportation as well as walking and cycling. Thus, the major changes in the transportation mode use become more important in urban regions, especially in medium-sized towns. Table 4 provides the modal split of automobile ownership in various Indian cities in 2005. Automobile population comprises mainly two wheelers which approximately account for two-thirds to three-quarters of all automobiles. In metropolitan cities like Kolkata and Mumbai, the share of car is also high comprising about 30 to 40% of the total passenger vehicle fleet. In
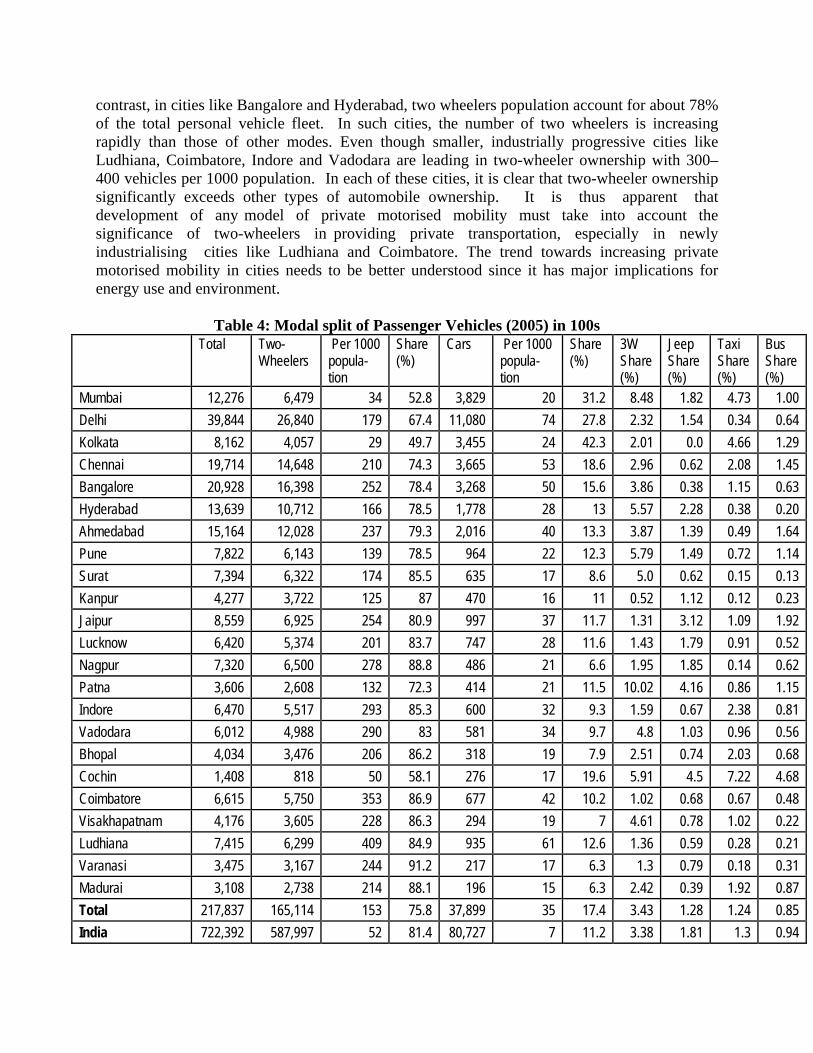
contrast, in cities like Bangalore and Hyderabad, two wheelers population account for about 78% of the total personal vehicle fleet. In such cities, the number of two wheelers is increasing rapidly than those of other modes. Even though smaller, industrially progressive cities like Ludhiana, Coimbatore, Indore and Vadodara are leading in two-wheeler ownership with 300–400 vehicles per 1000 population. In each of these cities, it is clear that two-wheeler ownership significantly exceeds other types of automobile ownership. It is thus apparent that development of any model of private motorised mobility must take into account the significance of two-wheelers in providing private transportation, especially in newly industrialising cities like Ludhiana and Coimbatore. The trend towards increasing private motorised mobility in cities needs to be better understood since it has major implications for energy use and environment.
Table 4: Modal split of Passenger Vehicles (2005) in 100s Total Two-
Wheelers Per 1000 popula-tion
Share (%)
Cars Per 1000 popula-tion
Share (%)
3W Share (%)
Jeep Share (%)
Taxi Share (%)
Bus Share (%)
Mumbai 12,276 6,479 34 52.8 3,829 20 31.2 8.48 1.82 4.73 1.00 Delhi 39,844 26,840 179 67.4 11,080 74 27.8 2.32 1.54 0.34 0.64 Kolkata 8,162 4,057 29 49.7 3,455 24 42.3 2.01 0.0 4.66 1.29 Chennai 19,714 14,648 210 74.3 3,665 53 18.6 2.96 0.62 2.08 1.45 Bangalore 20,928 16,398 252 78.4 3,268 50 15.6 3.86 0.38 1.15 0.63 Hyderabad 13,639 10,712 166 78.5 1,778 28 13 5.57 2.28 0.38 0.20 Ahmedabad 15,164 12,028 237 79.3 2,016 40 13.3 3.87 1.39 0.49 1.64 Pune 7,822 6,143 139 78.5 964 22 12.3 5.79 1.49 0.72 1.14 Surat 7,394 6,322 174 85.5 635 17 8.6 5.0 0.62 0.15 0.13 Kanpur 4,277 3,722 125 87 470 16 11 0.52 1.12 0.12 0.23 Jaipur 8,559 6,925 254 80.9 997 37 11.7 1.31 3.12 1.09 1.92 Lucknow 6,420 5,374 201 83.7 747 28 11.6 1.43 1.79 0.91 0.52 Nagpur 7,320 6,500 278 88.8 486 21 6.6 1.95 1.85 0.14 0.62 Patna 3,606 2,608 132 72.3 414 21 11.5 10.02 4.16 0.86 1.15 Indore 6,470 5,517 293 85.3 600 32 9.3 1.59 0.67 2.38 0.81 Vadodara 6,012 4,988 290 83 581 34 9.7 4.8 1.03 0.96 0.56 Bhopal 4,034 3,476 206 86.2 318 19 7.9 2.51 0.74 2.03 0.68 Cochin 1,408 818 50 58.1 276 17 19.6 5.91 4.5 7.22 4.68 Coimbatore 6,615 5,750 353 86.9 677 42 10.2 1.02 0.68 0.67 0.48 Visakhapatnam 4,176 3,605 228 86.3 294 19 7 4.61 0.78 1.02 0.22 Ludhiana 7,415 6,299 409 84.9 935 61 12.6 1.36 0.59 0.28 0.21 Varanasi 3,475 3,167 244 91.2 217 17 6.3 1.3 0.79 0.18 0.31 Madurai 3,108 2,738 214 88.1 196 15 6.3 2.42 0.39 1.92 0.87 Total 217,837 165,114 153 75.8 37,899 35 17.4 3.43 1.28 1.24 0.85 India 722,392 587,997 52 81.4 80,727 7 11.2 3.38 1.81 1.3 0.94
3.4 Energy demand
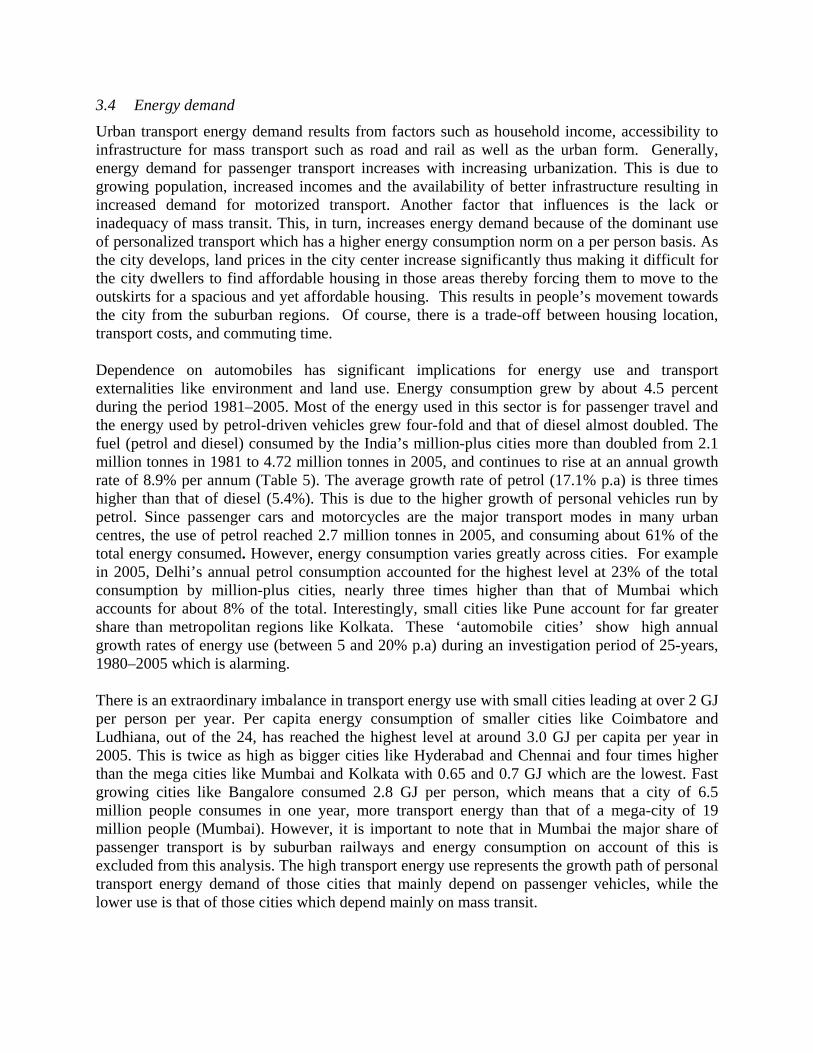
Urban transport energy demand results from factors such as household income, accessibility to infrastructure for mass transport such as road and rail as well as the urban form. Generally, energy demand for passenger transport increases with increasing urbanization. This is due to growing population, increased incomes and the availability of better infrastructure resulting in increased demand for motorized transport. Another factor that influences is the lack or inadequacy of mass transit. This, in turn, increases energy demand because of the dominant use of personalized transport which has a higher energy consumption norm on a per person basis. As the city develops, land prices in the city center increase significantly thus making it difficult for the city dwellers to find affordable housing in those areas thereby forcing them to move to the outskirts for a spacious and yet affordable housing. This results in people’s movement towards the city from the suburban regions. Of course, there is a trade-off between housing location, transport costs, and commuting time. Dependence on automobiles has significant implications for energy use and transport externalities like environment and land use. Energy consumption grew by about 4.5 percent during the period 1981–2005. Most of the energy used in this sector is for passenger travel and the energy used by petrol-driven vehicles grew four-fold and that of diesel almost doubled. The fuel (petrol and diesel) consumed by the India’s million-plus cities more than doubled from 2.1 million tonnes in 1981 to 4.72 million tonnes in 2005, and continues to rise at an annual growth rate of 8.9% per annum (Table 5). The average growth rate of petrol (17.1% p.a) is three times higher than that of diesel (5.4%). This is due to the higher growth of personal vehicles run by petrol. Since passenger cars and motorcycles are the major transport modes in many urban centres, the use of petrol reached 2.7 million tonnes in 2005, and consuming about 61% of the total energy consumed. However, energy consumption varies greatly across cities. For example in 2005, Delhi’s annual petrol consumption accounted for the highest level at 23% of the total consumption by million-plus cities, nearly three times higher than that of Mumbai which accounts for about 8% of the total. Interestingly, small cities like Pune account for far greater share than metropolitan regions like Kolkata. These ‘automobile cities’ show high annual growth rates of energy use (between 5 and 20% p.a) during an investigation period of 25-years, 1980–2005 which is alarming. There is an extraordinary imbalance in transport energy use with small cities leading at over 2 GJ per person per year. Per capita energy consumption of smaller cities like Coimbatore and Ludhiana, out of the 24, has reached the highest level at around 3.0 GJ per capita per year in 2005. This is twice as high as bigger cities like Hyderabad and Chennai and four times higher than the mega cities like Mumbai and Kolkata with 0.65 and 0.7 GJ which are the lowest. Fast growing cities like Bangalore consumed 2.8 GJ per person, which means that a city of 6.5 million people consumes in one year, more transport energy than that of a mega-city of 19 million people (Mumbai). However, it is important to note that in Mumbai the major share of passenger transport is by suburban railways and energy consumption on account of this is excluded from this analysis. The high transport energy use represents the growth path of personal transport energy demand of those cities that mainly depend on passenger vehicles, while the lower use is that of those cities which depend mainly on mass transit.
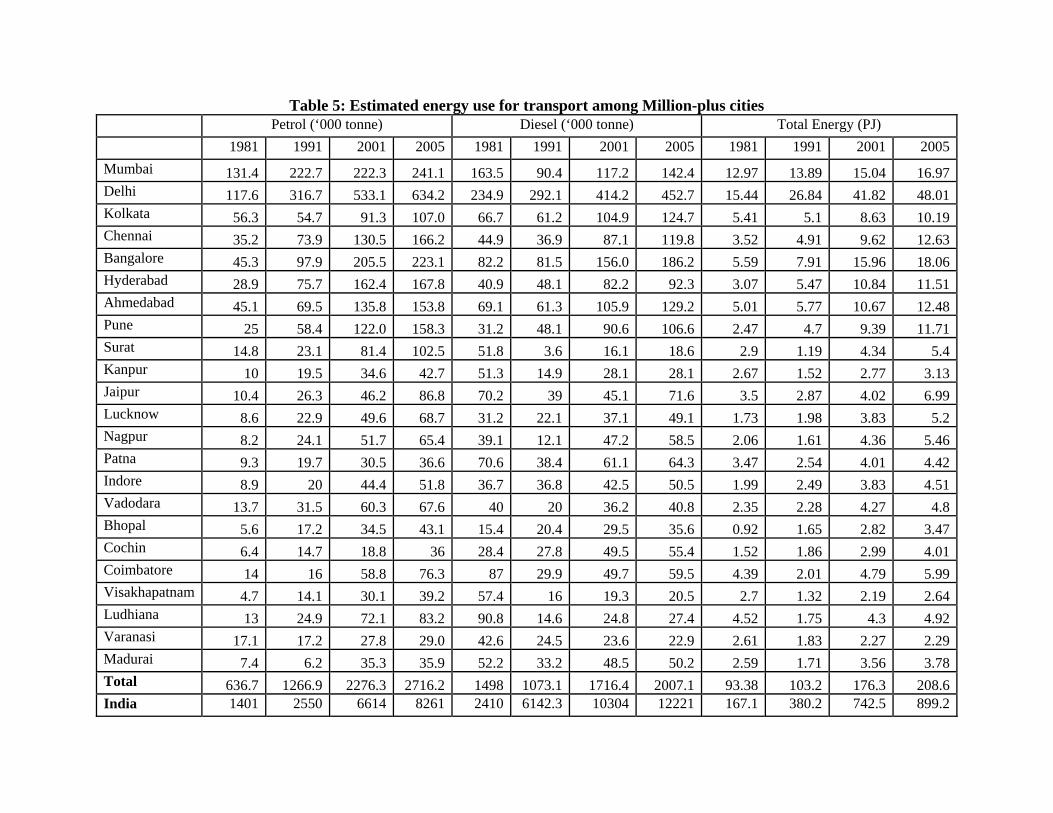
Table 5: Estimated energy use for transport among Million-plus cities Petrol (‘000 tonne) Diesel (‘000 tonne) Total Energy (PJ) 1981 1991 2001 2005 1981 1991 2001 2005 1981 1991 2001 2005Mumbai 131.4 222.7 222.3 241.1 163.5 90.4 117.2 142.4 12.97 13.89 15.04 16.97Delhi 117.6 316.7 533.1 634.2 234.9 292.1 414.2 452.7 15.44 26.84 41.82 48.01Kolkata 56.3 54.7 91.3 107.0 66.7 61.2 104.9 124.7 5.41 5.1 8.63 10.19Chennai 35.2 73.9 130.5 166.2 44.9 36.9 87.1 119.8 3.52 4.91 9.62 12.63Bangalore 45.3 97.9 205.5 223.1 82.2 81.5 156.0 186.2 5.59 7.91 15.96 18.06Hyderabad 28.9 75.7 162.4 167.8 40.9 48.1 82.2 92.3 3.07 5.47 10.84 11.51Ahmedabad 45.1 69.5 135.8 153.8 69.1 61.3 105.9 129.2 5.01 5.77 10.67 12.48Pune 25 58.4 122.0 158.3 31.2 48.1 90.6 106.6 2.47 4.7 9.39 11.71Surat 14.8 23.1 81.4 102.5 51.8 3.6 16.1 18.6 2.9 1.19 4.34 5.4Kanpur 10 19.5 34.6 42.7 51.3 14.9 28.1 28.1 2.67 1.52 2.77 3.13Jaipur 10.4 26.3 46.2 86.8 70.2 39 45.1 71.6 3.5 2.87 4.02 6.99Lucknow 8.6 22.9 49.6 68.7 31.2 22.1 37.1 49.1 1.73 1.98 3.83 5.2Nagpur 8.2 24.1 51.7 65.4 39.1 12.1 47.2 58.5 2.06 1.61 4.36 5.46Patna 9.3 19.7 30.5 36.6 70.6 38.4 61.1 64.3 3.47 2.54 4.01 4.42Indore 8.9 20 44.4 51.8 36.7 36.8 42.5 50.5 1.99 2.49 3.83 4.51Vadodara 13.7 31.5 60.3 67.6 40 20 36.2 40.8 2.35 2.28 4.27 4.8Bhopal 5.6 17.2 34.5 43.1 15.4 20.4 29.5 35.6 0.92 1.65 2.82 3.47Cochin 6.4 14.7 18.8 36 28.4 27.8 49.5 55.4 1.52 1.86 2.99 4.01Coimbatore 14 16 58.8 76.3 87 29.9 49.7 59.5 4.39 2.01 4.79 5.99Visakhapatnam 4.7 14.1 30.1 39.2 57.4 16 19.3 20.5 2.7 1.32 2.19 2.64Ludhiana 13 24.9 72.1 83.2 90.8 14.6 24.8 27.4 4.52 1.75 4.3 4.92Varanasi 17.1 17.2 27.8 29.0 42.6 24.5 23.6 22.9 2.61 1.83 2.27 2.29Madurai 7.4 6.2 35.3 35.9 52.2 33.2 48.5 50.2 2.59 1.71 3.56 3.78Total 636.7 1266.9 2276.3 2716.2 1498 1073.1 1716.4 2007.1 93.38 103.2 176.3 208.6India 1401 2550 6614 8261 2410 6142.3 10304 12221 167.1 380.2 742.5 899.2

4 Urban Mobility Ideally, for road transport, energy use should be measured for each type of vehicle or means of transport, including two and three wheelers, cars, jeeps and buses. While the number of personal transport vehicles (two wheelers or cars per 1000 persons) is an acceptable measure of vehicle ownership, annual passenger km of travel is more appropriate measure of personal mobility and in particular as a measure of energy intensity (Kenworthy et al. 1999 and WBCSD, 2001). The energy intensity of a vehicle depends on both capacity and capacity utilization As discussed earlier, a key factor in private motorised mobility at the city level is the distance travelled by automobiles which analyses the relationship between vehicle kilometers (VKM) and the passenger kilometers (PKM) of travel. We use load factors or average passengers per vehicle (Table 1) to convert VKM to PKM, which are then comparable between different modes. Public transport load factors are considerably higher during peak hours than on the average, while the opposite is true of passenger cars. Table 6 shows the estimated PKMs in 2005. In the PKM estimates, public transport includes buses, three-wheelers and taxis and the remaining modes are classified as under private transport. In million-plus cities, on an average less than 25% of the estimated passenger traffic in PKM is carried by private transport modes and about 75% by the public transport. Delhi accounts for about 21% of the total PKMs by the million plus cities. The annual per capita PKM indicates how mobile are the population in a given city. Among the major cities, Delhi and Bangalore appear to be highly mobile with about 7,200 PKM per capita. Kolkata and Mumbai appear to have least mobile population, at least by road, with an annual per capita PKM of less than 2000. Both Mumbai and Kolkata have dominant non-road transport systems (suburban train and metro) for people mobility. There are very significant differences in the average annual automobile PKM per capita between the more developed (4,400 PKM) and less-developed cities (6,300PKM). The gap between less developed and more developed is however closing. In 2005, the annual automobile PKM per capita of Bangalore was approximately 3.6 times that of Mumbai, whereas it is five times for Coimbatore. Vasconcellos (1997) argues that the middle class of many less-developed cities experience a period of increased affluence, and an automobile is perceived by the middle classes as essential to perform their desired daily activities. The trend towards increasing private motorised mobility in cities needs to be better understood as it has major implications for cities whether located, in a newly industrialising city or in a very poor region yet to experience rapid economic growth. The analysis shows that the main reason for increased automobile ownership and use throughout the country is the lack of efficient public transport system. Of course, the influence of rising personal income and its relationship with increased automobile PKM also cannot be ruled out. However, the dependence on an automobile, at least as far as the journey-to-work is concerned, cannot be explained either by a city’s wealth or population density. According to Wickham (1999) the level of automobile use (measured in terms of automobile ownership and extent to which travel to work is by automobile) is more a function of: (i) the extent and form of the road network, (ii) the maintenance of pre-existing public transport systems and the development of new forms of mass transit, and (iii) city planning, especially land planning and housing zoning policies. This holds
good for Indian cities as well. This shows that income has some influence on, but is not a sole driver of, automobile ownership and use or private motorised mobility. It appears to act in combination with others factors to drive private motorised mobility at the city level.
Table 6: Passenger KM among various categories of cities (2005) PKM (billion) through various modes Per
capita PKM
Share of Public PKM (%) 2 W 3 W Cars Jeeps Taxis Buses Total Public Private
Mumbai 3.08 3.65 2.86 0.82 2.54 24.6 37.55 30.79 6.75 1,999 82.02 Delhi 15.44 5.72 13.43 2.8 1.77 69.41 108.57 76.91 31.67 7,229 70.83 Kolkata 1.21 0.6 2.01 0 2.08 19.22 25.12 21.9 3.22 1,767 87.18 Chennai 4.39 1.83 2.11 0.18 1.35 20.89 30.74 24.07 6.67 4,416 78.30 Bangalore 5.63 2.95 2.97 0.15 1.32 33.81 46.83 38.08 8.75 7,205 81.32 Hyderabad 5.67 2.61 1.6 1.13 0.57 13.21 24.8 16.39 8.41 3,839 66.09 Ahmedabad 4.26 2.14 1.93 0.38 0.73 22.71 32.16 25.58 6.57 6,342 79.56 Pune 4.24 3.31 1.19 0.53 0.74 17.85 27.85 21.89 5.96 6,316 78.60 Surat 3.29 2.16 0.78 0.21 0.12 2.71 9.27 5 4.28 2,555 53.88 Kanpur 2.14 0.08 0.58 0.26 0.05 4.46 7.57 4.59 2.98 2,550 60.63 Jaipur 3.82 0.45 0.98 0.39 0.41 11.97 18.03 12.83 5.2 6,604 71.17 Lucknow 3.09 0.34 0.81 0.52 0.26 7.36 12.37 7.95 4.42 4,632 64.26 Nagpur 3.17 0.78 0.5 0.37 0.04 9.92 14.79 10.75 4.04 6,322 72.67 Patna 1 0.79 0.27 0.68 0.14 9.87 12.75 10.79 1.96 6,439 84.66 Indore 1.63 0.38 0.38 0.08 0.76 8.58 11.8 9.71 2.09 6,279 82.27 Vadodara 2.65 1.05 0.43 0.23 0.25 6.79 11.4 8.09 3.31 6,627 70.98 Bhopal 1.5 0.41 0.25 0.05 0.54 6.04 8.79 6.99 1.81 5,204 79.46 Cochin 0.53 0.55 0.32 0.12 0.56 9.63 11.7 10.74 0.97 7,092 91.74 Coimbatore 3.31 0.44 0.77 0.16 0.44 10.39 15.52 11.27 4.24 9,519 72.65 Visakhapatnam 1.57 0.56 0.24 0.21 0.19 3.02 5.79 3.77 2.02 3,663 65.16 Ludhiana 4.13 0.37 1.01 0.2 0.09 4.49 10.29 4.95 5.34 6,680 48.10 Varanasi 1.59 0.26 0.16 0.18 0.05 3.75 5.99 4.06 1.93 4,607 67.83 Madurai 1.47 0.27 0.15 0.08 0.46 8.87 11.29 9.6 1.7 8,823 84.99 Total 78.8 31.7 35.7 9.7 15.4 329.6 501 376.7 124.3 4,638 75.20 All India 297.8 133.6 66.3 71.6 92.6 2476.6 3138.5 2702.8 435.7 2,776 86.12
Table 7 shows the estimated PKM through private as well as public transport and the ratio of public- to-private transport for various cities. The increasing growth of automobile PKM in various cities during 1981–2005 is more than likely associated with the expansion of the economy over this period and the influence of increased affluence on automobile ownership and use (Schafer, 1998. Of the cities, the two-tier cities experienced the largest growth in PKM not only for private but also for public transport. A number of factors might be responsible for this growth in PKM. These include: (i) increasing driving-age population, (ii) growing working population, as
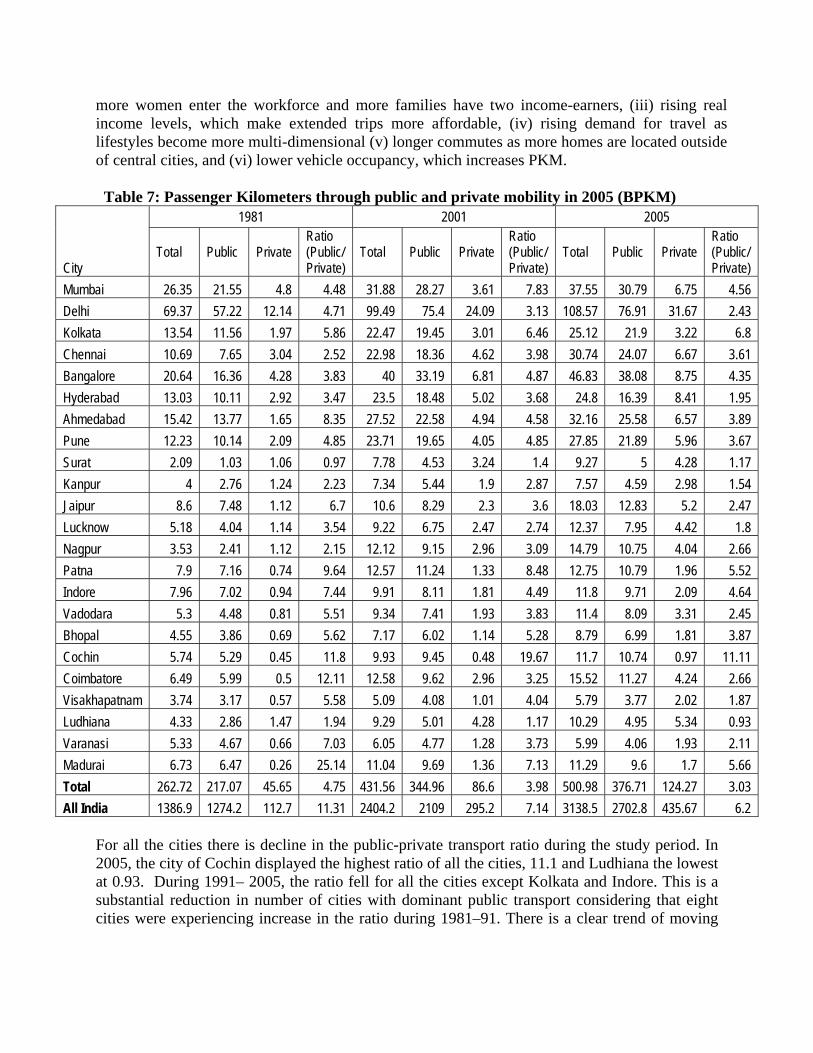
more women enter the workforce and more families have two income-earners, (iii) rising real income levels, which make extended trips more affordable, (iv) rising demand for travel as lifestyles become more multi-dimensional (v) longer commutes as more homes are located outside of central cities, and (vi) lower vehicle occupancy, which increases PKM. Table 7: Passenger Kilometers through public and private mobility in 2005 (BPKM)
City
1981 2001 2005
Total Public Private Ratio (Public/ Private)
Total Public Private Ratio (Public/ Private)
Total Public Private Ratio (Public/ Private)
Mumbai 26.35 21.55 4.8 4.48 31.88 28.27 3.61 7.83 37.55 30.79 6.75 4.56 Delhi 69.37 57.22 12.14 4.71 99.49 75.4 24.09 3.13 108.57 76.91 31.67 2.43 Kolkata 13.54 11.56 1.97 5.86 22.47 19.45 3.01 6.46 25.12 21.9 3.22 6.8 Chennai 10.69 7.65 3.04 2.52 22.98 18.36 4.62 3.98 30.74 24.07 6.67 3.61 Bangalore 20.64 16.36 4.28 3.83 40 33.19 6.81 4.87 46.83 38.08 8.75 4.35 Hyderabad 13.03 10.11 2.92 3.47 23.5 18.48 5.02 3.68 24.8 16.39 8.41 1.95 Ahmedabad 15.42 13.77 1.65 8.35 27.52 22.58 4.94 4.58 32.16 25.58 6.57 3.89 Pune 12.23 10.14 2.09 4.85 23.71 19.65 4.05 4.85 27.85 21.89 5.96 3.67 Surat 2.09 1.03 1.06 0.97 7.78 4.53 3.24 1.4 9.27 5 4.28 1.17 Kanpur 4 2.76 1.24 2.23 7.34 5.44 1.9 2.87 7.57 4.59 2.98 1.54 Jaipur 8.6 7.48 1.12 6.7 10.6 8.29 2.3 3.6 18.03 12.83 5.2 2.47 Lucknow 5.18 4.04 1.14 3.54 9.22 6.75 2.47 2.74 12.37 7.95 4.42 1.8 Nagpur 3.53 2.41 1.12 2.15 12.12 9.15 2.96 3.09 14.79 10.75 4.04 2.66 Patna 7.9 7.16 0.74 9.64 12.57 11.24 1.33 8.48 12.75 10.79 1.96 5.52 Indore 7.96 7.02 0.94 7.44 9.91 8.11 1.81 4.49 11.8 9.71 2.09 4.64 Vadodara 5.3 4.48 0.81 5.51 9.34 7.41 1.93 3.83 11.4 8.09 3.31 2.45 Bhopal 4.55 3.86 0.69 5.62 7.17 6.02 1.14 5.28 8.79 6.99 1.81 3.87 Cochin 5.74 5.29 0.45 11.8 9.93 9.45 0.48 19.67 11.7 10.74 0.97 11.11 Coimbatore 6.49 5.99 0.5 12.11 12.58 9.62 2.96 3.25 15.52 11.27 4.24 2.66 Visakhapatnam 3.74 3.17 0.57 5.58 5.09 4.08 1.01 4.04 5.79 3.77 2.02 1.87 Ludhiana 4.33 2.86 1.47 1.94 9.29 5.01 4.28 1.17 10.29 4.95 5.34 0.93 Varanasi 5.33 4.67 0.66 7.03 6.05 4.77 1.28 3.73 5.99 4.06 1.93 2.11 Madurai 6.73 6.47 0.26 25.14 11.04 9.69 1.36 7.13 11.29 9.6 1.7 5.66 Total 262.72 217.07 45.65 4.75 431.56 344.96 86.6 3.98 500.98 376.71 124.27 3.03 All India 1386.9 1274.2 112.7 11.31 2404.2 2109 295.2 7.14 3138.5 2702.8 435.67 6.2
For all the cities there is decline in the public-private transport ratio during the study period. In 2005, the city of Cochin displayed the highest ratio of all the cities, 11.1 and Ludhiana the lowest at 0.93. During 1991– 2005, the ratio fell for all the cities except Kolkata and Indore. This is a substantial reduction in number of cities with dominant public transport considering that eight cities were experiencing increase in the ratio during 1981–91. There is a clear trend of moving

towards un-sustainable transport. Overall, there is a decrease in the ratio from 4.75 in 1981 and 3.98 in 2001 to 3.03 in 2005. 5 Energy intensity In the transportation sector, energy intensity (MJ/PKM) or (MJ/person/year) measures the travel intensity of a mode or an individual. However, measurement and interpretation of energy intensities are complicated by differences among products within a category such as size (e.g., automobile weight), features (power steering and automatic transmission in cars), and utilization (vehicle occupancy if passenger-km is the measure of output). Among various modes of transport, cars are the most energy intensive, consuming 1.27 MJ (petrol vehicle) or 2.2 times more energy than a two wheeler, to move one passenger for one km. Energy intensity of a bus is about 0.3 to 0.3 MJ/PKM. Mass transit (electric trains) is the least energy intensive of all modes (0.02 MJ/PKM).
Table 8: Energy Intensity of urban transportation modes
Transport Mode Occupancy (persons/vehicle)
Fuel type (MJ/PKM) Petrol Diesel CNG Electricity
2 W (Scooter/Motor bike) – 2 stroke 1.5 0.55
2 W (Scooter/Motor bike) – 4 stroke 1.5 0.45
Autoriksha – 2 stroke 1.75 0.98
Autoriksha – 4 stroke 1.75 0.78 0.7
Car 2.5 1.27 1.37 1.02
Bus 50 0.2 0.3
Suburban train 800 0.02 Source: TERI, 2006 5.1 Energy intensity—Public transport
Cities in India have varied public transport modes such as urban metro or mass transit systems; buses on fixed routes and also from point-to-point routes (Omni); taxis; and three-wheeler vehicles. The different transport modes cater to different sections of the society providing various service levels and charging varied fares. The public transport sector is dominated by state-owned utilities, in some cases, subcontract operations to private companies. Public transportation consumes significantly lower energy than private transport. Table 9 provides information about public transportation modes and energy use in various urban centers of India. Energy use per PKM varies between 0.26 and 0.38 MJ/PKM, the only exception being Surat with 0.52 MJ/PKM. In terms of per capita public transport energy use, Kanpur, Kolkata and Mumbai have the lowest values. The reasons for such low levels are dominance of non-road public transport in Mumbai and Kolkata and inadequacy of public transport infrastructure in Kanpur. Emerging cities like Madurai, Coimbatore and Cochin use around 2 GJ/capita of energy for traveling by public transport. Need for traveling long distances may be one of the reasons for such high consumption levels.
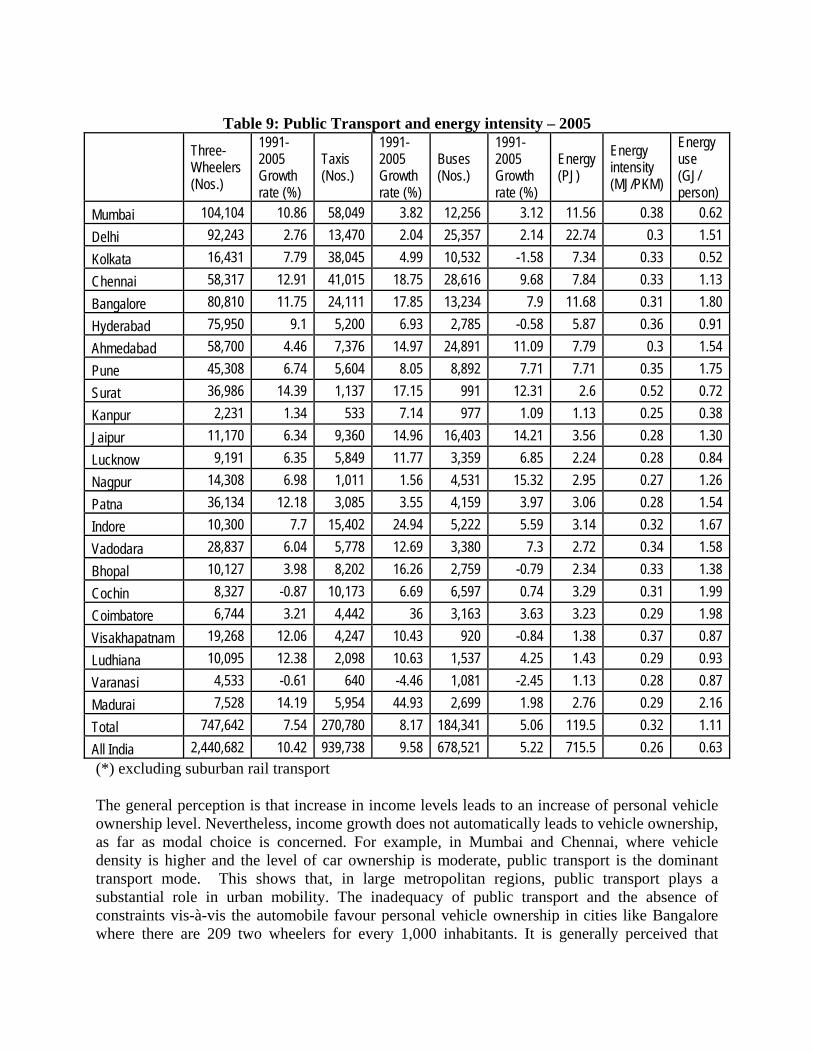
Table 9: Public Transport and energy intensity – 2005
Three-Wheelers (Nos.)
1991-2005 Growth rate (%)
Taxis (Nos.)
1991-2005 Growth rate (%)
Buses (Nos.)
1991-2005 Growth rate (%)
Energy (PJ)
Energy intensity (MJ/PKM)
Energy use (GJ/ person)
Mumbai 104,104 10.86 58,049 3.82 12,256 3.12 11.56 0.38 0.62 Delhi 92,243 2.76 13,470 2.04 25,357 2.14 22.74 0.3 1.51 Kolkata 16,431 7.79 38,045 4.99 10,532 -1.58 7.34 0.33 0.52 Chennai 58,317 12.91 41,015 18.75 28,616 9.68 7.84 0.33 1.13 Bangalore 80,810 11.75 24,111 17.85 13,234 7.9 11.68 0.31 1.80 Hyderabad 75,950 9.1 5,200 6.93 2,785 -0.58 5.87 0.36 0.91 Ahmedabad 58,700 4.46 7,376 14.97 24,891 11.09 7.79 0.3 1.54 Pune 45,308 6.74 5,604 8.05 8,892 7.71 7.71 0.35 1.75 Surat 36,986 14.39 1,137 17.15 991 12.31 2.6 0.52 0.72 Kanpur 2,231 1.34 533 7.14 977 1.09 1.13 0.25 0.38 Jaipur 11,170 6.34 9,360 14.96 16,403 14.21 3.56 0.28 1.30 Lucknow 9,191 6.35 5,849 11.77 3,359 6.85 2.24 0.28 0.84 Nagpur 14,308 6.98 1,011 1.56 4,531 15.32 2.95 0.27 1.26 Patna 36,134 12.18 3,085 3.55 4,159 3.97 3.06 0.28 1.54 Indore 10,300 7.7 15,402 24.94 5,222 5.59 3.14 0.32 1.67 Vadodara 28,837 6.04 5,778 12.69 3,380 7.3 2.72 0.34 1.58 Bhopal 10,127 3.98 8,202 16.26 2,759 -0.79 2.34 0.33 1.38 Cochin 8,327 -0.87 10,173 6.69 6,597 0.74 3.29 0.31 1.99 Coimbatore 6,744 3.21 4,442 36 3,163 3.63 3.23 0.29 1.98 Visakhapatnam 19,268 12.06 4,247 10.43 920 -0.84 1.38 0.37 0.87 Ludhiana 10,095 12.38 2,098 10.63 1,537 4.25 1.43 0.29 0.93 Varanasi 4,533 -0.61 640 -4.46 1,081 -2.45 1.13 0.28 0.87 Madurai 7,528 14.19 5,954 44.93 2,699 1.98 2.76 0.29 2.16 Total 747,642 7.54 270,780 8.17 184,341 5.06 119.5 0.32 1.11 All India 2,440,682 10.42 939,738 9.58 678,521 5.22 715.5 0.26 0.63 (*) excluding suburban rail transport The general perception is that increase in income levels leads to an increase of personal vehicle ownership level. Nevertheless, income growth does not automatically leads to vehicle ownership, as far as modal choice is concerned. For example, in Mumbai and Chennai, where vehicle density is higher and the level of car ownership is moderate, public transport is the dominant transport mode. This shows that, in large metropolitan regions, public transport plays a substantial role in urban mobility. The inadequacy of public transport and the absence of constraints vis-à-vis the automobile favour personal vehicle ownership in cities like Bangalore where there are 209 two wheelers for every 1,000 inhabitants. It is generally perceived that
higher the level of personal vehicle ownership, the greater is the decline in public transport use. However, it is worth emphasising that, at a given level of car ownership, public transport use becomes intensive if the services offered are attractive. It is illustrated chiefly by the examples of Mumbai and Chennai where high levels of car ownership does not deter city-dwellers from using public transport (mainly suburban trains) on a frequent basis. At a given level of car ownership, public transport’s market share becomes stronger if speed is higher. Public transport is not competitive with the car in majority of urban centers in India. On the other hand, it is faster than the automobile in Mumbai and Chennai (now in Delhi) where more than 70% of journeys on public transport are by train or metro. In other cities, however, the automobile is much faster than the bus, but is the preserve of a minority. 5.2 Personal transport
As shown in Table 11 energy consumed for personal travel increased by 8 percent per annum during 1981–2005 with two wheelers and cars mostly accounting for it. The total energy used by two wheelers grew the most of any passenger mode during the study period (about 9%). The combined use of energy consumption by these three modes of transport was 89 PJ in 2005. Three cities—Ludhiana, Madurai, and Jaipur—experienced large percentage increase in energy use during the study period; however, the combined consumption of these three cities is about 8 percent of private transportation energy use. The data in Table 10 illustrate the high energy requirements of urban transport based on private motor vehicles. Energy consumed per PKM in private transport in all the cities is about 2.3 times higher than that of public transport. Energy intensity of private transport is high for metropolitan regions like Kolkata and Mumbai mainly because of the dominant share of cars in the total personal vehicles. However, when we look at the private transport energy use per capita (Table 10), it is significantly low in cities like Mumbai and Kolkata because of the low dependency on personal transport. The data show an extraordinary imbalance in per capita energy consumption with cities like Coimbatore and Ludhiana leading at over or close to 2 GJ per person of energy use for personal vehicles. This is five times more than large metropolitan regions like Mumbai and Chennai and two times more than emerging cities like Bangalore and Hyderabad. The per capita energy consumption for private transport in urban centres is three times more than that of national average indicating higher mobility through own vehicles in cities. The energy intensity of public transport system is lower when compared to private transport on per PKM basis (Tables 9 and 10). However, on the basis of overall per capita energy use, at all India level, public transport consumes 2.5 times of that consumed by private transport. This ratio is lower at 1.3 in the case of million-plus cities. This indicates the dominance of public transport in delivering mobility services both at the national as well as at city level. The ratio of per capita energy use by public transport and that by private transport varies from a low of 0.4 in Ludhiana to a high of 4.5 in Cochin. Due to lack of efficient public transport, the public in urban India has shifted its choice to private passenger vehicle, and this is the main reason for an apparent decrease in the share of population using public transport after 1980. In cities like Bangalore public transport continues to lose market share to private vehicles with two wheelers and cars claiming a larger market share.
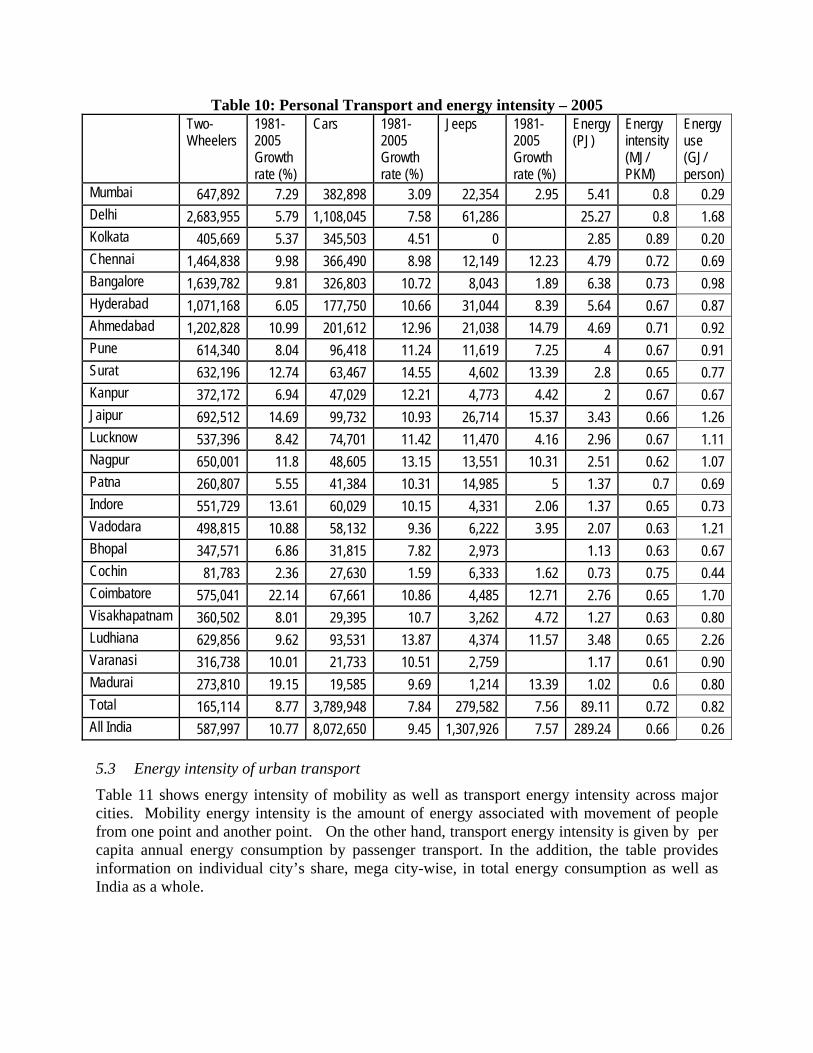
Table 10: Personal Transport and energy intensity – 2005 Two-
Wheelers 1981-2005 Growth rate (%)
Cars 1981-2005 Growth rate (%)
Jeeps 1981-2005 Growth rate (%)
Energy (PJ)
Energy intensity (MJ/ PKM)
Energy use (GJ/ person)
Mumbai 647,892 7.29 382,898 3.09 22,354 2.95 5.41 0.8 0.29 Delhi 2,683,955 5.79 1,108,045 7.58 61,286 25.27 0.8 1.68 Kolkata 405,669 5.37 345,503 4.51 0 2.85 0.89 0.20 Chennai 1,464,838 9.98 366,490 8.98 12,149 12.23 4.79 0.72 0.69 Bangalore 1,639,782 9.81 326,803 10.72 8,043 1.89 6.38 0.73 0.98 Hyderabad 1,071,168 6.05 177,750 10.66 31,044 8.39 5.64 0.67 0.87 Ahmedabad 1,202,828 10.99 201,612 12.96 21,038 14.79 4.69 0.71 0.92 Pune 614,340 8.04 96,418 11.24 11,619 7.25 4 0.67 0.91 Surat 632,196 12.74 63,467 14.55 4,602 13.39 2.8 0.65 0.77 Kanpur 372,172 6.94 47,029 12.21 4,773 4.42 2 0.67 0.67 Jaipur 692,512 14.69 99,732 10.93 26,714 15.37 3.43 0.66 1.26 Lucknow 537,396 8.42 74,701 11.42 11,470 4.16 2.96 0.67 1.11 Nagpur 650,001 11.8 48,605 13.15 13,551 10.31 2.51 0.62 1.07 Patna 260,807 5.55 41,384 10.31 14,985 5 1.37 0.7 0.69 Indore 551,729 13.61 60,029 10.15 4,331 2.06 1.37 0.65 0.73 Vadodara 498,815 10.88 58,132 9.36 6,222 3.95 2.07 0.63 1.21 Bhopal 347,571 6.86 31,815 7.82 2,973 1.13 0.63 0.67 Cochin 81,783 2.36 27,630 1.59 6,333 1.62 0.73 0.75 0.44 Coimbatore 575,041 22.14 67,661 10.86 4,485 12.71 2.76 0.65 1.70 Visakhapatnam 360,502 8.01 29,395 10.7 3,262 4.72 1.27 0.63 0.80 Ludhiana 629,856 9.62 93,531 13.87 4,374 11.57 3.48 0.65 2.26 Varanasi 316,738 10.01 21,733 10.51 2,759 1.17 0.61 0.90 Madurai 273,810 19.15 19,585 9.69 1,214 13.39 1.02 0.6 0.80 Total 165,114 8.77 3,789,948 7.84 279,582 7.56 89.11 0.72 0.82 All India 587,997 10.77 8,072,650 9.45 1,307,926 7.57 289.24 0.66 0.26 5.3 Energy intensity of urban transport
Table 11 shows energy intensity of mobility as well as transport energy intensity across major cities. Mobility energy intensity is the amount of energy associated with movement of people from one point and another point. On the other hand, transport energy intensity is given by per capita annual energy consumption by passenger transport. In the addition, the table provides information on individual city’s share, mega city-wise, in total energy consumption as well as India as a whole.
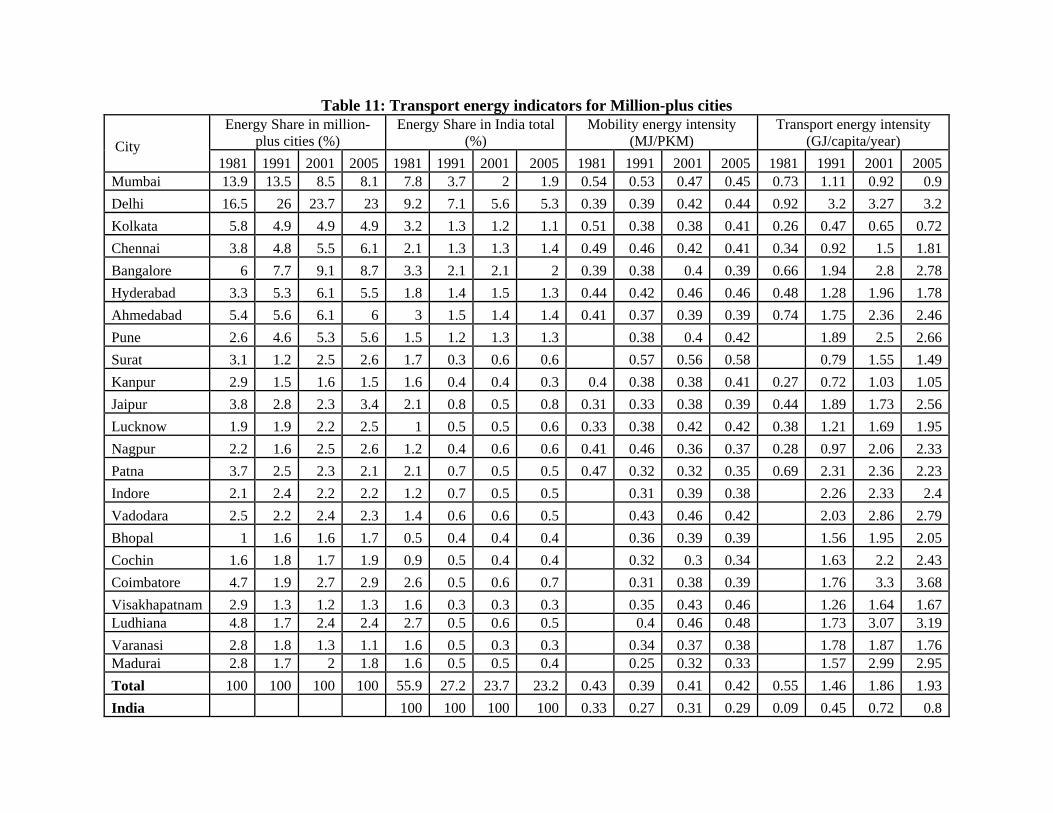
Table 11: Transport energy indicators for Million-plus cities
City
Energy Share in million-plus cities (%)
Energy Share in India total (%)
Mobility energy intensity (MJ/PKM)
Transport energy intensity (GJ/capita/year)
1981 1991 2001 2005 1981 1991 2001 2005 1981 1991 2001 2005 1981 1991 2001 2005Mumbai 13.9 13.5 8.5 8.1 7.8 3.7 2 1.9 0.54 0.53 0.47 0.45 0.73 1.11 0.92 0.9Delhi 16.5 26 23.7 23 9.2 7.1 5.6 5.3 0.39 0.39 0.42 0.44 0.92 3.2 3.27 3.2Kolkata 5.8 4.9 4.9 4.9 3.2 1.3 1.2 1.1 0.51 0.38 0.38 0.41 0.26 0.47 0.65 0.72Chennai 3.8 4.8 5.5 6.1 2.1 1.3 1.3 1.4 0.49 0.46 0.42 0.41 0.34 0.92 1.5 1.81Bangalore 6 7.7 9.1 8.7 3.3 2.1 2.1 2 0.39 0.38 0.4 0.39 0.66 1.94 2.8 2.78Hyderabad 3.3 5.3 6.1 5.5 1.8 1.4 1.5 1.3 0.44 0.42 0.46 0.46 0.48 1.28 1.96 1.78Ahmedabad 5.4 5.6 6.1 6 3 1.5 1.4 1.4 0.41 0.37 0.39 0.39 0.74 1.75 2.36 2.46Pune 2.6 4.6 5.3 5.6 1.5 1.2 1.3 1.3 0.38 0.4 0.42 1.89 2.5 2.66Surat 3.1 1.2 2.5 2.6 1.7 0.3 0.6 0.6 0.57 0.56 0.58 0.79 1.55 1.49Kanpur 2.9 1.5 1.6 1.5 1.6 0.4 0.4 0.3 0.4 0.38 0.38 0.41 0.27 0.72 1.03 1.05Jaipur 3.8 2.8 2.3 3.4 2.1 0.8 0.5 0.8 0.31 0.33 0.38 0.39 0.44 1.89 1.73 2.56Lucknow 1.9 1.9 2.2 2.5 1 0.5 0.5 0.6 0.33 0.38 0.42 0.42 0.38 1.21 1.69 1.95Nagpur 2.2 1.6 2.5 2.6 1.2 0.4 0.6 0.6 0.41 0.46 0.36 0.37 0.28 0.97 2.06 2.33Patna 3.7 2.5 2.3 2.1 2.1 0.7 0.5 0.5 0.47 0.32 0.32 0.35 0.69 2.31 2.36 2.23Indore 2.1 2.4 2.2 2.2 1.2 0.7 0.5 0.5 0.31 0.39 0.38 2.26 2.33 2.4Vadodara 2.5 2.2 2.4 2.3 1.4 0.6 0.6 0.5 0.43 0.46 0.42 2.03 2.86 2.79Bhopal 1 1.6 1.6 1.7 0.5 0.4 0.4 0.4 0.36 0.39 0.39 1.56 1.95 2.05Cochin 1.6 1.8 1.7 1.9 0.9 0.5 0.4 0.4 0.32 0.3 0.34 1.63 2.2 2.43Coimbatore 4.7 1.9 2.7 2.9 2.6 0.5 0.6 0.7 0.31 0.38 0.39 1.76 3.3 3.68Visakhapatnam 2.9 1.3 1.2 1.3 1.6 0.3 0.3 0.3 0.35 0.43 0.46 1.26 1.64 1.67Ludhiana 4.8 1.7 2.4 2.4 2.7 0.5 0.6 0.5 0.4 0.46 0.48 1.73 3.07 3.19Varanasi 2.8 1.8 1.3 1.1 1.6 0.5 0.3 0.3 0.34 0.37 0.38 1.78 1.87 1.76Madurai 2.8 1.7 2 1.8 1.6 0.5 0.5 0.4 0.25 0.32 0.33 1.57 2.99 2.95Total 100 100 100 100 55.9 27.2 23.7 23.2 0.43 0.39 0.41 0.42 0.55 1.46 1.86 1.93India 100 100 100 100 0.33 0.27 0.31 0.29 0.09 0.45 0.72 0.8
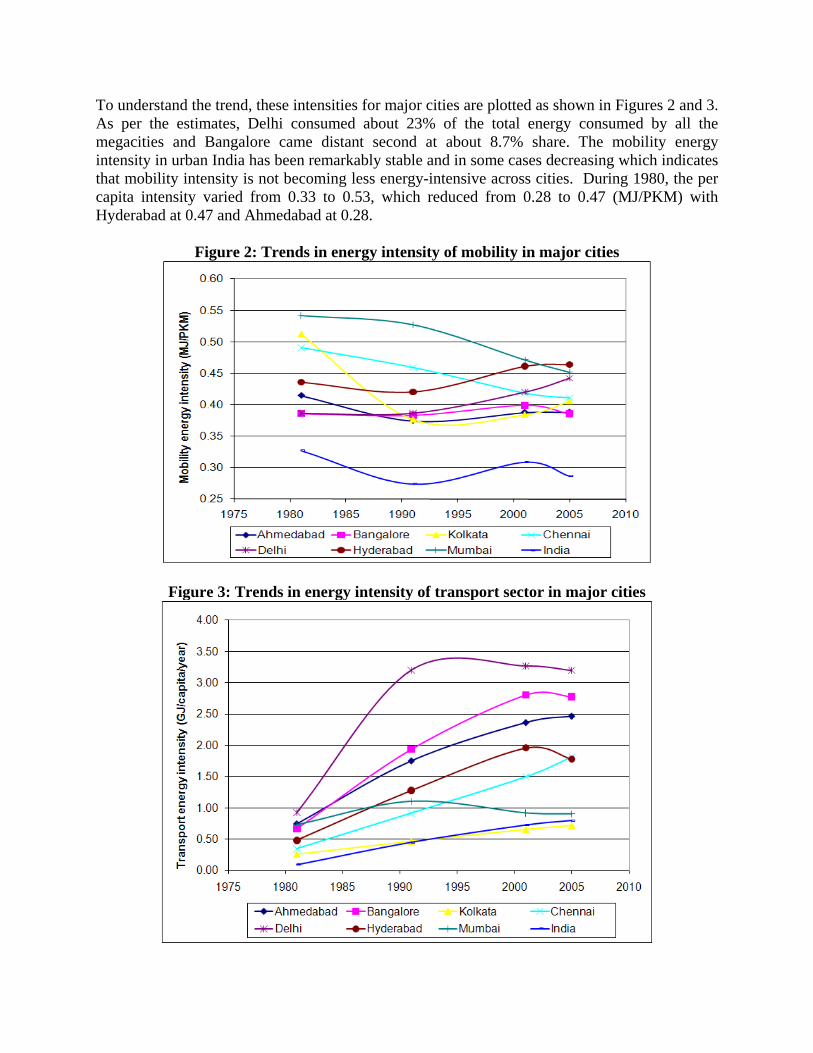
To understand the trend, these intensities for major cities are plotted as shown in Figures 2 and 3. As per the estimates, Delhi consumed about 23% of the total energy consumed by all the megacities and Bangalore came distant second at about 8.7% share. The mobility energy intensity in urban India has been remarkably stable and in some cases decreasing which indicates that mobility intensity is not becoming less energy-intensive across cities. During 1980, the per capita intensity varied from 0.33 to 0.53, which reduced from 0.28 to 0.47 (MJ/PKM) with Hyderabad at 0.47 and Ahmedabad at 0.28.
Figure 2: Trends in energy intensity of mobility in major cities
Figure 3: Trends in energy intensity of transport sector in major cities
The mobility energy intensities show a mixed trend (Figure 2). In major cities like Chennai and Mumbai, it is decreasing whereas it is increasing in cities like Delhi and Hyderabad. Dominant personal transport is likely to result in higher mobility energy intensity. Transport energy intensity (Figure 3) has increased for all the cities during the study period (1980-2005). In the case of Delhi, it increased until 1995 and then stabilized. Except for Chennai, the intensities appear to be stabilizing after 2005. Rising dependency on motorized transport causes increase transport energy intensities whereas better vehicle efficiency levels reduce it. 5.4 Carbon intensity of urban transport
Road transport-related CO2 emissions in the 23 million-plus cities have increased from 4,568 mt in 1981 to 15,288 mt in 2005, an increase of 4.2% per annum (Table 12). The increase in emissions is due to increases in road travel and also consumer choices in vehicles—in terms of heavier, higher specification vehicles (which tend to emit higher carbon emissions). A comparison of carbon intensities, in terms of kgCO2 per capita, reveal that the performance of large metropolitan cities (except Delhi and Bangalore) is better in comparison to smaller cities like Ludhiana, Vadodara, Madurai and Coimbatore whose per capita emissions are over 200 kg/year and more than three times of those of cities like Mumbai and Kolkata. The performance of Mumbai is outstanding and since 1981, the per capita emissions have decreased by half, from 110 to 66 kg. In that sense, Mumbai might be able to serve as a desirable model to catch up with the rapidly developing cities, particularly ones like Hyderabad and Ahmedabad. However, Mumbai cannot escape from need to further cut down CO2 emissions to meet the international norms. The use of private automobiles is small in Mumbai among major metropolitan regions. This is an important factor for better emission performance of the city. However, it’s performance is not spectacular when carbon intensity in terms of CO2 per PKM is considered. It compares poorly in comparison to cities like Bangalore, Ahmedabad and Pune. Possible reasons could be relatively high share of cars and old vehicles in Mumbai. Another important observation is that almost all the cities have experienced reduction in CO2 emission per PKM since 1981 and this is largely due to increasing share of modern and efficient vehicles. Opposite is the case with per capita CO2 emissions, which have increased substantially since 1981 in the case of most other cities. This indicates increased dependency on motorized transport and need for traveling longer distances even within the cities. Figure 4 shows the comparison of major cities in terms of CO2 per person per year. The per capita CO2 emissions in Bangalore have increased significantly over the years. This is due to increase in road traffic volume (vehicle-km) which was nearly four times. The data reveal that performance of cities like Kolkata and Mumbai is better in comparison to others. The CO2 performance (carbon intensity of mobility) of Bangalore and Hyderabad in terms of PKM is decreasing rapidly over years but in recent years it is getting stabilized (Figure 5). Mumbai is showing continuous decrease in carbon intensity since 1981, however, the rate of decrease has reduced significantly between 2001 and 2005.
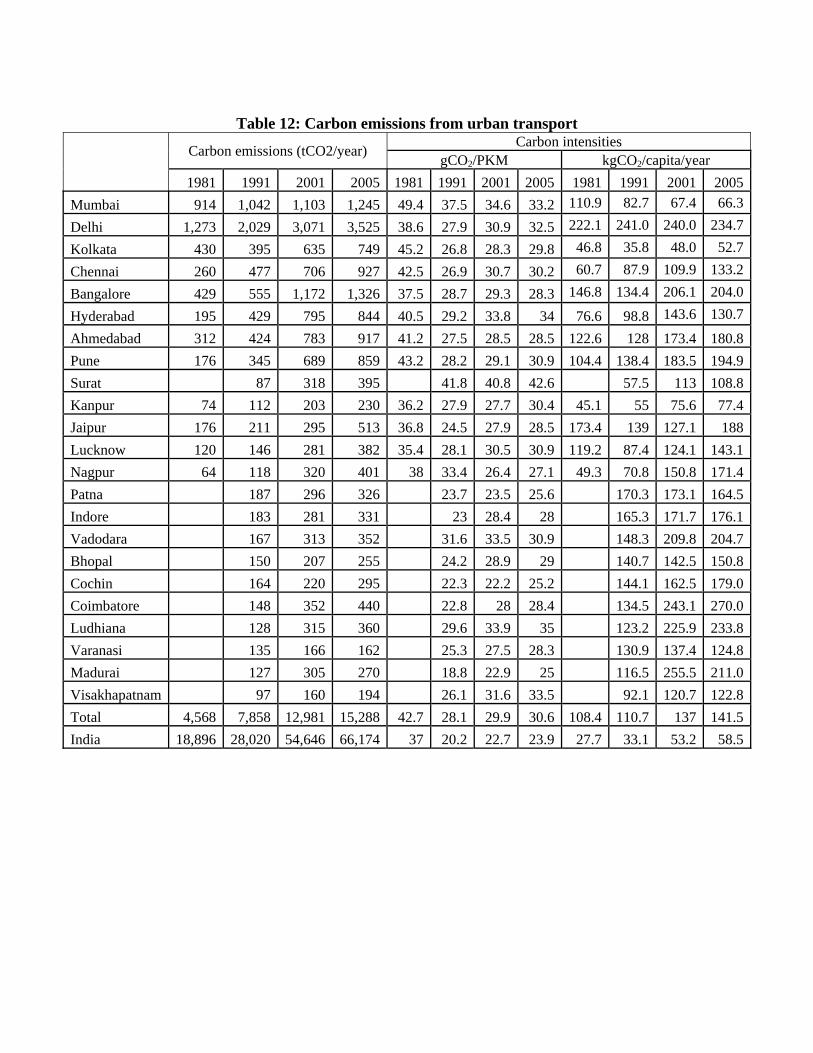
Table 12: Carbon emissions from urban transport
Carbon emissions (tCO2/year) Carbon intensities
gCO2/PKM kgCO2/capita/year1981 1991 2001 2005 1981 1991 2001 2005 1981 1991 2001 2005
Mumbai 914 1,042 1,103 1,245 49.4 37.5 34.6 33.2 110.9 82.7 67.4 66.3
Delhi 1,273 2,029 3,071 3,525 38.6 27.9 30.9 32.5 222.1 241.0 240.0 234.7
Kolkata 430 395 635 749 45.2 26.8 28.3 29.8 46.8 35.8 48.0 52.7
Chennai 260 477 706 927 42.5 26.9 30.7 30.2 60.7 87.9 109.9 133.2
Bangalore 429 555 1,172 1,326 37.5 28.7 29.3 28.3 146.8 134.4 206.1 204.0
Hyderabad 195 429 795 844 40.5 29.2 33.8 34 76.6 98.8 143.6 130.7
Ahmedabad 312 424 783 917 41.2 27.5 28.5 28.5 122.6 128 173.4 180.8Pune 176 345 689 859 43.2 28.2 29.1 30.9 104.4 138.4 183.5 194.9Surat 87 318 395 41.8 40.8 42.6 57.5 113 108.8Kanpur 74 112 203 230 36.2 27.9 27.7 30.4 45.1 55 75.6 77.4Jaipur 176 211 295 513 36.8 24.5 27.9 28.5 173.4 139 127.1 188Lucknow 120 146 281 382 35.4 28.1 30.5 30.9 119.2 87.4 124.1 143.1Nagpur 64 118 320 401 38 33.4 26.4 27.1 49.3 70.8 150.8 171.4Patna 187 296 326 23.7 23.5 25.6 170.3 173.1 164.5Indore 183 281 331 23 28.4 28 165.3 171.7 176.1Vadodara 167 313 352 31.6 33.5 30.9 148.3 209.8 204.7Bhopal 150 207 255 24.2 28.9 29 140.7 142.5 150.8Cochin 164 220 295 22.3 22.2 25.2 144.1 162.5 179.0Coimbatore 148 352 440 22.8 28 28.4 134.5 243.1 270.0Ludhiana 128 315 360 29.6 33.9 35 123.2 225.9 233.8Varanasi 135 166 162 25.3 27.5 28.3 130.9 137.4 124.8Madurai 127 305 270 18.8 22.9 25 116.5 255.5 211.0Visakhapatnam 97 160 194 26.1 31.6 33.5 92.1 120.7 122.8Total 4,568 7,858 12,981 15,288 42.7 28.1 29.9 30.6 108.4 110.7 137 141.5India 18,896 28,020 54,646 66,174 37 20.2 22.7 23.9 27.7 33.1 53.2 58.5
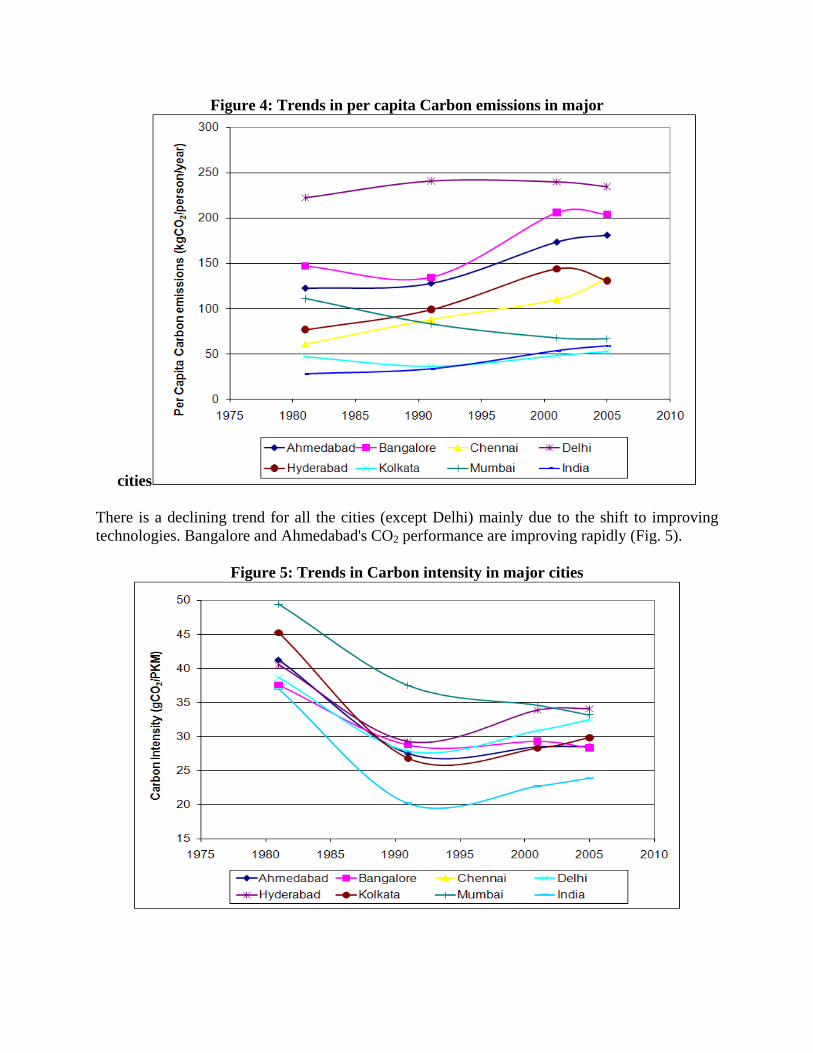
Figure 4: Trends in per capita Carbon emissions in major
cities There is a declining trend for all the cities (except Delhi) mainly due to the shift to improving technologies. Bangalore and Ahmedabad's CO2 performance are improving rapidly (Fig. 5).
Figure 5: Trends in Carbon intensity in major cities
6 Dynamics of Urban Mobility: an indicator-based assessment Mobility for an individual depends on adequacy, affordability, effectiveness, efficiency and comfortability of a transport system. Proximity to an expressway without access for people living in nearby areas serves no purpose. Similarly, having a vehicle but forced to run on a road in poor condition is highly inefficient. However, the condition where no road exists and no vehicle is available is extremely worse curtailing mobility. In general, rural people, without proper roads, make shorter trips, most either by walk or by use of bicycle. That is the reason for a significant variation in the mobility of people in urban areas and India as a whole. To assess the extent of variation in mobility over a time period (1981–2005) we have developed various indicators and also made a comparison between the indicator values obtained for mega-cities and all India. The quality of motorized mobility is also dependent on adequacy of transport system measured in terms of passenger carrying capacity and driving conditions on the road measured in terms of vehicle density. Sustainability aspect of mobility is measured using energy intensity and carbon intensity of mobility. Thus, we use a total of eight indicators to assess the temporal dynamics of urban mobility and compare them with similar indicators for India as a whole. The indicators are useful in designing a sustainable transportation system.
(i) Passenger-carrying capacity per 1000 persons: This gives the adequacy of transport system by indicating how many people the system can carry provided all the vehicle-seats are available.
(ii) Public–Private–carrying capacity ratio: The higher the ratio it would be more affordable and accessible for the poor, and also more efficient.
(iii)Vehicle density by area: This is an approximate measure of congestion of roads in a city.
(iv) Vehicle density by population: this is an approximate measure of vehicle domination/dependency in a city.
(v) Energy intensity of travel, energy intensity of transport, carbon intensity of travel and carbon intensity of transport indicates the efficiency of travel, which is a measure of technological advancement of vehicles and fuel efficiency. The energy/carbon intensity of transport indicates the efficiency of the transport sector as a whole. In addition to technological advancement and fuel efficiency it includes the effect of total energy consumption by the transport sector. For example, a city with lower dependency on motorized transport, can have lower transport intensity because of lower total energy consumption but this need not result in lower intensity of travel if it consists of highly inefficient fleet of vehicles.
Figure 5 shows the carrying capacity levels which are considerably higher in mega-cities than at all India level. Clearly, convenient transportation facilities in urban areas have significant effect on the carrying capacity. Theoretically, every two out of three persons in megacities have the provision of a seat in a motorized vehicle compared to one out of five in the countryside. Alarmingly, the ratio of public–private–carrying capacity is declining sharply, both in megacities as well as at the all-India level which shows the growth of personal vehicles. The decline appears to be sharper at all-India level compared to megacities indicating the un-sustainability nature of transport sector growth in India.
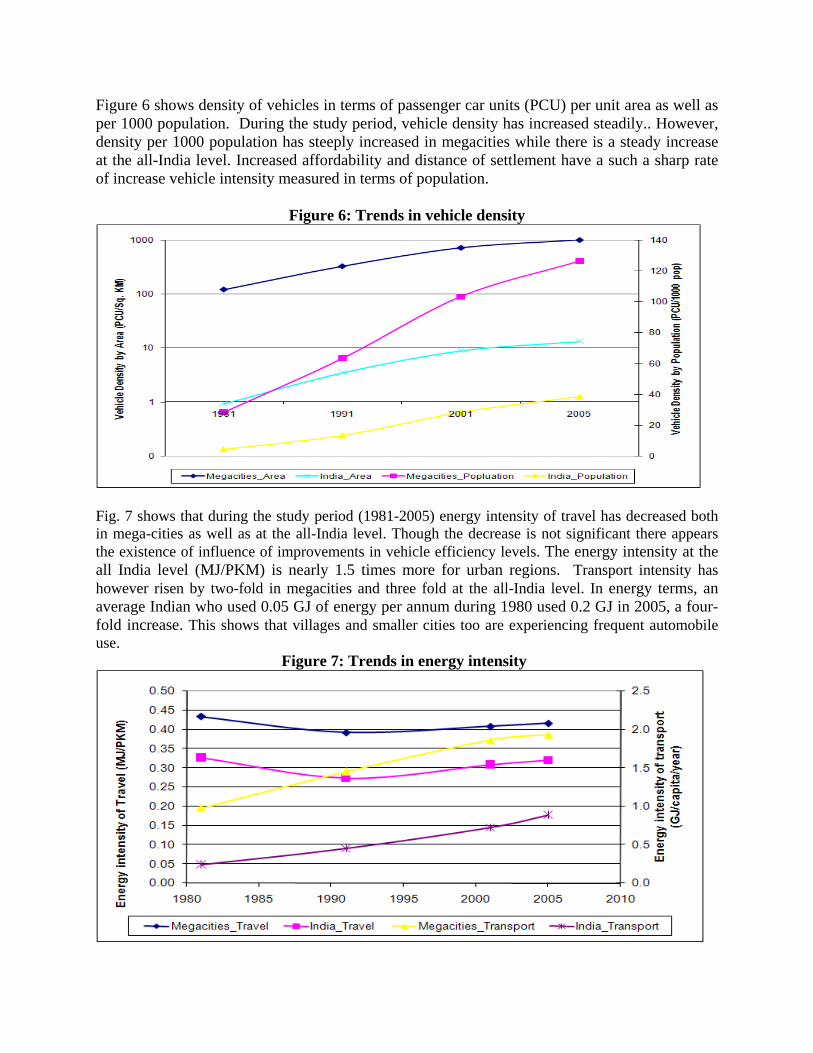
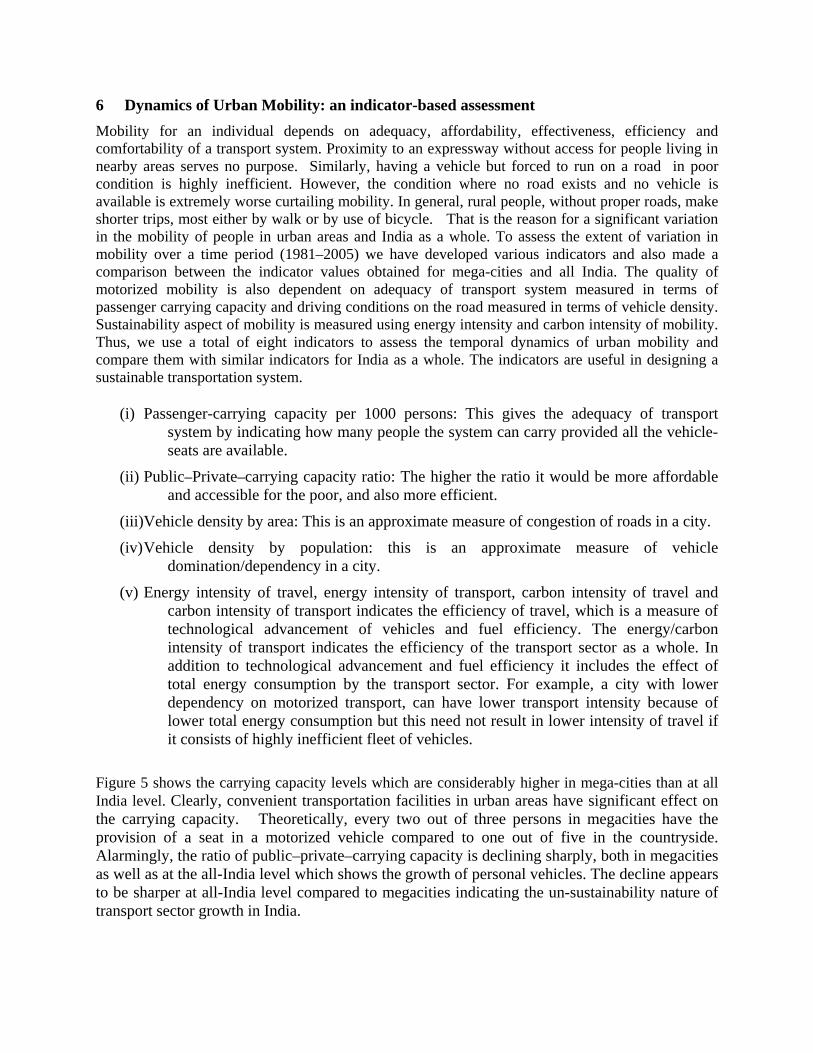
Figure 6 shows density of vehicles in terms of passenger car units (PCU) per unit area as well as per 1000 population. During the study period, vehicle density has increased steadily.. However, density per 1000 population has steeply increased in megacities while there is a steady increase at the all-India level. Increased affordability and distance of settlement have a such a sharp rate of increase vehicle intensity measured in terms of population.
Figure 6: Trends in vehicle density
Fig. 7 shows that during the study period (1981-2005) energy intensity of travel has decreased both in mega-cities as well as at the all-India level. Though the decrease is not significant there appears the existence of influence of improvements in vehicle efficiency levels. The energy intensity at the all India level (MJ/PKM) is nearly 1.5 times more for urban regions. Transport intensity has however risen by two-fold in megacities and three fold at the all-India level. In energy terms, an average Indian who used 0.05 GJ of energy per annum during 1980 used 0.2 GJ in 2005, a four-fold increase. This shows that villages and smaller cities too are experiencing frequent automobile use.
Figure 7: Trends in energy intensity
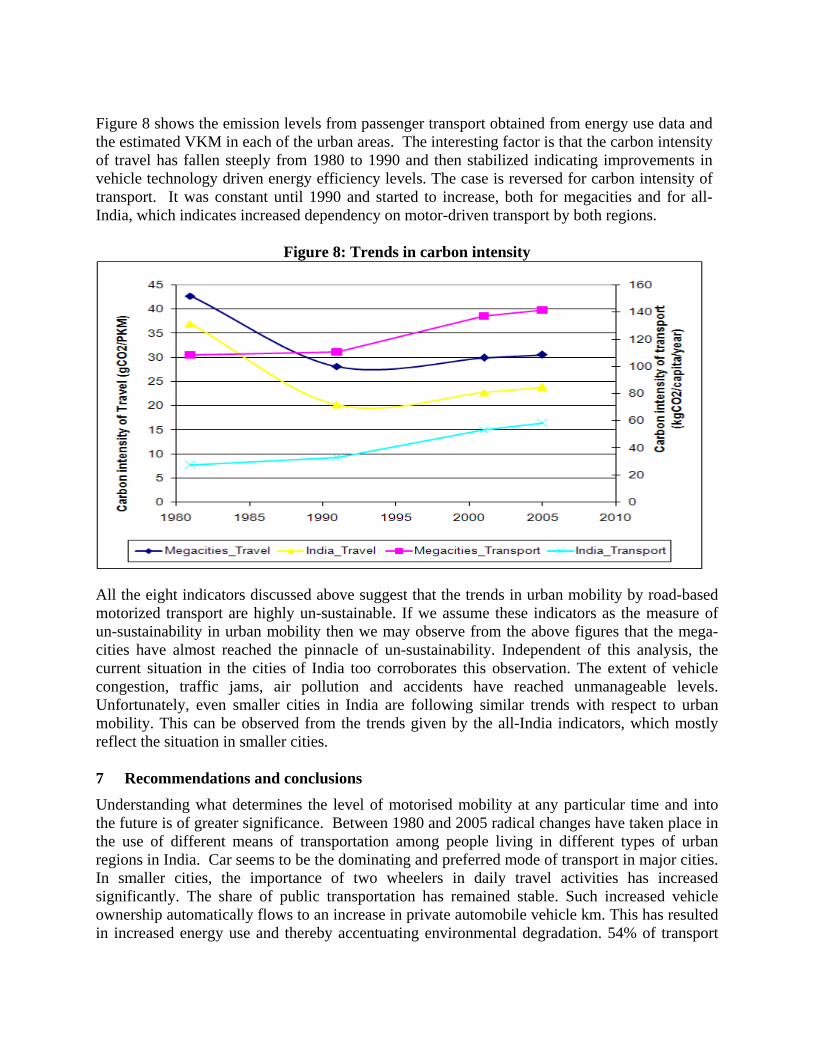
Figure 8 shows the emission levels from passenger transport obtained from energy use data and the estimated VKM in each of the urban areas. The interesting factor is that the carbon intensity of travel has fallen steeply from 1980 to 1990 and then stabilized indicating improvements in vehicle technology driven energy efficiency levels. The case is reversed for carbon intensity of transport. It was constant until 1990 and started to increase, both for megacities and for all-India, which indicates increased dependency on motor-driven transport by both regions.
Figure 8: Trends in carbon intensity
All the eight indicators discussed above suggest that the trends in urban mobility by road-based motorized transport are highly un-sustainable. If we assume these indicators as the measure of un-sustainability in urban mobility then we may observe from the above figures that the mega-cities have almost reached the pinnacle of un-sustainability. Independent of this analysis, the current situation in the cities of India too corroborates this observation. The extent of vehicle congestion, traffic jams, air pollution and accidents have reached unmanageable levels. Unfortunately, even smaller cities in India are following similar trends with respect to urban mobility. This can be observed from the trends given by the all-India indicators, which mostly reflect the situation in smaller cities. 7 Recommendations and conclusions Understanding what determines the level of motorised mobility at any particular time and into the future is of greater significance. Between 1980 and 2005 radical changes have taken place in the use of different means of transportation among people living in different types of urban regions in India. Car seems to be the dominating and preferred mode of transport in major cities. In smaller cities, the importance of two wheelers in daily travel activities has increased significantly. The share of public transportation has remained stable. Such increased vehicle ownership automatically flows to an increase in private automobile vehicle km. This has resulted in increased energy use and thereby accentuating environmental degradation. 54% of transport
emissions are produced by road transport. Of these, 90% are produced by private/commercial vehicles. Since 1990, total emissions of CO2 increased by 6% while transport emissions grew by almost 11%. In metros like Mumbai, Kolkata and Chennai, despite the increase in urban sprawl the increase has not been a significant contributor to growth in travel demand in terms of PKM despite strong growth in affluence and automobile ownership. In other cities, such as Ludhiana and Coimbatore, lack of proper public transport appears to have been pivotal in increasing growth in automobile use as a result of population increase and greater affluence. Overall, if cities minimise growth in automobile use, then they cannot overlook any of the key underlying drivers of private motorised mobility in their transport policy, strategy and management initiatives. The issues pertaining to urban mobility are manifold: rapid pace of motorization, lack of road infrastructure, shifting focus from public to private transport, and so on. Lack of proper public transportation system is the single most cause that hampers mobility and accessibility in urban regions. The example of Mumbai is a case in point which has a remarkable capability to facilitate public transport (both rail as well as bus). The bus transport is serving as a feeder line to the railway suburban transport. Recent developments including Jawaharlal Nehru Urban Renewal Mission (JNURM) which supports urban renewal raises hopes for the future. The Metro revolution is catching up. Kolkata has a metro and, now Delhi has one and soon both Bangalore and Hyderabad will get it too. Rapid bus transit system is beginning to spread across urban India. Dedicated lines for non-motorised transport are also catching up. But these efforts are restricted to major metros. It is essential to spread these to other urban centres too. Urban areas can reduce traffic congestion and air pollution by charging cars that enter the city. (as in Singapore, London, Stockholm, and Milan). In 2003, London adopted a £5 ($10) charge on all motorists driving into the center city between 7:00 a.m. and 6:30 p.m., immediately reducing the number of vehicles on the road. Within a year, bus ridership increased by 38 percent and delays dropped by 30 percent. In July 2005, the fee was raised to £8 ($16). Overall, since the congestion charge was adopted, car and minicab traffic into the central city has dropped 36 percent, while bicycle traffic has increased by 50 percent (Brown, 2008). The increasing dependence of towns and cities on imports of fossil-fuel energy is a profound risk for the future of urban transport. This risk can be mitigated in two ways. The first way is to tackle supply chain through encouragement of non-motorised as well as public transport. The second way is to increasing the tax on personal vehicles. Compared to non-motorized modes all mechanical modes are more energy-inefficient and private transport is less efficient than public transport. Successive governments have ignored public as well as non-motorised transport by spending large amounts of money on road transport and incentivising personal transport with increased number of flyovers. The combination of public transport, cycling and walking and their integration into a single, overall transport system, makes a city more livable than one that relies almost exclusively on private automobiles. There will be less noise, pollution, and congestion and country as well as
the earth will be more secure and healthier. There is no better way to develop such a vision with a stronger and more representative local government through an open, public discourse on what all residents want the city to look like. References Anon, 1994, Energy consumption and environmental effects of passenger transport modes - a life cycle study on passenger transport modes, Annual Report, Tampere University of Technology, Finland. Anon, (2004). Making the transport sector more energy efficient. http://www.energymanagertraining.com/Journal/Making%20the%20transport%20sector%20more%20energy%20efficient.pdf. Anon, 2005, Indian cities: Transport indicators, Report prepared for Ministry of Urban Development, New Delhi. Anon 2008a, Report, Ministry of Shipping, Road Transport & Highways, Govt. of India, New Delhi Anon 2008b, Report, Indian Oil Corporation, Government of India, Mumbai Anon, 2008, Study on Traffic and transportation policies and strategies in urban areas in India, Ministry of Urban Devt, GOI, New Delhi Anon, 2009, Vehicles Growth in India – Present Scenario Source: Road Transport Year Book 2006-07 (March 2009), Ministry of Shipping, Road Transport & Highways, Govt. of India Baig, M.A., (2008). “Murad Ali Baig on Motoring in India”, Pages 1 and 2, http://www.cybersteering.com/pulmain/motoring/bulletin/b_arch.html. Banister, D., (2002). Transport, Development and Sustainability, Transport Planning, Second Edition, Spoon Publishers, London, 317pp. Breheny, M., (1995), ‘Compact Cities and Transport Energy Consumption’, Transactions of the Institute of British Geographers, vol 20 (1), pp 81-101 Brown L, 2008, Rethinking on urban mobility, Open Access Article, July 09, 2008 Gakenheimer, 1999, Urban mobility in the developing world, Transport Research, Part A, No 33, 671-689 Indiastat.com (2008), http://www.indiastat.com/transport/30/vehicles/289/registeredvehicles/16443/stats.aspx
John Pucher, Nisha Korattyswaropam, Neha Mittal and Neenu Ittyerah, 2005, Urban transport crisis in India, Transport Policy 12 (2005) 185–198 Kenworthy, J. R. and Laube, F. B., (1999). Patterns of automobile dependence in cities: an international overview of key physical and economic dimensions with some implications for urban policy. Transportation Research Part A, Volume 33, 691-723. KENWORTHY, J. R. (2008) Energy Use and CO2 Production in The Urban Passenger Transport Systems of 84 International Cities: Findings and Policy Implications. Droege, P. (ed) Urban Energy Transitions. Chapter 9, pp.211-236. Elsevier. Naess 1993 Naess, P. (1993), “Energy use for transport in 22 Nordic towns”, NIBR Report No. 2, Norwegian Institute for Urban and Regional Research, Oslo. Newman, P.W. G. and Kenworthy, J. R., (1999). Sustainability and Cities: Overcoming Automobile Dependence. Island Press, Washington, USA, 442pp. Pendakur, V.S., 2002. A Policy Perspective for Sustainable Cities: Non-Motorized Transport in Asia. University of British Columbia, Vancouver, Canada. Pucher J, Korattyswaropam N, Mittal N, and Ittyerah N, 2005, Urban transport crisis in India, Transport Policy, No 12, pp 185, 198 Schafer, 1998, The global demand for motorized mobility, Transport Research Part A, Volume 32, No 6, 455-477. Singh, S.K., 2005. Review of Urban Transportation in India. Journal of Public Transportation, 8(1), 79-97. Singh, S.K., 2006. The demand for road-based passenger mobility in India: 1950-2030 and relevance for developing and developed countries. European Journal of Transport and Infrastructure Research, 6(3), 247-274. Sudhakara Reddy B, Urban Transportation Systems in India: A Tale of two cities”, Energy for Sustainable Development, Vol 4, No 1, 2000. TERI, (2006), National Energy Map for India: Technology Vision 2030, A report by The Energy and Resources Institute (TERI) and Office of the Principal Scientific Adviser, Government of India, New Delhi, http://psa.gov.in/writereaddata/11913293531_NEMI2030.pdf. Todd Goldman and Roger Gorham, Sustainable urban transport: Four innovative directions, Technology in Society 28 (2006) 261–273 van der Waals, F.M.J., (2000) The compact city and the environment: a review. Tijdschrift voor Economische en Sociale Geografie, Vol 91, No 2, pp 111-121.
Vlek, C. and Michon J, 1992, Why we should and how we could decrease the use of motor vehicles in the near future. IATSS Research. 15(2), 82-93 World Bank, 2002.Anon., 2002. India’s Transport Sector: The Challenges Ahead. The World Bank, Washington, DC. Wickham, J (2002) (Ed.), Scenarios of mobility: Experts’ images of the future in four European cities, Department of Sociology, Trinity College Dublin, Dublin 2, Ireland. Zhou N. and McNeil, M.A., 2009. Assessment of historic trend in mobility and energy use in India transportation sector using bottom-up approach. Journal of Renewable and Sustainable Energy, 1, 1-16.