dynamics of drying in 3d porous media
TRANSCRIPT
Dynamics of Drying in 3D Porous Media
Lei Xu,1 Simon Davies,2 Andrew B. Schofield,3 and David A. Weitz1
1HSEAS and Department of Physics, Harvard University, Cambridge, Massachusetts 02138, USA2ICI Strategic Technology Group, R320 Wilton Centre, Redcar TS104RF, United Kingdom3The School of Physics, University of Edinburgh, Edinburgh EH9 3JZ, United Kingdom
(Received 9 June 2008; published 27 August 2008)
The drying dynamics in three dimensional porous media are studied with confocal microscopy. We
observe abrupt air invasions in size from single particle to hundreds of particles. We show that these result
from the strong flow from menisci in large pores to menisci in small pores during drying. This flow causes
air invasions to start in large menisci and subsequently spread throughout the entire system. We measure
the size and structure of the air invasions and show that they are in accord with invasion percolation. By
varying the particle size and contact angle we unambiguously demonstrate that capillary pressure
dominates the drying process.
DOI: 10.1103/PhysRevLett.101.094502 PACS numbers: 47.56.+r, 47.55.Ca, 47.57.�s
Drying is a ubiquitous natural process; it is of particularimportance and interest for porous media where there aremany important applications, including soil drying in agri-culture, recovery of volatile hydrocarbons from under-ground oil reservoirs, spray drying in food and pharmaceu-tical industries, and drying of paint and ceramic powders.Drying in porous media is often described theoretically byinvasion percolation (IP) [1–4] and modeled by immiscibledisplacement experiments in two dimensions [5]. How-ever, despite its great importance, direct imaging of dryingin three dimensional (3D) porous media is rare, largely dueto thedifficultyof visualization in3Dporousmedia. Instead,indirect measurements such as light scattering and acousticmethods[2],conductancemeasurement[6],orpressuremea-surement [7–9] have been used. While valuable informa-tion is deduced with these techniques, many importantdynamical features of drying, such as the flow pattern,the structure of the abrupt bursts and the liquid redistribu-tion, remain poorly characterized. To study them, thecritical investigation by direct imaging is indispensable.
In this Letter, we study drying dynamics in 3D porousmedia by direct imaging with confocal microscopy. Weobserve a strong flow from the menisci in large pores to themenisci in small pores during drying. The flow causesabrupt air invasions starting from large menisci whichsubsequently spread throughout the entire system. Thesize, structure and dynamics of these invasions are ex-plained by 3D invasion percolation coupled with liquidredistribution [7,8]. The liquid redistribution is confirmedby direct observation. By varying the particle size andcontact angle we also demonstrate unambiguously thatcapillary pressure dominates the drying process.
Porous media are prepared by evaporating a high con-centration colloidal suspension, composed of fluorescentlylabeled PMMA particles (density �PMMA ¼ 1:19 g=cm3
and index of refraction nPMMA ¼ 1:49) suspended in dec-alin (�dec ¼ 0:897 g=cm3, ndec ¼ 1:48). The particles andsolvent are closely index matched, allowing 3D visualiza-
tion through more than 100 particle layers using confocalmicroscopy. Samples are dried on clean glass substrateswith the initial volume fractions between 30% and 40%.The overall drying process is demonstrated by evapo-
rating a drop of suspension (3:8 �l) with particle size
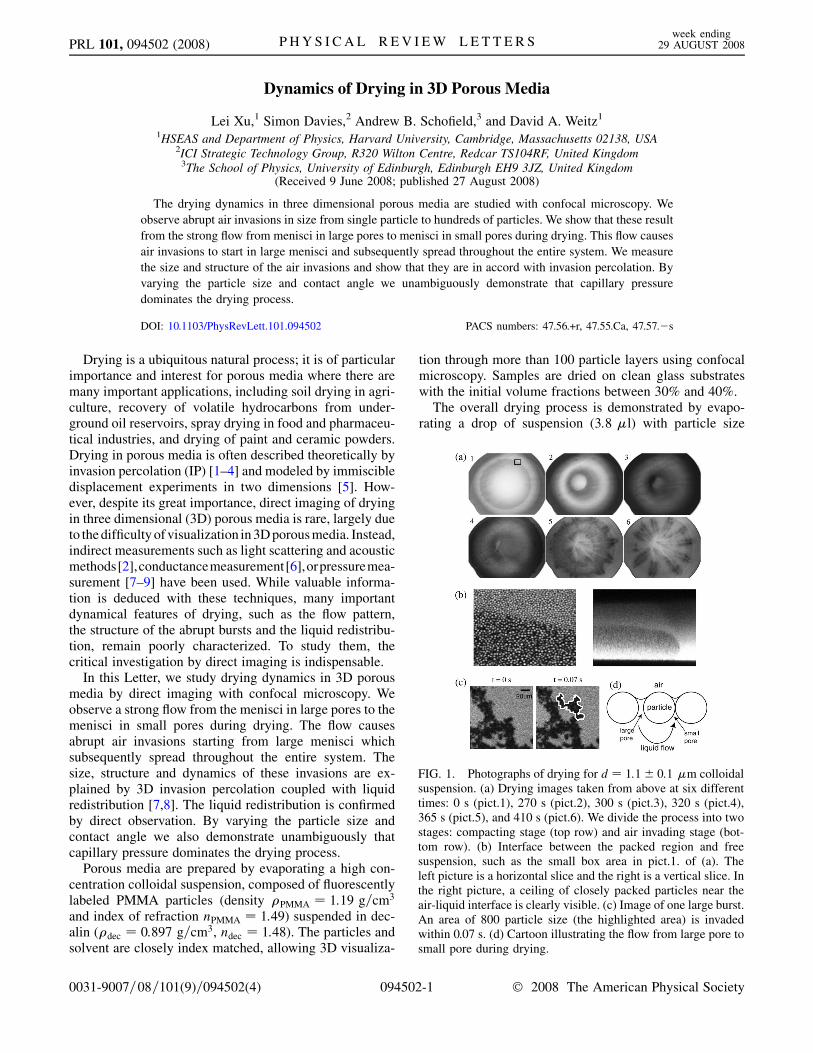
FIG. 1. Photographs of drying for d ¼ 1:1� 0:1 �m colloidalsuspension. (a) Drying images taken from above at six differenttimes: 0 s (pict.1), 270 s (pict.2), 300 s (pict.3), 320 s (pict.4),365 s (pict.5), and 410 s (pict.6). We divide the process into twostages: compacting stage (top row) and air invading stage (bot-tom row). (b) Interface between the packed region and freesuspension, such as the small box area in pict.1. of (a). Theleft picture is a horizontal slice and the right is a vertical slice. Inthe right picture, a ceiling of closely packed particles near theair-liquid interface is clearly visible. (c) Image of one large burst.An area of 800 particle size (the highlighted area) is invadedwithin 0.07 s. (d) Cartoon illustrating the flow from large pore tosmall pore during drying.
PRL 101, 094502 (2008) P HY S I CA L R EV I EW LE T T E R Sweek ending
29 AUGUST 2008
0031-9007=08=101(9)=094502(4) 094502-1 � 2008 The American Physical Society
d ¼ 1:1� 0:1 �m. The drying is divided into two stages:The suspension is initially compacted as decalin evapo-rates and the colloid volume fraction increases. Because ofthe coffee-ring effect [10], the suspension compacts at thedroplet edge with the randomly close-packed particles,creating a network of pores. Images of horizontal (xy)and vertical (xz) cross sections taken at the interface be-tween the packed region and free suspension are shown inFig. 1(b). Particles can not move once they are in thepacked region. Interestingly, the xz section indicates thatthe packed region forms a ‘‘ceiling’’ on the top of thedroplet due to the lowering of the air-liquid interfacefrom evaporation. As solvent evaporates, the dense regionat the edge grows towards the center and eventually fills theentire system [Figs. 1(a), top three images]. In the secondstage, air invades the system. Cracks appear first, indicat-ing large stresses in the system, then air continues to invadethe network of pores until all the liquid is evaporated(bottom three images). It is the second stage which is thefocus of this study.
This second stage is characterized by a series of abruptair invasions, or bursts [7–9,11,12]. A typical burst isidentified with confocal microscopy by a bright area sud-denly turning black, corresponding to the displacement ofdecalin by air, which is optically mismatched, as illustratedby the highlighted area in Fig. 1(c). In a single step, within0.07 s, an area of about 800 particle area is invaded. Thisabrupt behavior indicates that some large stress is drivingthe process.
The dominant stress during drying is the capillary pres-sure from the tiny menisci [13]:
�P ¼ 2� cos�
r; (1)
where � is the surface tension coefficient, � is the solvent-
particle contact angle and r is the radius of curvature whichis typically r ’ 0:1R for randomly close-packed spheres ofradius R. Since �dec ¼ 31 mN=m and cos� ’ 1, Eq. (1)gives an enormous pressure: �P� 6� 105 Pa� 6 atmfor d ¼ 1:1 �m particles. Relative to the ambient pressuresurrounding the droplet, P0, the liquid within the pores hasa very low pressure: P0 ��P. Therefore every meniscusacts like a low pressure pump trying to suck liquid fromother places. Because of the inhomogeneity of the poresizes, the menisci in small pores can produce lower pres-sure and draws liquid from menisci in large pores, asillustrated by the cartoon in Fig. 1(d). We emphasize thatthis flow is quite different from the capillary flow in thecoffee-ring problem, wherein the faster evaporation rate atthe droplet edge leads to bulk flow outwards from thecenter to the edge. This flow would move the air-liquidinterface rapidly through the large pores, creating bursts.The bursting process will terminate either when all thepores are small enough to balance the capillary pressureor when the displaced liquid flows to the nearby menisciand reduces the capillary pressure. Previous research in 2Dsystems proposed that the later mechanism results in anexponential cutoff of burst size [7,8].To visualize this flow, we add a small quantity of tiny
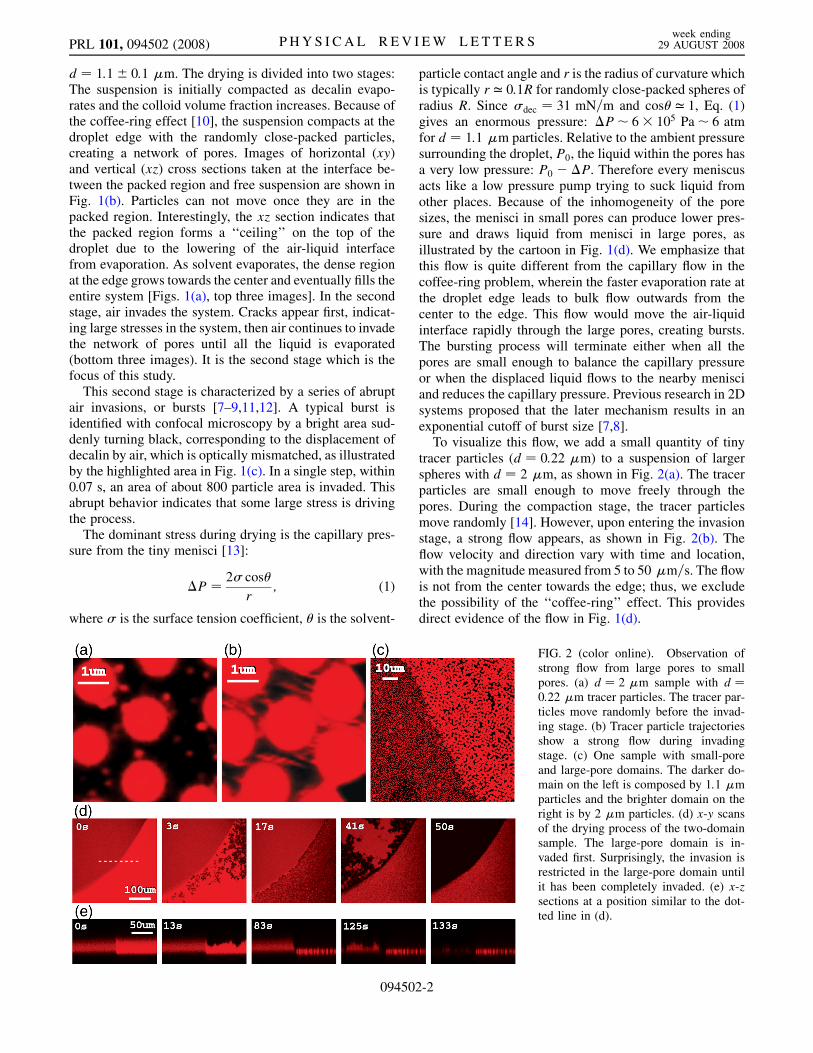
tracer particles (d ¼ 0:22 �m) to a suspension of largerspheres with d ¼ 2 �m, as shown in Fig. 2(a). The tracerparticles are small enough to move freely through thepores. During the compaction stage, the tracer particlesmove randomly [14]. However, upon entering the invasionstage, a strong flow appears, as shown in Fig. 2(b). Theflow velocity and direction vary with time and location,with the magnitude measured from 5 to 50 �m=s. The flowis not from the center towards the edge; thus, we excludethe possibility of the ‘‘coffee-ring’’ effect. This providesdirect evidence of the flow in Fig. 1(d).
FIG. 2 (color online). Observation ofstrong flow from large pores to smallpores. (a) d ¼ 2 �m sample with d ¼0:22 �m tracer particles. The tracer par-ticles move randomly before the invad-ing stage. (b) Tracer particle trajectoriesshow a strong flow during invadingstage. (c) One sample with small-poreand large-pore domains. The darker do-main on the left is composed by 1:1 �mparticles and the brighter domain on theright is by 2 �m particles. (d) x-y scansof the drying process of the two-domainsample. The large-pore domain is in-vaded first. Surprisingly, the invasion isrestricted in the large-pore domain untilit has been completely invaded. (e) x-zsections at a position similar to the dot-ted line in (d).
PRL 101, 094502 (2008) P HY S I CA L R EV I EW LE T T E R Sweek ending
29 AUGUST 2008
094502-2
To confirm that the flow is indeed from large to smallmenisci, we prepare samples comprised of two distinctdomains of differing particle diameters (d ¼ 1 m�m and2 �m), illustrated in Fig. 2(c). Various times in the dryingprocess at the boundary of the two domains are highlightedby the xy sections shown in Fig. 2(d). The large-poredomain (right) is invaded first, proving that air invasionsstart in large pores. Strikingly, fluid displacements arerestricted to the large-pore domain until it has been com-pletely invaded. Since evaporation occurs everywhere, theonly way to halt air invasions at the boundary between thedomains is to cause a macroscopic flow from the large-poreto the small-pore domain to compensate for evaporation.The large-pore domain effectively serves as a liquid reser-voir which prevents drying of the small-pore domain untilthe reservoir is completely exhausted. A similar process inthe xz direction is shown in Fig. 2(e). This phenomenon isfurther proof confirming the flow pattern from large tosmall menisci shown in Fig. 1(d). Moreover, it provides ameans to precisely control the order of drying. It alsoillustrates a method to spontaneously concentrate materialto small-pore regions through drying.
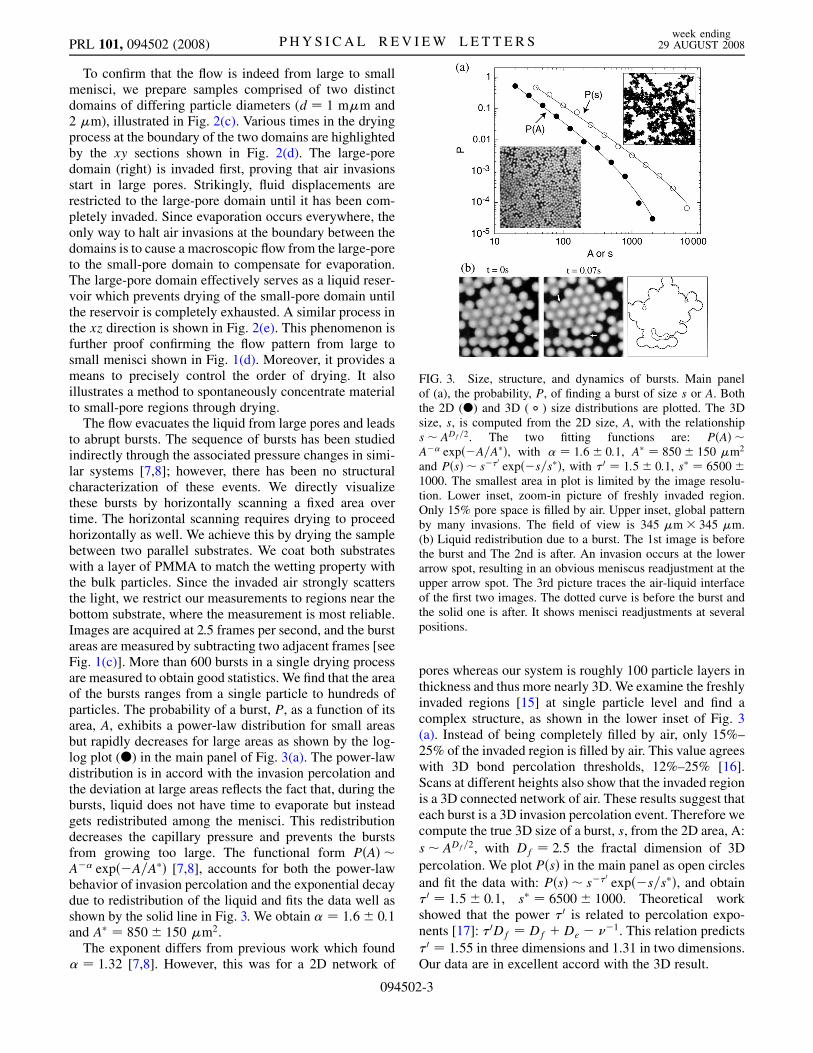
The flow evacuates the liquid from large pores and leadsto abrupt bursts. The sequence of bursts has been studiedindirectly through the associated pressure changes in simi-lar systems [7,8]; however, there has been no structuralcharacterization of these events. We directly visualizethese bursts by horizontally scanning a fixed area overtime. The horizontal scanning requires drying to proceedhorizontally as well. We achieve this by drying the samplebetween two parallel substrates. We coat both substrateswith a layer of PMMA to match the wetting property withthe bulk particles. Since the invaded air strongly scattersthe light, we restrict our measurements to regions near thebottom substrate, where the measurement is most reliable.Images are acquired at 2.5 frames per second, and the burstareas are measured by subtracting two adjacent frames [seeFig. 1(c)]. More than 600 bursts in a single drying processare measured to obtain good statistics. We find that the areaof the bursts ranges from a single particle to hundreds ofparticles. The probability of a burst, P, as a function of itsarea, A, exhibits a power-law distribution for small areasbut rapidly decreases for large areas as shown by the log-log plot (d) in the main panel of Fig. 3(a). The power-lawdistribution is in accord with the invasion percolation andthe deviation at large areas reflects the fact that, during thebursts, liquid does not have time to evaporate but insteadgets redistributed among the menisci. This redistributiondecreases the capillary pressure and prevents the burstsfrom growing too large. The functional form PðAÞ �A�� expð�A=A�Þ [7,8], accounts for both the power-lawbehavior of invasion percolation and the exponential decaydue to redistribution of the liquid and fits the data well asshown by the solid line in Fig. 3. We obtain � ¼ 1:6� 0:1and A� ¼ 850� 150 �m2.
The exponent differs from previous work which found� ¼ 1:32 [7,8]. However, this was for a 2D network of
pores whereas our system is roughly 100 particle layers inthickness and thus more nearly 3D. We examine the freshlyinvaded regions [15] at single particle level and find acomplex structure, as shown in the lower inset of Fig. 3(a). Instead of being completely filled by air, only 15%–25% of the invaded region is filled by air. This value agreeswith 3D bond percolation thresholds, 12%–25% [16].Scans at different heights also show that the invaded regionis a 3D connected network of air. These results suggest thateach burst is a 3D invasion percolation event. Therefore wecompute the true 3D size of a burst, s, from the 2D area, A:
s� ADf=2, with Df ¼ 2:5 the fractal dimension of 3D
percolation. We plot PðsÞ in the main panel as open circles
and fit the data with: PðsÞ � s��0 expð�s=s�Þ, and obtain�0 ¼ 1:5� 0:1, s� ¼ 6500� 1000. Theoretical workshowed that the power �0 is related to percolation expo-nents [17]: �0Df ¼ Df þDe � ��1. This relation predicts
�0 ¼ 1:55 in three dimensions and 1.31 in two dimensions.Our data are in excellent accord with the 3D result.
FIG. 3. Size, structure, and dynamics of bursts. Main panelof (a), the probability, P, of finding a burst of size s or A. Boththe 2D (d) and 3D ( � ) size distributions are plotted. The 3Dsize, s, is computed from the 2D size, A, with the relationships� ADf=2. The two fitting functions are: PðAÞ �A�� expð�A=A�Þ, with � ¼ 1:6� 0:1, A� ¼ 850� 150 �m2
and PðsÞ � s��0 expð�s=s�Þ, with �0 ¼ 1:5� 0:1, s� ¼ 6500�1000. The smallest area in plot is limited by the image resolu-tion. Lower inset, zoom-in picture of freshly invaded region.Only 15% pore space is filled by air. Upper inset, global patternby many invasions. The field of view is 345 �m� 345 �m.(b) Liquid redistribution due to a burst. The 1st image is beforethe burst and The 2nd is after. An invasion occurs at the lowerarrow spot, resulting in an obvious meniscus readjustment at theupper arrow spot. The 3rd picture traces the air-liquid interfaceof the first two images. The dotted curve is before the burst andthe solid one is after. It shows menisci readjustments at severalpositions.
PRL 101, 094502 (2008) P HY S I CA L R EV I EW LE T T E R Sweek ending
29 AUGUST 2008
094502-3
The sequence of bursts quickly spreads throughout thefield of view and forms a macroscopic pattern, as shown inthe picture taken at the moment when invasions first per-colate the field of view (345 �m� 345 �m) in the upperinset of Fig. 3(a). The pattern is fractal-like and similar toprevious experiment [3]. However, from the magnifiedimage in lower inset, we determine that the black regionis not completely filled by air, but instead forms 3D perco-lated networks of air.
We can also directly determine the origin for the expo-nential cut-off: the liquid redistribution. In two framesseparated by 0.07 s, we catch a single burst and the sub-sequent liquid redistribution. The two frames are shown inthe two pictures of Fig. 3(b) on the left. The first picture isbefore the burst while the second is after. The burst occursat the spot indicated by the lower arrow and an obviousmeniscus readjustment occurs at the spot indicated by theupper arrow. More careful comparison is done in the thirdpicture of Fig. 3(b), where we trace the air-liquid interfacesof the first two pictures. The dotted line is the interfacebefore the burst while the solid line is after. There aremeniscus readjustments in several places. These readjust-ments reduce the capillary pressure and lead to the expo-nential cut-off, s�. This observation provides unambiguousevidence for the redistribution argument proposed by pre-vious indirect measurements [7,8].
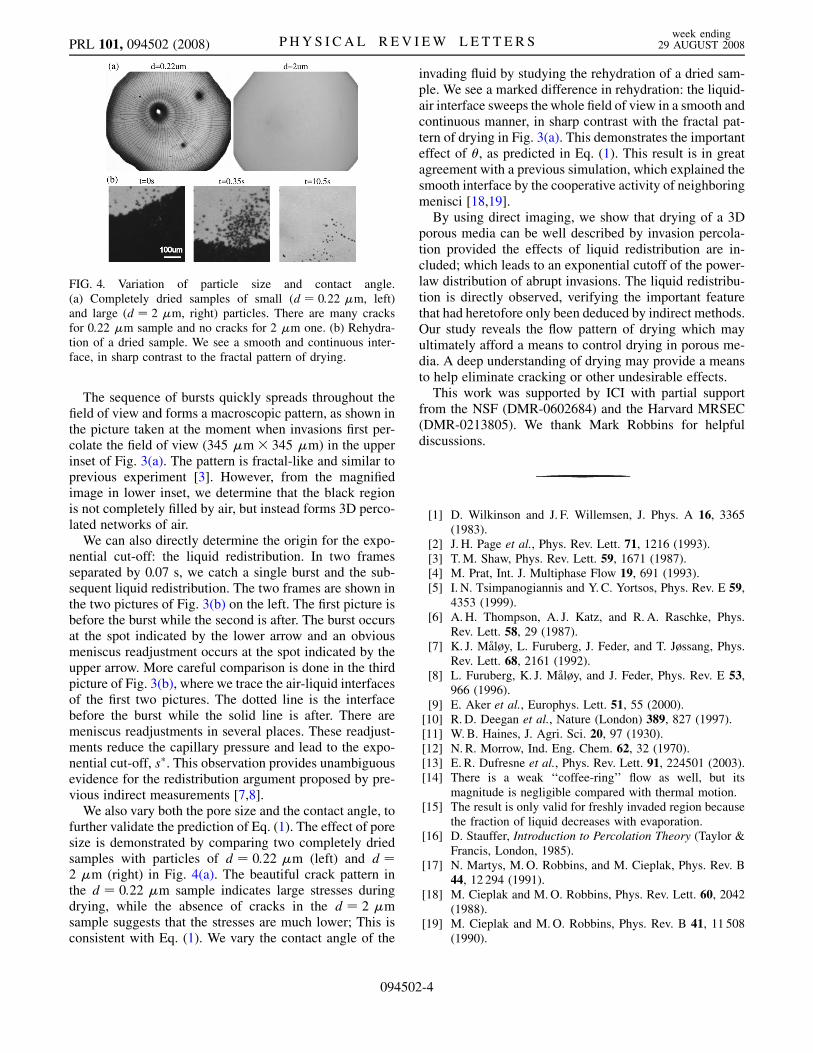
We also vary both the pore size and the contact angle, tofurther validate the prediction of Eq. (1). The effect of poresize is demonstrated by comparing two completely driedsamples with particles of d ¼ 0:22 �m (left) and d ¼2 �m (right) in Fig. 4(a). The beautiful crack pattern inthe d ¼ 0:22 �m sample indicates large stresses duringdrying, while the absence of cracks in the d ¼ 2 �msample suggests that the stresses are much lower; This isconsistent with Eq. (1). We vary the contact angle of the
invading fluid by studying the rehydration of a dried sam-ple. We see a marked difference in rehydration: the liquid-air interface sweeps the whole field of view in a smooth andcontinuous manner, in sharp contrast with the fractal pat-tern of drying in Fig. 3(a). This demonstrates the importanteffect of �, as predicted in Eq. (1). This result is in greatagreement with a previous simulation, which explained thesmooth interface by the cooperative activity of neighboringmenisci [18,19].By using direct imaging, we show that drying of a 3D
porous media can be well described by invasion percola-tion provided the effects of liquid redistribution are in-cluded; which leads to an exponential cutoff of the power-law distribution of abrupt invasions. The liquid redistribu-tion is directly observed, verifying the important featurethat had heretofore only been deduced by indirect methods.Our study reveals the flow pattern of drying which mayultimately afford a means to control drying in porous me-dia. A deep understanding of drying may provide a meansto help eliminate cracking or other undesirable effects.This work was supported by ICI with partial support
from the NSF (DMR-0602684) and the Harvard MRSEC(DMR-0213805). We thank Mark Robbins for helpfuldiscussions.
[1] D. Wilkinson and J. F. Willemsen, J. Phys. A 16, 3365(1983).
[2] J. H. Page et al., Phys. Rev. Lett. 71, 1216 (1993).[3] T.M. Shaw, Phys. Rev. Lett. 59, 1671 (1987).[4] M. Prat, Int. J. Multiphase Flow 19, 691 (1993).[5] I. N. Tsimpanogiannis and Y.C. Yortsos, Phys. Rev. E 59,
4353 (1999).[6] A. H. Thompson, A. J. Katz, and R.A. Raschke, Phys.
Rev. Lett. 58, 29 (1987).[7] K. J. Maløy, L. Furuberg, J. Feder, and T. Jøssang, Phys.
Rev. Lett. 68, 2161 (1992).[8] L. Furuberg, K. J. Maløy, and J. Feder, Phys. Rev. E 53,
966 (1996).[9] E. Aker et al., Europhys. Lett. 51, 55 (2000).[10] R. D. Deegan et al., Nature (London) 389, 827 (1997).[11] W.B. Haines, J. Agri. Sci. 20, 97 (1930).[12] N. R. Morrow, Ind. Eng. Chem. 62, 32 (1970).[13] E. R. Dufresne et al., Phys. Rev. Lett. 91, 224501 (2003).[14] There is a weak ‘‘coffee-ring’’ flow as well, but its
magnitude is negligible compared with thermal motion.[15] The result is only valid for freshly invaded region because
the fraction of liquid decreases with evaporation.[16] D. Stauffer, Introduction to Percolation Theory (Taylor &
Francis, London, 1985).[17] N. Martys, M.O. Robbins, and M. Cieplak, Phys. Rev. B
44, 12 294 (1991).[18] M. Cieplak and M.O. Robbins, Phys. Rev. Lett. 60, 2042
(1988).[19] M. Cieplak and M.O. Robbins, Phys. Rev. B 41, 11 508
(1990).
FIG. 4. Variation of particle size and contact angle.(a) Completely dried samples of small (d ¼ 0:22 �m, left)and large (d ¼ 2 �m, right) particles. There are many cracksfor 0:22 �m sample and no cracks for 2 �m one. (b) Rehydra-tion of a dried sample. We see a smooth and continuous inter-face, in sharp contrast to the fractal pattern of drying.
PRL 101, 094502 (2008) P HY S I CA L R EV I EW LE T T E R Sweek ending
29 AUGUST 2008
094502-4