dynamics of aboveground and soil carbon and nitrogen stocks and cycling of available nitrogen along...
TRANSCRIPT
Dynamics of Aboveground and SoilCarbon and Nitrogen Stocks and
Cycling of Available Nitrogen alonga Land-use Gradient in
Rondonia, BrazilR. Flint Hughes,1* J. Boone Kauffman,2 and Dian L. Cummings2
1Department of Forest Science, Oregon State University, Corvallis, Oregon, 97331, USA; and 2Department of Fisheries andWildlife, Oregon State University, Corvallis, Oregon, 97331, USA
ABSTRACTHigh rates of deforestation in the Brazilian Amazonhave the potential to alter the storage and cycling ofcarbon (C) and nitrogen (N) across this region. Toinvestigate the impacts of deforestation, we quan-tified total aboveground biomass (TAGB),aboveground and soil pools of C and N, and soil Navailability along a land-use gradient in Rondonia,Brazil, that included standing primary forest,slashed primary and secondary forest, shifting cul-tivation, and pasture sites. TAGB decreased sub-stantially with increasing land use, ranging from311 and 399 Mg ha–1 (primary forests) to 63 Mgha–1 (pasture). Aboveground C and N pools de-clined in patterns and magnitudes similar to thoseof TAGB. Unlike aboveground pools, soil C and Nconcentrations and pools did not show consistentdeclines in response to land use. Instead, C and Nconcentrations were strongly related to percent claycontent of soils. Concentrations of NO3-N and
NH4-N generally increased in soils following slash-and-burn events along the land-use gradient anddecreased with increasing land use. Increasing landuse resulted in marked declines in NO3-N poolsrelative to NH4-N pools. Rates of net nitrificationand N-mineralization were also generally higher inpostfire treatments relative to prefire treatmentsalong the land-use gradient and declined with in-creasing land use. Results demonstrate the linkedresponses of aboveground C and N pools and soil Navailability to land use in the Brazilian Amazon;steady reductions in aboveground pools along theland-use gradient were accompanied by declines ininorganic soil N pools and transformation rates.
Key words: tropical forests; Brazilian Amazon;land-use change; aboveground and soil C and Npools; soil inorganic N; net nitrification; net N-min-eralization.
INTRODUCTION
Deforestation of the world’s tropical forests via bio-mass burning has been identified as a significantsource of greenhouse gases to the atmosphere
(Crutzen and Andreae 1990; Schimel and others1995; Houghton 1999). In the Brazilian Amazon,deforestation rates ranged from 1.1 million to 2.9million ha y–1 during the 1990s (Brazil INPE 1998).Such high rates of deforestation within this largeregion have the capacity to significantly alterstorage and cycling of carbon (C) and nitrogen(N) at local, regional, and global scales (Fearnside1997).
Deforestation in the Brazilian Amazon often con-
Received 20 July 2000; accepted 17 October 2001.*Corresponding author; present address: Institute of Pacific Islands Forestry,USDA Forest Service, 23 East Kawili Street, Hilo, Hawaii 96720, USA;email: [email protected]
Ecosystems (2002) 5: 244–259DOI: 10.1007/s10021-001-0069-1 ECOSYSTEMS
© 2002 Springer-Verlag
244

sists of cutting and burning of mature forests forconversion to pastures or croplands. In addition,established pastures are commonly burned to pro-mote grass productivity and reduce woody speciescover, and forest fallows (that is, young regenerat-ing forests) are burned to return lands to pasture orcropland. Such land use results in substantial fluxesof aboveground C and nutrient pools to the atmo-sphere. In Rondonia, Brazil, cutting and burning ofmature tropical forests resulted in abovegroundfluxes to the atmosphere of 58–102 Mg C ha–1 and1019–1605 kg N ha–1 (Kauffman and others 1995;Guild and others 1998). Burning of regeneratingforests in Rondonia resulted in fluxes of 20 to 47Mg C ha–1 and 306 to 709 kg N ha–1 (Hughes andothers 2000), and pasture fires resulted in fluxes of9–16 Mg C ha–1 and 88–240 kg N ha–1 (Kauffmanand others 1998; Guild and others 1998). These aregross fluxes rather than net fluxes because they donot account for subsequent reaccumulations ofaboveground C and N stocks during the regrowth offorest fallows and pastures. However, they do rep-resent the disturbance processes by which matureforests are eventually replaced by a matrix of land-cover types that, at equilibrium, is predicted to sup-port only 6% of the aboveground biomass and Cpools sustained by those original forested systems(Fearnside 1996).
In contrast to losses of aboveground C and Npools with sustained land use following deforesta-tion in the Brazilian Amazon, consistent patterns ofC and N decline in soils in response to land use havenot been documented. Some studies have showndecreases in soil C storage associated with forest-to-pasture conversion (Desjardins and others 1994;Eden and others 1991; Camargo and others 1999),whereas others have shown increases (Chone andothers 1991; de Moraes and others 1996; Neill andothers 1995). Variation in both the direction andmagnitude of response of soil C pools to forest-to-pasture conversion can be explained in part by landmanagement practices (Trumbore and others 1995;Neill and others 1995; Buschbacher and others1988). Soil texture has been shown to influence theresponse of soil C pools to land use as well (deMoraes and others 1996).
Inorganic N pools and rates of N transformationin soils are often accurate indexes of the impacts ofdeforestation and land use on site fertility (Nadel-hoffer and others 1983; Vitousek and Matson1988). In addition, soil N availability, along withsoil water content, are primary determinants of theproduction of trace gasses such as nitrous oxide(N2O) and nitric oxide (NO) in tropical soils (Da-vidson and others 2000). In Rondonia, Brazil, Neill
and others (1995) found significantly lower rates ofnet N-mineralization and nitrification in pasturesoils more than 3 years old relative to forest soilsand a reduction in the contribution of NO3-N to soilinorganic N pools in pastures relative to forests.Investigations into impacts of land use on N trans-formation rates along a series of sites that includedprimary and secondary forests as well as pastures inPara, Brazil, by Verchot and others (1999) foundthat primary forest soils generally exhibited higherrates of net nitrification and mineralization thansecondary forest and pasture soils.
As the primary agent of disturbance during land-use cycles in the Brazilian Amazon, fire has thecapacity to strongly influence pools and transfor-mation rates of inorganic N. Although fires in trop-ical forest systems have generally been shown toincrease soil inorganic N pools and rates of N trans-formation for up to 6 months following fire (Uhland Jordan 1984; Matson and others 1987; Mon-tagnini and Buschbacher 1989), such increasedavailabilities may also hasten the loss of inorganic Nfrom these systems due to leaching (Neill and oth-ers 1997), long-term declines in microbial biomass(Matson and others 1987), and increased fluxes ofNO and N2O to the atmosphere (Verchot and others1999).
To better understand C and N dynamics in re-sponse to the combined impacts of fire and land usein forest ecosystems of the Brazilian Amazon, wequantified the dynamics of several ecosystem pa-rameters at sites representing a land-use gradient inRondonia, Brazil. This land-use gradient includedtwo standing primary forest sites, a slashed primaryforest site, a 1-year-old shifting cultivation site,slashed second- and third-growth forest sites, andan old pasture. The ecosystem parameters quanti-fied include total aboveground biomass and pools ofC and N, soil pools of total C and N, as well as poolsof inorganic N (that is, NH4-N and NO3-N) and ratesof net nitrification and N-mineralization in surfacesoils. Emphasis was placed on quantifying both theimmediate effects of slash-and-burn events occur-ring at intervals along the land-use gradient and thecumulative long-term impacts of land use.
METHODS
Study Area
The study area was located in the Brazilian state ofRondonia. This region has undergone rapid rates ofdeforestation (Skole and Tucker 1993); during the13 years between 1978 and 1991, the total amountof deforested land in Rondonia had increased from
Impacts of Land Use on C and N Dynamics in the Amazon 245
4600 km2 to 34,600 km2 (INPE 1992). The primarycauses of deforestation include pasture conversion,shifting cultivation, and timber harvest.
All study sites were located within a 5-km radiusnear the mining village of Santa Barbara, Rondonia(9°12�S, 60°3�W). Climatological data were col-lected from the nearest available station located inPorto Velho, Rondonia, approximately 100 kmnorthwest of the study sites. Mean annual precipi-tation is 2354 mm, with a pronounced dry seasonfrom June to September during which meanmonthly precipitation is less than 100 mm. Mini-mum and maximum monthly temperatures are 21°and 31°C, respectively, with a mean of 25.2°C.Mean relative humidity is 85% (Departmento Na-cional de Meterologia–Brasil 1992). Soils of thestudy area range from very clayey yellow latosols(Hapludox) to very sandy red-yellow podzolics(Paleudult) (Neill and others 1997).
Farmers and ranchers in this region use fire toremove slashed vegetation and maintain cattle pas-tures. Vegetation is typically slashed at the onset ofthe dry season. The understory is first cleared uti-lizing only hand tools, after which large trees arefelled with chainsaws. Certain trees are commonlyleft standing because of their value or because it isillegal to cut them (for example, Bertholletia excelsa,Brazil nut). Slashed vegetation is subsequently ig-nited at the end of the dry season, when conditionsare most favorable for fuel combustion (that is,relatively high air temperature, low relative humid-ity, and low fuel moisture). Second- and third-growth forests and pastures are slashed and burnedin a similar manner (Kauffman and others 1998;Guild and others 1998; Hughes and others 2000).
A total of seven sites were sampled in this study,representing land-cover types that can be consid-ered a common land-use gradient in this region ofRondonia (Guild and others 1998). We obtainedthe land-use history of each site through interviewswith the respective landowners. Primary forests 1and 2 were undisturbed forests typical of the regionand were classified as floresta tropical perenifolia deterra firme (upland tropical evergreen forest) byEiten (1983) or as floresta ombrofila aberta sub-montane (submontane open forest) by RADAM(Brazil DNPM 1978). The slashed primary forestwas located immediately adjacent to primary forest2 and had been slashed 2 months prior to sampling.The shifting cultivation site was converted from anundisturbed primary forest to a manioc (Manihotspp.) crop 1 year prior to sampling. The second-growth forest site had been converted from primaryforest to shifting cultivation 6 years prior to sam-pling and had experienced one cultivation/fallow
cycle consisting of 2 years of cultivation followed bya 4-year fallow period. The third-growth forest sitehad been converted from primary forest to shiftingcultivation 12 years prior to sampling; it had expe-rienced two cultivation/fallow cycles and had beenin forest fallow for 4 years prior to sampling. Thepasture site was converted from primary forest 14years prior to sampling; it had undergone two6-year cultivation cycles. Following the second fal-low cycle, it was converted to pasture 2 years priorto sampling. All slashed primary forest, slashed sec-ond- and third-growth forests, and pasture siteswere sampled both before and immediately afterthe respective fire events.
All decisions regarding the cutting and burning ofsample plots were left to local landowners to mea-sure the characteristics and influences of anthropo-genic fire without possible biases introduced by oursampling. Vegetation of sites where prefire andpostfire measures were made had already beenfelled when we initiated our sampling, and we hadno a priori knowledge of either biomass or nutrientpools. All slash fires were conducted during Sep-tember–October 1993.
Field and Laboratory MethodologyAboveground biomass and C and N pools. Methods
to estimate aboveground biomass and C and Npools of slashed forest sites followed those pre-sented in detail by Kauffman and others (1995,1998), Guild and others (1998), and Hughes andothers (2000). Briefly, biomass at each site waspartitioned into categories and sampled based onplant morphology, their potential influence on firebehavior, their value as a nutrient pool, and con-siderations of sampling approach. Biomass catego-ries included downed wood debris (that is, all treesand vines that were slashed and lying on theground prior to the fire event), foliage attached towood debris, litter, rootmat, and dicots (that is,sprouts and seedlings). Sites ranged from 1.5 to 5 hain size, and wood debris and attached foliage weresampled at each site along 32 11-m transects usingplanar intersect models and protocols (Van Wagner1968; Brown and Roussopoulous 1974).
Transects were systematically established to en-sure sampling dispersion through the site. Alltransects were marked with small aluminum stakesprior to burning to allow for exact relocation oftransects following fire. Wood debris was parti-tioned into size classes based on diameter at thepoint of intersection along the transect (0–0.64 cm,0.64–2.54 cm, 2.55–7.5 cm, 7.6–20.5 cm, andgreater than 20.5 cm) (Kauffman and others 1995).Biomass was calculated from these measures using
246 R. F. Hughes and others
particle density values for each diameter class ob-tained from randomly collected samples of eachdiameter class at each site. Biomass of foliage(leaves, flowers, and seeds) that remained attachedto the slashed woody debris was determined fromcalculated ratios between biomass of attached foli-age and biomass of less than 0.64-cm–diameterwood particles of randomly collected samples ateach site (Kauffman and others 1998, 1995). Bio-mass of litter, rootmat, and seedlings were destruc-tively sampled through collection of all materials in25 � 25 cm microplots placed at the 2-m point ofeach transect (n � 32/site). The mass of each bio-mass component was separated and dried to a con-stant weight. All biomass components (wood, her-baceous material, and litter) were measured bothbefore and after the fire event at each slashed-and-burned study site. In addition, the few scatteredtrees that remained standing within each study siteafter the site had been slashed were not included inthe calculation of pre- or postfire aboveground bio-mass and C and N pools.
Postfire ash mass was determined from 16 50 �50 cm microplots located along 16 of the 32 planartransects 1 day after each fire. Ash was collectedwithin each microplot using a portable electric gen-erator and a vacuum cleaner (Kauffman and others1995).
Pools of C and N in aboveground biomass weredetermined from grab samples collected for eachbiomass component at each site following methodsof Kauffman and others (1995, 1998). Sampleswere ground to pass through a 40-mesh (0.5-mm–diameter) screen using a Tecator Cyclotec 1093sample mill (Tecator Inc., Herndon, VA, USA). TotalC and N concentrations of samples were deter-mined via the induction furnace method using aCarlo-Erba NA Series 1500 NCS analyzer (FisonsInstruments, Danvers, MA, USA) (Nelson and Som-mers 1982). Tissue C and N concentrations for eachvegetation component were multiplied by the bio-mass of the respective component to obtain C and Nmass. These were summed to obtain totalaboveground C and N mass for each site.
Aboveground biomass and C and N pools forprimary forest 1 and for second- and third-growthforest sites were obtained from published results(Guild and others 1998; Hughes and others 2000).In addition to measurement of biomass componentsusing methods described above, manioc biomassand C and N pools of the shifting cultivation sitewere determined by counting the numbers ofmanioc stems present in 1 � 5 m belt transectsadjacent to each of the 32 planar intersect transects.Average biomass for each manioc individual was
determined by harvesting randomly selected indi-viduals that were subsequently oven-dried andweighed. Pools of C and N in manioc were calcu-lated from samples of stem and leaf tissue analyzedvia combustion using methods described above.
Inorganic N pools and rates of transformation. Inor-ganic N pools (NH4-N and NO3-N) and potentialrates of net nitrification and N-mineralization weremeasured in mineral soil at 0–2.5-cm and2.5–10-cm depths in primary forest sites 1 and 2,and in the slashed primary forest, shifting cultiva-tion, slashed second-growth forest, and pasturesites. All sites were sampled in September and Oc-tober in 1993 at the end of the dry season. At eachslashed-and-burned site, samples were collectedprior to and following the fire event. Two parallel40-m transects were established within the bound-aries of each plot, and soils were collected at 10-mintervals along each transect, for a total of eightsampling points per site. At each sampling point,four soil cores were collected at each depth using asoil corer 6 cm in diameter; soil cores were collected1 m away from the sample point in each of the fourcardinal directions. The four cores were compositedin the field to give eight samples per depth per site.
Composited samples were promptly transportedto the laboratory and processed within 8 h follow-ing their collection from the field. All stones, roots,and litter more than 2 mm in diameter were re-moved by hand from each sample. A subsample ofapproximately 30 g fresh weight was weighed anddried to a constant weight to determine water con-tent. Two more 10-g (fresh weight) subsampleswere removed from each composite sample; thefirst of these was extracted immediately by shakingwith 50 ml of 2N KCl and equilibrating for 24 h.After this period, 10 ml of the supernatant waspipetted into sample vials and frozen pending anal-ysis.
Each of the second set of 10-g soil samples wasplaced in plastic sample cups and covered with per-forated caps to allow for gas exchange, then incu-bated under aerobic conditions at an ambient tem-perature of 25°–28°C for 14 days. Samples weremaintained at field water holding capacity through-out the incubation period by adding deionized wa-ter when necessary. Average field water holdingcapacity was determined from soil samples (30 g) ofthree of the eight composited samples from eachdepth at each site. These samples were dried,weighed, placed in filters, saturated with water, andallowed to drain for 12 h. Samples were then re-weighed to determine field water holding capacity.Values were averaged for each depth at each siteand were applied to incubating samples of each
Impacts of Land Use on C and N Dynamics in the Amazon 247
respective depth and site. Following the 14-day in-cubation period, 10 ml of supernatant was ex-tracted from each sample by the method describedabove and kept frozen pending analysis.
Concentrations of NH4-N and NO3-N in soil ex-tracts were determined colorimetrically using anALPCHEM 300 series rapid flow analyzer (OI Corp.,College Station, TX, USA). Concentrations of initialextracts were considered to be the available soilconcentrations of NH4-N and NO3-N. Net nitrifica-tion was calculated as final (incubated) NO3-N con-centration minus initial NO3-N concentration. NetN-mineralization was calculated as final NH4-N plusfinal NO3-N minus initial NH4-N plus initial NO3-N.
Total C and N in soils. Total C and N concentra-tions were determined to a 1-m depth at each studysite, and C and N pools were determined for themajority of the sites. Total C and N in surface soils(0–2.5 cm and 2.5–10 cm) were determined fromcomposited soil samples collected for the analysis ofavailable N pools. Total C and N concentrations insubsurface soils were determined from five samplepoints within each study plot. At each sample point,soils were collected at 10–30-cm, 30–50-cm, and50–100-cm depths using a soil auger. Samples weredried to a constant weight, sieved to remove rootslarger than 2 mm diameter, and ground to passthrough a 60-mesh screen (250-micrometer poresize). Total C and N concentrations in each samplewere determined by the same methods describedfor aboveground samples in this study. Soil concen-tration values were converted to a mass per areabasis for five of the seven sites using soil bulk den-sity measures from those sites. At two of the sites(primary forest 2 and the shifting cultivation site),soil bulk density was not measured; consequently,C and N pools were not calculated from C and Nconcentration data at those sites. Soil bulk densitywas determined from samples of known volumecollected at five points within each site at depthsthat coincided with sampling of soil C and N con-centrations. To avoid artifacts that might resultfrom soil compaction in sites that had experiencedland use relative to primary forest sites, we com-pared soils at 0- to 30-cm depths on a commonmass basis (Trumbore and others 1995; Veldkamp1994; Fearnside and Barbosa 1998). In cases wherebulk density values were not available for a givensoil depth at a given site, values from the soil depthimmediately above were used.
To determine soil texture at each site, percentclay, sand, and silt was quantified for three samplesat depths of 2.5–10 cm using the hydrometermethod (Gee and Bauder 1986). Soils were classi-fied based on the USDA classification scheme.
Statistical analysis. Differences among sites re-garding soil C and N pools were determined usingsingle classification analysis of variance (ANOVA)and post hoc Tukey tests (Sokal and Rohlf 1981).Relationships between soil clay content and soil Cand N concentrations were examined using simpleregression analysis. All values in tables and figuresare presented as means � one standard error.
RESULTS
Total Aboveground Biomass andC and N Pools
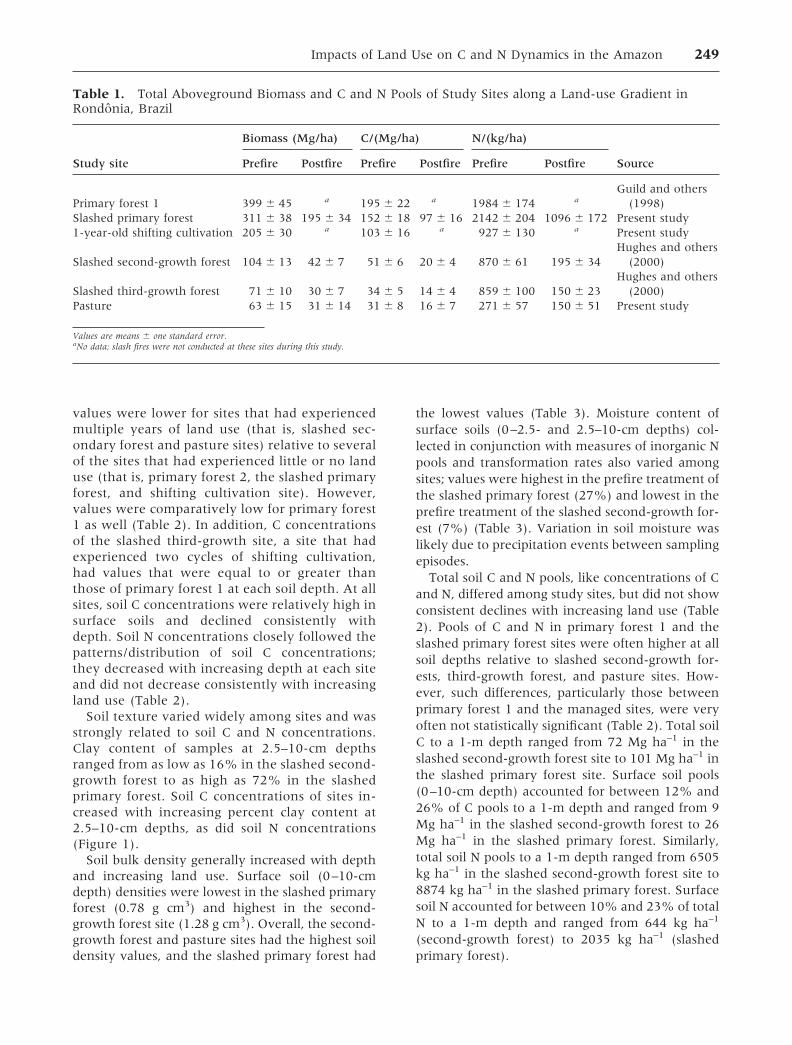
Total aboveground biomass (TAGB) and C and Npools declined substantially along the land-use gra-dient (Table 1). TAGB was 311 and 399 Mg ha–1 inthe primary forest sites. TAGB of the shifting culti-vation, second-, and third-growth forest sites were58%, 29%, and 20%, respectively, of the meanTAGB of the primary forest sites. The TAGB of thepasture site, the site with the longest history of landuse, was 63 Mg ha–1, or only 18% of primary forestTAGB. Similarly, total aboveground C and N poolsalso declined along the land-use gradient.Aboveground C pools were 152 and 195 Mg ha–1 inthe primary forest sites, as compared to 31 Mg ha–1
in the pasture site. Aboveground N pools were 1984and 2142 kg ha–1 in primary forest sites but only271 kg ha–1 at the pasture site (Table 1).
Biomass and aboveground pools of both C and Ndeclined in response to fires at each site. Biomasslosses during burning ranged from as high as 116Mg ha–1 from the slashed primary forest to as low as32 Mg ha–1 from the pasture site. The amount ofTAGB consumed, expressed as a percentage of pre-fire values (that is, the combustion factor), rangedfrom as high as 60% in the second-growth forestsite to as low as 37% in the slashed primary forest(Table 1). Losses of aboveground C from burningranged from 15 Mg ha–1 in the pasture site to 55 Mgha–1 in the slashed primary forest. Combustion fac-tors of C ranged from 36% in the slashed primaryforest to 61% in the second-growth forest site.Losses of N ranged from 121 kg ha–1 in the pasturesite to 1046 kg ha–1 in the slashed primary forestwith combustion factors of 45% (pasture site) to83% (third-growth forest).
Soil C and N Pools, Soil Texture, BulkDensity, and Soil Moisture
Based on the sites sampled in this study, values didnot show an impact of land use on soil C and Nconcentrations. Instead, C and N concentrationswere more closely related to soil texture. Soil C
248 R. F. Hughes and others
values were lower for sites that had experiencedmultiple years of land use (that is, slashed sec-ondary forest and pasture sites) relative to severalof the sites that had experienced little or no landuse (that is, primary forest 2, the slashed primaryforest, and shifting cultivation site). However,values were comparatively low for primary forest1 as well (Table 2). In addition, C concentrationsof the slashed third-growth site, a site that hadexperienced two cycles of shifting cultivation,had values that were equal to or greater thanthose of primary forest 1 at each soil depth. At allsites, soil C concentrations were relatively high insurface soils and declined consistently withdepth. Soil N concentrations closely followed thepatterns/distribution of soil C concentrations;they decreased with increasing depth at each siteand did not decrease consistently with increasingland use (Table 2).
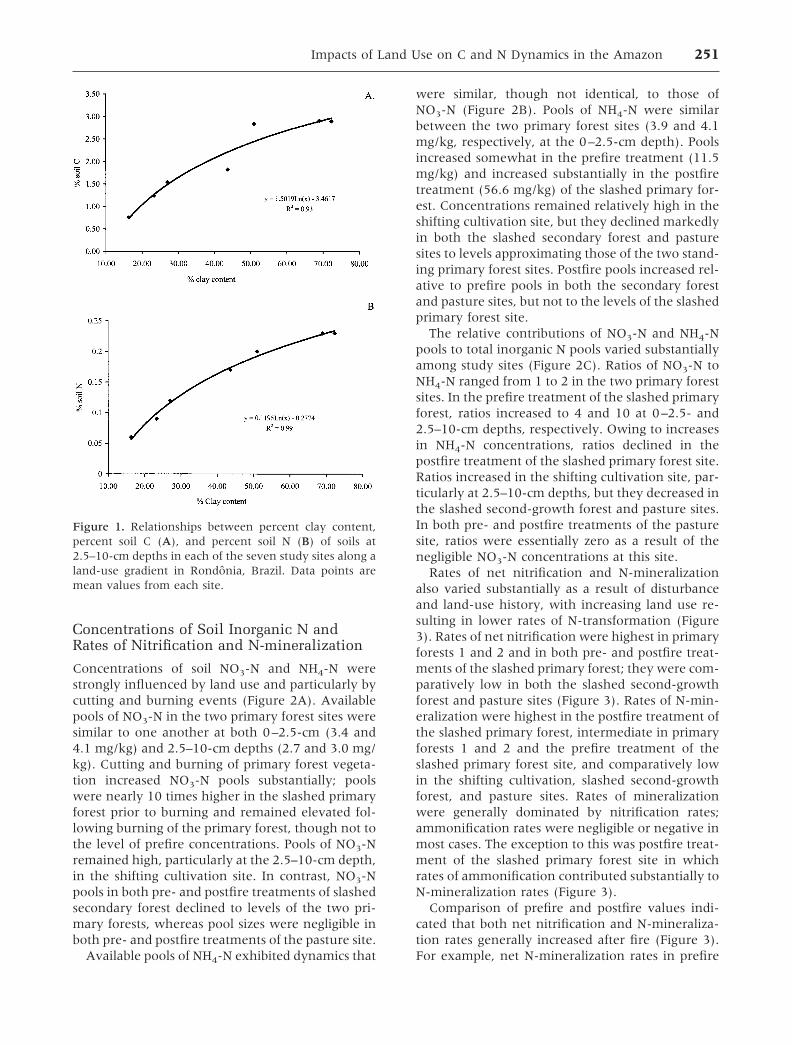
Soil texture varied widely among sites and wasstrongly related to soil C and N concentrations.Clay content of samples at 2.5–10-cm depthsranged from as low as 16% in the slashed second-growth forest to as high as 72% in the slashedprimary forest. Soil C concentrations of sites in-creased with increasing percent clay content at2.5–10-cm depths, as did soil N concentrations(Figure 1).
Soil bulk density generally increased with depthand increasing land use. Surface soil (0–10-cmdepth) densities were lowest in the slashed primaryforest (0.78 g cm3) and highest in the second-growth forest site (1.28 g cm3). Overall, the second-growth forest and pasture sites had the highest soildensity values, and the slashed primary forest had
the lowest values (Table 3). Moisture content ofsurface soils (0–2.5- and 2.5–10-cm depths) col-lected in conjunction with measures of inorganic Npools and transformation rates also varied amongsites; values were highest in the prefire treatment ofthe slashed primary forest (27%) and lowest in theprefire treatment of the slashed second-growth for-est (7%) (Table 3). Variation in soil moisture waslikely due to precipitation events between samplingepisodes.
Total soil C and N pools, like concentrations of Cand N, differed among study sites, but did not showconsistent declines with increasing land use (Table2). Pools of C and N in primary forest 1 and theslashed primary forest sites were often higher at allsoil depths relative to slashed second-growth for-ests, third-growth forest, and pasture sites. How-ever, such differences, particularly those betweenprimary forest 1 and the managed sites, were veryoften not statistically significant (Table 2). Total soilC to a 1-m depth ranged from 72 Mg ha–1 in theslashed second-growth forest site to 101 Mg ha–1 inthe slashed primary forest site. Surface soil pools(0–10-cm depth) accounted for between 12% and26% of C pools to a 1-m depth and ranged from 9Mg ha–1 in the slashed second-growth forest to 26Mg ha–1 in the slashed primary forest. Similarly,total soil N pools to a 1-m depth ranged from 6505kg ha–1 in the slashed second-growth forest site to8874 kg ha–1 in the slashed primary forest. Surfacesoil N accounted for between 10% and 23% of totalN to a 1-m depth and ranged from 644 kg ha–1
(second-growth forest) to 2035 kg ha–1 (slashedprimary forest).
Table 1. Total Aboveground Biomass and C and N Pools of Study Sites along a Land-use Gradient inRondonia, Brazil
Study site
Biomass (Mg/ha) C/(Mg/ha) N/(kg/ha)
SourcePrefire Postfire Prefire Postfire Prefire Postfire
Primary forest 1 399 � 45 a 195 � 22 a 1984 � 174 aGuild and others
(1998)Slashed primary forest 311 � 38 195 � 34 152 � 18 97 � 16 2142 � 204 1096 � 172 Present study1-year-old shifting cultivation 205 � 30 a 103 � 16 a 927 � 130 a Present study
Slashed second-growth forest 104 � 13 42 � 7 51 � 6 20 � 4 870 � 61 195 � 34Hughes and others
(2000)
Slashed third-growth forest 71 � 10 30 � 7 34 � 5 14 � 4 859 � 100 150 � 23Hughes and others
(2000)Pasture 63 � 15 31 � 14 31 � 8 16 � 7 271 � 57 150 � 51 Present study
Values are means � one standard error.aNo data; slash fires were not conducted at these sites during this study.
Impacts of Land Use on C and N Dynamics in the Amazon 249
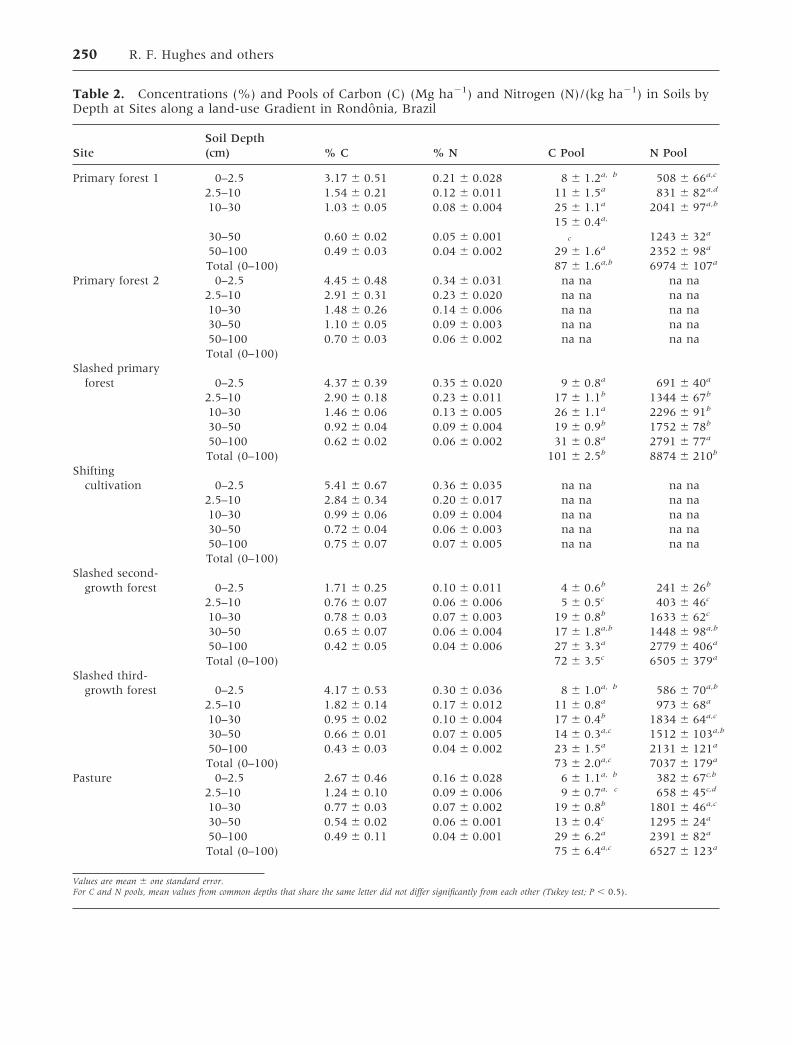
Table 2. Concentrations (%) and Pools of Carbon (C) (Mg ha�1) and Nitrogen (N)/(kg ha�1) in Soils byDepth at Sites along a land-use Gradient in Rondonia, Brazil
SiteSoil Depth(cm) % C % N C Pool N Pool
Primary forest 1 0–2.5 3.17 � 0.51 0.21 � 0.028 8 � 1.2a, b 508 � 66a,c
2.5–10 1.54 � 0.21 0.12 � 0.011 11 � 1.5a 831 � 82a,d
10–30 1.03 � 0.05 0.08 � 0.004 25 � 1.1a 2041 � 97a,b
30–50 0.60 � 0.02 0.05 � 0.00115 � 0.4a,
c 1243 � 32a
50–100 0.49 � 0.03 0.04 � 0.002 29 � 1.6a 2352 � 98a
Total (0–100) 87 � 1.6a,b 6974 � 107a
Primary forest 2 0–2.5 4.45 � 0.48 0.34 � 0.031 na na na na2.5–10 2.91 � 0.31 0.23 � 0.020 na na na na10–30 1.48 � 0.26 0.14 � 0.006 na na na na30–50 1.10 � 0.05 0.09 � 0.003 na na na na50–100 0.70 � 0.03 0.06 � 0.002 na na na naTotal (0–100)
Slashed primaryforest 0–2.5 4.37 � 0.39 0.35 � 0.020 9 � 0.8a 691 � 40a
2.5–10 2.90 � 0.18 0.23 � 0.011 17 � 1.1b 1344 � 67b
10–30 1.46 � 0.06 0.13 � 0.005 26 � 1.1a 2296 � 91b
30–50 0.92 � 0.04 0.09 � 0.004 19 � 0.9b 1752 � 78b
50–100 0.62 � 0.02 0.06 � 0.002 31 � 0.8a 2791 � 77a
Total (0–100) 101 � 2.5b 8874 � 210b
Shiftingcultivation 0–2.5 5.41 � 0.67 0.36 � 0.035 na na na na
2.5–10 2.84 � 0.34 0.20 � 0.017 na na na na10–30 0.99 � 0.06 0.09 � 0.004 na na na na30–50 0.72 � 0.04 0.06 � 0.003 na na na na50–100 0.75 � 0.07 0.07 � 0.005 na na na naTotal (0–100)
Slashed second-growth forest 0–2.5 1.71 � 0.25 0.10 � 0.011 4 � 0.6b 241 � 26b
2.5–10 0.76 � 0.07 0.06 � 0.006 5 � 0.5c 403 � 46c
10–30 0.78 � 0.03 0.07 � 0.003 19 � 0.8b 1633 � 62c
30–50 0.65 � 0.07 0.06 � 0.004 17 � 1.8a,b 1448 � 98a,b
50–100 0.42 � 0.05 0.04 � 0.006 27 � 3.3a 2779 � 406a
Total (0–100) 72 � 3.5c 6505 � 379a
Slashed third-growth forest 0–2.5 4.17 � 0.53 0.30 � 0.036 8 � 1.0a, b 586 � 70a,b
2.5–10 1.82 � 0.14 0.17 � 0.012 11 � 0.8a 973 � 68a
10–30 0.95 � 0.02 0.10 � 0.004 17 � 0.4b 1834 � 64a,c
30–50 0.66 � 0.01 0.07 � 0.005 14 � 0.3a,c 1512 � 103a,b
50–100 0.43 � 0.03 0.04 � 0.002 23 � 1.5a 2131 � 121a
Total (0–100) 73 � 2.0a,c 7037 � 179a
Pasture 0–2.5 2.67 � 0.46 0.16 � 0.028 6 � 1.1a, b 382 � 67c,b
2.5–10 1.24 � 0.10 0.09 � 0.006 9 � 0.7a, c 658 � 45c,d
10–30 0.77 � 0.03 0.07 � 0.002 19 � 0.8b 1801 � 46a,c
30–50 0.54 � 0.02 0.06 � 0.001 13 � 0.4c 1295 � 24a
50–100 0.49 � 0.11 0.04 � 0.001 29 � 6.2a 2391 � 82a
Total (0–100) 75 � 6.4a,c 6527 � 123a
Values are mean � one standard error.For C and N pools, mean values from common depths that share the same letter did not differ significantly from each other (Tukey test; P � 0.5).
250 R. F. Hughes and others
Concentrations of Soil Inorganic N andRates of Nitrification and N-mineralization
Concentrations of soil NO3-N and NH4-N werestrongly influenced by land use and particularly bycutting and burning events (Figure 2A). Availablepools of NO3-N in the two primary forest sites weresimilar to one another at both 0–2.5-cm (3.4 and4.1 mg/kg) and 2.5–10-cm depths (2.7 and 3.0 mg/kg). Cutting and burning of primary forest vegeta-tion increased NO3-N pools substantially; poolswere nearly 10 times higher in the slashed primaryforest prior to burning and remained elevated fol-lowing burning of the primary forest, though not tothe level of prefire concentrations. Pools of NO3-Nremained high, particularly at the 2.5–10-cm depth,in the shifting cultivation site. In contrast, NO3-Npools in both pre- and postfire treatments of slashedsecondary forest declined to levels of the two pri-mary forests, whereas pool sizes were negligible inboth pre- and postfire treatments of the pasture site.
Available pools of NH4-N exhibited dynamics that
were similar, though not identical, to those ofNO3-N (Figure 2B). Pools of NH4-N were similarbetween the two primary forest sites (3.9 and 4.1mg/kg, respectively, at the 0–2.5-cm depth). Poolsincreased somewhat in the prefire treatment (11.5mg/kg) and increased substantially in the postfiretreatment (56.6 mg/kg) of the slashed primary for-est. Concentrations remained relatively high in theshifting cultivation site, but they declined markedlyin both the slashed secondary forest and pasturesites to levels approximating those of the two stand-ing primary forest sites. Postfire pools increased rel-ative to prefire pools in both the secondary forestand pasture sites, but not to the levels of the slashedprimary forest site.
The relative contributions of NO3-N and NH4-Npools to total inorganic N pools varied substantiallyamong study sites (Figure 2C). Ratios of NO3-N toNH4-N ranged from 1 to 2 in the two primary forestsites. In the prefire treatment of the slashed primaryforest, ratios increased to 4 and 10 at 0–2.5- and2.5–10-cm depths, respectively. Owing to increasesin NH4-N concentrations, ratios declined in thepostfire treatment of the slashed primary forest site.Ratios increased in the shifting cultivation site, par-ticularly at 2.5–10-cm depths, but they decreased inthe slashed second-growth forest and pasture sites.In both pre- and postfire treatments of the pasturesite, ratios were essentially zero as a result of thenegligible NO3-N concentrations at this site.
Rates of net nitrification and N-mineralizationalso varied substantially as a result of disturbanceand land-use history, with increasing land use re-sulting in lower rates of N-transformation (Figure3). Rates of net nitrification were highest in primaryforests 1 and 2 and in both pre- and postfire treat-ments of the slashed primary forest; they were com-paratively low in both the slashed second-growthforest and pasture sites (Figure 3). Rates of N-min-eralization were highest in the postfire treatment ofthe slashed primary forest, intermediate in primaryforests 1 and 2 and the prefire treatment of theslashed primary forest site, and comparatively lowin the shifting cultivation, slashed second-growthforest, and pasture sites. Rates of mineralizationwere generally dominated by nitrification rates;ammonification rates were negligible or negative inmost cases. The exception to this was postfire treat-ment of the slashed primary forest site in whichrates of ammonification contributed substantially toN-mineralization rates (Figure 3).
Comparison of prefire and postfire values indi-cated that both net nitrification and N-mineraliza-tion rates generally increased after fire (Figure 3).For example, net N-mineralization rates in prefire
Figure 1. Relationships between percent clay content,percent soil C (A), and percent soil N (B) of soils at2.5–10-cm depths in each of the seven study sites along aland-use gradient in Rondonia, Brazil. Data points aremean values from each site.
Impacts of Land Use on C and N Dynamics in the Amazon 251

soil at the 0–2.5-cm depth of the slashed primaryforest were less than half (2.43 mg kg–1 day–1) ofthose in the postfire treatment (5.13 mg kg–1
day–1), (Figure 3). However, differences betweenpre- and postfire treatments were much smaller forthe slashed second-growth and pasture sites thanfor the slashed primary forest site (Figure 3).
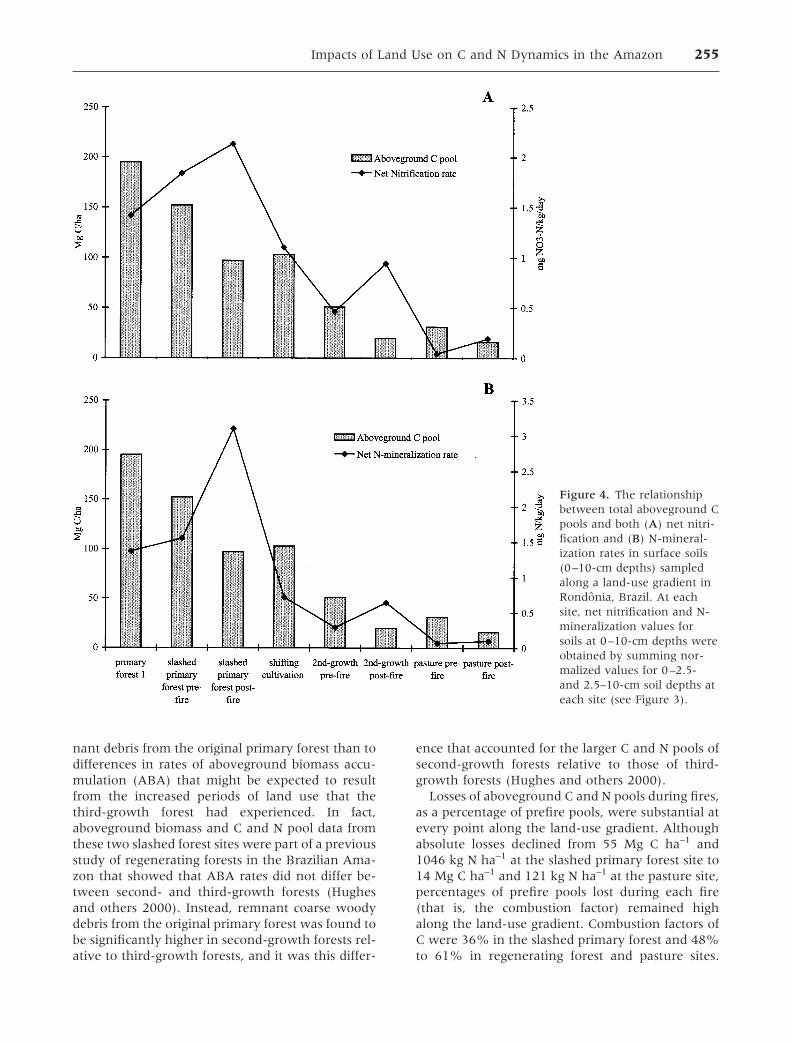
Relationships among Ecosystem Parameters
Viewed together, aboveground C pools, net nitrifi-cation, and N-mineralization rates followed similartrajectories along the land-use gradient (Figure 4).They were each relatively high in primary forestsites and declined substantially to the point thatpostfire values in the pasture site represented lessthan 10% of primary forest values in each case.However, the response of aboveground pools to firediffered from responses of nitrification and N-min-
eralization. While slash fires resulted in decreases inaboveground C pools, fires resulted in short-termincreases in both nitrification and N-mineralizationrates (that is, postfire relative to prefire values).However, these opposite responses were similar inthe sense that absolute differences between pre-and postfire values decreased with increasing landuse along the gradient (Figure 4).
DISCUSSION
Dynamics of Aboveground Pools
Sites sampled in this study were representative oftheir respective land-cover types in the BrazilianAmazon. Aboveground C and N pools of primaryforest site 1 and the slashed primary forest site (195and 152 Mg C ha–1 and 1984 and 2142 kg N ha–1,respectively) were similar to C and N pools of pri-
Table 3. Bulk Density and Moisture Content of Soils by Depth at Study Sites along a Land-use Gradientin Rondonia, Brazil
Soil Depth(cm)
Bulk Density(g cm3)
Depth/Treatment(cm)
Moisture Content(%)
Primary forest 1 Primary forest 10–10 0.96 � 0.13 0–2.5 12.6 � 0.8
10–30 1.21 � 0.04 2.5–10 12.4 � 0.730–50 1.23 � 0.02 Primary forest 250–100 1.16 � 0.03 0–2.5 12.6 � 0.8
0–2.5–10 12.4 � 0.7Slashed primary forest Slashed primary forest
0–10 0.78 � 0.03 0–2.5 prefire 26.7 � 0.410–30 0.89 � 0.02 2.5–10 prefire 26.8 � 0.330–100 1.01 � 0.01 0–2.5postfire 24.3 � 0.7
2.5–10postfire 26.6 � 0.3Shifting cultivation
0–2.5 24.3 � 1.02.5–10 21.5 � 0.3
Slashed second-growth forest Slashed second-growth forest0–10 1.28 � 0.05 0–2.5prefire 9.4 � 0.7
10–30 1.36 � 0.04 2.5–10 prefire 7.2 � 0.730–50 1.27 � 0.07 0–2.5 postfire 8.3 � 1.1
2.5–10 postfire 8.2 � 0.7Slashed third-growth forest
0–10 0.90 � 0.1010–30 1.21 � 0.0230–100 1.08 � 0.04
Pasture Pasture0–10 1.27 � 0.07 0–2.5 prefire 12.0 � 0.7
10–30 1.35 � 0.02 2.5–10 prefire 9.9 � 0.430–50 1.16 � 0.02 0–2.5 postfire 19.4 � 2.5
2.5–10 postfire 13.9 � 1.5
Soil moisture values were measured from samples collected to determine inorganic N pools and rates of transformation.Values are mean � one standard error.
252 R. F. Hughes and others

mary forest sites of Rondonia and Para, Brazil, re-ported by Kauffman and others (1995).Aboveground C pools of primary forest sites in thisstudy were also similar to aboveground C pools inprimary forests of Rondonia (184 Mg ha–1) esti-mated by Alves and others (1997) and were withinthe range of 130 to 240 Mg C ha–1 reported foraboveground C pools of 20 intact primary forestslocated within Rondonia (Cummings and othersForthcoming) if we assume that C accounts forapproximately 45% of TAGB pools in these forestsystems (Kauffman and others 1995).
Aboveground pools of C and N in the second- andthird-growth forest sites sampled in this study (Ta-ble 1) were also within the range of aboveground C(32–90 Mg ha–1) and N (487–1012 kg ha–1) poolsmeasured in young regenerating forests of Para and
Rondonia, Brazil (Hughes and others 2000).Aboveground C and N pools in the pasture site (31Mg ha–1 and 271 kg ha–1, respectively) were com-parable to pastures measured in Para and Rondonia,where aboveground C pools ranged from 26 to 59Mg ha–1 and N pools ranged from 304 to 661 kgha–1 (Kauffman and others 1998).
In the 1-year-old shifting cultivation site,aboveground biomass, C, and N values were 205Mg ha–1, 103 Mg ha–1 and 927 kg ha�1, respec-tively. These values were high relative to the 0.5 Mgha–1 estimate made by Fearnside (1996) foraboveground biomass of Amazonian croplands andthe 5 Mg C ha–1 estimate for croplands replacingtropical forests in Latin America used by Houghton(1999) to calculate annual net C fluxes to the at-mosphere as a result of land-use change. The ma-
Figure 2. Mean values forpools of (A) NO3-N, (B)NH4-N, and (C) NO3-N:NH4-N ratios in soils sampledfrom 0–2.5 and 2.5–10-cmdepths at sites along a land-use gradient of in Rondonia,Brazil. Error bars represent �one standard error.
Impacts of Land Use on C and N Dynamics in the Amazon 253

jority of aboveground biomass and C and N pools inthe shifting cultivation site was accounted for bydowned woody debris originating from the primaryforest previously occupying the site. AbovegroundC and N pools of the manioc crop itself were 1 Mgha–1 and 27 kg ha–1, respectively, and constitutedonly 1% and 3% of total aboveground C and Npools at this site. Both Fearnside (1996) andHoughton (1999) include only live biomass in theirestimates of cropland aboveground C pools in crop-lands, considering wood debris and other necro-mass to be net committed emissions (that is, C poolsthat will eventually be lost from the site via decom-position or combustion). Although this approachmay be adequate for the purposes of regional and
global C budgets, we suggest that the presence orabsence of the potentially large C and N pools thatwood debris represent will have an impact on siteproductivity during both management periods andsuccession following abandonment. Consequently,accurate accounting of these pools at points alongland-use gradients is important to understandingthe impacts of land use on ecosystem processeswithin regions of the Brazilian Amazon.
Aboveground C and N pools in the prefire treat-ment of the slashed second-growth forest (51 Mg Cha–1 and 870 kg N ha–1) were higher than those inthe prefire treatment of the slashed third-growthforest (34 Mg C ha–1 and 859 kg N ha–1). However,these results were due more to differences in rem-
Figure 3. Mean values forrates of (A) net nitrificationand (B) N-mineralization insoils sampled from 0–2.5-and 2.5–10-cm depths atsites along a land-use gradi-ent in Rondonia, Brazil. Er-ror bars represent � onestandard error.
254 R. F. Hughes and others
nant debris from the original primary forest than todifferences in rates of aboveground biomass accu-mulation (ABA) that might be expected to resultfrom the increased periods of land use that thethird-growth forest had experienced. In fact,aboveground biomass and C and N pool data fromthese two slashed forest sites were part of a previousstudy of regenerating forests in the Brazilian Ama-zon that showed that ABA rates did not differ be-tween second- and third-growth forests (Hughesand others 2000). Instead, remnant coarse woodydebris from the original primary forest was found tobe significantly higher in second-growth forests rel-ative to third-growth forests, and it was this differ-
ence that accounted for the larger C and N pools ofsecond-growth forests relative to those of third-growth forests (Hughes and others 2000).
Losses of aboveground C and N pools during fires,as a percentage of prefire pools, were substantial atevery point along the land-use gradient. Althoughabsolute losses declined from 55 Mg C ha–1 and1046 kg N ha–1 at the slashed primary forest site to14 Mg C ha–1 and 121 kg N ha–1 at the pasture site,percentages of prefire pools lost during each fire(that is, the combustion factor) remained highalong the land-use gradient. Combustion factors ofC were 36% in the slashed primary forest and 48%to 61% in regenerating forest and pasture sites.
Figure 4. The relationshipbetween total aboveground Cpools and both (A) net nitri-fication and (B) N-mineral-ization rates in surface soils(0–10-cm depths) sampledalong a land-use gradient inRondonia, Brazil. At eachsite, net nitrification and N-mineralization values forsoils at 0–10-cm depths wereobtained by summing nor-malized values for 0–2.5-and 2.5–10-cm soil depths ateach site (see Figure 3).
Impacts of Land Use on C and N Dynamics in the Amazon 255

Combustion factors of N were 45% and 49% in thepasture and the slashed primary forest sites and78% and 83% in the second- and third-growthforest sites, respectively. These losses are consistentwith combustion factors of TAGB in slashed-and-burned primary forests (42%–57%), slashed-and-burned second- and third-growth forests(42%–88%), and slashed-and-burned pastures(21%–84%) measured in the Brazilian Amazonduring previous studies (Kauffman and others1995, 1998; Guild and others 1998; Hughes andothers 2000).
Dynamics of Total C and N Pools in Soils
Total soil C (72–118 Mg ha–1) and N (6505–9802 kgha–1) pools to a 1-m depth documented in thisstudy were comparable to soil C and N pools mea-sured elsewhere (see Fearnside and Barbosa 1998).Using data based on the RADAMBRASIL survey, deMoraes and others (1995) found that Oxisols andUltisols to a 1-m depth at sites across the BrazilianAmazon contained 85–105 Mg C ha–1 and 4000–10,200 kg N ha–1. Trumbore and others (1995)reported a range of 100–108 Mg C ha–1 in soils to a1-m depth in forest and pasture sites located onUltisols in Para, Brazil. Oxisols supporting primaryforest vegetation in the state of Amazonas con-tained 124 Mg C ha–1 to a 1-m depth (Cerri andVolkoff 1987).
Numerous studies report increases in soil C poolsfollowing deforestation and land use in the Brazil-ian Amazon (see, for example, de Moraes and oth-ers 1996; Trumbore and others 1995; Neill andothers 1996), while others report or predict de-creases (for example, Eden and others 1991; Des-jardins and others 1994; Camargo and others1999). Fearnside and Barbosa (1998) and Trumbore
and others (1995) asserted that discrepanciesamong studies are often explained by managementpractices. That is, sites that experienced “ideal man-agement” (for instance, fertilizer applications)tended to show increases in C pools following con-version, whereas soil C pools of sites experiencing“typical management” (that is, lacking fertilizer in-puts or other measures designed to maintain soilfertility) tended to decrease following forest-to-pas-ture conversion.
Although the sites sampled here fit the “typicalmanagement” category defined by Fearnside andBarbosa (1998) and would be expected to showdeclines in soil C and N with increasing land use,our results did not support this expectation (Table2). Rather, soil texture proved to be a much betterpredictor of soil C and N pools than land use. Thus,differences that initially might be ascribed to land-use impacts, such as higher total soil C pools in theslashed primary forest relative to the pasture site,are more likely due to the high clay content of theformer site relative to that of the latter (Table 4 andFigure 1). In previous studies, soil texture has beenshown to be a strong determinant of soil C content(Parton and others 1987; de Moraes and others1996). We expect that this is the case in this studyas well, particularly since soils of sites sampled inthis study span a broad range of soil textures (thatis, from 16% to 72% clay content). Further, Trum-bore and others (1995) asserted that, given thetypically small differences in soil C between sitesrelative to the uncertainties in their measurement,direct measurement of soil C inventories is oftennot a sensitive indicator of soil C accumulation orloss in response to land use. Given the strong influ-ence of soil texture on soil C pools of sites sampledin this study, it proved particularly difficult to detect
Table 4. Percent Clay, Sand, and Silt of Soils at 2.5 – 10-cm Depths at Study Sites along a Land-useGradient in Rondonia, Brazil
SiteClay(%)
Sand(%)
Silt(%) Soil Type
Primary forest 1 27.00 � 2.08 67.67 � 3.53 5.00 � 1.53 Sandy clay loamPrimary forest 2 69.00 � 0.82 19.75 � 0.48 11.00 � 0.71 ClaySlashed primary forest 72.33 � 0.88 13.67 � 0.88 14.33 � 0.33 ClayShifting cultivation 51.00 � 1.53 34.33 � 0.67 14.33 � 0.67 ClaySlashed second-growth forest 16.33 � 5.04 82.00 � 5.69 2.00 � 0.58 Sandy loamSlashed third-growth forest 43.67 � 3.84 46.67 � 4.67 9.67 � 0.67 Sandy clayPasture 23.33 � 2.60 75.00 � 2.65 1.33 � 0.88 Sandy clay loam
Values are mean � one standard error.Soil types were determined using the USDA soil classification scheme textural triangle.
256 R. F. Hughes and others
any changes in soil C pools among these sites inresponse to land use through the use of direct mea-sures of soil C inventories alone.
In a previous study, Camargo and others (1999)modeled dynamics of soil C stocks in primary andsecond-growth forests as well as pastures in easternAmazonia using measures of C inputs and losses(that is, litterfall, root turnover, and soil carbondioxide emissions), stable and radioactive isotopes,and direct measures of soil C stocks. They predictedthat pasture soils would lose C due to lower litterand root inputs and that soils of second-growthforests would eventually regain the soil C that hadbeen lost during land use. However, Carmago andothers had sampled 7- and 16-year-old second-growth forests that represented a chronosequenceof ecosystem recovery advancing to soil C levels ofsampled primary forest sites. In contrast, the4-year-old second- and third-growth forests sam-pled in this study represent relatively short-termfallow periods between management periods. Con-sequently, these forest types would not provide theopportunity to accumulate and store soil C thatmight be lost during previous periods of land use.
Dynamics of Inorganic N Pools, Rates of NetNitrification, and Net N-mineralization
Our results regarding inorganic N pools and rates ofnet nitrification and N-mineralization representone-time measures taken during the dry season.Consequently, results should be interpreted withsome caution. However, they are comparable inmagnitude to results of soil inorganic N pools andrates of net N transformations measured in a similarmanner from other sites in Rondonia, Brazil (Neilland others 1997). Further, previous studies haveshown that rates of net nitrification and net N-mineralization are relatively aseasonal in tropicalforests (Neill and others 1997; Vitousek and Den-slow 1986; Steudler and others 1991).
Results indicate that cutting and burning slashedforest biomass generally led to short-term increasesin both soil NO3-N and NH4-N pools. These resultsagree with those of Matson and others (1987) andMontagnini and Buschbacher (1989), who reportedsubstantial increases in inorganic N pools in soilsimmediately following initial fire events in slashed-and-burned forests of Costa Rica and Brazil, respec-tively. Further, postfire pulses in inorganic N poolswere relatively large early in the land-use gradient(the slashed primary forest) and decreased in mag-nitude at the later stages of the gradient (the pas-ture). The postfire increases, particularly of NH4-Npools, were likely the result of thermal decomposi-tion of soil organic N, protein hydrolysis, and de-
structive distillation of organic N (Raison 1979).The combustion of large amounts of biomass duringthe burning of the slashed primary forest site is alsolikely responsible for the increased contribution ofammonification rates to N-mineralization rates ex-hibited by the postfire treatment of that study site.Further, we attribute decreases in the size of post-fire inorganic N pulses relative to prefire values todeclines in the amount of biomass consumed ineach of the slash fires along the land-use gradient(that is, from slashed primary forest to slashed sec-ond-growth forest to pasture). Reduction inamounts of biomass consumed by fires resulted inprogressively lower heat fluxes to the soil from eachfire, as well as progressive declines in organic N andNO3-N pools that would serve as sources for py-romineralized NH4-N. Similar findings were re-ported for inorganic N pool dynamics following de-forestation and land use in tropical dry forests ofMexico (Ellingson and others 1999).
Although the rates of net nitrification and netN-mineralization also generally increased in post-fire treatments along the land-use gradient, theirresponse to land use was one of marked declinealong the gradient. Rates of both nitrification and Nmineralization in the second-growth forest and pas-ture sites were substantially lower than those mea-sured in the primary forest sites (Figures 3 and 4).These results agree with previous studies investigat-ing the effects of land use on rates of nitrificationand N-mineralization in regions of Brazil and CostaRica (Neill and others 1997; Reiners and others1994).
Results also suggest that cutting and burning ofprimary forests and subsequent land use lead todeclines in the importance of NO3-N pools and netnitrification in soil N cycles. In the primary forestssampled in this study, NO3-N pools were high rel-ative to NH4-N pools; moreover, nitrification rateswere high as well. Both NO3-N pools and net nitri-fication rates increased substantially in recently dis-turbed sites (the slashed primary forest and shiftingcultivation sites) owing to increases in available Nfollowing burning and a lack of sinks for NO3-N inthe form of regrowing vegetation. With increasingland use, however, available N pools became de-pleted at the same time that competition for NH4-Nby regenerating forest and pasture vegetation in-creased, leading to sharp declines in both NO3-Npools and net nitrification rates. Results indicatethat in the pasture site sampled in this study, bothNO3-N pools and net nitrification rates were negli-gible. Studies by Neill and others (1997) and Ver-chot and others (1999) presented similar findingsfor N dynamics along land-use gradients in the
Impacts of Land Use on C and N Dynamics in the Amazon 257
Brazilian Amazon. Although our results do not pro-vide unequivocal evidence of decreased N cyclingdue to extended periods of land use in these eco-systems—increased microbial immobilization maybe occurring in the second-growth forest and pas-ture sites (see Neill and others 1999)—they do sug-gest that soil N transformations are being substan-tially altered by land use in this region of Rondonia,Brazil.
As a whole, our results illustrate the strong linksbetween aboveground C and N pools and soil Navailability with respect to land use. Steady reduc-tions in aboveground pools of C and N at sites alongthe land-use gradient were accompanied by sub-stantial declines in pool sizes and cycling of soilinorganic N. These findings have implications forfuture accumulation rates of C following site aban-donment. Camargo and others (1999) demon-strated that in regenerating forests recovering fromland use in eastern Amazonia, ecosystem processes(for example, root inputs and litterfall) reached lev-els that were nearly identical to those of primaryforests after only 16 years of secondary succession.However, the management scenarios described inour study (relatively short fallow periods punctu-ated by cutting, burning, and a period of land use)do not allow C and N pools to recover to predistur-bance levels. Ultimately, regional C pools and dy-namics will be determined by the composition ofland-cover types across the Brazilian Amazon(Fearnside 1996). Significant gains in the storage ofC across the Brazilian Amazon can be expected onlyafter management practices such as those describedhere, which reduce aboveground C and N stocksand soil N cycling, are replaced by managementscenarios that allow for long-term regeneration ofsecondary forests and the ecosystem processes thatthey support.
ACKNOWLEDGMENTS
We are grateful to Darold Ward, Ron Babbit, B.Barros da Silva, B. Dos Santos, and Kathleen Hu-man for their invaluable assistance with fieldwork.We also thank Lisa Ellingson-Boder and CarolGlassman for assistance with laboratory analysis.We also wish to express our gratitude to all of thesmall landowners who provided us with the oppor-tunity to conduct this research on their propertiesand freely volunteered extensive knowledge onland-use practices in the Brazilian Amazon. VictorJaramillo, Alan Townsend, Mary Scholes, and twoanonymous reviewers provided helpful suggestionsthat greatly improved the manuscript. We thankthe Brazilian Institute of Geography and Statistics(IBGE), the Brazilian Institute of the Environment
and Natural Resources (IBAMA), and the Compa-nia Estanifera de Jacunda for logistical supportthroughout the fieldwork phases of this research.This project was funded by the United States ForestService and the National Aeronautics and SpaceAdministration (NASA) and included substantialsupport from NASA’s Global Change FellowshipProgram.
REFERENCES
Alves DS, Soares JV, Amaral S, Mello EMK, Almeida SAS, DaSilva OF, Silveira AM. 1997. Biomass of primary and second-ary vegetation in Rondonia, western Brazilian Amazon. GlobalChange Biol 3:451–61
Brazil DNPM. 1978. Projeto RADAMBRASIL. Folha SC.20-PortoVelho; Geologia, geomorfolgia, pedologia, vegetacao e usopotencial da terra. Rio de Janeiro: Departmento Nacionel daProducao Mineral
Brazil INPE. 1998. Amazonia: desflorestamento 1995–1997. SaPaulo: Instituto Nacional de Pesquisas Espaciais (INPE), SaJose dos Campos. Available on the Internet: http://www.in-pe.br
Brown JK, Roussopoulos PJ. 1974. Eliminating biases in theplanar intersect method for estimating volumes of small fuels.For Sci 20:350–6
Buschbacher R, Uhl C, Serrao EAS. 1988. Abandonded pasturesin eastern Amazonia. II. Nutrient stocks in the soil and vege-tation. J Ecol 76:682–99
Camargo PBD, Trumbore SE, Martinelli LA, Davidson EA, Nep-stad DC, Victoria RL. 1999. Soil carbon dynamics in regrowingforest of eastern Amazonia. Global Change Biol 5:693–702
Cerri CC, Volkoff B. 1987. Carbon content in a yellow latosol ofCentral Amazon rain forest. Acta Oecol 8:29–42
Chone T, Andreux F, Correa JC, Volcoff B, Cerri CC. 1991.Changes in organic matter in an oxisol from Central Amazonforest during eight years as pasture determined by 13C isotopiccomposition. In: Berthelin J, editor. Diversity of environmen-tal biogeochemistry. Amsterdam: Elsevier. p 398–405
Crutzen PJ, Andreae MO. 1990. Biomass burning in the tropics:impact on atmospheric chemistry and biological cycles. Sci-ence 250:1669–78
Cummings DL, Kauffman JB, Perry DL, Hughes RF.Aboveground biomass and structure of rainforests in theSouthwestern Brazilian Amazon. For Ecol Manage. Forthcom-ing
Davidson EA, Keller M, Erikson HE, Verchot LV, Veldkamp E.2000. Testing a conceptual model of soil emissions of nitrousand nitric oxides. BioScience 50:667–80
de Moraes JL, Cerri CC, Melillo JM, Kicklighter D, Neill C, SkoleDL, Steudler PA. 1995. Soil carbon stocks of the BrazilianAmazon Basin. Soil Sci Soc Am J 59:244–7
de Moraes JFL, Volkoff B, Cerri CC, Bernoux M. 1996. Soilproperties under Amazon forest and changes due to pastureinstallation in Rondonia Brazil. Geoderma 70:63–81
Departmento Nacional de Metrologia–Brasil. 1992. Normais cli-matologicas (1961–1990). Brasilia: Ministerio da Agricultura eReforma Agraria
Desjardins T, Andreux F, Volkoff B, Cerri CC. 1994. Organiccarbon and 13C contents in soils and soil size-fractions, andtheir changes due to deforestation and pasture installation inEastern Amazonia. Geoderma 61:103–18
258 R. F. Hughes and others
Eden MJ, Furley PA, McGregor DFM, Milliken W, Ratter JA.1991. Effect of forest clearance and burning on soil propertiesin northern Roraima, Brazil. For Ecol Manage 38:283–90
Eiten G. 1983. Classificacao da vegetacao do Brasil. Brasilia:CNPq/Coordenacao
Ellingson LJ, Kauffman JB, Cummings DL, Sanford RL, JaramilloVJ. 1999. Soil N dynamics associated with deforestation, bio-mass burning, and pasture conversion in a Mexican tropicaldry forest. For Ecol Manage 4994:1–11
Fearnside PM. 1997. Greenhouse gases from deforestation inBrazilian Amazonia: net commited emissions. Clim Change35:321–60
Fearnside PM. 1996. Amazonian deforestation and global warm-ing: carbon stocks in vegetation replacing Brazil’s Amazonforest. For Ecol Manage 80:21–34
Fearnside PM, Barbosa RI. 1998. Soil carbon changes from con-version of forest to pasture in Brazilian Amazonia. For EcolManage 108:147–66
Gee GW, Bauder JW. 1986. Particle-size analysis. In: Page AL,editor. Methods of soil analysis. P 1. Physical and mineralog-ical methods. 2nd ed. Madison (WI): Soil Science Society ofAmerica. P 383–412
Guild LS, Kauffman JB, Ellingson LJ, Cummings DL, Castro EA,Babbitt RE, Ward DE. 1998. Dynamics associated with totalaboveground biomass, C, nutrient pools and and biomassburning of primary forest and pasture in Rondonia duringSCAR-B. J. Geophys Res 103:32,091–100
Houghton RA. 1999. The annual net flux of carbon to theatmosphere from changes in land use 1850–1990. Tellus 51B:298–313
Hughes, RF, Kauffman JB, Cummings DL. 2000. Fire in theBrazilian Amazon: 3. Dynamics of biomass, C, and nutrientpools in regenerating forests. Oecologia 124:574–588
[INPE] Instituto Nacional de Pesquisas Espaciais. 1992. Defores-tation in estimates in the Brazilian Amazon. Separata. SaoPaulo: Sao Jose dos Campos
Kauffman JB, Cummings DL, Ward DE. 1998. Fire in the Bra-zilian Amazon: 2. Biomass, nutrient pools and losses in cattlepastures. Oecologia 113:415–27
Kauffman JB, Cummings DL, Ward DE, Babbitt R. 1995. Fire inthe Brazilian Amazon: 1. Biomass, nutrient pools, and losses inslashed primary forests. Oecologia 104:397–408
Matson PA, Vitousek PM, Ewel JJ, Mazzarino MJ, Robertson GP.1987. Nitrogen transformations following tropical forest fellingand burning on a volcanic soil. Ecology 68(3):491–502
Montagnini F, Buschbacher R. 1989. Nitrification rates in twoundisturbed tropical rain forests and three slash-and-burnsites of the Venezuelan Amazon. Biotropica 21:9–14
Nadelhoffer KJ, Aber JD, Mellilo JM. 1983. Leaf-litter produc-tion and soil organic matter dynamics along a nitrogen-avail-ability gradient in southern Wisconsin (U.S.A.). Can J for Res13:12–21
Neill C, Fry B, Mellilo JM, Steudler PA, Moraes JFL, Cerri CC.1996. Forest- and pasture-derived carbon contributions tocarbon stocks and microbial respiration of tropical pasturesoils. Oecologia 107:113–9
Neill C, Piccolo MC, Cerri CC, Steudler PA, Melillo JM, Brito M.1997. Net nitrogen mineralization and net nitrification rates in
soils following deforestation for pasture across the southwest-ern Brazilian Amazon Basin landscape. Oecologia 110:243–52
Neill C, Piccolo MC, Melillo JM, Steudler PA, Cerri CC. 1999.Nitrogen dynamics in Amazon forest and pasture soils mea-sured by N-15 pool dilution. Soil Biol Biochem 31:576–72
Neill C, Piccolo MC, Steudler PA, Mellilo JM, Feigl BJ, Cerri CC.1995. Nitrogen dynamics in soils of forests and active pasturesin the western Brazilian Amazon Basin. Soil Biol Biochem27:1167–75
Nelson DW, Sommers LE. 1982. Total carbon, organic carbon,and organic matter. In: Page AL, editor. Methods of soil anal-ysis. P 2. Chemical and microbiological properties. 2nd ed.Madison (WI): Soil Science Society of America. p 539–79
Parton WJ, Schimel DS, Cole CV, Ojima DS. 1987. Analysis offactors controlling soil organic matter levels in Great Plainsgrasslands. Soil Sci Soc Am J 51:1173–79
Raison RJ. 1979. Modification of the soil environment by vege-tation fires with particular reference to nitrogen transforma-tions: a review. Plant Soil 51:73–108
Reiners WA, Bouwman AF, Parsons WFJ, Keller M. 1994. Trop-ical rain forest conversion to pasture: changes in vegetationand soil properties. Ecol Appl 4(2):363–77
Schimel D, Enting IG, Heimann M, Wigley TML, Raynaud D,Alves D, Siegenthaler U. 1995. CO2 and the carbon cycle. In:Houghton JT, Meira Filho LG, Bruce J, Lee H, Callander BA,Haites E, Harris N, Maskell K, editors. Climate change 1994:radiative forcing of climate change and an evaluation of theIPCC IS92 emission scenarios. Cambridge (England): Cam-bridge University Press. p 39–66
Skole D, Tucker C. 1993. Tropical deforestation and habitatfragmentation in the Amazon: satellite data from 1978 to1988. Science 260:1905–10
Sokal RF, Rohlf FJ. 1981. Biometry. San Francisco: WH Freeman
Steudler PA, Mellilo JM, Bowden RD, Castro MS, Lugo AE.1991. The effects of natural and human disturbances on soilnitrogen dynamics and trace gas fluxes in a Puerto Rican wetforest. Biotropica 23:356–63
Trumbore SE, Davidson EA, Carmargo PB, Nepstad DE, Marti-nelli LA. 1995. Belowground cycling of carbon in forests andpastures of Eastern Amazonia. Global Biogeochem Cycles9:515–28
Uhl C, Jordan CF. 1984. Succession and nutrient dynamics fol-lowing forest cutting and burning in Amazonia. Ecology 65:1476–90
Van Wagner CE. 1968. The line intersect method in forest fuelsampling. For Sci 14:20–6
Veldkamp E. 1994. Organic carbon turnover in 3 tropical soilsunder pasture after deforestation. Soil Sci Soc Am J 58:175–80
Verchot LV, Davidson EA, Cattanio JH, Ackerman IL, EricksonHE, Keller M. 1999. Land use change and biogeochemicalcontrols of nitrogen oxide emissions from soils in easternAmazonia. Global Biogeochem Cycles 13:31–46
Vitousek PM, Denslow JS. 1986. Nitrogen and phosphorus avail-ability in treefall gaps of a lowland tropical rainforest. J Ecol74:1167–78
Vitousek PM, Matson PA. 1988. Nitrogen transformations in arange of tropical forest soils. Soil Biol Biochem 20:361–7
Impacts of Land Use on C and N Dynamics in the Amazon 259