dynamical models for uranium leaching - aquac.de · pdf fileh. kalka, h. märten, r....
TRANSCRIPT

UIT GmbH Dresden • Germany
Dynamical Models for Uranium Leaching
H. Kalka
More Info:
H. Kalka, H. Märten, R. Kahnt: Dynamical Models for Uranium Leaching – Production and Remediation Cases
in Uranium in the Environment, B.J. Merkel, A. Hasche-Berger (Editors), Springer Berlin Heidelberg New York, 2006 p. 235-245
© UIT GmbH Dresden H. Kalka
Uranium Miningand Hydrogeology 2005
Dynamical Models for Uranium Leaching
- Production and Remediation Cases -

© UIT GmbH Dresden, Sept. 2005 - 2 -
Dynamical Models
Model Concept1
Production Case2In-situ Leach at Beverley Mine
Remediation Case3Flooding of Königstein Mine
for Uranium Leaching

© UIT GmbH Dresden, Sept. 2005 - 3 -
Dynamical CompartmentModels
mass and charge conservation
high time resolution ∆t ≥ 1 h
local conditionsavailable data
spatial-time structure
modular design with C++ PHREEQC
Thermodynamics
Transport Kinetics
© UIT GmbH Dresden, Sept. 2005 - 4 -
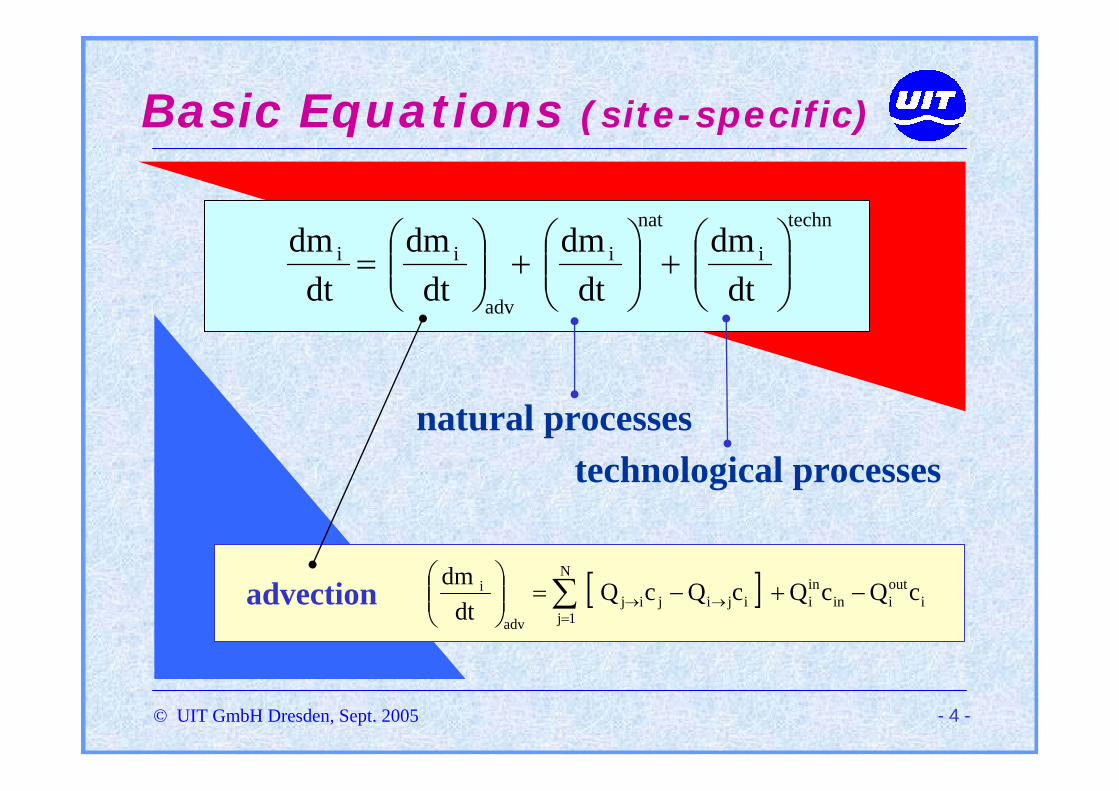
Basic Equations (site-specific)
techn
i
nat
i
adv
ii
dtdm
dtdm
dtdm
dtdm
⎟⎟⎠
⎞⎜⎜⎝
⎛+⎟⎟
⎠
⎞⎜⎜⎝
⎛+⎟⎟
⎠
⎞⎜⎜⎝
⎛=
[ ] ioutiin
ini
N
1jijijij
adv
i cQcQcQcQdt
dm−+−=⎟⎟
⎠
⎞⎜⎜⎝
⎛∑=
→→advection
natural processestechnological processes
© UIT GmbH Dresden, Sept. 2005 - 5 -
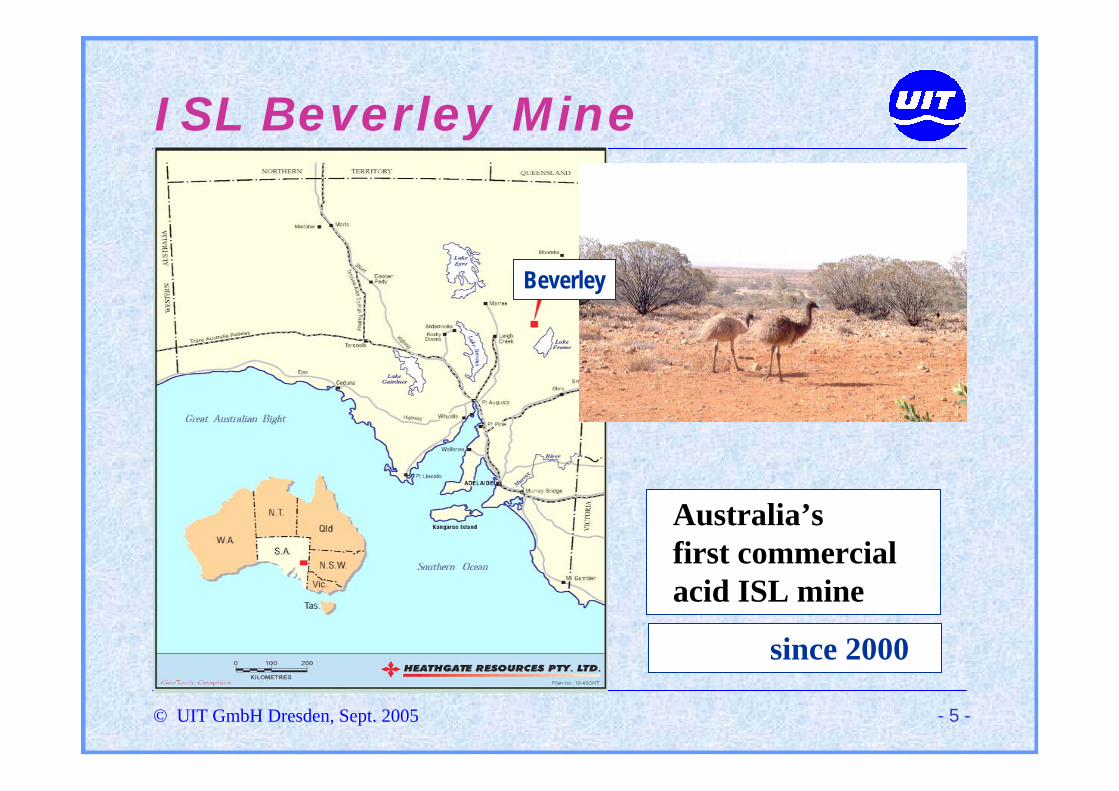
ISL Beverley Mine
Australia’s first commercial acid ISL mine
Beverley
since 2000

© UIT GmbH Dresden, Sept. 2005 - 6 -
Wellfield / Wellhouse
injectionextraction
complex flow pattern
averaging overore grades,
hydraulic parameters

© UIT GmbH Dresden, Sept. 2005 - 7 -
First: Analytical Approach
oreore
mdt
dmλ−=
qmmdtdm ore −λ=
0ore m)0(m =
0)0(m =
dissolution flushing
{ }tqt0 ee
qc)t(c λ−− −
−λλ
=
P0Vc=
initial mass
mas
s tra
nsfe
r

© UIT GmbH Dresden, Sept. 2005 - 8 -
{ }tqt0 ee
qc)t(c λ−− −
−λλ
=
Three Parameters
PV/Qq =
flushing rateExample
830 OUt200m =3
P m00030V =h/m200Q 3=
)pH2(bea −⋅=λ
dissolution rate
P00 V/mc =
initial concentration
17 s105.0a −−⋅=2.3b =USiO4

© UIT GmbH Dresden, Sept. 2005 - 9 -
Uranium in the Lixiviant
0
50
100
150
200
250
300
350
400
450
0 30 60 90 120 150 180 210
Time [d]
U3O
8 [p
pm]
WH 8
0
50
100
150
200
250
300
350
400
450
0 30 60 90 120 150 180 210
Time [d]
U3O
8 [p
pm]
WH 9
1d160.0q −=
1d136.0q −=
L/g7.5c0 =
1d016.0 −=λ
L/g4.6c0 =
1d011.0 −=λ
SO4, Cl, Fe, Ca, Si ?
geochemical model
© UIT GmbH Dresden, Sept. 2005 - 10 -
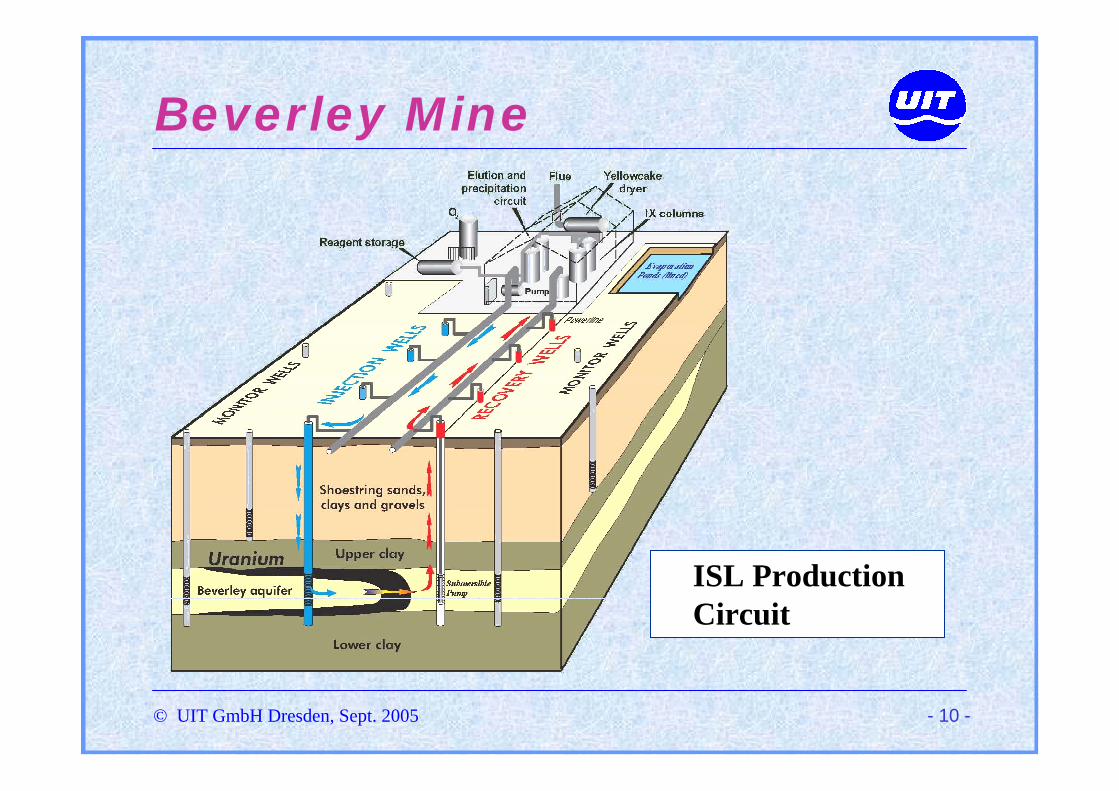
Beverley Mine
ISL ProductionCircuit
© UIT GmbH Dresden, Sept. 2005 - 11 -
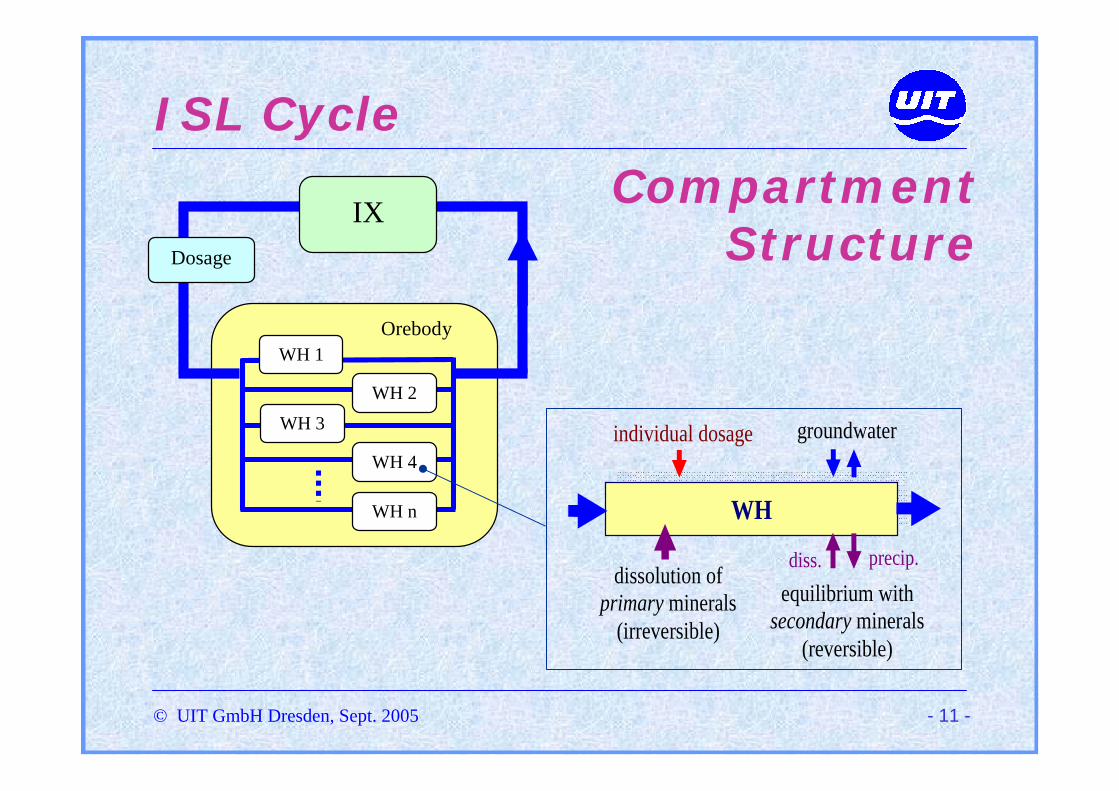
ISL Cycle
Orebody
IX Dosage
WH 1
WH 2 WH 3
WH 4
WH n WH
groundwater
diss. precip.
individual dosage
equilibrium with secondary minerals
(reversible)
dissolution of primary minerals
(irreversible)
Compartment Structure

© UIT GmbH Dresden, Sept. 2005 - 12 -
ISL - Numerical Model
04080
120160200240280320360400440480
07.07.03 22.07.03 06.08.03 21.08.03 05.09.03 20.09.03 05.10.03 20.10.03 04.11.03
1,01,21,41,61,82,02,22,42,62,83,03,23,43,6
07.07.03 22.07.03 06.08.03 21.08.03 05.09.03 20.09.03 05.10.03 20.10.03 04.11.03
W9 Data W8 Data W9 Model W8 Model
pH
U3O8
leaching + IX
time behavior ofpH, ORP
U, SO4, Cl, Fe, CaNa, Al, Mg, K, Si
... and material balance in the cycle
silicate minerals
inte
rfer
ing
leac
hing
© UIT GmbH Dresden, Sept. 2005 - 13 -
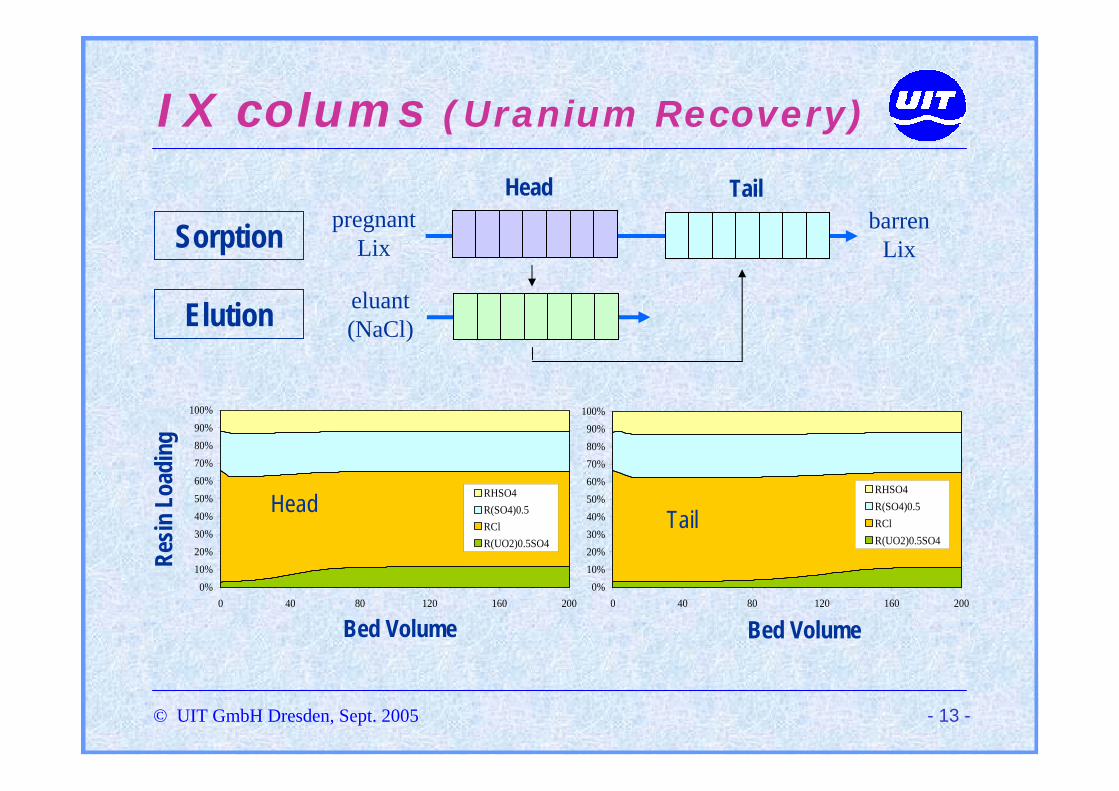
IX colums (Uranium Recovery)
pregnantLix
barrenLix
Head Tail
Sorption
0%10%20%30%40%50%60%70%80%90%
100%
0 40 80 120 160 200
Resin bed volumes
RHSO4R(SO4)0.5RClR(UO2)0.5SO4
0%10%20%30%40%50%60%70%80%90%
100%
0 40 80 120 160 200
Resin bed volumes
RHSO4R(SO4)0.5RClR(UO2)0.5SO4
Head Tail
Bed Volume Bed Volume
Resin
Loa
ding
eluant(NaCl)Elution

© UIT GmbH Dresden, Sept. 2005 - 14 -
Königstein Uranium Mine
1967 mining1984 acid ISL
A1
A2
A3
A4
B1
B2
B3
AG
BG
C1
C2CG
P_B1
P_B2
P_B3
P_C1
P_C2
P_C3
P_D0
Pfeiler
KS
E2
E1WN
C3
DG WS
Uranium Mine Königstein
pillar
dept
h
cont
rol d
rift
pum
p
Compartment StructureSouth-East Saxony
(near Dresden)
1991 decommissioning2001 start flooding

© UIT GmbH Dresden, Sept. 2005 - 15 -
Internal StructureCo
mpa
rtm. 1
P
Com
partm
. 2
P
F
F
of a Compartment
mobile watermass transport
stagnant watermass production & storage
© UIT GmbH Dresden, Sept. 2005 - 16 -
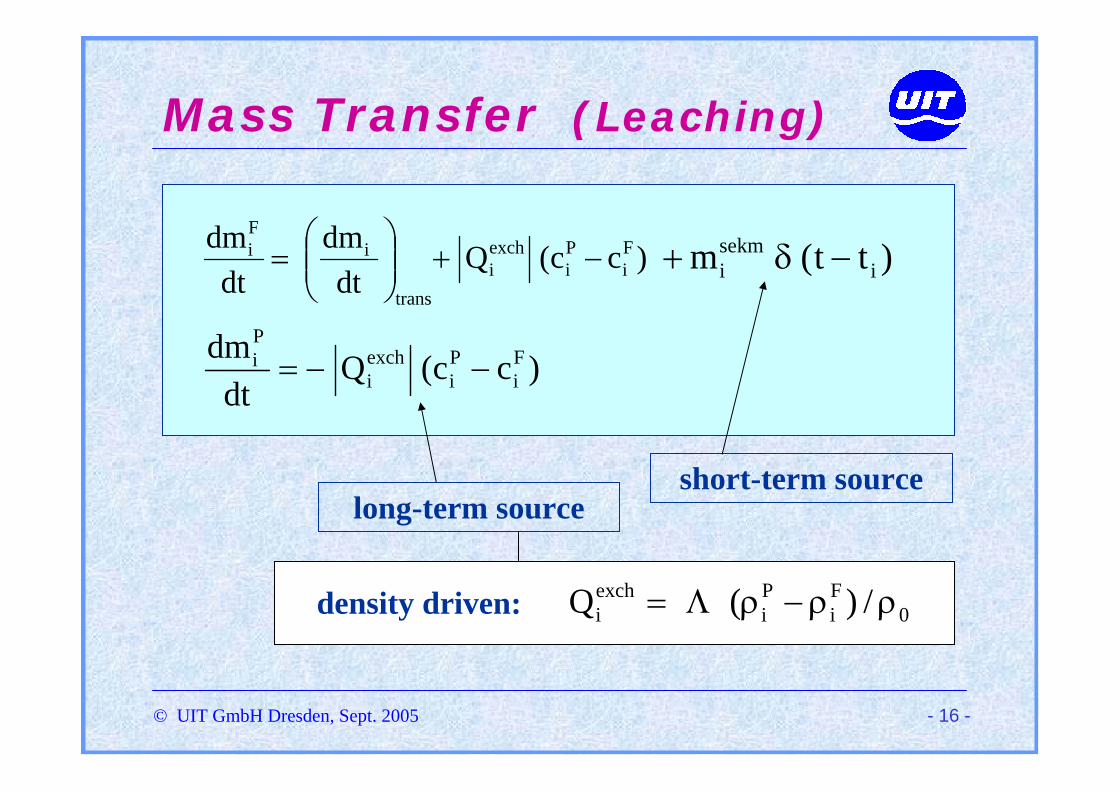
Mass Transfer (Leaching)
)cc(Qdt
dmdt
dm Fi
Pi
exchi
trans
iFi −+⎟⎟
⎠
⎞⎜⎜⎝
⎛=
)cc(Qdt
dm Fi
Pi
exchi
Pi −−=
0Fi
Pi
exchi /)(Q ρρ−ρΛ=density driven:
long-term sourceshort-term source
)tt(m isekmi −δ+
© UIT GmbH Dresden, Sept. 2005 - 17 -
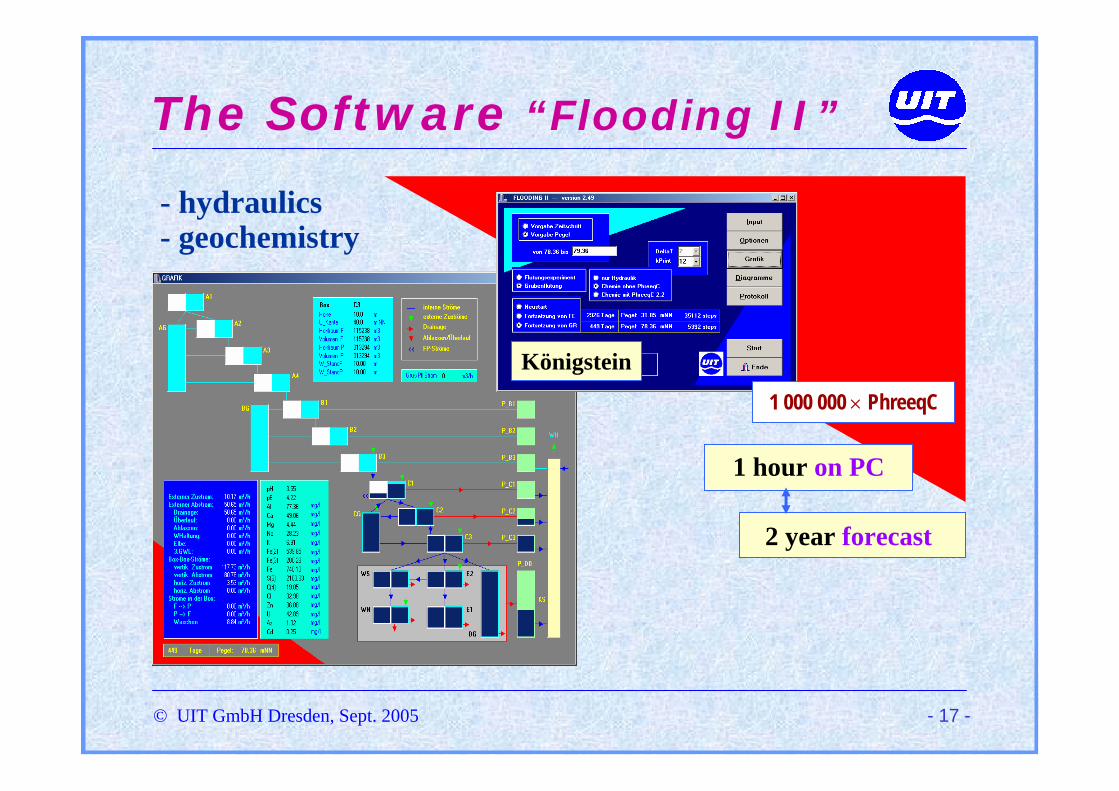
The Software “Flooding II”
- hydraulics - geochemistry
Königstein
1 hour on PC
2 year forecast
1 000 000 × PhreeqC

© UIT GmbH Dresden, Sept. 2005 - 18 -
Step-by-Step Approach
Model Calibration
Forecast
FirstFlooding
Experiment
SecondFlooding
Experiment
1993
1997
2001
2005Fine Tuning
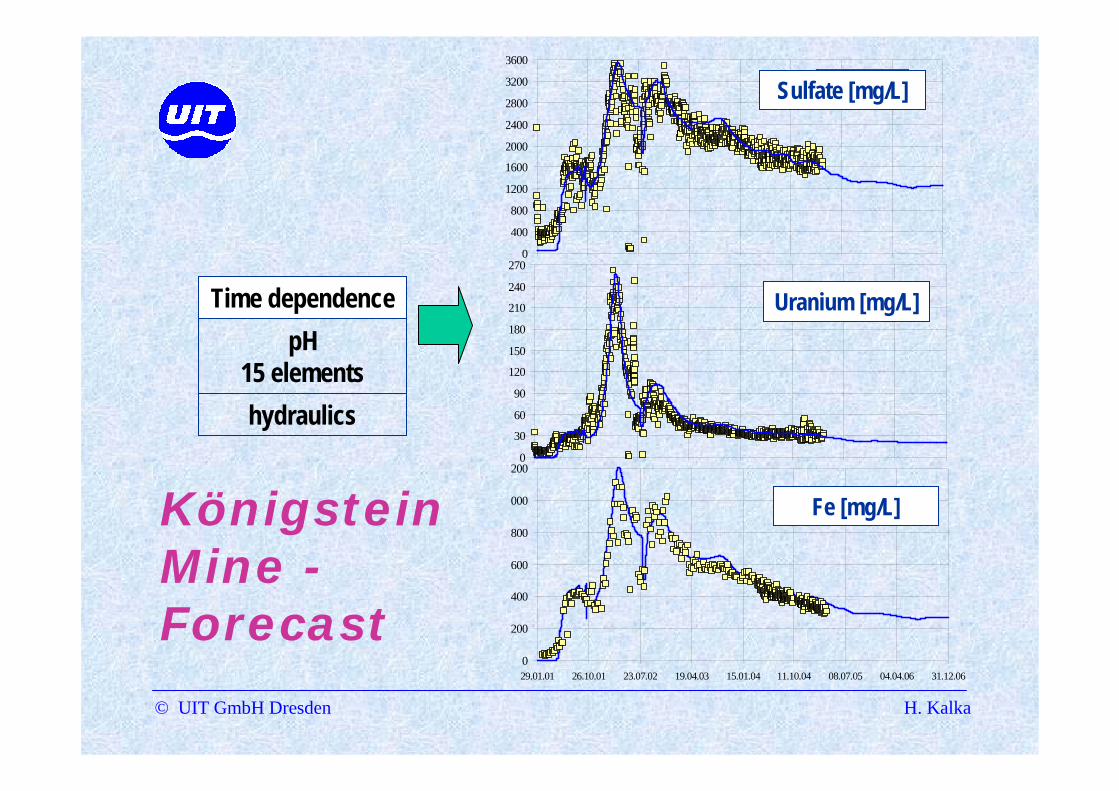
0
400
800
1200
1600
2000
2400
2800
3200
3600
29.01.01 26.10.01 23.07.02 19.04.03 15.01.04 11.10.04 08.07.05 04.04.06 31.12.06
SulfateSulfate [mg/L]
© UIT GmbH Dresden H. Kalka
0
400
800
1200
1600
2000
2400
2800
3200
3600
Sulfate
0
30
60
90
120
150
180
210
240
270
U
0
200
400
600
800
000
200
29.01.01 26.10.01 23.07.02 19.04.03 15.01.04 11.10.04 08.07.05 04.04.06 31.12.06
FeKönigstein Mine -Forecast
Sulfate [mg/L]
Fe [mg/L]
Uranium [mg/L]pH
15 elements
Time dependence
hydraulics
© UIT GmbH Dresden, Sept. 2005 - 20 -
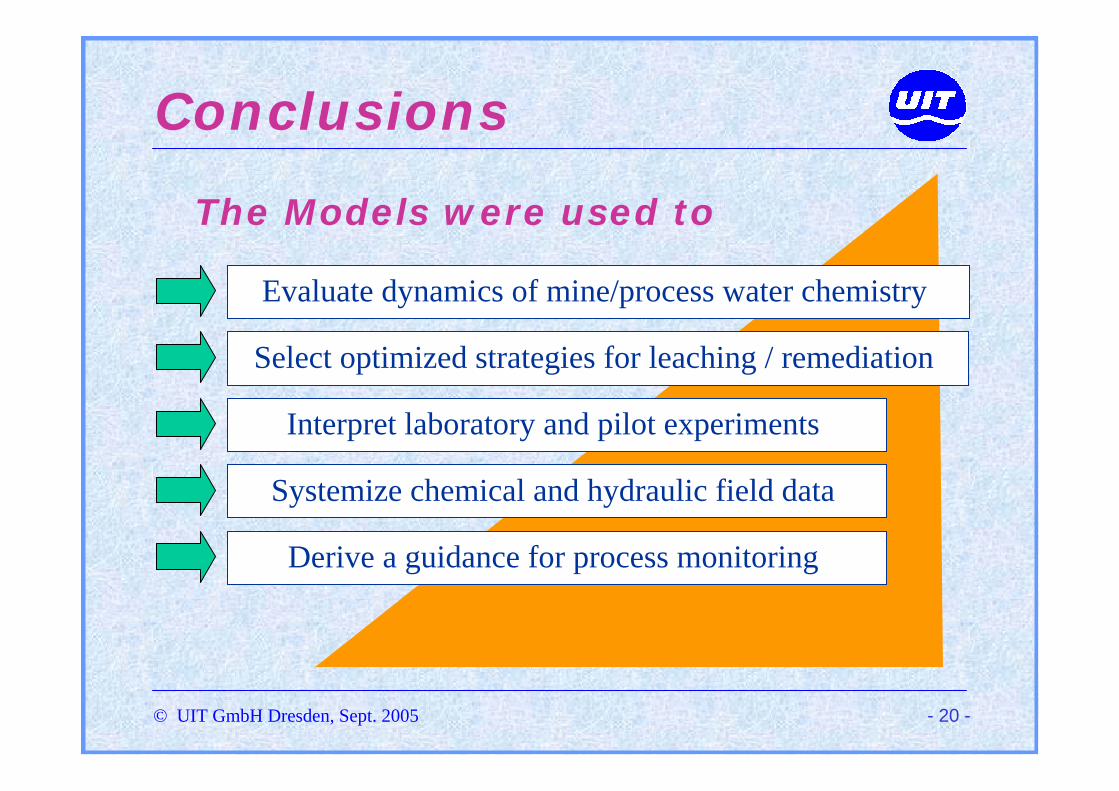
Evaluate dynamics of mine/process water chemistry
Conclusions
The Models were used to
Select optimized strategies for leaching / remediation
Interpret laboratory and pilot experiments
Systemize chemical and hydraulic field data
Derive a guidance for process monitoring