dynamic response of terrestrial hydrological cycles and...
TRANSCRIPT
Dynamic Response of Terrestrial Hydrological Cycles and Plant Water Stressto Climate Change in China
FULU TAO
Institute of Geographic Sciences and Natural Resources Research, Chinese Academy of Sciences, Beijing, China
ZHAO ZHANG
State Key Laboratory of Earth Surface Processes and Resource Ecology, Beijing Normal University, Beijing, China
(Manuscript received 6 May 2010, in final form 30 September 2010)
ABSTRACT
Rising atmospheric CO2 concentration CO2 and climate change are expected to have a major effect on
terrestrial ecosystem hydrological cycles and plant water stress in the coming decades. The present study
investigates the potential responses of terrestrial ecosystem hydrological cycles and plant water stress across
China to elevated CO2 and climate change in the twentieth and twenty-first centuries using the calibrated and
validated Lund–Potsdam–Jena dynamic global vegetation model (LPJ-DGVM) and eight climate change
scenarios. The spatiotemporal change patterns of estimated evapotranspiration (ET), soil moisture, runoff,
and plant water stress due to climate change and elevated CO2 are plotted singly and in combination. Positive
future trends in ET, soil moisture, and runoff—although differing greatly among regions—are projected.
Resultant plant water stress over China’s terrestrial ecosystem generally could be eased substantially through
the twenty-first century under the climate scenarios driven by emission scenarios that consider economic
concerns. By contrast, under the climate scenarios driven by emission scenarios that consider environmental
concerns, plant water stress could be eased until 2060, then begin to fluctuate until 2100. The net impact of
physiological and structural vegetation responses to elevated CO2 could result in an increasing trend in runoff
in southern and northeastern China, and a decreasing trend in runoff in northern and northwestern China in
the twentieth century. It is projected to reduce ET by 1.5 3 109 to 6.5 3 109 m3 yr21 on average, and increase
runoff by 1.0 3 109 to 5.4 3 109 m3 yr21 during 2001–2100 across China’s terrestrial ecosystems, although the
spatial change pattern could be quite diverse. These findings, in partial contradiction to previous results,
present an improved understanding of transient responses of China’s terrestrial ecosystem hydrological cycles
and plant water stress to climate change and elevated CO2 in the twentieth and twenty-first centuries.
1. Introduction
The climate and ecosystem interact with each other
through energy, water, and carbon exchange. Temper-
ature, radiation, and water interact to impose complex
and varying limitations on vegetation dynamics in dif-
ferent parts of the world (Churkina and Running 1998).
Among the major limiting factors to plant growth, water
availability most strongly limits vegetation growth over
40% of the earth’s vegetated surface (Nemani et al. 2003).
In Asia, the spatial and temporal variability of ecosystems
are characterized by their strong response to variations in
monsoon rainfall (Fu and Wen 1999). Particularly, var-
iability in precipitation regimes at seasonal and longer
time scales strongly influences ecosystem dynamics in
arid and semiarid regions (Lotsch et al. 2003; Tao et al.
2008).
Rising atmospheric CO2 concentration [CO2], land use
change, and climate change are expected to have a ma-
jor effect on global hydrological cycles, water resource
availability, and terrestrial ecosystem dynamics in the
coming decades (e.g., Alcamo et al. 2003; Tao et al. 2003;
Arnell 2004; Barnett et al. 2005; Milly et al. 2005; de Wit
and Stankiewicz 2006; Oki and Kanae 2006; Gedney et al.
2006; Gerten et al. 2007; Piao et al. 2007; Koutsoyiannis
et al. 2007; Alo and Wang 2008). Climate change directly
influences precipitation patterns, the hydrological cycle,
and vegetation dynamics, leading to substantial changes
in land surface dynamics (e.g., Milly et al. 2005; Alo and
Corresponding author address: Fulu Tao, Institute of Geographic
Sciences and Natural Resources Research, Chinese Academy of
Sciences, Beijing 100101, China.
E-mail: [email protected]
JUNE 2011 T A O A N D Z H A N G 371
DOI: 10.1175/2010JHM1314.1
� 2011 American Meteorological Society
Wang 2008; Tao et al. 2008). On the other hand, changes in
land surface properties—such as albedo, surface rough-
ness, rooting depth, stomatal resistance, and leaf area
index (LAI)—can feed back on the hydrological cycle
and climate through the energy and water fluxes (e.g.,
Sellers et al. 1997; Beltran-Przekurat et al. 2008). Under
elevated [CO2], stomatal apertures on plant leaves are
observed to close partially—suppressing transpiration
and, consequently, increasing runoff—together with pre-
cipitation increase (e.g., Gedney et al. 2006; Betts et al.
2007); structural changes in vegetation in response to
increased productivity, particularly changes in LAI, can
also alter canopy interception and transpiration (e.g.,
Sellers et al. 1997; Cowling and Field 2003; Piao et al.
2007; Alo and Wang 2008).
Numerous studies have investigated the trends in
river runoff and water availability for human use (e.g.,
Vorosmarty et al. 2000; Alcamo et al. 2003; Arnell
2004; Barnett et al. 2005; Milly et al. 2005; de Wit and
Stankiewicz 2006) and changes in terrestrial ecosystem
hydrological cycles due to climate change and/or human
activities on a global scale (e.g., Tao et al. 2003; Gedney
et al. 2006; Gerten et al. 2007; Piao et al. 2007; Alo and
Wang 2008). The results generally show that climate
change, land use change, and [CO2] have substantial ef-
fects on terrestrial ecosystem hydrological cycles, which
are expected to accelerate in a warmer future climate.
Increasing evapotranspiration (ET), deceasing runoff,
and increasing drought risk in some regions of the world,
accompanied with pronounced increases in precipita-
tion and runoff in other regions, have been indicated.
However, the mechanisms underlying the observational
runoff changes, particularly the roles of physiological
(e.g., stomatal) and structural (e.g., LAI) responses of
vegetation to elevated [CO2], remain uncertain. For
example, Gedney et al. (2006), using a mechanistic land
surface model, attributed increases in continental runoff
in the twentieth century to rising [CO2] via the suppres-
sion of transpiration. Piao et al. (2007), using a process-
based terrestrial biosphere model [Organizing Carbon
and Hydrology in Dynamic Ecosystems (ORCHIDEE)]
accounting for both the physiological and structural re-
sponse of elevated [CO2], found a decrease in global
runoff in the twentieth century. Gerten et al. (2007)
explored the effects of rising [CO2] and climate change
on soil moisture and biome-level water limitation during
2071–2100 using the Lund–Potsdam–Jena dynamic global
vegetation model (LPJ-DGVM) forced by five different
climate scenarios based on the same Intergovernmental
Panel on Climate Change (IPCC) 1992 emission scenario
(IS92a). They found that ecosystems in northern tem-
perate latitudes were at greatest risk of increasing water
limitation, in contrast with most other latitudes, where
ecosystem water limitation tended to be eased. Alo
and Wang (2008) used a Community Land Model, ver-
sion 3 (CLM3) land surface model driven by eight cli-
mate scenarios to explore the hydrological impact of the
potential vegetation response to climate change in 2100.
They showed that climate- and CO2-induced changes in
potential vegetation structure substantially influenced
the surface hydrological processes.
Dynamic responses of hydrological cycles and vege-
tation water stress at a regional scale to climate change
are complex, with both regional increases and decreases
expected in runoff, drought, and flooding risk (e.g., Tao
et al. 2005; de Wit and Stankiewicz 2006; Barnett et al.
2008; Vano et al. 2008; Mishra et al. 2010). In China,
numerous studies have investigated the responses of
streamflow to changes in climate and/or land use/cover
in some watersheds (e.g., Zhang and Wang 2007; Zhang
et al. 2008; Cong et al. 2009). Less attention has been
paid to changes in terrestrial hydrological cycles and
water availability for natural ecosystems. Tao et al. (2005)
developed a terrestrial ecosystem water-balance model to
assess the interactive impacts of climate change and soil
degradation on terrestrial water cycles in China. Recent
studies highlight the importance of vegetation structure
feedback on the water balance of the land surface (e.g.,
Gedney et al. 2006; Gerten et al. 2007; Piao et al. 2007;
Alo and Wang 2008), suggesting that our understand-
ing of the dynamic response of terrestrial hydrological
cycles to climate change and rising [CO2] across China’s
terrestrial ecosystem could be improved with dynamic
global vegetation models (DGVMs).
In a companion paper (Tao and Zhang 2010), the LPJ-
DGVM (Sitch et al. 2003), with the updated hydrology
of Gerten et al. (2004), was calibrated and validated, and
forced by eight climate scenarios to investigate the dy-
namic responses of the terrestrial ecosystem’s structure
and function to transient change in [CO2] and climate
in China. In the present study, using the calibrated and
validated LPJ-DGVM over China, we aim to investigate
the dynamic responses of major components of terres-
trial hydrological cycles and vegetation water stress across
China’s terrestrial ecosystem to transient change in [CO2]
and climate in the twentieth and twenty-first centuries.
2. Methods and data
a. LPJ-DGVM
The LPJ-DGVM (Sitch et al. 2003) simulates photo-
synthesis, plant distribution, and competition of 10 plant
functional types (PFTs), including tropical broad-leaved
evergreen (TrBE), tropical broad-leaved rain green
(TrBR), temperate needle-leaved evergreen (TeNE),
372 J O U R N A L O F H Y D R O M E T E O R O L O G Y VOLUME 12
temperate broad-leaved evergreen (TeBE), temperate
broad-leaved summer green (TeBS), boreal needle-leaved
evergreen (BoNE), boreal needle-leaved summer green
(BoNS), boreal broad-leaved summer green (BoBS),
temperate herbaceous (TeH), and tropical herbaceous
(TrH). The current version includes the updated hy-
drology of Gerten et al. (2004). Human land use such
as cropland is not considered—all simulations reported
here are for potential natural vegetation. The plant dis-
tribution is based on bioclimatic limits for plant growth
and regeneration. PFT-specific parameters govern com-
petition for light and water among the PFTs. Dispersal
processes are not explicitly modeled, and an individual
PFT can invade new regions if its bioclimatic limits and
competition with other PFTs allow establishment. Car-
bon is stored in seven PFT-associated pools representing
leaves, sapwood, heartwood, fine roots, a fast and a slow
decomposing above-ground litter pool, and a below-
ground litter pool; in addition, two soil carbon pools for
each grid cell receive input from the litter pools of all
PFTs present. Photosynthesis is a function of absorbed
photosynthetic-active radiation, temperature, atmospheric
[CO2], day length, canopy conductance, and biochemical
pathways (C3 and C4), using a form of the Farquhar
scheme (Farquhar et al. 1980; Collatz et al. 1992) with
leaf-level optimized nitrogen allocation (Haxeltine and
Prentice 1996) and an empirical convective boundary
layer parameterization (Monteith 1995) to couple car-
bon and water cycles. Decomposition rates of soil and
litter organic carbon depend on soil temperature (Lloyd
and Taylor 1994) and moisture (Foley et al. 1996). The
model has been extensively used to study past, present,
and future terrestrial ecosystem carbon and hydrologi-
cal dynamics, as well as biochemical and biophysical
interactions between ecosystems and the atmosphere at
global, regional, and site scales (e.g., Cramer et al. 2001;
Bachelet et al. 2003; Sitch et al. 2003; Morales et al. 2007;
Scholze et al. 2006; Gerten et al. 2007; Sitch et al. 2008;
Doherty et al. 2010).
The water balance in the LPJ-DGVM is coupled to
vegetation dynamics and photosynthesis. The model dis-
tinguishes 2 soil layers with fixed thickness (upper, 50 cm;
lower, 100 cm). The soil moisture of each layer is up-
dated at daily time steps according to the previous day’s
water content and the balance between the amount of
water infiltrating into the soil and that removed from the
soil layers through runoff, percolation, and actual ET.
The ET is the sum of interception loss and plant tran-
spiration for all PFTs, plus evaporation from bare soil.
Transpiration is modeled as the lesser of an atmosphere-
controlled demand function and a plant-controlled sup-
ply function, as proposed by Federer (1982). The model
diagnoses surface and subsurface runoff from the excess
of water over field capacity of the upper and the lower soil
layer, respectively. The amount of water percolating
through the second soil layer is assumed to contribute to
subsurface runoff. There is no lateral redistribution of
water among grid cells and no routing in the stream
network. Soil water limitation restricts the transpiration
and photosynthesis rates, which emulates the decrease
of photosynthetic activity as the soil water content de-
clines and finally reaches the wilting point. The ratio
between actual and potential canopy conductance, con-
sequently, describes the extent to which transpiration and
photosynthesis are co-limited by soil water deficit. The
water balance computed by LPJ-DGVM has been com-
prehensively validated, and it was found that the model
performs on the level of state-of-the-art global hydro-
logical models with respect to the quality of runoff and
ET simulations (Gerten et al. 2004).
b. Model input data and modeling protocol
1) MODEL INPUT DATA
Model input data are monthly mean air temperature,
total precipitation and percentage of full sunshine, an-
nual atmospheric [CO2], and soil texture class. Monthly
fields of mean temperature, precipitation, cloud cover,
and the number of wet days on a 0.58 3 0.58 grid from
1901 to 2000 were taken from the Climatic Research
Unit (CRU) dataset called CRU time series (TS) 2.1
(Mitchell and Jones 2005). To get daily values used in
LPJ-DGVM, monthly mean temperature and percent-
age of full sunshine data are interpolated to provide
‘‘quasi-daily’’ time series of climate using linear inter-
polation; monthly precipitation is interpolated to daily
values using a weather generator, with monthly total
precipitation and wet days as inputs, after Gerten et al.
(2004). The dataset of historical global atmospheric
[CO2] was from the Carbon Cycle Model Linkage Project
(Kicklighter et al. 1999; McGuire et al. 2001). The da-
taset was extended to 2000 according to atmospheric
observation (Keeling and Whorf 2005). Soil texture
data were based on the Food and Agricultural Organi-
zation (FAO) soil dataset (Zobler 1986; FAO 1991).
For future climate and [CO2] scenarios, eight future
climate scenarios consisting of the combinations of two
GCMs and four IPCC Special Report on Emissions
Scenarios (SRES) emission scenarios (A1FI, A2, B1,
and B2) were used in the study. The two GCMs are third
climate configuration of the Met Office (UKMO) Uni-
fied Model (HadCM3) and Canadian Centre for Climate
Modelling and Analysis (CCCma) Coupled General
Circulation Model, version 2 (CGCM2). CGCM2 pre-
dicts warmer and drier conditions over China, while
HadCM3 predicts wetter conditions. The HadCM3
JUNE 2011 T A O A N D Z H A N G 373

model includes CO2 effects on stomatal closure in its
land surface scheme, which affect the evolution of the
climate (Betts et al. 2007). This has been shown to
contribute to greater warming over land than would be
the case without CO2 physiological effects (Boucher
et al. 2009). By contrast, the land surface scheme in
CGCM2 uses a single soil layer with spatially varying
field capacity and soil properties. The scenarios on
monthly fields of mean temperature, precipitation, and
cloud cover on a 0.58 3 0.58 grid from 2001 to 2100 were
taken from the CRU at the University of East Anglia
(Mitchell et al. 2004). The monthly wet days in the
twenty-first century are assumed to replicate the ob-
served values in the twentieth century because the
variable is not available in the future climate change
scenarios. GCM outputs were interpolated to 0.58 res-
olution using a Delaunay triangulation of a planar set
of points. Climate scenarios of the twenty-first century
replicate observed month-to-month, interannual, and
multidecadal climate variability of the detrended twen-
tieth century climate. (The full method for its con-
struction is described in Mitchell et al. 2004.) Thus,
climate scenarios of the twenty-first century replicate
the observed month-to-month, interannual, and multi-
decadal climate variability of the detrended twentieth
century climate data. One consequence of this approach
is that possible future changes in multidecadal or in-
terannual variability from the GCMs are not included in
these scenarios. The dataset of global atmospheric CO2
concentration scenarios under A1FI, A2, B1, and B2
emission scenarios was taken from the IPCC report
(Prentice et al. 2001). For each year, the average of the
reference estimate from the Integrated Science Assess-
ment Model (ISAM) and the reference estimate from the
Bern Carbon Cycle (Bern-CC) model was used. The cli-
mate and CO2 scenarios used in the study are as in Tao
and Zhang (2010). In comparison with the baseline
(1961–90) level, atmospheric CO2 concentration is pro-
jected to change by a factor of 1.64 (B1) to 2.90 (A1FI) by
2100.
2) MODELING PROTOCOL AND ANALYSIS
The LPJ-DGVM has been calibrated to reasonably
capture the general patterns of vegetation distribution
across China’s terrestrial ecosystems. New parameter
values were used for bioclimatic limits, and the model
was validated against satellite, in situ, and inventory data
for net primary production (NPP), LAI, and carbon stor-
age simulations (Tao and Zhang 2010).
In the present study, the calibrated model was applied
to simulate the dynamic responses of terrestrial hydro-
logical cycles and plant water stress to climate change
and rising [CO2] across China from 1901 to 2100 at the
gridcell resolution of 0.58 3 0.58. The simulation for each
grid cell began from ‘‘bare ground,’’ and ‘‘spun up’’
(under nontransient climate) for 1000 model years to
develop equilibrium carbon pools and vegetation cover,
following the standard simulation by Sitch et al. (2003).
Then the model was driven with transient historical
climate (1901–2000) and each of the eight future climate
scenarios (2001–2100) from 1901 to 2100 together with
transient historical [CO2] (1901–2000) and future [CO2]
under the corresponding emission scenario (2001–2100)
(hereafter, ETRC experiment).
To quantify the hydrological impacts of climate change
and the direct physiological and structural effects of
[CO2] enrichment separately, we also have contrasting
simulation experiments with [CO2] held at year 2000
state from 2001 to 2100 for all 8 scenarios, while using
the same climate inputs as ETRC experiment (hereafter,
ETR experiment).
We further investigated the temporal and spatial
patterns and mechanisms in changes of major compo-
nents in terrestrial hydrological cycles such as ET, soil
moisture (Ws), and runoff, as well as the changes in plant
water stress, under eight different climate scenarios in
both the ETRC and ETR experiments. Direct physiological
and structural effects of [CO2] enrichment are derived as
the difference between the ETRC and ETR experiments.
c. Runoff and ET dataset for model validation
The University of New Hampshire (UNH)–World
Meteorological Organization’s Global Runoff Data Cen-
ter (GRDC) Composite Runoff Fields v1.0 (Fekete et al.
2002) are used to validate the simulated runoff. The
composite runoff fields are based on observed river dis-
charge and simulated water balances. Selected gauging
stations from the World Meteorological Organization
GRDC data archive were firstly geographically co-
registered to a gridded simulated topological network
at 0.58 spatial resolution. Interstation regions between
gauging stations along the network were identified and
annual interstation runoff was calculated. The annual
interstation runoff was compared with outputs from
water-balance model calculations, which were performed
using long-term mean monthly climate forcing (temper-
ature and precipitation). The simulated runoff for each
cell was multiplied by the ratio of observed to simulated
runoff of the corresponding interstation region from the
GRDC dataset to create spatially distributed runoff
fields at 0.58 spatial resolution.
The Global Hydrographic Dataset (GGHYDRO),
release 2.3.1 (Cogley 2003) is also used to compare with
simulated runoff. The runoff field has a spatial resolu-
tion of 18 longitude by 18 latitude. The runoff field
was derived from maps in a considerable number of
374 J O U R N A L O F H Y D R O M E T E O R O L O G Y VOLUME 12

sources, of which Korzun et al. (1977) was the most
important.
A new version of the Moderate Resolution Imaging
Spectroradiometer (MODIS) ET product, developed by
Mu et al. (2007), is used to compare with simulated ET.
The ET product was developed using an algorithm based
on the Penman–Monteith method, using reanalysis me-
teorological data and 0.058 remote sensing data from
MODIS.
3. Results
a. Changes in temperature and precipitation
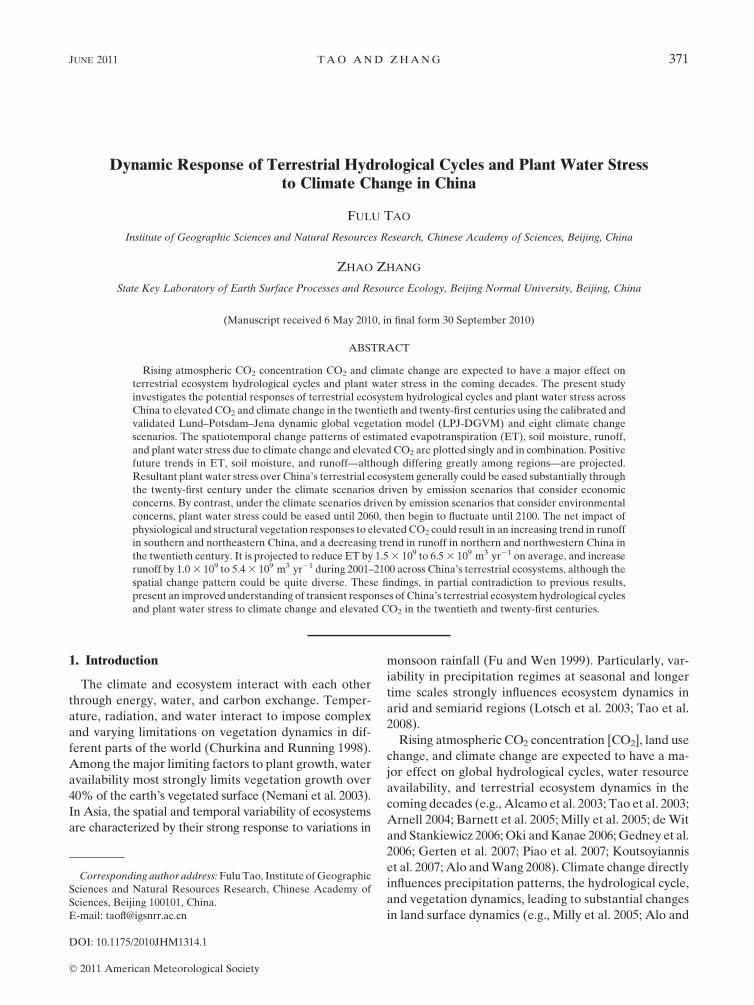
In comparison with the period 1961–90 (Figs. 1a,b),
during 2071–2100, under the HadCM3 A1FI scenario,
annual mean temperature would increase from 3.28 to
7.38C across China (Fig. 1c), with the lowest increase in
the southeast and the highest increase in the northeast
and northwest. Annual total precipitation would in-
crease in most of China by up to 880 mm, with the most
increase in the south (Fig. 1d). Under the HadCM3 B1
scenario, annual mean temperature would increase from
1.68 to 4.08C across China (Fig. 1e), with the lowest in-
crease in the southeast and the highest increase in the
northeast and northwest. Annual total precipitation
would increase in most of China by up to 520 mm, with
the highest increase in the south and southeast (Fig. 1f).
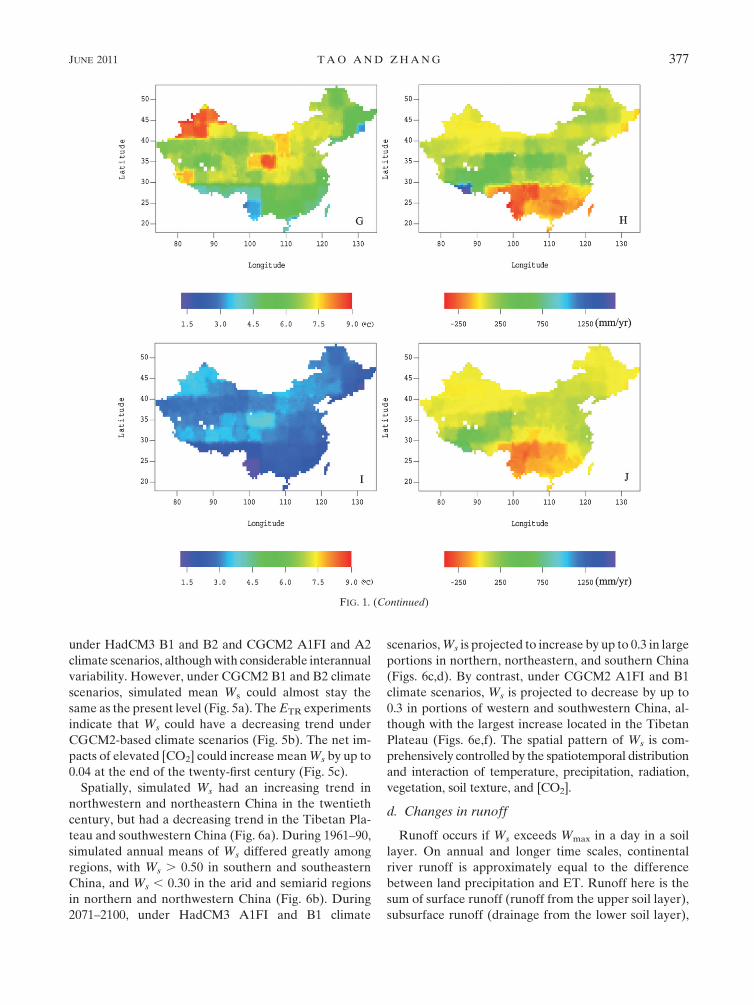
Under the CGCM2 A1FI scenario, annual mean tem-
perature would increase from 2.98 to 9.18C across China
(Fig. 1g), with the lowest increase in the southwest and
the highest increase in the northwest. Annual total pre-
cipitation would increase from 2410 to 1600 mm, and
decrease most in the southwest (Fig. 1h). Under the
CGCM2 B1 scenario, annual mean temperature would
increase from 1.28C to 3.98C across China (Fig. 1i), with
the lowest increase in the southeast. Annual total pre-
cipitation would increase from 2270 to 738 mm, and
decrease most in the southwest (Fig. 1j).
b. Changes in evapotranspiration
The LPJ-DGVM captures the general pattern of the
MODIS-based ET across China reasonably well, al-
though simulated ET is relatively smaller in some por-
tions of southeastern China and the Tibetan Plateau
(Fig. 2). Moreover, model estimates of ET can reasonably
capture the interannual changes of the MODIS-based
ET. For example, ET changes in portions of north-
eastern and southwestern China in 2000 (Figs. 2a,b), 2001
(Figs. 2c,d), and 2002 (Figs. 2e,f) are captured generally.
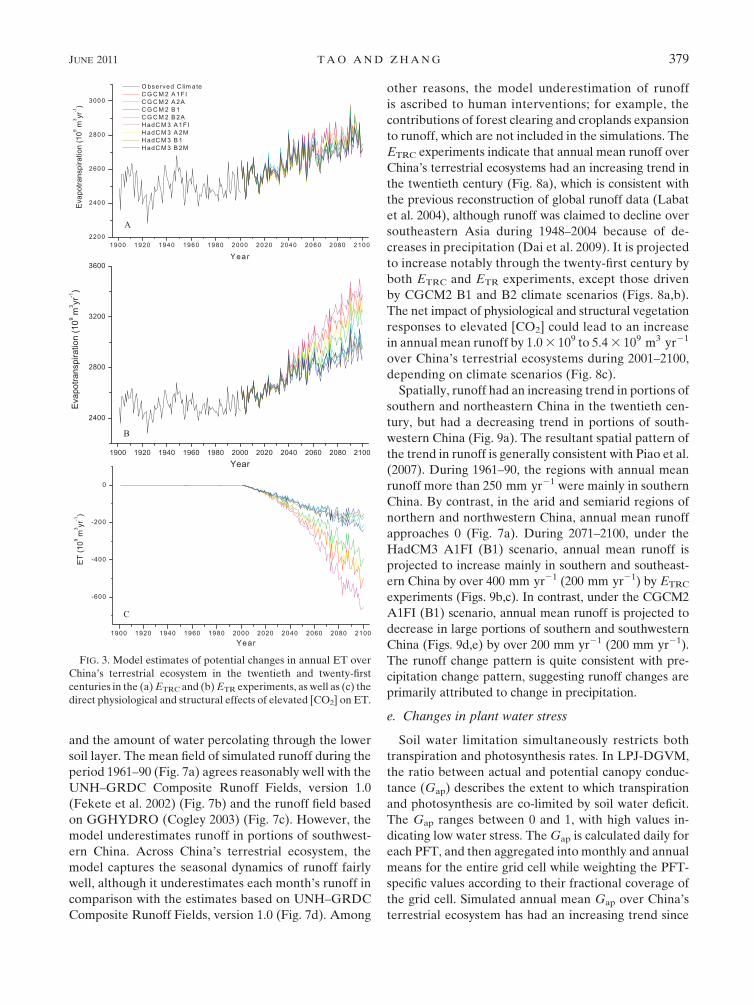
Simulations show that ET over China’s terrestrial
ecosystems has had an increasing trend since the 1920s.
Both ETRC (Fig. 3a) and ETR (Fig. 3b) experiments
indicate that ET could increase through the twenty-first
century, which could be ascribed to both climate and
vegetation structural responses to elevated [CO2]. In
comparison with the ETR experiment (Fig. 3b), the ETRC
experiment projects more consistent ET time series un-
der the eight climate change scenarios (Fig. 3a). The net
impact of physiological and structural vegetation re-
sponses to elevated [CO2] could reduce ET by 1.5 3 109
to 6.5 3 109 m3 yr21 averaged across China’s terrestrial
ecosystem during 2001–2100, depending on climate sce-
narios (Fig. 3c).
Spatially, simulated annual ET had a decreasing trend
in southern and southeastern China in the twentieth
century, but had an increasing trend in portions of
northern and northeastern China (Fig. 4a). Simulated
ET had a distinct pattern during 1961–90, with annual
mean ET more than 600 mm yr21 in southern and
southeastern China. By contrast, it was substantially
lower in northwestern and western China, approaching
zero in desert areas (Fig. 4b). The simulated ET pattern
is largely consistent with the spatial patterns of vegeta-
tion and climate (see also Tao and Zhang 2010). During
2071–2100, ETRC experiments indicate that annual mean
ET could decrease by up to 150 mm yr21 in southern
and southeastern China because of a decrease in solar
radiation and vapor pressure deficit and elevated [CO2]
under the HadCM3 A1FI scenario (Fig. 4c). By contrast,
ET is projected to increase in the Tibetan Plateau be-
cause of an increase in temperature and precipitation.
Generally, the projected ET pattern under the HadCM3
B1 scenario is quite similar to that under the HadCM3
A1FI scenario, although with less an extent of change
(Fig. 4d). Nevertheless, in comparison with the HadCM3
A1FI scenario, ET is projected to decrease in potions of
northeastern China and increase in potions of south-
eastern China under the HadCM3 B1 scenario (Fig. 4d).
ET is projected to decrease at most by up to 200 mm yr21
in southwestern China under the CGCM2 A1FI sce-
nario (Fig. 4e), whereas precipitation is projected to
decrease by up to 300 mm yr21 (Fig. 1h). Under the
CGCM2 B1 scenario, ET change is projected to have
a similar spatial pattern although less extensive (Fig. 4f).
c. Changes in soil moisture
The LPJ-DGVM distinguishes two soil layers with
fixed thickness. Relative water content (Ws) of the top
layer—expressed as the fraction of soil water content in a
day compared to plant-available water capacity (Wmax)—
is focused on here. Simulated mean Ws over China’s
terrestrial ecosystem had an increasing trend in the
twentieth century (Fig. 5a). The ETRC experiments indi-
cate that Ws could increase substantially under HadCM3
A1FI and A2 climate scenarios, and increase moderately
JUNE 2011 T A O A N D Z H A N G 375
FIG. 1. Spatial patterns of annual mean (a) temperature and (b) precipitation during 1961–90, as well as the
differences in (c),(e),(g),(i) temperature and (d),(f),(h),(j) precipitation between the periods of 2071–2100 and 1961–
90 under (c),(d) HadCM3 A1FI; (e),(f) HadCM3 B1; (g),(h) CGCM2 A1FI; and (i),(j) CGCM2 B1 climate scenarios,
respectively.
376 J O U R N A L O F H Y D R O M E T E O R O L O G Y VOLUME 12
under HadCM3 B1 and B2 and CGCM2 A1FI and A2
climate scenarios, although with considerable interannual
variability. However, under CGCM2 B1 and B2 climate
scenarios, simulated mean Ws could almost stay the
same as the present level (Fig. 5a). The ETR experiments
indicate that Ws could have a decreasing trend under
CGCM2-based climate scenarios (Fig. 5b). The net im-
pacts of elevated [CO2] could increase mean Ws by up to
0.04 at the end of the twenty-first century (Fig. 5c).
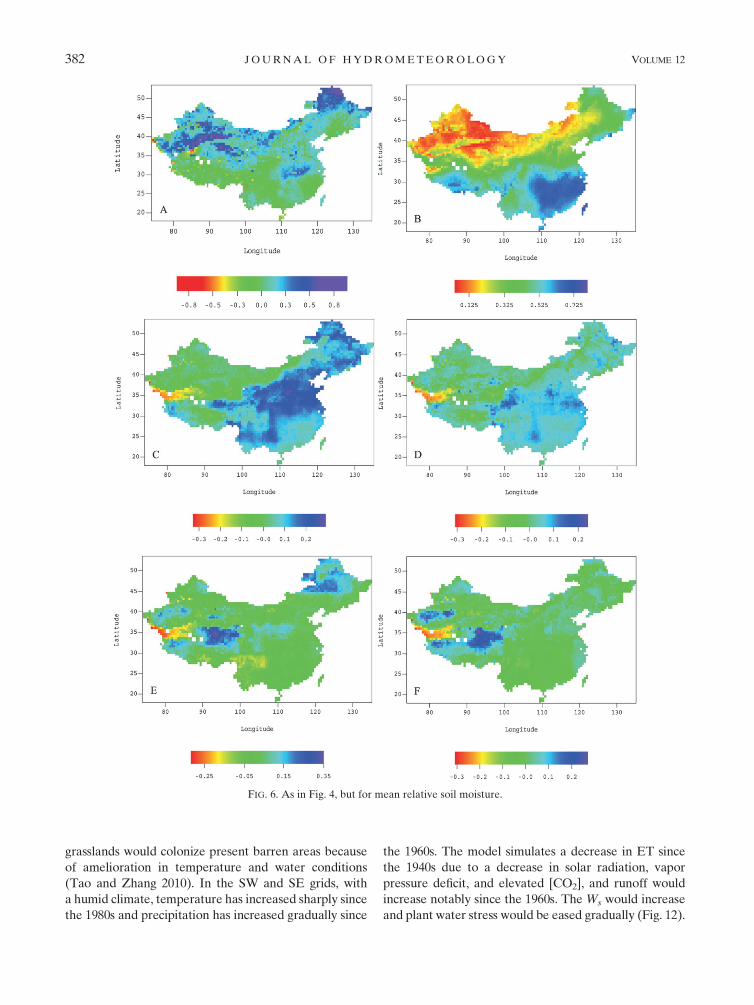
Spatially, simulated Ws had an increasing trend in
northwestern and northeastern China in the twentieth
century, but had a decreasing trend in the Tibetan Pla-
teau and southwestern China (Fig. 6a). During 1961–90,
simulated annual means of Ws differed greatly among
regions, with Ws . 0.50 in southern and southeastern
China, and Ws , 0.30 in the arid and semiarid regions
in northern and northwestern China (Fig. 6b). During
2071–2100, under HadCM3 A1FI and B1 climate
scenarios, Ws is projected to increase by up to 0.3 in large
portions in northern, northeastern, and southern China
(Figs. 6c,d). By contrast, under CGCM2 A1FI and B1
climate scenarios, Ws is projected to decrease by up to
0.3 in portions of western and southwestern China, al-
though with the largest increase located in the Tibetan
Plateau (Figs. 6e,f). The spatial pattern of Ws is com-
prehensively controlled by the spatiotemporal distribution
and interaction of temperature, precipitation, radiation,
vegetation, soil texture, and [CO2].
d. Changes in runoff
Runoff occurs if Ws exceeds Wmax in a day in a soil
layer. On annual and longer time scales, continental
river runoff is approximately equal to the difference
between land precipitation and ET. Runoff here is the
sum of surface runoff (runoff from the upper soil layer),
subsurface runoff (drainage from the lower soil layer),
FIG. 1. (Continued)
JUNE 2011 T A O A N D Z H A N G 377
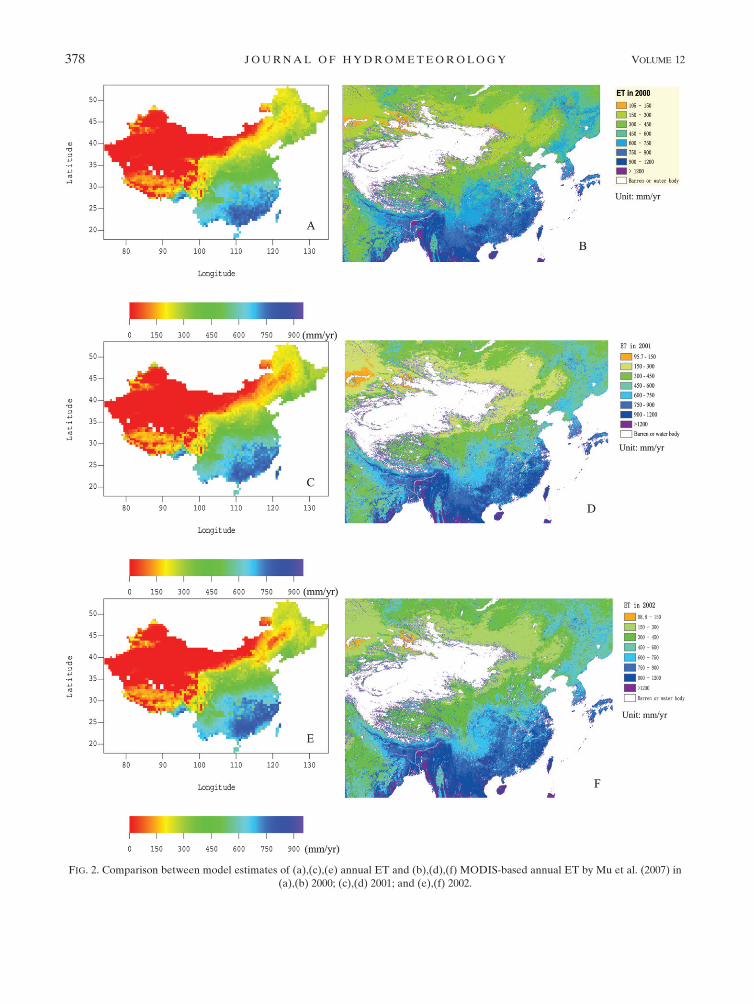
FIG. 2. Comparison between model estimates of (a),(c),(e) annual ET and (b),(d),(f) MODIS-based annual ET by Mu et al. (2007) in
(a),(b) 2000; (c),(d) 2001; and (e),(f) 2002.
378 J O U R N A L O F H Y D R O M E T E O R O L O G Y VOLUME 12
and the amount of water percolating through the lower
soil layer. The mean field of simulated runoff during the
period 1961–90 (Fig. 7a) agrees reasonably well with the
UNH–GRDC Composite Runoff Fields, version 1.0
(Fekete et al. 2002) (Fig. 7b) and the runoff field based
on GGHYDRO (Cogley 2003) (Fig. 7c). However, the
model underestimates runoff in portions of southwest-
ern China. Across China’s terrestrial ecosystem, the
model captures the seasonal dynamics of runoff fairly
well, although it underestimates each month’s runoff in
comparison with the estimates based on UNH–GRDC
Composite Runoff Fields, version 1.0 (Fig. 7d). Among
other reasons, the model underestimation of runoff
is ascribed to human interventions; for example, the
contributions of forest clearing and croplands expansion
to runoff, which are not included in the simulations. The
ETRC experiments indicate that annual mean runoff over
China’s terrestrial ecosystems had an increasing trend in
the twentieth century (Fig. 8a), which is consistent with
the previous reconstruction of global runoff data (Labat
et al. 2004), although runoff was claimed to decline over
southeastern Asia during 1948–2004 because of de-
creases in precipitation (Dai et al. 2009). It is projected
to increase notably through the twenty-first century by
both ETRC and ETR experiments, except those driven
by CGCM2 B1 and B2 climate scenarios (Figs. 8a,b).
The net impact of physiological and structural vegetation
responses to elevated [CO2] could lead to an increase
in annual mean runoff by 1.0 3 109 to 5.4 3 109 m3 yr21
over China’s terrestrial ecosystems during 2001–2100,
depending on climate scenarios (Fig. 8c).
Spatially, runoff had an increasing trend in portions of
southern and northeastern China in the twentieth cen-
tury, but had a decreasing trend in portions of south-
western China (Fig. 9a). The resultant spatial pattern of
the trend in runoff is generally consistent with Piao et al.
(2007). During 1961–90, the regions with annual mean
runoff more than 250 mm yr21 were mainly in southern
China. By contrast, in the arid and semiarid regions of
northern and northwestern China, annual mean runoff
approaches 0 (Fig. 7a). During 2071–2100, under the
HadCM3 A1FI (B1) scenario, annual mean runoff is
projected to increase mainly in southern and southeast-
ern China by over 400 mm yr21 (200 mm yr21) by ETRC
experiments (Figs. 9b,c). In contrast, under the CGCM2
A1FI (B1) scenario, annual mean runoff is projected to
decrease in large portions of southern and southwestern
China (Figs. 9d,e) by over 200 mm yr21 (200 mm yr21).
The runoff change pattern is quite consistent with pre-
cipitation change pattern, suggesting runoff changes are
primarily attributed to change in precipitation.
e. Changes in plant water stress
Soil water limitation simultaneously restricts both
transpiration and photosynthesis rates. In LPJ-DGVM,
the ratio between actual and potential canopy conduc-
tance (Gap) describes the extent to which transpiration
and photosynthesis are co-limited by soil water deficit.
The Gap ranges between 0 and 1, with high values in-
dicating low water stress. The Gap is calculated daily for
each PFT, and then aggregated into monthly and annual
means for the entire grid cell while weighting the PFT-
specific values according to their fractional coverage of
the grid cell. Simulated annual mean Gap over China’s
terrestrial ecosystem has had an increasing trend since
FIG. 3. Model estimates of potential changes in annual ET over
China’s terrestrial ecosystem in the twentieth and twenty-first
centuries in the (a) ETRC and (b) ETR experiments, as well as (c) the
direct physiological and structural effects of elevated [CO2] on ET.
JUNE 2011 T A O A N D Z H A N G 379

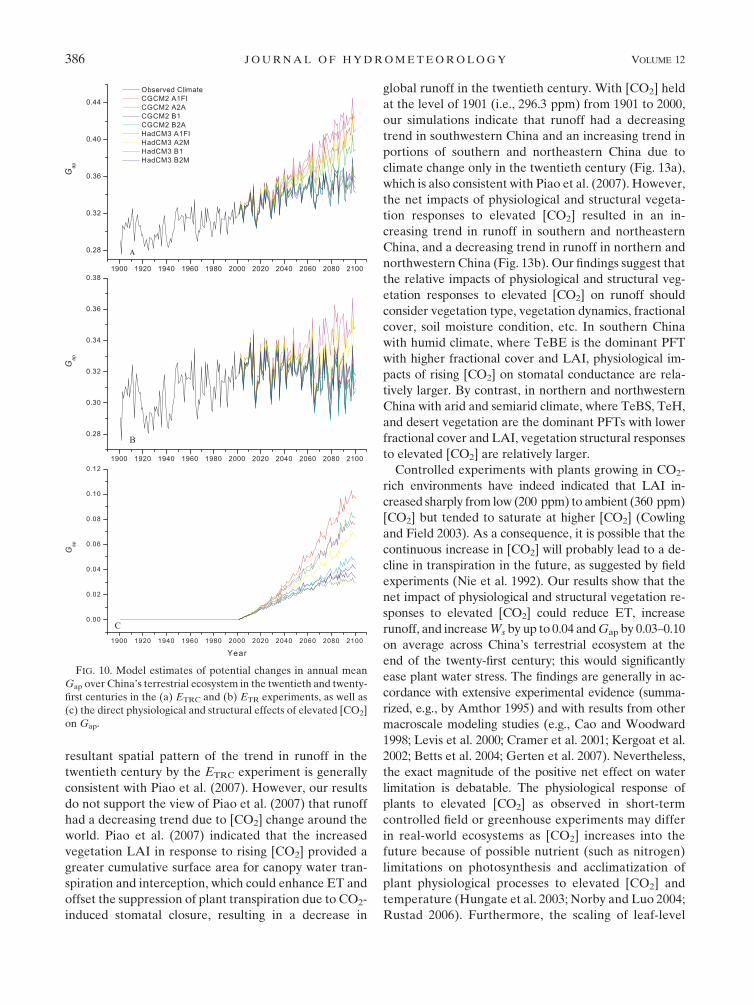
1920, although with considerable interannual variability
(Fig. 10a). The ETRC experiments indicate that Gap could
increase substantially through the twenty-first century,
particularly using the climate scenarios driven by A1FI
and A2 emission scenarios (Fig. 10a). However, under
the climate scenarios driven by B1 and B2 emission
scenarios, annual mean Gap over China’s terrestrial
ecosystem is projected to increase until 2060 and
FIG. 4. Spatial pattern of trends in (a) estimated annual ET in the twentieth century and (b) estimated annual
mean ET during 1961–90, as well as its change during 2071–2100 in the ETRC experiment under (c) HadCM3 A1FI
and (d) HadCM3 B1, and (e) CGCM2 A1FI and (f) CGCM2 B1 climate scenarios. The initials in (b) represent the
representative grids for further analysis, which are referred to in Fig. 12.
380 J O U R N A L O F H Y D R O M E T E O R O L O G Y VOLUME 12

then begin to fluctuate until 2100 (Fig. 10a). The ETR
experiments indicate that average Gap over China’s
terrestrial ecosystem could decrease notably, except
under HadCM3 A1FI and A2 climate scenarios (Fig.
10b). The net impact of physiological and structural
vegetation responses to elevated [CO2] upon Gap is
the largest under CGCM A1FI and A2 scenarios—
the warmer and drier climate scenarios (Fig. 10c)—
suggesting plant responses to elevated [CO2] be greater
in a drought environment. Elevated [CO2] could in-
crease mean Gap over China’s terrestrial ecosystem by
0.03–0.10 at the end of the twenty-first century depending
on climate scenarios.
Spatially, simulated annual mean Gap had an increas-
ing trend in northern and northeastern China in the
twentieth century, but had a decreasing trend in portions
of southwestern China (Fig. 11a). During 1961–90, simu-
lated annual mean Gap varied considerably across China’s
terrestrial ecosystem (Fig. 11b). During 2071–2100, un-
der HadCM3-driven climate scenarios, ETRC experi-
ments indicate that annual mean Gap could increase
substantially in the Tibetan Plateau and the north China
plain, suggesting vegetation could benefit from im-
provement in soil moisture status (Figs. 11c,d). By
contrast, in portions of northeastern China where
simulated annual mean Gap was larger than 0.60 during
1961–90, annual mean Gap could reduce by up to 0.5,
suggesting vegetation could become severely stressed
by water because of climate change. Under CGCM2-
driven climate scenarios, ETRC experiments indicate
the similar Gap change pattern, except that vegetation
in southwestern China could undergo more serious
water stress (Figs. 11e,f). In addition, the changes of Ws
are not always reflected in analogous changes in Gap
because of the difference in responsiveness between
them to the physiological CO2 effect (Gerten et al.
2007).
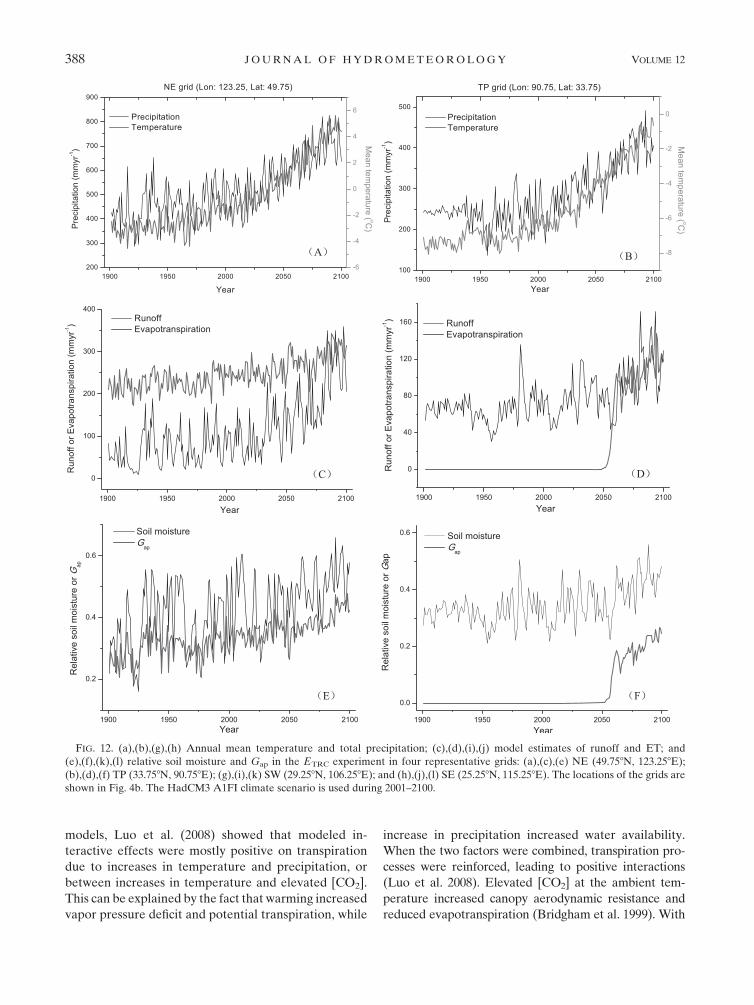
f. Response mechanisms of terrestrial hydrologicalcycles at subregions
To gain further insights into the possible response
mechanisms of hydrological cycles in different subre-
gions, we plot temperature and precipitation, and sim-
ulated time series of runoff, ET, Ws, and Gap in four
representative grids across China (Fig. 12). The four
grids include a grid centered on longitude 123.258 and
latitude 49.758 in northeastern China (NE grid), a grid
centered on longitude 90.758 and latitude 33.758 in the
Tibetan Plateau (TP grid), a grid centered on longitude
106.258 and latitude 29.258 in southwestern China (SW
grid), and a grid centered on longitude 115.258 and lati-
tude 25.258 in southeastern China (SE grid). The locations
of the grids are shown in Fig. 4b. Specific mechanisms act
on hydrological dynamics in each grid. For example, in
the ETRC experiment under the HadCM3 A1FI climate
scenario, in the NE grid, with semiarid and arid cli-
mates, ET and Ws increase gradually because of an in-
crease in temperature and precipitation, and runoff could
increase sharply after 2020 because of an increase in
precipitation. Soil moisture could increase, and plant
water stress could be eased gradually through the twenty-
first century (Fig. 12). In the TP grid, with an arid cli-
mate, Ws is projected to increase gradually; ET and
runoff are projected to increase sharply after around
2050 because of an increase in precipitation, when
FIG. 5. As in Fig. 3, but for mean relative soil moisture.
JUNE 2011 T A O A N D Z H A N G 381
grasslands would colonize present barren areas because
of amelioration in temperature and water conditions
(Tao and Zhang 2010). In the SW and SE grids, with
a humid climate, temperature has increased sharply since
the 1980s and precipitation has increased gradually since
the 1960s. The model simulates a decrease in ET since
the 1940s due to a decrease in solar radiation, vapor
pressure deficit, and elevated [CO2], and runoff would
increase notably since the 1960s. The Ws would increase
and plant water stress would be eased gradually (Fig. 12).
FIG. 6. As in Fig. 4, but for mean relative soil moisture.
382 J O U R N A L O F H Y D R O M E T E O R O L O G Y VOLUME 12

4. Discussion
a. Hydrological response of terrestrial ecosystems toclimate change in China
The study quantifies the potential response of terres-
trial ecosystem hydrological cycles and water stress in
China to climate change in the twentieth and twenty-
first centuries under eight climate change scenarios. The
contributions of elevated [CO2], climate change, and,
consequently, vegetation dynamics are explored in the
study. Our results indicate that plant water stress over
China’s terrestrial ecosystem could be substantially eased
through the twenty-first century under the climate sce-
narios driven by A1FI and A2 emission scenarios. By
contrast, under the climate scenarios driven by B1 and
B2 emission scenarios, it could be notably eased until
2060 and then begin to fluctuate until 2100. The spatial
pattern further indicates that vegetation water stress in
some arid and semiarid regions—such as the Tibetan
Plateau, the north China plain, and portions of the
northeast China plain—could be eased considerably
under A1FI emission scenarios. The regions with Gap
decreasing are mainly located in the regions with less
water stress during 1961–90, such as some portions
of southern and northeastern China. In arid and semi-
arid regions, transpiration is mainly determined by wa-
ter availability; a slight increase in precipitation could
lead to a notable increase in actual transpiration and,
consequently, Gap. However, in humid and semihumid
regions, changes in actual transpiration and Gap are
FIG. 7. Spatial pattern of (a) simulated annual mean runoff during 1961–90, (b) the runoff field from the UNH–
GRDC Composite Runoff Fields v1.0 (Fekete et al. 2002) at 0.58 spatial resolution (the blank points indicate missing
values), (c) the runoff field from the GGHYDRO (Cogley 2003) at 1.08 spatial resolution, and (d) comparisons
between simulated mean monthly runoff during 1961–90 and estimates from UNH–GRDC Composite Runoff Fields
v1.0.
JUNE 2011 T A O A N D Z H A N G 383

simultaneously determined by changes in precipita-
tion, solar radiation, and temperature. We also find that
the projected changes in hydrological cycle compo-
nents are highly dependent on climate change sce-
narios. HadCM3 and CGCM2 project precipitation
changes with opposite signs in portions of southern
China, which are reflected in the changes in plant water
stress, vegetation fraction, and LAI by LPJ-DGVM
(Tao and Zhang 2010). These changes further affect
ET, soil moisture, and runoff. For example, in southern
China, the runoff is projected to increase during 2071–
2100 under the HadCM3 GCM-based climate scenario,
but decrease under the CGCM2 GCM-based climate
scenario.
The results of this present study stand in partial con-
tradiction to previous studies that suggest possible nega-
tive consequences for drought and flooding risk, as well
as other effects on the ecosystem caused by climate
change. The findings provide a new and promising per-
spective on the hydrological response of terrestrial eco-
systems to future climate change in China. With different
foci and using different climate scenarios and models,
previous studies showed somewhat different response
patterns and consequences that were dominated by neg-
ative impacts. For example, Tao et al. (2005) found that
under the combined impacts of climate change and soil
degradation, soil moisture deficits would increase most
in central, western, and southwestern China; surface
runoff would increase most in southeastern China. In
investigating the response of river runoff to climate
change by a hydrological model, Zhang and Wang (2007)
indicated that drought risk in northern China could fur-
ther increase, while flooding risk in southern China could
further increase; therefore the water-related risk would
be aggravated because of climate change (Lin et al. 2007;
Zhang and Wang 2007). Using an equilibrium atmospheric–
vegetation interaction model, Wu et al. (2010) showed that
in most ecoregions over China, moisture condition—
defined as the ratio of potential evapotranspiration to
precipitation—would become much more arid and in-
duce decreases in NPP. In comparison with previous
studies on a global scale, our results do not support the
view that ET could increase notably in southern China
because of change in climate and [CO2] (Alo and Wang
2008), or that runoff could decrease in southern China
under HadCM3-based scenarios (Alo and Wang 2008),
which may be partly due to the different emission sce-
nario used. Nevertheless, our results support the view
that runoff could decrease in southern China under
CGCM2-based scenarios (Alo and Wang 2008). Our
findings on change patterns of soil moisture and plant
water stress are generally consistent with Gerten et al.
(2007) under HadCM3-based scenarios; however, the
vegetation distribution (Tao and Zhang 2010), ET (Fig. 2),
runoff (Fig. 7), and, consequently, other components of
hydrological cycles are better described—particularly in
northeastern China and the Tibetan Plateau—in the
present study.
These studies differ with respect to climate change
and land use scenarios, models, and parameterization in
capturing ecosystem characteristics and in accounting
for the key response mechanisms to climate change. The
inconsistent results highlight DGVMs that account for
the dynamic response of vegetation distribution to cli-
mate change. These direct physiological and structural
effects of elevated [CO2] are important, particularly on
a time scale of decades to centuries.
FIG. 8. As in Fig. 3, but for mean runoff.
384 J O U R N A L O F H Y D R O M E T E O R O L O G Y VOLUME 12

b. Physiological and structural effects of elevated[CO2] on terrestrial hydrological cycles
Vegetation physiological responses to elevated [CO2]
are well known; that is, stomata respond to elevated
[CO2] by partial closure. The structural vegetation re-
sponses to elevated [CO2] include PFT transition, changes
in fractional coverage, height, LAI, etc. Increases in
fractional coverage and LAI could increase canopy
interception, reducing soil moisture and runoff. The
FIG. 9. Spatial pattern of trends in (a) estimated annual mean runoff in the twentieth century and estimated annual
mean runoff change during 2071–2100, relative to 1961–90, in the ETRC experiment under (b) HadCM3 A1FI and (c)
HadCM3 B1, and (d) CGCM2 A1FI and (e) CGCM2 B1 climate scenarios.
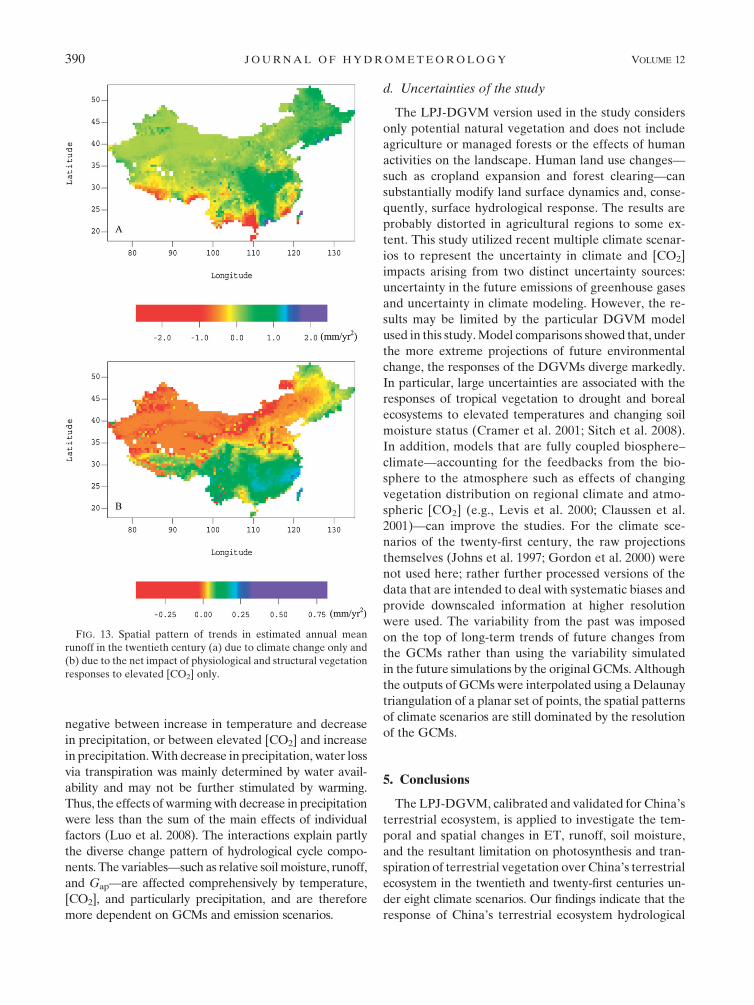
JUNE 2011 T A O A N D Z H A N G 385
resultant spatial pattern of the trend in runoff in the
twentieth century by the ETRC experiment is generally
consistent with Piao et al. (2007). However, our results
do not support the view of Piao et al. (2007) that runoff
had a decreasing trend due to [CO2] change around the
world. Piao et al. (2007) indicated that the increased
vegetation LAI in response to rising [CO2] provided a
greater cumulative surface area for canopy water tran-
spiration and interception, which could enhance ET and
offset the suppression of plant transpiration due to CO2-
induced stomatal closure, resulting in a decrease in
global runoff in the twentieth century. With [CO2] held
at the level of 1901 (i.e., 296.3 ppm) from 1901 to 2000,
our simulations indicate that runoff had a decreasing
trend in southwestern China and an increasing trend in
portions of southern and northeastern China due to
climate change only in the twentieth century (Fig. 13a),
which is also consistent with Piao et al. (2007). However,
the net impacts of physiological and structural vegeta-
tion responses to elevated [CO2] resulted in an in-
creasing trend in runoff in southern and northeastern
China, and a decreasing trend in runoff in northern and
northwestern China (Fig. 13b). Our findings suggest that
the relative impacts of physiological and structural veg-
etation responses to elevated [CO2] on runoff should
consider vegetation type, vegetation dynamics, fractional
cover, soil moisture condition, etc. In southern China
with humid climate, where TeBE is the dominant PFT
with higher fractional cover and LAI, physiological im-
pacts of rising [CO2] on stomatal conductance are rela-
tively larger. By contrast, in northern and northwestern
China with arid and semiarid climate, where TeBS, TeH,
and desert vegetation are the dominant PFTs with lower
fractional cover and LAI, vegetation structural responses
to elevated [CO2] are relatively larger.
Controlled experiments with plants growing in CO2-
rich environments have indeed indicated that LAI in-
creased sharply from low (200 ppm) to ambient (360 ppm)
[CO2] but tended to saturate at higher [CO2] (Cowling
and Field 2003). As a consequence, it is possible that the
continuous increase in [CO2] will probably lead to a de-
cline in transpiration in the future, as suggested by field
experiments (Nie et al. 1992). Our results show that the
net impact of physiological and structural vegetation re-
sponses to elevated [CO2] could reduce ET, increase
runoff, and increase Ws by up to 0.04 and Gap by 0.03–0.10
on average across China’s terrestrial ecosystem at the
end of the twenty-first century; this would significantly
ease plant water stress. The findings are generally in ac-
cordance with extensive experimental evidence (summa-
rized, e.g., by Amthor 1995) and with results from other
macroscale modeling studies (e.g., Cao and Woodward
1998; Levis et al. 2000; Cramer et al. 2001; Kergoat et al.
2002; Betts et al. 2004; Gerten et al. 2007). Nevertheless,
the exact magnitude of the positive net effect on water
limitation is debatable. The physiological response of
plants to elevated [CO2] as observed in short-term
controlled field or greenhouse experiments may differ
in real-world ecosystems as [CO2] increases into the
future because of possible nutrient (such as nitrogen)
limitations on photosynthesis and acclimatization of
plant physiological processes to elevated [CO2] and
temperature (Hungate et al. 2003; Norby and Luo 2004;
Rustad 2006). Furthermore, the scaling of leaf-level
FIG. 10. Model estimates of potential changes in annual mean
Gap over China’s terrestrial ecosystem in the twentieth and twenty-
first centuries in the (a) ETRC and (b) ETR experiments, as well as
(c) the direct physiological and structural effects of elevated [CO2]
on Gap.
386 J O U R N A L O F H Y D R O M E T E O R O L O G Y VOLUME 12

experiments to the canopy and ecosystem scale remains
a challenge (Norby and Luo 2004). Thus, the represen-
tation of CO2 effects on photosynthesis and stomatal
conductance in DGVMs is a potential source of uncer-
tainty in the simulated vegetation structural changes
and, consequently, the simulated surface hydrological
impacts (Alo and Wang 2008).
c. Interactive effects of temperature, precipitation,and [CO2] on terrestrial hydrological cycles
Terrestrial ecosystem responses to multifactor global
change—including changes in temperature, precipita-
tion, and [CO2]—are regulated by complex and non-
linear processes. Using LPJ-DGVM and three other
FIG. 11. As in Fig. 4, but for mean Gap.
JUNE 2011 T A O A N D Z H A N G 387
models, Luo et al. (2008) showed that modeled in-
teractive effects were mostly positive on transpiration
due to increases in temperature and precipitation, or
between increases in temperature and elevated [CO2].
This can be explained by the fact that warming increased
vapor pressure deficit and potential transpiration, while
increase in precipitation increased water availability.
When the two factors were combined, transpiration pro-
cesses were reinforced, leading to positive interactions
(Luo et al. 2008). Elevated [CO2] at the ambient tem-
perature increased canopy aerodynamic resistance and
reduced evapotranspiration (Bridgham et al. 1999). With
FIG. 12. (a),(b),(g),(h) Annual mean temperature and total precipitation; (c),(d),(i),(j) model estimates of runoff and ET; and
(e),(f),(k),(l) relative soil moisture and Gap in the ETRC experiment in four representative grids: (a),(c),(e) NE (49.758N, 123.258E);
(b),(d),(f) TP (33.758N, 90.758E); (g),(i),(k) SW (29.258N, 106.258E); and (h),(j),(l) SE (25.258N, 115.258E). The locations of the grids are
shown in Fig. 4b. The HadCM3 A1FI climate scenario is used during 2001–2100.
388 J O U R N A L O F H Y D R O M E T E O R O L O G Y VOLUME 12

rising temperature, these effects of elevated [CO2] dras-
tically decreased (Homma et al. 1999), leading to a posi-
tive interaction between [CO2] and temperature. The
interaction explains why the ETRC experiment projects
more consistent ET time series under the eight climate
change scenarios (Fig. 3a) than the ETR experiment. The
other modeled positive interactive effects on transpi-
ration were between elevated [CO2] and a decrease in
precipitation, largely due to the fact that CO2-induced
reduction in transpiration was usually stronger in dry
than in wet environments (Housman et al. 2006). The
interaction explains that the net impact of physiolog-
ical and structural vegetation responses to elevated
[CO2] upon Gap is the largest under CGCM A1FI and
A2 scenarios—the warmer and drier climate scenarios
(Fig. 10c). The interactive effects on transpiration were
FIG. 12. (Continued)
JUNE 2011 T A O A N D Z H A N G 389
negative between increase in temperature and decrease
in precipitation, or between elevated [CO2] and increase
in precipitation. With decrease in precipitation, water loss
via transpiration was mainly determined by water avail-
ability and may not be further stimulated by warming.
Thus, the effects of warming with decrease in precipitation
were less than the sum of the main effects of individual
factors (Luo et al. 2008). The interactions explain partly
the diverse change pattern of hydrological cycle compo-
nents. The variables—such as relative soil moisture, runoff,
and Gap—are affected comprehensively by temperature,
[CO2], and particularly precipitation, and are therefore
more dependent on GCMs and emission scenarios.
d. Uncertainties of the study
The LPJ-DGVM version used in the study considers
only potential natural vegetation and does not include
agriculture or managed forests or the effects of human
activities on the landscape. Human land use changes—
such as cropland expansion and forest clearing—can
substantially modify land surface dynamics and, conse-
quently, surface hydrological response. The results are
probably distorted in agricultural regions to some ex-
tent. This study utilized recent multiple climate scenar-
ios to represent the uncertainty in climate and [CO2]
impacts arising from two distinct uncertainty sources:
uncertainty in the future emissions of greenhouse gases
and uncertainty in climate modeling. However, the re-
sults may be limited by the particular DGVM model
used in this study. Model comparisons showed that, under
the more extreme projections of future environmental
change, the responses of the DGVMs diverge markedly.
In particular, large uncertainties are associated with the
responses of tropical vegetation to drought and boreal
ecosystems to elevated temperatures and changing soil
moisture status (Cramer et al. 2001; Sitch et al. 2008).
In addition, models that are fully coupled biosphere–
climate—accounting for the feedbacks from the bio-
sphere to the atmosphere such as effects of changing
vegetation distribution on regional climate and atmo-
spheric [CO2] (e.g., Levis et al. 2000; Claussen et al.
2001)—can improve the studies. For the climate sce-
narios of the twenty-first century, the raw projections
themselves (Johns et al. 1997; Gordon et al. 2000) were
not used here; rather further processed versions of the
data that are intended to deal with systematic biases and
provide downscaled information at higher resolution
were used. The variability from the past was imposed
on the top of long-term trends of future changes from
the GCMs rather than using the variability simulated
in the future simulations by the original GCMs. Although
the outputs of GCMs were interpolated using a Delaunay
triangulation of a planar set of points, the spatial patterns
of climate scenarios are still dominated by the resolution
of the GCMs.
5. Conclusions
The LPJ-DGVM, calibrated and validated for China’s
terrestrial ecosystem, is applied to investigate the tem-
poral and spatial changes in ET, runoff, soil moisture,
and the resultant limitation on photosynthesis and tran-
spiration of terrestrial vegetation over China’s terrestrial
ecosystem in the twentieth and twenty-first centuries un-
der eight climate scenarios. Our findings indicate that the
response of China’s terrestrial ecosystem hydrological
FIG. 13. Spatial pattern of trends in estimated annual mean
runoff in the twentieth century (a) due to climate change only and
(b) due to the net impact of physiological and structural vegetation
responses to elevated [CO2] only.
390 J O U R N A L O F H Y D R O M E T E O R O L O G Y VOLUME 12

cycles to future climate change could be considerable.
Mean vegetation water stress on plant growth could be
generally eased by climate changes and rising [CO2],
although it could become more serious in portions of
northeastern China. The net impact of physiological and
structural vegetation responses to elevated [CO2] re-
sulted in an increasing trend in runoff in southern and
northeastern China and a decreasing trend in runoff in
northern and northwestern China in the twentieth cen-
tury. And it could generally lead to a decrease in mean
ET, as well as an increase in mean soil moisture and
runoff across China’s terrestrial ecosystem in the twenty-
first century, although the spatial change patterns could
be quite diverse. Our findings, in partial contradiction to
previous results, present an improved understanding of
transient responses in China’s terrestrial ecosystem hy-
drological cycles and plant water stress to climate change
and elevated [CO2] in the twentieth and twenty-first
centuries. The results are, however, constrained by the
lack of consideration for human land use changes and
vegetation feedback to climate, as well as the uncertainty
related to the physiological response of ecosystems to
elevated [CO2]. The future trajectories of ET, runoff, soil
moisture, and plant water stress are not to be taken as
predictions. Nevertheless, the overall temporal and spa-
tial patterns derived in the study can be used with some
confidence as a guide for policy making.
Acknowledgments. This study is supported by Na-
tional Key Program for Developing Basic Science (Pro-
ject 2009CB421105 and Project 2010CB950902), China.
F. Tao acknowledges the support of the ‘‘Hundred Tal-
ents’’ Program from the Chinese Academy of Sciences.
We are grateful to anonymous reviewers and editors for
their insightful comments on an earlier version of this
manuscript.
REFERENCES
Alcamo, J., P. Doll, T. Henrichs, F. Kaspar, B. Lehner, T. Rosch,
and S. Siebert, 2003: Global estimates of water withdrawals
and availability under current and future business-as-usual
conditions. Hydrol. Sci. J., 48, 339–348.
Alo, C. A., and G. Wang, 2008: Hydrological impact of the po-
tential future vegetation response to climate changes pro-
jected by 8 GCMs. J. Geophys. Res., 113, G03011, doi:10.1029/
2007JG000598.
Amthor, J. S., 1995: Terrestrial higher-plant response to increasing
atmospheric [CO2] in relation to the global carbon cycle.
Global Change Biol., 1, 243–274.
Arnell, N. W., 2004: Climate change and global water resources:
SRES emissions and socio-economic scenarios. Global Envi-
ron. Change, 14, 31–52.
Bachelet, D., and Coauthors, 2003: Simulating past and future
dynamics of natural ecosystems in the United States. Global
Biogeochem. Cycles, 17, 1045, doi:10.1029/2001GB001508.
Barnett, T. P., J. C. Adam, and D. P. Lettenmaier, 2005: Potential
impacts of a warming climate on water availability in snow-
dominated regions. Nature, 438, 303–309.
——, and Coauthors, 2008: Human-induced changes in the hy-
drology of the western United States. Science, 319, 1080–1083.
Beltran-Przekurat, A., C. H. Marshall, and R. A. Pielke Sr., 2008:
Ensemble reforecasts of recent warm-season weather: Impacts
of a dynamic vegetation parameterization. J. Geophys. Res.,
113, D24116, doi:10.1029/2007JD009480.
Betts, R. A., P. M. Cox, M. Collins, P. P. Harris, C. Huntingford,
and C. D. Jones, 2004: The role of ecosystem–atmosphere
interactions in simulated Amazonian precipitation decrease
and forest dieback under global climate warming. Theor.
Appl. Climatol., 78, 157–175, doi:10.1007/s00704-004-0050-y.
——, and Coauthors, 2007: Projected increase in continental runoff
due to plant responses to increasing carbon dioxide. Nature,
448, 1037–1041.
Boucher, O., A. Jones, and R. Betts, 2009: Climate response to the
physiological impact of carbon dioxide on plants in the Met
Office Unified Model HadCM3. Climate Dyn., 32, 237–249.
Bridgham, S. D., J. Pastor, K. Updegraff, T. J. Malterer, K. Johnson,
C. Harth, and J. Chen, 1999: Ecosystem control over
temperature and energy flux in northern peatlands. Ecol.
Appl., 9, 1345–1358.
Cao, M. K., and F. I. Woodward, 1998: Dynamic responses of
terrestrial ecosystem carbon cycling to global climate change.
Nature, 393, 249–252.
Churkina, G., and S. W. Running, 1998: Contrasting climatic con-
trols on the estimated productivity of global terrestrial biomes.
Ecosystems, 1, 206–215.
Claussen, M., V. Brovkin, and A. Ganopolski, 2001: Biogeophysical
versus biogeochemical feedbacks of large-scale land cover
change. Geophys. Res. Lett., 28, 1011–1014.
Cogley, J. G., 2003: GGHYDRO—Global Hydrographic Data,
release 2.3.1. Trent University Tech. Note 2003-1, 8 pp.
Collatz, G. J., M. Ribas-Carbo, and J. A. Berry, 1992: A coupled
photosynthesis–stomatal conductance model for leaves of C4
plants. Aust. J. Plant Physiol., 19, 519–538.
Cong, Z., D. Yang, B. Gao, H. Yang, and H. Hu, 2009: Hydro-
logical trend analysis in the Yellow River basin using a dis-
tributed hydrological model. Water Resour. Res., 45, W00A13,
doi:10.1029/2008WR006852.
Cowling, S. A., and C. B. Field, 2003: Environmental control of leaf
area production: Implications for vegetation and land-surface
modeling. Global Biogeochem. Cycles, 17, 1007, doi:10.1029/
2002GB001915.
Cramer, W., and Coauthors, 2001: Global response of terrestrial
ecosystem structure and function to CO2 and climate change:
Results from six dynamic global vegetation models. Global
Change Biol., 7, 357–373.
Dai, A., T. Qian, K. E. Trenberth, and J. D. Milliman, 2009:
Changes in continental freshwater discharge from 1948 to 2004.
J. Climate, 22, 2773–2792.
de Wit, M., and J. Stankiewicz, 2006: Changes in surface water
supply across Africa with predicted climate change. Science,
311, 1917–1921.
Doherty, R. M., S. Sitch, B. Smith, S. L. Lewis, and P. K. Thornton,
2010: Implications of future climate and atmospheric CO2
content for regional biogeochemistry, biogeography and eco-
system services across East Africa. Global Change Biol., 16,
617–640.
FAO, 1991: The Digitized Soil Map of the World, release 1.0. Food
and Agricultural Organization of the United Nations World
JUNE 2011 T A O A N D Z H A N G 391
Soil Resources Rep. 67/1. [Available online at http://www.
fao.org/nr/land/soils/digital-soil-map-of-the-world/en/.]
Farquhar, G. D., S. von Caemmerer, and J. A. Berry, 1980: A
biochemical model of photosynthetic CO2 assimilation in leaves
of C3 species. Planta, 149, 78–90.
Federer, C. A., 1982: Transpirational supply and demand: Plant,
soil, and atmospheric effects evaluated by simulation. Water
Resour. Res., 18, 355–362.
Fekete, B. M., C. J. Vorosmarty, and W. Grabs, 2002: High-resolution
fields of global runoff combining observed river discharge and
simulated water balances. Global Biogeochem. Cycles, 16, 1042,
doi:10.1029/1999GB001254.
Flato, G. M., G. J. Boer, W. G. Lee, N. A. McFarlane, D. Ramsden,
M. C. Reader, and A. J. Weaver, 2000: The Canadian Centre
for Climate Modeling and Analysis global coupled model and
its climate. Climate Dyn., 16, 451–467.
Foley, J. A., I. C. Prentice, N. Ramankutty, S. Levis, D. Pollard,
S. Sitch, and A. Haxeltine, 1996: An integrated biosphere
model of land surface processes, terrestrial carbon balance, and
vegetation dynamics. Global Biogeochem. Cycles, 10, 603–628.
Fu, C. B., and G. Wen, 1999: Variation of ecosystems in East Asia
in association with the seasonal, interannual and interdecadal
variations of monsoon climate. Climatic Change, 43, 477–494.
Gedney, N., P. M. Cox, R. A. Betts, O. Boucher, C. Huntingford,
and P. A. Stott, 2006: Detection of a direct carbon dioxide
effect in continental river runoff records. Nature, 439,
835–838.
Gerten, D., S. Schaphoff, U. Haberlandt, W. Lucht, and S. Sitch,
2004: Terrestrial vegetation and water balance: Hydrological
evaluation of a dynamic global vegetation model. J. Hydrol.,
286, 249–270.
——, ——, and W. Lucht, 2007: Potential future changes in water
limitations of the terrestrial biosphere. Climatic Change, 80,
277–299.
Gordon, C., C. Cooper, C. A. Senior, H. Banks, J. M. Gregory,
T. C. Johns, J. F. B. Mitchell, and R. A. Wood, 2000: The
simulation of SST, sea ice extents and ocean heat transports in
a version of the Hadley Centre coupled model without flux
adjustments. Climate Dyn., 16, 147–168.
Haxeltine, A., and I. C. Prentice, 1996: BIOME3: An equilibrium
biosphere model based on ecophysiological constraints, re-
source availability, and competition among plant functional
types. Global Biogeochem. Cycles, 10, 693–709.
Homma, K., H. Nakagawa, T. Horie, H. Ohnishi, H. Y. Kim, and
M. Ohnishi, 1999: Energy budget and transpiration charac-
teristics of rice grown under elevated CO2 and high temper-
ature conditions as determined by remotely sensed canopy
temperatures. Japan J. Crop Sci., 68, 137–145.
Housman, D. C., E. Naumburg, T. E. Huxman, T. N. Charlet,
R. S. Nowak, and S. D. Smith, 2006: Increases in desert shrub
productivity under elevated carbon dioxide vary with water.
Ecosystems, 9, 374–385.
Hungate, B. A., J. S. Dukes, R. Shaw, Y. Luo, and C. B. Field, 2003:
Nitrogen and climate change. Science, 302, 1512–1513.
Johns, T. C., R. E. Carnell, J. F. Crossley, J. M. Gregory,
J. F. B. Mitchell, C. A. Senior, S. F. B. Tett, and R. A. Wood,
1997: The second Hadley Centre coupled ocean–atmosphere
GCM: Model description, spinup and validation. Climate Dyn.,
13, 103–134.
Keeling, C. D., and T. P. Whorf, cited 2005: Atmospheric CO2
records from sites in the SIO air sampling network. Trends: A
Compendium of Data on Global Change, Carbon Dioxide
Information Analysis Center, Oak Ridge National Laboratory,
U.S. Department of Energy. [Available online at http://cdiac.
ornl.gov/trends/co2/sio-keel.html.]
Kergoat, L., S. Lafont, H. Douville, B. Berthelot, G. Dedieu,
S. Planton, and J.-F. Royer, 2002: Impact of doubled CO2 on
global-scale leaf area index and evapotranspiration: Conflict-
ing stomatal conductance and LAI responses. J. Geophys.
Res., 107, 4808, doi:10.1029/2001JD001245.
Kicklighter, D. W., and Coauthors, 1999: A first-order analysis of
the potential role of CO2 fertilization to affect the global
carbon budget: A comparison study of four terrestrial bio-
sphere models. Tellus, 51B, 343–366.
Korzun, V. I., and Coauthors, 1977: Atlas of World Water Balance.
UNESCO Press, 34 pp. 1 65 maps.
Koutsoyiannis, D., A. Efstratiadis, and K. P. Georgakakos, 2007:
Uncertainty assessment of future hydroclimatic predictions:
A comparison of probabilistic and scenario-based approaches.
J. Hydrometeor., 8, 261–281.
Labat, D., Y. Godderis, J. L. Probst, and J. L. Guyot, 2004: Evi-
dence for global streamflow increase related to climate warm-
ing. Adv. Water Resour., 27, 631–642.
Levis, S., J. A. Foley, and D. Pollard, 2000: Large-scale vegetation
feedbacks on a doubled CO2 climate. J. Climate, 13, 1313–1325.
Lin, E., Y. Xu, S. Wu, H. Ju, and S. Ma, 2007: China’s National
Assessment Report on Climate Change (II): Climate change
impacts and adaptation (in Chinese). Adv. Climate Change
Res., 2, 51–56.
Lloyd, J., and J. A. Taylor, 1994: On the temperature dependence
of soil respiration. Funct. Ecol., 8, 315–323.
Lotsch, A., M. A. Friedl, B. T. Anderson, and C. J. Tucker, 2003:
Coupled vegetation–precipitation variability observed from
satellite and climate records. Geophys. Res. Lett., 30, 1774,
doi:10.1029/2003GL017506.
Luo, Y., and Coauthors, 2008: Modeled interactive effects of pre-
cipitation, temperature, and [CO2] on ecosystem carbon and
water dynamics in different climatic zones. Global Change
Biol., 14, 1986–1999.
McGuire, A. D., and Coauthors, 2001: Carbon balance of the ter-
restrial biosphere in the twentieth century: Analyses of CO2,
climate and land use effects with four process-based ecosystem
models. Global Biogeochem. Cycles, 15, 183–206.
Milly, P. C. D., K. A. Dunne, and A. V. Vecchia, 2005: Global
pattern of trends in streamflow and water availability in
a changing climate. Nature, 438, 347–350.
Mishra, V., K. A. Cherkauer, and S. Shukla, 2010: Assessment of
drought due to historic climate variability and projected future
climate change in the midwestern United States. J. Hydro-
meteor., 11, 46–68.
Mitchell, T. D., and P. D. Jones, 2005: An improved method of
constructing a database of monthly climate observations and
associated high-resolution grids. Int. J. Climatol., 25, 693–712.
——, T. R. Carter, P. D. Jones, M. Hulme, and M. New, 2004: A
comprehensive set of high-resolution grids of monthly climate
for Europe and the globe: The observed record (1901–2000)
and 16 scenarios (2001–2100). Tyndall Center for Climate
Change Research Working Paper 55, 30 pp.
Monteith, J. L., 1995: Accommodation between transpiring veg-
etation and the convective boundary layer. J. Hydrol., 166,
251–263.
Morales, P., T. Hickler, D. P. Rowell, B. Smith, and M. T. Sykes,
2007: Changes in European ecosystem productivity and car-
bon balance driven by regional climate model output. Global
Change Biol., 13, 108–122.
392 J O U R N A L O F H Y D R O M E T E O R O L O G Y VOLUME 12
Mu, Q., F. A. Heinsch, M. Zhao, and S. W. Running, 2007: De-
velopment of a global evapotranspiration algorithm based on
MODIS and global meteorology data. Remote Sens. Environ.,
111, 519–536.
Nemani, R. R., C. D. Keeling, H. Hashimoto, W. M. Jolly,
S. C. Piper, C. J. Tucker, R. B. Myneni, and S. W. Running,
2003: Climate-driven increases in global terrestrial net pri-
mary production from 1982 to 1999. Science, 300, 1560–1563.
Nie, D., H. He, G. Mo, M. B. Kirkham, and E. T. Kanemasu, 1992:
Canopy photosynthesis and evapotranspiration of rangeland
plants under doubled carbon dioxide in closed-top chambers.
Agric. For. Meteor., 61, 205–221.
Norby, R. J., and Y. Luo, 2004: Evaluating ecosystem responses to
rising atmospheric CO2 and global warming in a multi-factor
world. New Phytol., 162, 281–294.
Oki, T., and S. Kanae, 2006: Global hydrological cycle and world
water resources. Science, 313, 1068–1072.
Piao, S., P. Friedlingstein, P. Ciais, N. de Noblet-Ducoudre,
D. Labat, and S. Zaehle, 2007: Changes in climate and land use
have a larger direct impact than rising CO2 on global river
runoff trends. Proc. Natl. Acad. Sci. USA, 104, 15 242–15 247.
Prentice, I. C., and Coauthors, 2001: The carbon cycle and atmo-
spheric carbon dioxide. Climate Change 2001: The Scientific
Basis, J. T. Houghton et al., Eds., Cambridge University Press,
185–224.
Rustad, L. E., 2006: From transient to steady-state response of
ecosystems to atmospheric CO2-enrichment and global cli-
mate change: Conceptual challenges and need for an in-
tegrated approach. Plant Ecol., 182, 43–62, doi:10.1007/
s11258-005-9030-2.
Scholze, M., W. Knorr, N. Arnell, and I. C. Prentice, 2006: A climate-
change risk analysis for world ecosystems. Proc. Natl. Acad. Sci.
USA, 103, 13 116–13 120.
Sellers, P. J., and Coauthors, 1997: Modeling the exchanges of
energy, water, and carbon between continents and the atmo-
sphere. Science, 275, 502–509.
Sitch, S., and Coauthors, 2003: Evaluation of ecosystem dynamics,
plant geography and terrestrial carbon cycling in the LPJ
dynamic global vegetation model. Global Change Biol., 9,
161–185.
——, and Coauthors, 2008: Evaluation of the terrestrial carbon
cycle, future plant geography and climate-carbon cycle feed-
backs using five dynamic global vegetation models (DGVMs).
Global Change Biol., 14, 2015–2039.
Tao, F., and Z. Zhang, 2010: Dynamic responses of terrestrial
ecosystem structure and function to climate change in China.
J. Geophys. Res., 115, G03003, doi:10.1029/2009JG001062.
——, M. Yokozawa, Y. Hayashi, and E. Lin, 2003: Terrestrial
water budget and the impacts of climate change. Ambio, 32,
295–301.
——, ——, ——, and ——, 2005: A perspective on water resources
in China: Interactions between climate change and soil deg-
radation. Climatic Change, 68, 169–197.
——, ——, Z. Zhang, Y. Hayashi, and Y. Ishigooka, 2008: Land
surface phenology dynamics and climate variations in the
North East China Transect (NECT), 1982–2000. Int. J. Remote
Sens., 29, 5461–5478.
Vano, J. A., J. A. Foley, C. J. Kucharik, and M. T. Coe, 2008:
Controls of climatic variability and land cover on land surface
hydrology of northern Wisconsin, USA. J. Geophys. Res., 113,
G04040, doi:10.1029/2007JG000681.
Vorosmarty, C. J., P. Green, J. Salisbury, and R. B. Lammers, 2000:
Global water resources: Vulnerability from climate change
and population growth. Science, 289, 284–288.
Wu, S., Y. Yin, D. Zhao, M. Huang, X. Shao, and E. Dai, 2010:
Impact of future climate change on terrestrial ecosystems in
China. Int. J. Climatol., 30, 866–873.
Zhang, J., and Q. Wang, Eds., 2007: The Impacts of Climate Change
on Hydrology and Water Resources. Science Press, 214 pp.
Zhang, X., L. Zhang, J. Zhao, P. Rustomji, and P. Hairsine, 2008:
Responses of streamflow to changes in climate and land use/
cover in the Loess Plateau, China. Water Resour. Res., 44,
W00A07, doi:10.1029/2007WR006711.
Zobler, L., 1986: A world soil file for global climate modeling.
NASA Tech. Memo. 87802, 32 pp.
JUNE 2011 T A O A N D Z H A N G 393