dynamic force microscopy in fluid
TRANSCRIPT
SURFACE AND INTERFACE ANALYSISSurf. Interface Anal. 27, 354È360 (1999)
Dynamic Force Microscopy in Fluid
M. Lantz,1 Y. Z. Liu,2 X. D. Cui,2 H. Tokumoto1 and S. M. Lindsay2,*1 Joint Research Center for Atom Technology, c/o National Institute for Advanced Interdisciplinary Research, 1-1-4 Higashi,Tsukuba, Ibaraki 305-0046, Japan2 Department of Physics and Astronomy, Arizona State University, Tempe, AZ 85287-1504, USA
Low-amplitude dynamic force microscopy can operate in a non-contact mode, sensing changes in liquid propertiesnear a surface. Operation of the microscope in water at the higher amplitudes often required for stable imaging hasbeen investigated. When driven by direct application of a force to the tip, the microscope is stable over a wide rangeof operating frequencies. At low frequency, the interfacial sti†ness extracted from approach curves is found to be ofthe order of 1 N m—1 on Ðrst contact, which is indicative of imaging via a compressed liquid layer. Measurementsof the spectral response of the cantilever and numerical simulations conÐrm this and show that viscous damping atthe surface also plays a role. Copyright 1999 John Wiley & Sons, Ltd.(
KEYWORDS: liquidÈsolid interface ; atomic force microscopy ; dynamic force microscopy
INTRODUCTION
Dynamic force microscopy (DFM) has become themethod of choice for imaging soft materials in liquid,arguably one of the most important applications ofatomic force microscopy. The mechanism of DFM inair has received considerable attention,1h3 as has theoperation of DFM on clean surfaces in a vacuum.4 Theinteraction between an oscillating cantilever and a solidsurface in Ñuid has been studied with the cantileverdriven solely by thermal Ñuctuations5 or at a very lowamplitude of oscillation.6h8 Recently, OÏShea et al.demonstrated that low-amplitude DFM senses changesin the elastic and viscous properties of the surface atnanometer distances, and can therefore be operated in anon-contact mode. The purpose of this paper is todiscuss operation of DFM at the larger amplitudestypical of many imaging applications.10,11
Both operation of the microscope and investigationof its imaging mechanism are complicated by the heavyviscous damping and mass loading of the cantilever.Butt Ðrst showed that the resonant frequency of a can-tilever in water is reduced by about a factor of threecompared to that in air as a consequence of itsincreased e†ective mass due to the need to move Ñuidwith the cantilever.12 The mechanical Q factor is alsoreduced by many orders of magnitude by viscousdamping.12 These Ðrst studies utilized the thermal Ñuc-tuations of a cantilever far from the surface. As the can-tilever is brought towards a surface, the e†ectiveviscosity of the Ñuid increases rapidly owing to the needfor Ñuid to be squeezed out of the gap between cantile-
* Correspondence to : M. Department of Physics andS. Lindsay,Astronomy, Arizona State University, Tempe, AZ 85287-1504, USA.
ver and surface.5,13 However, the e†ect does not con-tribute to image contrast because it is approximatelyconstant once the cantilever is close enough for the tipto be nearly in contact with the surface.7 Our concernhere is with the changes that occur at nanometer dis-tances from the surface.
This paper is organized as follows : the criteria forchoosing operating amplitude are presented and a pro-cedure for amplitude calibration is outlined ; the mecha-nical di†erence between acoustic excitation of thecantilever and direct drive by magnetic deÑection isdemonstrated with approach curves ; a formula forinterpreting low-frequency, high-amplitude approachcurves is derived and applied to surfaces under water ;and measurements of the cantilever response as a func-tion of frequency and distance from a mica surface arepresented and interpreted with the aid of numericalsimulations. These conÐrm the interpretation of thelow-frequency approach curves, which indicate that oninitial “contactÏ the tip is sensing the surface via com-pression of an interfacial Ñuid layer. Thus, it appears tobe possible to operate DFM in non-contact mode inÑuid even at high amplitude.
EXPERIMENTAL
Measurements were made with two systems. One was aSeiko (Tokyo) atomic force microscope with a home-made liquid cell equipped with a ferrite-cored solenoidbeneath the sample. Rectangular silicon cantilevers(Olympus, Tokyo) with nominal spring constant (k), of 2and 20 N m~1 were modiÐed by the addition of a smallmagnetic particle as described elsewhere.9 The otherwas a MAC Mode Pico scanning probe microscope
CCC 0142È2421/99/050354È07 $17.50 Received 15 September 1998Copyright ( 1999 John Wiley & Sons, Ltd. Accepted 21 December 1998
DFM IN FLUID 355
that utilized silicon nitride cantilevers (nominal sti†ness0.6 N m~1) coated with a magnetic Ðlm (MAC Levers),both from Molecular Imaging (Phoenix, AZ). Theinstrument was equipped with a piezo-electric drive topermit switching between magnetic and acoustic excita-tion of the cantilever. We used Ñame-annealed gold(111) Ðlms and clean water14 or freshly-cleaved mica inwater from a Millipore system.
OPERATING AMPLITUDE FOR DFM INLIQUID
It is desirable to operate DFM at as small an amplitudeand with as small a setpoint change as possible, in orderto minimize disturbance of the sample. This may beseen by considering the energy dissipated in the sampleon each cycle in the low-frequency limit :
*E(z)\ 12kMA02[ [A0[ A(z)]2N (1)
where k is the cantilever spring constant, is theA0amplitude immediately prior to approach to the surfaceand A(z) is the amplitude at some distance z from anominal surface plane (see below). In contrast to DFMin a vacuum or air, resonance e†ects are small, so themicroscopy is largely sensitive to changes in amplitude.Its sensitivity is thus limited by thermal Ñuctuations andis not signiÐcantly enhanced by operating at resonance.However, stable operation requires an amplitude suffi-cient to pull the tip out of attractive interactions (suchas adhesion). In addition to the usual requirement that
we need(LFts/Lz)' \ k,
kA~ ] FM] Fts'\ 0 (2)
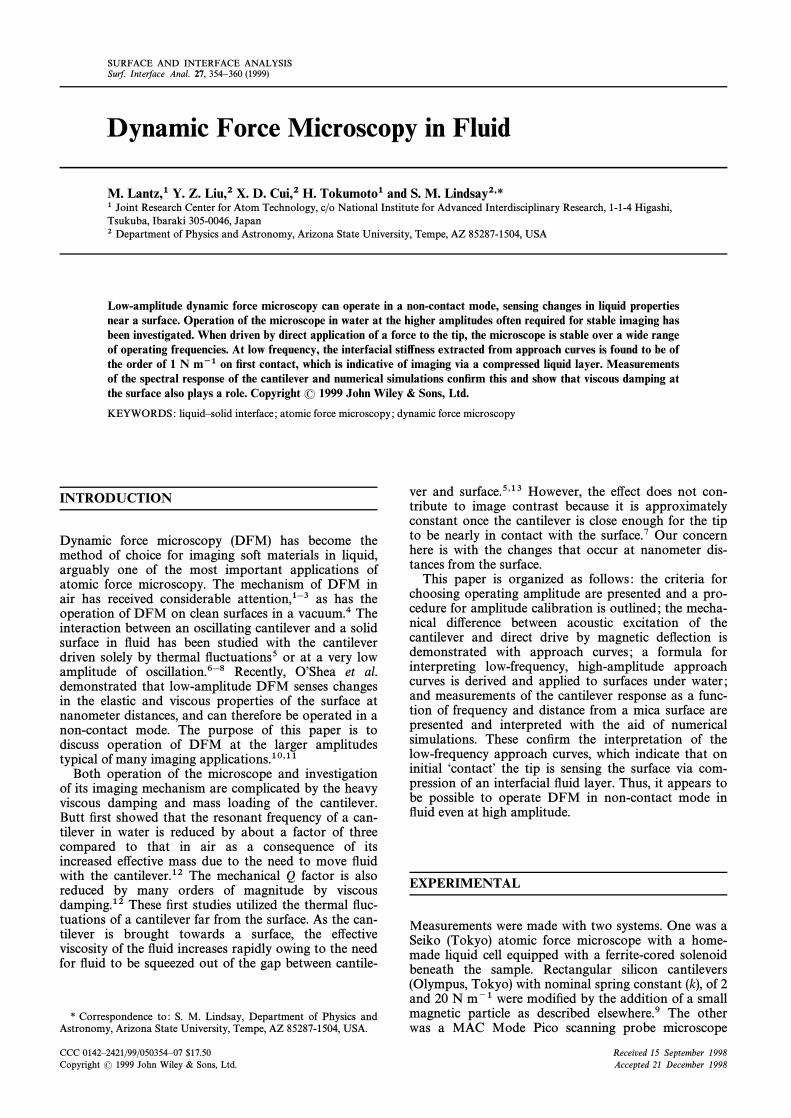
where is the amplitude on the down swing (Fig. 1),A~is the maximum magnetic force (for the case of mag-FMnetic drive) and is the tip-sample maximal inter-Fts'action force. In non-contact operation tipÈsampleadhesion can be avoided, but in normal imaging condi-tions on rough surfaces a safe value of is D2È5 nmA0with k D1 N m~1.
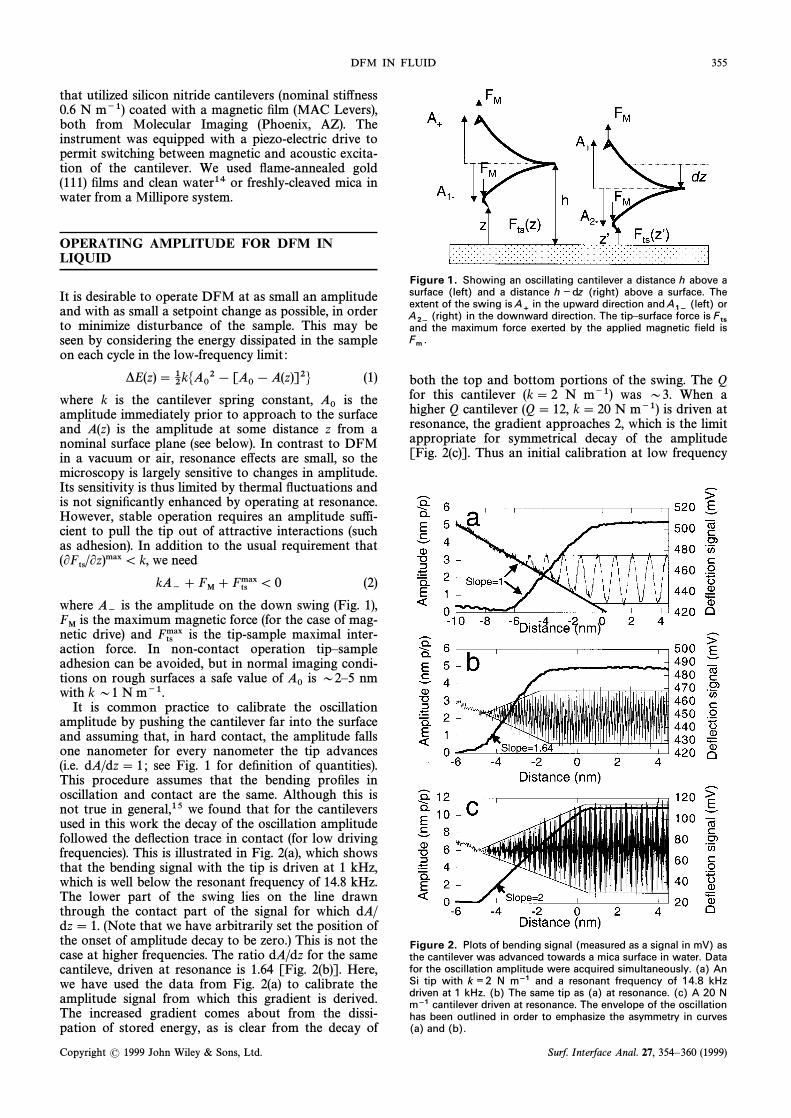
It is common practice to calibrate the oscillationamplitude by pushing the cantilever far into the surfaceand assuming that, in hard contact, the amplitude fallsone nanometer for every nanometer the tip advances(i.e. dA/dz\ 1 ; see Fig. 1 for deÐnition of quantities).This procedure assumes that the bending proÐles inoscillation and contact are the same. Although this isnot true in general,15 we found that for the cantileversused in this work the decay of the oscillation amplitudefollowed the deÑection trace in contact (for low drivingfrequencies). This is illustrated in Fig. 2(a), which showsthat the bending signal with the tip is driven at 1 kHz,which is well below the resonant frequency of 14.8 kHz.The lower part of the swing lies on the line drawnthrough the contact part of the signal for which dA/dz\ 1. (Note that we have arbitrarily set the position ofthe onset of amplitude decay to be zero.) This is not thecase at higher frequencies. The ratio dA/dz for the samecantileve, driven at resonance is 1.64 [Fig. 2(b)]. Here,we have used the data from Fig. 2(a) to calibrate theamplitude signal from which this gradient is derived.The increased gradient comes about from the dissi-pation of stored energy, as is clear from the decay of
Figure 1. Showing an oscillating cantilever a distance h above asurface (left) and a distance h Édz (right) above a surface. Theextent of the swing is in the upward direction and (left) orA
½A
1É(right) in the downward direction. The tip–surface force isA
2ÉF
tsand the maximum force exerted by the applied magnetic field isF
m.
both the top and bottom portions of the swing. The Qfor this cantilever (k \ 2 N m~1) was D3. When ahigher Q cantilever (Q\ 12, k \ 20 N m~1) is driven atresonance, the gradient approaches 2, which is the limitappropriate for symmetrical decay of the amplitude[Fig. 2(c)]. Thus an initial calibration at low frequency
Figure 2. Plots of bending signal (measured as a signal in mV) asthe cantilever was advanced towards a mica surface in water. Datafor the oscillation amplitude were acquired simultaneously. (a) AnSi tip with k ¼2 N mÉ1 and a resonant frequency of 14.8 kHzdriven at 1 kHz. (b) The same tip as (a) at resonance. (c) A 20 NmÉ1 cantilever driven at resonance. The envelope of the oscillationhas been outlined in order to emphasize the asymmetry in curves(a) and (b).
Copyright ( 1999 John Wiley & Sons, Ltd. Surf. Interface Anal. 27, 354È360 (1999)
356 M. LANTZ ET AL .
is required because the gradient near resonance is notknown a priori.
ACOUSTIC VERSUS MAGNETIC DRIVE
It is well known that acoustic drive in liquid isrestricted to frequencies at which the cantilever holderresonates, resulting in many sharp response peaksdespite the dampened response of the cantilever.16,17These spurious responses can be eliminated with mag-netic drive.12 However, magnetic drive appears to o†eradvantages that go beyond an increased range of oper-ating frequency. It is claimed that the technique gives abetter signal-to-noise ratio and images with higherresolution.10,11,18 This may be related to the di†erentprocess by which the cantilever is bent in the two cases.In magnetic excitation, the cantilever and sampleremain Ðxed, the cantilever being bent directly by appli-cation of a magnetic force or magnetostriction [seeinset, Fig. 3(a)]. In acoustic excitation, the long-wavelength sound waves cause displacement of the can-tilever holder [inset, Fig. 3(b)] so that the net bendingsignal is the di†erence between displacement of the tipand displacement of the holder. Writing the complexamplitude in this way and solving for the real part ofthe signal yields the following result
A(u)\ A0S u4] (uu0/Q)2
(u2[ u02)2] (uu0/Q)2(3)
Here is the amplitude of the drive applied to theA0holder, is the resonant frequency of the cantileveru0and Q is the quality factor of the cantilever. Note thatthe response, A(u), drops to zero at zero frequency, incontrast to magnetic drive where the response is FM/k.11
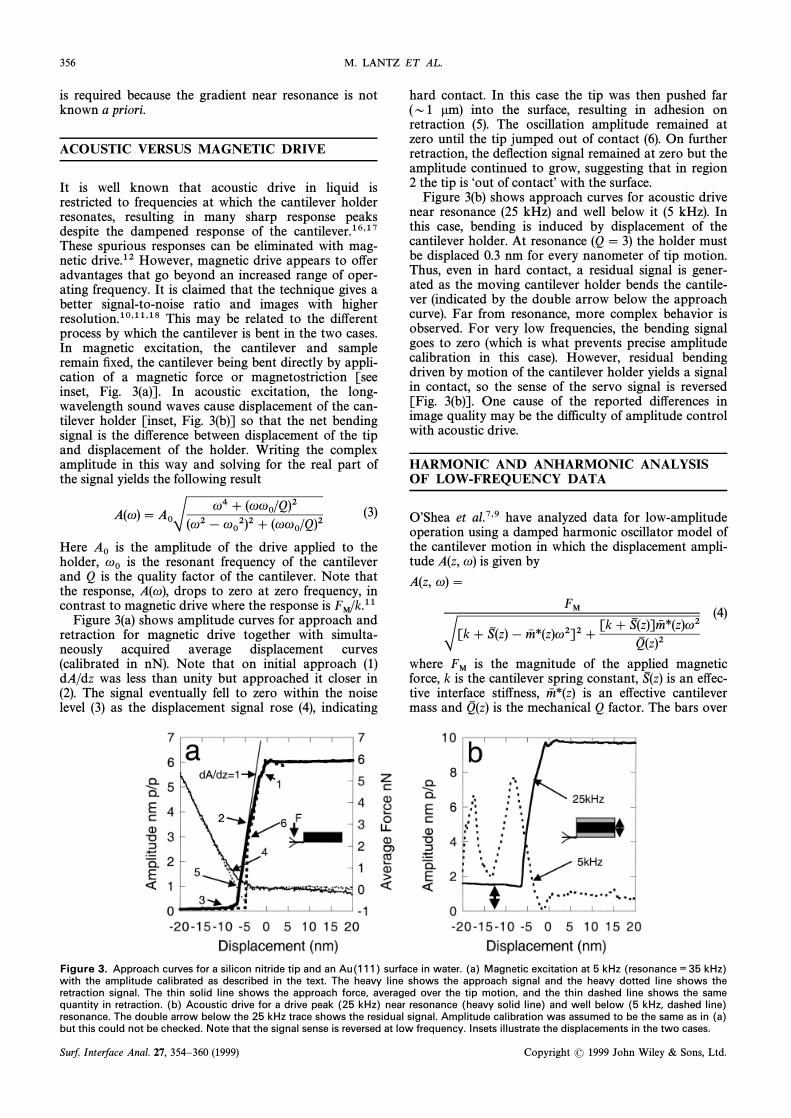
Figure 3(a) shows amplitude curves for approach andretraction for magnetic drive together with simulta-neously acquired average displacement curves(calibrated in nN). Note that on initial approach (1)dA/dz was less than unity but approached it closer in(2). The signal eventually fell to zero within the noiselevel (3) as the displacement signal rose (4), indicating
hard contact. In this case the tip was then pushed far(D1 lm) into the surface, resulting in adhesion onretraction (5). The oscillation amplitude remained atzero until the tip jumped out of contact (6). On furtherretraction, the deÑection signal remained at zero but theamplitude continued to grow, suggesting that in region2 the tip is “out of contactÏ with the surface.
Figure 3(b) shows approach curves for acoustic drivenear resonance (25 kHz) and well below it (5 kHz). Inthis case, bending is induced by displacement of thecantilever holder. At resonance (Q\ 3) the holder mustbe displaced 0.3 nm for every nanometer of tip motion.Thus, even in hard contact, a residual signal is gener-ated as the moving cantilever holder bends the cantile-ver (indicated by the double arrow below the approachcurve). Far from resonance, more complex behavior isobserved. For very low frequencies, the bending signalgoes to zero (which is what prevents precise amplitudecalibration in this case). However, residual bendingdriven by motion of the cantilever holder yields a signalin contact, so the sense of the servo signal is reversed[Fig. 3(b)]. One cause of the reported di†erences inimage quality may be the difficulty of amplitude controlwith acoustic drive.
HARMONIC AND ANHARMONIC ANALYSISOF LOW-FREQUENCY DATA
OÏShea et al.7,9 have analyzed data for low-amplitudeoperation using a damped harmonic oscillator model ofthe cantilever motion in which the displacement ampli-tude A(z, u) is given by
A(z, u) \FM
S[k ] S1 (z) [ m6 *(z)u2]2] [k ] S1 (z)]m6 *(z)u2
Q1 (z)2
(4)
where is the magnitude of the applied magneticFMforce, k is the cantilever spring constant, is an e†ec-S1 (z)tive interface sti†ness, is an e†ective cantileverm6 *(z)mass and is the mechanical Q factor. The bars overQ1 (z)
Figure 3. Approach curves for a silicon nitride tip and an Au(111) surface in water. (a) Magnetic excitation at 5 kHz (resonance ¼35 kHz)with the amplitude calibrated as described in the text. The heavy line shows the approach signal and the heavy dotted line shows theretraction signal. The thin solid line shows the approach force, averaged over the tip motion, and the thin dashed line shows the samequantity in retraction. (b) Acoustic drive for a drive peak (25 kHz) near resonance (heavy solid line) and well below (5 kHz, dashed line)resonance. The double arrow below the 25 kHz trace shows the residual signal. Amplitude calibration was assumed to be the same as in (a)but this could not be checked. Note that the signal sense is reversed at low frequency. Insets illustrate the displacements in the two cases.
Surf. Interface Anal. 27, 354È360 (1999) Copyright ( 1999 John Wiley & Sons, Ltd.
DFM IN FLUID 357
Figure 4. Interfacial stiffness S(z) for mica and a silicon tip(dashed line) and Au(111) and a silicon nitride tip (heavy line) inwater. Results were calculated from low-frequency approachcurves using Eqn. (7). The thin line indicates a region of exponen-tial decay.
S, m* and Q indicate that they are averaged over themotion of the cantilever, which is accurate for smallamplitudes. This approximation breaks down at highamplitude. For example, the low-frequency limit of (4)yields the well-known result A0/A(z)\ [S(z) ] k]/k,19
implying that the fractional change in amplitude is con-stant at a given z. This is obviously not true at highamplitude, where all of the motion that lies beyond therange of surface forces is una†ected by the approach.
It is relatively straightforward to generalize the resultof Pethica and Oliver19 to the high-amplitude regime.Consider a cantilever initially at a height h above asurface (Fig. 1) with a maximum upward swing A
`\
and a maximum downward swing Moved aFM/k A1~ .distance dz towards the surface (Fig. 1), the new down-ward swing is With andA2~ . dA\A1~[ A2~z@\ z[ (dz[ dA) the force equilibration on the down-ward stroke is given by
FM\ kA1~] Fts(z) \ kA2~] Fts[z[ (dz[ dA)] (5)
where we have assumed a symmetric magnetic drive sothat the magnitude of the magnetic force on the down-ward swing is equal to that on the upward swing. If wedeÐne a di†erential force “constantÏ S(z) by
S(z) \ Fts[z[ (dz[ dA)][ Fts[z](dA[ dz)
, (dA[ dz) ] 0 (6)
then Eqn. (5) yields
S(z) \ kCdzdA
(z) [ 1D (7)
with repulsive forces deÐned as negative. Thus, theinverse of the derivative of the approach curve taken at
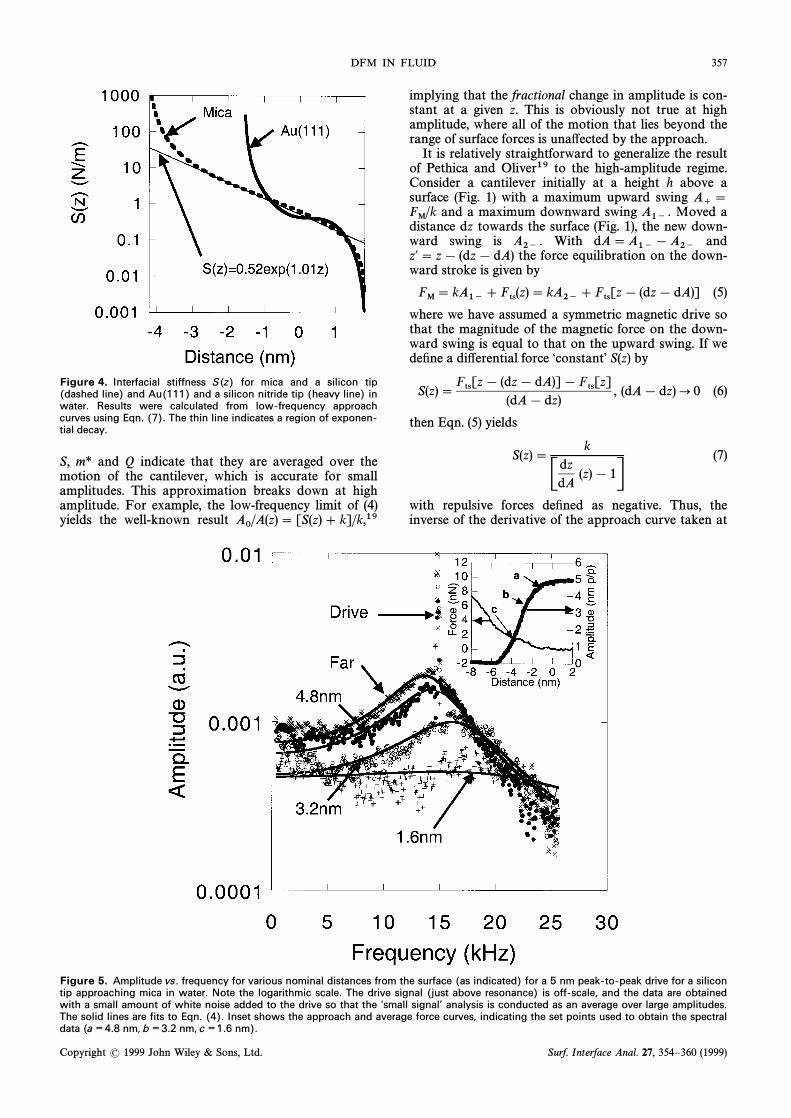
Figure 5. Amplitude vs. frequency for various nominal distances from the surface (as indicated) for a 5 nm peak-to-peak drive for a silicontip approaching mica in water. Note the logarithmic scale. The drive signal (just above resonance) is off-scale, and the data are obtainedwith a small amount of white noise added to the drive so that the ‘small signal’ analysis is conducted as an average over large amplitudes.The solid lines are fits to Eqn. (4). Inset shows the approach and average force curves, indicating the set points used to obtain the spectraldata (a ¼4.8 nm, b ¼3.2 nm, c ¼1.6 nm).
Copyright ( 1999 John Wiley & Sons, Ltd. Surf. Interface Anal. 27, 354È360 (1999)
358 M. LANTZ ET AL .
low frequency may be used to estimate S(z). Theapproach curves of Figs 2(a) and 3(a) were used to gen-erate the values for S(z) displayed in Fig. 4. Curves wereÐtted to a ninth-order polynomial that was then di†er-entiated explicitly and the results used in Eqn. 7. Theprocedure becomes unreliable as dA/dz approachesunity, but both systems show that, at the extreme lowpoint of the swing, S is initially of the order of 1 N m~1for distances of the order of nanometer. This is charac-teristic of compression of a Ñuid layer.7,8,20 Closer tothe surface S(z) rises rapidly to values of the order of100 N m~1, which is characteristic of indentation of asolid surface by a tip.19,21 The data for mica exhibit anextended region of single exponential behavior, indi-cated by the line of Fig. 4.
AMPLITUDE DECAY OVER A WIDEFREQUENCY RANGE
The measurements of OÏShea et al.9 were extended intothe high-amplitude regime by driving a silicon cantile-ver just above its resonant frequency (14.8 kHz) withsinusoidal excitation that produced a 5 nm peak-to-peak deÑection when the cantilever was far from thesurface. A small amount of white noise was added to thedrive signal and the deÑection signal was fed into aspectrum analyzer. Far from the surface (D500 nm) thisyields a response that Ðts the damped harmonic oscil-lator model (Eqn. 4) with k \ 2.5 N m~1, m6 *(z)\ 3.1] 10~10 kg and although there is some dis-Q1 (z)\ 2.4,crepancy at low frequencies (Fig. 5). This is to beexpected because these measurements are averages overlarge-amplitude motion. Surprisingly, Eqn. (4) Ðts thedata to about the same extent even as the surface isapproached. The distance was controlled using ampli-tude damping at the drive frequency (inset, Fig. 5). Wearbitrarily took 5 nm from the initial onset of decay tobe the surface location so that at a (inset, Fig. 5) the tipwas 4.8 nm, at b it was 3.2 nm and at c it was 1.6 nmfrom it. The Ðts were made with approximatelym6 *(z)constant, with remaining D2 (falling to 0.9 for theQ1 (z)1.6 nm curve). Values of were 0.4 N m~1 (4.8 nm),S1 (z)1.4 N m~1 (3.2 nm) and 1.5 N m~1 (1.6 nm). Thenumbers are of no signiÐcance beyond their role inparameterizing the response curves ; the surprisingresult is that Eqn (4) Ðts to any degree.
A NUMERICAL MODEL
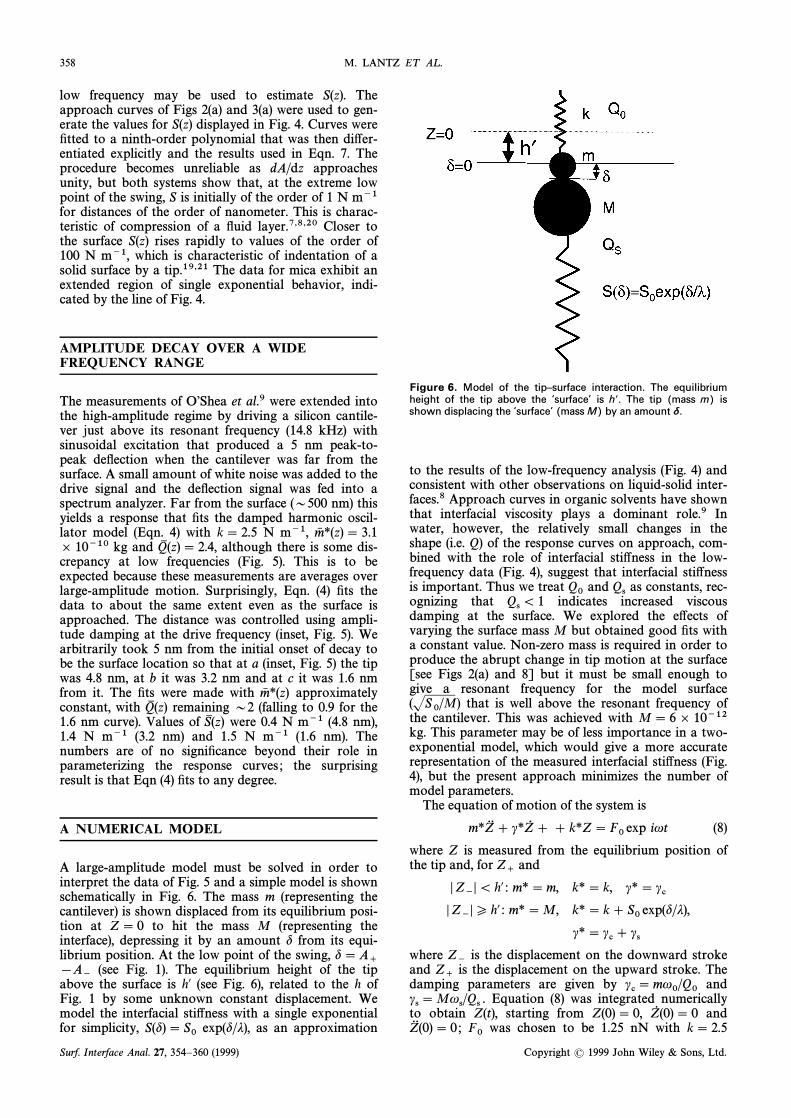
A large-amplitude model must be solved in order tointerpret the data of Fig. 5 and a simple model is shownschematically in Fig. 6. The mass m (representing thecantilever) is shown displaced from its equilibrium posi-tion at Z\ 0 to hit the mass M (representing theinterface), depressing it by an amount d from its equi-librium position. At the low point of the swing, d \A
`(see Fig. 1). The equilibrium height of the tip[A~above the surface is h@ (see Fig. 6), related to the h ofFig. 1 by some unknown constant displacement. Wemodel the interfacial sti†ness with a single exponentialfor simplicity, exp(d/j), as an approximationS(d)\S0
Figure 6. Model of the tip–surface interaction. The equilibriumheight of the tip above the ‘surface’ is h ¾. The tip (mass m) isshown displacing the ‘surface’ (mass M) by an amount d.
to the results of the low-frequency analysis (Fig. 4) andconsistent with other observations on liquid-solid inter-faces.8 Approach curves in organic solvents have shownthat interfacial viscosity plays a dominant role.9 Inwater, however, the relatively small changes in theshape (i.e. Q) of the response curves on approach, com-bined with the role of interfacial sti†ness in the low-frequency data (Fig. 4), suggest that interfacial sti†nessis important. Thus we treat and as constants, rec-Q0 Qsognizing that indicates increased viscousQs \ 1damping at the surface. We explored the e†ects ofvarying the surface mass M but obtained good Ðts witha constant value. Non-zero mass is required in order toproduce the abrupt change in tip motion at the surface[see Figs 2(a) and 8] but it must be small enough togive a resonant frequency for the model surface
that is well above the resonant frequency of(JS0/M)the cantilever. This was achieved with M \ 6 ] 10~12kg. This parameter may be of less importance in a two-exponential model, which would give a more accuraterepresentation of the measured interfacial sti†ness (Fig.4), but the present approach minimizes the number ofmodel parameters.
The equation of motion of the system is
m*Z� ] c*Z0 ] ] k*Z\ F0 exp iut (8)
where Z is measured from the equilibrium position ofthe tip and, for andZ
`oZ~o\ h@ : m* \ m, k* \ k, c* \ ccoZ~oP h@ : m* \ M, k* \ k ] S0 exp(d/j),
c* \ cc] cswhere is the displacement on the downward strokeZ~and is the displacement on the upward stroke. TheZ
`damping parameters are given by andcc\ mu0/Q0Equation (8) was integrated numericallycs\ Mus/Qs .to obtain Z(t), starting from Z(0)\ 0, andZ0 (0)\ 0was chosen to be 1.25 nN with k \ 2.5Z� (0) \ 0 ; F0
Surf. Interface Anal. 27, 354È360 (1999) Copyright ( 1999 John Wiley & Sons, Ltd.

DFM IN FLUID 359
Figure 7. Some simulations of the spectral response for a peak-to-peak amplitude of 2 nm at low frequency and the parameters describedin the text. The amplitude scale is logarithmic. At h ¾ ¼1.6 nm (top curves) the tip barely touches the ‘surface’. Lower curves are calculatedfor steps of 1.6 nm towards the ‘surface’.
N/m~1 to give a low-frequency half-amplitude of 2 nm;and m was calculated from the free resonant frequencyto be 3.1] 1010 Kg. Each cycle of oscillation wasdivided into 60 000 time increments and the equationswere integrated over 40 complete cycles. A comparisonof the results after 20 and 40 cycles showed that asteady state was reached at 20 cycles, so subsequent cal-culation was stopped at this time. Calculations werecarried out for h@\ 1.6, 0, [1.6 and [3.2 nm. The Ðrstvalue barely touches the surface (A`[ h@\ 0.4 nm),whereas the last value corresponds to an equilibriumposition well into the region of increased sti†ness.
Some results are displayed in Fig. 7. The best agree-ment [Fig. 7(a)] was obtained with the experimentallydetermined form S(z)\ 0.52 exp (1.01d) and with QS \
Results are quite sensitive to as illustrated in0.3. QS ,Fig. 7(b). A small decrease (to 0.1) results in an apparentdecrease of peak frequency with penetration because ofthe frequency dependence of the damping. Furtherreduction results in a very “non-harmonicÏ response, thetop of the peak near resonance being cut o† as the tiploses energy to the surface. A higher value results inQStoo sharp a peak at the greatest penetration depth.
The simulation are also quite sensitive to the form ofthe surface sti†ness. This can be demonstrated bychanging either or j, and we show plots for j \ 10S0nm in Fig. 7(c). These show that the amplitude damping
Figure 8. (a) The experimentally measured tip bending signals at5 kHz as the setpoint is increased stepwise (data overlaid). (b)Calculated displacement with the parameters used for calculationof the data in Fig. 7(a).
and frequency shift are too small in this case. Theopposite results are obtained with an increase in or aS0decrease in j.
The shape of the tip trajectory calculated with theseparameters is in reasonable agreement with measure-ments, as shown in Fig. 8 (data and calculations are for5 kHz drive). The cut-o† appearance of the bottomrequires both some surfaces mass and a surface sti†nessthat increases strongly with distance.
DISCUSSION AND CONCLUSIONS
Both the simple analysis of low-frequency approachcurves and numerical modeling of the spectral responseshow that, at the lowest point of its swing, the tip sensesan initial interfacial sti†ness of the order of 1 N m~1even at the nanometer amplitudes used for DFMimaging. This value is characteristic of Ñuid compres-sion.7,8,20 Thus, operated at small changes in ampli-tude, DFM in Ñuid is non-contact, conÐrming andextending the low-amplitude results of OÏShea et al.9This conclusion is in accord with experience in oper-ating the microscope. A small setpoint amplitudereduction does not, in general, give the best resolution.Resolution increases as the amplitude reduction isincreased, until the interaction becomes so strong, thatthe underlying sample is disturbed. This suggests thatthe best operating conditions for the microscope areobtained with the smallest free amplitude that(A0)yields stable operation together with the largest ampli-tude reduction that does not disturb the sample. Softercantilevers would help this process, but we have foundthat the background signal owing to cantilever motionin contact becomes signiÐcant when the sti†ness fallsbelow 0.1 n m~1.
Our results, and those of OÏShea et al.,9 suggest aninterfacial sti†ness for water that is much greater thanthat implied by a recent simulation22 that yieldedpiconewton changes over subnanometer distances. Wecannot exclude the possibility that contamination playssome role23 because of the non-UHV environment.None the less, our measurements were carried out inrelatively cleaner conditions that those used for imagingbiological molecules, for example.
Copyright ( 1999 John Wiley & Sons, Ltd. Surf. Interface Anal. 27, 354È360 (1999)
360 M. LANTZ ET AL .
The simulations suggest that, at least for the initialapproach, the dominant contribution arises from sti†en-ing of the water at the interface, in contrast to the domi-nant role of viscosity in other cases9 (though the viscouscontribution clearly increases at short distances). ThusDFM images in water, particularly at low frequency,may be interpreted as a map of contours of constantsti†ness. The value of the setpoint sti†ness may beevaluated from the approach curve using Eqn. (7). Theremarkably “harmonicÏ appearance of the high-amplitude spectral response is accidental. We would not
expect it at a more dissipative interface. Measurementslike these on more complex surfaces, such as tetheredpolymers,5 might be expected to yield information onboth elastic and viscoelastic properties of the interface.
Acknowledgements
We have received support from the Japanese New Energy and Tech-nology Development Organization (NEDO), the NSF (BIR 9513233)and the Molecular Imaging Corporation (TCL-157C).
REFERENCES
1. J. Tamayo and R. Garcia, Langmuir 12, 4430 (1996).2. J. Tamayo and R. Garcia, App. Phys. Lett . 71, 2394 (1997).3. B. Anczykowski, D. Kruger, K. L. Babcock and H. Fuchs,
Ultramicroscopy 66, 251 (1996).4. F. J. Giessibl, Phys.Rev.B 56, 16010 (1997).5. A. Roters, M. Gelbert, M. Schimmel, J. Ruhe and D. Johanns-
mann, Phys.Rev. E 56, 3256 (1997).6. S. J. O’Shea, R. M. Atta and M. E. Welland, Rev. Sci . Instrum.
66, 2508 (1995).7. S. J. O’Shea and M. E. Welland, Langmuir 14, 4186 (1998).8. W. Han and S. M. Lindsay, Appl . Phys. Lett . 72, 1656 (1998).9. S. J. O’Shea, M. A. Lantz, and H. Tokomoto, Langmuir in
press (1998).10. M. A. Lantz, S. J. O’Shea and M. E. Welland, Appl . Phys. Lett .
65, 409 (1994).11. W. Han, S. M. Lindsay and T. Jing, Appl . Phys. Lett . 69, 4111
(1996).12. H. J. Butt, P. Siedle, K. Seifert, K. Fendler, T. Seeger, E.
Bamberg, A. L. Weisenhorn, K. Goldie and A. Engel, J .Microsc. 169, 75 (1993).
13. J. A. Williams, Engineering Tribology. Oxford University Press,New York (1994).
14. T. Wandlowski, D. Lampner and S. M. Lindsay, J. Electroanal .Chem. 404, 215 (1996).
15. J. E. Sader, I. Larson, P. Mulvaney and L. White, Rev. Sci .Instrum. 66, 3789 (1995).
16. C. A. J. Putman, K. O. V. d. Werf, B. G. deGrooth, N. F. V.Hulst and J. Greve, Appl . Phys. Lett . 64, 2454 (1994).
17. T. E. Schaffer, J. P. Cleveland, F. Ohnesorge, D. A. Waltersand P. K. Hansma, J.Appl . Phys. 80, 3622 (1996).
18. W. Han, S. M. Lindsay, M. Dlakic and R. E. Harrington, Nature(London) 386, 563 (1997).
19. J. B. Pethica and W. C. Oliver, Phys. Scr . T19, 61 (1987).20. A. Dhinojwala and S. Granick, J. Chem. Soc. Faraday Trans.
92, 619 (1996).21. D. Sarid, Atomic Force Microscopy (Oxford University Press,
New York (1992).22. K. Koga and X. C. Zeng, Phys.Rev. Lett . 79, 853 (1997).23. T. Smith, J. Colloid Interface Sci . 75, 51 (1980).
Surf. Interface Anal. 27, 354È360 (1999) Copyright ( 1999 John Wiley & Sons, Ltd.