dynamic behavior of shallow rectangular underground ...tunnelseis.pdf · 1 dynamic behavior of...
TRANSCRIPT
1
Dynamic Behavior of Shallow Rectangular Underground Structures in Soft Soils
SERIES Concluding Workshop –Joint with US-NEES "Earthquake Engineering Research Infrastructures"
Ispra, May 28-30, 2013
TA Project: DRESBUS IIInvestigation of the Seismic Behaviour of Shallow Rectangular Underground Structures in Soft Soils Using Centrifuge Experiments
Tsinidis G., Rovithis E., Pitilakis K., Chazelas J.‐L.
TA Project: TUNNELSEISInvestigation of Several Aspects Affecting the Seismic Behaviour of Shallow Rectangular Underground Structures in Soft Soils
Tsinidis G., Heron C., Madabhushi S.P.G., Pitilakis K., Stringer M.

2
Scope
• Seismic behavior of shallow rectangular underground structures in soft soils in transversal direction
• Racking deformations
• Dynamic earth pressures
• Seismic shear stresses – soil‐tunnel interface characteristics
• Dynamic internal forces
• Soil‐structure relative flexibility
3
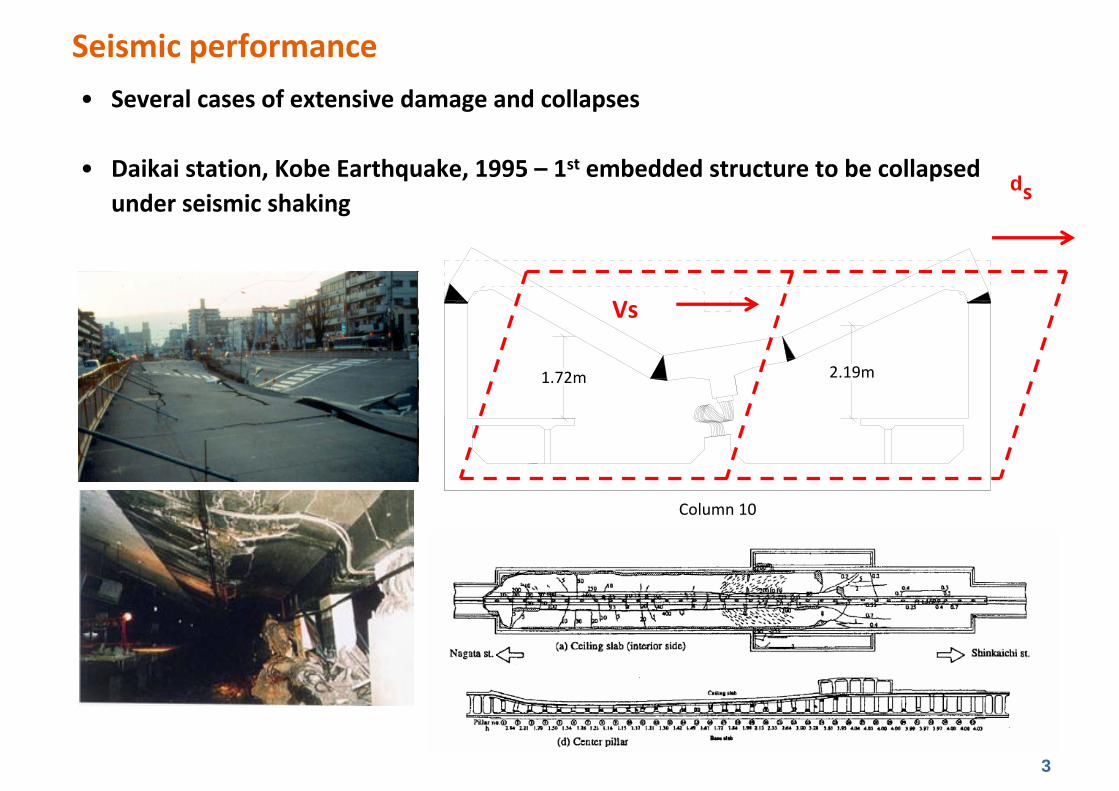
• Several cases of extensive damage and collapses
• Daikai station, Kobe Earthquake, 1995 – 1st embedded structure to be collapsed under seismic shaking
1.72m 2.19m
Column 10
Vs
ds
Seismic performance
4
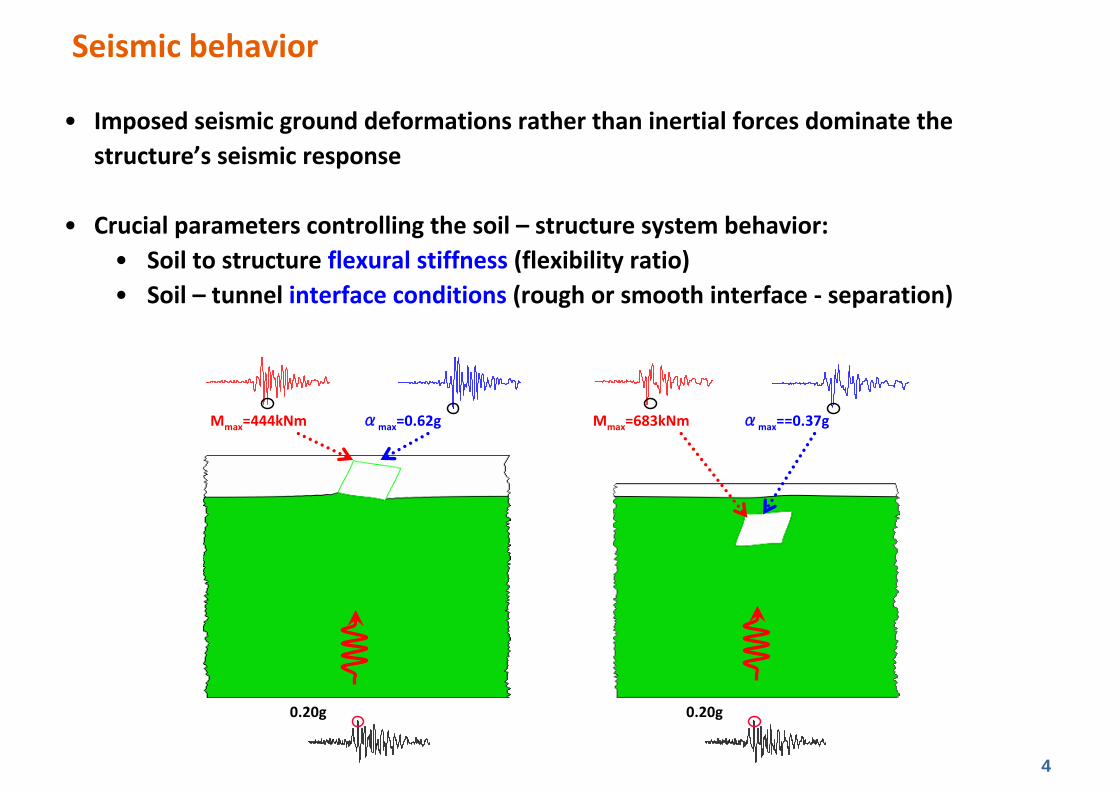
• Imposed seismic ground deformations rather than inertial forces dominate the structure’s seismic response
• Crucial parameters controlling the soil – structure system behavior: • Soil to structure flexural stiffness (flexibility ratio)• Soil – tunnel interface conditions (rough or smooth interface ‐ separation)
Mmax=683kNm αmax==0.37gαmax=0.62gMmax=444kNm
αmax=0.20g αmax=0.20g
Seismic behavior
5
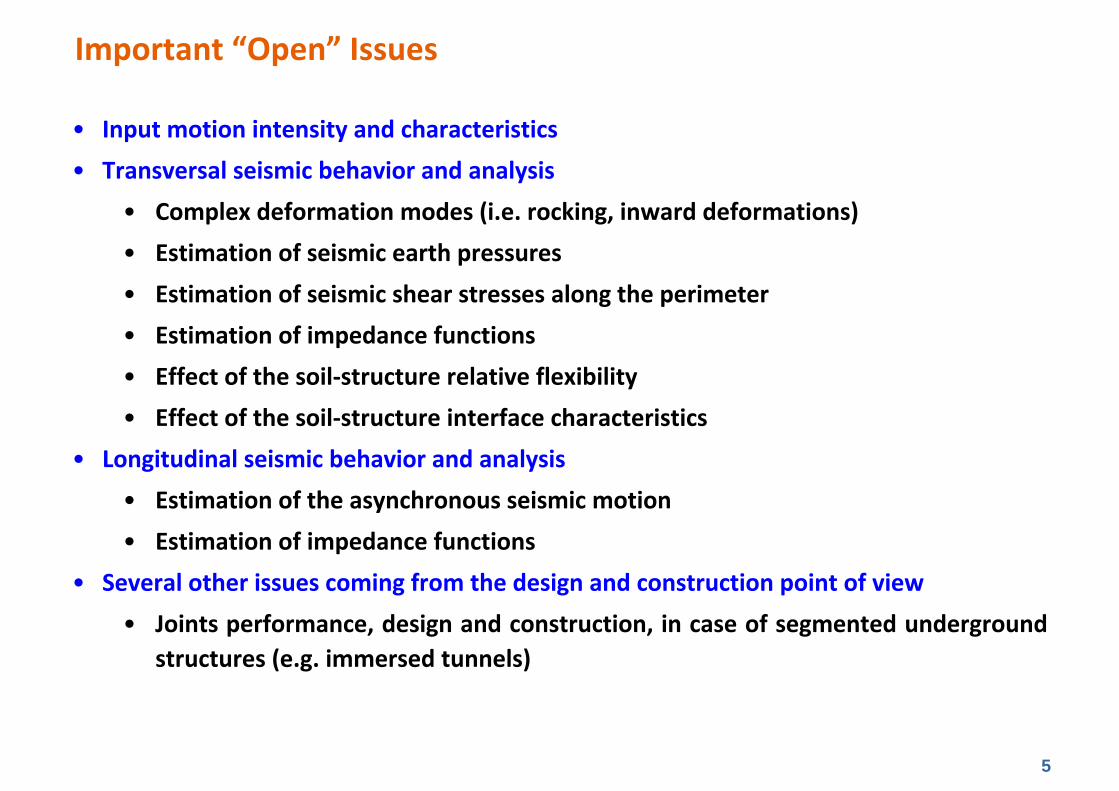
Important “Open” Issues
• Input motion intensity and characteristics• Transversal seismic behavior and analysis
• Complex deformation modes (i.e. rocking, inward deformations)• Estimation of seismic earth pressures • Estimation of seismic shear stresses along the perimeter• Estimation of impedance functions • Effect of the soil‐structure relative flexibility• Effect of the soil‐structure interface characteristics
• Longitudinal seismic behavior and analysis• Estimation of the asynchronous seismic motion • Estimation of impedance functions
• Several other issues coming from the design and construction point of view• Joints performance, design and construction, in case of segmented underground
structures (e.g. immersed tunnels)
6
Experimental research within SERIES
• A substantial advancement to the above topics may be accomplished by means of well‐constrained experimental data allowing investigation of crucial response parameters
• SERIES TA projects: DRESBUS II ‐ Investigation of the seismic behavior of shallow rectangular underground
structures in soft soils using centrifuge experiments – IFSTTAR, Nantes, FR
TUNNELSEIS ‐ Investigation of several aspects affecting the seismic behavior of shallow rectangular underground structures in soft soils – Schofield Centre, University of
Cambridge, UK
7
TA Project: DRESBUS II

8
Project partners and research team
TA User team
• Manos Rovithis (Researcher, EPPO‐ITSAK) – Lead User
• Grigoris Tsinidis (Civil Engineer MSc, PhD candidate AUTH) • Kyriazis Pitilakis (Professor, AUTH)• Emmanouil Kirtas (Assistant Professor, TEI SERRES)• Dimitris Pitilakis (Assistant Professor, AUTH)• Anastasios Anastasiadis (Assistant Professor, AUTH)• Konstantia Makra (Researcher, EPPO‐ITSAK)• Roberto Paolucci (Professor, POLITECNICO DI MILANO)
Access Provider: IFSTTAR, Nantes, FR
• Jean‐Louis Chazelas (Researcher, IFSTTAR)
9
• Dynamic centrifuge tests on rectangular tunnels embedded in dry and saturated sands, under centrifuge acceleration of 40g
• The program extends the DRESBUS program (METU) posing a series of original issues
• Investigation of salient parameters affecting the tunnel response
• Tunnel flexibility
• Tunnel external face rugosity
• Soil saturation
• Input motion
Dynamic centrifuge tests
10
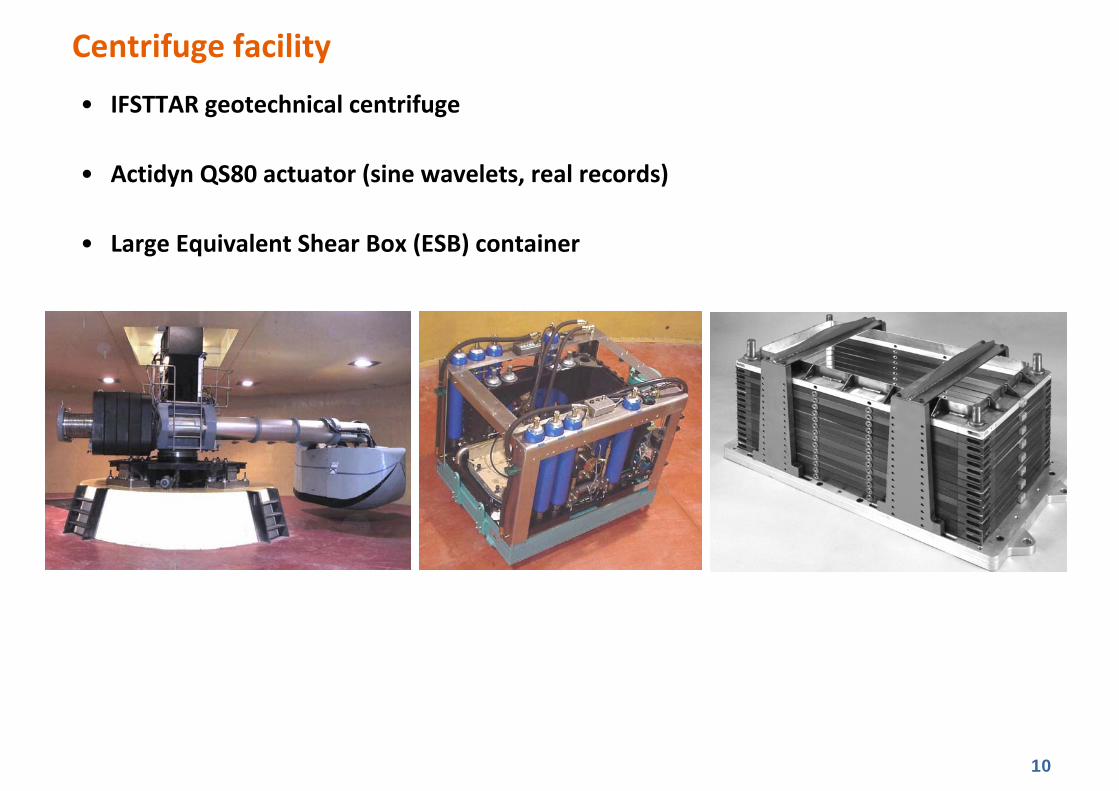
• IFSTTAR geotechnical centrifuge
• Actidyn QS80 actuator (sine wavelets, real records)
• Large Equivalent Shear Box (ESB) container
Centrifuge facility
11
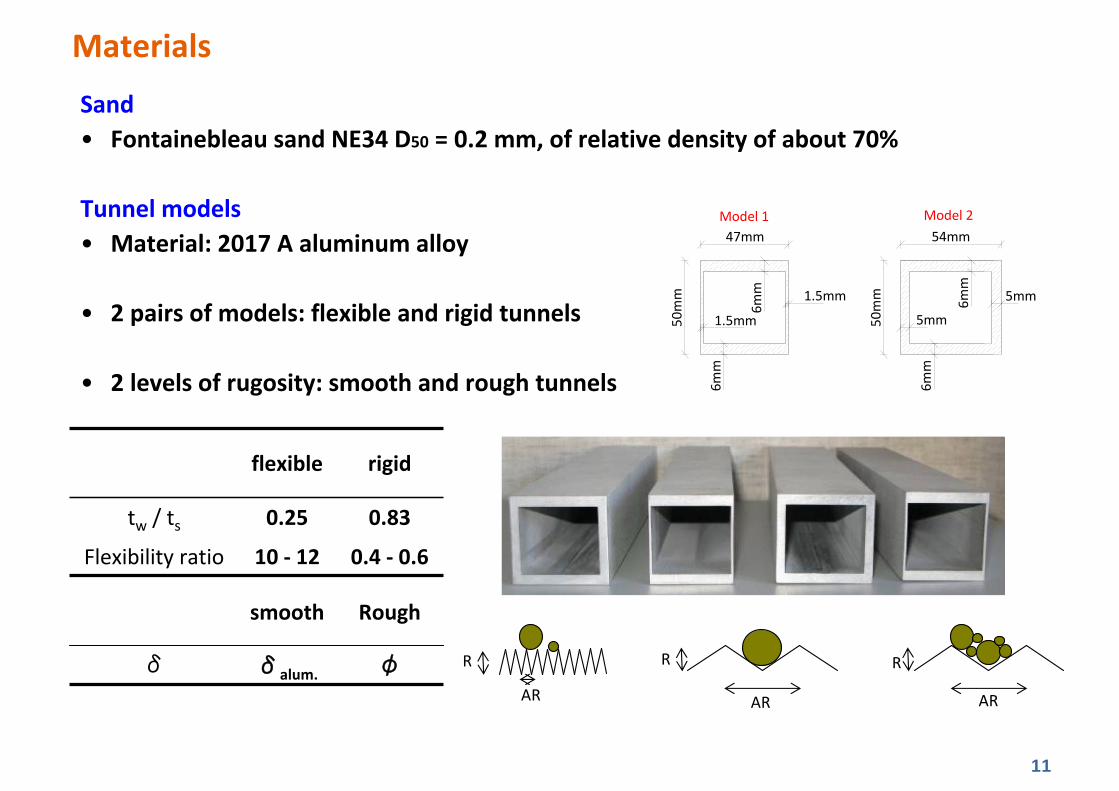
Sand• Fontainebleau sand NE34 D50 = 0.2 mm, of relative density of about 70%
Tunnel models• Material: 2017 A aluminum alloy
• 2 pairs of models: flexible and rigid tunnels
• 2 levels of rugosity: smooth and rough tunnels
Materials
6mm
6mm 1.5mm
1.5mm50mm
47mmModel 1
50mm
Model 254mm
6mm
5mm
6mm
5mm
flexible rigid
tw / ts 0.25 0.83
Flexibility ratio 10 ‐ 12 0.4 ‐ 0.6
smooth Rough
δ δalum. φ
AR
R
AR
R
AR
R
12
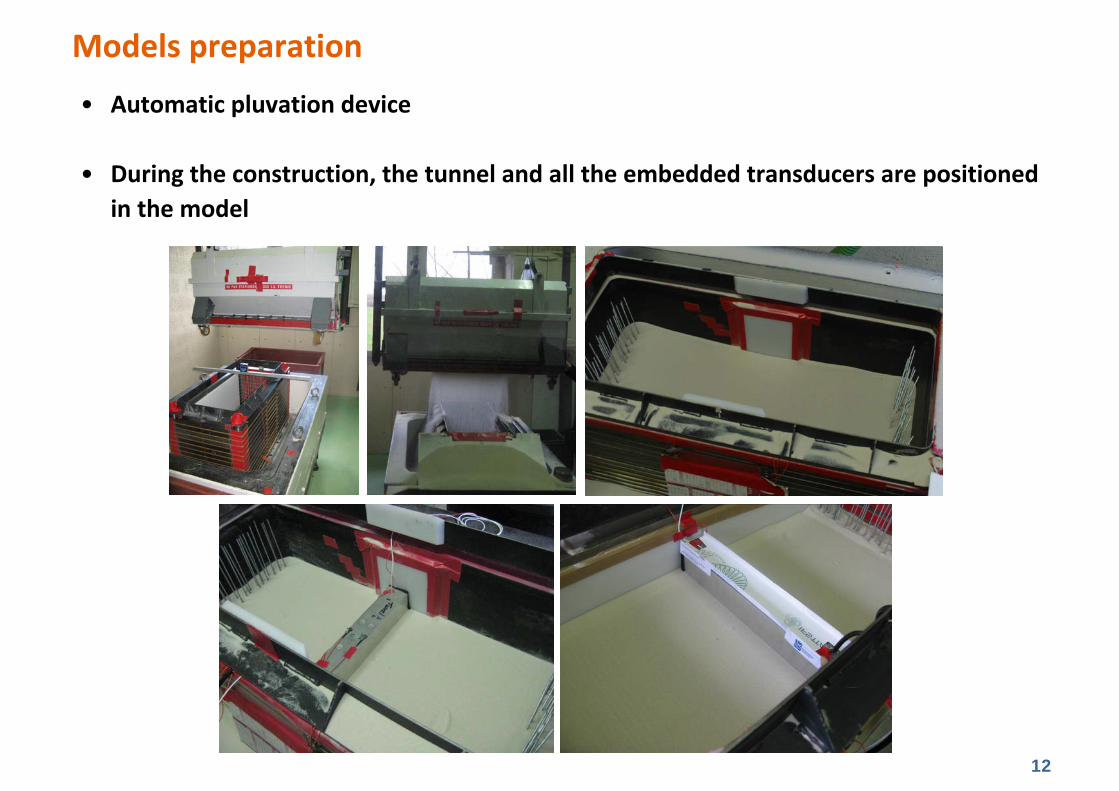
• Automatic pluvation device
• During the construction, the tunnel and all the embedded transducers are positioned in the model
Models preparation
13
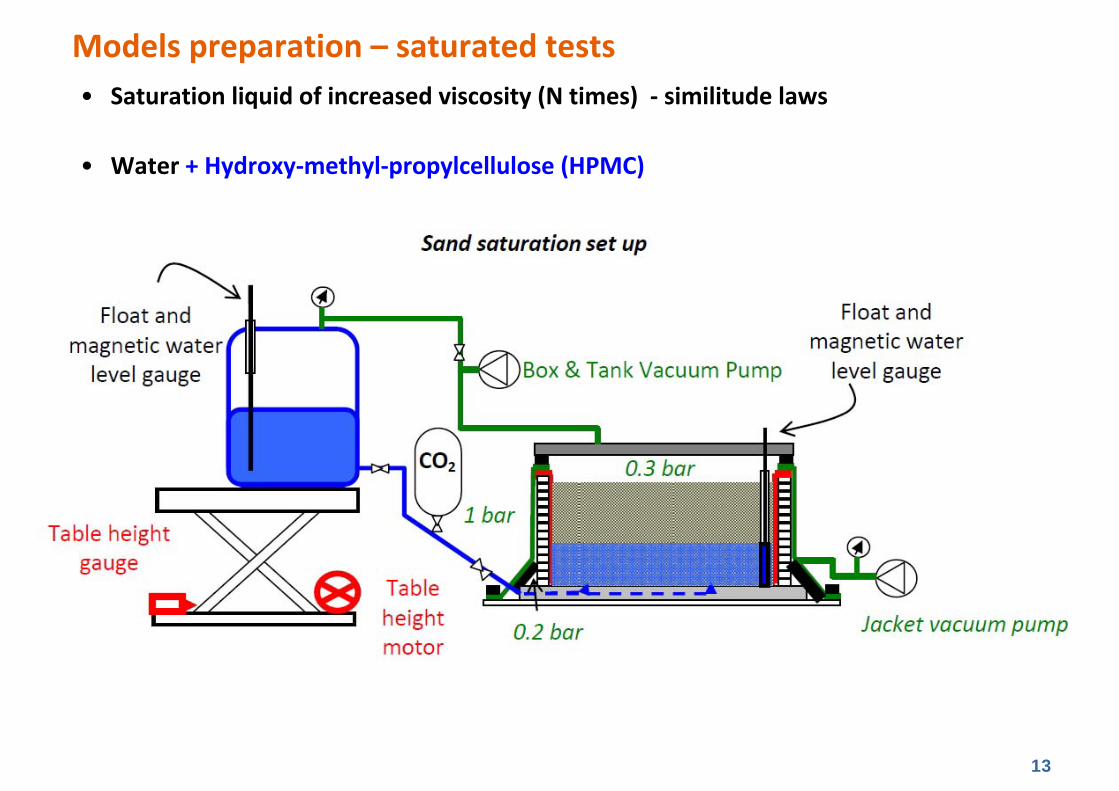
• Saturation liquid of increased viscosity (N times) ‐ similitude laws
• Water + Hydroxy‐methyl‐propylcellulose (HPMC)
Models preparation – saturated tests
14
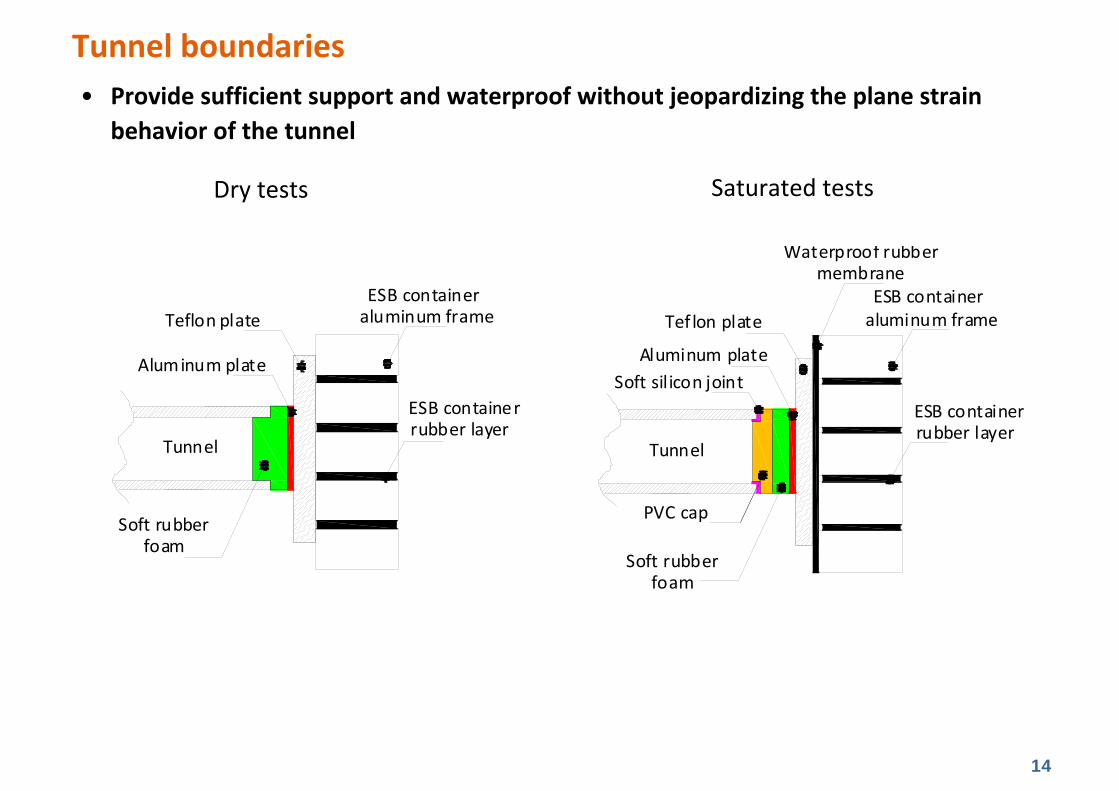
• Provide sufficient support and waterproof without jeopardizing the plane strain behavior of the tunnel
Tunnel boundaries
Tunnel
Soft rubberfoam
Aluminum plate
Teflon plateESB container
aluminum frame
ESB containerrubber layer
(a)
Dry tests Saturated tests
Tunnel
Soft rubberfoam
Aluminum plate
Tef lon plateESB container
aluminum frame
ESB containerrubber layer
PVC cap
Waterproof rubbermembrane
Soft silicon joint
(c)
15
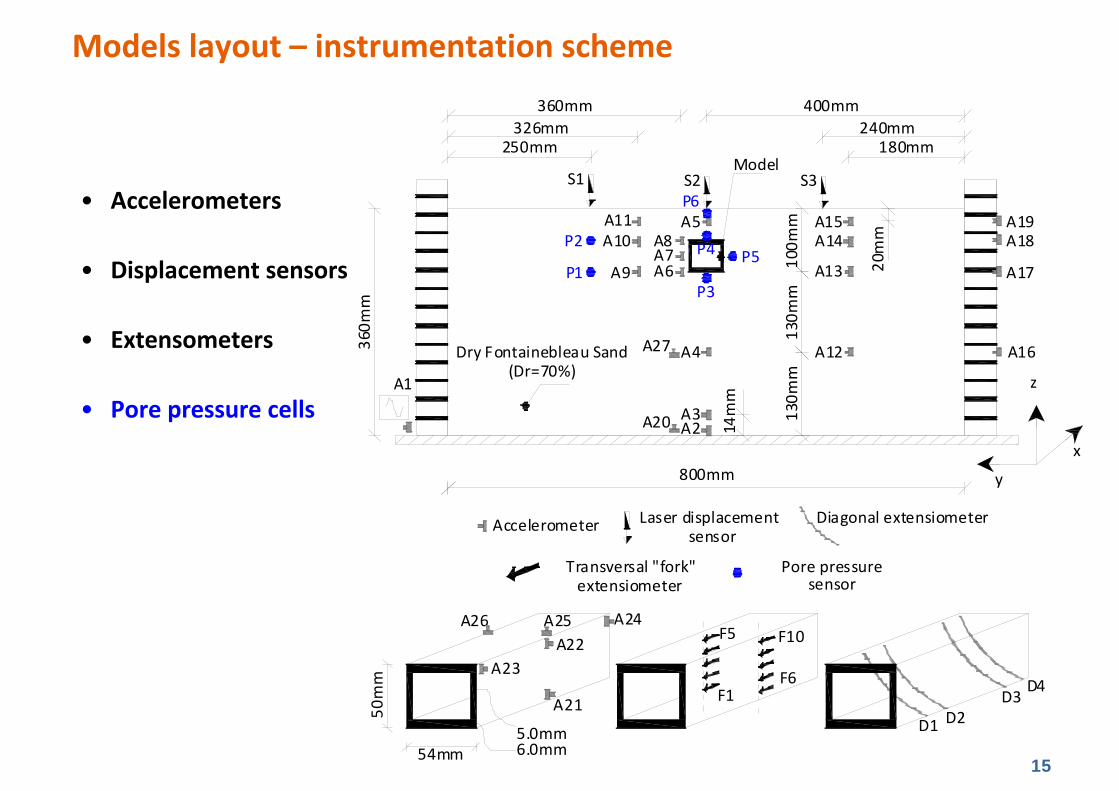
• Accelerometers
• Displacement sensors
• Extensometers
• Pore pressure cells
Models layout – instrumentation scheme
250mm
400mm240mm
360mm
180mm326mm
360m
m
A2
A1
A3
A4
A20
A12
A9 A6 A13A7
A10A11
A8 A5
130m
m130m
m
A14A15
20mm
100m
m
F5
F1F6
F10
D1 D2D3
D4
S1 S3
800mm
Dry Fontainebleau Sand(Dr=70%)
Model
14mm
y
x
z
S2
Accelerometer Laser displacement sensor
Diagonal extensiometer
Transversal "fork"extensiometer
50mm
5.0mm6.0mm54mm
A23
A24
A21
A22A25A26
A16
A17
A18A19
Pore pressuresensor
A27
P3P1
P2 P4 P5
P6
16
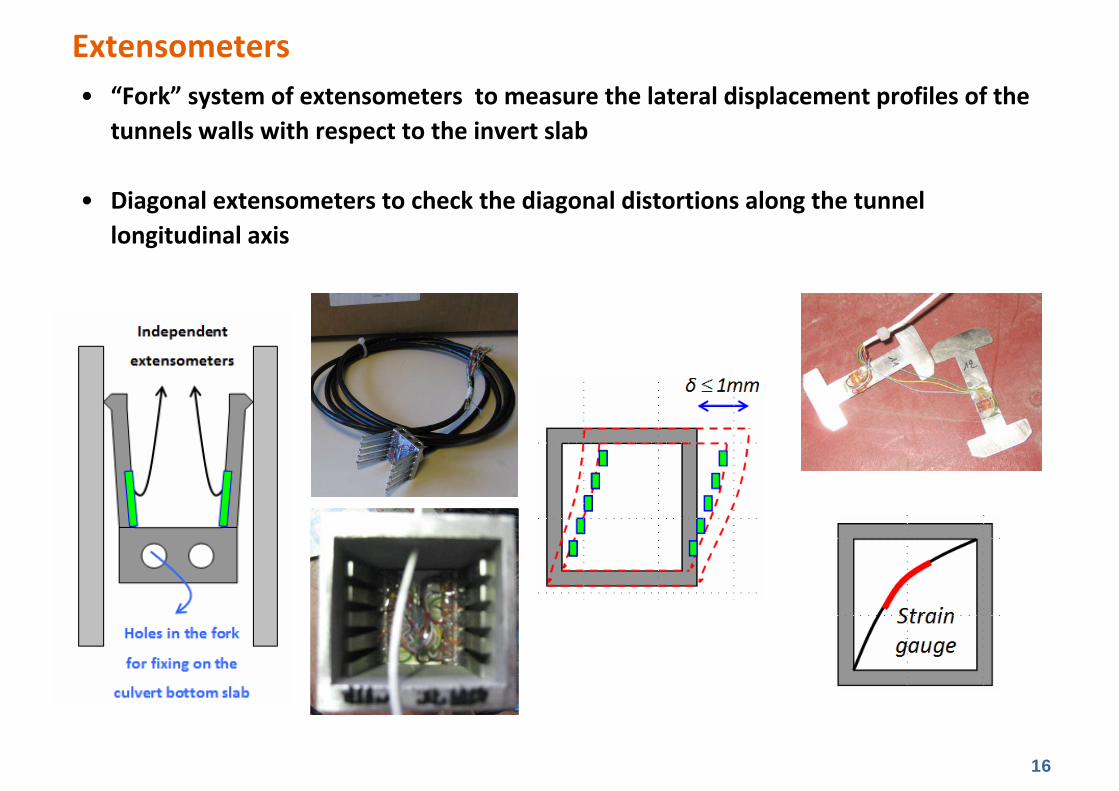
• “Fork” system of extensometers to measure the lateral displacement profiles of the tunnels walls with respect to the invert slab
• Diagonal extensometers to check the diagonal distortions along the tunnel longitudinal axis
Extensometers
17
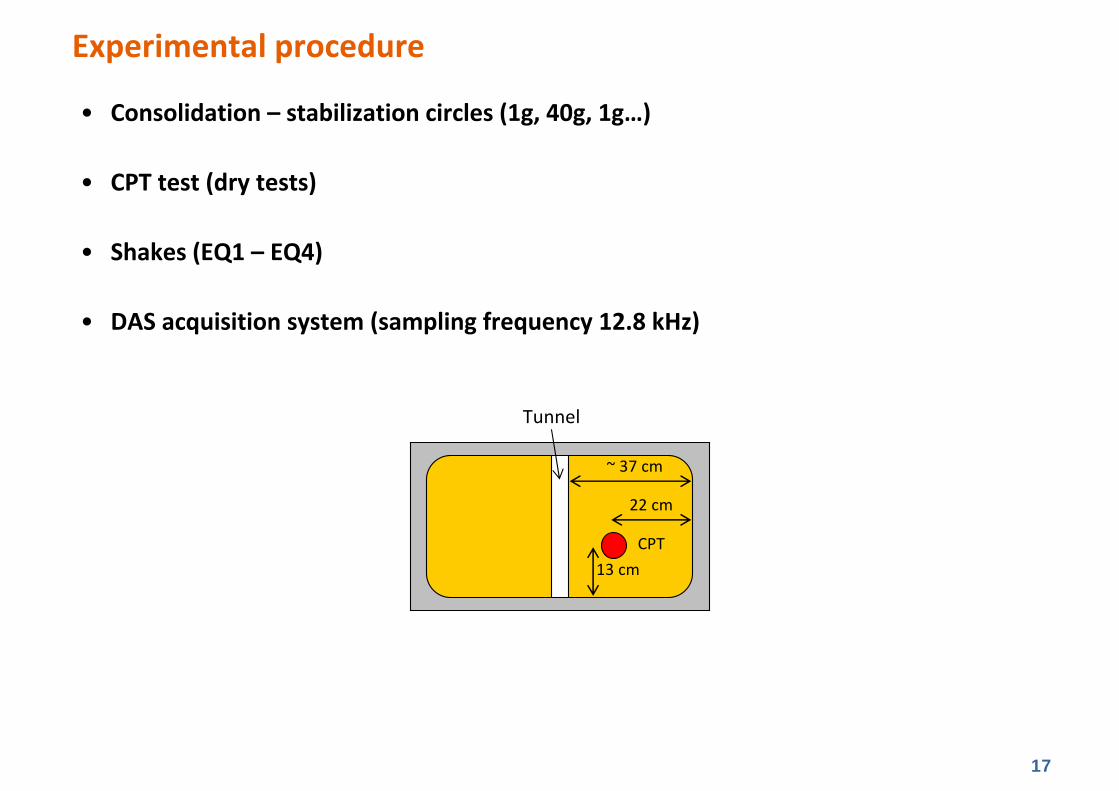
• Consolidation – stabilization circles (1g, 40g, 1g…)
• CPT test (dry tests)
• Shakes (EQ1 – EQ4)
• DAS acquisition system (sampling frequency 12.8 kHz)
Experimental procedure
Tunnel
CPT
~ 37 cm
22 cm
13 cm
18
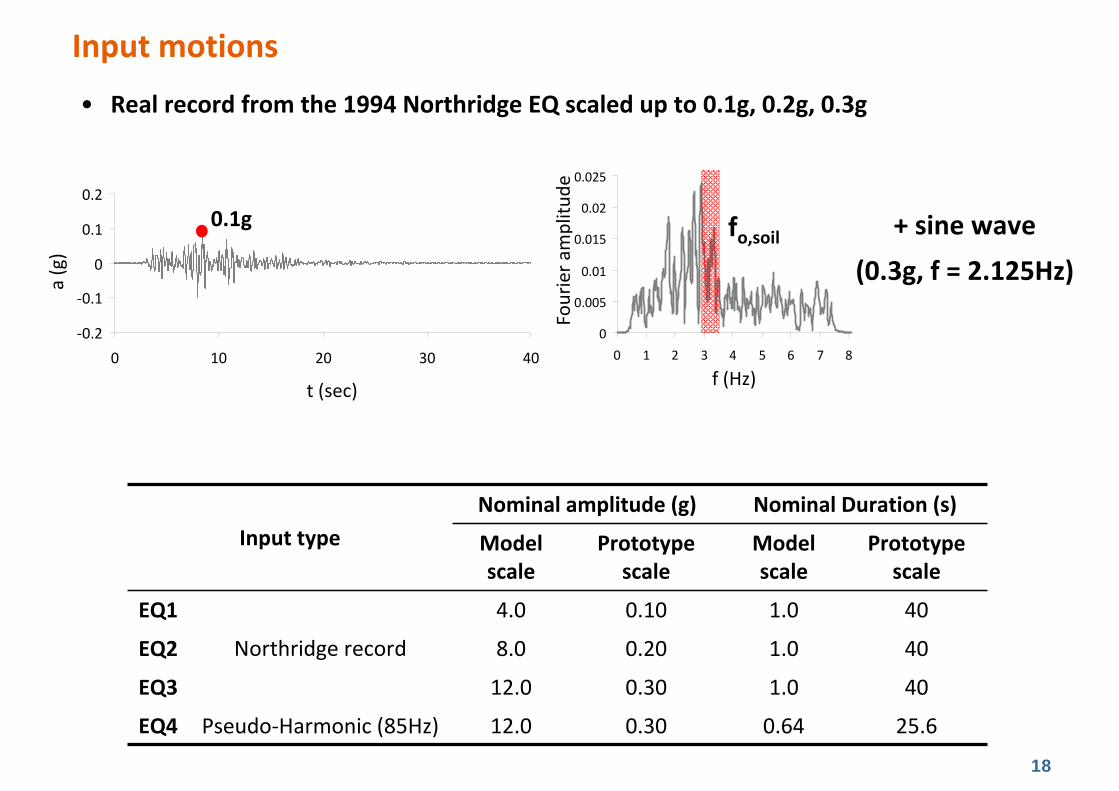
• Real record from the 1994 Northridge EQ scaled up to 0.1g, 0.2g, 0.3g
Input motions
25.60.640.3012.0Pseudo‐Harmonic (85Hz) EQ4
401.00.3012.0EQ3
401.00.208.0EQ2
401.00.104.0
Northridge record
EQ1
Prototype scale
Model scale
Prototype scale
Model scale
Nominal Duration (s)Nominal amplitude (g)Input type
t (sec)
a (g)
‐0.2
‐0.1
0
0.1
0.2
0 10 20 30 40
0.1g
Fourier a
mplitu
de
f (Hz)
0
0.005
0.01
0.015
0.02
0.025
0 1 2 3 4 5 6 7 8
fo,soil + sine wave (0.3g, f = 2.125Hz)
19
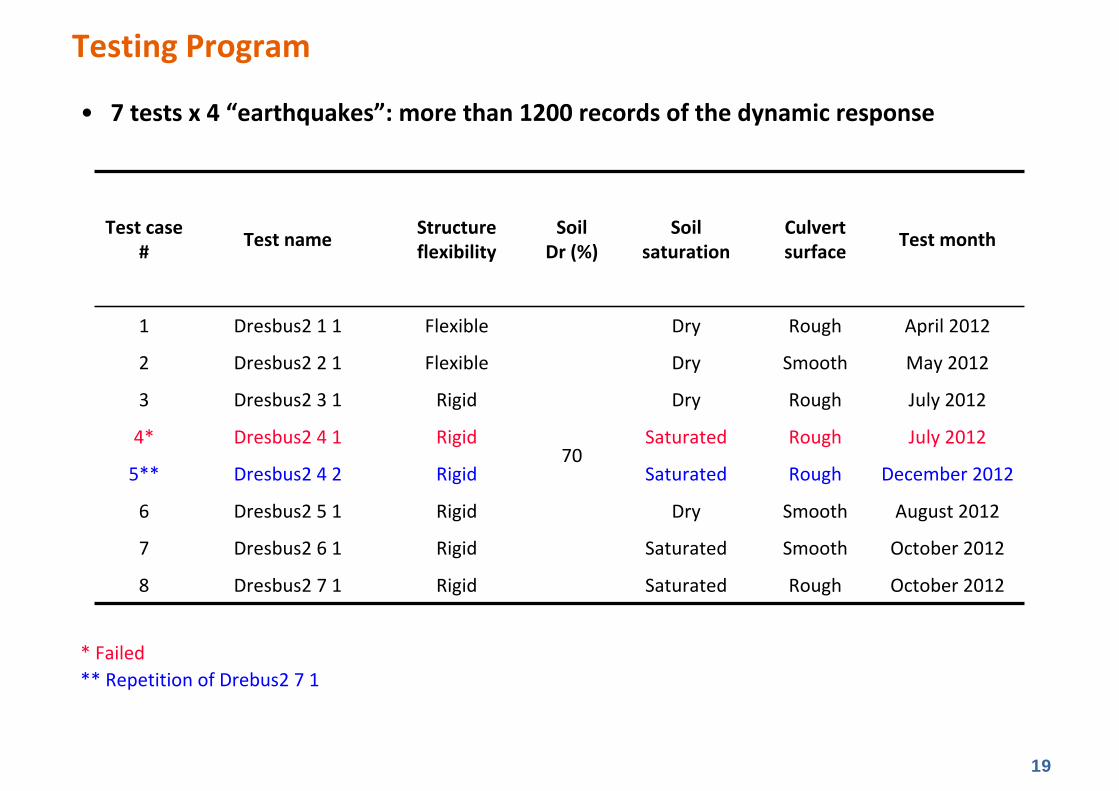
• 7 tests x 4 “earthquakes”: more than 1200 records of the dynamic response
Testing Program
October 2012RoughSaturatedRigidDresbus2 7 18
October 2012SmoothSaturated RigidDresbus2 6 17
August 2012SmoothDryRigidDresbus2 5 16
December 2012RoughSaturated RigidDresbus2 4 25**
July 2012RoughSaturated RigidDresbus2 4 14*
July 2012RoughDry RigidDresbus2 3 13
May 2012SmoothDry FlexibleDresbus2 2 12
April 2012RoughDry
70
Flexible Dresbus2 1 11
Test monthCulvert surface
Soil saturation
SoilDr (%)
Structure flexibilityTest nameTest case
#
* Failed** Repetition of Drebus2 7 1
20
• Acceleration time histories• Band pass filtering (20 ‐ 400 Hz)
• Displacement time histories (double integration)
• Transfer functions (frequency domain analysis)
• Stress‐strain loops – soil shear modulus (Zeghal and Elgamal, 1994, Brennan et al., 2005)
• Tunnels deformation time histories• Band pass filtering (20 ‐ 400 Hz)
• Low pass filtering (400 Hz)
• Pore pressures time histories• Low pass filtering (400 Hz)
Experimental data processing
21
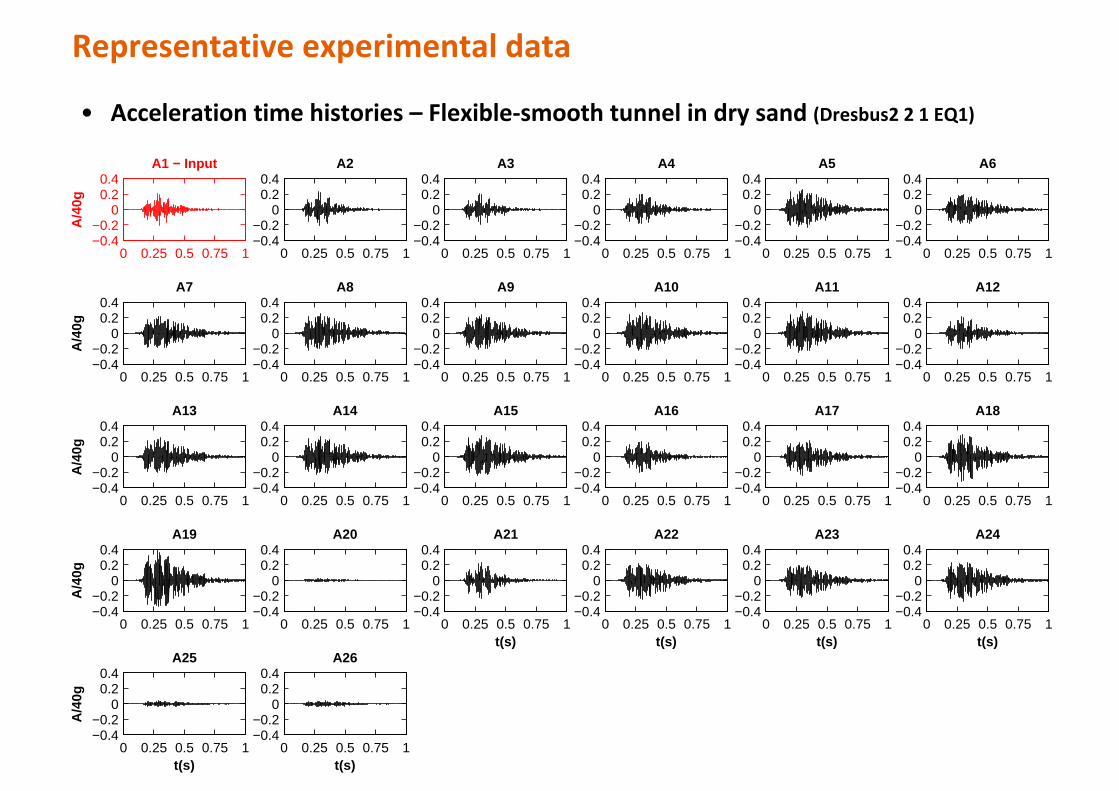
• Acceleration time histories – Flexible‐smooth tunnel in dry sand (Dresbus2 2 1 EQ1)
Representative experimental data
0 0.25 0.5 0.75 1−0.4−0.2
00.20.4
A/4
0g
A1 − Input
0 0.25 0.5 0.75 1−0.4−0.2
00.20.4
A2
0 0.25 0.5 0.75 1−0.4−0.2
00.20.4
A3
0 0.25 0.5 0.75 1−0.4−0.2
00.20.4
A4
0 0.25 0.5 0.75 1−0.4−0.2
00.20.4
A5
0 0.25 0.5 0.75 1−0.4−0.2
00.20.4
A6
0 0.25 0.5 0.75 1−0.4−0.2
00.20.4
A/4
0g
A7
0 0.25 0.5 0.75 1−0.4−0.2
00.20.4
A8
0 0.25 0.5 0.75 1−0.4−0.2
00.20.4
A9
0 0.25 0.5 0.75 1−0.4−0.2
00.20.4
A10
0 0.25 0.5 0.75 1−0.4−0.2
00.20.4
A11
0 0.25 0.5 0.75 1−0.4−0.2
00.20.4
A12
0 0.25 0.5 0.75 1−0.4−0.2
00.20.4
A/4
0g
A13
0 0.25 0.5 0.75 1−0.4−0.2
00.20.4
A14
0 0.25 0.5 0.75 1−0.4−0.2
00.20.4
A15
0 0.25 0.5 0.75 1−0.4−0.2
00.20.4
A16
0 0.25 0.5 0.75 1−0.4−0.2
00.20.4
A17
0 0.25 0.5 0.75 1−0.4−0.2
00.20.4
A18
0 0.25 0.5 0.75 1−0.4−0.2
00.20.4
A/4
0g
A19
0 0.25 0.5 0.75 1−0.4−0.2
00.20.4
A20
0 0.25 0.5 0.75 1−0.4−0.2
00.20.4
t(s)
A21
0 0.25 0.5 0.75 1−0.4−0.2
00.20.4
t(s)
A22
0 0.25 0.5 0.75 1−0.4−0.2
00.20.4
t(s)
A23
0 0.25 0.5 0.75 1−0.4−0.2
00.20.4
t(s)
A24
0 0.25 0.5 0.75 1−0.4−0.2
00.20.4
t(s)
A/4
0g
A25
0 0.25 0.5 0.75 1−0.4−0.2
00.20.4
t(s)
A26
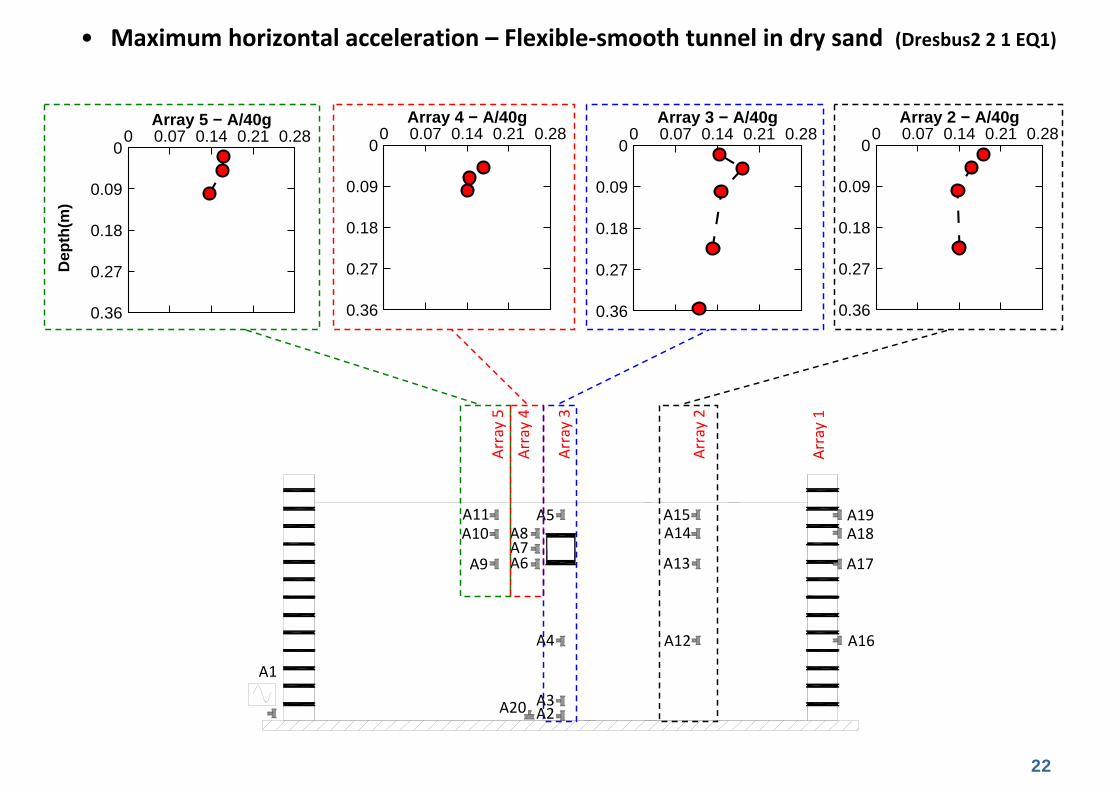
22
• Maximum horizontal acceleration – Flexible‐smooth tunnel in dry sand (Dresbus2 2 1 EQ1)
0 0.07 0.14 0.21 0.280
0.09
0.18
0.27
0.36
Array 2 − A/40g
0
0
0
0
A2A3
A4
A20
A12
A9 A6 A13A7
A10A11
A8 A5
A14A15
Array 1
Array 2
Array 3
Array 4
Array 5
A16
A17
A18A19
A1
0 0.07 0.14 0.21 0.280
0.09
0.18
0.27
0.36
Array 5 − A/40g8 0 0.07 0.14 0.21 0.28
0
0.09
0.18
0.27
0.36
Array 4 − A/40g
Dep
th(m
)
8 0 0.07 0.14 0.21 0.280
0.09
0.18
0.27
0.36
Array 3 − A/40g
0
0
0
0
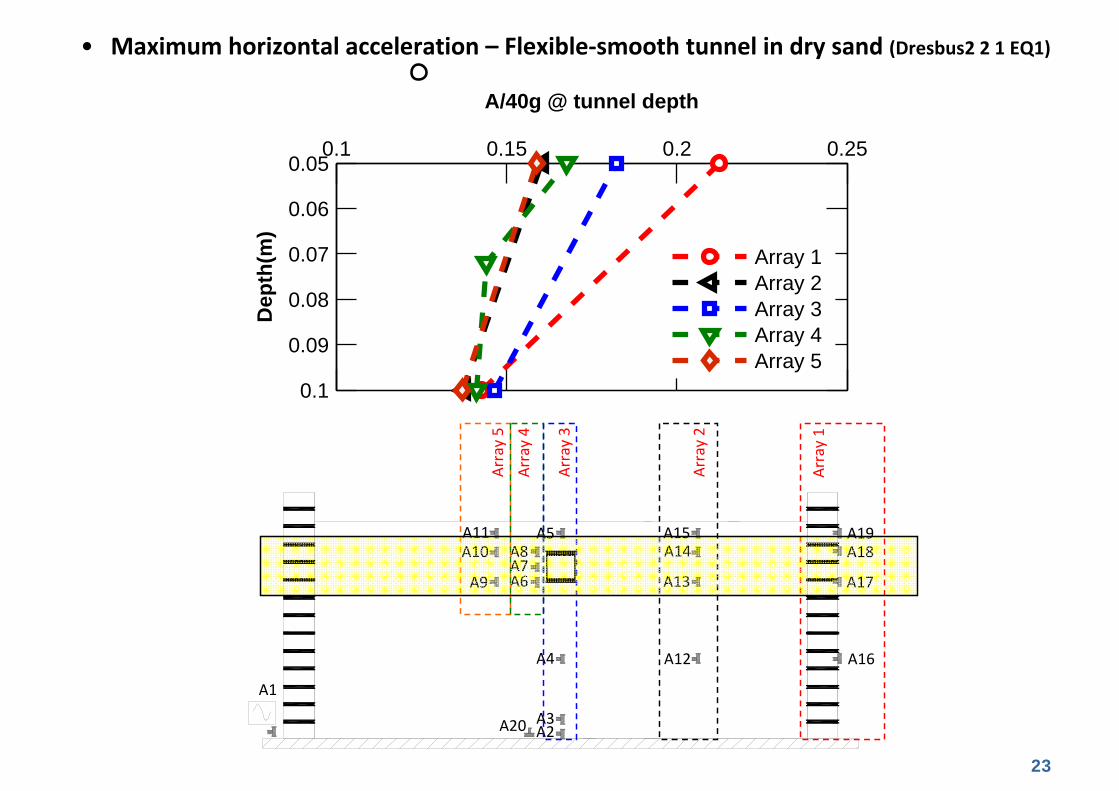
23
• Maximum horizontal acceleration – Flexible‐smooth tunnel in dry sand (Dresbus2 2 1 EQ1)0.36 0.36
0.1 0.15 0.2 0.250.05
0.06
0.07
0.08
0.09
0.1
Dep
th(m
)
A/40g @ tunnel depth
Array 1Array 2Array 3Array 4Array 5
A2A3
A4
A20
A12
A9 A6 A13A7
A10A11
A8 A5
A14A15
Array 1
Array 2
Array 3
Array 4
Array 5
A16
A17
A18A19
A1
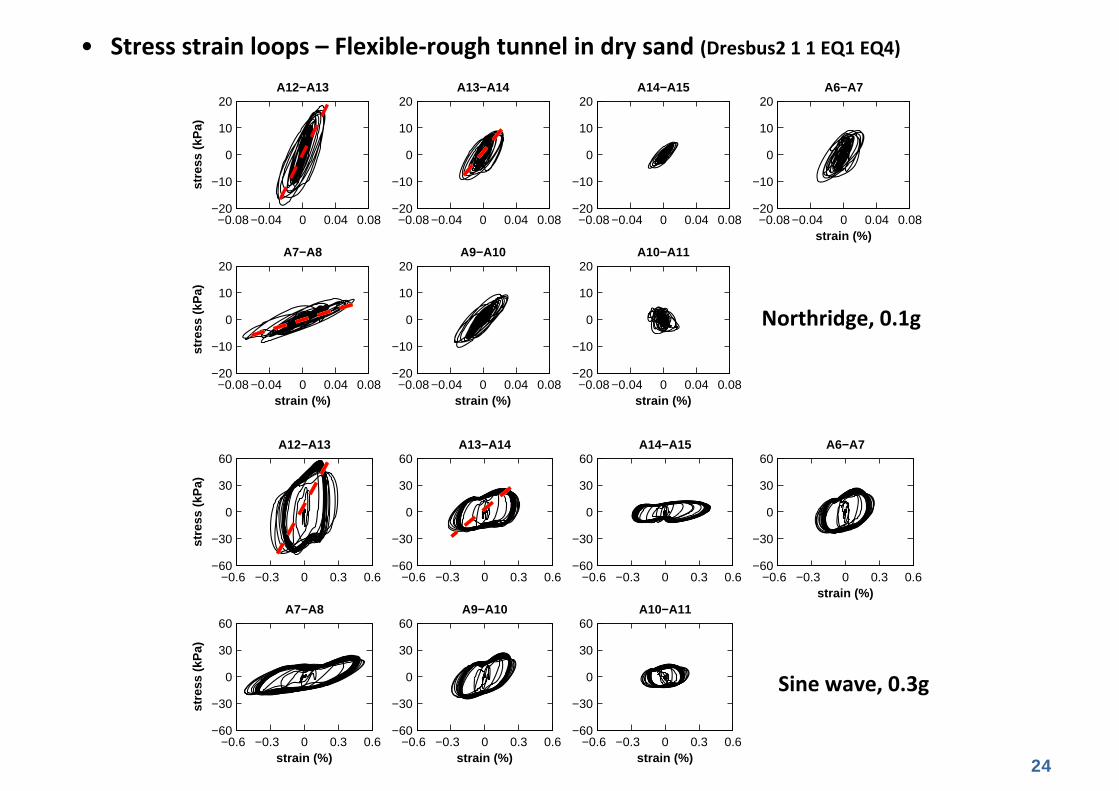
24
• Stress strain loops – Flexible‐rough tunnel in dry sand (Dresbus2 1 1 EQ1 EQ4)
−0.08 −0.04 0 0.04 0.08−20
−10
0
10
20
stre
ss (
kPa)
A12−A13
−0.08 −0.04 0 0.04 0.08−20
−10
0
10
20A13−A14
−0.08 −0.04 0 0.04 0.08−20
−10
0
10
20A14−A15
−0.08 −0.04 0 0.04 0.08−20
−10
0
10
20
strain (%)
A6−A7
−0.08 −0.04 0 0.04 0.08−20
−10
0
10
20
strain (%)
stre
ss (
kPa)
A7−A8
−0.08 −0.04 0 0.04 0.08−20
−10
0
10
20
strain (%)
A9−A10
−0.08 −0.04 0 0.04 0.08−20
−10
0
10
20
strain (%)
A10−A11
−0.6 −0.3 0 0.3 0.6−60
−30
0
30
60
stre
ss (
kPa)
A12−A13
−0.6 −0.3 0 0.3 0.6−60
−30
0
30
60A13−A14
−0.6 −0.3 0 0.3 0.6−60
−30
0
30
60A14−A15
−0.6 −0.3 0 0.3 0.6−60
−30
0
30
60
strain (%)
A6−A7
−0.6 −0.3 0 0.3 0.6−60
−30
0
30
60
strain (%)
stre
ss (
kPa)
A7−A8
−0.6 −0.3 0 0.3 0.6−60
−30
0
30
60
strain (%)
A9−A10
−0.6 −0.3 0 0.3 0.6−60
−30
0
30
60
strain (%)
A10−A11
Northridge, 0.1g
Sine wave, 0.3g
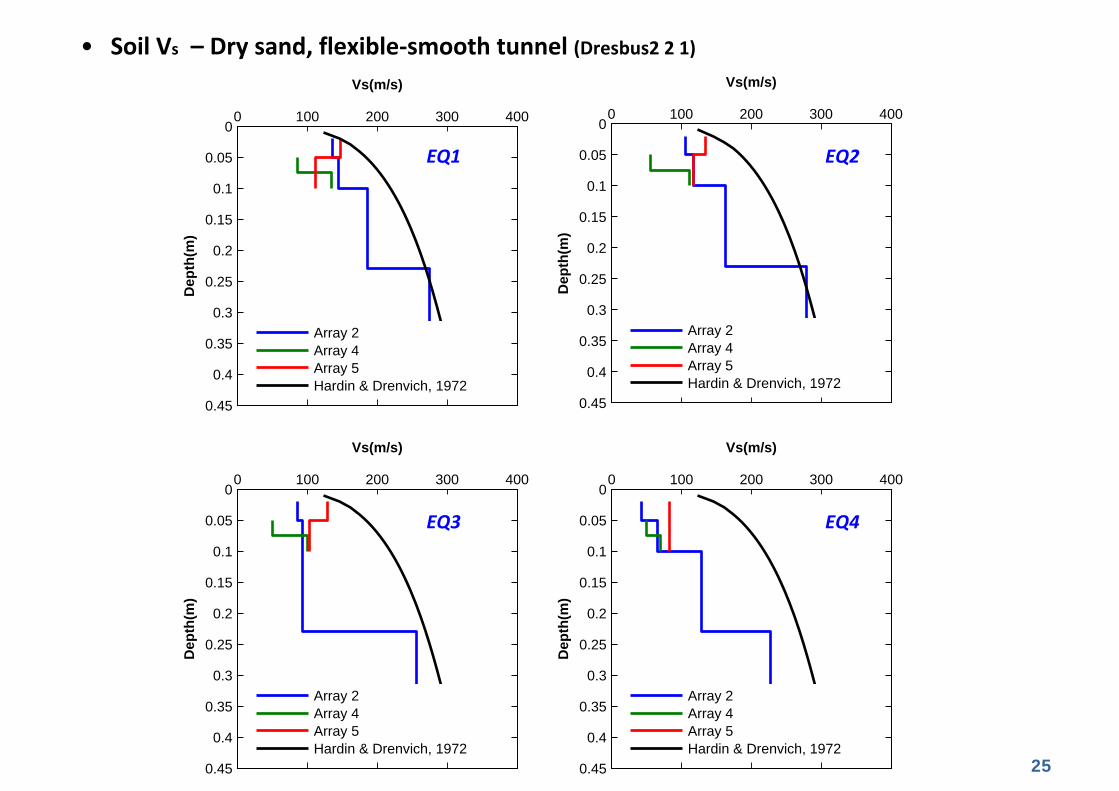
25
• Soil Vs – Dry sand, flexible‐smooth tunnel (Dresbus2 2 1)
0 100 200 300 4000
0.05
0.1
0.15
0.2
0.25
0.3
0.35
0.4
0.45
Dep
th(m
)
Vs(m/s)
Array 2Array 4Array 5Hardin & Drenvich, 1972
0 100 200 300 4000
0.05
0.1
0.15
0.2
0.25
0.3
0.35
0.4
0.45
Dep
th(m
)
Vs(m/s)
Array 2Array 4Array 5Hardin & Drenvich, 1972
0 100 200 300 4000
0.05
0.1
0.15
0.2
0.25
0.3
0.35
0.4
0.45
Dep
th(m
)
Vs(m/s)
Array 2Array 4Array 5Hardin & Drenvich, 1972
0 100 200 300 4000
0.05
0.1
0.15
0.2
0.25
0.3
0.35
0.4
0.45
Dep
th(m
)
Vs(m/s)
Array 2Array 4Array 5Hardin & Drenvich, 1972
EQ1 EQ2
EQ3 EQ4
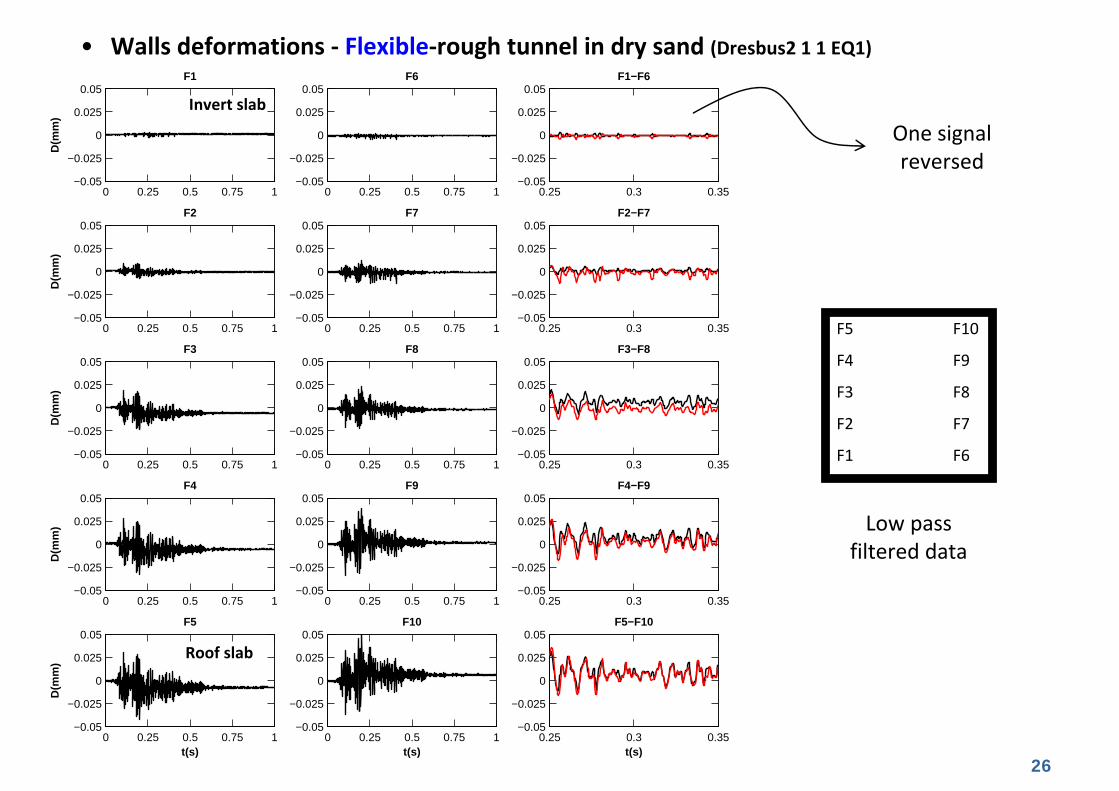
26
• Walls deformations ‐ Flexible‐rough tunnel in dry sand (Dresbus2 1 1 EQ1)
0 0.25 0.5 0.75 1−0.05
−0.025
0
0.025
0.05
D(m
m)
F1
0 0.25 0.5 0.75 1−0.05
−0.025
0
0.025
0.05F6
0.25 0.3 0.35−0.05
−0.025
0
0.025
0.05F1−F6
0 0.25 0.5 0.75 1−0.05
−0.025
0
0.025
0.05
D(m
m)
F2
0 0.25 0.5 0.75 1−0.05
−0.025
0
0.025
0.05F7
0.25 0.3 0.35−0.05
−0.025
0
0.025
0.05F2−F7
0 0.25 0.5 0.75 1−0.05
−0.025
0
0.025
0.05
D(m
m)
F3
0 0.25 0.5 0.75 1−0.05
−0.025
0
0.025
0.05F8
0.25 0.3 0.35−0.05
−0.025
0
0.025
0.05F3−F8
0 0.25 0.5 0.75 1−0.05
−0.025
0
0.025
0.05
D(m
m)
F4
0 0.25 0.5 0.75 1−0.05
−0.025
0
0.025
0.05F9
0.25 0.3 0.35−0.05
−0.025
0
0.025
0.05F4−F9
0 0.25 0.5 0.75 1−0.05
−0.025
0
0.025
0.05
t(s)
D(m
m)
F5
0 0.25 0.5 0.75 1−0.05
−0.025
0
0.025
0.05
t(s)
F10
0.25 0.3 0.35−0.05
−0.025
0
0.025
0.05
t(s)
F5−F10
F5
F4
F3
F2
F1
F10
F9
F8
F7
F6
One signal reversed
Low pass filtered data
Invert slab
Roof slab
27
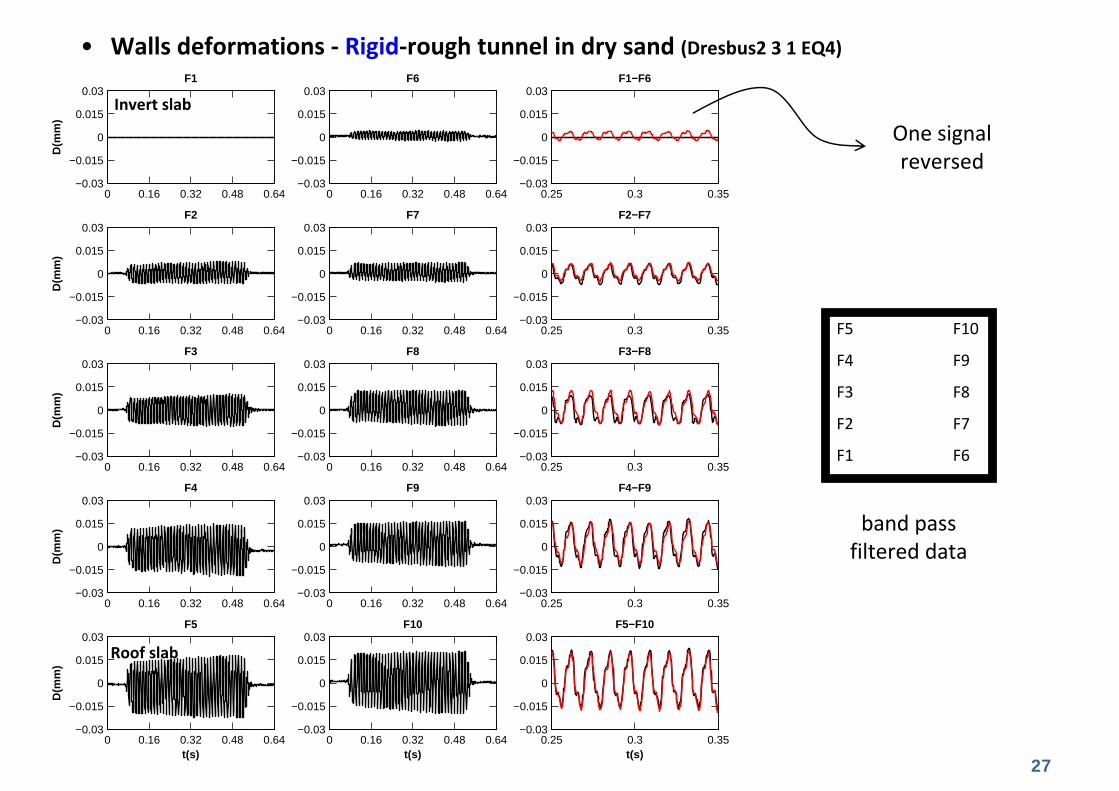
• Walls deformations ‐ Rigid‐rough tunnel in dry sand (Dresbus2 3 1 EQ4)
F5
F4
F3
F2
F1
F10
F9
F8
F7
F6
One signal reversed
band pass filtered data
0 0.16 0.32 0.48 0.64−0.03
−0.015
0
0.015
0.03
D(m
m)
F1
0 0.16 0.32 0.48 0.64−0.03
−0.015
0
0.015
0.03F6
0.25 0.3 0.35−0.03
−0.015
0
0.015
0.03F1−F6
0 0.16 0.32 0.48 0.64−0.03
−0.015
0
0.015
0.03
D(m
m)
F2
0 0.16 0.32 0.48 0.64−0.03
−0.015
0
0.015
0.03F7
0.25 0.3 0.35−0.03
−0.015
0
0.015
0.03F2−F7
0 0.16 0.32 0.48 0.64−0.03
−0.015
0
0.015
0.03
D(m
m)
F3
0 0.16 0.32 0.48 0.64−0.03
−0.015
0
0.015
0.03F8
0.25 0.3 0.35−0.03
−0.015
0
0.015
0.03F3−F8
0 0.16 0.32 0.48 0.64−0.03
−0.015
0
0.015
0.03
D(m
m)
F4
0 0.16 0.32 0.48 0.64−0.03
−0.015
0
0.015
0.03F9
0.25 0.3 0.35−0.03
−0.015
0
0.015
0.03F4−F9
0 0.16 0.32 0.48 0.64−0.03
−0.015
0
0.015
0.03
t(s)
D(m
m)
F5
0 0.16 0.32 0.48 0.64−0.03
−0.015
0
0.015
0.03
t(s)
F10
0.25 0.3 0.35−0.03
−0.015
0
0.015
0.03
t(s)
F5−F10
Invert slab
Roof slab
28
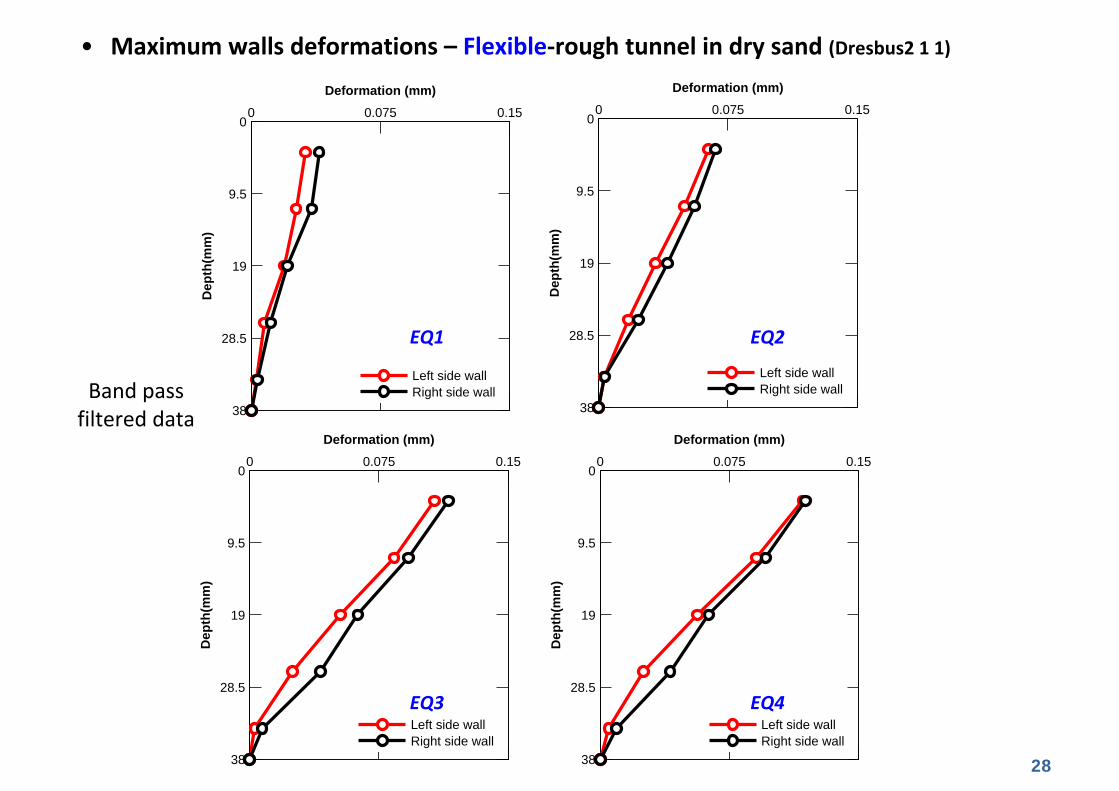
• Maximum walls deformations – Flexible‐rough tunnel in dry sand (Dresbus2 1 1)
Band pass filtered data
0 0.075 0.150
9.5
19
28.5
38
Deformation (mm)
Dep
th(m
m)
Left side wallRight side wall
0 0.075 0.150
9.5
19
28.5
38
Deformation (mm)
Dep
th(m
m)
Left side wallRight side wall
0 0.075 0.150
9.5
19
28.5
38
Deformation (mm)
Dep
th(m
m)
Left side wallRight side wall
0 0.075 0.150
9.5
19
28.5
38
Deformation (mm)
Dep
th(m
m)
Left side wallRight side wall
EQ1 EQ2
EQ3 EQ4
29
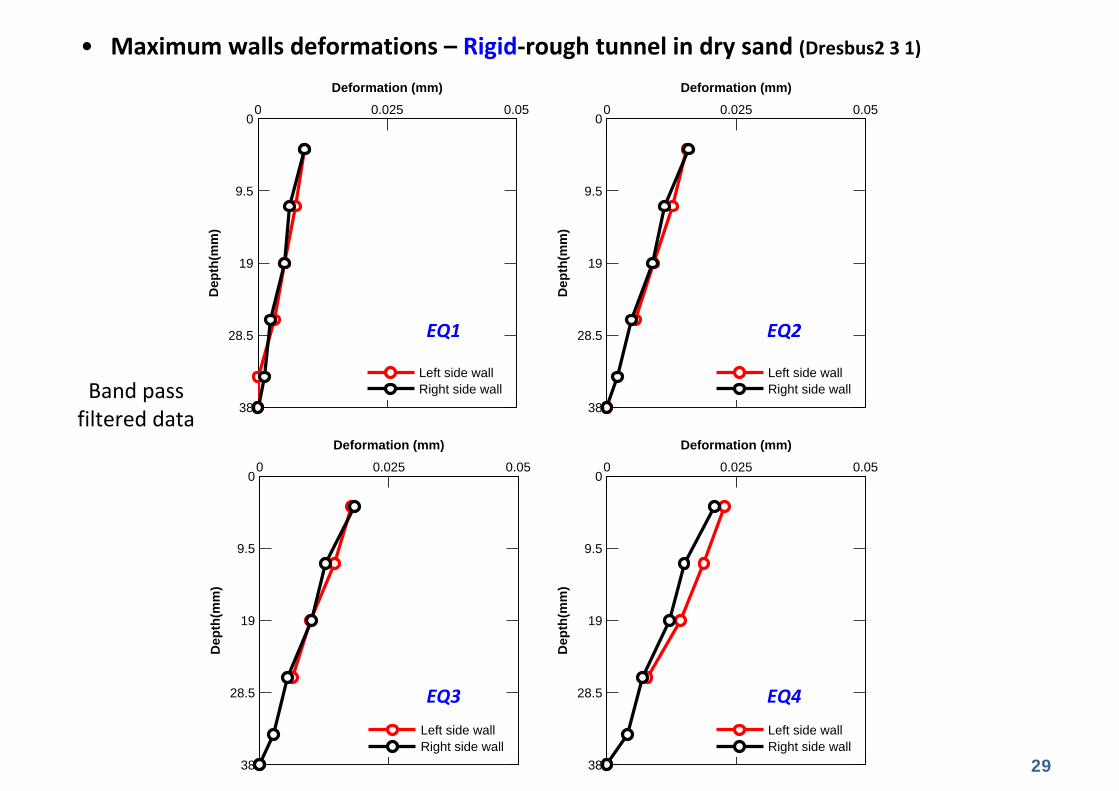
• Maximum walls deformations – Rigid‐rough tunnel in dry sand (Dresbus2 3 1)
Band pass filtered data
0 0.025 0.050
9.5
19
28.5
38
Deformation (mm)
Dep
th(m
m)
Left side wallRight side wall
0 0.025 0.050
9.5
19
28.5
38
Deformation (mm)
Dep
th(m
m)
Left side wallRight side wall
0 0.025 0.050
9.5
19
28.5
38
Deformation (mm)
Dep
th(m
m)
Left side wallRight side wall
0 0.025 0.050
9.5
19
28.5
38
Deformation (mm)
Dep
th(m
m)
Left side wallRight side wall
EQ1 EQ2
EQ3 EQ4
30
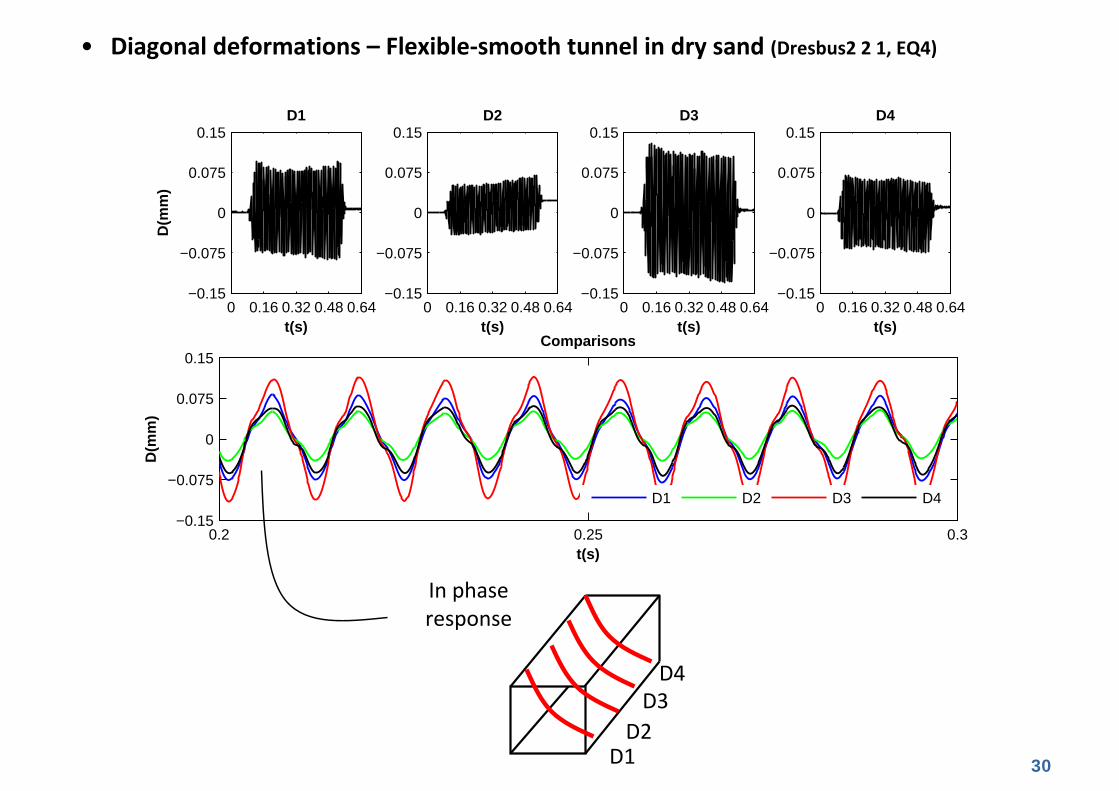
• Diagonal deformations – Flexible‐smooth tunnel in dry sand (Dresbus2 2 1, EQ4)
0 0.16 0.32 0.48 0.64−0.15
−0.075
0
0.075
0.15
t(s)
D(m
m)
D1
0 0.16 0.32 0.48 0.64−0.15
−0.075
0
0.075
0.15
t(s)
D2
0 0.16 0.32 0.48 0.64−0.15
−0.075
0
0.075
0.15
t(s)
D3
0 0.16 0.32 0.48 0.64−0.15
−0.075
0
0.075
0.15
t(s)
D4
0.2 0.25 0.3−0.15
−0.075
0
0.075
0.15
t(s)
D(m
m)
Comparisons
D1 D2 D3 D4
In phase response
D1
D4D3
D2
31
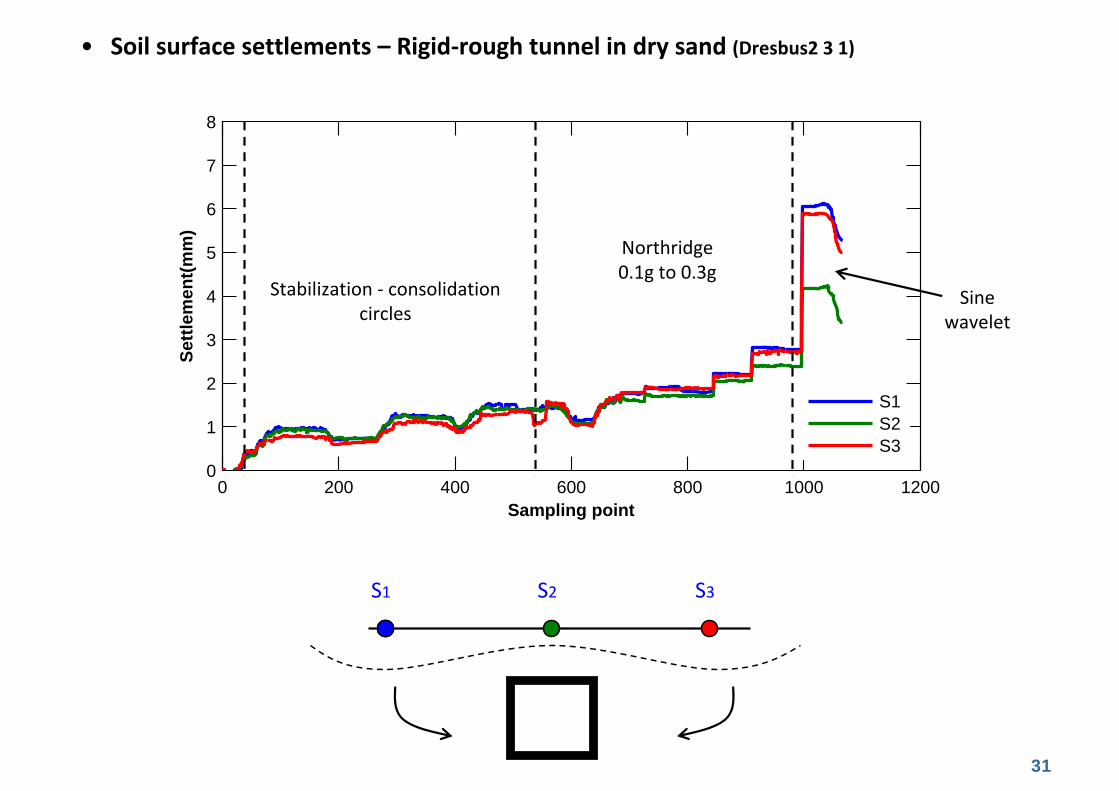
• Soil surface settlements – Rigid‐rough tunnel in dry sand (Dresbus2 3 1)
S1 S2 S3
0 200 400 600 800 1000 12000
1
2
3
4
5
6
7
8
Sampling point
Set
tlem
ent(
mm
)
S1S2S3
Stabilization ‐ consolidation circles
Northridge 0.1g to 0.3g
Sine wavelet
32
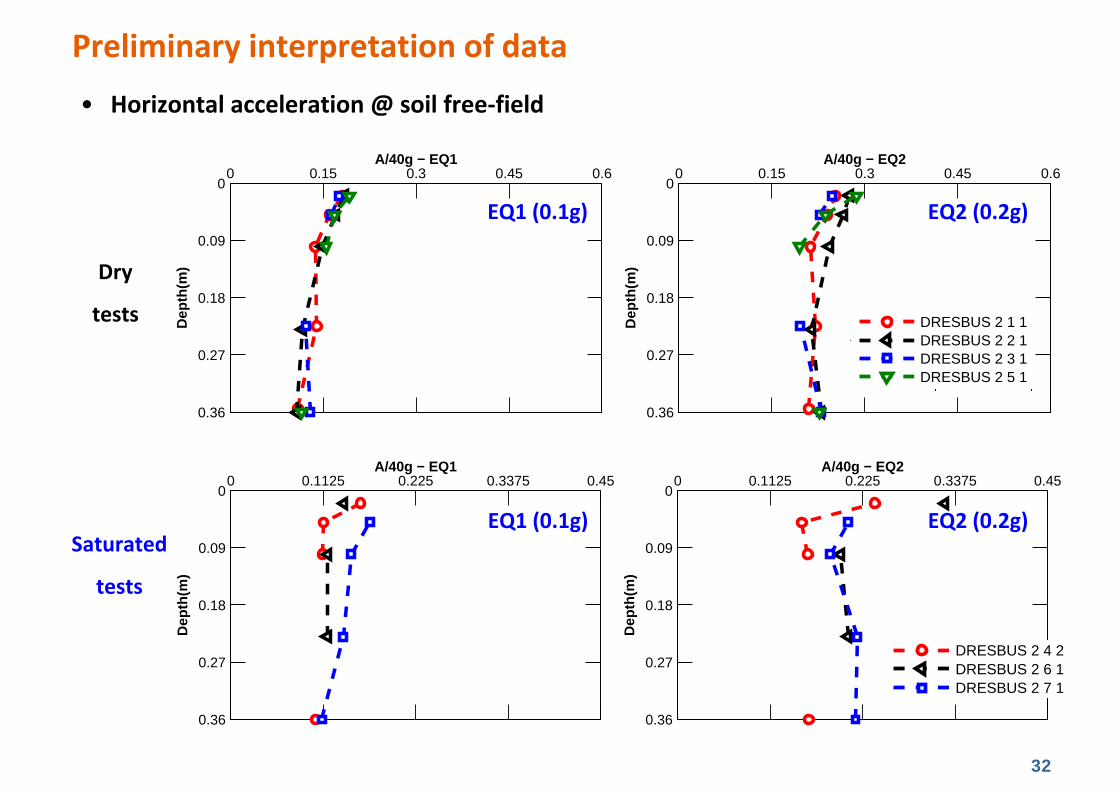
• Horizontal acceleration @ soil free‐field
0 0.1125 0.225 0.3375 0.450
0.09
0.18
0.27
0.36
Dep
th(m
)
A/40g − EQ10 0.1125 0.225 0.3375 0.45
0
0.09
0.18
0.27
0.36
Dep
th(m
)
A/40g − EQ2
DRESBUS 2 4 2DRESBUS 2 6 1DRESBUS 2 7 1
0 0.15 0.3 0.45 0.60
0.09
0.18
0.27
0.36
Dep
th(m
)
A/40g − EQ10 0.15 0.3 0.45 0.6
0
0.09
0.18
0.27
0.36
Dep
th(m
)
A/40g − EQ2
EQ1 (0.1g) EQ2 (0.2g)
DRESBUS 2 1 1DRESBUS 2 2 1DRESBUS 2 3 1DRESBUS 2 5 1
EQ1 (0.1g) EQ2 (0.2g)
Dry
tests
Saturated
tests
Preliminary interpretation of data
33
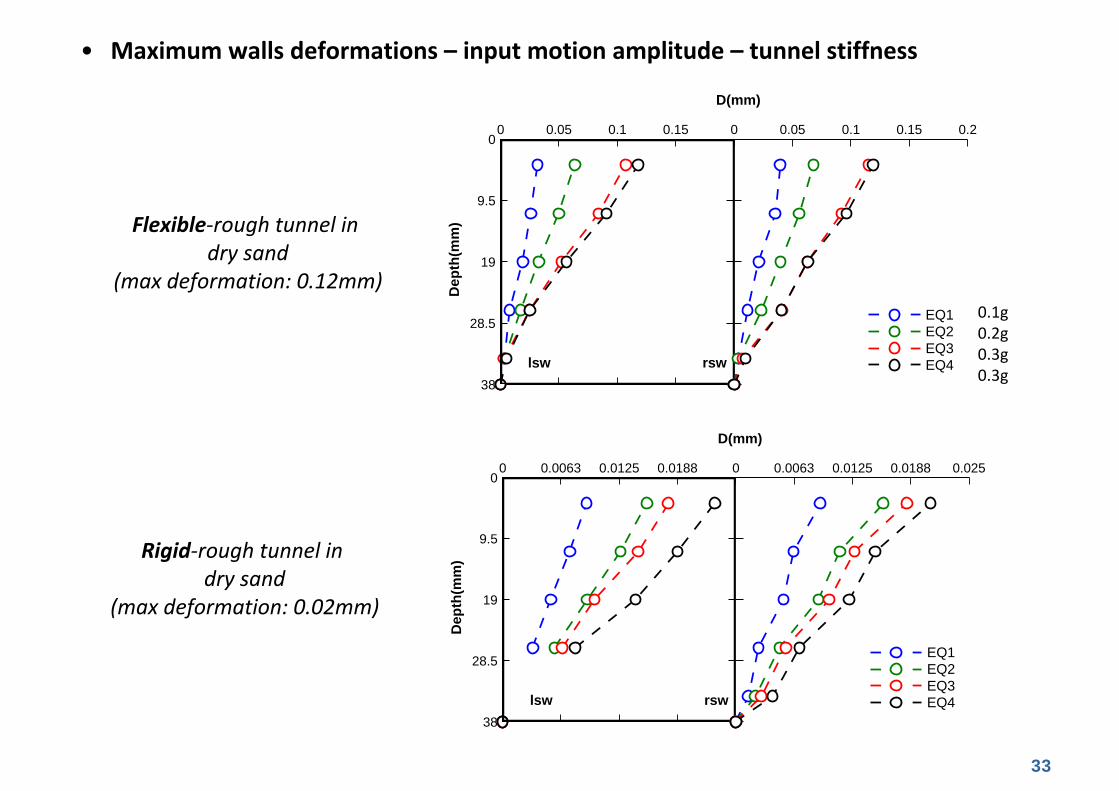
• Maximum walls deformations – input motion amplitude – tunnel stiffness
0 0.05 0.1 0.150
9.5
19
28.5
38
Dep
th(m
m)
0 0.05 0.1 0.15 0.2
EQ1EQ2EQ3EQ4
D(mm)
lsw rsw
Flexible‐rough tunnel in dry sand
(max deformation: 0.12mm)
0 0.0063 0.0125 0.01880
9.5
19
28.5
38
Dep
th(m
m)
0 0.0063 0.0125 0.0188 0.025
EQ1EQ2EQ3EQ4
D(mm)
lsw rsw
Rigid‐rough tunnel in dry sand
(max deformation: 0.02mm)
0.1g 0.2g 0.3g 0.3g
34
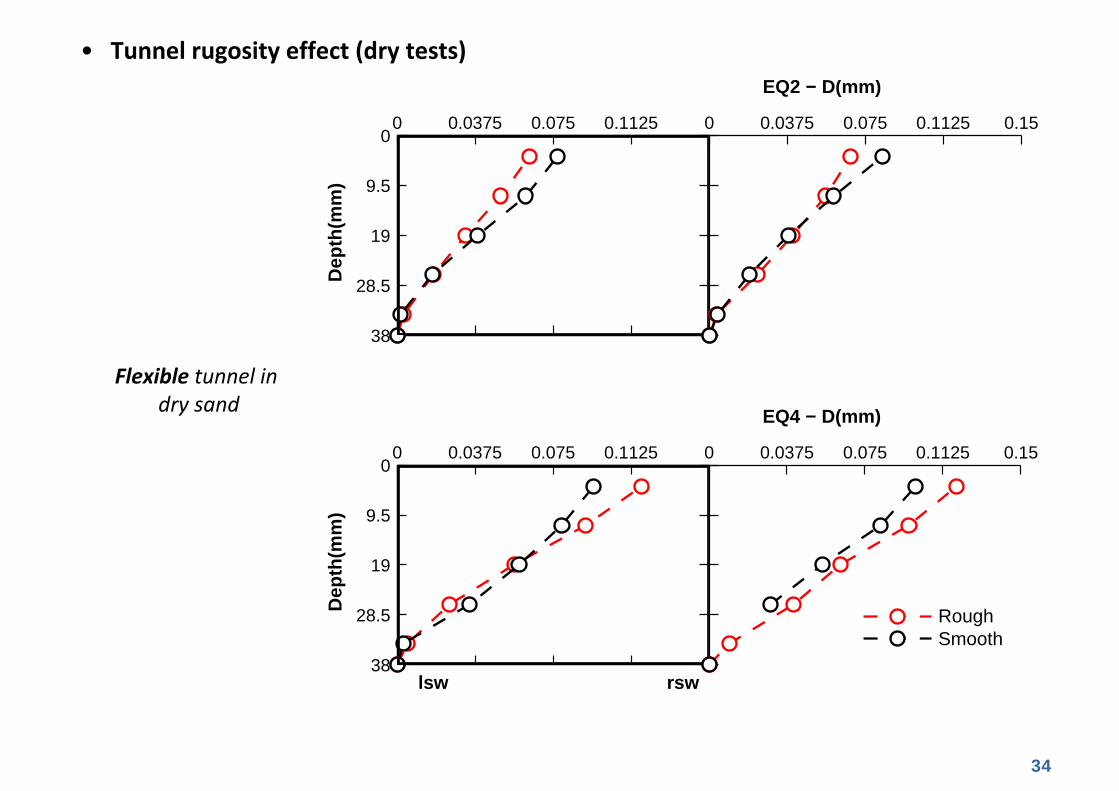
• Tunnel rugosity effect (dry tests)
0 0.0375 0.075 0.11250
9.5
19
28.5
38D
epth
(mm
)
0 0.0375 0.075 0.1125 0.15
EQ2 − D(mm)
EQ3 − D(mm)Flexible tunnel in
dry sand
0 0.0375 0.075 0.11250
9.5
19
28.5
38
Dep
th(m
m)
0 0.0375 0.075 0.1125 0.15
38
RoughSmooth
EQ4 − D(mm)
lsw rsw
35
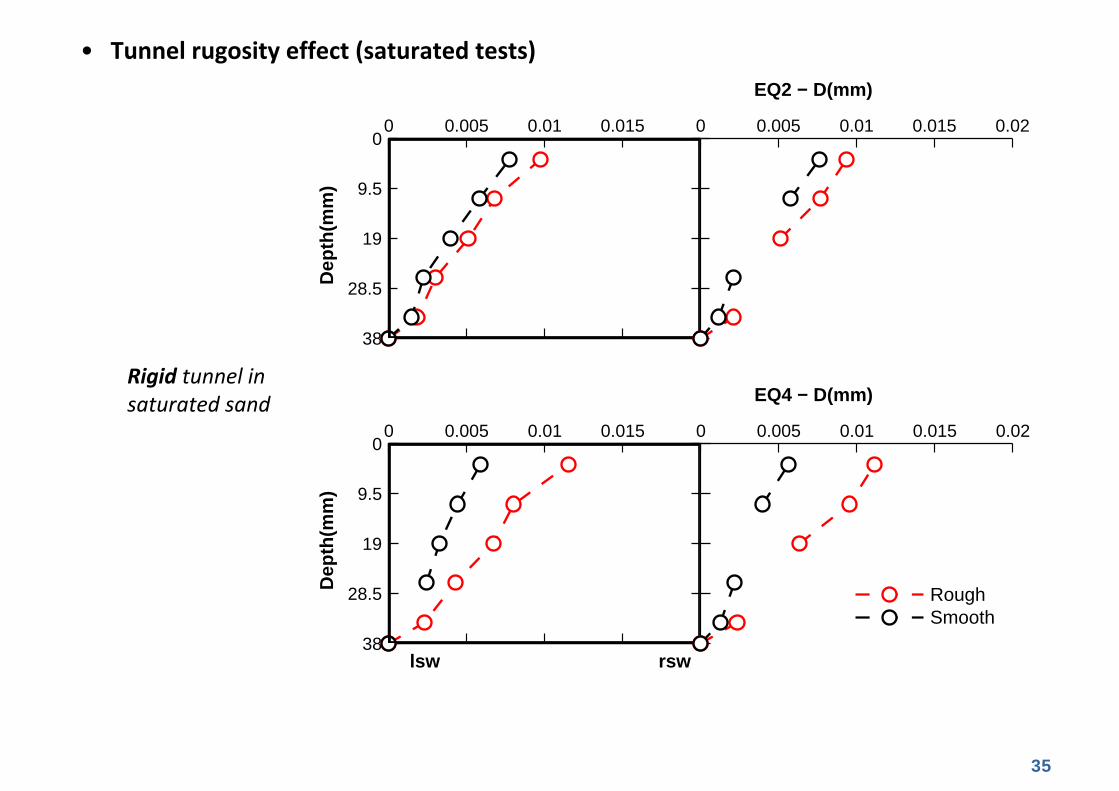
• Tunnel rugosity effect (saturated tests)
Rigid tunnel in saturated sand
0 0.005 0.01 0.0150
9.5
19
28.5
38D
epth
(mm
)
0 0.005 0.01 0.015 0.02
38EQ2 − D(mm)
EQ3 − D(mm)
0 0.005 0.01 0.0150
9.5
19
28.5
38
Dep
th(m
m)
0 0.005 0.01 0.015 0.02
38
RoughSmooth
EQ4 − D(mm)
lsw rsw
36
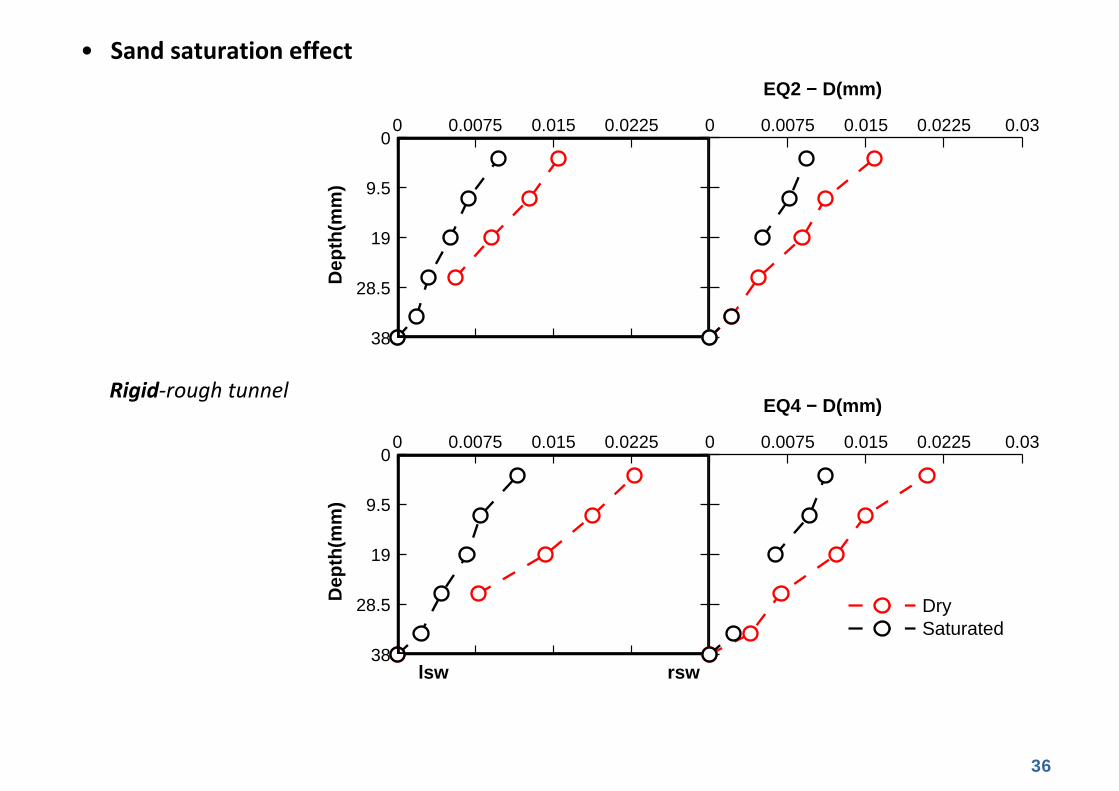
• Sand saturation effect
Rigid‐rough tunnel
0 0.0075 0.015 0.02250
9.5
19
28.5
38
Dep
th(m
m)
0 0.0075 0.015 0.0225 0.03
38
DrySaturated
EQ4 − D(mm)
lsw rsw
0 0.0075 0.015 0.02250
9.5
19
28.5
38D
epth
(mm
)
0 0.0075 0.015 0.0225 0.03
38EQ2 − D(mm)
EQ3 − D(mm)
37
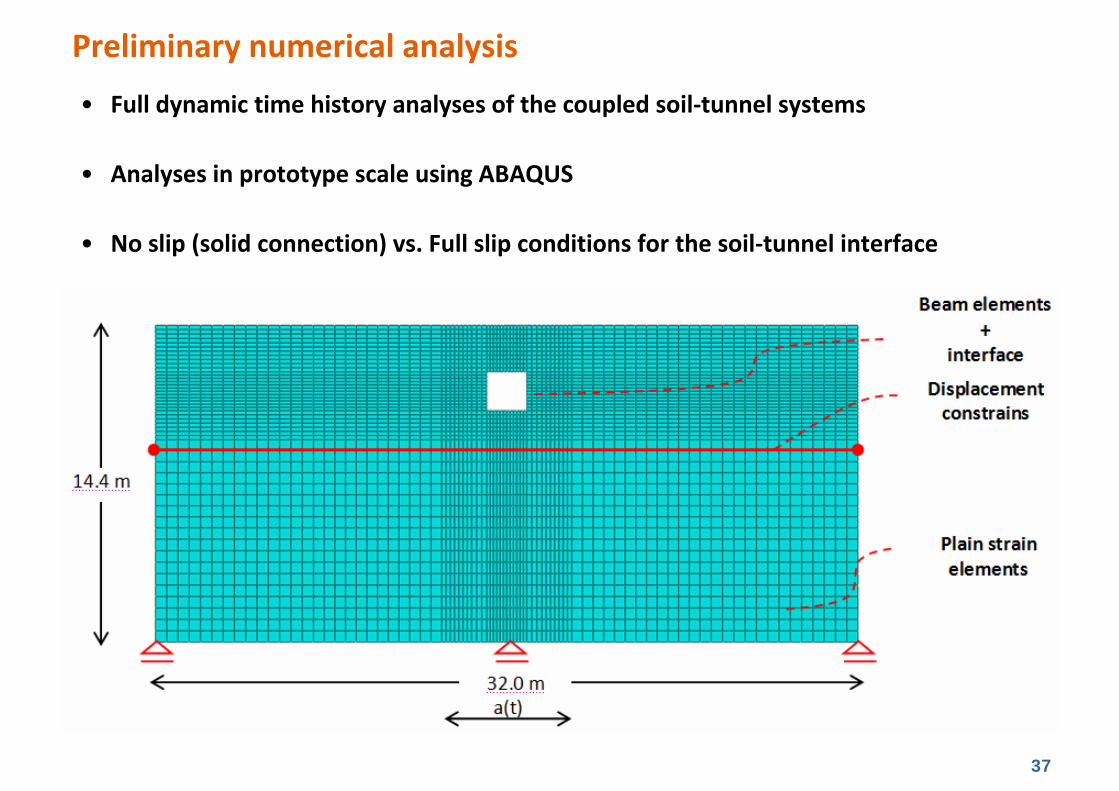
• Full dynamic time history analyses of the coupled soil‐tunnel systems
• Analyses in prototype scale using ABAQUS
• No slip (solid connection) vs. Full slip conditions for the soil‐tunnel interface
Preliminary numerical analysis
38
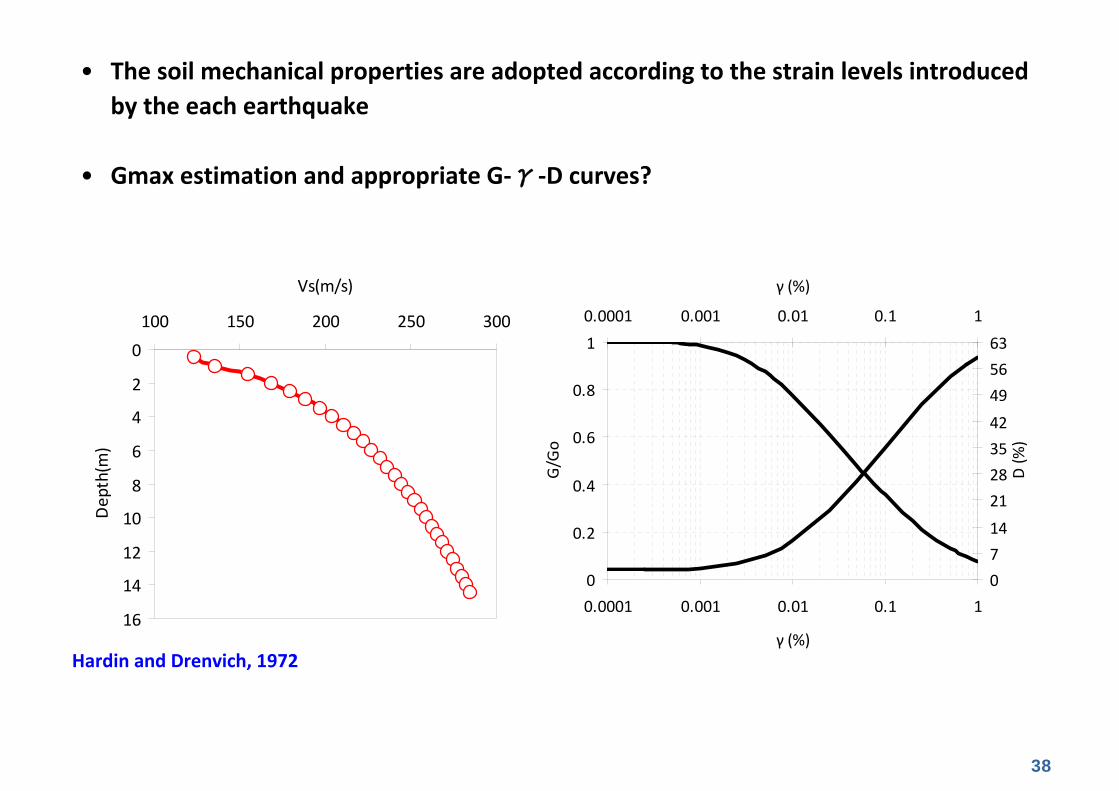
• The soil mechanical properties are adopted according to the strain levels introduced by the each earthquake
• Gmax estimation and appropriate G‐γ‐D curves?
0
2
4
6
8
10
12
14
16
100 150 200 250 300
Vs(m/s)
Depth(m
)
0
0.2
0.4
0.6
0.8
1
0.0001 0.001 0.01 0.1 1
γ (%)
G/Go
0714
21283542
495663
0.0001 0.001 0.01 0.1 1
γ (%)
D (%
)
Hardin and Drenvich, 1972
39
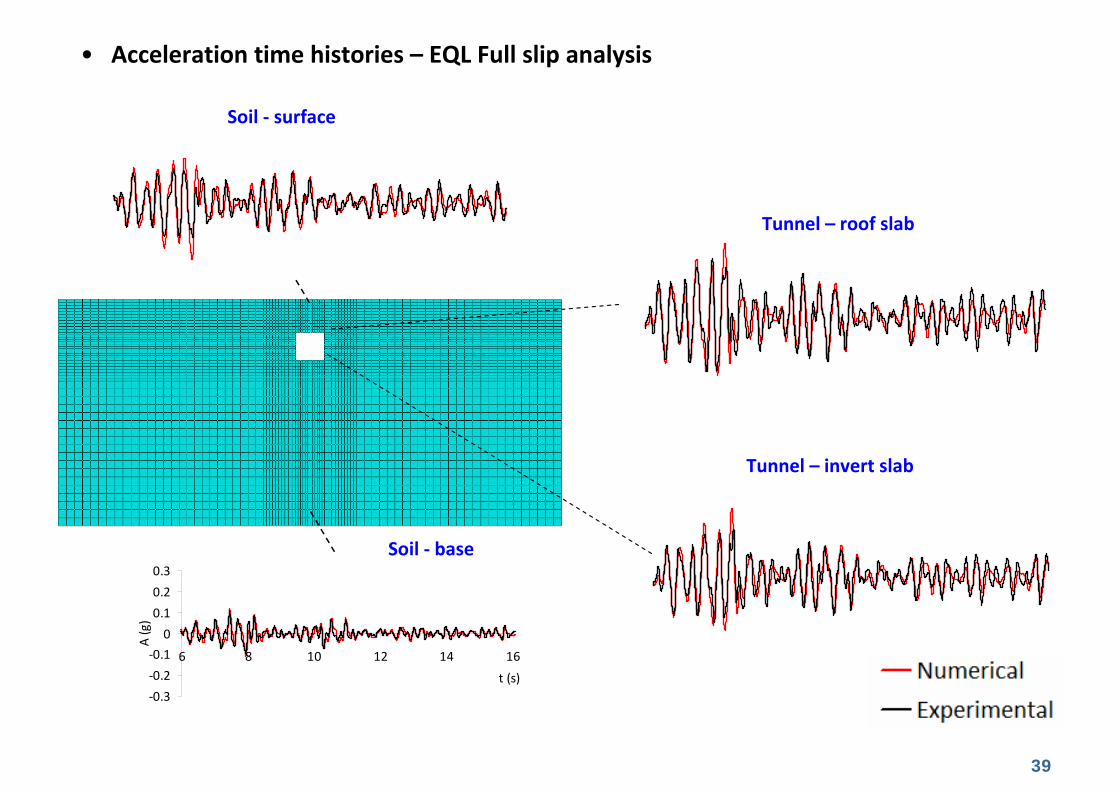
Tunnel – roof slab
Soil ‐ surface
‐0.3‐0.2‐0.1
00.10.20.3
6 8 10 12 14 16
t (s)
A (g)
• Acceleration time histories – EQL Full slip analysis
Soil ‐ base
Tunnel – invert slab
40
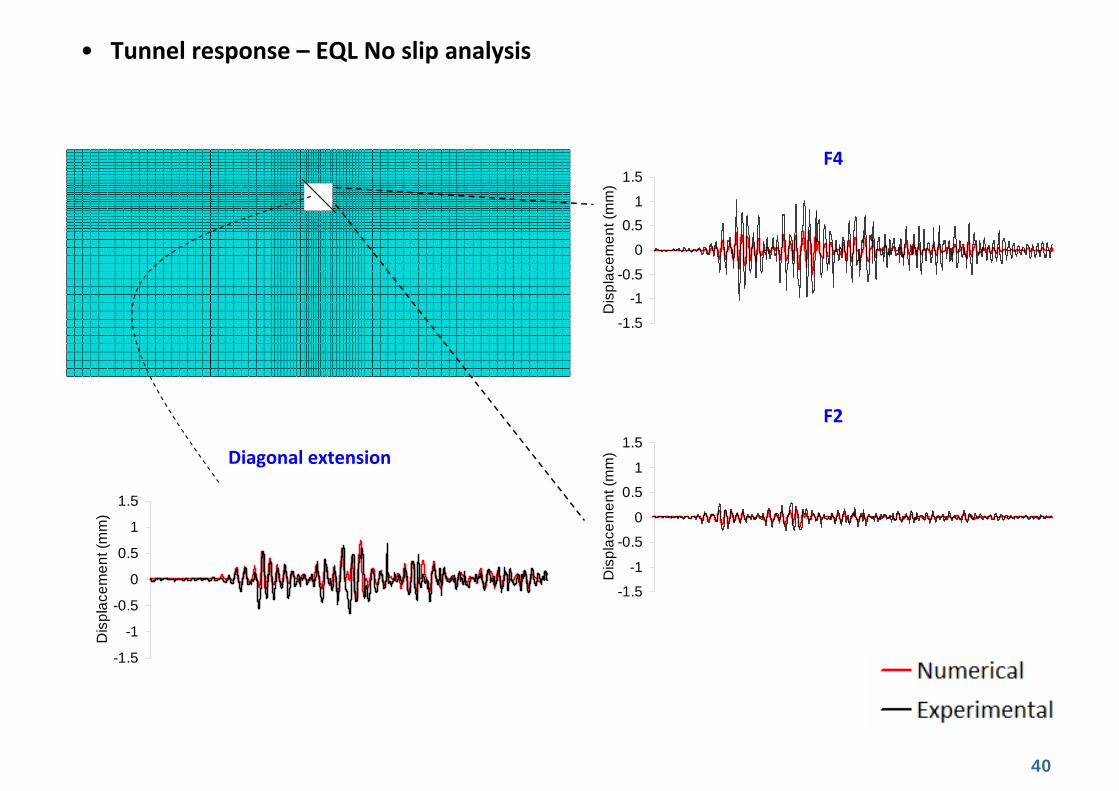
• Tunnel response – EQL No slip analysis
Diagonal extension
-1.5-1
-0.50
0.51
1.5
Dis
plac
emen
t (m
m)
-1.5-1
-0.50
0.51
1.5
Dis
plac
emen
t (m
m)
F4
F2
-1.5
-1
-0.5
0
0.5
1
1.5
Dis
plac
emen
t (m
m)
41
TA Project: TUNNELSEIS

42
Project partners and research team
TA User team
• Kyriazis Pitilakis (Professor, AUTH) – Lead user
• Grigoris Tsinidis (Civil Engineer MSc, PhD candidate AUTH) • Anastasios Anastasiadis (Assistant Professor, AUTH)• Dimitris Pitilakis (Assistant Professor, AUTH)• Roberto Paolucci (Professor, POLITECNICO DI MILANO)
Access Provider: Schofield Centre, UCAM, UK
• Gopal Madabhushi (Professor, UCAM)• Charles Heron (PhD candidate, UCAM)• Mark Stringer (Dr Civil Engineer, UCAM)
43
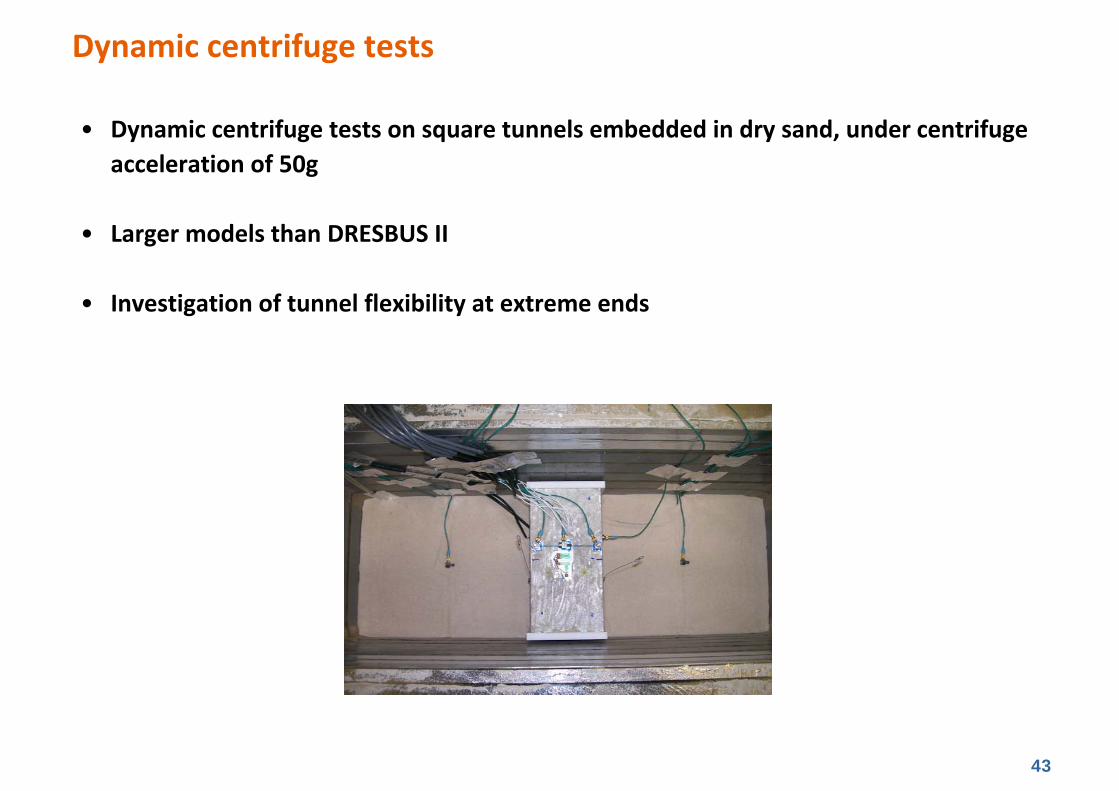
• Dynamic centrifuge tests on square tunnels embedded in dry sand, under centrifuge acceleration of 50g
• Larger models than DRESBUS II
• Investigation of tunnel flexibility at extreme ends
Dynamic centrifuge tests
44
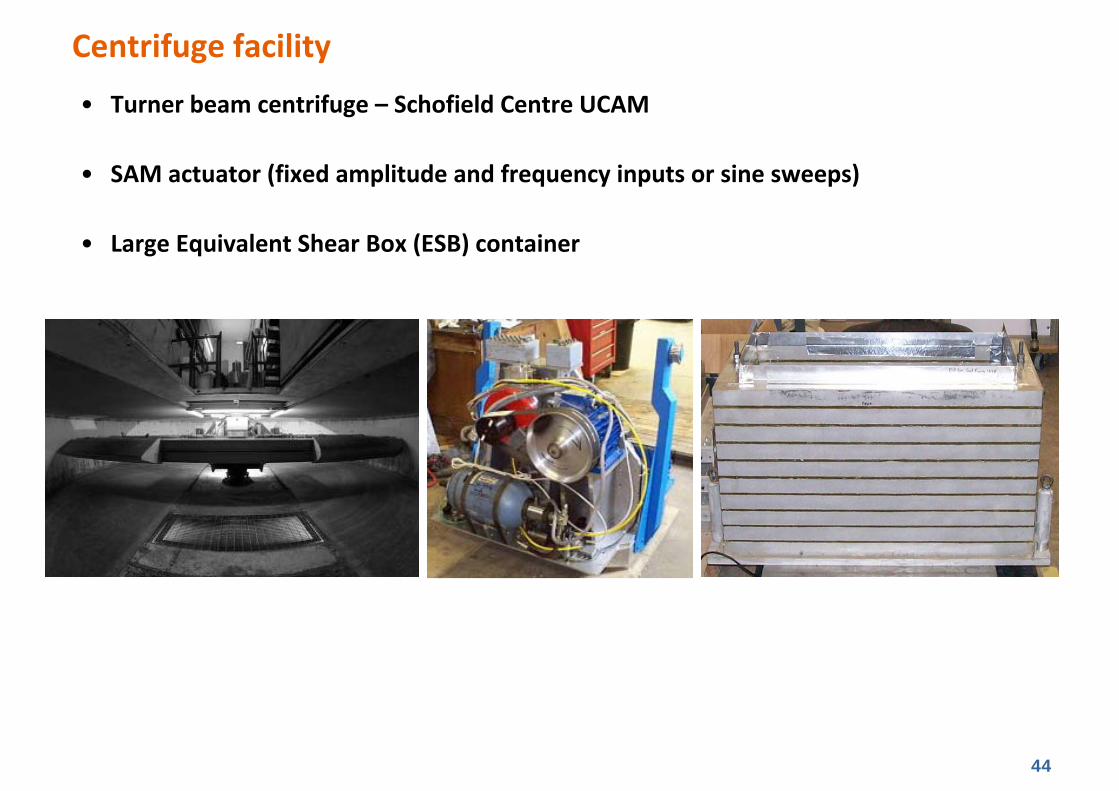
• Turner beam centrifuge – Schofield Centre UCAM
• SAM actuator (fixed amplitude and frequency inputs or sine sweeps)
• Large Equivalent Shear Box (ESB) container
Centrifuge facility
45
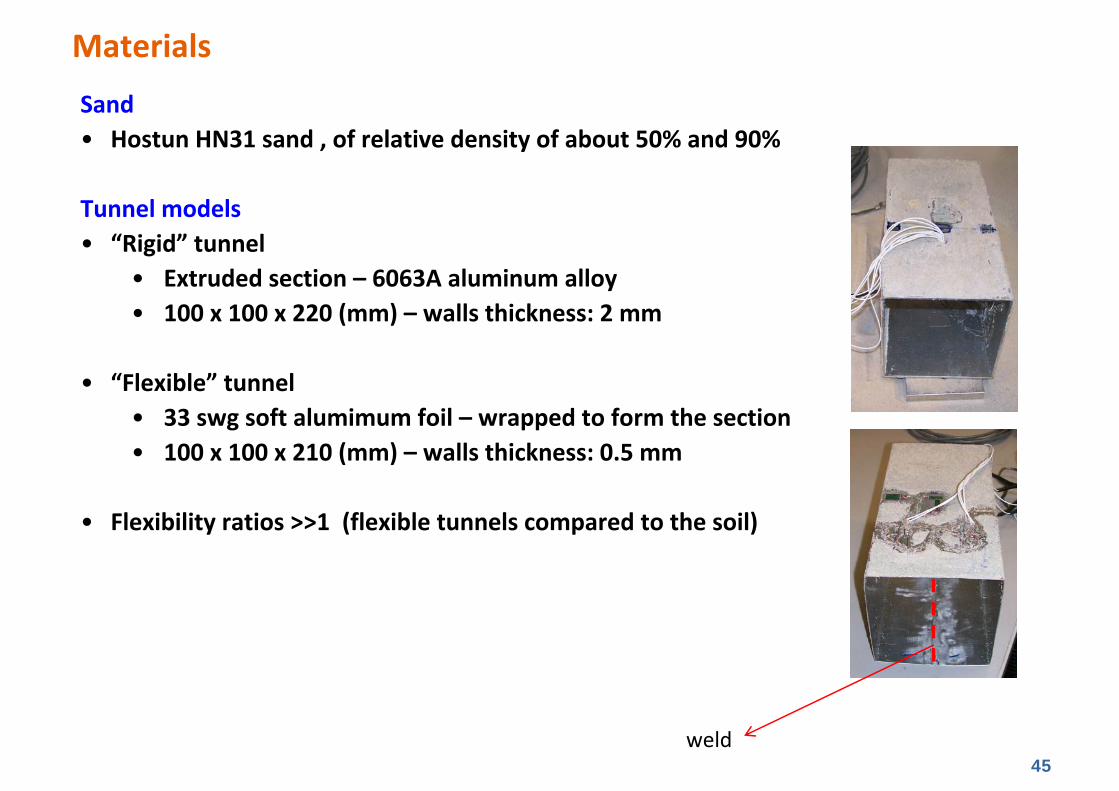
Sand• Hostun HN31 sand , of relative density of about 50% and 90%
Tunnel models• “Rigid” tunnel
• Extruded section – 6063A aluminum alloy• 100 x 100 x 220 (mm) – walls thickness: 2 mm
• “Flexible” tunnel• 33 swg soft alumimum foil – wrapped to form the section • 100 x 100 x 210 (mm) – walls thickness: 0.5 mm
• Flexibility ratios >>1 (flexible tunnels compared to the soil)
Materials
weld
46
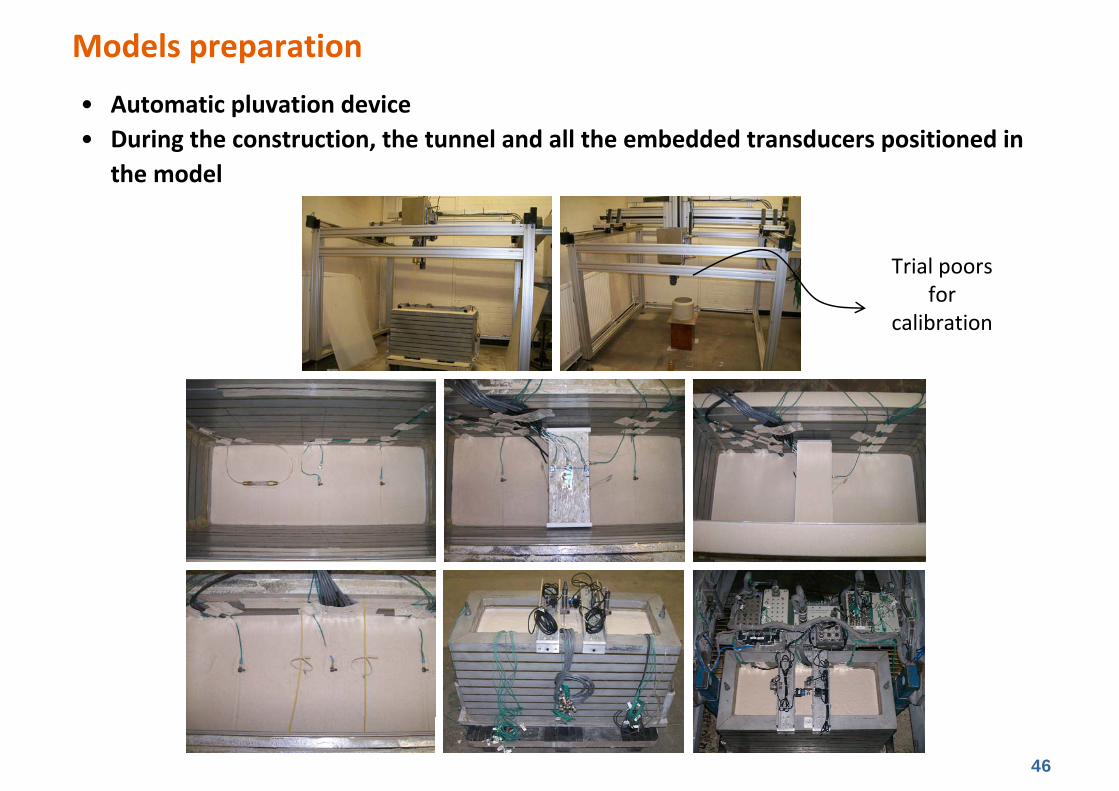
• Automatic pluvation device • During the construction, the tunnel and all the embedded transducers positioned in
the model
Models preparation
Trial poors for
calibration
47
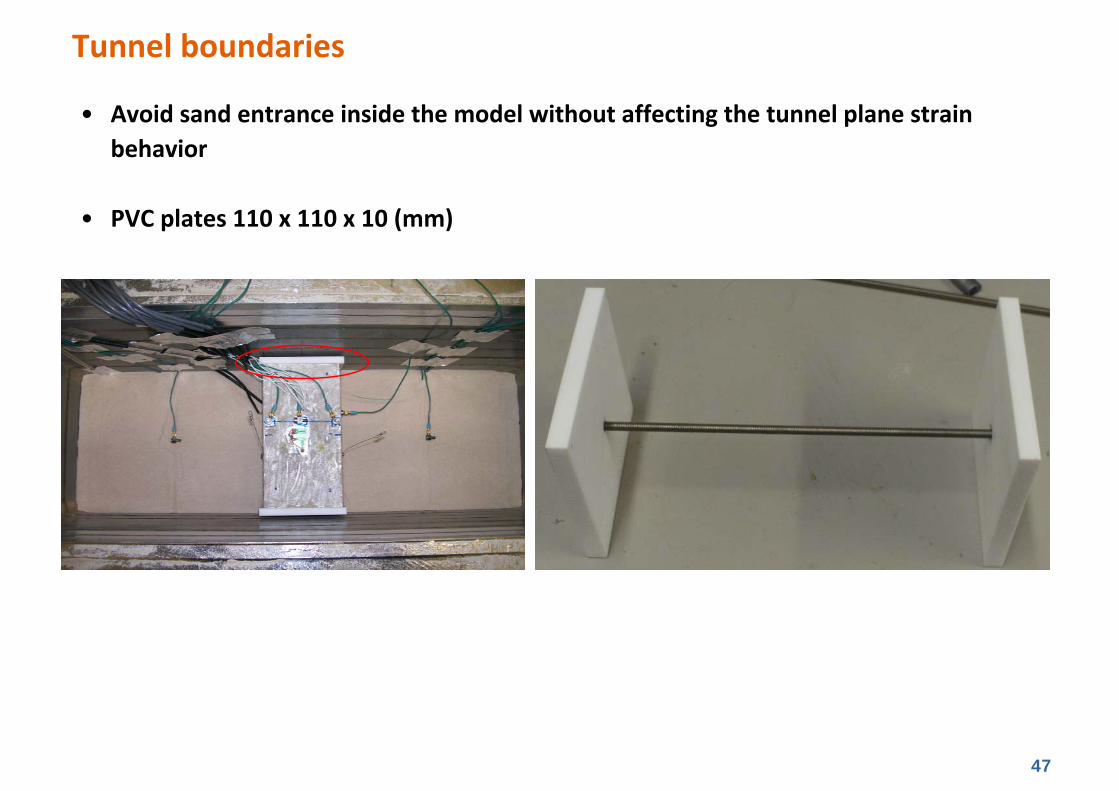
• Avoid sand entrance inside the model without affecting the tunnel plane strain behavior
• PVC plates 110 x 110 x 10 (mm)
Tunnel boundaries
48
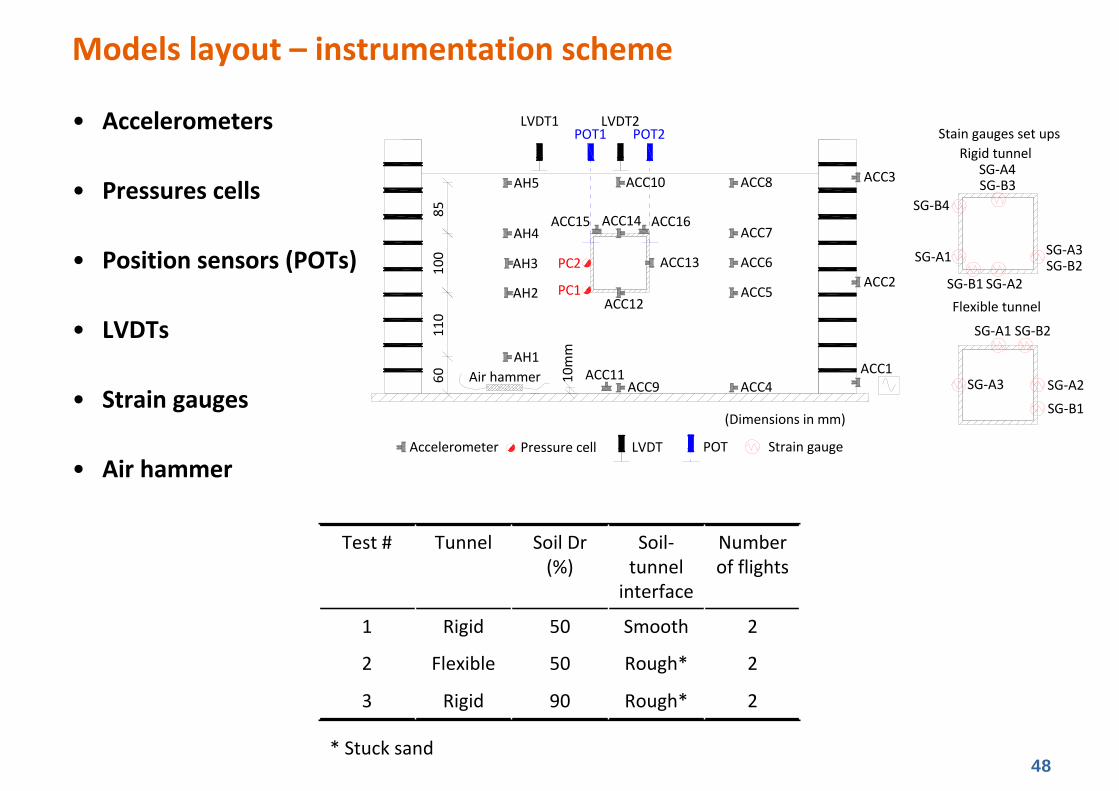
Models layout – instrumentation scheme
• Accelerometers
• Pressures cells
• Position sensors (POTs)
• LVDTs
• Strain gauges
• Air hammer
g
ACC10
ACC1160 Air hammer 10mm
POT1 POT2LVDT2
AH5
LVDT1
AH4
AH3
AH2
AH1
ACC12
ACC14ACC15 ACC16
ACC13
ACC9 ACC4
ACC5
ACC6
ACC7
ACC8
PC1
PC2
110
100
85Accelerometer Pressure cell LVDT POT Strain gauge
(Dimensions in mm)
ACC1
ACC3
ACC2
Rough*
Rough*
Smooth
Soil‐tunnel interface
250Rigid1
250Flexible2
90
Soil Dr (%)
Rigid
Tunnel
23
Number of flights
Test #
* Stuck sand
SG‐A2
SG‐A1 SG‐B2
SG‐A3CC1
ACC3
ACC2
SG‐B1
Rigid tunnel
Flexible tunnel
SG‐A3SG‐B2
SG‐A4SG‐B3
SG‐B1 SG‐A2
SG‐A1
SG‐B4
Stain gauges set ups
49
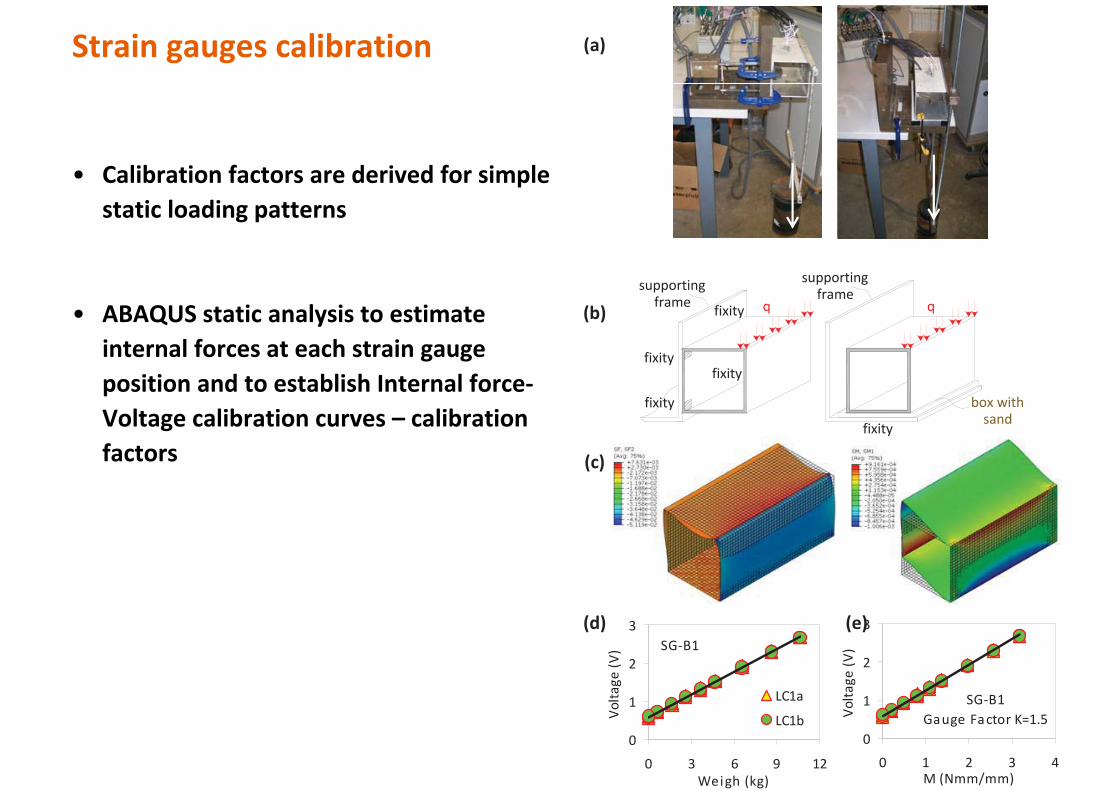
• Calibration factors are derived for simple static loading patterns
• ABAQUS static analysis to estimate internal forces at each strain gauge position and to establish Internal force‐Voltage calibration curves – calibration factors
Strain gauges calibration
fixity
fixityfixity
fixity
fixity
box withsand
supportingframe
supportingframe
SG B1Gauge Factor K=1.5
0
1
2
3
0 1 2 3 4M (Nmm/mm)
Volta
ge(V)SG B1
0
1
2
3
0 3 6 9 12Weigh (kg)
Volta
ge(V)
LC1a
LC1b
(a)
(b)
(c)
(d) (e)
50
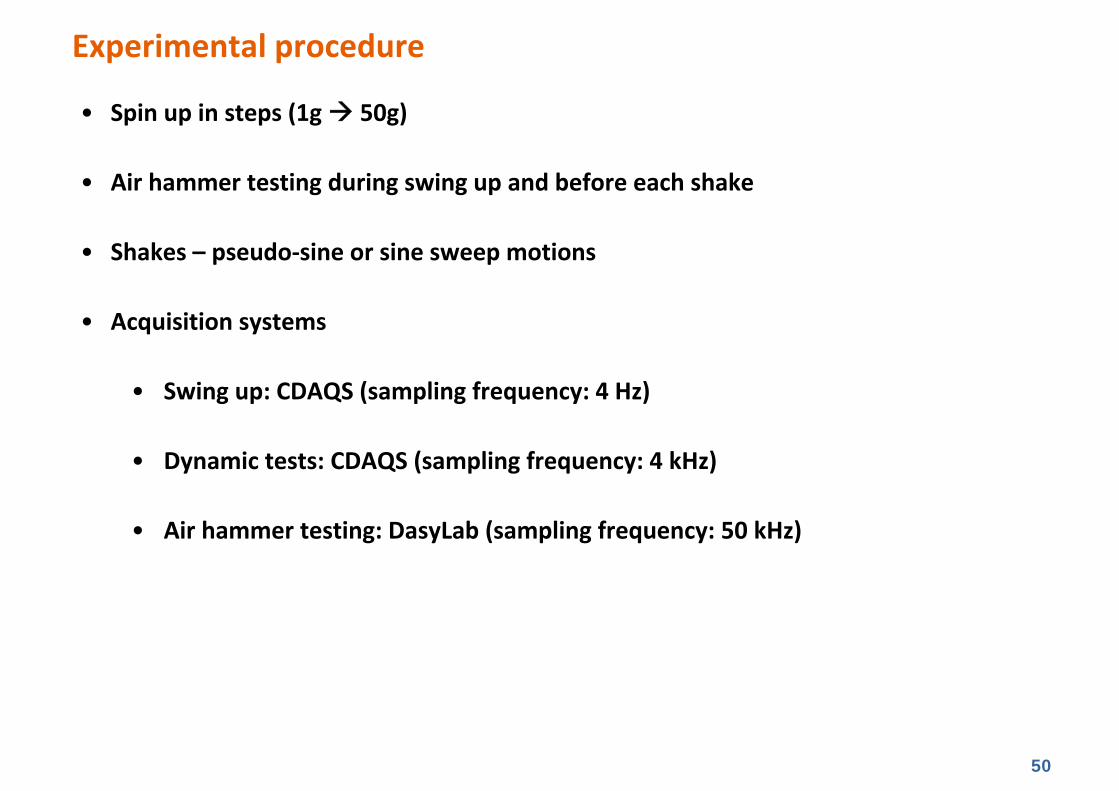
• Spin up in steps (1g 50g)
• Air hammer testing during swing up and before each shake
• Shakes – pseudo‐sine or sine sweep motions
• Acquisition systems
• Swing up: CDAQS (sampling frequency: 4 Hz)
• Dynamic tests: CDAQS (sampling frequency: 4 kHz)
• Air hammer testing: DasyLab (sampling frequency: 50 kHz)
Experimental procedure
51
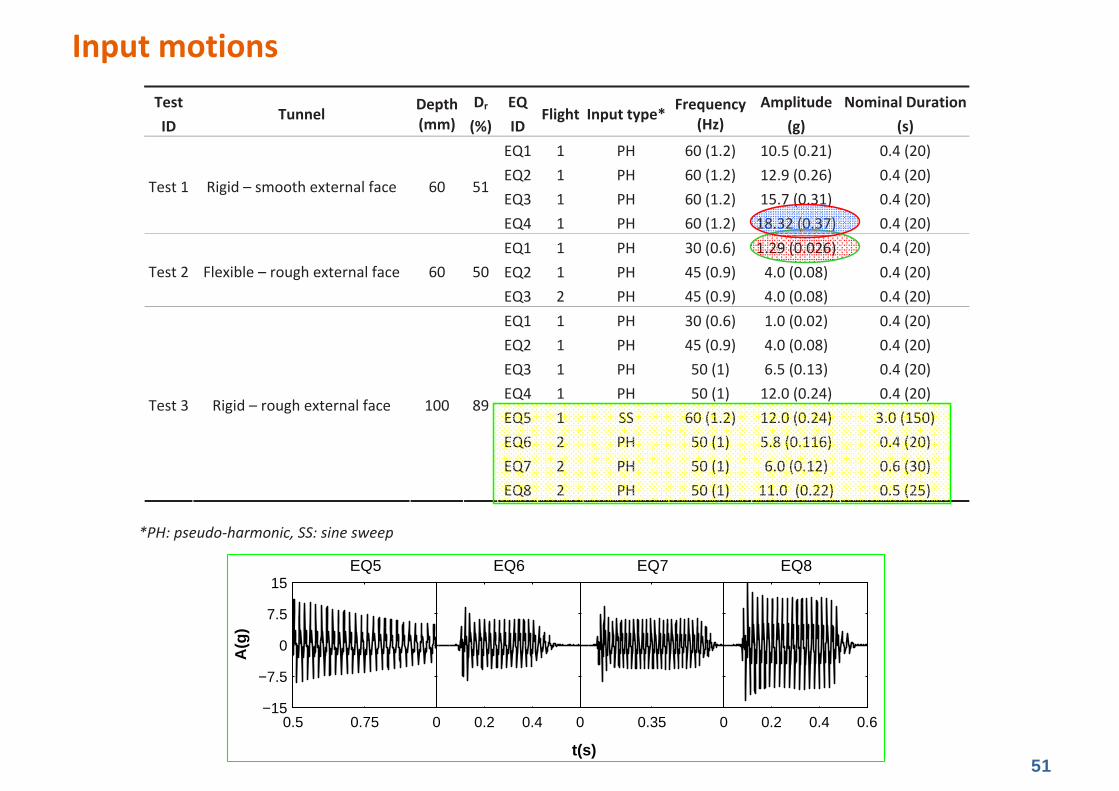
Input motions
0.5 0.75−15
−7.5
0
7.5
15
A(g
)
EQ5
0 0.2 0.4
EQ6
0 0.35
EQ7
0 0.2 0.4 0.6
EQ8
t(s)
*PH: pseudo harmonic, SS: sine sweep
TestID
Tunnel Depth(mm)
Dr
(%)EQID
Flight Input type* Frequency(Hz)
Amplitude(g)
Nominal Duration(s)
EQ1 1 PH 60 (1.2) 10.5 (0.21) 0.4 (20)EQ2 1 PH 60 (1.2) 12.9 (0.26) 0.4 (20)EQ3 1 PH 60 (1.2) 15.7 (0.31) 0.4 (20)
Test 1 Rigid – smooth external face 60 51
EQ4 1 PH 60 (1.2) 18.32 (0.37) 0.4 (20)EQ1 1 PH 30 (0.6) 1.29 (0.026) 0.4 (20)EQ2 1 PH 45 (0.9) 4.0 (0.08) 0.4 (20)Test 2 Flexible – rough external face 60 50EQ3 2 PH 45 (0.9) 4.0 (0.08) 0.4 (20)EQ1 1 PH 30 (0.6) 1.0 (0.02) 0.4 (20)EQ2 1 PH 45 (0.9) 4.0 (0.08) 0.4 (20)EQ3 1 PH 50 (1) 6.5 (0.13) 0.4 (20)EQ4 1 PH 50 (1) 12.0 (0.24) 0.4 (20)EQ5 1 SS 60 (1.2) 12.0 (0.24) 3.0 (150)EQ6 2 PH 50 (1) 5.8 (0.116) 0.4 (20)EQ7 2 PH 50 (1) 6.0 (0.12) 0.6 (30)
Test 3 Rigid – rough external face 100 89
EQ8 2 PH 50 (1) 11.0 (0.22) 0.5 (25)
52
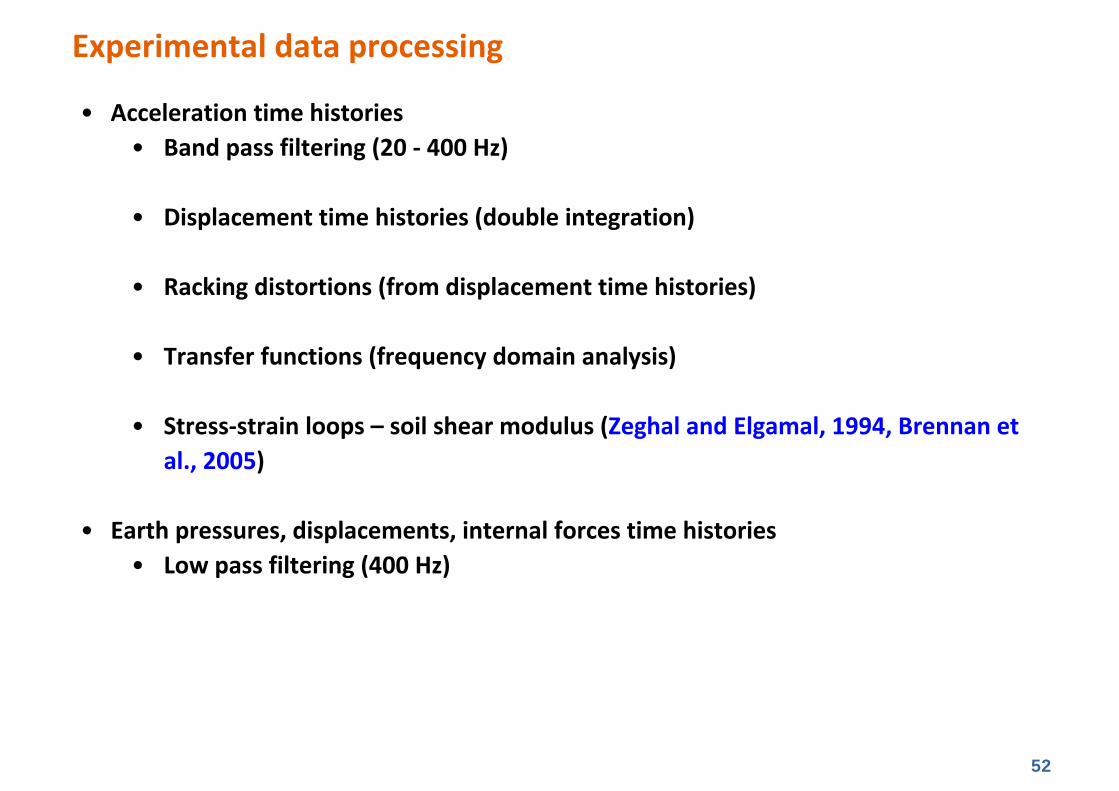
• Acceleration time histories• Band pass filtering (20 ‐ 400 Hz)
• Displacement time histories (double integration)
• Racking distortions (from displacement time histories)
• Transfer functions (frequency domain analysis)
• Stress‐strain loops – soil shear modulus (Zeghal and Elgamal, 1994, Brennan et al., 2005)
• Earth pressures, displacements, internal forces time histories• Low pass filtering (400 Hz)
Experimental data processing
53
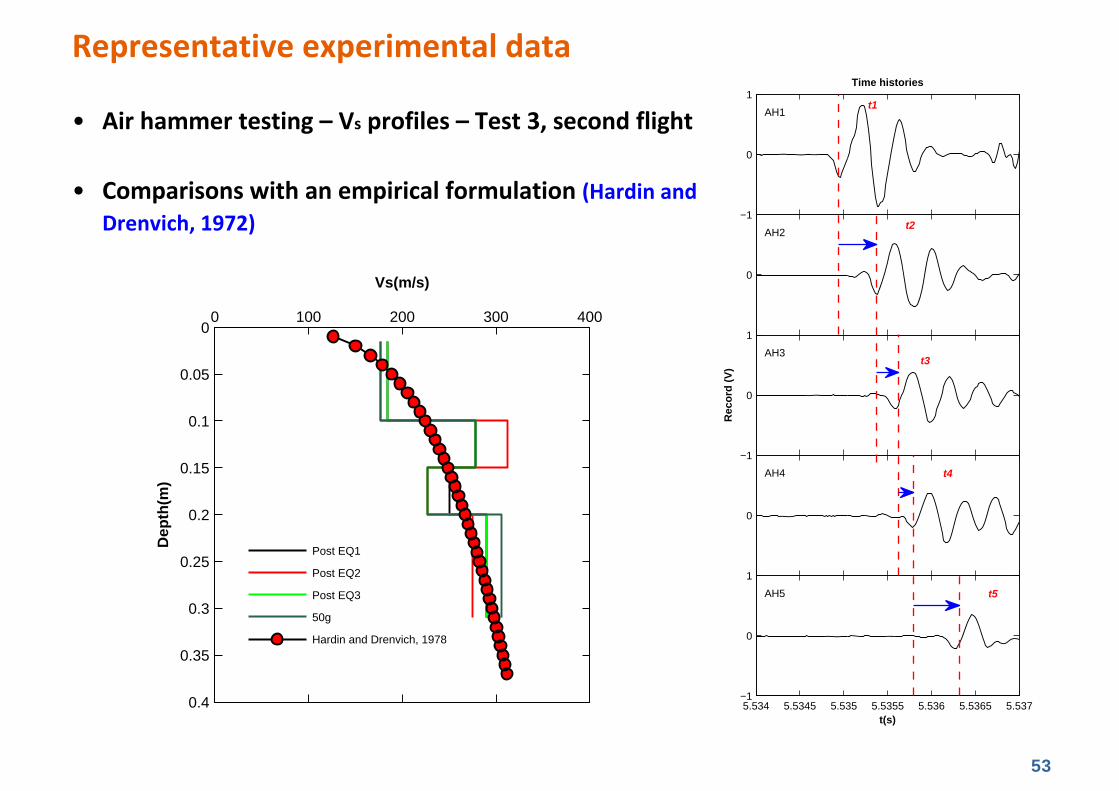
• Air hammer testing – Vs profiles – Test 3, second flight
• Comparisons with an empirical formulation (Hardin and Drenvich, 1972)
Representative experimental data
−1
0
1Time histories
0
−1
0
1
Rec
ord
(V
)
0
5.534 5.5345 5.535 5.5355 5.536 5.5365 5.537−1
0
1
t(s)
AH1
AH2
AH3
AH4
AH5
t1
t2
t3
t4
t5
0 100 200 300 4000
0.05
0.1
0.15
0.2
0.25
0.3
0.35
0.4
Dep
th(m
)
Vs(m/s)
Post EQ1
Post EQ2
Post EQ3
50g
Hardin and Drenvich, 1978
54
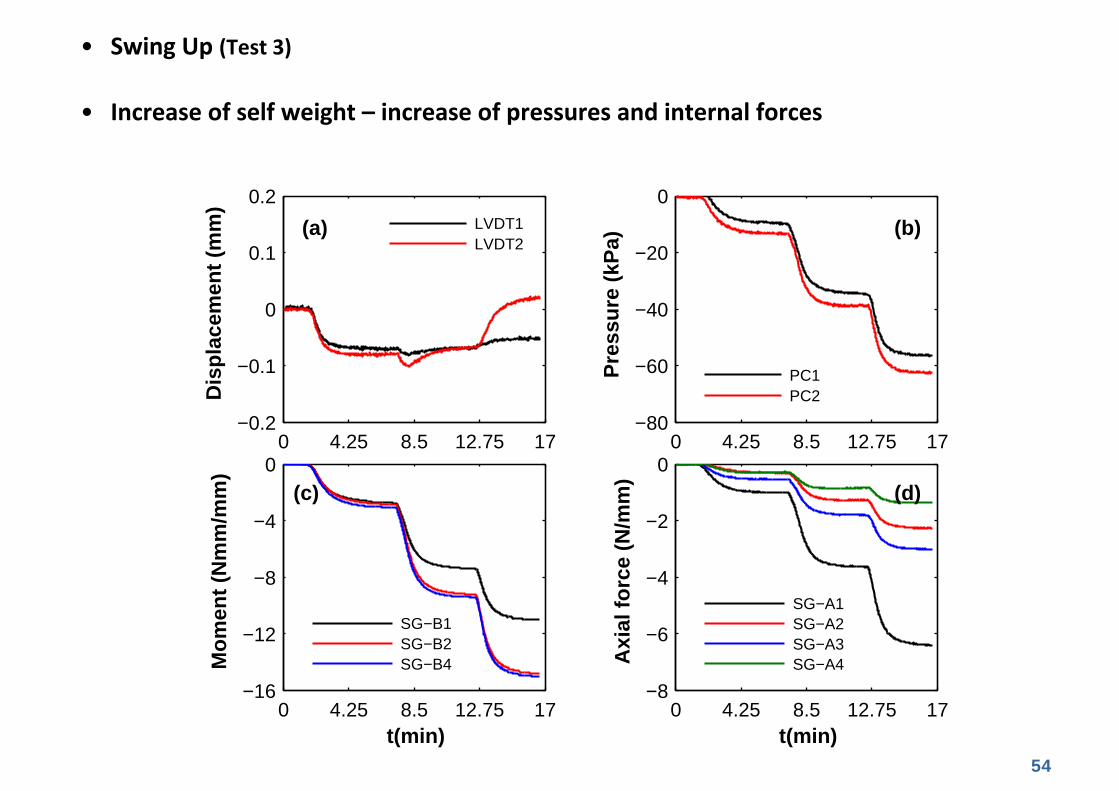
• Swing Up (Test 3)
• Increase of self weight – increase of pressures and internal forces
0 4.25 8.5 12.75 17−0.2
−0.1
0
0.1
0.2D
isp
lace
men
t (m
m)
0 4.25 8.5 12.75 17−80
−60
−40
−20
0
Pre
ssu
re (
kPa)
0 4.25 8.5 12.75 17−16
−12
−8
−4
0
t(min)
Mo
men
t (N
mm
/mm
)
0 4.25 8.5 12.75 17−8
−6
−4
−2
0
t(min)
Axi
al f
orc
e (N
/mm
)
LVDT1LVDT2
PC1PC2
SG−B1SG−B2SG−B4
SG−A1SG−A2SG−A3SG−A4
(a) (b)
(c) (d)
55
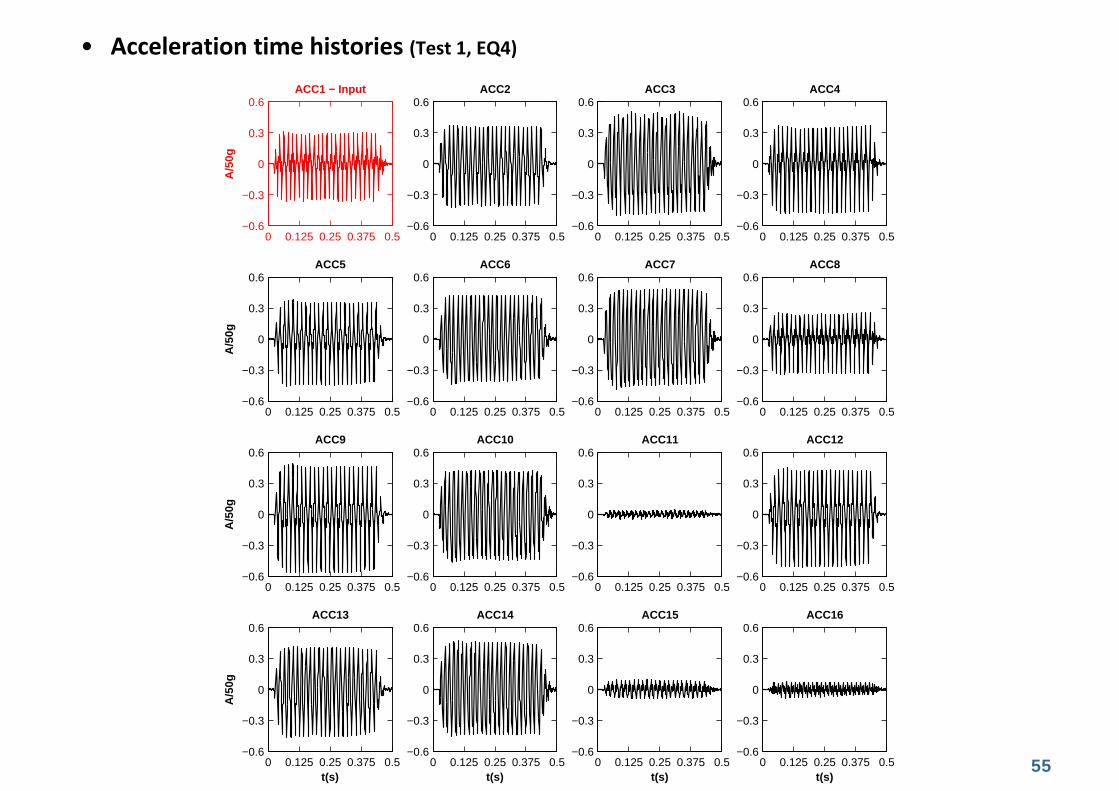
• Acceleration time histories (Test 1, EQ4)
0 0.125 0.25 0.375 0.5−0.6
−0.3
0
0.3
0.6
A/5
0g
ACC1 − Input
0 0.125 0.25 0.375 0.5−0.6
−0.3
0
0.3
0.6ACC2
0 0.125 0.25 0.375 0.5−0.6
−0.3
0
0.3
0.6ACC3
0 0.125 0.25 0.375 0.5−0.6
−0.3
0
0.3
0.6ACC4
0 0.125 0.25 0.375 0.5−0.6
−0.3
0
0.3
0.6
A/5
0g
ACC5
0 0.125 0.25 0.375 0.5−0.6
−0.3
0
0.3
0.6ACC6
0 0.125 0.25 0.375 0.5−0.6
−0.3
0
0.3
0.6ACC7
0 0.125 0.25 0.375 0.5−0.6
−0.3
0
0.3
0.6ACC8
0 0.125 0.25 0.375 0.5−0.6
−0.3
0
0.3
0.6
A/5
0g
ACC9
0 0.125 0.25 0.375 0.5−0.6
−0.3
0
0.3
0.6ACC10
0 0.125 0.25 0.375 0.5−0.6
−0.3
0
0.3
0.6ACC11
0 0.125 0.25 0.375 0.5−0.6
−0.3
0
0.3
0.6ACC12
0 0.125 0.25 0.375 0.5−0.6
−0.3
0
0.3
0.6
t(s)
A/5
0g
ACC13
0 0.125 0.25 0.375 0.5−0.6
−0.3
0
0.3
0.6
t(s)
ACC14
0 0.125 0.25 0.375 0.5−0.6
−0.3
0
0.3
0.6
t(s)
ACC15
0 0.125 0.25 0.375 0.5−0.6
−0.3
0
0.3
0.6
t(s)
ACC16
56
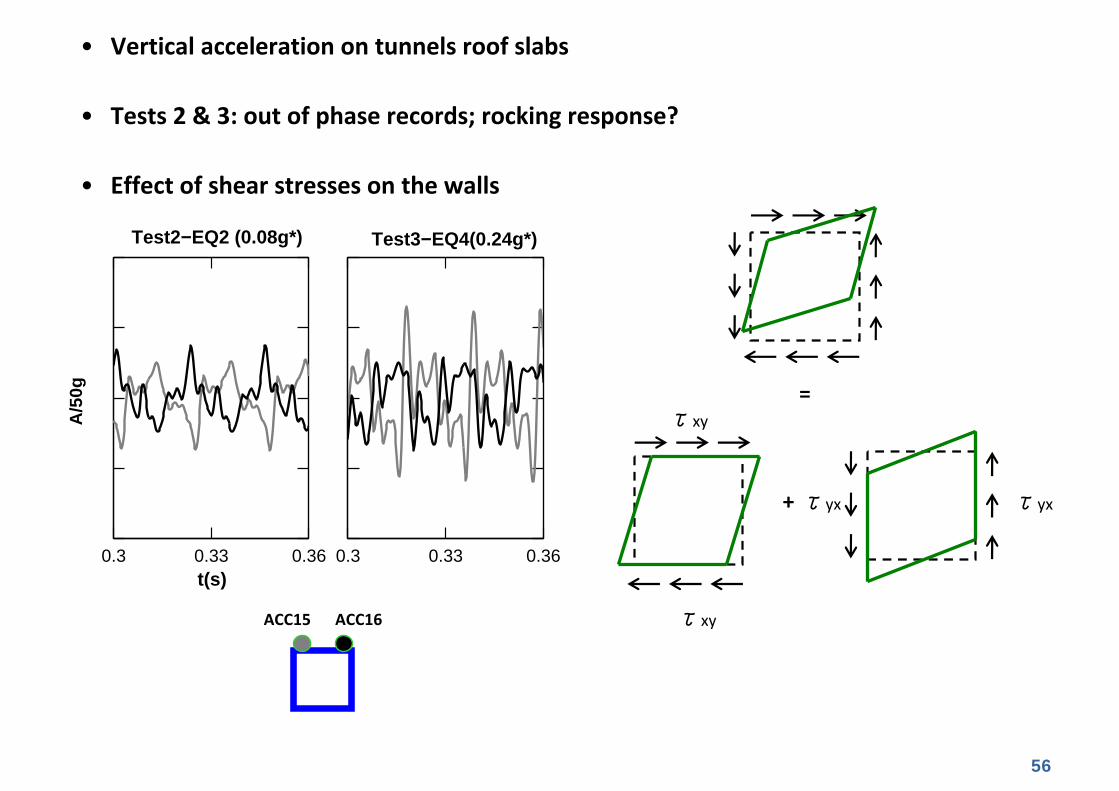
• Vertical acceleration on tunnels roof slabs
• Tests 2 & 3: out of phase records; rocking response?
• Effect of shear stresses on the walls
6 0.3 0.33 0.36t(s)
Test2−EQ2 (0.08g*)
0.3 0.33 0.36
Test3−EQ4(0.24g*)
ACC15 ACC16
=
+ τyx τyx
τxy
τxyA/5
0g
57
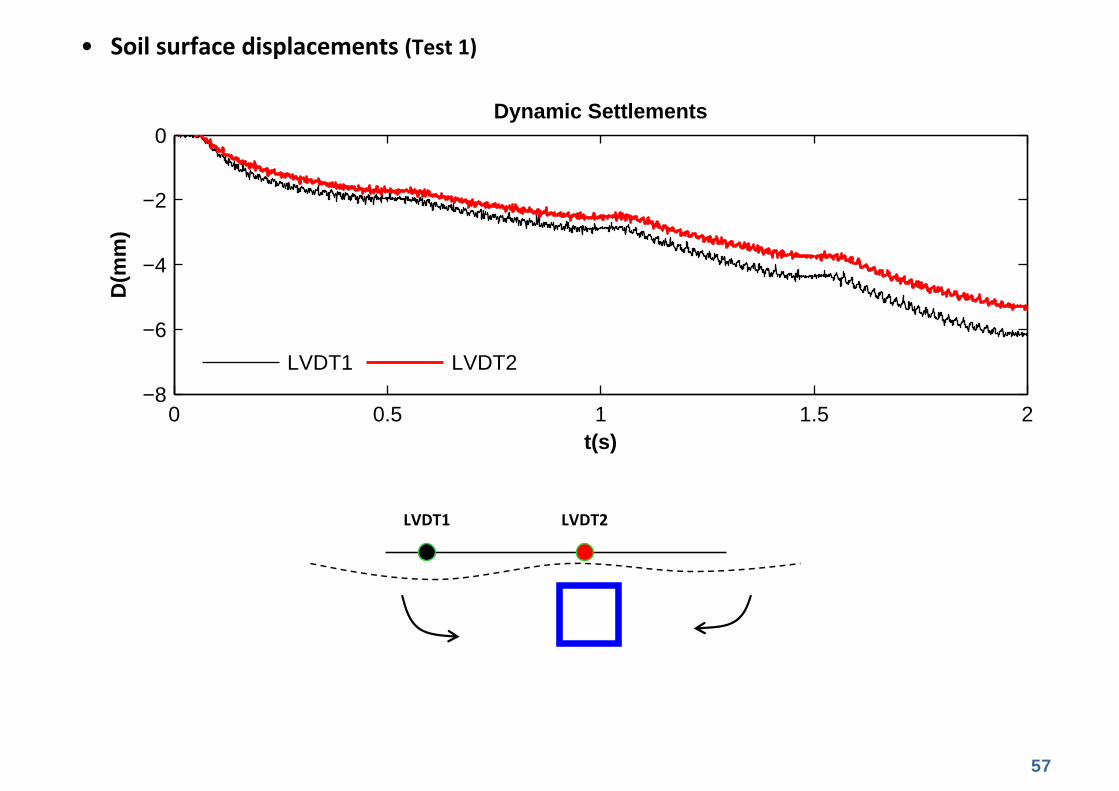
• Soil surface displacements (Test 1)
0 0.5 1 1.5 2−8
−6
−4
−2
0
t(s)
D(m
m)
Dynamic Settlements
LVDT1 LVDT2
D(m
m)
Total settlements
(e)
LVDT1 LVDT2
58
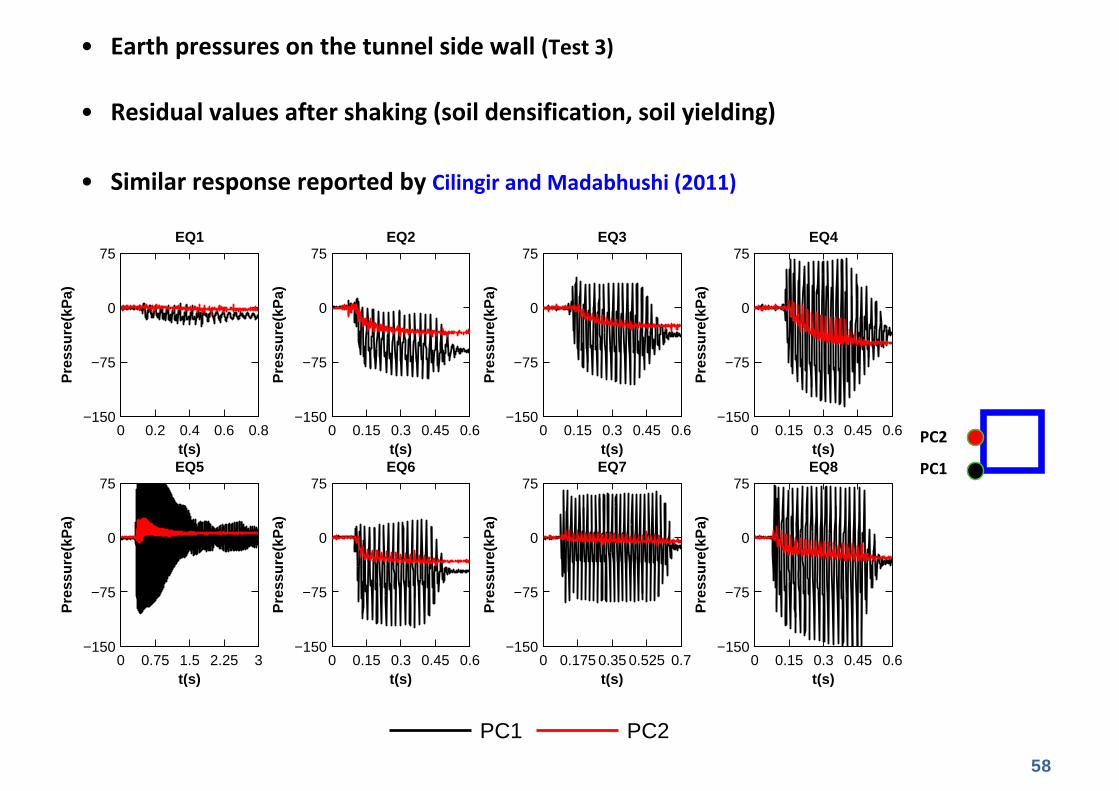
• Earth pressures on the tunnel side wall (Test 3)
• Residual values after shaking (soil densification, soil yielding)
• Similar response reported by Cilingir and Madabhushi (2011)
PC2
PC1
PC1 PC2
0 0.2 0.4 0.6 0.8−150
−75
0
75
t(s)
Pre
ssu
re(k
Pa)
EQ1
0 0.15 0.3 0.45 0.6−150
−75
0
75
t(s)
Pre
ssu
re(k
Pa)
EQ2
0 0.15 0.3 0.45 0.6−150
−75
0
75
t(s)
Pre
ssu
re(k
Pa)
EQ3
0 0.15 0.3 0.45 0.6−150
−75
0
75
t(s)
Pre
ssu
re(k
Pa)
EQ4
0 0.75 1.5 2.25 3−150
−75
0
75
t(s)
Pre
ssu
re(k
Pa)
EQ5
0 0.15 0.3 0.45 0.6−150
−75
0
75
t(s)
Pre
ssu
re(k
Pa)
EQ6
0 0.175 0.35 0.525 0.7−150
−75
0
75
t(s)
Pre
ssu
re(k
Pa)
EQ7
0 0.15 0.3 0.45 0.6−150
−75
0
75
t(s)
Pre
ssu
re(k
Pa)
EQ8
SwingUp−f1 SwingUp−f3 SwingDown−f1 SwingDown−f3
59
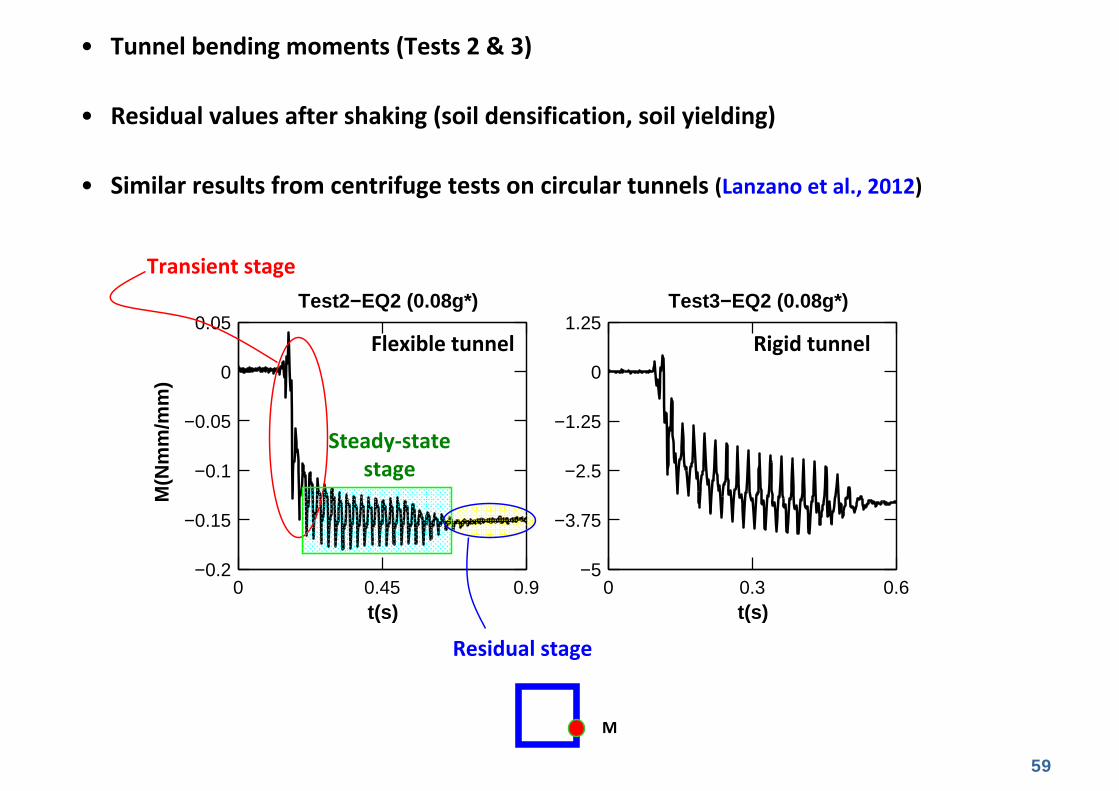
• Tunnel bending moments (Tests 2 & 3)
• Residual values after shaking (soil densification, soil yielding)
• Similar results from centrifuge tests on circular tunnels (Lanzano et al., 2012)
M
0 0.45 0.9−0.2
−0.15
−0.1
−0.05
0
0.05
M(N
mm
/mm
)
t(s)
Test2−EQ2 (0.08g*)
0 0.3 0.6−5
−3.75
−2.5
−1.25
0
1.25
t(s)
Test3−EQ2 (0.08g*)
Flexible tunnel Rigid tunnel
Transient stage
Steady‐state stage
Residual stage
60
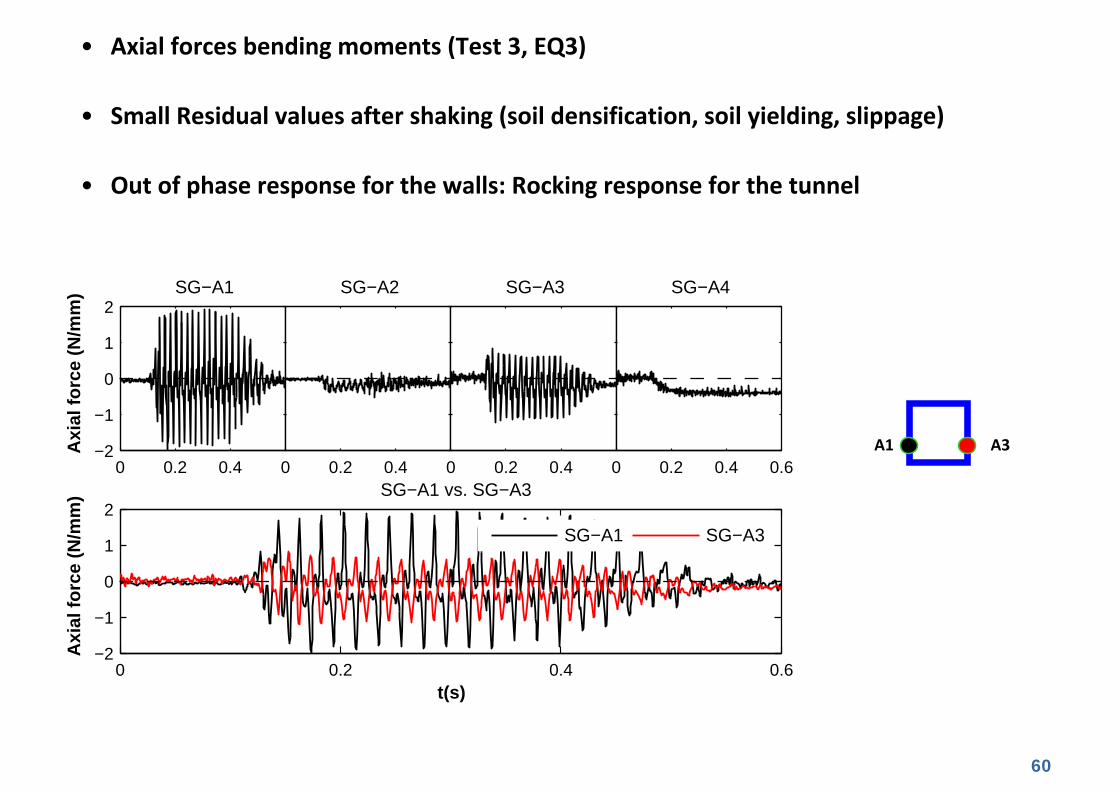
• Axial forces bending moments (Test 3, EQ3)
• Small Residual values after shaking (soil densification, soil yielding, slippage)
• Out of phase response for the walls: Rocking response for the tunnel
0 0.2 0.4−2
−1
0
1
2
Axi
al f
orc
e (N
/mm
) SG−A1
0 0.2 0.4
SG−A2
0 0.2 0.4
SG−A3
0 0.2 0.4 0.6
SG−A4
0 0.2 0.4 0.6−2
−1
0
1
2
t(s)
Axi
al f
orc
e (N
/mm
) SG−A1 vs. SG−A3
SG−A1 SG−A3
A3A1
61
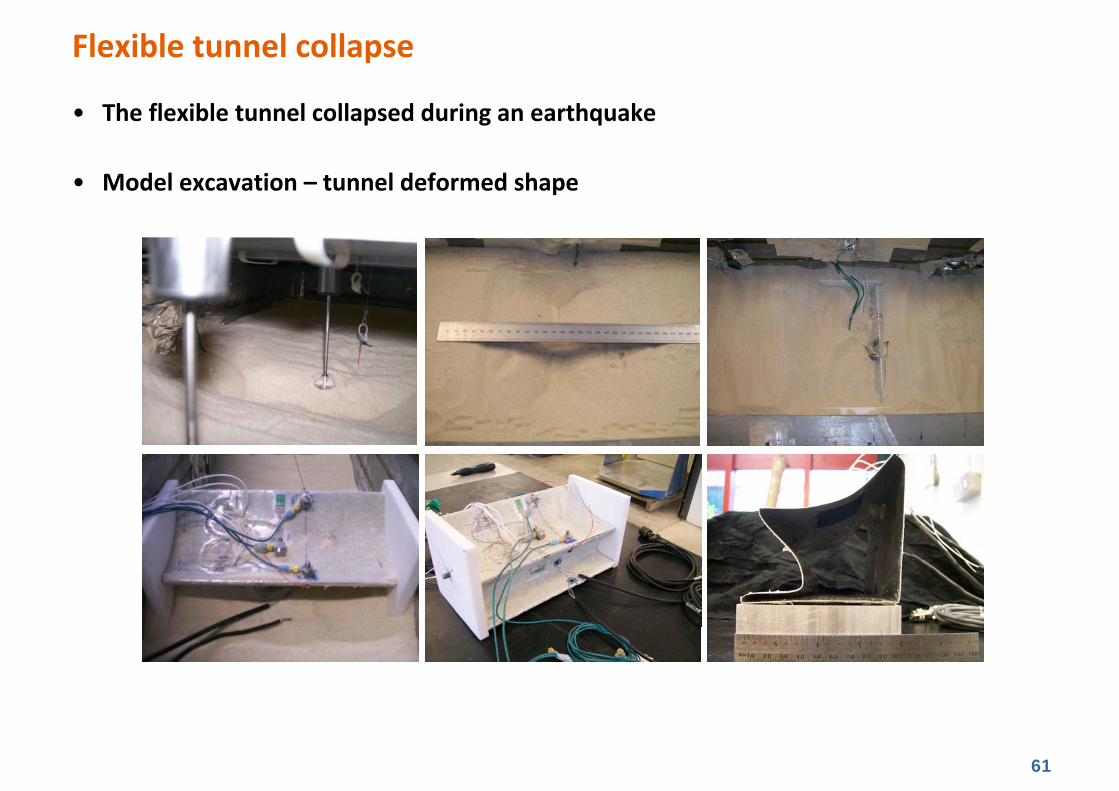
• The flexible tunnel collapsed during an earthquake
• Model excavation – tunnel deformed shape
Flexible tunnel collapse
62
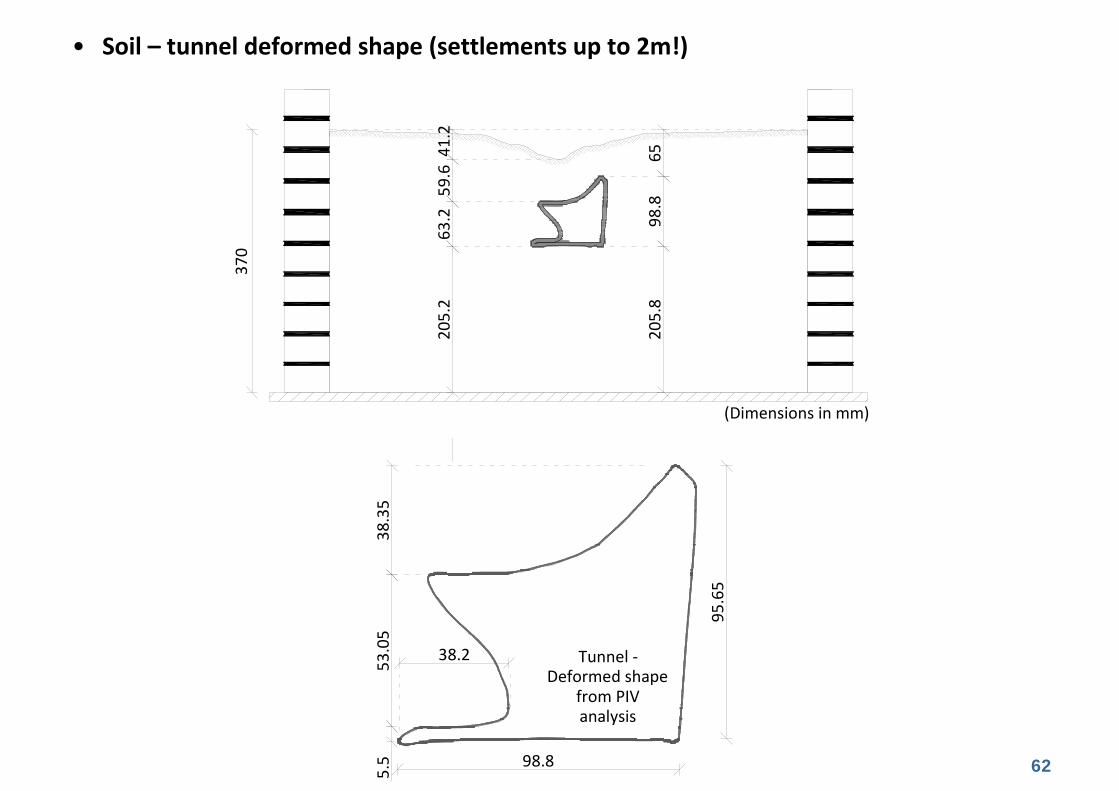
• Soil – tunnel deformed shape (settlements up to 2m!)
370
205.8
98.8
65
205.2
63.2
59.6
41.2
(Dimensions in mm)
6
(b)
Tunnel ‐Deformed shape
from PIVanalysis
95.65
98.8
53.05
38.35
5.5
38.2
(e)
63
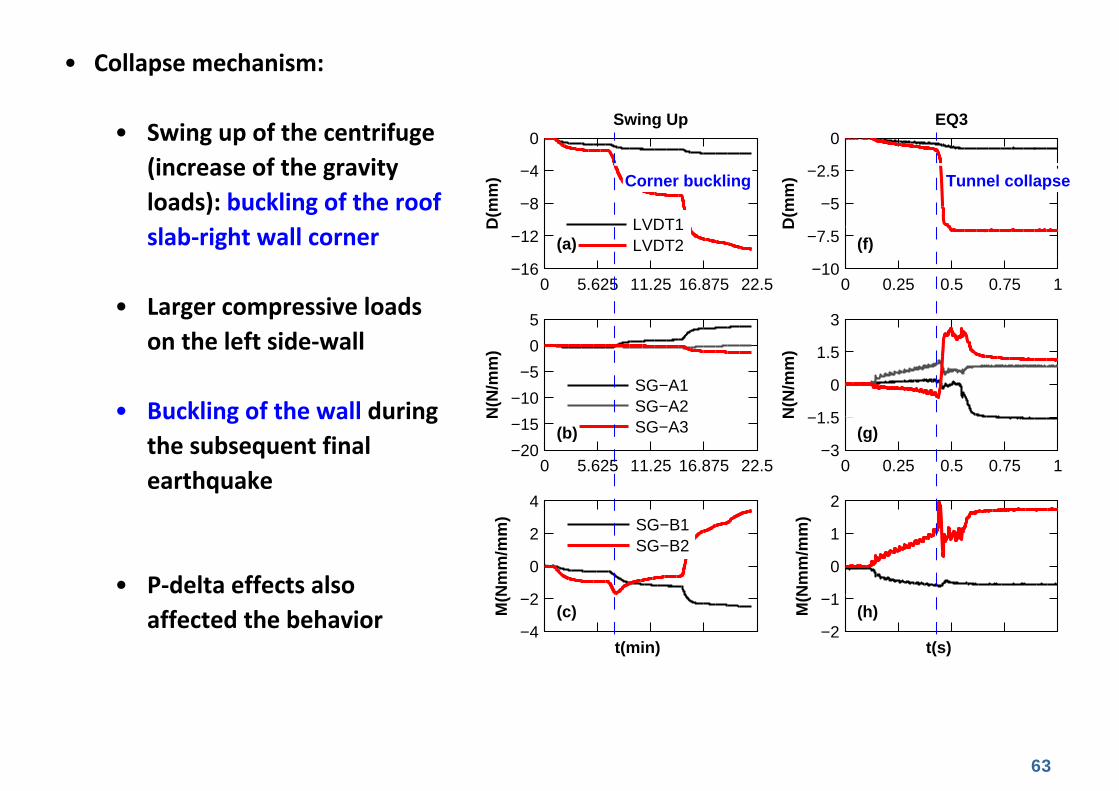
• Collapse mechanism:
• Swing up of the centrifuge (increase of the gravity loads): buckling of the roof slab‐right wall corner
• Larger compressive loads on the left side‐wall
• Buckling of the wall during the subsequent final earthquake
• P‐delta effects also affected the behavior
0 5.625 11.25 16.875 22.5−16
−12
−8
−4
0
D(m
m)
Swing Up
0 0.25 0.5 0.75 1−10
−7.5
−5
−2.5
0
D(m
m)
EQ3
0 5.625 11.25 16.875 22.5−20
−15
−10
−5
0
5
N(N
/mm
)
0 0.25 0.5 0.75 1−3
−1.5
0
1.5
3
N(N
/mm
)
0 5.625 11.25 16.875 22.5−4
−2
0
2
4M
(Nm
m/m
m)
0 0.25 0.5 0.75 1−2
−1
0
1
2
M(N
mm
/mm
)
LVDT1LVDT2
SG−A1SG−A2SG−A3
SG−B1SG−B2
Corner buckling Tunnel collapse
(a)
(b)
(c)
(f)
(g)
(h)
t(min) t(s)
64
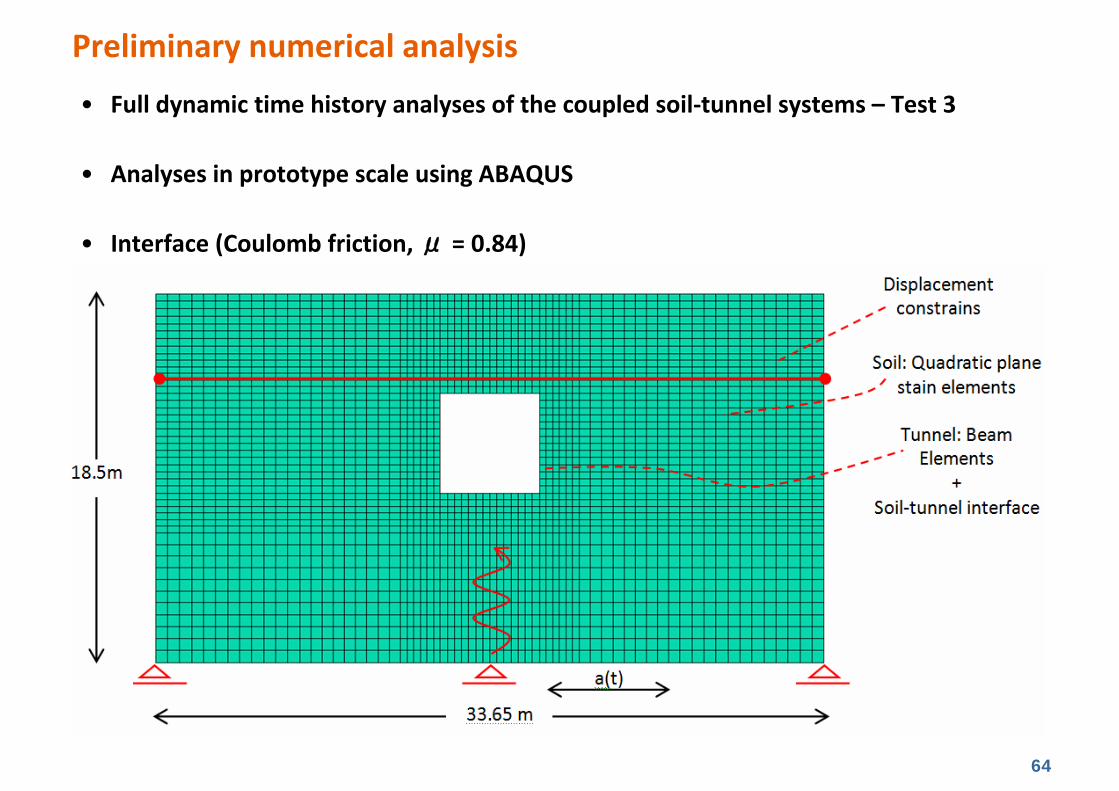
• Full dynamic time history analyses of the coupled soil‐tunnel systems – Test 3
• Analyses in prototype scale using ABAQUS
• Interface (Coulomb friction, μ = 0.84)
Preliminary numerical analysis
65
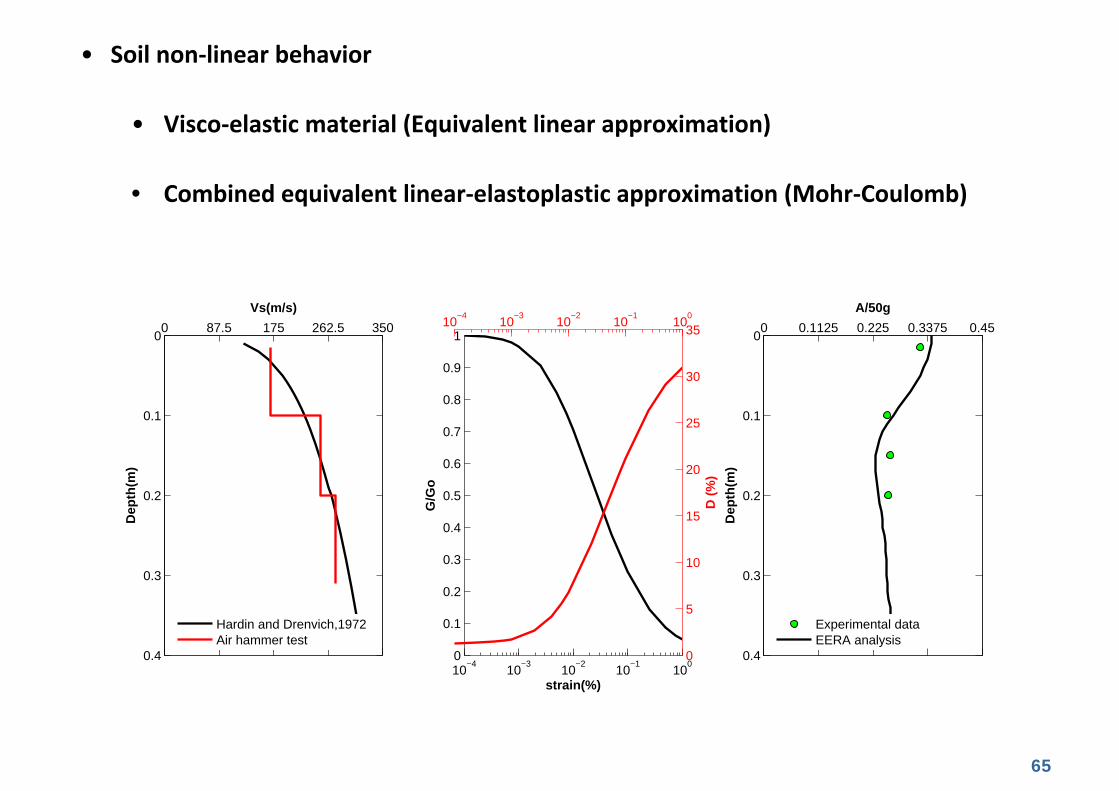
• Soil non‐linear behavior
• Visco‐elastic material (Equivalent linear approximation)
• Combined equivalent linear‐elastoplastic approximation (Mohr‐Coulomb)
0 87.5 175 262.5 3500
0.1
0.2
0.3
0.4
Vs(m/s)
Dep
th(m
)
Hardin and Drenvich,1972Air hammer test
10−4
10−3
10−2
10−1
100
0
0.1
0.2
0.3
0.4
0.5
0.6
0.7
0.8
0.9
1
strain(%)
G/G
o
10−4
10−3
10−2
10−1
100
0
5
10
15
20
25
30
35
D (
%)
0 0.1125 0.225 0.3375 0.450
0.1
0.2
0.3
0.4
A/50g
Dep
th(m
)
Experimental dataEERA analysis

66
• Accelerations
0.2 0.25 0.3−0.4
−0.2
0
0.2
0.4
A/5
0g
ACC1 − Input
0.2 0.25 0.3−0.4
−0.2
0
0.2
0.4ACC2
0.2 0.25 0.3−0.4
−0.2
0
0.2
0.4ACC3
0.2 0.25 0.3−0.4
−0.2
0
0.2
0.4ACC4
0.2 0.25 0.3−0.4
−0.2
0
0.2
0.4
A/5
0g
ACC5
0.2 0.25 0.3−0.4
−0.2
0
0.2
0.4ACC6
0.2 0.25 0.3−0.4
−0.2
0
0.2
0.4ACC7
0.2 0.25 0.3−0.4
−0.2
0
0.2
0.4ACC8
0.2 0.25 0.3−0.4
−0.2
0
0.2
0.4
A/5
0g
ACC9
0.2 0.25 0.3−0.4
−0.2
0
0.2
0.4ACC10
0.2 0.25 0.3−0.4
−0.2
0
0.2
0.4ACC11
0.2 0.25 0.3−0.4
−0.2
0
0.2
0.4ACC12
0.2 0.25 0.3−0.4
−0.2
0
0.2
0.4
t(s)
A/5
0g
ACC13
0.2 0.25 0.3−0.4
−0.2
0
0.2
0.4
t(s)
ACC14
0.2 0.25 0.3−0.4
−0.2
0
0.2
0.4
t(s)
ACC15
0.2 0.25 0.3−0.4
−0.2
0
0.2
0.4
t(s)
ACC16
Experimental data
Numerical prediction
67
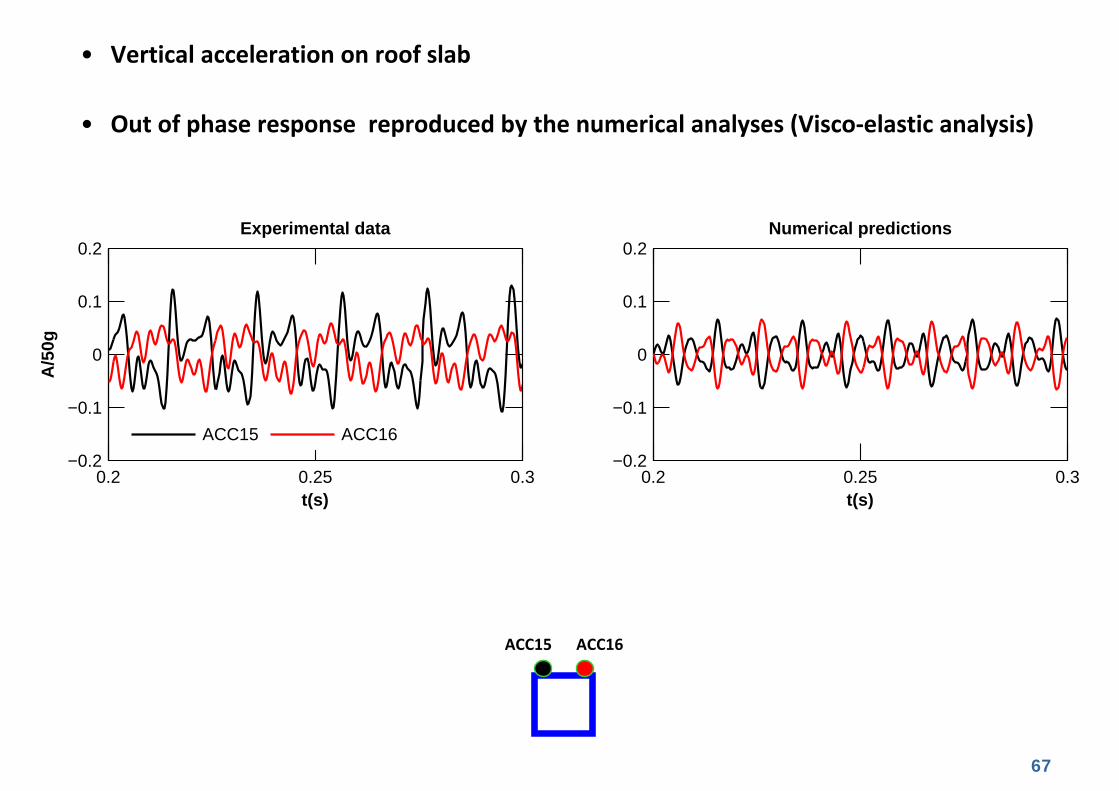
• Vertical acceleration on roof slab
• Out of phase response reproduced by the numerical analyses (Visco‐elastic analysis)
0.2 0.25 0.3−0.2
−0.1
0
0.1
0.2
t(s)
A/5
0g
Experimental data
0.2 0.25 0.3−0.2
−0.1
0
0.1
0.2
t(s)
Numerical predictions
ACC15 ACC16
ACC15 ACC16
68
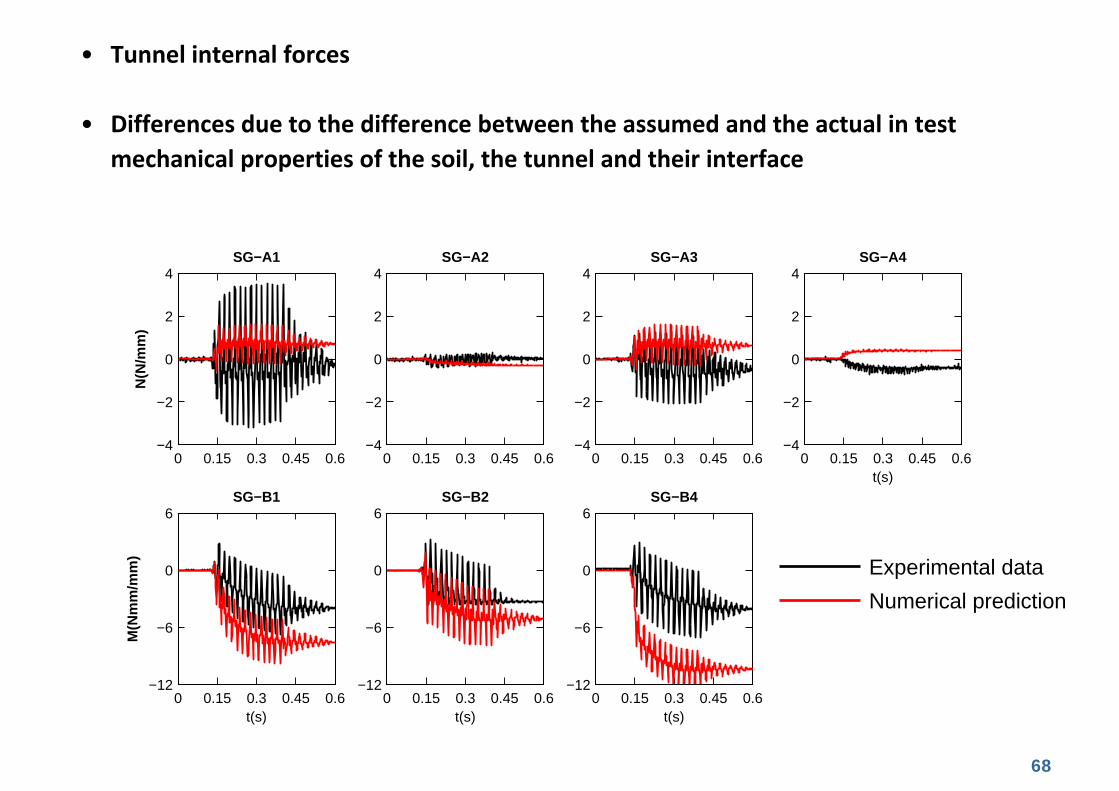
• Tunnel internal forces
• Differences due to the difference between the assumed and the actual in test mechanical properties of the soil, the tunnel and their interface
0 0.15 0.3 0.45 0.6−4
−2
0
2
4
N(N
/mm
)
SG−A1
0 0.15 0.3 0.45 0.6−4
−2
0
2
4SG−A2
0 0.15 0.3 0.45 0.6−4
−2
0
2
4SG−A3
0 0.15 0.3 0.45 0.6−4
−2
0
2
4
t(s)
SG−A4
0 0.15 0.3 0.45 0.6−12
−6
0
6
t(s)
M(N
mm
/mm
)
SG−B1
0 0.15 0.3 0.45 0.6−12
−6
0
6
t(s)
SG−B2
0 0.15 0.3 0.45 0.6−12
−6
0
6
t(s)
SG−B4
Experimental data
Numerical predictionExperimental data
Numerical prediction
69
Conclusions
70
• Maximum soil horizontal accelerations were slightly amplified within the soil deposit, for the dry tests, while for the saturated tests the amplification effects were less important due to the probable higher variation of the soil stiffness
• The side‐walls horizontal deformations developed in a symmetrical manner
• The diagonal extensometers denoted the plane strain behavior of the model sections
• Rigid tunnels were understandably less deformed during shaking compared to the flexible sections
• The effects of the face rugosity and saturation are still under investigation
Conclusions ‐ DRESBUS II
71
• The horizontal acceleration was generally amplified towards the surface, while the presence of the tunnel affected this amplification
• Vertical acceleration‐time histories recorded on the sides of the roof slab indicated a “rocking mode” of vibration for the tunnels
• Residual values were reported after each shake for the earth pressures on the side walls and the dynamic bending moments due to soil yielding and/or densification
• Smaller residuals were observed for the dynamic axial forces due to the soil densification, soil yielding and a small amount of sliding at the interface
Conclusions ‐ TUNNELSEIS

72
• The research leading to the presented results has received funding from the European Community’s Seventh Framework Programme [FP7/2007–2013] for access to the Turner Beam Centrifuge, Cambridge, UK, and the IFSTTAR Centrifuge, Nantes, FR under grant agreement no 227887 [SERIES]
• The technical support received by the Technicians of both the facilities is gratefully acknowledged
• DRESBUS II: www.series.upatras.gr/DRESBUS_II• TUNNELSEIS: www.series.upatras.gr/TUNNELSEIS
Acknoledgements
73
• Tsinidis G., Heron C., Pitilakis K., Madabhushi G. (2013) Physical Modeling for the Evaluation of the Seismic Behavior of Square Tunnels. A. Ilki and M.N. Fardis (eds.), Seismic Evaluation and Rehabilitation of Structures, Geotechnical, Geological and Earthquake Engineering 26 (in press)
• Tsinidis G., Pitilakis K., Heron C., Madabhushi G. (2013) Experimental and NumericalInvestigation of the Seismic Behavior of Rectangular Tunnels in Soft Soils. Proceedings of the 4th International Conference on Computational Methods in Structural Dynamics and Earthquake Engineering (COMPDYN 2013), 12‐14 June 2013, Kos Island, Greece
• Tsinidis G., Rovithis E., Pitilakis K., Chazelas J.‐L.(2013) Centrifuge Modeling of the Dynamic Response of Shallow Rectangular Culverts in Sand. SERIES concluding Workshop, Ispra, May 28‐30 (near submission)
• Tsinidis G., Heron C., Pitilakis K., Madabhushi G. (2013) Centrifuge Modeling of the Dynamic Behavior of Square Tunnels in Sand. SERIES concluding Workshop, Ispra, May 28‐30 (near submission)
• Tsinidis G., Heron C., Pitilakis K., Madabhushi G. (2013) Experimental Investigation of the Seismic Behavior of Square Tunnels in Sand. (Journal paper –near submission)
• Tsinidis G., Rovithis E., Pitilakis K., Chazelas J.‐L. (2013) Seismic Behavior of Swallow Rectangular Culverts Embedded in Sand (Journal paper – near submission)
Publications (Submitted or near submission)