dye-sensitized solar cell using natural dyes extracted...
TRANSCRIPT

إقرار
:العنوان تحمل التي الرسالة مقدم أدناه الموقع أنا
Dye-Sensitized Solar Cell Using Natural Dyes
Extracted From Dried Flowers
م ا باس تثناء الخ اص، جھ دي نت اج ھ ي إنم ا الرس الة ھ ذه علی ھ تلاش تم م ا ب أن أق ر
یق دم ل م منھ ا ج زء أي وأ كك ل، الرس الة ھ ذه و أن ورد، حیثم ا إلی ھ اإلش ارة تم ت
بحثی ة أو تعلیمی ة مؤس سة أی ة ل دى بح ث أو علم ي لق ب أو درج ة لنی ل قب ل م ن
.أخرى
DECLARATION
The work provided in this thesis, unless otherwise referenced, is
the researcher's own work, and has not been submitted elsewhere
for any other degree or qualification.
Student's name: Hussein A. Al Mogiar حسین أمین المغیر: اسم الطالب
Signature:............................... التوقیع:
Date: 09/09/2015 التاریخ :

Islamic University of Gaza Deanery of Higher Studies Faculty of Science Department of Physics
Dye-Sensitized Solar Cell Using Natural Dyes Extracted
From Dried Flowers
الخالیا الشمسیة ذات األصباغ الطبیعیة المستخلصة من الزھور المجففة
By
Hussein Amin Al Mogiar
B.Sc. in Physics, Islamic University of Gaza
Supervisors
Dr. Sofyan A. Taya Dr. Taher M. El-Agez
Associate Professor of Physics Associate Professor of Physics
Submitted to the Faculty of Science as a Partial Fulfillment of the Master Degree
of Science (M. Sc.) in Physics
1436 – 2015

i

ii
Dedication
This thesis is dedicated to:
My great teacher Prophet Muhammad
(May Allah bless and grant him)
who taught us the purpose of life,
My homeland Palestine; the warmest womb,
The great martyrs and prisoners; the symbol of sacrifice,
My heart mother; for here endless love, support and encouragement,
My dear father; who never stop giving of themselves in countless ways,
My beloved brothers; Abed Allah and Ahmed whom my support in life,
My dearest wife; who stands by me when things look bleak
and the symbol of love and support,
My beloved kids: Rim, Raghad, Fatmeh and Anas; whom I can't force myself
to stop loving,
All friends and family; who encourage and support me all the time,
I dedicate this research
Hussein Amin Al Mogiar

iii
Acknowledgments In the name of Allah the most compassionate all praise be to Allah, the Lord of the
worlds; and prayers and peace be upon Mohamed His servant and messenger.
Firstly, I must acknowledge my limitless thanks to Allah; the Ever-Thankful, for His
help and bless. I am totally sure that this work would have never become truth,
without His guidance.
I owe a deep debt of gratitude to our university for giving us an opportunity to
complete this work. I am grateful to my supervisors Dr. Sofyan Taya and Dr. Taher
El-Agez for their constant support and whose help, and encouragement helped me in
all time of research for arranging and writing of this thesis. I would like to take this
opportunity to say warm thanks to Hatem El Ghamri and all my beloved friends;
Islam Radwan, Mohanned Dawood and Mohammed Al Qrenawy, Ahmed Al Ghouti,
who have been so supportive along the way of doing my thesis. I also would like to
express my wholehearted thanks to my father and mother for giving me the love and
support. I would like to thank my family for their generous support they provided me
throughout my entire life and particularly through the process of pursuing the master
degree. Because of their unconditional love and prayers, I have the chance to
complete this thesis. I owe profound gratitude to my wife, whose constant
encouragement, limitless giving and great sacrifice, helped me accomplish my degree.
Personally, I'd like to thank all those who have helped with their advice and efforts.

iv
Abstract
In this thesis, dye sensitized solar cells (DSSCs) were prepared using titanium dioxide
(TiO2) as a semiconducting layer spread on transparent conducting fluorine tin oxide
(FTO) coated glass using doctor blade method and based on three natural dyes
extracted from Hibiscus Rosa Sinensis, Hibiscus Sabdariffa and Rosa Damascena
flowers as sensitizers.
Three processes were conducted to improve the performance of prepared solar cells
namely pre and post-treatment of TiO2 and FTO layers with three acids, changing the
pH of the extract solution, and capping TiO2 particles with ZnO layer.
Many measurements were conducted on all DSSCs such as UV-Vis absorption
spectra in the range of 400 nm to 800 nm of all dyes, J-V characteristic curves under
100 mW/cm2 illumination, and impedance spectroscopy under dark and illumination.
Many of the photovoltaic parameters of the cells were presented.
The best performance was obtained for the DSSC sensitized with Hibiscus Sabdariffa
dye solution without treatment with Jsc of 1.18 mA/cm², Voc of 0.46 V, FF of 0.51,
and an efficiency η of 0.28%. When the treatment processes were applied to DSSC
sensitized with Hibiscus Sabdariffa, the efficiency was lowered for all treatments. The
treatment of the dye solution of Hibiscus Rosa Sinensis with hydrochloric acid to get
pH of 2.0 showed an efficiency improvement of 400%.

v
Abstract in Arabic
في ھذا البحث، تم تحضیر الخلیة الشمسیة الصبغیة بواسطة مادة ثاني أك سید التیت انیوم كطبق ة ش بھ موص لة حی ث
باس تخدام طریق ة ال دكتور ب الد واعتم دت عل ى ثالث ة أص باغ طبیعی ة م ستخرجة م ن ) FTO(لت على زجاج تشك
.الزھور وھي زھرة الفونوغراف وزھرة الكركدیھ وزھرة الجوري
باس تخدام TiO2 وطبق ة FTOتم تطبیق ثالث دراسات لتح سین أداء الخالی ا الشم سیة وھ ي معالج ة س طح طبق ة
تغیی ر درج ة الحموض ة لمحل ول األص باغ المستخل صة وتغطی ة جزیئ ات م ادة ث اني أك سید ثالثة أحماض و ت أثیر
.التیتانیوم باستخدام طبقة من أكسید الزنك
الجھد لكل الخالیا تحت شدة إض اءة -تم قیاس االمتصاص الطیفي للصبغات الثالث وقیاس ودراسة منحنیات التیار
100 mW/cm2یر ال الم واإلض اءة إض افة إل ى ع رض ك ل الق یم والمتغی رات وقیاس الممانعة الطیفیة تحت تأث
.الخاصة بالخالیا
تم الحصول على أفضل نتیجة للخالیا الشمسیة الصبغیة باستخدام محلول صبغة الكركدیھ وذلك بدون استخدام أي
عن د تطبی ق%. 0.28 و الكفاءة تساوي FF=0.51 و Voc=0.46v و Jsc=1.18 mA/cm²معالجة حیث كانت
إن معالج ة . الدراسات المحسنة للكفاءة أظھر استخدام محلول صبغة الكركدیھ انخفاضا ملحوظا في كل الدراس ات
محل ول ص بغة الفون وغراف باس تخدام محل ول مخف ف م ن حم ض الھی دروكلوریك لی صبح ال رقم الھی دروجیني
%. 400 أظھرت زیادة في الكفاءة بقیمة تساوي 2.0یساوي

vi
Contents
Dedication.................................................................................................................. ii
Acknowledgments......................................................................................................iii
Abstract...................................................................................................................... iv
Abstract in Arabic...................................................................................................... v
List of Figures............................................................................................................ ix
List of Tables............................................................................................................. xii
Symbols..................................................................................................................... xiv
Chapter One : Introduction
1.1. History of energy sources............................................................................... 1
1.1.1. Non-renewable energy sources............................................................... 1
1.1.2. Renewable energy sources.......................................................................... 1
1.2. Solar irradiation and availability of solar electricity........................................... 1
1.3. Air mass.............................................................................................................. 2
1.4. Types of solar energy conversion........................................................ ........... 3
1.4.1. Thermal solar energy conversion................................................................ 4
1.4.2. Thermoelectric solar energy conversion..................................................... 4
1.4.3. Photoelectric solar energy conversion........................................................ 4
1.4.4. Chemical solar energy conversion.............................................................. 4
1.5. Solar electricity............... ........... ....................................................................... 5
1.6. Types of solar cells............................................................................................. 5
1.6.1. Single-crystalline and polycrystalline silicon solar cells............................ 5
1.6.2. Thin film solar cells.................................................................................... 6
1.6.3. Photoelectrochemical solar cells................................................................. 6
1.7. Electricity problem in Gaza................................................................................ 7
1.8. State of the art..................................................................................................... 8
1.9. Aim of this work................................................................................................. 9
Chapter Two : Dye-Sensitized Solar Cells (DSSCs)
2.1. Introduction......................................................................................................... 10
2.2. Materials of a dye-sensitized solar cell............................................................... 10
2.2.1. Substrates.................................................................................................... 10

vii
2.2.2. Nanoparticle electrodes............................................................................... 10
2.2.3. Sensitizer dyes............................................................................................ 11
2.2.4. Electrolytes................................................................................................. 12
2.2.5. Counter-electrode catalysts......................................................................... 12
2.2.6. Sealing......................................................................................................... 13
2.3. Operating principle............................................................................................. 13
2.4. Parameters of solar cells......................................................................................15
2.4.1. Short circuit current density Jsc................................................................... 15
2.4.2. Open circuit potential Voc........................................................................... 15
2.4.3. Optimum voltage Vm.................................................................................. 16
2.4.4. Optimum current density Jm........................................................................ 16
2.4.5. Fill factor..................................................................................................... 16
2.4.6. Efficiency η................................................................................................. 17
2.4.7. The simple electrical model of a solar cell................................................. 17
Chapter Three : Description of Instruments and Techniques Used in DSSC
Fabrication
3.1. Materials used in the preparation of DSSCs....................................................... 19
3.2. Experimental....................................................................................................... 19
3.2.1. Extraction the natural dyes........................................................................... 19
3.2.1.1. Measuring absorption spectra of natural dyes........................................ 19
3.2.2. FTO cleaning............................................................................................... 20
3.2.3. Preparing of TiO2 film................................................................................. 20
3.2.4. Sintering of TiO2 and DSSC assembly........................................................ 20
3.3. Techniques used to improve the efficiency........................................................ 21
3.3.1. FTO acidic treatment................................................................................... 21
3.3.2. TiO2 Film acidic treatment........................................................................... 21
3.3.3. Effect of changing pH of dyes..................................................................... 21
3.3.4. Successive ionic layer absorption and reaction method.............................. 21
3.4. Description of instruments.................................................................................. 22
3.4.1. Autolab PGSTAT 302N............................................................................... 22
3.4.2. Ultraviolet and visible absorption spectroscopy (UV-Vis).......................... 25
3.4.3. J-V measurement systems of solar cell........................................................25

viii
3.4.4. Diffuse reflectance and Kubelka-Munk....................................................... 26
Chapter Four : Results And Discussion
4.1. Sensitization of DSSCs by three plant flowers................................................... 29
4.1.1. Absorption spectra of the extracts................................................................ 29
4.1.2. Photovoltaic parameters............................................................................... 30
4.2. FTO acidic treatment.......................................................................................... 34
4.2.1. J-V characterizations.................................................................................... 34
4.3. Acidic treatment of TiO2..................................................................................... 37
4.3.1. J-V characterizations.................................................................................... 38
4.4. Effect of the pH of dye solutions........................................................................ 41
4.4.1. J-V characterizations.................................................................................... 41
4.5. Effect of SILAR method to improve the efficiency of DSSCs........................... 48
4.6. Electrochemical impedance spectroscopy.......................................................... 49
4.6.1. Electrochemical impedance spectroscopy of the untreated cell................... 49
4.6.2. Electrochemical impedance spectroscopy of the DSSC sensitized by Hibiscus
Rosa Sinensis with post treated TiO2 layer with Nitric acid......................... 51
4.6.3. Electrochemical impedance spectroscopy of the DSSC sensitized by Hibiscus
Rosa Sinensis of pH of 5.5............................................................................ 53
Chapter Five
Conclusion................................................................................................................. 60
References.................................................................................................................. 62

ix
List Of Figures
Chapter One
Figure 1.1 Spectral distribution of solar radiation on: a) the surface of the Sun (black
body), b) the top of the Earth's atmosphere (AM0), c) the Earth's
atmosphere layer (AM1.5)....................................................................... 3
Chapter Two
Figure 2.1 The working principle of dye-sensitized nanostructured solar cell.......... 14
Figure 2.2 Schematic energy diagram....................................................................... 14
Figure 2.3 Typical J-V curve of a solar cell showing the open circuit voltage Voc,
short circuit current Isc, and the maximum power point Pm...................... 16
Figure 2.4 Equivalent circuit of a solar cell including series and shunt resistances.. 17
Figure 2.5 Effect of (a) reducing parallel resistance and (b) increasing series
resistance................................................................................................... 18
Chapter Three
Figure 3.1 Doctor blade method to spread the TiO2 paste on the FTO coated glass. 20
Figure 3.2 The Autolab PGSTAT 302N instrument with frequency response analyzer
FRA 32 Module........................................................................................ 23
Figure 3.3 Nyquist Plots............................................................................................ 23
Figure 3.4 Bode plot showing the phase angle as a function of frecuency................ 24
Figure 3.5 Genesys 10S UV-Vis spectrophotometer................................................. 25
Figure 3.6 System of I-V measurement and solar cell simulator.............................. 26
Figure 3.7 Specular reflection diagram...................................................................... 26
Figure 3.8 Diffuse reflection diagram........................................................................ 27
Figure 3.9 Evolution 220 UV-Visible spectrophotometer instrument with ISA-220
Integrating Sphere Accessory................................................................... 28
Chapter Four
Figure 4.1 The UV-Vis absorption spectrum of the dyes extracted from Hibiscus
Rosa Sinensis, Hibiscus Sabdariffa, Rosa Damascena............................. 29
Figure 4.2 Current density-voltage characteristics curves for the DSSCs sensitized by
Hibiscus Sabdariffa, Hibiscus Rosa Sinensis and Rosa Damascena........ 30

x
Figure 4.3 Current density-voltage characteristics curves for the DSSCs sensitized by
Hibiscus Sabdariffa, Hibiscus Rosa Sinensis and Rosa Damascena........ 31
Figure 4.4 Molecular structure of anthocyanin and the binding between anthocyanin
molecule and TiO2 particles...................................................................... 32
Figure 4.5 Hibiscus Rosa Sinensis, Hibiscus Sabdariffa and Rosa Damascena........ 33
Figure 4.6 Absorption spectra of Hibiscus Rosa Sinensis dye on TiO2 film and the
extract of the same flower in ethanol........................................................ 33
Figure 4.7 Current density-voltage characteristics curves of DSSCs with the pre-
treatment of FTO layer with acids sensitized by: (1) Hibiscus Rosa Sinensis
(2) Hibiscus Sabariffa (3) Rosa Damascena (4) Hibiscus Rosa Sinensis (5)
Hibiscus Sabariffa (6) Rosa Damascena. The upper panels were presented
in acids for 5 minutes whereas the lower panels for 10 minutes.............. 34
Figure 4.8 Current density-voltage characteristics curves for the DSSCs sensitized by
(1) Hibiscus Rosa Sinensis (2) Hibiscus Sabdariffa (3) Rosa Damascena
with post-treated TiO2 film by the acids for 5 minutes............................. 38
Figure 4.9 Absorption spectra of Hibiscus Rosa Sinensis extract in ethanol solution
and anthocyanin adsorbed onto TiO2 film treated with HNO3, HCl and
H3PO4........................................................................................................ 40
Figure 4.10 Current density-voltage characteristics curves for the DSSCs sensitized
by (1) Hibiscus Rosa Sinensis (3) Hibiscus Sabdariffa (5) Rosa
Damascena using acetic acid to change pH of the dye, sensitized by (2)
Hibiscus Rosa Sinensis (4) Hibiscus Sabdariffa (6) Rosa Damascena using
hydrochloric acid to change pH of the dye............................................. 42
Figure 4.11 DSSC efficiency versus the pH of the extract solution of three dyes using
acetic acid................................................................................................44
Figure 4.12 Absorption spectra of Hibiscus Rosa Sinensis extract in ethanol solution
and anthocyanin adsorbed onto TiO2 film of pH of 2 and pH of 5.5...... 46
Figure 4.13 DSSC efficiency versus the pH of the extract solution of three dyes using
hydrochloric acid.................................................................................... 47
Figure 4.14 Current density-voltage characteristics curves for the DSSCs sensitized
by Hibiscus Rosa Sinensis using SILAR Method.................................. 48
Figure 4.15 Nyquist plots of the DSSC sensitized by Hibiscus Rosa Sinensis without
any treatment at -0.4 V, -0.6 V and -0.8 V in the dark and under an
illumination of 100 mW/cm2.................................................................. 50

xi
Figure 4.16 The equivalent circuit for the DSSC sensitized by Hibiscus Rosa Sinensis
without treatments................................................................................... 50
Figure 4.17 Nyquist plots of the DSSC sensitized by Hibiscus Rosa Sinensis with post
treated TiO2 layer with Nitric acid at -0.4 V, -0.6 V and -0.8 V in the dark
and under an illumination of 100 mW/cm2............................................. 52
Figure 4.18 The equivalent circuit for the DSSC sensitized by Hibiscus Rosa Sinensis
with post treated TiO2 layer with Nitric acid.......................................... 52
Figure 4.19 Nyquist plots of the DSSC sensitized by Hibiscus Rosa Sinensis of pH of
5.5 at -0.4V in the dark and under an illumination of 100 mW/cm2.......54
Figure 4.20 The equivalent circuit for the DSSC sensitized by Hibiscus Rosa Sinensis
of pH of 5.5............................................................................................ 54
Figure 4.21 Nyquist plots of DSSCs sensitized by Hibiscus Rosa Sinensis at -0.4V
applied potential under an illumination of 100 mW/cm2........................ 56
Figure 4.22 Nyquist plots of DSSCs sensitized by Hibiscus Rosa Sinensis at -0.6V
applied potential under an illumination of 100 mW/cm2........................ 56
Figure 4.23 Nyquist plots of DSSCs sensitized by Hibiscus Rosa Sinensis at -0.8V
applied potential under an illumination of 100 mW/cm2........................ 57
Figure 4.24 Bode plots of DSSCs sensitized by Hibiscus Rosa Sinensis for the three
studies mentioned before under an illumination of 100 mW/cm2 at -0.4 V,
-0.6 V, and -0.8 V applied voltages........................................................ 57

xii
List Of Tables
Chapter Three
Table 3.1 Flowers used in this study to extract the natural dyes.............................. 19
Chapter Four
Table 4.1 Photovoltaic parameters of the DSSCs sensitized by the three natural
Dyes............................................................................................................ 31
Table 4.2 Photovoltaic parameters of the DSSCs using the treated FTO with the acids
for 5 minutes.............................................................................................. 35
Table 4.3 Photovoltaic parameters of the DSSCs sensitized by natural dyes using pre-
treatment the FTO by acids for 10 minutes............................................... 36
Table 4.4 Photovoltaic parameters of the DSSCs sensitized by natural dyes using
post-treatment of TiO2 film by acids for 5 minutes................................... 38
Table 4.5 Photovoltaic parameters of the DSSCs sensitized by the dyes with changing
the values pH using acetic acid.................................................................. 41
Table 4.6 Photovoltaic parameters of the DSSCs sensitized by the dyes with changing
the values pH using hydrochloric acid....................................................... 44
Table 4.7 Photovoltaic parameters of the DSSCs sensitized by Hibiscus Rosa Sinensis
dye using SILAR Method with three different molarities of Zncl2
solution....................................................................................................... 48
Table 4.8 Electrochemical impedance spectroscopy results from data-fitting of
Nyquist plots to the equivalent circuit model in Fig. 4.28 for the DSSC
sensitized by Hibiscus Rosa Sinensis without any treatment.................... 51
Table 4.9 Electrochemical impedance spectroscopy results from data-fitting of
Nyquist plots to the equivalent circuit model in Fig. 4.30 for the DSSC
sensitized by Hibiscus Rosa Sinensis and TiO2 post-treatment with Nitric
acid............................................................................................................. 53
Table 4.10 Electrochemical impedance spectroscopy results from data-fitting of
Nyquist plots to the equivalent circuit model in Fig. 4.32 for the DSSC
sensitized by Hibiscus Rosa Sinensis of pH of 5.5.................................. 55

xiii
Table 4.11 EIS results from data-fitting of Nyquist plots to the equivalent circuit
model in Fig. 4.33 for the DSSCs sensitized by Hibiscus Rosa Sinensis
at -0.4V applied voltage........................................................................... 58
Table 4.12 EIS results from data-fitting of Nyquist plots to the equivalent circuit
model in Fig. 4.34 for the DSSCs sensitized by Hibiscus Rosa Sinensis
at -0.6V applied voltage........................................................................... 58
Table 4.13 EIS results from data-fitting of Nyquist plots to the equivalent circuit
model in Fig. 4.35 for the DSSCs sensitized by Hibiscus Rosa Sinensis
at -0.8V applied voltage........................................................................... 59
Table 4.14 Electron lifetime calculations from Bode plots....................................... 59

xiv
Symbols K Kelvin degree
W Watt
m² Meter square
k Kilo
h Hour
nm Nano meter
Si Silicon
μm Micro meter
CdTe Cadmium telluride
a-Si Amorphous silicon
DSSC Dye-sensitized solar cells
TiO2 Titanum dioxide
ZnO Zinc oxide
Jsc Short circuit current density
Voc Open circuit potential
MW Megawatt
GPP Gaza Power Plant
mA Mille ampere
Pmax Power maximum
mV Mille volt
V Volt
pH Hydrogen number
Zncl2 Zinc dichloride
η Conversion efficiency
FTO Fluorine-doped tin oxide (SnO2:F)
Imax Optimum current
Vmax Optimum voltage
FF Fill factor
TCO Transparent conducting oxide
°C Celsius degree
eV Electron volt
g/mol Gram per mole

xv
cm³ Centimeter cubic
Iˉ Iodine
Iˉ³ Tri-iodide
Pt Platinum
P(light) Incident light
J-V Current density-voltage
Rs Series resistance
Rsh Shunt resistance
S* Excited energy state of the sensitizer
S⁺ Oxidized state of the sensitizer
S Original state
ν Frequency
ΔV Voltage difference
Z' Real impedance
Z" Imaginary impedance
EIS Electrochemical impedance spectroscopy
FRA Frequency response analyzer
DC Direct current
AC Alternative current
Z Impedance
UV-Vis Ultraviolet-Visible
SILAR Successive ionic layer absorption and reaction
P-V Power-Voltage
a.u. Arbitrary units
HCl Hydrochloric acid
H3PO4 Phosphoric acid
HNO3 Nitric acid
RCT Charge-transfer resistance
C Capacitance
CPE Constant phase element
Qo Constant phase element coefficient
ωmax Characteristic frequency
τelectron Electron lifetime

1
Chapter One
Introduction 1.1. History of energy sources Over the last 200 years, people have become more and more dependent on energy that
they dig out of the ground. In the 1700’s, almost all the energy came from wind,
water, firewood, or muscle power. About 1800, much of the energy was taken from
coal dug out of the ground. About 1900, human began to drill for oil and natural gas.
By 1950 these “fossil fuels” had mainly displaced the older energy sources except for
water power. In some parts of the world new fossil fuels are being formed even today.
After 1950, we began to use atomic energy from uranium dug from the ground.
Energy sources have been classified into nonrenewable and renewable sources.
1.1.1. Non-renewable energy sources Fossil fuels such as coal and natural gas are the main sources of energy used by
humans. They come from the decayed remains of prehistoric plants and animals
buried in the ground millions of years ago. This type of energy is expected to run out
through several decades; and the burning of fossil fuels has caused and is causing
damage to the environment of Earth such as raise the air temperature around the
Earth's surface. Moreover, they have a direct impact on human health and cause many
diseases.
1.1.2. Renewable energy sources The renewable energy sources such as sunlight, wind, rain, tides, and geothermal heat
are clean, environmentally friendly sources of energy that do not lead to pollution.
But they have high cost and low efficiency. If used wisely, however, renewable
energy supplies can last forever. Sun has always been the most powerful energy
source on Earth. Sunlight can be transformed into electricity using solar cells. Solar
cells have found applications in many different fields such as calculators, solar lamps
and even on spacecraft and satellites.
1.2. Solar irradiation and availability of solar electricity The energy of the Sun is created by the nuclear fusion reaction of hydrogen and
helium which occurs inside the sun at several million degrees. The solar radiation is

2
emitted from the Sun's photosphere at (5800-6000)°K temperature. Because all
elements are ionized to some degree at this temperature, their spectral lines are
strongly broadened so that the gaseous surface of the Sun radiates like a black body as
shown in Fig. 1.1 [1]. The solar energy that reaches Earth is determined by the
radiation of the Sun and the distance between the Earth and the Sun. The solar
radiation power just outside the Earth's atmosphere is 1.353 kW/m², a number also
called the solar constant [2]. Passing through the Earth's atmosphere, radiation is
partly absorbed by the air molecules, in particular oxygen, water vapor, and carbon
dioxide; and attenuated by scattering from air molecules, aerosols and dust particles.
Note that only 30% of total solar radiation actually hits the Earth surface
perpendicular to the Sun's path. The available solar irradiation in a certain place
depends on the latitude, the climatic type in a yearly basis, the season, the time of day,
and the weather conditions in a specific time. The total yearly solar irradiation on
horizontal surface is 1800-2300 kWh/m² in the equator, and 2000-2500 kWh/m² in the
so called "solar belt" i.e. between 20° and 30° latitude [3].
1.3. Air mass Specific solar radiation conditions are defined by the Air Mass (AM) value. AM is the
direct optical path length (atmosphere thickness). The spectral distribution and total
flux of radiation just outside the Earth's atmosphere, similar to the radiation of a Sun,
has been defined as AM0 meaning zero atmosphere as shown in Fig. 1.1. In passing
through the atmosphere the radiation becomes attenuated by complex and varying
extinction processes mentioned above. At the equator at sea level at noon when the
incidence of sunlight is vertical (α=90°, sun in zenith) and the light travels the shortest
distance through the atmosphere and air (air-mass) to the surface, the spectral solar
radiance and flux is defined as AM1. However, if the angle of light incidence is
smaller then 90°, the light has to travel through more AM than under AM1 conditions.
The relative path length through the atmosphere by the shortest geometrical path is
given by:
(1.1)
1 1
AM= ـــــــــ = ـــــــــــــ
sin α I0

3
where I0 is path length normal to the earth's surface at sea level and α is the zenith
angle. The so-called AM1.5 conditions are achieved when the sun is at an angle of
41.8° above the horizon and results in the spectral distribution shown in Fig. 1.1. This
angle of incidence is commonly encountered in western countries and hence AM1.5 is
taken as a standard condition for solar cell testing and referencing [1]. AM1.5
represents the overall yearly average solar irradiation. Therefore, it is an important
indicator for photovoltaic measurements, where the sun simulators ought to resemble
the solar spectrum as close as possible to the reality. The specific value of 1.5 has been
selected in the 1970s for standardization purposes, based on an analysis of solar
irradiance data in the conterminous United States [4].
1.4. Types of solar energy conversion
Solar energy emitted by the Sun and reaching the Earth's surface is a form of
electromagnetic radiation that is available over a wide spectral range (300−2100 nm)
where the visible spectrum range from 400 nm to 800 nm. In order to be used, the
radiation needs to be converted into an energy form suitable for our needs.
Fig. 1.1 Spectral distribution of solar radiation on: a) the surface of the Sun (black
body), b) the top of the Earth's atmosphere (AM0), c) the Earth's atmosphere
layer (AM1.5) [4,5].

4
The energy of solar radiation is directly utilized in mainly two forms:
i) direct conversion into electricity that takes place in semiconductor devices called
solar cells,
ii) accumulation of heat in solar collectors [6] .
Four different types of solar energy conversion methods are currently available for
this purpose.
1.4.1. Thermal solar energy conversion It is a famous type of solar energy conversion. It is used all over the world including
Gaza Strip, that observed in the form of black panels on rooftops houses and it is only
used to heat water. This type is very effective in summer due to the high density of
solar radiation.
1.4.2. Thermoelectric solar energy conversion Solar energy is converted into steam which in turn is converted into electricity by
rotating turbines in power plants. This technology requires large Sun collection
systems and has been applied to construct small to medium sized power plants.
1.4.3. Photoelectric solar energy conversion Photovoltaic represents a high-technology approach to converting sunlight directly
into electrical energy. The electricity obtained is direct current (dc) and can be used
directly to operate direct current devices. The (dc) current supplied by the
photovoltaic modules is converted to (ac) power of appropriate frequency using an
inverter. The high cost of solar cells is the main factor that limits the wide range use
of solar electricity.
1.4.4. Chemical solar energy conversion This path represents the conversion of solar energy into chemical energy and is
important because of its potential to overcome problems with long term storage and
transport of energy. The example of photochemical reactions of this kind is the
photocatalytic splitting of water into hydrogen and oxygen.

5
1.5. Solar electricity Solar electricity is a growing energy technology today for the huge theoretical
potential and the very high practical potential of the solar electricity make it attractive
for large-scale utilization. Direct utilization of solar radiation to produce electricity is
close to an ideal way to utilize the nature's renewable energy flow. Generating
electricity from the sun radiation has many features over other energy generation
techniques. The high cost of solar cells has been a significant obstacle for the
implementation of the solar electricity in a large scale. There is therefore an urgent
need for the development of new materials and concepts for the solar cell technology
to reduce this cost [7]. Nanotechnology plays a remarkable role in developing
nanoscale materials and utilizing them in the field of solar cells and systems that
could potentially lead to realization of low-cost solar cells in the future. These
materials include for example different types of synthetic organic materials and
inorganic nanoparticles. The solar cells based on these materials are called for
example organic solar cells or molecular solar cells.
1.6. Types of solar cells 1.6.1. Single-crystalline and polycrystalline silicon solar cells The first silicon solar cell was developed by Chapin, Fuller and Pearson at the Bell
Telephone Laboratories in the mid 1950's, and it had about 6% efficiency. Today the
efficiency of the commercial crystalline silicon solar panels is in the best case about
15% [6,7]. The energy search was accelerated in the late of 20th century. This search
resulted in a growing interest in the photovoltaic (PV) solar energy. The major
obstacle of using solar cells for terrestrial electricity generation has been a much
higher price of the solar electricity when compared to the price of electricity
generated from the traditional sources. To produce a solar cell, the semiconductor is
doped by the intentional introduction of chemical elements, with which one can
obtain a surplus of either positive charge carriers (p-conducting semiconductor layer)
or negative charge carriers (n-conducting semiconductor layer) from the
semiconductor material. If two differently doped semiconductor layers are combined,
then a so-called p-n junction results on the boundary of the layers. At this junction, an
interior electric field is built up which leads to the separation of the charge carriers
that are released by light. Through metal contacts, an electric charge can be tapped. If

6
the outer circuit is closed, a consumer is connected, then direct current flows [8]. It is
very important to know that over 95% of all the solar cells produced worldwide are
composed of the semiconductor material Silicon (Si). As the second most abundant
element in earth's crust, silicon has the advantage, of being available in sufficient
quantities, and additionally processing the material does not burden the environment.
From the manufacturers point of view this is coupled to the need for the special solar
cell grade silicon supply and from the market's point of view not very easy to achieve
at present PV system costs without governmental subsidies for customers to create
artificial markets for the solar electricity.
1.6.2. Thin film solar cells In order to decrease the material costs of crystalline silicon solar cells, research has
been directed to develop low cost thin-film solar cells, which represent the second
generation solar cells for terrestrial application. Also as direct band gap
semiconductors, the thin film semiconductor materials have much higher absorption
coefficient than silicon, and therefore typically less than 1μm thick semiconductor
layer is required, which is 100-1000 times less than that of silicon. The amount of
expensive semiconductor material is thus reduced, or on the other hand, more
expensive semiconductors can be used in the thin films. There are several
semiconductor materials that are potential candidates for thin-film solar cells, namely
copper indium gallium diselenide, cadmium telluride (CdTe), and hydrogenated
amorphous silicon (a-Si). A thin-film solar cell, also called a thin-film photovoltaic
cell, is a solar cell that is made by depositing one or more thin layers of photovoltaic
material on a substrate. It is expected that the efficiency of commercial second
generation solar modules is likely to reach 15%.
1.6.3. Photoelectrochemical solar cells The oldest type of photovoltaic cell is the photoelectrochemical solar cell, used
already by Becquerel for the discovery of the photovoltaic effect in 1839. In the
photoelectrochemical solar cell a semiconductor-electrolyte junction is used as a
photoactive layer. Michael Grätzel and Brian O’Regan invented ''Dye-sensitized solar
cells'', also called ''Grätzel cells'', in 1991 [9]. The first cells were only capable of
using light at the ultraviolet and blue end of the solar spectrum. By the turn of the
century, advances in technology were able to broaden the frequencies in which these

7
cells were able to respond. The most efficient dyes were simply known as “Black
dyes” due to their very dark colors. DSSC is considered the third generation of
photovoltaic devices for the conversion of visible light into electric energy. These
new types of solar cells are based on the photosensitization produced by the dyes on
wide band-gap semiconductors such as TiO2 (Titanium dioxide). This sensitization is
produced by the dye absorption of part of the visible light spectrum. DSSCs are low
cost solar cells because of inexpensive materials and the relative ease of the
fabrication processes. Recent studies have shown that metal oxides such as TiO2 and
ZnO (Zinc Oxide) have been successfully used as photo-anode when a dye is
adsorbed in the interior of the porous layer of the semiconductor. Even natural dyes
extracted from roots, flowers, leaves, fruits, vegetables can be used [10]. The highest
efficiency of DSSCs sensitized by Ruthenium complexes adsorbed on nanocrystalline
TiO2 has reached 12– 15% but they are still not suitable for the high cost and stability.
1.7. Electricity problem in Gaza Electricity demand in Gaza strip can reach up to 360 megawatts (MW). At its current
operating capacity, the Gaza Power Plant (GPP) can produce up to 80 MW;
supplemented by 120 MW purchased from Israeli Occupation Authorities and 22 MW
from Egypt. The majority of Gazan households have power cuts of at least eight hours
per day. Some have no electricity for long as 12 hours a day. For years now, Gaza is
suffering from a chronic crisis in the electricity supply. This crisis is an extension of
an ongoing series of crises escalating in severity in accordance with the changes in
conditions and contexts affecting such crisis. The total amount of electricity available
can meet approximately two-thirds of the demand. The chronic electricity deficit
affecting Gaza over the past few years has disrupted the delivery of basic services and
many fields in the daily life. Since February 2012, the situation has further
deteriorated following a sharp decline in the amount of fuel brought into Gaza from
Egypt and used to operate the GPP. As a result the people depend on back-up
generators. Private mobile generators can be particularly unsafe, environmentally
polluting, and are not affordable with the poorest people. The generating capacity and
reliability of the GPP has been significantly impaired over the past six years as the
destruction of six transformers by an Israeli airstrike in 2006.
Power cuts place immense pressure on Gaza's crumbling electrical grid impacting
water and sanitation infrastructure, where lowered hygiene standards. Thus increasing

8
the pollution level of partially treated sewage discharged into the sea. There is also the
risk of back-flow of sewage onto streets, disrupting healthcare delivery and adding
misery to the lives of civilians.
1.8. State of the art In 1991, Grätzel and his co-workers developed a solar cell with energy conversion
efficiency exceeding 7%. This solar cell was called the dye sensitized solar cell
(DSSC) or the "Grätzel cell" [9], After its invention, an increasing interest has been
shown in the fabrication and development of DSSCs. In 1993, DSSCs gives 10.3%
conversion efficiency using a ruthenium dye sensitizer, which contained one
ruthenium center and was thus simpler than the ruthenium dye reported in 1991 [10].
In 2001, DSSCs with 10.4% to 11.1% efficiency were fabricated using a ruthenium
dye called ‘black dye’. Although black dye looks green in solvent, on a porous
nanocrystalline-TiO2 electrode the DSSC looks black, because its wide absorption
band covers the entire visible range of wavelengths [11,12]. In 2004, DSSC were
assembled using natural dyes extracted from black rice, capsicum, erythrina, variegate
flower, Rosa xanthina, and kelp as sensitizers [13]. The Isc ranging from 0.225
mA/cm² to 1.142 mA/cm², the Voc ranging from 0.412 V to 0.551 V, the fill factor
ranging from 0.52 to 0.63, and Pm ranging from 58 μW to 327 μW were obtained
from the DSSC sensitized with natural dye extracts. In 2007, some experimental data
for analyzing the various dye’s absorption spectra, which can be applied in the DSSC,
have been presents [14]. The analysis of dyes focused on the natural dyes which are
extracted from the plants and compared with the chemical ones. The results showed
that natural dyes have wider absorption spectra than the chemical synthesis due to the
more various constituents in the natural dyes. In 2009, The performances of DSSCs
assembled by using natural dyes extracted from spinach, amaranth and a mixture of
them were investigated [15]. In the sun, the Voc of cells sensitized by spinach extract
was 450 mV, while those sensitized by the mixture showed a Voc above 500 mV. In
2010, twenty natural dyes, extracted from natural materials such as flowers, leaves,
fruits, traditional Chinese medicines, and beverages, were used as sensitizers to
fabricate DSSCs. The photoelectrochemical performance of the DSSCs based on
these dyes showed that the open circuit voltages (Voc) varied from 0.337 to 0.689 V,
and the short circuit photocurrent density (Jsc) ranged from 0.14 to 2.69 mA/cm² [15].
Hee-Je Kim, et. all, studied natural dye extracted from Curcuma longa L. The

9
conversion efficiency was 0.36% that enhanced to 0.6% for the acetic acid-treated
curcumin dye [16]. In 2013, The highest efficiency of DSSCs sensitized by
Ruthenium complexes adsorbed on nanocrystalline TiO2 has reached 15% [17]. S.
Suhaimi, et. all were assembled the DSSCs using different materials for the
semiconductor oxide, dye sensitizer and counter electrode and the conversion
efficiency were ranged from 6.7-8.6% [18]. A. Zulkifili, T. Kento, M. Daiki, and A.
Fujiki, evaluating the particle size of titania and the effect of the multilayer of TiO2
[19]. El-Agez et al. studied natural dyes extracted from fresh and dried plant leaves
and found that spinach oleracea extract has a better performance after drying where
the efficiency of the cell prepared with TiO2 thin film layer reached 0.29% [20,21].
M. S. Abdel-Latif et al. used Plant seeds as sensitizers and it was found that DSSCs
sensitized with the extracts of onion, rapa, and Eruca sativa seeds have efficiencies of
0.875%, 0.86%, and 0.725%, respectively [22]. Kamal S. El-Refi obtained a Jsc from
0.951 mA/cm² to 6.092 mA/cm² and Voc from 0.573V to 0.703V for DSSCs sensitized
with natural dyes. The best preformance was obtained for the DSSC sensitized with
Ziziphus jujuba with parameter Jsc of 2.671 mA/cm², Voc of 0.646 V, and an
efficiency of 1.156% [3]. Islam M. Radwan found that the pre-treatment of the FTO
with H3PO4 and the post-treatment of TiO2 with HNO3 resulted in improved
efficiencies of 130% and 250% respectively for the DSSCs sensitized by purple carrot
[23].
1.9. Aim of this work
In this thesis, DSSCs will be fabricated using TiO2 as a semiconducting layer dyed
with natural dyes extracted from flowers. Thin films of nanocrystalline TiO2 will be
prepared on transparent named Fluorine-doped tin oxide (FTO) coated glass using
doctor blade method. Three natural dyes were used such as Hibiscus Sabdariffa, Rosa
Damascena and Hibiscus Rosa Sinensis. The absorption spectra of these dyes will be
performed. Different factors will be examined such as (pH of dyes, effect of some
acids on TiO2 and FTO by using pre-treatment and post-treatment, effect of Zncl2
dissoluble as a layer above TiO2). The J-V characteristic curves of all fabricated cells
will be measured and analyzed. All DSSC parameters such as short circuit current
density (Isc), open circuit potential (Voc), optimum current (Im), optimum voltage (Vm),
conversion efficiency (η), and fill factor (FF) will be calculated. Optimization of the
fabricated cells with the best dye will be performed.

10
Chapter Two
Dye-Sensitized Solar Cells (DSSC) In this chapter, the materials used to fabricate DSSCs and the cell parameters such as
short circuit current Jsc, open circuit voltage Voc, optimum current Im, optimum
voltage Vm, fill factor and efficiency are explained. The principal of operation of
DSSCs are presented in details.
2.1. Introduction
DSSC was developed by Grätzel in 1991 which was called "Grätzel Cell". This type
of solar cells was classified as the third-generation of photovoltaic devices for the
conversion of visible light to electric energy. The principle of operation of DSSCs
depends on the photosensitization produced by the dyes adsorbed on the film surface
of porous semiconductor material, and the sensitization produced by the dye
absorption at portion of visible light spectrum.
2.2. Materials of a dye-sensitized solar cell
2.2.1. Substrates
DSSC electrodes as usually are prepared from transparent conducting oxide (TCO)
coated glass substrate. Fluorine-doped tin oxide (SnO2:F) is a famous electrode of the
standard DSSC. The main tasks of the conducting coating are collection of a current,
support the structure of the cell and as a sealing layer between the cell and ambient air
[17]. The choice of (SnO2:F) is due to the stability at a high temperatures where the
standard preparation procedure of the nanostructured TiO2 electrode includes
sintering of the deposited TiO2 film at 450-500 °C. An efficient DSSC substrate must
have low sheet resistance that is independent on temperature, high transparency, and
capability to forbid impurities from entering into the cell [24].
2.2.2. Nanoparticle electrodes
The large band gap (>3 eV) of the semiconducting oxides is very important in DSSCs
for the transparency of the semiconductor electrode for the large part of the solar
spectrum. The stable oxide semiconductors cannot absorb visible light because they
have relatively wide gaps. Sensitization of wide band gap oxide semiconductor as
TiO2 takes place with photosensitizers as natural dye where it can absorb visible
light [25]. TiO2 is a wide band gap (Eg ≈ 3.2 eV) semiconductor and has three

11
crystalline structures: anatase, rutile and brookite. Anatase is dominant in low
temperatures (<800 °C) and has some properties of the most important, such as molar
mass: 79.86 g/mol, melting point 1843 °C, boiling point 2972 °C, refractive index:
2.488 and density of 3.78 g/cm³.
TiO2 has many advantages including high photosensitivity, high structure stability
under solar irradiation and in solutions, non-toxic, and low cost. Nanoparticles of TiO2
semiconductor is used to form a porous layer so that it can provide a large surface
area and a relatively high porosity possible to adsorb enough dye for efficient light
harvesting and a relative high conversion efficiency.
2.2.3. Sensitizer dyes
The use of natural dyes as photosensitizers for the conversion of solar energy into
electricity is interesting because, on one hand it enhances the economical aspect and,
on the other, it has significant benefits from the environmental point of view [26].
There are some properties that must be available of the dye molecule as attached to
the semiconductor particle surface to achieve a high light-to-energy conversion
efficiency in the DSSC. The properties of the dye can be summarized as:
• The dye should have good adsorption onto the surface of semiconductor and
not be desorbed by the electrolyte.
• Dye should be high soluble in some solvents used in the dye impregnation.
• Dye must absorb the light in the spectrum of the solar radiation. In DSSC,
light must be only absorbed by dye molecules. The other layers
(semiconductor or electrolyte) should not absorb the light.
• Excited state energy of the dye must be slightly over the TiO2 conduction band
and the energy difference must be sufficient to permit the transfer of electrons.
Also, ground state energy level of the dye must be slightly below the
reduction-oxidation potential of the electrolyte. This is necessary to obtain
photo-voltage (conversion of solar energy to the electric energy) in a high
level and maintain a minimum level of energy losses.
• The conduction band edge of the TiO2 lie under the excited state of the dye to
cause fast electron injection.
• The dye adsorbed TiO2 surface must be stable for a long time in the working
conditions.

12
2.2.4. Electrolytes
The electrolyte function is to return the electrons of the dye to complete the close
circuit. The common electrolyte consists of iodine (Iˉ) and triiodide (Iˉ³) as a redox
pair in a solvent with possibly other substances added to improve the properties of the
electrolyte.
These properties can be summarized as follow [27]:
1. High diffusion coefficients in the solvent to enable efficient mass transport.
2. Absence of significant spectral characteristics in the visible region to prevent
absorption of incident light in the electrolyte.
3. High stability of both the reduced and oxidized forms of the couple to enable
long operating life.
4. Highly reversible couple to facilitate fast electron transfer kinetics.
5. Chemically inert toward all other components in the DSSC.
The criteria for a suitable solvent for a high efficiency liquid electrolytes can be read
as follows [28]:
1. The solvent must be liquid with low volatility at the operating temperatures
(-40°C - 80°C) to avoid freezing or expansion of the electrolyte, which would
damage the DSSCs.
2. It should have low viscosity to permit the rapid diffusion of charge
carriers.
3. The intended redox couple should be soluble in the solvent.
4. It should have a high dielectric constant to facilitate dissolution of the redox
couple.
5. The sensitizing dye should not desorbs into the solvent.
6. It must be resistant to decomposition over long periods of time.
7. And finally from the point of view of commercial production, the
solvent should be of low cost and low toxicity.
2.2.5. Counter-electrode catalysts
On the back of the DSSC there presents another glass substrate covered with a thin
layer of Pt (Platinum) used as the catalyst to regenerate Iˉ and as the cathode material.
The function of the counter electrode is to transfer the electrons arriving from the
external circuit back to the redox electrolyte. Pt is the best material to make efficient

13
devices technically. But considering high expenses, carbon cathode has been an ideal
substitute, such as carbon black, carbon nanotubes etc. In 2006, Gratzel’s group
employed carbon black as the material of counter electrode, and reaches an efficiency
of 9.1%, which is 83% of that using Pt [29].
Conducting polymers can also be used. Polyaniline film on stainless steel by
electrochemical polymerization bas been reported as a counter electrode of DSSC. It
is cheap and non-fragile [30,31].
2.2.6. Sealing
The space between the photo electrode and the counter electrode are filled with a
liquid type electrolyte for electron transfer into the cell. Therefore, an appropriate
sealing method is required to prevent the liquid electrolyte leaking out. The sealing
technique improves the durability and stability of the DSSCs. The optimal conditions
for the sealing of the DSSCs are related to the pin-hole diameter, the discharge current
and the moving velocity of the target [32]. In addition, it prevents leakage. Sealing
must be impervious to water vapor and ambient air, chemically inert towards the
electrolyte and other cell components and coalesce well to the glass substrate and
TCO coating.
2.3. Operating principle
The operation of a DSSC is shown in Fig. 2.1. Photons are converted into an electric
current by charge injection of excited dye molecules into a wide band gap
semiconductor [34]. A photon is absorbed by the dye molecule and this leads to excite
the dye to an electronically excited state (S*):
S + hν = S* (2.1)
The excited electrons are injected by excited dye molecule into the conduction band
of stable semiconductor (TiO2 electrode) and the dye becomes oxidized (S⁺):
S* = S⁺ + eˉ(TiO₂) (2.2)
The original state of the dye (S) is subsequently restored by the electron from the
electrolyte through the reduction of iodide:
2S⁺ + 3I ˉ = 2S + Iˉ³ (2.3)
The regeneration of dye from iodide prevents the capture of the conduction band
electrons through the dye oxidation. The iodide is in turn regenerated at the counter
electrode by reducing tri-iodide as follows:

14
Iˉ³ + 2eptˉ = 3Iˉ (2.4)
The electrical cycle is completed where the electron flows through the outer electrical
circuit and performs work.
Fig. 2.1 The working principle of dye-sensitized nanostructure solar cell.
Fig. 2.2 Schematic energy diagram
The performance of a DSSC is predominantly based on four energy levels of the
component: the excited state (approximately LUMO) and the ground state (HOMO)

15
of the photosensitizer, the Fermi level of the TiO2 electrode, which is located near the
conduction-band level, and the redox potential of the mediator (Iˉ/Iˉ³) in the
electrolyte.
The photocurrent obtained from a DSSC is determined by the energy difference
between the HOMO and the LUMO of the photosensitizer, analogous to the band gap,
Eg, for inorganic semiconductor materials. The smaller the HOMO–LUMO energy
gap, the larger the photocurrent will be because of the utilization of the long-
wavelength region in the solar spectrum. The energy gap between the LUMO level
and the conduction-band level of TiO2, ∆E1, is important, and the energy level of the
LUMO must be sufficiently negative with respect to the conduction band of TiO2 to
inject electrons effectively. In addition, substantial electronic coupling between the
LUMO and the conduction band of TiO2 also leads to effective electron injection. The
HOMO level of the complex must be sufficiently more positive than the redox
potential of the Iˉ/Iˉ³ redox mediator to accept electrons effectively (∆E2) [35].
2.4. Parameters of solar cells
In this section the most important parameters such as short circuit current (Jsc), open
circuit voltage (Voc), optimum current (Im), optimum voltage (Vm), fill factor (FF) and
efficiency (η) are presented.
2.4.1. Short circuit current density Jsc
This current appears when the potential difference across the cell equals to zero,
where it called short circuit cell Jsc as shown in Fig. 2.3. Jsc is equal to the absolute
number of photons converted to the hole-electron pairs. It depends on the solar cell
structure, material properties, and the operating conditions [35]. 2.4.2. Open circuit potential Voc
If the output current is zero, the cell is open circuited and the voltage of the cell is
called open circuit voltage. It depends on both the Fermi level of the semiconductor
and the level of dark current [23]. The theoretical maximum of the Voc of the cell is
determined by the difference between the Fermi level of the semiconductor and the
redox potential of the electrolyte.

16
Fig. 2.3 Typical J-V curve of a solar cell showing the open circuit voltage Voc, short
circuit current Isc, and the maximum power point Pm [23].
2.4.3. Optimum voltage Vm
Vm is the voltage at the optimum operating point (as shown in Fig. 2.3) at which the
DSSC output power is maximum. It depends on bonds between the dye molecule and
TiO2 film [3].
2.4.4. Optimum current density Jm
Jm is the current at the optimum operating point (as shown in Fig. 2.3) at which the
DSSC output power is maximum.
2.4.5. Fill factor
The ratio of peak output Vm Jm to Voc Jsc is called fill factor (FF) of a solar cell.
Mathematical formula for this concept is [6]:
(2.5) Where Pm = Vm Jm (2.6) where Pm is the maximum optimal power output. The meaning of fill factor can be
understood from its graphical representation. It indicates how much area underneath
the J-V characteristic curve is filled by the rectangle described by Vm Jm (as shown in
Fig. 2.3) in relation to the rectangle Voc Jsc. The theoretically maximum obtainable FF
is a function of the open circuit potential. Fill factors for optimized solar cells are
typically within the range of 0.6−0.75.
Vm Jm FF = ــــــــــــــــ . Voc Jsc

17
2.4.6. Efficiency η
The ratio of output electrical power of the solar cell and the power of incident light
P(in) is called the conversion of energy or efficiency. The value of P(in) at the earth
ground is approximately 100 mW/cm². The maximum efficiency can be calculated
from the J-V curve according to the relation:
(2.7)
Jsc is directly proportional to the incident optical power P(in) while Voc increases
logarithmically with the incident power so the overall efficiency of solar cell is
expected to increase logarithmically with incident power [32]. The temperature of the
cell and the quality of the illumination are very effective to obtain high efficiency, so
there is a standard conditions used in different laboratories, taking light intensity
equals 100 mW/cm², Air Mass 1.5 spectrum and a temperature cell of 25ºC.
2.4.7. The simple electrical model of a solar cell
A simple equivalent circuit corresponding to a solar cell is shown in Fig. 2.4 [3]. A
solar cell can be thought as a combination of a current source and diode in the solar
cell having series resistance (Rs) and shunt resistance (Rsh). The cell would be an ideal
cell if Rs is zero, and Rsh is infinitely large. In fact this is not a practical case.
Fig. 2.4 Equivalent circuit of a solar cell including series and shunt resistances.
The Rs is composed of the electric resistance of different materials in the cell and
interfaces between them. The resistance of the TCO layer has the biggest influence on
the series resistance. The shunt resistance measures the resistance between the
electrodes of the cell through undesirable routes for example from TiO2 film to
electrolyte. It is desired to be as high as possible. The diode model does not represent
the dye solar cell very well. The internal structure of the DSSC is more complex than
FF . Jsc Voc
η= ــــــــــــــــــــــ
P(in)

18
that of silicon solar cell. But the concepts of the series and parallel resistances can
also be applied to the DSSC. The resistance can be measured using impedance
spectroscopy. Series and parallel resistances have a considerable effect on the fill
factor as shown in Fig. 2.5. For an efficient cell we need Rs to be as small and Rsh to
be as large as possible.
[a] [b] Fig. 2.5 Effect of (a) reducing parallel resistance and (b) increasing series resistance.
The effect of Rs and Rsh is shown in Fig. 2.5. The effect of decreasing Rsh and
increasing Rs is to reduce the area of the maximum power rectangle compared to that
with area Jsc cross Voc.

19
Chapter Three
Description of Instruments and Techniques of Fabrication of DSSC
In this chapter, materials and techniques used for the preparation of DSSC are
discussed. Instruments used to fabricate and characterize the cells are described.
3.1. Materials used in the preparation of DSSCs
1. A Nanoparticle material (TiO2) as a semiconductor layers named P25.
2. Fluorine-doped tin oxide (SnO2 : F) as a conductive glass plate.
3. Natural dyes extracted from flowers coronets as listed in Table 3.1.
4. A counter electrode fabricated from FTO-coated glass, coated with of
platinum catalyst layer.
5. A redox (Iˉ/ Iˉ³) electrolyte solution.
6. Electrical contact between working and counter electrodes is achieved using
alligator clips.
3.2. Experimental
3.2.1. Extraction of natural dyes
Flowers were collected from three plants (tabulated in Table 3.1) and the coronets of
the flower were used. These coronets were first washed by distilled water, dried at
60 ºC and then 15g of each of the dried natural coronet were immersed in 10 ml of
ethyl alcohol at room temperature and in the dark for 24 hours. After filtration of the
solutions, natural dyes were obtained.
3.2.1.1. Measuring absorption spectra of natural dyes
The absorption spectra measurements of the extracted dyes (Hibiscus Sabdariffa;
Hibiscus Rosa Sinensis and Rosa Damascena) in ethyl alcohol solution were
performed using a UV-Vis spectrophotometer (400 to 800 nm).
Table 3.1 Flowers used in this study to extract the natural dyes.
No. Name of flower Name in Arabic FD.1 Hibiscus Rosa Sinensis نأحمر اللو(زھرة الفونوغراف( FD.2 Rosa Damascena ن اللوأحمر (زھرة الجوري( FD.3 Hibiscus Sabdariffa ن اللوأحمر(زھرة الكركدیھ(

20
3.2.2. FTO cleaning The conductive glass substrates Florin doped tin oxide (FTO) were cut into pieces
with area of 2.56 cm² with dimensions of 1.6 cm × 1.6 cm. The substrates were
cleaned in a detergent solution using an ultrasonic bath for 20 minutes twice, then
immerging in boiling water for 30 minutes to get more cleaned, rinsed with distilled
water and ethanol, then dried for 20 minutes and kept in an oven at 60 ºC. The sheet
resistance of the (FTO) was measured and found to be 17-23 Ω/sq.
3.2.3. Preparing of TiO2 film
The TiO2 paste was prepared by adding of 2g of TiO2 nanopowder of (10-25nm) in
size (type P25), 4 ml distilled water, 10 µl acetyl acetone and 50 µl Triton X-100,
then grinding the mixture for half an hour until a homogeneous paste was obtained.
The TiO2 paste was distributed on the glass substrates using doctor blade method. To
make thin films; two pieces of tape with thickness 20 µm were used as shown in the
Fig. 3.1. After the paste was spread, the films were left to dry for 5 min. before
removing the tape, and placing them in an oven at 70 ºC for 30 min. and left to dry.
The required area of 0.25 cm² with dimensions of 0.5 cm × 0.5 cm was taken.
Fig. 3.1 Doctor blade method to spread the TiO2 paste on the FTO coated glass.
3.2.4. Sintering of TiO2 and DSSC assembly
The films were sintered at 450 ºC for 30 minutes and then were cooled down to about
100 ºC to cause more adhesion between TiO2 and dye molecule. The sintered films
were dyed for 24 hour under dark. The dyed TiO2 electrode and platinum counter
electrode were assembled to form a solar cell by sandwiching a redox (Iˉ/Iˉ³)
electrolyte solution which is composed of 2ml acetonitrile (ACN), 8 ml propylene
carbonate (p-carbonate), 0.668 gm (kI), and 0.0634 gm (I2).
It is worth mentioning that the previous steps are fixed for all what has been
accomplished in the laboratory and some other factors were changed such as changing

21
the pH value of the dye solution or increase the acidic surface of titanium dioxide;
which will be presented in detail.
3.3. Techniques used to improve the Efficiency
Four experiments were conducted, namely treating the FTO substrate and TiO2 layers
with three acids, such that pH of the dye solutions, and coating TiO2 particle with
Zinc Oxide layer.
3.3.1. FTO acidic treatment
The FTO layers were cleaned carefully using ultrasonic bath for 20 minutes twice,
then immerging in boiling water for 30 minutes, rinsed with distilled water and
ethanol, then dried in an oven at 60 °C for 20 minutes. The cleaned FTO were
immersed in diluted acids hydrochloric acid, nitric acid, and phosphoric acid for five
and ten minutes. A 0.1 M from each acid was prepared. The TiO2 past was spread
onto acidic pre-treatment FTO layers then sintered then dyed for 24 hour under dark.
3.3.2. TiO2 film acidic treatment
The sintered TiO2 films were immersed in diluted acids for five minutes then washed
by distilled water for 30 minutes in an oven at 60 °C before dying process. The acidic
treated films were dyed for 24 hour under dark then the process of the DSSC
fabrication was done as mentioned before.
3.3.3. Effect of changing pH of dye solutions.
The pH of the natural dye extracts were measured using pH meter without any
additions and found to be 6.65 for Hibiscus Rosa Sinensis, 6.15 for Rosa Damascena,
and 3.23 for Hibiscus Sabdariffa. A 0.1 molar concentration of hydrochloric acid and
acetic acid were prepared by adding drops of dilute solutions of acids to dye solutions
to change the values of the pH. The TiO2 film were dyed for 24 hour under dark by
different pH dye solutions.
3.3.4. Successive ionic layer absorption and reaction method.
The successive ionic layer absorption and reaction method (SILAR) is used to create
coatings on thin films for technological products such as photovoltaic cells. By
allowing thin films to be coated in different chemicals at or close to room
temperature, metallic films or films incorporating metallic parts can use the SILAR

22
method and avoid possible problems with damage caused by oxidation or corrosion.
Other methods of thin film deposition use the transfer of atoms to provide a coating
over thin films. The SILAR method uses the transfer of ions that provides better
coverage of chemicals over the film, and can result in a finer grain structure than other
deposition methods. One of the advantages of the SILAR method of coating thin films
is the number of different materials that can be used to create a film for a desired
application. Materials that can be used in the method include temperature sensitive
substrates such as polyester because the SILAR method is completed at or close to
room temperature. The thin film production method known as SILAR requires the
film to be immersed in the chemicals required for creating a chemical solution over
the substrate. Between each immersion of the film into the chemicals, the film is
rinsed using purified water to create the desired coating over the film. The main
advantages of the SILAR deposition method include the ease of completing the
method and the relative low cost. For small amounts of substrates to be treated using
the SILAR method, the process can be completed using glass beakers [35,36].
In this thesis, three solutions of Zinc Chloride with different molar concentrations
were prepared (0.1M, 0.05M, 0.01M). Ammonium hydroxide were added to the
different zinc chloride solutions and then white precipitate was formed. The white
precipitate must be dissolved in the zinc chloride solutions by adding more
ammonium hydroxide until Zinc Ammonium complex is formed as shown in Eq. 3.1:
ZnCl2 + NH4OH ―› ZnO + 2 HCl + NH3 (3.1)
TiO2 film was immersed into the solution for 15 seconds after heating the film to a
temperature of 100˚C. The TiO2 film directly was submerged in boiling water at
temperature 90˚C for 30 seconds to form ZnO layer. The samples were dyed for 24
hour under dark then taken to carry out the measurement.
3.4. Description of instruments
3.4.1. Autolab PGSTAT 302N
The Autolab PGSTAT 302N instrument manufactured by Metrohm Autolab company
as shown in Fig. 3.2. It is an electrochemistry instrument, that uses NOVA program as
a control software. Any cell or electrochemical interface can be described in terms of
an electric circuit, to determine the resistive, capacitive and inductive behavior of the
cell at that particular frequency [37,38].

23
Fig. 3.2 The Autolab PGSTAT 302N instrument with frequency response analyzer of
Module (FRA 32).
Electrochemical impedance spectroscopy (EIS) measurements can be performed with
the Autolab instruments in combination with the Frequency response analyzer (FRA).
In a typical electrochemical impedance measurement, the FRA module generates a
sine wave with a user-defined frequency and a small amplitude. This signal is
superimposed on the applied DC potential or current of the cell. The AC voltage and
current components are analyzed by the two FRA channels and the transfer function.
The total impedance Z is calculated, together with the phase angle shift and the real
and imaginary components of the total impedance. If the real part Re(Z) is plotted
on the X-axis and the imaginary part -Im(Z) is plotted on the Y-axis of a chart, we
get a "Nyquist Plot" is obtained as shown in Fig. 3.3. In this plot the Y-axis is
negative and each point on the Nyquist Plot is the impedance at one frequency. Fig.
3.3 has been annotated to show that low frequency (ω=0) data are on the right side of
the plot and higher frequencies (ω≈∞) are on the left.
On the Nyquist Plot the impedance can be represented as a vector (arrow) of length
|Z|. The angle between this vector and the X-axis, is called the phase angle (φ).
Fig. 3.3 Nyquist Plots

24
Nyquist Plots have one major shortcoming. Any data point on the plot, cannot tell
what frequency was used to record that point. The semicircle is characteristic of a
single "time constant". From the DSSC, Electrochemical impedance plots often
contain three semicircles; the first semicircle represent the FTO glass substrate, the
second represent the TiO2 film and the third represent the dye molecule layer.
Another popular presentation method is the Bode Plot. The impedance is plotted with
log frequency on the X-axis and both the absolute values of the impedance (|Z|=Z0)
and the phase-shift on the Y-axis.
The Bode Plot is shown in Fig. 3.4. Unlike the Nyquist Plot, the Bode Plot does show
frequency information.
Fig. 3.4 Bode plot showing the phase angle as a function of frecuency DSSC can be described in terms of an electric circuit, which is a combination of
resistances, capacitances and inductances. If such an electric circuit produces the
same response as the cell does when the same excitation signal is imposed, it is called
the equivalent electric circuit of the cell. The equivalent circuit should be as simple as
possible to represent the system targeted [37,39]. EIS can establish a hypothesis using
equivalent circuit models. A data-fitted equivalent circuit model will suggest valuable
chemical processes for the electrochemical system being studied.
In this work, EIS was measured for three cells using Autolab PGSTAT 302N with
frequency response analyzer FRA 32 Module. After analyzing the results, the
equivalent circuit for each cell was found. The cells were prepared using Hibiscus
Rosa Sinensis dye as a sensitizer. The AC amplitude were taken as -0.4 v, -0.6 v and -
0.8 v for all cells under dark and illuminated conditions for all measurements. All the
25
measurements were carried out with the NOVA software. The impedance was
measured and plotted to obtain Nyquist and Bode plots.
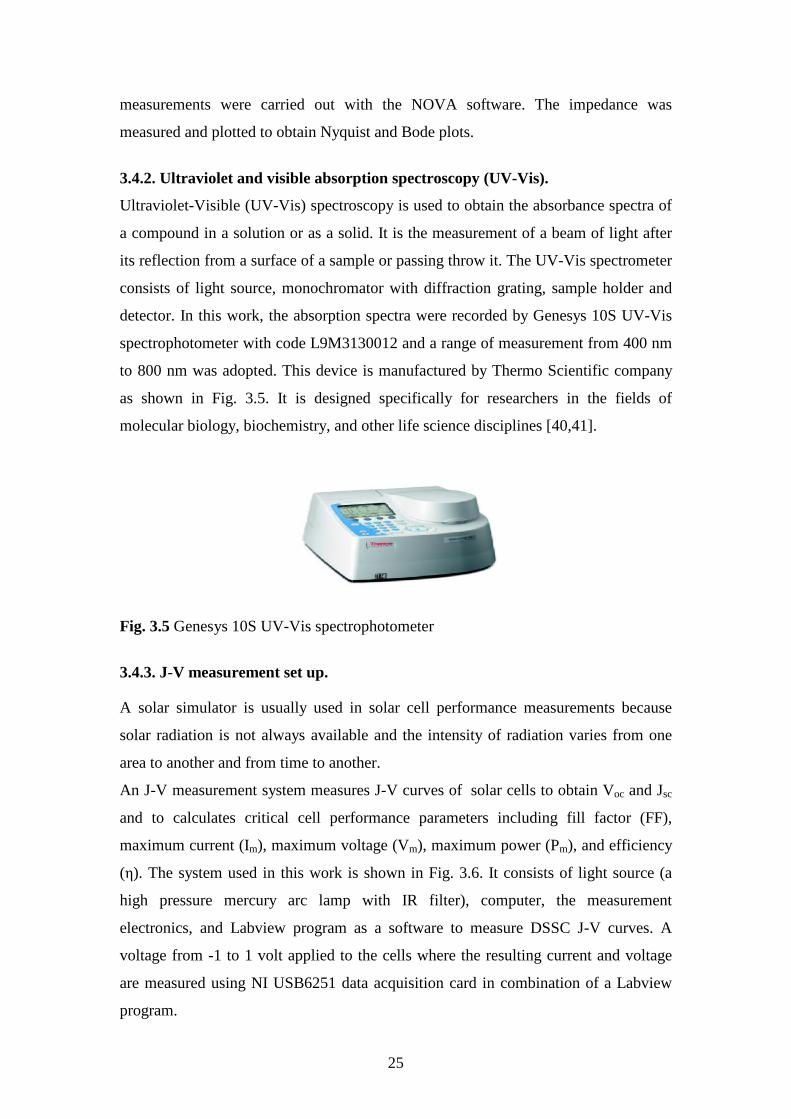
3.4.2. Ultraviolet and visible absorption spectroscopy (UV-Vis).
Ultraviolet-Visible (UV-Vis) spectroscopy is used to obtain the absorbance spectra of
a compound in a solution or as a solid. It is the measurement of a beam of light after
its reflection from a surface of a sample or passing throw it. The UV-Vis spectrometer
consists of light source, monochromator with diffraction grating, sample holder and
detector. In this work, the absorption spectra were recorded by Genesys 10S UV-Vis
spectrophotometer with code L9M3130012 and a range of measurement from 400 nm
to 800 nm was adopted. This device is manufactured by Thermo Scientific company
as shown in Fig. 3.5. It is designed specifically for researchers in the fields of
molecular biology, biochemistry, and other life science disciplines [40,41].
Fig. 3.5 Genesys 10S UV-Vis spectrophotometer
3.4.3. J-V measurement set up.
A solar simulator is usually used in solar cell performance measurements because
solar radiation is not always available and the intensity of radiation varies from one
area to another and from time to another.
An J-V measurement system measures J-V curves of solar cells to obtain Voc and Jsc
and to calculates critical cell performance parameters including fill factor (FF),
maximum current (Im), maximum voltage (Vm), maximum power (Pm), and efficiency
(η). The system used in this work is shown in Fig. 3.6. It consists of light source (a
high pressure mercury arc lamp with IR filter), computer, the measurement
electronics, and Labview program as a software to measure DSSC J-V curves. A
voltage from -1 to 1 volt applied to the cells where the resulting current and voltage
are measured using NI USB6251 data acquisition card in combination of a Labview
program.

26
Fig. 3.6 System of I-V measurement and solar cell simulator
3.4.4. Diffuse reflectance and Kubelka-Munk.
When infrared radiation is directed onto the surface of a solid sample, two types of
reflection can occur: specular reflection and diffuse reflection. The specular
component is the radiation that reflects directly off the sample surface according to
the normal reflection law; angle of reflection equals angle of incidence as shown in
Fig. 3.7. Diffuse reflection is the radiation that penetrates into the sample and then
emerges at all angles after suffering multiple reflections and refractions by the sample
particles as shown in Fig. 3.8. A diffuse reflection accessory is designed so the
diffusely reflected energy is optimized and the specular component is minimized. The
optical system collects the scattered radiation and directs it to the infrared detector.
Fig. 3.7 Specular reflection diagram

27
Fig. 3.8 Diffuse reflection diagram
A theory of diffuse reflection at scattering surfaces was derived by Munk in 1931 and
Kubelka 1948 describes optical characteristics (e.g. reflectance, transmittance and
absorptance). The Kubelka-Munk model relates sample concentration to the intensity
of the measured infrared spectrum.
The Kubelka -Munk function is given as [42]:
(3.2)
where:
R = absolute reflectance of the layer
K= molar absorption coefficient
S= scattering coefficient
The diffuse reflection spectra were collected then transformed to the absorption
spectra at the wavelength range of 200 – 800 nm with a Evolution 220 UV-Visible
spectrophotometer instrument with ISA-220 Integrating Sphere Accessory
manufactured by Thermo Scientific company as shown in Fig. 3.9. The absorption
spectra were obtained and plotted their values on Y-axis vs. the wavelength that
plotted on X-axis.
(1-R)² K
F(R)= ــــــــــــــــ = ـــــــ
S 2R

28
Fig. 3.9 Evolution 220 UV-Visible spectrophotometer instrument with ISA-220
Integrating Sphere Accessory [43].

29
Chapter Four
Results And Discussion In this chapter, the absorption spectra of the dyes are presented. The J-V characteristic
curves of the fabricated cells are studied. The output power is plotted versus the
voltage of the cell. Short circuit current Jsc, open circuit voltage Voc, fill factor FF, and
power conversion efficiency η are all presented.
4.1. Sensitization of DSSCs by three plant flowers
4.1.1. Absorption spectra of the extracts
A GENESYS 10S UV-Vis spectrophotometer was used to measure the absorption
spectra of the dye solutions extracted from dried flowers. The wavelength range of
absorption spectra analysis was taken from 400 to 800 nm. Fig. 4.1 shows the
UV–Vis absorption spectra of the natural dyes extracted from the flowers of Hibiscus
Rosa Sinensis, Hibiscus Sabdariffa, and Rosa Damascena.
400 500 600 700 800
(a.u
.)
Wavelength (nm)
Hibiscus Rosa Sinensis Hibiscus Sabdariffa Rosa Damascena
Fig. 4.1. The UV-Vis absorption spectra of the dyes extracted from Hibiscus Rosa
Sinensis, Hibiscus Sabdariffa, and Rosa Damascena.
The absorption spectra of the extracts showed the presence of distinct absorption
peaks in the visible region. The absorption peaks of Hibiscus Sabdariffa dye can be
seen at about 545 nm and 664 nm. The absorption peak of Rosa Damascena dye is at
541.63 nm and those of Hibiscus Rosa Sinensis dye are at 442 nm and 548 nm. It is
found that the dye extracted from Hibiscus Rosa Sinensis has a wide absorption band

30
with peaks at about 548 nm and 440 nm. The absorption spectrum of Hibiscus Rosa
Sinensis dye solution was in agreement with those reported by Fernando and
Senadeera [44] for Hibiscus Rosa Sinensis dye that was extracted using acidified
ethanol, which resulted in an absorption peak at 540 nm where the anthocyanin is the
effective material that caused the peaks. The difference in the absorption
characteristics resulted from the different types of functional groups on the
anthocyanins and the colors of the extracts [44].
4.1.2. Photovoltaic parameters
The J-V measurements of the DSSCs sensitized using the extracts of the three natural
dyes are presented in Fig. 4.2. For each DSSC, the measured current density J versus
the voltage V is presented at light intensity of 100 mW/cm2. The power P is plotted
versus the voltage for each DSSC as shown in Fig. 4.3. Through the study and
analysis of these curves the cell parameters can be determined. The maximum power
point is determined from the P-V curves from which Jm and Vm can be obtained. The
fill factor and cell efficiency are calculated using Eq. (2.1) and Eq. (2.3). All the
photovoltaic parameters of the fabricated DSSCs are listed in Table 4.1.
-1.6
-1.2
-0.8
-0.4
0.00.0 0.1 0.2 0.3 0.4 0.5 0.6
J (m
A/c
m²)
voltage (V)
Hibiscus Sabdariffa Rosa Damascena Hibiscus Rosa Sinensis
Fig. 4.2. Current density-voltage characteristics curves for the DSSCs sensitized by
Hibiscus Sabdariffa, Hibiscus Rosa Sinensis, and Rosa Damascena.

31
0.0 0.1 0.2 0.3 0.4 0.5 0.60.0
0.1
0.2
0.3
0.4
pow
er (m
W/c
m²)
voltage (V)
Hibiscus Sabdariffa Rosa Damascena Hibiscus Rosa Sinensis
Fig. 4.3. Power-voltage characteristics curves for the DSSCs sensitized by Hibiscus
Sabdariffa, Hibiscus Rosa Sinensis and Rosa Damascena.
Table 4.1 Photovoltaic parameters of the DSSCs sensitized by the three natural dyes.
Dye Voc (V)
Jsc (mA/cm²)
Vm (V)
Jm (mA/cm²) FF η
%
Hibiscus Rosa Sinensis 0.55 0.23 0.41 0.15 0.49 0.06
Hibiscus Sabdariffa 0.46 1.18 0.32 0.89 0.51 0.28
Rosa Damascena 0.53 0.35 0.41 0.26 0.56 0.11
As shown in Table 4.1, the Voc ranges between 0.46 V for DSSC sensitized with
Hibiscus Sabdariffa extract and 0.53 V for the cell dyed with Rosa Damascena. The
Jsc has a maximum value of 1.18 mA/cm2 for the DSSC sensitized with the dye
extracted from Hibiscus Sabdariffa, and a minimum value of 0.23 mA/cm2 for the
DSSC sensitized with the dye extracted from Hibiscus Rosa Sinensis. The fill factor
of the fabricated cells ranges from 49% to 56%. The highest fill factor was obtained
for the DSSC sensitized with the extract of Rosa Damascena and the lowest one was
observed for the cell dyed with Hibiscus Rosa Sinensis. The highest efficiency has a
value of 0.28% for the DSSC sensitized with Hibiscus Sabdariffa, while the lowest
efficiency has a value of 0.06% for the DSSC sensitized with Hibiscus Rosa Sinensis.

32
The low fill factor may be caused from poor connection between material interfaces
and low mobility of electrolyte [45]. Moreover, the resistance of Iˉ³ diffusion
increases with decreasing the concentration of Iˉ³ leading to a lower FF [46]. The low
values of efficiency in the fabricated DSSCs may be due to the fast charge
recombination rate, lower electron transfer from the dye molecule to the conduction
band of TiO2 or incompatibility between the conduction band edge of TiO2 and the
energy of the excited state of the adsorbed dye [47].
According to Table 4.1 and Fig. 4.1, Hibiscus Sabdariffa dye showed the best
efficiency according to the good photo-to-electric conversion that for high absorbance
of photons, but when treatments were applied to improve the efficiency, to be
presented later the efficiency was damped for all treatment processes whereas
Hibiscus Rosa Sinensis showed the best efficiencies improvement after applying the
treatments may be connected with large area of the absorption peak and faster injection
of the electrons. So, Hibiscus Rosa Sinensis was chosen as a main sensitizer for further
studies.
The Hibiscus Rosa Sinensis contains high content of anthocyanin pigments [44]. The
advantage of anthocyanin is the binding of hydroxyl and carbonyl groups to the
surface of the porous TiO2 film as shown in Fig. 4.4. This causes electron transfer
from the anthocyanin molecule to the conduction band of TiO2. The difference in the
absorption characteristics resulted from the different types of functional groups on the
anthocyanin and the colors of the extracts affected by the pH [48]. There are many
colors of Hibiscus Rosa Sinensis dyes as red, yellow, violet, white and pink. The
flowers used in this work were red colored as shown in Fig. 4.5.
Fig. 4.4. Molecular structure of anthocyanin and the binding between anthocyanin
molecule and TiO2 particles [23]

33
Fig. 4.5. Hibiscus Rosa Sinensis, Hibiscus Sabdariffa, and Rosa Damascena flowers. According to the Kubelka-Munk relationship, the diffuse reflectance spectra were
collected with a Evolution 220 UV-Visible spectrophotometer instrument with
ISA-220 Integrating Sphere Accessory and transformed to the absorption spectra.
Fig. 4.6 shows the absorption spectra of TiO2 electrode after being dyed with Hibiscus
Rosa Sinensis and that of the extract from Hibiscus Rosa Sinensis in ethanol.
The absorption spectrum for the extracted dye in ethanol shows a peak at
wavelength of 548 nm where the absorption spectrum for that adsorbed onto TiO2
film shows a wider one at a wavelength of 585 nm. This refers to the red shifted
towards higher wavelength according to the bonding strength between anthocyanin
and TiO2 ions [49].
400 500 600 700 800
(a.u
.)
Wavelength (nm)
Dye solution in ethanol Dye adsorbed on TiO2
Fig. 4.6. Absorption spectra of Hibiscus Rosa Sinensis dye on TiO2 film and the
extract of the same flower in ethanol.

34
4.2. FTO acidic treatment
In this process, the FTO layer was pre-treated with hydrochloric (HCl), phosphoric
(H3PO4), and nitric acids (HNO3). The FTO substrates were immersed in 0.1M of one
of the acids for 5 minutes and then washed by distilled water and dried in an oven at
60 °C for 30 minutes. TiO2 paste was distributed on the treated glass substrates using
doctor blade method then dyed with dye solutions at room temperature for 24 hours
and finally the DSSCs were assembled. The same steps of FTO acid pre-treatment
were repeated for a time of immersion of 10 minutes.
4.2.1. J-V characterizations
-0.3
-0.2
-0.1
0.00.0 0.2 0.4 0.6
J (m
A/c
m²)
voltage (V)
H3PO4
HCl HNO3
Untreated
-1.2
-0.8
-0.4
0.00.0 0.2 0.4
J (m
A/c
m²)
voltage (V)
H3PO4
HCl HNO3
Untreated
-0.4
-0.2
0.00.0 0.2 0.4 0.6
J (m
A/c
m²)
voltage (V)
H3PO4
HCl HNO3
Untreated
(1) (2) (3)
-0.3
-0.2
-0.1
0.00.0 0.2 0.4 0.6
J (m
A/c
m²)
voltage (V)
H3PO
4
HCl HNO
3
Untreated
-1.2
-0.8
-0.4
0.00.0 0.2 0.4
J (m
A/c
m²)
voltage (V)
H3PO
4
HCl HNO
3
Untreated
-0.4
-0.2
0.00.0 0.2 0.4 0.6
J (m
A/c
m²)
voltage (V)
H3PO4
HCl HNO3
Untreated
(4) (5) (6)
Fig. 4.7. Current density-voltage characteristics curves of DSSCs with the pre-
treatment of FTO layer with acids sensitized by: (1) Hibiscus Rosa Sinensis (2)
Hibiscus Sabariffa (3) Rosa Damascena (4) Hibiscus Rosa Sinensis (5) Hibiscus
Sabariffa (6) Rosa Damascena. The upper panels were presented in acids for
5 minutes whereas the lower panels for 10 minutes.
Table 4.2 and Table 4.3 shows the photovoltaic parameters of the pre-treated DSSCs
using the hydrochloric (HCl), phosphoric (H3PO4), and nitric (HNO3) acids for 5 then
10 minutes, respectively.

35
Table 4.2 Photovoltaic parameters of the DSSCs using the treated FTO with the acids
for 5 minutes.
Dye Acids Voc (V)
Jsc (mA/cm²)
Vm (V)
Jm (mA/cm²) FF Η
%
Untreated 0.55 0.23 0.41 0.15 0.49 0.06 H3PO4 0.56 0.20 0.45 0.15 0.60 0.07
HCl 0.54 0.26 0.41 0.18 0.53 0.07
Hibiscus Rosa
Sinensis HNO3 0.56 0.28 0.45 0.19 0.55 0.09
Untreated 0.46 1.18 0.32 0.89 0.51 0.28 H3PO4 0.46 1.20 0.34 0.87 0.54 0.30
HCl 0.47 1.19 0.35 0.92 0.57 0.32 Hibiscus
Sabdariffa
HNO3 0.46 1.13 0.32 0.78 0.48 0.25 Untreated 0.53 0.35 0.41 0.26 0.56 0.11
H3PO4 0.51 0.28 0.40 0.19 0.52 0.08 HCl 0.51 0.29 0.40 0.20 0.54 0.08
Rosa Damascena
HNO3 0.53 0.28 0.42 0.19 0.54 0.08
The J-V characteristics of DSSCs of the treated FTO with acids for 5 minutes under
an illumination of 100 mW/cm2 are shown in the upper panels of Fig. 4.7. Table 4.2
presents the Photovoltaic parameters of the same DSSCs sensitized by the three
natural dyes under the previous conditions. The Voc ranges between 0.46 V for DSSCs
sensitized with Hibiscus Sabdariffa extract when treating FTO with H3PO4 and HNO3
acids for 5 minutes and 0.56 V for the cells dyed with Hibiscus Rosa Sinensis when
treating FTO with H3PO4 and HNO3 acids for 5 minutes. The Jsc has a maximum
value of 1.20 mA/cm2 for the DSSC sensitized with the dye extracted from Hibiscus
Sabdariffa when treating FTO with H3PO4 acid for 5 minutes, and a minimum value
of 0.2 mA/cm2 for the DSSC sensitized with the dye extracted from Hibiscus Rosa
Sinensis when treating FTO with H3PO4 acid for 5 minutes.
The fill factor of the fabricated cells changes from 48% to 60%. The highest fill factor
was obtained for the DSSC sensitized with the extract of Hibiscus Rosa Sinensis
when treating FTO with H3PO4 acid for 5 minutes and the lowest fill factor was
observed for the cell dyed with Hibiscus Sabdariffa when treating FTO with HNO3
acid for 5 minutes. The highest efficiency has a value of 0.32% for the DSSC
sensitized with Hibiscus Sabdariffa when treating FTO with HCl acid for 5 minutes,
while the lowest efficiency has the value of 0.06% for the DSSC sensitized with

36
Hibiscus Rosa Sinensis without treatment. The treatment of FTO layer by the three
acids for 5 minutes didn't improve the efficiency when the Rosa Damascena and
Hibiscus Sabdariffa dye solutions were used as photosensitizers. The pre-treatment of
the FTO with H3PO4 and HCl for 5 minutes showed an improved efficiency of 116.7%
and 150% with HNO3 for the DSSC sensitized with the dye extracted from Hibiscus
Rosa Sinensis.
Table 4.3 Photovoltaic parameters of the DSSCs sensitized by natural dyes using pre-
treatment the FTO by acids for 10 minutes.
Dye Acids Voc (V)
Jsc (mA/cm²)
Vm (V)
Jm (mA/cm²) FF η
%
Untreated 0.55 0.23 0.41 0.15 0.49 0.06 H3PO4 0.53 0.31 0.42 0.21 0.53 0.09
HCl 0.53 0.32 0.43 0.23 0.58 0.1
Hibiscus Rosa
Sinensis HNO3 0.53 0.29 0.42 0.20 0.55 0.08
Untreated 0.46 1.18 0.32 0.89 0.51 0.28 H3PO4 0.46 0.87 0.34 0.65 0.55 0.22
HCl 0.45 1.07 0.33 0.82 0.56 0.27 Hibiscus
Sabdariffa HNO3 0.45 0.88 0.33 0.61 0.51 0.20
Untreated 0.53 0.35 0.41 0.26 0.56 0.11 H3PO4 0.51 0.23 0.38 0.14 0.45 0.05
HCl 0.51 0.34 0.38 0.22 0.48 0.08 Rosa
Damascena HNO3 0.51 0.36 0.40 0.25 0.54 0.10
The treatment of the FTO layer with acids was repeated for 10 minutes and the J-V
characteristics of DSSCs are shown in the lower panels of Fig. 4.7. Table 4.3 presents
the Photovoltaic parameters of the DSSCs sensitized by the three natural dyes. The
Voc ranges between 0.45 V for DSSCs sensitized with Hibiscus Sabdariffa extract
when treating FTO with HCl and HNO3 acids for 10 minutes and 0.55 V for the cell
dyed with Hibiscus Rosa Sinensis without treating. The Jsc has a maximum value of
1.18 mA/cm2 for the DSSC sensitized with the dye extracted from Hibiscus
Sabdariffa without treating, and a minimum value of 0.23 mA/cm2 for the DSSC
sensitized with the dye extracted from Hibiscus Rosa Sinensis without treating and for
the DSSC sensitized with the dye extracted from Rosa Damascena when treating FTO
with H3PO4 acid for 10 minutes.

37
The fill factor of the fabricated cells changes from 45% to 58%. The highest fill factor
was obtained for the DSSC sensitized with the extract of Hibiscus Rosa Sinensis
when treating FTO with HCl acid for 10 minutes and the lowest fill factor was
observed for the cell dyed with Rosa Damascena when treating FTO with H3PO4 acid
for 10 minutes. The highest efficiency has a value of 0.28% for the DSSC sensitized
with Hibiscus Sabdariffa without treating whereas the lowest efficiency has the value
of 0.05% for the DSSC sensitized with Rosa Damascena when treating FTO with
H3PO4 acid for 10 minutes. The treatment of FTO by the three acids for 10 minutes
didn't improve the efficiency when the Rosa Damascena and Hibiscus Sabdariffa dye
solutions were used as photosensitizers. The improvement of the efficiency of DSSC
was appeared when treated FTO with H3PO4, HCl and HNO3 acids for 10 minutes
showed 150%, 166.7% and 133.3% improves using Hibiscus Rosa Sinensis dye
solution.
The function of this treatment is to clean and events scratches on the FTO layer. This
leads to decreasing of the sheet resistance of the FTO glass substrate and cause more
adhesion and contact points between the TiO2 film and FTO layers to improve the
efficiency and reduces the fast recombination rate and the photoelectrons can be
collected efficiently. Strong connection between material interfaces by these acids
treatment cause higher values of fill factor [47,48] as shown in Table 4.2 and Table
4.3.
4.3. Acidic treatment of TiO2
In this process, the TiO2 layer was post-treated with phosphoric acid (H3PO4), nitric
acid (HNO3) and hydrochloric acid (HCl). The FTO layers were cleaned using an
ultrasonic bath for 20 minutes twice, washed with distilled water and then dried in an
oven at 60 oC for 30 min. The TiO2 paste were spread on FTO glass substrate using
doctor blade method then sintered at 450 oC for 30 min and cooled down to 100 oC in
ambient air. The sintered TiO2 layers were immersed in 0.1M of one of the acids for
5 min and then washed with distilled water then dried in an oven for 30 min at 60 oC.
Finally, the TiO2 layers were immersed in the dye solutions at room temperature for
24 hours.

38
4.3.1. J-V characterizations
Table 4.4 Photovoltaic parameters of the DSSCs sensitized by natural dyes using
post-treatment of TiO2 film by acids for 5 minutes.
Dye Acids Voc (V)
Jsc (mA/cm²)
Vm (V)
Jm (mA/cm²) FF η
%
Untreated 0.55 0.23 0.41 0.15 0.49 0.06 H3PO4 0.55 0.41 0.43 0.29 0.55 0.12
HCl 0.57 0.36 0.44 0.27 0.58 0.12
Hibiscus Rosa
Sinensis HNO3 0.54 0.50 0.42 0.38 0.59 0.16
Untreated 0.46 1.18 0.32 0.89 0.51 0.28 H3PO4 0.43 0.23 0.32 0.15 0.48 0.05
HCl 0.45 0.90 0.32 0.66 0.52 0.21 Hibiscus
Sabdariffa HNO3 0.40 0.46 0.26 0.28 0.39 0.07
Untreated 0.53 0.35 0.41 0.26 0.56 0.11 H3PO4 0.52 0.23 0.41 0.17 0.58 0.07
HCl 0.53 0.28 0.42 0.20 0.56 0.08 Rosa
Damascena HNO3 0.52 0.23 0.38 0.16 0.50 0.06
-0.4
-0.2
0.00.0 0.2 0.4 0.6
J (m
A/c
m²)
voltage (V)
H3PO4
Hcl HNO3
Untreated -1.2
-0.8
-0.4
0.00.0 0.2 0.4
J (m
A/c
m²)
voltage (V)
H3PO4
Hcl HNO3
Untreated
(1) (2)
-0.4
-0.2
0.00.0 0.2 0.4 0.6
J (m
A/c
m²)
voltage (V)
H3PO4
Hcl HNO3
Untreated
(3)
Fig. 4.8. Current density-voltage characteristics curves for the DSSCs sensitized by
(1) Hibiscus Rosa Sinensis (2) Hibiscus Sabdariffa (3) Rosa Damascena with post-
treated TiO2 film by the acids for 5 minutes.
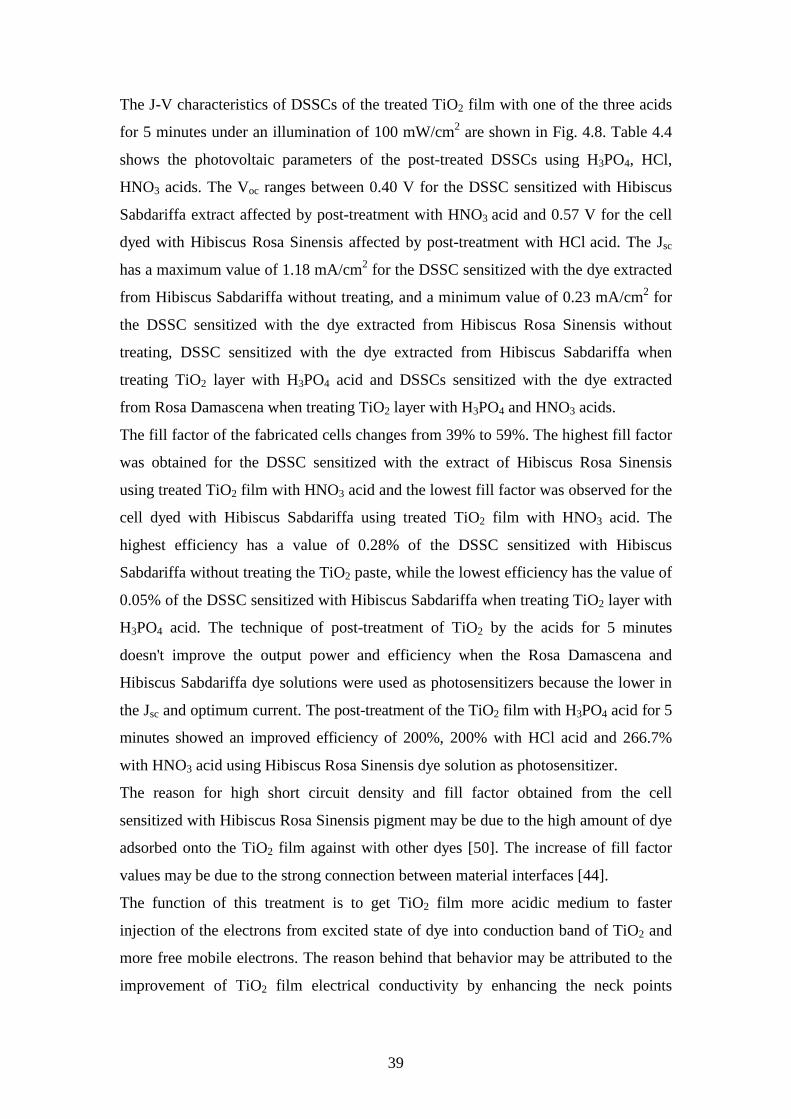
39
The J-V characteristics of DSSCs of the treated TiO2 film with one of the three acids
for 5 minutes under an illumination of 100 mW/cm2 are shown in Fig. 4.8. Table 4.4
shows the photovoltaic parameters of the post-treated DSSCs using H3PO4, HCl,
HNO3 acids. The Voc ranges between 0.40 V for the DSSC sensitized with Hibiscus
Sabdariffa extract affected by post-treatment with HNO3 acid and 0.57 V for the cell
dyed with Hibiscus Rosa Sinensis affected by post-treatment with HCl acid. The Jsc
has a maximum value of 1.18 mA/cm2 for the DSSC sensitized with the dye extracted
from Hibiscus Sabdariffa without treating, and a minimum value of 0.23 mA/cm2 for
the DSSC sensitized with the dye extracted from Hibiscus Rosa Sinensis without
treating, DSSC sensitized with the dye extracted from Hibiscus Sabdariffa when
treating TiO2 layer with H3PO4 acid and DSSCs sensitized with the dye extracted
from Rosa Damascena when treating TiO2 layer with H3PO4 and HNO3 acids.
The fill factor of the fabricated cells changes from 39% to 59%. The highest fill factor
was obtained for the DSSC sensitized with the extract of Hibiscus Rosa Sinensis
using treated TiO2 film with HNO3 acid and the lowest fill factor was observed for the
cell dyed with Hibiscus Sabdariffa using treated TiO2 film with HNO3 acid. The
highest efficiency has a value of 0.28% of the DSSC sensitized with Hibiscus
Sabdariffa without treating the TiO2 paste, while the lowest efficiency has the value of
0.05% of the DSSC sensitized with Hibiscus Sabdariffa when treating TiO2 layer with
H3PO4 acid. The technique of post-treatment of TiO2 by the acids for 5 minutes
doesn't improve the output power and efficiency when the Rosa Damascena and
Hibiscus Sabdariffa dye solutions were used as photosensitizers because the lower in
the Jsc and optimum current. The post-treatment of the TiO2 film with H3PO4 acid for 5
minutes showed an improved efficiency of 200%, 200% with HCl acid and 266.7%
with HNO3 acid using Hibiscus Rosa Sinensis dye solution as photosensitizer.
The reason for high short circuit density and fill factor obtained from the cell
sensitized with Hibiscus Rosa Sinensis pigment may be due to the high amount of dye
adsorbed onto the TiO2 film against with other dyes [50]. The increase of fill factor
values may be due to the strong connection between material interfaces [44].
The function of this treatment is to get TiO2 film more acidic medium to faster
injection of the electrons from excited state of dye into conduction band of TiO2 and
more free mobile electrons. The reason behind that behavior may be attributed to the
improvement of TiO2 film electrical conductivity by enhancing the neck points

40
between the nanoparticles, increasing dye loading and minimizing the recombination
rate between the TiO2 film and the mediator [44,51].
According to the Kubelka-Munk relationship, Fig. 4.9 shows the absorption spectra of
acid treated TiO2 electrode after being dyed with Hibiscus Rosa Sinensis and that of
the extract from Hibiscus Rosa Sinensis in ethanol.
The absorption spectrum for the extracted dye in ethanol shows a peak at a
wavelength of 548 nm. It can be observed that the absorption spectrum for that
adsorbed onto acid treated TiO2 film with HNO3, HCl, H3PO4 acids shows a wider
one at a wavelength of (581 nm, 572 nm, 553 nm) respectively. This refers to the red
shifted towards higher wavelength according to the bonding strength between
anthocyanin and TiO2 ions [49].
400 600 800
(a.u
.)
Wavelength (nm)
Dye solution in ethanol TiO2 in HNO3
400 600 800
(a.u
.)
Wavelength (nm)
Dye solution in ethanol TiO2 in HCl
400 600 800
(a.u
.)
Wavelength (nm)
Dye solution in ethanol TiO2 in H3PO4
Fig. 4.9 Absorption spectra of Hibiscus Rosa Sinensis extract in ethanol solution and
anthocyanin adsorbed onto TiO2 film treated with HNO3, HCl and H3PO4.

41
4.4. Effect of the pH of dye solution
Acetic and hydrochloric acids were used to control the pH of dye solutions. Four
different pH values ranging from 5.5 to 2.0 from Hibiscus Rosa Sinensis and Rosa
Damascena dye solutions and those ranging from 3.0 to 1.0 from Hibiscus Sabdariffa
dye solution were examined by adding 0.1 M acetic acid or 0.1 M hydrochloric acid
to the dye solutions. The starting pH of the Hibiscus Rosa Sinensis, Hibiscus
Sabdariffa and Rosa Damascena extracts in Ethanol were about 6.65, 3.23 and 6.15,
respectively. TiO2 paste was distributed on the cleaned glass substrates using doctor
blade method then dyed with different pH dye solutions at room temperature for
24 hours then connected to the solar cell simulator and J-V measurements were
carried out.
4.4.1. J-V characterizations
The J-V characteristics of DSSC of the different pH values of the dyes under an
illumination of 100 mW/cm2 are shown in Fig. 4.10.
Table 4.5 Photovoltaic parameters of the DSSCs sensitized by the dyes with changing
the values of pH using acetic acid.
Dye pH Voc (V)
Jsc (mA/cm²)
Vm (V)
Jm (mA/cm²) FF η
% Untreated 0.55 0.23 0.41 0.15 0.49 0.06
2.0 0.31 0.05 0.14 0.02 0.19 0.003 3.5 0.39 0.07 0.25 0.04 0.36 0.01 4.5 0.51 0.19 0.35 0.12 0.43 0.04
Hib
iscu
s Ros
a Si
nens
is
5.5 0.49 0.30 0.32 0.16 0.35 0.05 Untreated 0.46 1.18 0.32 0.89 0.51 0.28
1.5 0.40 0.77 0.28 0.61 0.55 0.17 2.0 0.42 0.84 0.28 0.60 0.47 0.17
Hib
iscu
s Sa
bdar
iffa
3.0 0.46 1.03 0.34 0.76 0.54 0.26 Untreated 0.53 0.35 0.41 0.26 0.56 0.11
2.0 0.46 0.24 0.34 0.16 0.49 0.05 3.5 0.48 0.25 0.37 0.17 0.53 0.06 4.5 0.49 0.25 0.37 0.14 0.42 0.05 R
osa
Dam
asce
na
5.5 0.49 0.23 0.38 0.16 0.54 0.06

42
-0.3
-0.2
-0.1
0.00.0 0.2 0.4 0.6
J (m
A/c
m²)
voltage (V)
pH=2.0 pH=3.5 pH=4.5 pH=5.5 Untreated -1.0
-0.5
0.00.0 0.2 0.4 0.6
J (m
A/c
m²)
voltage (V)
pH=2.0 pH=3.5 pH=4.5 pH=5.5 Untreated
(1) (2)
-1.2
-0.8
-0.4
0.00.0 0.2 0.4
J (m
A/cm
²)
voltage (V)
pH=1.5 pH=2.0 pH=3.0 Untreated
-1.2
-0.8
-0.4
0.00.0 0.2 0.4
J (m
A/cm
²)
voltage (V)
pH=1.5 pH=2.0 pH=3.0 Untreated
(3) (4)
-0.4
-0.2
0.00.0 0.2 0.4 0.6
J (m
A/c
m²)
voltage (V)
pH=2.0 pH=3.5 pH=4.5 pH=5.5 Untreated
-0.9
-0.6
-0.3
0.00.0 0.2 0.4 0.6
J (m
A/c
m²)
voltage (V)
PH=2.0 PH=3.5 PH=4.5 PH=5.5 Untreated
(5) (6)
Fig. 4.10. Current density-voltage characteristics curves for the DSSCs sensitized by
(1) Hibiscus Rosa Sinensis (3) Hibiscus Sabdariffa (5) Rosa Damascena using acetic
acid to change pH of the dye, and those sensitized by (2) Hibiscus Rosa Sinensis (4)
Hibiscus Sabdariffa (6) Rosa Damascena using hydrochloric acid to change pH of the
dye.

43
Table 4.5 shows the photovoltaic parameters of the DSSCs sensitized by Hibiscus
Rosa Sinensis, Hibiscus Sabdariffa and Rosa Damascena by changing the pH values
using acetic acid. As shown in Table 4.5, the Voc ranges between 0.31 V for DSSC
sensitized with Hibiscus Rosa Sinensis of pH of 2.0 to 0.55 V for DSSC sensitized
with Hibiscus Rosa Sinensis of natural pH. The Jsc has a maximum value of
1.18 mA/cm2 for the DSSC sensitized with the dye extracted from Hibiscus
Sabdariffa of natural pH and a minimum value of 0.05 mA/cm2 for the DSSC
sensitized with the dye extracted from Hibiscus Rosa Sinensis of pH of 2.0. The fill
factor of the fabricated cells changes from 19% to 56%. The highest efficiency has a
value of 0.28% for the DSSC sensitized with Hibiscus Sabdariffa of natural pH
whereas the lowest efficiency has a value of 0.003% for the DSSC sensitized with
Hibiscus Rosa Sinensis of pH of 2.0.
The acetic acid treated dyes showed poor performance in the power conversion
efficiency which may be due to changing of the molecular structure of the dye and
confirms that the acetic acid treatment does affect the dye molecules for minimizing
absorbance and upward the conduction band of the TiO2 that decreasing the values of
Voc connected with low photocurrent.
Fig. 4.11 shows the DSSC efficiency as a function of the pH of the three dyes extract
solutions using acetic acid. As observed from the Fig. 4.11, the efficiency is
diminished with decreasing the pH for all cells except of the cell dyed with Rosa
Damascena where the efficiency is enhanced from 4.5 to 3.5 pH values, after that it
declines towards lowest value at pH of 2.0.

44
2 4 60
2
4
6
effic
ienc
y (*
10-2)
pH
Acetic acid Hibiscus Rosa Sinensis
1 2 3
0.0
0.1
0.2
0.3
effic
ienc
y
pH
Acetic acid Hibiscus Sabdariffa
2 4 6
6
8
10
ef
ficie
ncy
(*10
-2)
pH
Acetic acidRosa Damascena
Fig. 4.11. DSSC efficiency versus the pH of the extract solution of three dyes using
acetic acid.
The changing of pH of dyes was repeated using hydrochloric acid. The J-V
characteristics of DSSC with pH was changed using HCl are shown in Fig. 4.10.
Table 4.6 Photovoltaic parameters of the DSSCs sensitized by the dyes with changing
the values pH using hydrochloric acid.
Dye pH Voc (V)
Jsc (mA/cm²)
Vm (V)
Jm (mA/cm²) FF η
%
Untreated 0.55 0.23 0.41 0.15 0.49 0.06 2.0 0.44 1.02 0.33 0.72 0.51 0.24 3.5 0.46 0.14 0.35 0.09 0.42 0.03 4.5 0.49 0.33 0.37 0.22 0.51 0.08
Hib
iscu
s Ros
a Si
nens
is
5.5 0.53 0.35 0.40 0.23 0.48 0.09 Untreated 0.46 1.18 0.32 0.89 0.51 0.28
1.5 0.38 0.17 0.30 0.11 0.51 0.03 2.0 0.39 0.20 0.30 0.13 0.50 0.04
Hib
iscu
s Sa
bdar
iffa
3.0 0.47 0.63 0.35 0.49 0.58 0.17 Untreated 0.53 0.35 0.41 0.26 0.56 0.11
2.0 0.45 0.85 0.34 0.59 0.52 0.20 3.5 0.46 0.48 0.36 0.31 0.50 0.11 4.5 0.48 0.31 0.36 0.20 0.48 0.07 R
osa
Dam
asce
na
5.5 0.52 0.37 0.41 0.26 0.55 0.11

45
Table 4.6 shows the photovoltaic parameters of the DSSCs sensitized by Hibiscus
Rosa Sinensis, Hibiscus Sabdariffa and Rosa Damascena by changing the pH values
using hydrochloric acid.
As shown in Table 4.6, the Voc ranges between 0.38 V for DSSC sensitized with
Hibiscus Sabdariffa of pH of 1.5 to 0.55 V for DSSC sensitized with Hibiscus Rosa
Sinensis of natural pH. The Jsc has a maximum value of 1.18 mA/cm2 for the DSSC
sensitized with the dye extracted from Hibiscus Sabdariffa of natural pH and a
minimum value of 0.14 mA/cm2 for the DSSC sensitized with the dye extracted from
Hibiscus Sabdariffa of pH of 2.0. The fill factor changes from 40% to 58% that
affected with a low series resistance, a high shunt resistance, the connection between
material interfaces and for a values of Voc [44]. The highest efficiency has a value of
0.28% for the DSSC sensitized with Hibiscus Sabdariffa of natural pH, while the
lowest efficiency has a value of 0.03% for the DSSC sensitized with Hibiscus
Sabdariffa of pH of 1.5 and with Hibiscus Rosa Sinensis of pH of 3.5.
The changing of pH using the hydrochloric acid showed an improved efficiency of
400%, 133.3% and 150% at pH of 2.0, 4.5 and 5.5, respectively using Hibiscus Rosa
Sinensis dye solution as photosensitizer and of 188% at pH of 2.0 using Rosa
Damascena. The reason of the high improvement of the conversion efficiency of the
DSSC sensitized with Hibiscus Rosa Sinensis dye at pH of 2.0 and pH of 5.5 and with
Rosa Damascena dye at pH of 2.0 may be attributed to the strong bond between dye
molecule and TiO2 film and this lead to faster injection of the electrons from excited
state of dye into conduction band of TiO2 or to the increase of the optical absorption
of the dye, as shown in Fig. 4.12. The small red shifting of the wavelength of the
optical absorption peak can be considered to be due to the change of the molecular
structure of the dye [44] as a result of change in pH especially at pH of 5.5 as shown
in Fig. 4.12. The reason for highest short circuit density may be due to the higher
amount of dye adsorbed onto the TiO2 film [50]. Some factors caused high FF, the
resistance for the electron transport in TCO substrate, large electrolyte thickness
(distance between TiO2 layer and Pt electrode), and the poor quality of Pt layer.
According to the Kubelka-Munk relationship, Fig. 4.12 shows the absorption spectra
of TiO2 electrode after being dyed with Hibiscus Rosa Sinensis and that of the extract
from Hibiscus Rosa Sinensis in ethanol.

46
The absorption spectrum of the extracted dye at pH of 6.65 in ethanol shows a peak at
a wavelength of 548 nm where the absorption spectrum of that at pH of 5.5 adsorbed
to TiO2 film shows a wider one at a wavelength of 562 nm. This refers to the red
shifted towards higher wavelength according to the boning strength between
anthocyanin and TiO2 ions [49], where no red shifting in the absorption spectrum of
the extracted dye at pH of 2.0 adsorbed to TiO2 film but show a high absorption peak
of 5 times that of the extracted dye.
Fig. 4.13 shows the DSSC efficiency as a function of the pH values of the extract
solutions of three dyes using hydrochloric acid. As observed from the Fig. 4.13, the
efficiency when dyeing the cells of DSSCs dyed with Hibiscus Rosa Sinensis is
enhanced dramatically with decreasing the pH values from 6.56 to 5.5 then it is
diminished with decreasing the pH from 4.5 to 3.5 and then it is enhanced again with
pH of 2.0 which corresponds the highest efficiency. For Hibiscus Sabdariffa dye, the
efficiency is diminished with decreasing the pH from 3.23 to 1.0. It is diminished with
decreasing the pH from 5.5 to 4.5 and then it is enhanced again with pH of 3.5 to 2.0
which corresponds the highest efficiency when using the Rosa Damascena as
photosensitizer.
400 600 800
(a.u
.)
Wavelength (nm)
Dye solution in ethanol pH=5.5 pH=2.0
Fig. 4.12. Absorption spectra of Hibiscus Rosa Sinensis extract in ethanol solution
and anthocyanin adsorbed onto TiO2 film of pH of 2.0 and pH of 5.5.

47
2 4 60.0
0.1
0.2
effic
ienc
y
pH
Hydrochloric acidHibiscus Rosa Sinensis
1 2 30.0
0.1
0.2
0.3
effic
ienc
y
pH
Hydrochloric acidHibiscus Sabdariffa
2 4 6
0.1
0.2
effic
ienc
y
pH
Hydrochloric acidRosa Damascena
Fig. 4.13. DSSC efficiency versus the pH of the extract solution of three dyes using
hydrochloric acid.

48
4.5. Effect of SILAR method to improve the efficiency of DSSCs
The TiO2 film was soaked in Zinc chloride (ZnCl2) solution with concentrations of
0.01, 0.05 and 0.1 M for 15 sec. after heating the film to 100 ºC then immersing in
boiling distilled water at temperature of 90 ºC for 30 seconds then, the TiO2 layers
were dyed at room temperature for 24 hours. The J-V characteristics of DSSC of the
treated TiO2 with ZnCl2 solution are shown in Fig. 4.14. This treatment was
performed only for DSSCs sensitized with Hibiscus Rosa Sinensis dye.
-0.24
-0.18
-0.12
-0.06
0.000.0 0.2 0.4 0.6
J (m
A/c
m²)
voltage (V)
0.01M 0.05M 0.1 M Untreated
Fig. 4.14. Current density-voltage characteristics curves for the DSSCs sensitized by
Hibiscus Rosa Sinensis using SILAR Method.
Table 4.7 Photovoltaic parameters of the DSSCs sensitized by Hibiscus Rosa
Sinensis dye using SILAR Method with three different molarities of Zncl2 solution.
Molarities Voc (V)
Jsc (mA/cm²)
Vm (V)
Jm (mA/cm²) FF η
% Untreated 0.55 0.23 0.41 0.15 0.49 0.06
0.01 M 0.58 0.15 0.45 0.09 0.47 0.04 0.05 M 0.60 0.11 0.46 0.07 0.48 0.03 0.10 M 0.58 0.13 0.45 0.08 0.48 0.04
As shown in the Table 4.7, the Voc ranges between 0.55 V for DSSC without SILAR
treatment to 0.60 V for DSSC when treating the TiO2 paste with 0.05 M. The Jsc has a
maximum value of 0.23 mA/cm2 for the DSSC without SILAR treatment and a
minimum value of 0.11 mA/cm2 for the DSSC when treating the TiO2 paste with
0.05 M. The fill factor of the fabricated cells changes from 47% to 49%. The highest

49
efficiency has a value of 0.06% for the DSSC without SILAR treatment, whereas the
lowest efficiency has a value of 0.03% for the DSSC when treating TiO2 paste with
0.05 M. The reason of the low values of the conversion efficiency of the DSSC with
SILAR treatment may be attributed to the poor bonding between dye molecule and
TiO2 film and this leads to slow injection the electrons from excited state of the dye
into the conduction band of TiO2 or may be according to the poor connection between
material interfaces.
4.6. Electrochemical impedance spectroscopy
Electrochemical impedance spectroscopy (EIS) was carried out for three DSSCs using
Autolab PGSTAT 302N with frequency response analyzer FRA 32 Module. EIS of
the DSSCs sensitized by Hibiscus Rosa Sinensis without treatment, with dye of pH of
5.5 and with post-treated TiO2 layer with nitric acid for 5 minutes, were studied.
4.6.1. Electrochemical impedance spectroscopy of the untreated cell
The electrochemical impedance spectroscopy measurements were carried out in the
dark and under an illumination of 100 mW/cm2 at -0.4V, -0.6V, and -0.8V. Fig. 4.15
shows the Nyquist plots of the DSSC sensitized by Hibiscus Rosa Sinensis without
any treatment at -0.4V, -0.6V, and -0.8V applied voltages in dark and under
illumination.
As shown in Fig. 4.15 and Table 4.8, there is a decrease in the charge-transfer
resistance (RCT). Electrochemical circle fit was obtained as shown in Fig. 4.16. The
estimated interfacial capacitance (C) can be calculated according to the Mansfield and
Hus relationship as shown in equation (4.1) from a depressed semicircle model:
C = Q0 * (ωmax)(n-1) (4.1)
where C is estimated interfacial capacitance, Qo is the CPE coefficient, ωmax is the
characteristic frequency at which the imaginary part of the impedance reaches its
maximum magnitude, and n is the exponent.

50
0 20 40 60 800
10
20
30
40
-Z'' (
kΩ)
Z' (kΩ)
Under illumination , -0.4v Under dark , -0.4v
0 3 6 9 120
2
4
6
-Z'' (
kΩ)
Z' (kΩ)
Under illumination , -0.6v Under dark , -0.6v
0 1 20.0
0.4
0.8
-Z''
(kΩ
)
Z ' (kΩ)
Under illumination , -0.8v Under dark , -0.8v
0 10 20 300
4
8
12
-Z'' (
kΩ)
Z ' (kΩ )
Under illumination-0.4v Under illumination-0.6v Under illumination-0.8v
Fig. 4.15 Nyquist plots of the DSSC sensitized by Hibiscus Rosa Sinensis without any
treatment at -0.4 V, -0.6 V and -0.8 V in the dark and under an illumination of
100 mW/cm2.
Fig. 4.16 The equivalent circuit for the DSSC sensitized by Hibiscus Rosa Sinensis
without treatments.
As shown in Fig. 4.16, RS is the series resistance, CPE is the constant phase element,
and RCT is the charge-transfer resistance. Table 4.8 shows the equivalent circuit
component values obtained from modeling the DSSCs sensitized by Hibiscus Rosa
Sinensis without any treatment.

51
Table 4.8 Electrochemical impedance spectroscopy results from data-fitting of
Nyquist plots to the equivalent circuit model in Fig. 4.16 for the DSSC sensitized by
Hibiscus Rosa Sinensis without any treatment.
Without treatments RS(Ω) RCT1(kΩ) C1(µF) RCT2(kΩ) C2(µF)
-0.4v dark 40.6 74.30 1.56 - -
-0.4v illumination 40.1 3.47 2.80 21.00 2.09
-0.6v dark 40.4 10.10 1.36 1.28 3.35
-0.6v illumination 40.0 1.60 76.30 5.05 0.93
-0.8v dark 39.0 0.28 201.00 1.91 0.84
-0.8v illumination 38.4 1.47 0.87 0.40 0.001
4.6.2. Electrochemical impedance spectroscopy of the DSSC sensitized by
Hibiscus Rosa Sinensis with post-treated TiO2 layer with Nitric acid.
Fig. 4.17 shows the Nyquist plots of the DSSC sensitized by Hibiscus Rosa Sinensis
with TiO2 was post treated with Nitric acid at -0.4V, -0.6V and -0.8V applied
voltages.
Table 4.9 presents the equivalent circuit component values obtained from modeling
the DSSCs sensitized by Hibiscus Rosa Sinensis with post treated TiO2 with Nitric
acid. Electrochemical circle fit was obtained as shown in Fig. 4.18. According to
Fig. 4.18 and Table 4.9, there is a decrease in the charge-transfer resistance (RCT)
upon exposure to an illumination of 100 mW/cm2 at all applied voltage.

52
0 25 50 75 1000
20
40
-Z'' (
kΩ)
Z' (kΩ)
Under illumination , -0.4v Under dark , -0.4v
0 3 6 9 120
2
4
6
Under illumination , -0.6v Under dark , -0.6v
-Z'' (
kΩ)
Z' (kΩ)
0.0 0.6 1.2 1.80.0
0.3
0.6
0.9
-Z'' (
kΩ)
Z' (kΩ)
Under illumination , -0.8v Under dark , -0.8v
0 4 8 12 160
2
4
6
-Z'' (
kΩ)
Z' (kΩ)
Under illumination , -0.4v Under illumination , -0.6v Under illumination , -0.8v
Fig. 4.17. Nyquist plots of the DSSC sensitized by Hibiscus Rosa Sinensis with post
treated TiO2 layer with Nitric acid at -0.4 V, -0.6 V and -0.8 V in the dark and under
an illumination of 100 mW/cm2.
Fig. 4.18. The equivalent circuit for the DSSC sensitized by Hibiscus Rosa Sinensis
with post treated TiO2 layer with Nitric acid.

53
Table 4.9 Electrochemical impedance spectroscopy results from data-fitting of
Nyquist plots to the equivalent circuit model in Fig. 4.18 for the DSSC sensitized by
Hibiscus Rosa Sinensis and TiO2 post-treatment with Nitric acid.
TiO2 post-treatment with Nitric acid RS(Ω) RCT1(kΩ) C1(µF) RCT2(Ω) C2(µF)
-0.4v dark 33.5 92.10 1.28 - -
-0.4v illumination 33.2 6.70 1.76 7.31 9.69
-0.6v dark 34.4 2.08 1.05 5.37 0.28
-0.6v illumination 32.9 1.44 63.30 3.34 0.78
-0.8v dark 33.1 1.23 0.94 0.40 2.09
-0.8v illumination 33 1.30 0.75 0.34 0.0007
4.6.3. Electrochemical impedance spectroscopy of the DSSC sensitized by
Hibiscus Rosa Sinensis solution of pH of 5.5
Fig. 4.19 shows the Nyquist plots for DSSC sensitized by Hibiscus Rosa Sinensis of
pH of 5.5 in the dark and under an illumination of 100 mW/cm2 at -0.4 V, -0.6 V and
-0.8 V applied voltages.
Electrochemical semicircle fit were obtained at -0.4V, -0.6V, and -0.8V applied
voltages and shown in Fig. 4.20. A summary of the equivalent circuit component
values obtained from modeling the DSSCs sensitized by Hibiscus Rosa Sinensis of
pH of 5.5 in the dark and under an illumination at chosen applied voltage can be
found in Table 4.10.
According to Fig. 4.20 and Table 4.10, there is a decrease in the charge-transfer
resistance (RCT) upon exposure to an illumination of 100 mW/cm2 of the DSSC
sensitized by Hibiscus Rosa Sinensis of pH 5.5 with hydrochloric acid at -0.4V,
-0.6V and -0.8V applied voltage.

54
0 14 28 420
6
12
18
- Z'' (
kΩ)
Z' (kΩ)
pH=5.5, illumination, -0.4 v pH=5.5, dark, -0.4 v
0 3 6 90
1
2
3
4
- Z'' (
kΩ)
Z' (kΩ)
pH=5.5, illumination, -0.6 v pH=5.5, dark, -0.6 v
0 1 20.0
0.3
0.6
0.9
- Z'' (
kΩ)
Z' (kΩ)
pH=5.5, illumination, -0.8 v pH=5.5, dark, -0.8 v
0 4 8 12 160
2
4
6
-Z'' (
kΩ)
Z' (kΩ)
pH=5.5 , -0.4v pH=5.5 , -0.6v pH=5.5 , -0.8v
Fig. 4.19. Nyquist plots of the DSSC sensitized by Hibiscus Rosa Sinensis of pH of
5.5 at -0.4V in the dark and under an illumination of 100 mW/cm2.
Fig. 4.20. The equivalent circuit for the DSSC sensitized by Hibiscus Rosa Sinensis
of pH of 5.5.
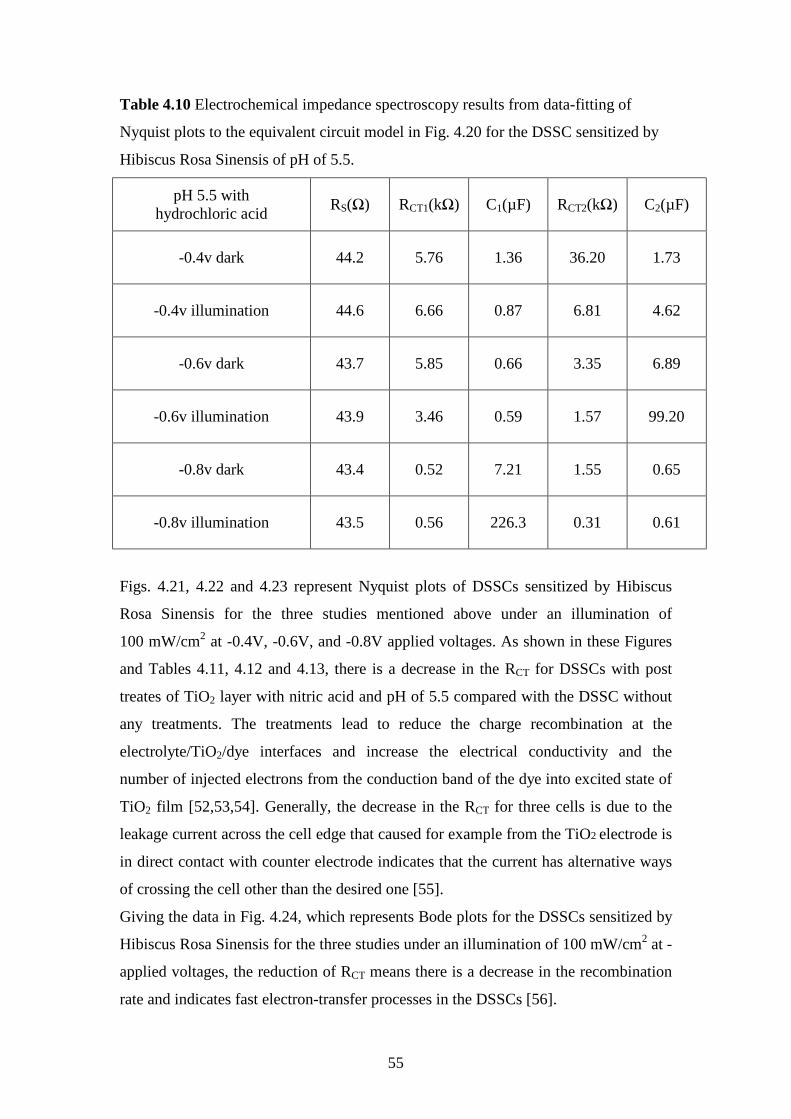
55
Table 4.10 Electrochemical impedance spectroscopy results from data-fitting of
Nyquist plots to the equivalent circuit model in Fig. 4.20 for the DSSC sensitized by
Hibiscus Rosa Sinensis of pH of 5.5.
pH 5.5 with hydrochloric acid RS(Ω) RCT1(kΩ) C1(µF) RCT2(kΩ) C2(µF)
-0.4v dark 44.2 5.76 1.36 36.20 1.73
-0.4v illumination 44.6 6.66 0.87 6.81 4.62
-0.6v dark 43.7 5.85 0.66 3.35 6.89
-0.6v illumination 43.9 3.46 0.59 1.57 99.20
-0.8v dark 43.4 0.52 7.21 1.55 0.65
-0.8v illumination 43.5 0.56 226.3 0.31 0.61
Figs. 4.21, 4.22 and 4.23 represent Nyquist plots of DSSCs sensitized by Hibiscus
Rosa Sinensis for the three studies mentioned above under an illumination of
100 mW/cm2 at -0.4V, -0.6V, and -0.8V applied voltages. As shown in these Figures
and Tables 4.11, 4.12 and 4.13, there is a decrease in the RCT for DSSCs with post
treates of TiO2 layer with nitric acid and pH of 5.5 compared with the DSSC without
any treatments. The treatments lead to reduce the charge recombination at the
electrolyte/TiO2/dye interfaces and increase the electrical conductivity and the
number of injected electrons from the conduction band of the dye into excited state of
TiO2 film [52,53,54]. Generally, the decrease in the RCT for three cells is due to the
leakage current across the cell edge that caused for example from the TiO2 electrode is
in direct contact with counter electrode indicates that the current has alternative ways
of crossing the cell other than the desired one [55].
Giving the data in Fig. 4.24, which represents Bode plots for the DSSCs sensitized by
Hibiscus Rosa Sinensis for the three studies under an illumination of 100 mW/cm2 at -
applied voltages, the reduction of RCT means there is a decrease in the recombination
rate and indicates fast electron-transfer processes in the DSSCs [56].

56
0 10 20 300
3
6
9
12
-Z'' (
kΩ)
Z' (kΩ)
Without treatments TiO2 treated with HNO3
Dye of pH of 5.5
Fig. 4.21. Nyquist plots of DSSCs sensitized by Hibiscus Rosa Sinensis at -0.4V
applied potential under an illumination of 100 mW/cm2.
0 2 4 6 80
1
2
3
-Z'' (
kΩ)
Z' (kΩ)
Without treatments TiO2 treated with HNO3
Dye of pH of 5.5
Fig. 4.22. Nyquist plots of DSSCs sensitized by Hibiscus Rosa Sinensis at -0.6V
applied potential under an illumination of 100 mW/cm2.

57
0.0 0.5 1.0 1.5 2.00.0
0.3
0.6
0.9
-Z'' (
kΩ)
Z' (kΩ)
Without treatments TiO2 treated with HNO3
Dye of pH of 5.5
Fig. 4.23. Nyquist plots of DSSCs sensitized by Hibiscus Rosa Sinensis at -0.8V
applied potential under an illumination of 100 mW/cm2.
10-1 100 101 102 103 104 105
0
20
40
60
80
Pha
se (°
)
Frequency (Hz)
-0.4v, pH=5.5 -0.4v, TiO2 HNO3
-0.4v, without
10-1 100 101 102 103 104 105
0
20
40
60
80
Pha
se (°
)
Frequency (Hz)
-0.6v, pH=5.5 -0.8v, TiO
2 HNO
3
-0.8v, without
10-1 100 101 102 103 104 105
0
20
40
60
Pha
se (°
)
Frequency (Hz)
-0.8v, pH=5.5 -0.8v, TiO2 HNO3
-0.8v, without
Fig. 4.24 Bode plots of DSSCs sensitized by Hibiscus Rosa Sinensis for the three
studies mentioned before under an illumination of 100 mW/cm2 at -0.4 V, -0.6 V, and
-0.8 V applied voltages.

58
Table 4.11 EIS results from data-fitting of Nyquist plots to the equivalent circuit
model in Fig. 4.21 for the DSSCs sensitized by Hibiscus Rosa Sinensis at -0.4V
applied voltage.
The treatment at -0.4V illumination RS(Ω) RCT1 (kΩ) C1(µF) RCT2(kΩ) C2(µF)
without treatments 40.1 3.47 2.80 21.00 2.09
nitric acid post-treatment of TiO2
33.2 6.70 1.76 7.31 9.69
pH 5.5 with hydrochloric acid 44.6 6.66 0.87 6.81 4.62
Table 4.12 EIS results from data-fitting of Nyquist plots to the equivalent circuit
model in Fig. 4.22 for the DSSCs sensitized by Hibiscus Rosa Sinensis at -0.6V
applied voltage.
The treatment at -0.6V illumination RS(Ω) RCT1 (kΩ) C1(µF) RCT2(kΩ) C2(µF)
without treatments 40.0 1.60 7.63 5.05 0.93
nitric acid post-treatment of TiO2
32.9 1.44 63.30 3.34 0.78
pH 5.5 with hydrochloric acid 43.9 1.46 0.59 1.57 99.20

59
Table 4.13 EIS results from data-fitting of Nyquist plots to the equivalent circuit
model in Fig. 4.23 for the DSSCs sensitized by Hibiscus Rosa Sinensis at -0.8V
applied voltage.
The treatment at -0.8V illumination RS(Ω) RCT (kΩ) C1(µF) RCT2(kΩ) C2(µF)
without treatments 38.4 1.47 0.87 0.40 0.001
nitric acid post-treatment of TiO2
33.0 1.30 0.94 0.39 2.09
pH 5.5 with hydrochloric acid 43.5 0.56 226.30 0.31 0.61
Table 4.14 Electron lifetime calculations from Bode plots.
The treatment f (frequency) (Hz) τelectron (ms)
-0.4V without 138.54 1.15
-0.4V nitric acid post-treatment of TiO2 380.98 0.42
-0.4V pH 5.5 with hydrochloric acid 213.18 0.75
-0.6V without 298.58 0.53
-0.6V nitric acid post-treatment of TiO2 692.45 0.23
-0.6V pH 5.5 with hydrochloric acid 421.28 0.38
-0.8V without 549.90 0.29
-0.8V nitric acid post-treatment of TiO2 1179.77 0.13
-0.8V pH 5.5 with hydrochloric acid 617.00 0.26
Life time indication for the recombination rate. Lower recombination rate is good for
high efficiency.

60
Chapter Five
Conclusions In this thesis, the DSSCs were fabricated using TiO2 as a semiconducting layer dyed
with natural dyes extracted from dried flowers. Natural dyes from three flowers were
tested as sensitizers for DSSCs and they are Hibiscus Rosa Sinensis, Hibiscus
Sabdariffa and Rosa Damascena. The aim of this thesis was to study the influences of
several treatment process on the performance of DSSCs including the effect of
changing the pH values of the dye solution using hydrochloric acid and acetic acid.
Better performance was obtained with the hydrochloric acid treatment of the dye
solution of Hibiscus Rosa Sinensis than the acetic acid. As observed from the results,
the efficiency is enhanced dramatically with decreasing the pH values of Hibiscus Rosa
Sinensis dye solution from 6.56 to 5.5 then it is diminished with decreasing the pH
from 4.5 to 3.5 and then it is enhanced again with pH of 2.0 which corresponds the
highest efficiency enhancement of about 400% using hydrochloric acid where the
efficiency is diminished from Hibiscus Sabdariffa and Rosa Damascena dye solutions
except it enhanced dramatically with decreasing the pH values from 3.5 to 2.0.
The pre-treatment of the FTO with H3PO4 for 10 minutes showed an improved
efficiency of 140%, 160% with HCl and 135% with HNO3 by using Hibiscus Rosa
Sinensis dye solution. Pre-treatment leads to decreasing of the sheet resistance of the
FTO glass substrate and cause more adhesion and contact points between the TiO2
film and FTO layers to improve the efficiency and reduces the fast recombination rate
and the photoelectrons can be collected efficiently.
HNO3, HCl and H3PO4 post-treated cells showed an efficiency of 0.16%, a short
circuit current of Jsc of 0.5 mA/cm2, an open circuit voltage of Voc of 0.54 V and a fill
factor (FF) of 0.59, efficiency of 0.12%, a short circuit current of Jsc of 0.36 mA/cm2,
an open circuit voltage of Voc of 0.57 V and a fill factor of 0.58 and efficiency of
0.12%, a short circuit current of Jsc of 0.41 mA/cm2, an open circuit voltage of Voc of
0.55 V and a fill factor of 0.55, respectively when the Hibiscus Rosa Sinensis dye
solution was used where the normal cell gave an efficiency of 0.06%, a short circuit
current of Jsc of 0.23 mA/cm2, an open circuit voltage of Voc of 0.55 V and a fill factor
of 0.49. The HNO3, HCl and H3PO4 treated cells showed an efficiency enhancement
of about 266.7%, 200% and 200% respectively.

61
SILAR treatment was applied and was found to decrease the DSSC response. The
reason of the low values of the conversion efficiency of the DSSC with SILAR
treatment may be attributed to the poor bonding between dye molecule and TiO2 film
and this leads to slow injection of the electrons from excited state of the dye into the
conduction band of TiO2 or may be according to the poor connection between
material interfaces.
These observations could be conferring to that the acid treatment contributed regular
arrangement of the photoelectrode by the dispersion of TiO2 nanoparticles which
improved the anchoring geometry of the dye on their surfaces and led to faster
electron injection. The improvement of TiO2 film electrical conductivity is achieved
by enhancing the neck points between the nanoparticles, minimizing the
recombination rate between the interfaces and increasing dye loading.
The application of natural dye to DSSCs as a photosensitizer is promising for the
realization of high cell performance, low-cost production. Incorporation of these
treatments for DSSC with existing large scale manufacturing processes could open
new directions for the development of low-cost solar cells in the future.
62
References [1] G. Wolfbauer, "Electrochemistry of Dye Sensitized Solar Cells their Sensitizer
and their Redox Shuttles", Monash University Clayton, (Australia), (1999).
[2] C. J. Winter, R. L. Sizmann and L. L. Vant-Hull, "Solar Radiation Conversion",
Springer- Verlag, Berlin, Heidelberg, (1991).
[3] K. S. El-Refi, "Dye-Sensitized Solar Cells Using TiO2 as a Semiconducting
Layer", Master thesis, Islamic University of Gaza, Gaza, (2013).
[4] C. Gueymard, D. Myers, and K. Emeryand, "Proposed reference irradiance spectra
for solar energy systems testing", Solar Energy, Vol. 73, No. 6, pp. 443-467, (2002).
[5] H. A. Mccartney and M. H. Unsworth, "Spectral distribution of solar radiation. I:
direct radiation", Quarterly Journal of the Royal Meteorological Society, Vol. 104,
No. 441, PP. 699-718, (1978).
[6] M. Zeman, ''Introduction To Photovoltaic Solar Energy'', Delft University of
Technology, Holland, (2005).
[7] A. Shah, P. orres, R. Tscharner, N. Wyrsch & H. Keppner ''Photovoltaic
Technology: The Case for Thin-Film Solar Cells'', Science, Vol. 285, No. 5427, pp. 8-
692, (1999).
[8] J. Halme, "Dye-sensitized Nanostructured and Organic Photovoltaic Cells:
Technical Review and Preliminary Tests", Master Thesis, Helsinki University of
Technology, (Finland), (2002).
[9] B. O’Regan and M. Grätzel, ''A low-cost, high-efficiency solar cell based on dye
sensitized colloidal TiO2 film'', Nature, Vol. 353, No. 6346, pp. 737-740, (1991).
[10] M. K. Nazzerruddin, A. Kay, I. Podicio, R. Humphy-Baker, E. Müller, P. Liska,
N. Vlachopoulos and M. Gratzel, "Conversion of light to electricity by cis-x2bis (2,2'-
bipyridyl-4,4'-dicarboxylaye) ruthenium (II) charge–transfers on nanocrystalline
titanium dioxide electrodes", J. Am. Chem. Soc., Vol. 115, No. 14, pp. 6382-6390,
(1993).
63
[11] K. Wongcharee, V. Meeyoo, S. Chavadej, "Dye-sensitized solar cell using
natural dyes extracted from rosella and blue pea flowers", Science Direct, Vol. 91,
No. 7, pp. 566-571, (2007).
[12] Z. S. Wang, T. Yamaguchi, H. Sugihara and H. Arakawa, Langmuir, "Significant
Efficiency Improvement of the Black Dye Sensitized Solar Cell through Protonation
of TiO2 Films", Vol. 21, No. 10, pp. 4272-4276, (2005) .
[13] T. W. Lin, J. R. Lin, S. Y. Tsai, J. N. Lee, C. C. Ting, "Absorption Spectra
Analysis of Natural Dyes for Applications in Dye- Sensitized Nano Solar Cells",
National Conference on Theoretical and Applied Mechanics, Vol. 96, No. 12, pp. 21-
22, (2007).
[14] P. Luo, H. Niu, G. Zheng, X. Bai, M. Zhang, W. Wang, "From salmon pink to
blue natural sensitizers for solar cells: Canna indica L., Salvia splendens, cowberry
and Solanum nigrum L.", Spectrochim. Acta Part A, Vol. 74, No. 4, pp. 936-942,
(2009).
[15] H. Zhou, L. Wu, Y. Gao, T. Ma, " Dye-sensitized solar cells using 20 natural
dyes as sensitizers", Journal of Photochemistry and Photobiology A: Chemistry, Vol.
219, No. 2, pp. 188-194, (2011).
[16] H. J. Kim1, D. J. Kim, S.N. Karthick, K.V. Hemalatha, C. J. Raj, S. Ok, Y. Choe,
"Curcumin Dye Extracted from Curcuma longa L. Used as Sensitizers for Efficient
Dye-Sensitized Solar Cells", Int. J. Electrochem. Sci., Vol. 8, No. 6, pp. 8320-8328,
(2013).
[17] J. Burschka, N. Pellet, Soo-J. Moon, R. Humphry-Baker, P. Gao, M.
Nazeeruddin, and M. Gratzel, "Sequential deposition as a route to high-performance
perovskite-sensitized solar cells", Nature, Vol. 499, No. 7458, pp. 316-319 (2013).
[18] S. Suhaimi, M. M. Shahimin, Z.A. Alahmed, J. Chysky, A. H. Reshak,
''Materials for Enhanced Dye-sensitized Solar Cell Performance: Electrochemical
Application'', Int. J. Electrochem. Sci., Vol. 10, No. , pp. 2859-2871, (2015).

64
[19] A. Zulkifili, T. Kento, M. Daiki, and A. Fujiki, ''The Basic Research on the Dye-
Sensitized Solar Cells (DSSC)'', Journal of Clean Energy Technologies, Vol. 3, No. 5,
pp. 382-387, (2015).
[20] S. A. Taya, T. M. El-Agez, H. S. El-Ghamri and M. S. Abdel-Latif, ''Dye-
sensitized solar cells using fresh and dried natural dyes'', International Journal of
Materials Science and Applications, Vol. 2, No. 2, pp. 37-42, (2013).
[21] T. M. El-Agez, A. A. El Tayyan, A. Al-Kahlout, S. A. Taya and M. S. Abdel-
Latif, ''Dye-sensitized solar cells based on ZnO films and natural dyes'', International
Journal of Materials and Chemistry, Vol. 2, No. 3, pp. 105-110, (2012).
[22] M. S. Abdel-Latif, T. M. El-Agez, S. A. Taya, A. Y. Batniji and H. S. El-Ghamri,
''Plant Seeds-Based Dye-Sensitized Solar Cells'', Journal of Materials Sciences and
Applications, Vol. 4, No. 9, pp. 516-520, (2013).
[23] I. M. Radwan, "Dye Sensitized Solar Cells Based on Natural Dyes Extracted
from Plant Roots", Master thesis, Islamic University of Gaza, Gaza, (2015).
[24] M. Toivola, "Dye Sensitized Solar Cells on Alternative Substrates", Master
Thesis, Alto University, Finland (2010).
[25] A. N. Zulkifili, T. Kento, M. Daiki, and A Fujiki, "The Basic Research on the
Dye-Sensitized Solar Cells (DSSC)", Journal of Clean Energy Technologies, Vol. 3,
No. 5, pp. 382-387, (2015).
[26] K. Kalyanasundaram, M. Grätzel, "Applications of functionalized transition
metal complexes in photonic and optoelectronic devices", Coordination Chemistry
Reviews, Vol. 177, No. 1, pp. 347-414, (1998).
[27] A. R. Hernandez-Martínez, M. Estevez, S. Vargas, F. Quintanilla, R. Rodríguez,
"Natural Pigment-Based Dye-Sensitized Solar Cells", Journal of Applied Research
and Technology, Vol. 10, No. 1, pp. 38-47, (2012).

65
[28] G. Wolfbauer, "A channel flow cell system specifically designed to test the
efficiency of redox shuttles in dye sensitized solar cells", Solar Energy Materials and
Solar Cells, Vol. 70, No. 1, pp. 85-101, (2001).
[29] A. Stanley, "Minimizing the dark current at the dye sensitized TiO2 electrode ",
Solar Energy Materials and Solar Cells, Vol. 52, No. 2, pp. 141-154, (1998).
[30] Y. Cao, Y. Bai, Q. Yu, et al., "Dye-sensitized solar cells with a high absorptivity
ruthenium sensitizer featuring a 2-(hexylthio)thiophene conjugated bipyridine" The
Journal of Physical Chemistry C, Vol. 113, No. 15, pp. 6290–6297, (2009).
[31] N. Papageorgiony, W. F. Maier, M. Grätzel, "An Iodode/Triidide Reduction
Electron catalyst for Aqueous and Organic Media", J. Electrochem. soc., Vol. 144,
No. 3, pp. 876-884, (1997).
[32] A. Tolvanen, "Characterization and manufacturing techniques of dye sensitized
solar cell", Master of science in technology, Helsinki University of Technology,
(Finland), (2003).
[33] D. G. Lee, J. T. Hong, G. C. Xu, H. S. Kim, K. J. Lee, S. J. Park, W. Y. Kim, H.
J. Kim, "A simple dye-sensitized solar cell sealing technique using a CO2 laser beam
excited by 60 Hz AC discharges", Optics and Laser Technology, Vol. 42, No. 6, pp.
934-940, (2010).
[34] G. Smestad, "Testing of dye-sensitized TiO2 solar cells I: Experimental
photocurrent output and conversion efficiencies", Solar Energy Materials & Solar
Cells, Vol. 32, No. 3, pp. 259-272, (1994).
[35] A. Luque, S. Hegedus, " Handbook of Photovoltaic Science and Engineering",
Library of Congress, USA, (2003).
[36] http://www.ehow.com/info_11386125_methods-silar-deposition-thin-films.html.

66
[37] M. M. Beevi, M. Anusuya, V. Saravanan, "Characterization of CdO Thin Films
Prepared By SILAR Deposition Technique", International Journal of Chemical
Engineering and Applications, Vol. 1, No. 2, pp. 151-154, (2010).
[38] E. Barsoukov, J. Macdonald, ''Impedance Spectroscopy Theory, Experiment, and
Applications'', Library of Congress, USA, (2005).
[39] https://www.uantwerpen.be/en/rg/axes/service/equipment/electrochemistry/metro
hm-autolab-pgst.
[40] M. Kendig, J. Scully, "Basic Aspects of Electrochemical Impedance Application
for the Life Prediction of Organic Coatings on Metals", The Journal of Science and
Engineering, Vol. 46, No. 1, pp. 22-29, (1990).
[41] http://www.thermoscientific.com/en/product/genesys-10s-uv-vis/spectrophotome
ter.html.
[42] T. Ma, W. M. Johnson, A. Koran, "The Color Accuracy of the Kubelka-Munk
Theory for Various Colorants in Maxillofacial Prosthetic Material", J Dent Res, Vol.
66, No. 9, pp. 1438-1444, (1987).
[43] www.thermo scientific.com/uv-vis.
[44] J. M. R. C. Fernando and G. K. R. Senadeera, ''Natural anthocyanins as
photosensitizers for dye-sensitized solar devices'' Current Science, Vol. 95, No. 5, pp.
663-666, (2008).
[45] R. F. Mansa, G. Govindasamy, Y. Y. Farm, H. Abu Bakar, J. Dayou, C. S.
Sipaut, "Hibiscus Flower Extract as a Natural Dye Sensitizer for a Dye-sensitized
Solar Cell", Journal of Physical Science, Vol. 25, No. 2, pp. 85-96, (2014).
[46] S. A. TAYA, T. M. EL-AGEZ, K. S. ELREFI, M. S. ABDEL-LATIF, " Dye-
sensitized solar cells based on dyes extracted from dried plant leaves", Turkish
Journal of Physics, Vol. 38, No. 1, pp. 1-7, (2014).

67
[47] M. Alhamed, A. S. Issa, A.W. Doubal, " STUDYING OF NATURAL DYES
PROPERTIES AS PHOTO-SENSITIZER FOR DYE SENSITIZED SOLAR CELLS
(DSSC)", Journal of Electron Devices, Vol. 16, No. 11, pp. 1370-1383, (2012).
[48] C. H. Lee, W. H. Chiu, K. M. Lee, W. F. Hsieh, J. M. Wu, " Improved
performance of flexible dye-sensitized solar cells by introducing an interfacial layer
on Ti substrates", Journal of Materials Chemistry , Vol. 21, No. 13, pp. 5114-5119,
(2011).
[49] G. Calogero, and G. D. Marco, "Red Sicilian orange and purple eggplant fruits as
natural sensitizers for dye-sensitized solar cells", Solar Energy Materials and Solar
Cells, Vol. 92, No. 11, pp. 1341–1346, (2008).
[50] S. A. Taya, T. M. El-Agez, M. S. Abdel-Latif, H. S. El-Ghamri A. Y. Batniji, I.
R. El-Sheikh, "Fabrication of Dye-Sensitized Solar Cells Using Dried Plant Leaves",
INTERNATIONAL JOURNAL of RENEWABLE ENERGY RESEARCH, Vol. 4,
No. 2, pp. 384-388, (2014).
[51] F. Cao, G. Oskam, G. J. Meyer, and P. C. Searson, "Electron transport in porous
nanocrystalline TiO2 photoelectrochemical cells", Journal of physical chemistry, Vol.
100, No. 42, pp. 17021-17027 (1996).
[52] S. Sarker, A. S. Ahammad, H. W. Seo, D. M. Kim, "Electrochemical Impedance
Spectra of Dye-Sensitized Solar Cells: Fundamentals and Spreadsheet Calculation",
International Journal of Photoenergy, Vol. 2014, No. 851705, pp. 1–17, (2014).
[53] F. Fabregat-Santiago, J. Bisquert, E. Palomares, L. Otero, D. Kuang, S. M.
Zakeeruddin, and M. Gratzel, "Correlation between Photovoltaic Performance and
Impedance Spectroscopy of Dye-Sensitized Solar Cells Based on Ionic Liquids", The
Journal of Physical Chemistry C, Vol. 111, No. 17, pp. 6550-6560 (2007).

68
[54] R. Kern, R. Sastrawan, J. Ferber, and R. Stangl, "Modeling and interpretation of
electrical impedance spectra of dye solar cells operated under open-circuit
conditions", Electrochimica Acta, Vol. 47, No. 26, pp. 4213-4225 (2002).
[55] H. Hafez, I. Yahia, G. Sakr, M. Abdel-Mottalebb, F. Yakuphanoglue, ''Extraction
of the DSSC parameters based TiO2 under dark and illumination conditions'',
Advances in Materials and Corrosion, Vol. 1, No. 5, pp. 8-13, (2012)
[56] M. Zhong, J. Shi, W. Zhang, H. Han, and C. Li, "Charge recombination
reduction in dye-sensitized solar cells by depositing ultrapure TiO2 nanoparticles on
“inert” BaTiO3 films", Materials Science and Engineering: B, Vol. 176, No. 14, pp.
1115–1122, (2011).