duty drawbacks, competitiveness and growth: should … · duty drawbacks, competitiveness and...
TRANSCRIPT
Duty drawbacks, competitiveness and growth: Should China Reform its Duty Drawback System?
Elena Ianchovichina♣
The World Bank
Abstract
The paper analyzes duty drawbacks in the presence of domestic distortions. Introducing duty drawbacks is welfare enhancing in a small economy if the import competing sectors are subsidized, have uniform or escalating tariff structure and low intensity of import use, while the export-oriented sectors are taxed. Reducing full duty drawbacks is likely to be welfare reducing when the import competing sectors have escalating tariff structure and are protected by domestic output subsidies, while the exporting sectors are taxed. The higher the tariff on imported final goods, the lower the tariff on imported inputs, and the import intensity of the import competing sector, the more likely it is that the welfare effect will be negative. In general, the welfare effect of a change in the duty drawback regime is ambiguous. The higher the protection on the import competing sector and the tax on the exportables, the lower the initial duty drawback, the tariff on imported inputs, and the import intensity of the import-competing sector, the more likely it is that the allocative efficiency effects of an reduction in the duty drawback is negative. The import intensity of the exporting sector and the level of imported protection are positively related to the magnitude of the allocative efficiency effect. In a large economy, there will be a nonnegative terms of trade effect, which in the perfectly competitive case is inversely related to the direction of duty drawback change. The paper quantifies the effects of a potential complete abolition of China’s duty exemption system in 2007, when China would have fulfilled almost all of its WTO commitments. While removal of duty drawbacks may not affect adversely aggregate welfare, it will have a strong negative effect on production, exports and employment of some key manufacturing sectors. Hardest hit will be the automobile sector, whose exports and output will contract by almost 40 percent and 16 percent, respectively, in the event that duty exemptions on imported inputs are abolished. Removal of duty drawbacks will increase domestic value added and lead to a decline in China’s bilateral trade surplus with North America by about US $7 billion. Keyword: Duty-drawbacks; Tax reform; China
JEL classification: F11; F13
♣ The author is an Economist with the Economic Policy Division, The World Bank; her email is [email protected]. The views expressed in this paper are personal and should not be attributed to the World Bank. I would like to thank Deepak Bhattasali, Bernard Hoekman, Garry Pursell for helpful comments, and Li Yan for her advice and data on export processing trade.
1
1. Introduction
Economic theory traditionally considers trade liberalization to be the reduction or
complete removal of existing trade restrictions and economists typically endorse it as a
‘first-best’ type of trade liberalization. While removal of existing trade barriers is the
most direct way to free trade, many economies have chosen more gradual and flexible
approaches. These involve ‘concessional’ trade liberalization instruments including intra-
industry liberalization via duty drawback schemes, sub-national liberalization through the
development of export processing zones (EPZs), firm-specific liberalization by
negotiating import rights with individual firms or expanding eligibility for import
permits, and regional trade liberalization by forming regional free trade blocs.
This paper focuses on one type of ‘concenssional’ trade instruments – duty
drawbacks on imported inputs used in the production of exports. They have been popular
as an indirect tax incentive for foreign investment and an instrument to reduce the anti-
export bias of otherwise highly protected economies.1
Despite their wide use,2 duty drawbacks have been given relatively little attention
in the literature.3 Considerably more attention has been given to exploring the
implications of different kinds of protectionism including voluntary export restraints
(VERs), ‘strategic’ trade interventions, and more recently to EPZs.4 There is also little
1 It needs to be mentioned that even full duty drawbacks just reduce, but do not completely eliminate the anti-export bias, since tariffs on final goods continue to provide positive effect protection to the domestic-oriented sectors. 2 Duty drawbacks have been widely used (see International Monetary Fund, 2002). But some economies have used duty drawbacks with a lot more success than others. For instance, most East Asian economies have used duty drawback schemes very effectively, whereas in many African countries poor execution of such schemes has led to very few benefits for exporters (Hinkle et al. 2003). 3 In December 2003 the ‘ECONLIT’ database contained 5 articles on duty drawbacks, 1 on export drawbacks and 1 on export linkages. 4 As of December 2003, the ECONLIT database contained 133 references to ‘voluntary export restraints’, 324 to ‘strategic trade’ and 48 to ‘export processing zones’.
2
consensus whether countries should embrace this type of instruments or whether and
when they should abandon them. A World Bank study by Thomas et al. (1991) made a
strong case in favor of duty drawbacks as instruments of export promotion when there is
import protection, whereas more recently the IMF (International Monetary Fund, 2002)
warns against the use of duty drawbacks and other indirect tax incentives since they can
lead to abuses, are difficult to justify on policy grounds and offer second best solutions.
Acknowledging the common use of duty drawbacks worldwide as an export and foreign
investment incentive, the IMF concludes that tariff exemptions should be used only for
export purposes and that countries with weak customs and tax administrations should
choose drawback schemes instead of exemptions in order to minimize the risk of tariff
leakages. Evidence suggests that exporters in a number of countries with duty drawback
schemes have found it difficult to collect refunds.5
Herander (1986) was among the first to study the implications of duty drawbacks
for the structure of protection.6 Using the standard framework for the analysis of
effective protection7 and assuming that foreign and domestic goods are perfect
substitutes, he identifies the conditions determining whether domestic component
producers or domestic final good consumers will bear the costs of export expansion
following the introduction of duty drawbacks. He finds that when domestic final good
consumption is low relative to domestic component production, domestic component
5 Uncertainties of payment and delays of up to a year in the reimbursement of import duties were major problems, for instance, in Uganda (1996), South Africa (1996), Tanzania (1996) and Zimbabwe (1998) (Hinkle et al. 2003). 6 Balassa et al. (1970) discussed in detail the duty drawback policies of several developing countries, while Hufbauer and Erb (1984) surveyed such policies in developed countries. 7 The standard framework used in the analysis of effective protection assumes a fixed coefficient, two-stage production process (component production and final good assembly), upward sloping supply curve for factors (value added) and intermediate inputs (components), perfectly competitive markets, exogenous world prices of components and final goods.
3
producers are worse off, while domestic consumers are better off with duty drawbacks
because the derived component demand for domestic usage can be satisfied entirely by
domestic components without bidding the price of domestic components up to the tariff
inclusive price of foreign components. When domestic final good consumption is high
relative to domestic component production, domestic component producers retain their
protection while consumers face a higher price if duty drawbacks are coupled with a large
final good import tariff.8 This results in a protection structure of escalating tariffs, which
is typical for many countries.9 Conversely, domestic component producers lose, while
domestic final good consumers benefit if final good tariffs are lowered or completely
eliminated. This results in a protection structure of de-escalating tariffs and the
emergence of two-way trade.
Panagariya (1992) introduces a model to study the welfare implications of trade
reform in the presence of duty drawbacks and duty drawback reform. He concludes that
the welfare effect of an increase in the duty drawback, when none has been in place, is
welfare improving, provided that goods are substitutes in consumption and production,
world prices are exogenous, there is no two-way trade in the good intended for exports
and no domestic production of the intermediate input. His analysis is based on a one
country model with little industry detail and no other distortion but those at the border.
Given the presence of domestic output and other taxes, and the fact that world prices are
not exogenous when the country implementing the reform is large, the welfare effects
from a reform in the duty drawback system may be misstated (Konan and Maskus, 2000).
8 Duty drawbacks could achieve export expansion without losses to domestic component producers or final good consumers if domestic component production is subsidized.
4
The evidence that duty drawbacks can speed up trade liberalization by opening
otherwise highly protected economies is also mixed. Gruen (1999) argues that
‘concessional’ trade liberalization instruments enable the trade liberalization path to be
specified in a flexible way ensuring targeted and gradual trade reform, which may not be
possible using traditional tariff dismantling. Cadot et al. (2003) however show that in a
political-economy setting, where tariffs and duty drawbacks are endogenously chosen
through industry lobbying, full duty drawbacks granted to exporters who use imported
intermediate inputs in their production decrease their incentives to counter-lobby against
high tariffs on their inputs and in equilibrium higher tariffs are observed on these goods.
This in turn implies that the presence of duty drawbacks may slow down trade
liberalization.
An introduction of a duty drawbacks program has an unambiguously positive
effect on exports. Duty drawbacks lower the cost of imported inputs thus increasing
firms’ competitiveness and the dispersion in effective rates of protection thus increasing
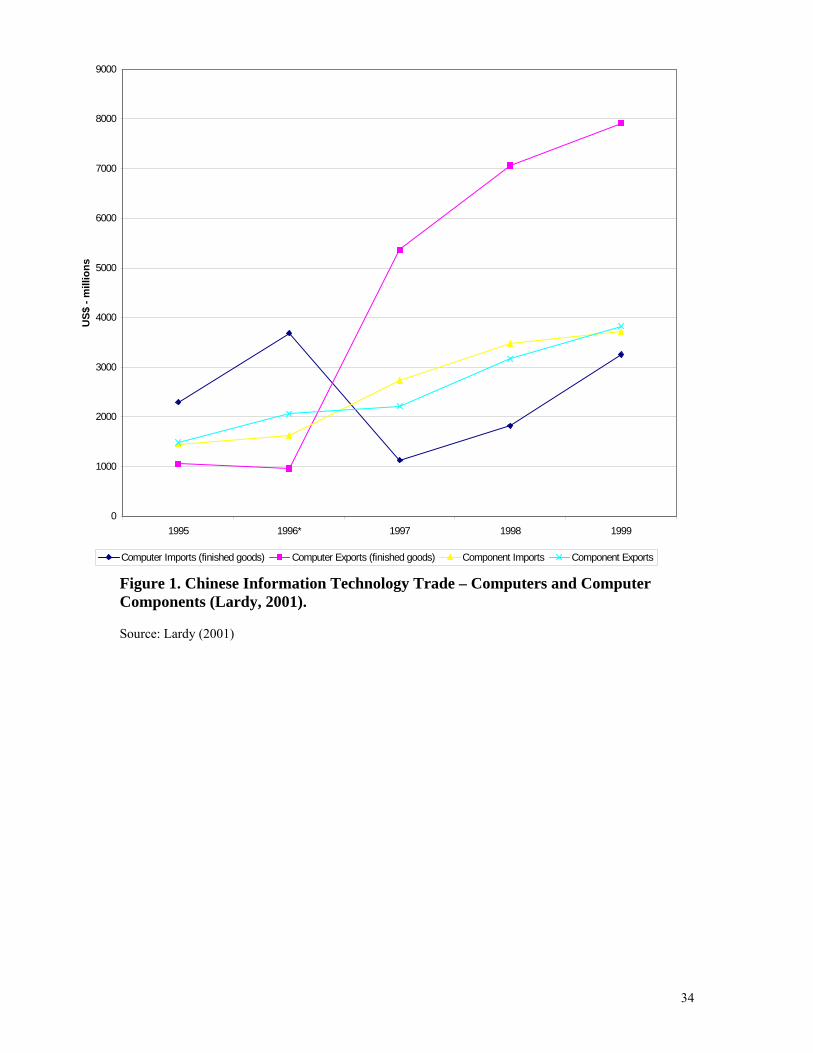
economic efficiency. As demonstrated in the case of China, duty exemptions have
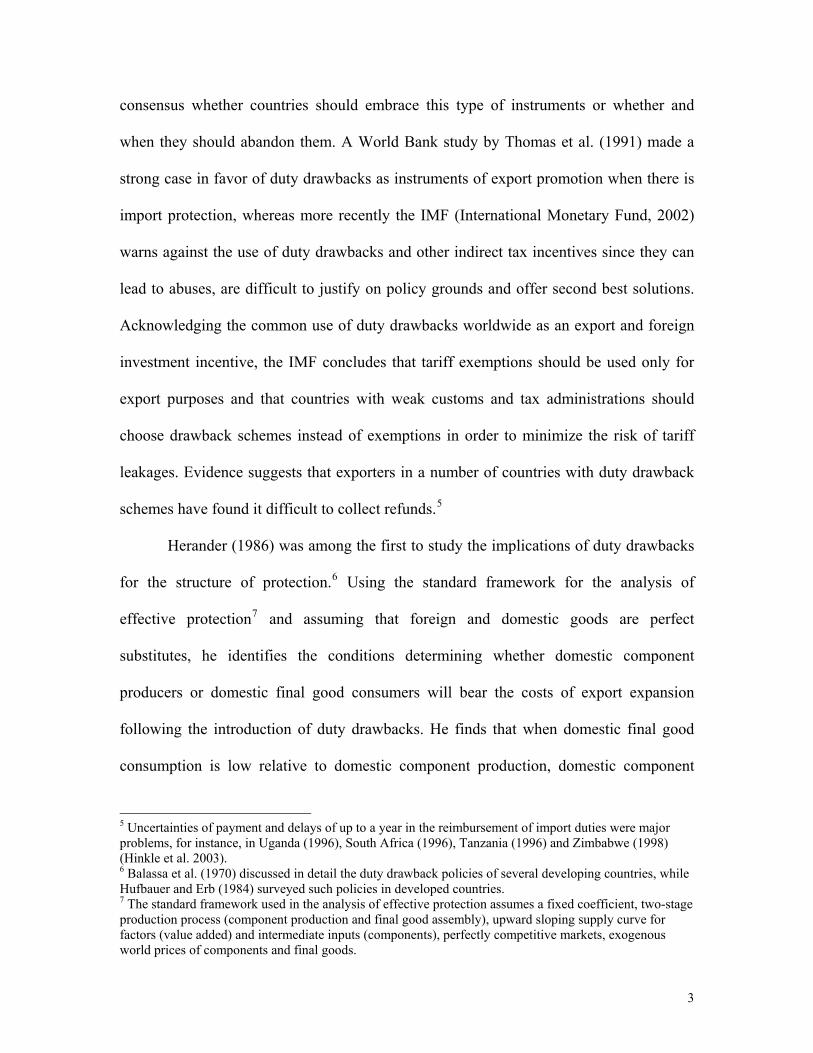
brought down otherwise negative effective rates of protection (ERPs) for export
competing firms to 0 (Figure 2),10 allowing export producers to operate at world prices.
They have halved the standard deviation in ERPs.
This paper analyzes duty drawbacks in the presences of domestic distortions. It
presents a model with duty drawbacks that can be used to quantify the economic impacts
of duty drawback reform. The paper analyzes the impact of a potential abolition of
9 World Bank data at www.worldbank.org/trade indicate that 48 out of 86 economies had escalating tariffs on industrial products between 1994 and 2000. One country (Bolivia) had de-escalating tariffs and the rest had a mix of increasing and decreasing tariff rates from one stage to another.
5
China’s duty exemption system in 2007, when China would have fulfilled almost all of
its WTO commitments. It presents estimates of the impacts of such a reform on prices;
output, trade volumes, factor returns and welfare. The welfare estimates take into account
some of duty drawback’s negative externalities such as administrative costs and leakages
in the tariff collection system.
Section 2 presents the model and discusses various welfare outcomes of duty
drawback reform using a modified version of Panagariya’s 1992 model, extended to
reflect the presence of domestic distortions. Section 3 discusses the welfare effects of
duty drawback reform. Section 4 present key features of China’s current duty drawback
system. Section 5 analyzes the economic impact of a potential complete removal of duty
exemptions in China in 2007. The section presents the simulation design and key
findings. Concluding remarks and caveats are summarized in section 6.
2. The Model
We consider a world with R economies in which there are G industries – each using F
types of production factors in order to produce G types of goods.11 Each industry is
perfectly competitive and has two types of firms – export-oriented and domestic-oriented.
Both types of firms produce the same commodity using the same constant-returns-to-
scale technology and are identical in all respects except one – the export-oriented firms
produce exclusively for export markets using imported intermediates that are either
exempt from duties or eligible for refunds on the import tax paid, while the domestic-
10 With duty exemptions the ERPs for export processing firms are close but not exactly zero because the domestic components of value added still have import duties embedded in them. 11 There is a one-to-one correspondence between goods and industries.
6
oriented firms produce no exports and supply exclusively the domestic market.
Production for domestic and export markets is therefore completely decoupled.
The choice to fully separate domestic and export production simplifies
considerably the representation of duty drawbacks in a large empirical multi-region
model. It is preferable to representations based on a single sector producing differentiated
products for domestic and export markets because it allows the two sectors to use quite
different input mixes, and particularly for the export-oriented activities to use much more
import-intensive means of production. It is also a fairly accurate depiction of the trade
regime in countries where duty drawbacks are used as export promotion instruments
while protection on the rest of the economy is fairly high.12
In China, for example, duty and other tax exemptions, local content requirements
and foreign balancing rules, which required companies selling domestically to source 70-
80 percent of intermediates from domestic producers and to finance imports by selling
exports, discouraged domestic companies selling locally from using imported
intermediates. Complex administrative rules discouraged export processing companies
from selling locally.13 These policies created a dual market structure with partially
segmented domestic and export markets.
One of the industries produces a non-tradable investment good, which could be
installed in a domestic or an export-oriented firm. The model captures the fact that the
industry uses domestic and imported capital goods, a portion of which are duty exempt.
12 In a deterministic world, a producer of exports will always take advantage of duty exemptions or duty rebates unless the administrative costs of the export processing arrangements are excessive. 13 Failure to obtain in advance a license to sell domestically is considered smuggling. Granting the permission requires the involvement of a number of government agencies. Naughton (2000) compares China’s trading system to that of Thailand and assesses the degree of dualism in China to be greater than that in Thailand because of the greater importance of government bureaucratic interference in China.
7
This is an important feature since tax concessions for imported capital goods are popular
in many developing countries.14
The production functions are Leontief so efficiency implies that:
,/ ijrijrjrjr aIV Ω==Ω (1)
where , superscript,...,1,,...,1, RrGji ∈∈ , XD∈Ω indicates the type of sub-sector
(D stands for the domestic-oriented one, X stands for the export-oriented one), jrV
value-added, is the intermediate input demand for input i in industry j of region r.
15 is
ΩijrI
Firms purchase both foreign and domestic intermediates, which are imperfect
substitutes in a constant-elasticity-of-substitution (CES) composite function (Armington
1969). Duty drawbacks for imported materials used in the production of exports imply
that the intensity of imported intermediate use by the export sector is higher than the
intensity of imported intermediate use by the sector producing for the local market.
Producers minimize unit factor costs given the vector of factor prices and
relevant taxes , and a CES function that relates the level of output to the factor inputs.
Linear homogeneity of the production function implies that factor demands of sub-sector
in industry j of region r ( ) can be written as:
Ffrp
Ffrt
ΩfjrF
16),,( Ffr
Ffr
Ffjrjrfjr tpaVF ΩΩ = (2)
where superscript F stands for factor use, ,...,1 Ff ∈ . Primary factors are fully employed.
Their supply is exogenous and equals demand:
14 For instance, capital goods brought into China for export processing by foreign-invested enterprises have been exempt from import duties during most of the nineties. 15 The sector producing investment goods is an exception since its exports are zero. 16 Functional forms are represented explicitly, but unit demand and supply functions are shown in reduced form, i.e. a(.), where superscripts DI and MI stand for intermediate use of domestic and imported goods, respectively.
8
(3) .∑∑ Ω
Ω
=j
fjrfr FF
Imports of good i in region r for the production of goods sold domestically and
for exports are CES composites of imports from various sources s, .ΩisrM 17 Product
differentiation among imports by region of origin allows for two-way trade in each
product category, depending on the ease of substitution between product from different
origins.
Output of the domestic-oriented sub-sector i in region r ( ) meets demand for
domestic intermediate products, and final demand for good i in region r:
irD
. (4) Dir
j
Dijrir CID += ∑∑ Ω
Ω
)(
Output of the export sector meets import demand of all trading partners:
(5) .)(∑∑ Ω
Ω
=s
irsir MX
Competitive producers in both the export-oriented and domestic-oriented sub-
sectors earn zero profit in equilibrium:
,)1)(,()1(∑ ∑ ΩΩ +++= ΩΩΩ
f j
Ijir
Mjr
Djr
Ijirjir
Ffir
Ffr
Ffirir tpppatpap (6)
where is the supply price to market Ω;Ωjrp 18 - the composite demand price of good
j for intermediate use by sub-sector Ω of industry i in region r is a function of Djr is the
domestic supply price of good j in region r, and is the import price of good j used
for final consumption or as intermediate input by sub-sector Ω in region r; is a tax on
ΩIjirp
p
ΩMjrp
ΩIjirt
17 Subscript s stands for ‘source’ region, while subscript r stands for ‘destination’ region.
9
intermediate inputs. In equilibrium, the domestic cif price equals the fob price gross of
export tax, the applicable tariff, and transport costs:
(7) ),1()1)](1([ isrs
Misr
Xisr
Xis
MDisr
MDir ttpap τ+++= ∑
(8) ),1)()1(1()]1([ isrMisr
s
Xisr
Xis
MXisr
MXir ttpap τφ +−++=∑
where is the import tax on good i from region s to region r; is the export tax on
good i from region s to region r; is the transportation cost of good i from region s to
region r; and
Misrt X
isrt
isrτ
φ is a parameter between 0 and 1 that determines the extent of the duty
drawback for the export processing sector.
If φ is one, export producers get full duty drawback of import duty paid on inputs
used in the production of exports. If 0<φ <1, export producers get partial refunds of such
duties. If φ =0, import taxes are the same for the export and domestic sub-sectors.
Equations (6), (7) and (8) show that duty drawbacks improve the exporters’
competitiveness as their costs either do not reflect import duties or reflect reduced import
taxes due to partial duty rebates.
In the background it is assumed that in each economy there is a single
representative consumer, maximizing a constant-difference-elasticity (CDE) demand
system. The representative consumers and the government receive income from
payments of primary factor services and tax revenue, respectively, and save a fixed share
of their income. Public consumption is governed by a Cobb-Douglas utility function. As
in the case of intermediate inputs, both private and government final demands are a CES
18 If Ω=X, the reference is to the export market. If Ω=D, the reference is to the domestic market.
10
composite of domestic and imported products. The consumer price level is the numeraire,
and aggregate investment is such that the trade balance is a fixed share of income.
3. Welfare effects of duty drawback reform
In order to illustrate the interaction between duty drawbacks, domestic and trade taxes,
we look first at the case of a small economy19 with 3 final goods (D, X, and N) and F
factors of production. Two of the final goods (D and X) use an imported intermediate
good that is not produced at home, while good N does not use the imported good. Good D
is an importable,20 good X is an exportable, and good N is freely traded. We assume that
the value added ( ) is a linear homogenous function, transport costs are negligible,
export taxes and taxes on intermediate inputs and factor inputs are zero.
jrV
Perfect substitutability between domestic and foreign goods implies that the
supply price of the import competing good ( ) is the world price adjusted for any
tariffs (t), and output taxes ( ), i.e. . The supply price of the
exportable good ( ) is the world price adjusted for output taxes ( ). From these
assumptions and equation (6) it follows that the prices of value added in sectors D and X ,
respectively, are:
Dp
Dτ )1/()1( DD tp τ++=
Xp Xτ
21
,)1()1/()1( DMDv attp
D+−++= τ
19 This implies that the country is a price taker and that domestic reforms will not affect world prices so that they can be fixed at 1. 20 We have chosen D to denote the domestic oriented sector, X to denote the export-oriented sector, and N the freely trade sector. 21 Notice that if factors are perfectly mobile across sectors, 1=φ and 0=== XDt ττ , then the tariff on the imported input needs to be equal to . Otherwise, there will be either production of good D or 1/ −DX aa
11
.))1(1()1/(1 XMXv atp
Xφτ −+−+=
It can be easily shown that the ERPs in sectors D and X are:
,)1)(1(
)1(DD
DDMDMD
aatatt
ττπ
+−+−−
=
.)1)(1(
))1(1()1(XX
XXMXMX
aatat
ττφφπ
+−−+−−−
=
Under free trade ( ) and no domestic distortions (0== Mtt 0== XD ττ ), the price
of value added in the import competing sector D is Da−1 , while that of the exporting
sector X is Xa−1 , and the ERPs in both sectors are 0. When tariffs are uniform or
escalating ( ) and the output tax on good D is zero (Mtt ≥ Dτ =0) or it is a subsidy
( Dτ <0), the ERP for good D is positive.22 If tariffs are uniform or escalating and there
is an output tax ( Dτ >0), the ERP for good D is positive only if the tariff on the final
good is high enough so that DDMDM atatt τ)1( ++≥ . If tariffs are de-escalating
( ), and there is an output tax on good D (Mtt < 0>Dτ ), the ERP for good D is
negative.
If there is no duty drawback ( 0=φ ) and the output tax on good X is zero
( Xτ =0), the ERP for good X is negative. If there are full duty drawbacks ( 1=φ ), the
ERP for good X becomes 0 in the absence of output taxes; negative if there is an output
tax ( Xτ >0), and positive if there is a subsidy ( Xτ <0).
The equilibrium in this economy is given by
);1,.)1/(1),1/()1(()1,,( uattETppR XMXDvv XD
φττ ++++=+ (A)
rted input to be positive, good X needs to be more intensive good X, but not both. For the tariff on the impo
12
where 23 is the revenue function of the economy obtained b)1,,(XD vv ppR y maximizing
the GDP subject to full employment, );1,.)1/(1),1/()1(( uattE XMXD φττ ++++ is
the expenditure function obtained by mini no
worse than u, and T is tariff revenue, collected by the government and distributed to
consumers:
1(EtT
mizing spending in order to achieve welfare
)(.) RRERatRatRatR XDXMXMDM2122211 ττφ ++−−++ .
The first term is the revenue raised from imports of good D, the second and third
terms s
24
totally
−=
pecify the revenues raised from intermediate imports for the production of goods
D and X, the fourth term is the expenditure made on the duty drawbacks, the fifth and
sixth terms are the revenues (expenditure) associated with output taxes (subsidies).
The welfare effects of a change in duty drawback policy can be assessed by
differentiating the equilibrium condition (A) and setting
0==== XDM dddtdt ττ .
]))1(()([
)(
22212212
21
RtaRtatEattEtadduEattEE
MXXDMDXMMX
uXM
uu
φττφφ
φ
−++−+++
=−− (B)
We assume that goods exhibit substitutability both in production and consumption
(i.e.
ng (i.e. and
(B) is po . The terms in the square brackets of equation (B) depict the
012 > and 012 <R ), demand is downward sloping, while supply is upward
slopi 22 <E 022 > ), and goods are normal so that the term on the left-
hand side of sitive
E
0 R
in the use of the imported input than good D. 22 It is assumed that subsidy rates are less than 100% so that the power of the subsidy (1+τ) is positive.
X is good 2, the demand for good i is given by the first partial of E(.) with respect to the ith argument. The supply of good i is given by the first partial of R(.) with respect to the ith argument.
23 The vector of factor endowments has been suppressed for the sake of brevity. 24Assuming that the import competing good D is good 1, while the exportable good
13
allocative efficiency effect of a change in demand and supply for goods 1 and 2,
respectively, in response to a change in the price of good 2. The resource allocation
effect is captured by the third and fourth terms, while the expenditure allocation effect is
represented by the first and second terms.
We discuss next the cases of (i) introducing duty drawbacks, when none is in
place initially; (ii) reducing duty drawbacks, when full drawbacks are in place initially,
and (iii) changing the duty drawbacks regime, the general case of 10 << φ .
3.1 Introducing duty drawbacks
Proposition 1. In a small country, the welfare effect of introducing duty drawbacks is
unambiguously positive if there is an output tax on the exportable X, an output subsidy on
the importable D, and the tariff structure is either uniform or escalating or such that
(for instance, if good D uses a very small portion of the imported input).
Otherwise, the welfare effect is ambiguous.
0≤− tat DM
If the output subsidy on the exportable good X or the output tax on the importable
good D are high enough, the welfare effect may be negative.25 The same outcome applies
if tariffs on intermediate imports are much higher than tariffs on final imports (i.e. in the
case of de-escalating tariff structure).
3.2 Reducing full duty drawbacks
Proposition 2. In a small country, the welfare effect of reducing full duty drawbacks is
ambiguous. The outcome depends on the relative magnitudes of and , on the 12E 22E
25 The first term in (B) is positive, while the second term is 0.
14
tariff structure of the economy and the domestic output tax structure. The welfare change
is unambiguously positive, if t=0, ,0>Mt 26 and there are no output taxes.27
In this case the ERP of good D is negative, while that of good X is zero. With the
removal of the duty drawback system, the ERP for the exportable sector becomes
negative, and sector D expands. The dispersion in ERPs for the export and domestic-
oriented sector declines, which will also lead to an increase in economic efficiency. The
welfare increase will be even bigger if the importable good faces domestic output taxes
( 0>Dτ ).
In the case of escalating tariffs and no output taxes, the import competing sector
D faces positive ERPs, while the exporting sector X faces negative ERPs.
Proposition 3. If the tariff on the final import competing good D is high enough so that
the first term on the right hand side is larger than the second one, and in the absence of
other distortions, a decline in duty drawbacks implies a negative welfare change. The
result is strengthened if there are output subsidies on the import competing sector D and
output taxes on the exportable sector X.
3.3 Changing the duty drawback regime
Proposition 4. In a small country and 10 << φ , the welfare effect of a change in the
duty drawback regime is ambiguous. The higher the protection on the import competing
sector D (high t and Dτ ) and the output tax on the exportable X, the lower the initial duty
drawback, the tariff on the imported input, and the import intensity of sector D, the more
26 When the importable D is not protected and goods D and X are perfect substitutes, good X will not be sold domestically, unless the tariff on the imported input is 0. 27 The second and third terms in (B) are negative, while the first and fourth are zero.
15
likely it is that the welfare effect of an increase (reduction) in the duty drawback is
positive (negative).
The welfare effect of a reduction in duty drawbacks is more likely to be positive
when the import competing sector D is intensive in the use of the imported input, its
output is taxed domestically and is not protected from foreign competition (t is low or 0),
while the export competing sector is heavily subsidized.
Proposition 5. In a small country, the import intensity use of sector X ( ), and the
tariff rate on the imported input are positively related to the magnitude of the
welfare change.
Xa
Mt
While expression (B) helps one to understand the welfare effect of a change in
duty drawback policy in a small economy, it cannot adequately depict the welfare
changes in a large country. In this case changes in the economy affect world prices and
the country is not a price taker.
Proposition 6. When evaluating the welfare effect of a change in duty drawback policy in
a large economy, in addition to the allocative efficiency effect, captured by expression
(B), one also needs to take into account a non-negative terms of trade effect. Under
perfect competition, the terms of trade effect is expected to be negative when duty
drawbacks are increasing since export production costs decline, lowering in turn export
prices. The opposite is expected in the case of declining duty drawbacks.
Some of the welfare changes associated with duty drawback reform cannot be
captured within models such as the one discussed here. Complete abolition of duty
drawbacks may lead to savings because the administration of a nationwide duty drawback
16
system can be costly and because duty drawbacks have often been associated with misuse
and leakages in the tariff collection system.
So far we focused on the aggregate welfare effects of a duty drawback reform.
However, the main policy concerns are with the impacts on such economic variables as
sectoral output, employment, and trade volumes; prices, and factor returns. The
remainder of this paper discusses key features of China’s duty exemption regime and the
economic impact of a complete removal of duty exemptions in China in 2007, the year
when China would have fulfilled almost all of its WTO commitments.
4. China’s duty drawbacks on the eve of WTO accession
Duty drawbacks in the form of tariff exemptions have been a central feature of China’s
export processing system. Introduced in 1979 in order to improve the country’s
competitiveness by reducing the anti-export bias in the country’s economic climate,28
initially the system provided various incentives for both the processing of raw materials
for export and the assembly of imported parts and components to produce finished goods
for export (known as processing and assembling or processing with supplied materials).
28 In the pre-reform era exchange rates, tariffs and relative prices had little influence on the magnitude and commodity composition of China’s foreign trade. Firms producing for export sold their products to foreign trade companies at officially established domestic prices, fixed in domestic currency. Export producers did not get the foreign exchange income from the sale of their products on international markets and thus had little incentive to expand production of goods for which foreign demand was strong (Lardy, 2001). The prices of imports also distorted the distribution of resources in the economy. Approximately 80 percent of imports were sold in China at prices similar to those of comparable products, quoted in domestic currency, and adjusted up or down to reflect quality differences. This price setting process isolated domestic firms from the influence of relative domestic and international price changes on the import pattern and from exchange rate changes. For imports without domestic equivalents, which accounted for 20 percent of all imports, domestic prices were based on the cost of imports converted to domestic currency at the official exchange rate. Since this exchange rate was overvalued, the imports were in effect subsidized. The consequences of these policies were (1) lack of foreign exchange for imports due to low exports; (2) low growth in trade volume; (3) distorted commodity composition of foreign trade, particularly on the export side, which did not correspond to China’s comparative advantage in the production of labor intensive goods.
17
In 1987 these incentives were expanded to allow for duty-free imports of all raw
materials and intermediate inputs used in the production of exports,29 and later to
imported capital goods supplied by foreign firms to Chinese companies when the
equipment was needed to fulfill processing contracts.30
On the eve of accession (2000), export processing trade accounted for 41 percent
of imports and 55 percent of exports in China. The remaining 45 percent of exports,
called ordinary exports, were produced mainly with domestic inputs and only a small
portion of duty–paid imported materials.31 According to the Customs authorities, in 2000,
60 percent of imports entered China duty-free, out of which 41 percentage points were
imports used for export processing, 13 percentage points were capital goods, and 6
percentage points were goods that fall in the special categories, such as materials used by
research institutions, as well as products used by the disabled, when these are unavailable
in China.
4.1 Benefits associated with duty exemptions in China
Duty exemptions in China reduced the anti-export bias of the old planned economic
system and improved the competitiveness and efficiency of the economy by allowing
29 Companies involved in export processing benefited from other tax concessions such as value-added tax (VAT) exemptions on imported goods. Benefits differ depending on the location of the company and are greatest for companies located, for example, in bonded areas and EPZs. Benefits in these areas include not only tariff and other tax exemptions, but also speedy customs processing, good infrastructure and others. Since these issues are not the primary focus of the paper, they are omitted from the discussion. 30 The State Council decided to eliminate these exemptions from tariffs and import related taxes as of April 1, 1996. Foreign-invested firms approved prior to April 1 were given additional time to take advantage of duty-free imports of capital goods. Investments under $30 million qualified for exemptions until December 31, 1996. Investments over $30 million were exempt from import duties until December 31, 1997. These deadlines were not strictly enforced and eventually the exemption program was formally re-established (Lardy, 2001). 31 According to version 4 GTAP, in 1995 14 percent of imports were for final consumption and according to China’s Customs 40 percent of imports were ordinary imports that were not duty exempt. This means that approximately 26 percent were ordinary imports used as intermediates. According to version 4 GTAP China’s firms exported on average
18
export producers to import at international prices. In the absence of duty exemption
schemes, exporters in China would have faced negative effective rates of protection
(Figure 2).32 Duty exemptions reduce the negative effective rates of protection (ERPs) for
export competing firms to almost zero, allowing many export producers to operate at
world prices and compete more effectively in world markets.33 Duty exemptions roughly
halve the dispersion in ERPs, measured as standard deviations, and therefore increase
economic efficiency.
Duty exemptions boosted trade growth in China. Right after their introduction in
1979, processing trade comprised only 5 percent of Chinese trade flows. By 1988 process
trade more than doubled. Between 1988 and 1991 processed exports produced with
inputs purchased from abroad almost tripled, increasing from US$140 million in 1988 to
US$324 million in 1991 (Table 2), while total exports rose by 50 percent over the same
period (World Bank, 1994). In 2000, processing trade accounted for 50 percent of total
trade, with export processing accounting for 55 percent of total exports.34
Duty exemptions facilitated China’s integration into the world production sharing
system, which in turn speeded up the diversification of Chinese manufactured exports
(Lemoine and Ünal-Kesenci, 2004). Textile and garment producers pioneered export
processing trade (Naughton, 2000), and despite the restrictive effect of the textile and
10 percent of their output, implying that approximately less than 3 percent of imports were used for the production of ordinary exports. 32 Figure 2 shows effective rates of protection (ERP) computed for import competing and exporting firms separately, in order to emphasize differences in protection depending on the orientation of the firms, i.e. on whether a firm is an exporter (refers to both ordinary exporters and export processors) or supplier in the domestic market. The effective rates of protection are computed using the 1995 tariff data in version 4 GTAP database. The protection for import competing firms is in general positive, while that for exporters is negative. This is because exporting firms face world prices while import-competing firms are protected by tariffs on imports (final or intermediates products). 33 The ERPs for export processing firms with duty exemptions are close but not exactly zero because the domestic components of value added still have import duties embedded in them.
19
apparel quotas in North America and Western Europe, made China the largest exporter of
textile and clothing in the world accounting for 8.8 percent of world textile exports and
16.2 percent of world clothing exports in 1999. China later emerged as an important
exporter of toys, sports goods, and more recently electronics, telecommunications and
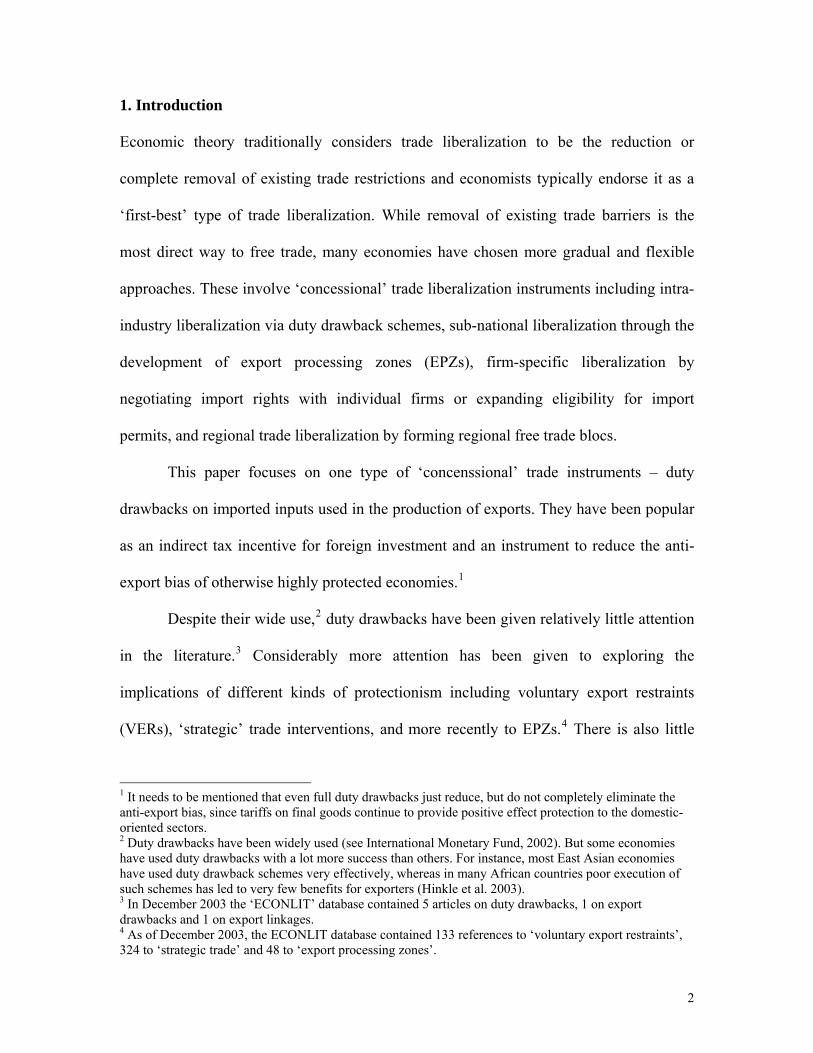
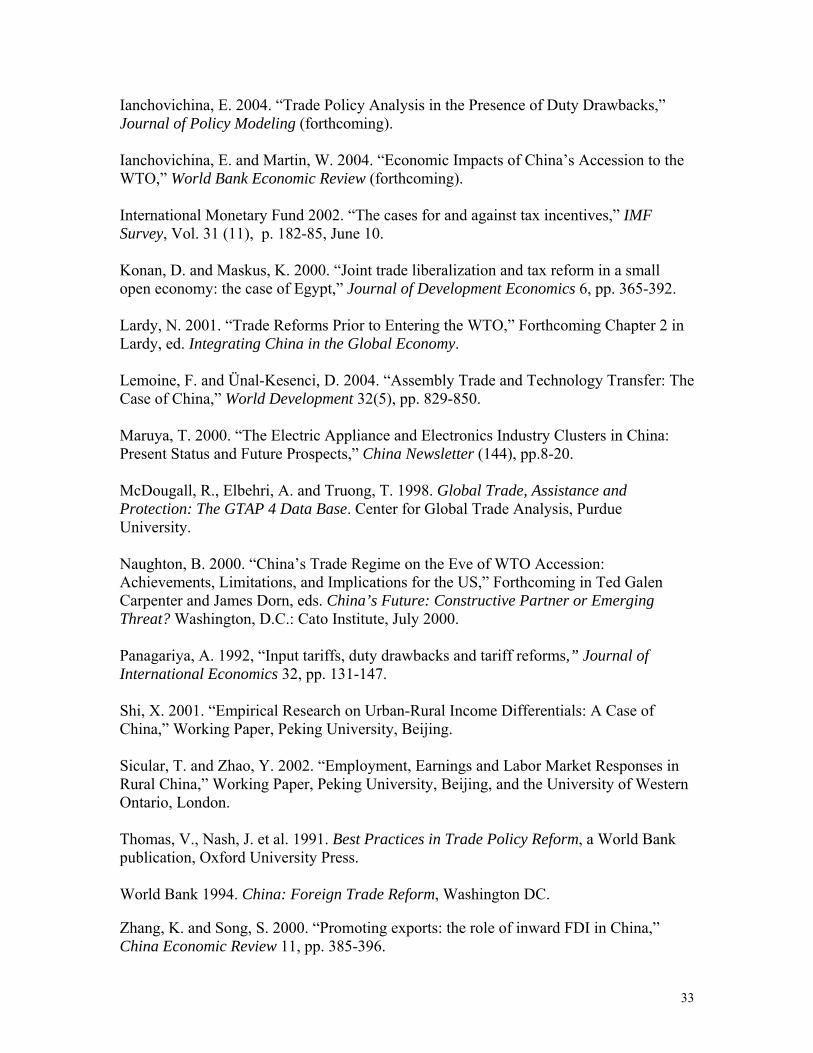
electrical equipment (Figure 1).
The boom in the export-oriented sector created millions of jobs.35 It speeded up
the transition of the Chinese economy from an agrarian to an industrial society and
shaped China’s industrial composition to reflect the country’s comparative advantage in
products that are intensive in its most abundant resource – low skilled labor.
Foreign direct investment (FDI) was also affected positively as foreign-invested
enterprises relocated production to take advantage of duty exemptions and other benefits
of the export processing regime. Zhang and Song (2000) provide evidence that inward
FDI is the most important factor determining export performance in China and isolate
duty exemptions as the most fundamental factor explaining the expanding exports by
foreign-invested enterprises. Estimates suggest that approximately 27 percent of actual
FDI has gone to the export processing sectors.36
34 These statistics are based on data for 2000 from Customs General Administration, People’s Republic of China. 35 The Ministry of Foreign Trade and Economic Cooperation (MOFTEC) estimates there are 21 million people involved in direct export processing activity (i.e., firms in which a part of the output is sold in foreign markets). In addition, there are also large numbers of people engaged in indirect export production (i.e., in firms which sell the majority of their output to direct exporters). 36 This estimate is based on the following estimates by BNP Paribus Peregrine Securities Limited for 2000: 54 percent of committed FDI is in manufactures, 50 percent of FDI in manufactures is in export processing, the delivery ratio is 52 percent (i.e. the actual FDI is 52 percent of committed FDI).
20
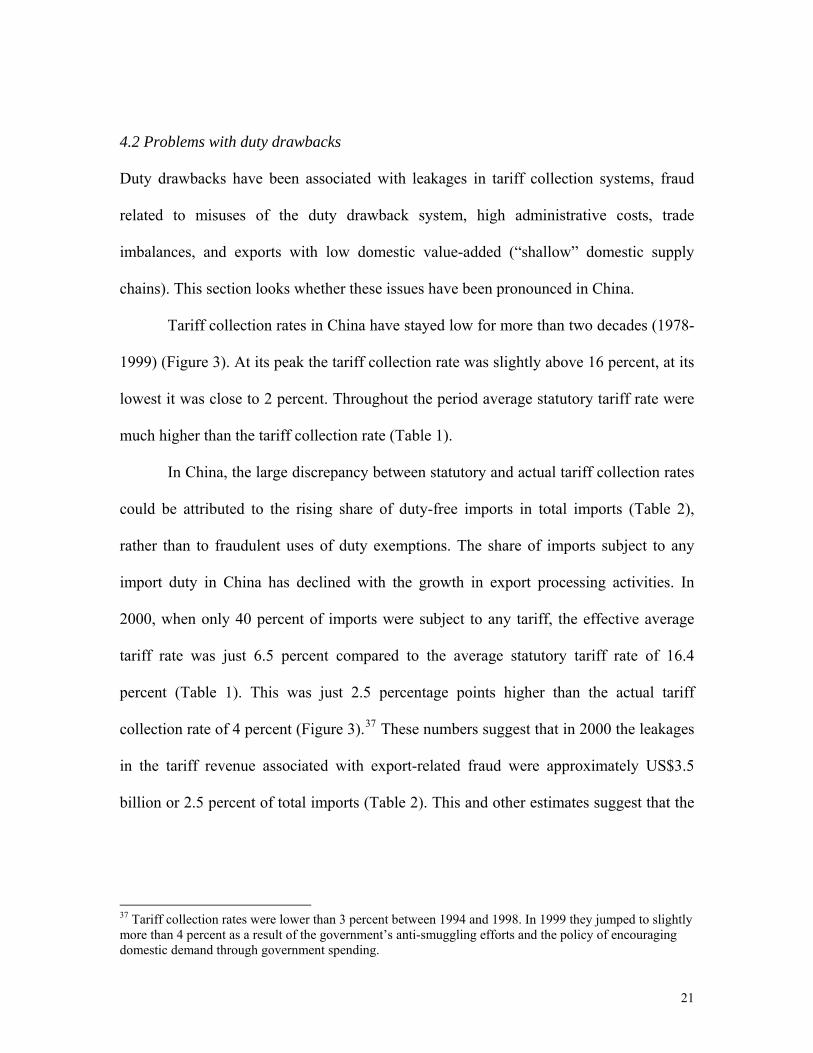
4.2 Problems with duty drawbacks
Duty drawbacks have been associated with leakages in tariff collection systems, fraud
related to misuses of the duty drawback system, high administrative costs, trade
imbalances, and exports with low domestic value-added (“shallow” domestic supply
chains). This section looks whether these issues have been pronounced in China.
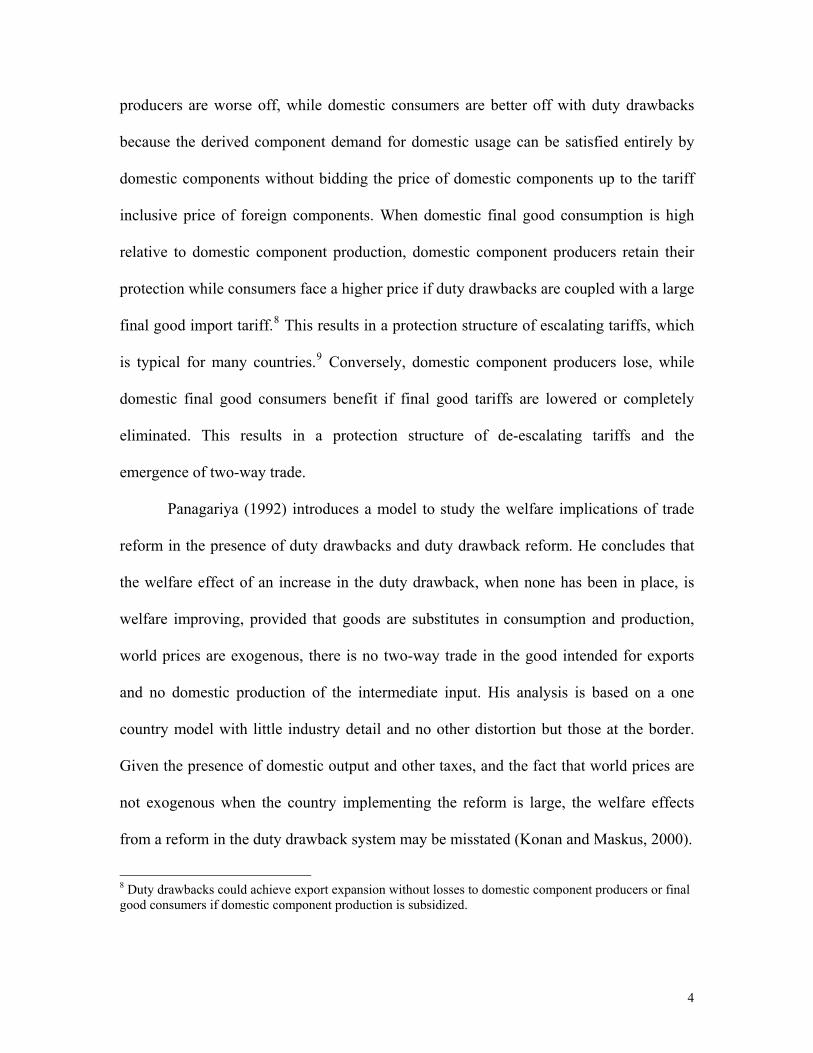
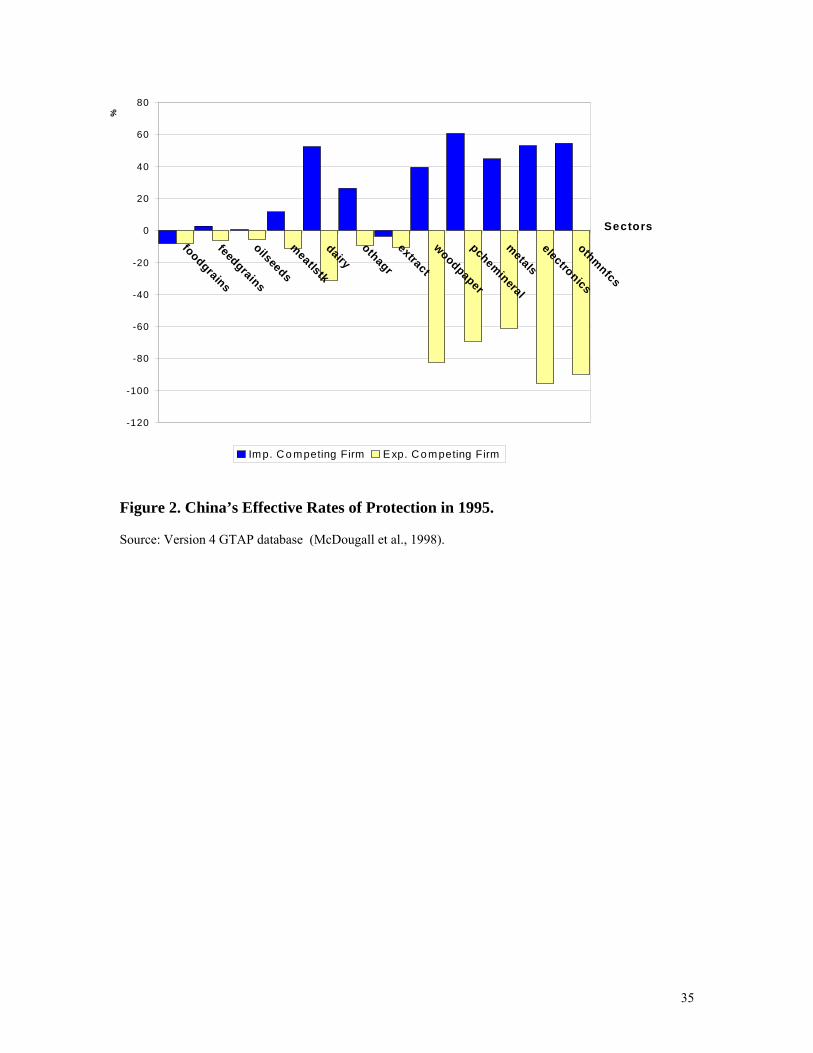
Tariff collection rates in China have stayed low for more than two decades (1978-
1999) (Figure 3). At its peak the tariff collection rate was slightly above 16 percent, at its
lowest it was close to 2 percent. Throughout the period average statutory tariff rate were
much higher than the tariff collection rate (Table 1).
In China, the large discrepancy between statutory and actual tariff collection rates
could be attributed to the rising share of duty-free imports in total imports (Table 2),
rather than to fraudulent uses of duty exemptions. The share of imports subject to any
import duty in China has declined with the growth in export processing activities. In
2000, when only 40 percent of imports were subject to any tariff, the effective average
tariff rate was just 6.5 percent compared to the average statutory tariff rate of 16.4
percent (Table 1). This was just 2.5 percentage points higher than the actual tariff
collection rate of 4 percent (Figure 3).37 These numbers suggest that in 2000 the leakages
in the tariff revenue associated with export-related fraud were approximately US$3.5
billion or 2.5 percent of total imports (Table 2). This and other estimates suggest that the
37 Tariff collection rates were lower than 3 percent between 1994 and 1998. In 1999 they jumped to slightly more than 4 percent as a result of the government’s anti-smuggling efforts and the policy of encouraging domestic demand through government spending.
21
monetary value of the leakage in tariff revenue collection related to export-related fraud
varies between US$1.5 and US$3.5 billion.38
The administration of a nationwide duty drawback system can be a costly and
complex task, especially in countries with weak administrative capacity. Hinkle et al.
(2003) conclude that none of the eleven Sub-Saharan African countries they surveyed had
a duty drawback scheme that functioned efficiently.39 In most cases, inadequate budget
allocations and fiscal constraints prevented effective implementation of the drawback
schemes.40 However, in China, the duty drawback system functioned well and the
administrative costs associated with the duty exemption system have been modest.
According to China’s General Administration of Customs, only 10 percent of China
Customs’ labor force are involved in the administration of duty drawbacks.
The export processing system has resulted in a highly concentrated export market
for Chinese products. China’s imports for processing trade come mainly from other parts
of East Asia, such as Hong Kong, Taiwan, Korea, and Japan, while its exports go
predominantly to the United States, the European Union, and Japan.41 Among all its
trading partners the largest US trade deficit is with China ($US113 billion in 2002).42 It
accounts for approximately 20 percent of the total US trade deficit. Naughton (2000)
estimates that the huge U.S. deficit with China under export processing trade overwhelms
38 The monetary value of export related fraud in 1998 was assessed at US$1.3bn. This was based on the following data gathered by Naugton (2000) during interviews with PRC officials, Beijing, August 1999. It is assumed that the best customs agencies are able to seize a maximum of 10 percent of total contraband, which in 1998 was worth US$1.2 billion, 63 percent of Customs fraud is related to export processing (Naughton 2000). The average statutory tariffs in 1998 were around 17 percent. 39 In Cameroon (1996), for instance, the reasons were administrative inefficiencies. In Uganda (1996), South Africa (1996), Tanzania (1996) and Zimbabwe (1998) uncertainties of payment and delays of up to a year in the reimbursement of import duties were major problems. Even in Mauritius (1996), long delays in duty refunds were reported. In Benin (1995), Burkina Faso (1996), and Mali (1995) the drawback system existed only on paper. 40 Côte d’Ivoire (1996) and Senegal (1995) did not have duty drawback systems. 41 Lardy (2001) reports China’s trade surplus with the United States to be around US$69 billion.
22
the tiny U.S. surplus with China under ordinary trade. With accession to the WTO these
trade imbalances could deepen, and thus could lead to an escalation in trade-related
tensions with the United States, and could increase the chances of anti-dumping cases
filed against China in the coming years.43
Perhaps the most serious concern is that the duty exemption system has created
incentives for growth in exports with little domestic value-added (“shallow” domestic
supply chains) and low profit margins. Protection of the domestic market raises the prices
of non-tradeables and tradeables with high domestic content. This discourages the use of
domestic raw materials and products, and implies that the domestic sector is not
competitive by international standards. Furthermore, companies involved in export
processing are typically part of production networks (Borrus et al., 2000). They import
intermediates from parent firms in Asian countries or buy from their affiliates on the
Mainland (Lemoine and Ünal-Kesenci, 2004), while high value added functions such as
research, design, and marketing are carried out in developed countries.44
The share of in-China value-added in 1992 was only 20 percent or less of the
value of processed exports (Naughton, 2000). It has risen since then to more than 30% in
2000 partly because the share of profit margins and/or wage costs may have increased
more rapidly than costs of imported inputs. But also because of the growing integration
42 Source: WITS/COMTRADE. 43 U.S. International Trade Commission’s (USITC) report on antidumping and countervailing duty orders in place as of February 4, 2004 suggests that antidumping orders against China have increased after 2002. There were 6 anti-dumping orders filed in 2003. With the exception of 1991, when USITC filed 7 anti-dumping cases against China, this is the largest number of such cases against China filed by USITC in any single year since 1983, (http://www.usitc.gov/). 44 The case of the hard disk drives (HDD) produced by Seagate’s Wuxi facility is a good example. The value-added within China, including wages, overhead, and a portion of transport costs is estimated to be at most 10 percent of the total value of the HDD. Most of the value of the HDD comes from research, design, marketing, management of supply chains, and other processes, which are primarily done in the United States (Gourevitch et al. 1997).
23
of the production process in China, where the value-add chain now includes packaging
and marketing, which were previously carried out in Hong Kong, and the shift in
processing activities toward machinery, which has higher local content than textiles and
electronics.
However, Maruya (2000) provides evidence that the increased local content is due
to a rise in transactions among foreign affiliates located in China and that procurement
from Chinese companies has remained low. Some of the reasons explaining the weak
linkages between the export- and domestic-oriented sectors are the higher quality of
imported intermediates, the tighter delivery schedules of foreign suppliers, the difficult
access of foreign firms to local primary products (agricultural goods and raw materials).
Dual market structure and the constraints to private sector growth45 may have slowed
down the technological upgrading of domestic companies (Lemoine and Ünal-Kesenci,
2004).
5. Will Duty Exemptions in China Be Worth the Hassle after 2007?
China’s compliance with its WTO commitments will lessen to a large degree the barriers
between the export and domestic-oriented markets. By 2007 statutory tariffs on
merchandise trade will fall to an average of 6.8% (Table 3). Competition in the domestic
market will intensify and economic efficiency will increase with the fall in protection.
The dualism of the market structure will be further reduced with the abolition of the
45 Huang (2003) argues that legal discrimination and limited access to bank credit constrained the growth of local firms.
24
complex system of trading rights,46 local content requirements, and foreign balancing
rules.
China’s WTO accession will not require the abolition of duty exemptions on
imported inputs used in the production of exports, yet given the fall in statutory tariffs
and the costs associated with the duty exemption system, it becomes important to assess
whether duty exemptions will be worth the hassle after 2007. We use the model in section
2 to quantify the impacts of a complete removal of duty drawbacks in 2007 on welfare,
output, employment, exports, prices and factor returns.
5.1 The empirical model and simulation design
The empirical model has 20 regions, 25 goods and 5 factor inputs and is implemented in
GEMPACK (Harrison and Pearson, 1996). Ianchovichina (2004) discusses in detail the
implementation in GEMPACK and the data.47 Starting point for the numerical simulation
is a data base resulting from a sequence of experiments designed to reflect growth in the
world economy to 2007 and the implementation of China’s WTO accession commitments
in Ianchovichina and Martin (2004).48
The growth projections are based on World Bank projections for aggregate real
GDP and factor input growth in each region in the model and a residually determined
total factor productivity growth rate to ensure consistency between the two.49 China’s
WTO accession commitments include reduction in protection to post-accession (2007)
46 China has agreed to terminate limitations on trading rights upon WTO accession, and in the case of designated trading over a 5 year period. 47 The GTAP version 5 database (Dimaranan and McDougall 2002) is the source for the elasticities in the model and tax distortions in the global economy. 48 Starting point for the experiments in Ianchovichina and Martin (2004) is the GTAP version 5 database (Dimaranan and McDougall, 2002).
25
tariff levels, liberalization of the services sectors, restructuring of the automobile sector,
removal of quotas on China’s clothing and textile exports, and China’s agricultural export
subsidies. The experiment considers the removal of duty drawbacks on imported inputs
used in the production of exports.
The macro closure is one of full employment, perfect mobility of skilled and
unskilled workers between nonagricultural sectors, and perfect mobility of unskilled
workers within agriculture. However, there are barriers to labor mobility between rural
and urban employment (see Ianchovichina and Martin, 2004). To capture the effects of
these barriers to mobility, the model allows for both imperfect transformation between
unskilled workers in agricultural and unskilled nonagricultural employment, and an
implicit tax on nonagricultural employment. The imperfect transformation reflects the
substantial differences in farm and nonfarm unskilled workers’ characteristics, and the
ability to transform (at a cost_ farm into nonfarm workers through training, experience,
and the creation of nonfarm jobs in rural areas.50 The tax is designed to reflect the pure
policy-induced barriers between rural and urban workers, such as the cost of a residence
permit and the inability to sell farm land.51 Assuming little induced change in net
international capital flows, trade balances as shares of GDP were fixed for China. This
assumptions is necessary because foreign investment levels are not determined within the
model.
49 These projection rates are shown in Table 4 of Ianchovichina and Martin (2004), available also as a World Bank Policy Research Working Paper at http://econ.worldbank.org/files/26864_wps3053.pdf. 50 We set the elasticity of transformation at 1.32. This is the estimate by Sicular and Zhao (2002) used in Ianchovichina and Martin (2004). 51 The tax reflection pure policy-induced barriers between rural and urban wages is set at 34 percent. This is the estimate by Shi (2001) used in Ianchovichina and Martin (2004). Even though the government recently
26
5.2 Impact of duty exemption removal in China
The removal of duty exemptions after the completion of China’s WTO accession
commitments will have a positive effect on welfare in China (column 2, Table 5).
Aggregate welfare might increase by US$ 6 to 8 billion a year as China’s terms of trade
improve (by US$6 billion) due to increases in export prices of major export products
(Table 4), tariff revenue (rising by 25%), and savings of between US$2 billion and US$4
billion as export processing related fraud declines (Table 5).
These gains will be offset by losses in economic efficiency as the dispersion in
ERPs increases (ERP for export processing firms becomes negative). The main source of
efficiency loss is associated with the increase in tariffs on imported intermediates used in
the production of exports,52 which amount to US$1.5 billion (Table 5). A small welfare
loss is associated with the contraction of the export processing sectors as they are
primarily manufacturing sectors, which in China face higher employment-related taxes
than other sectors (e.g. agriculture).53 We assume that output taxes in the exporting
sectors are zero since GTAP version 5 appears to represent the VAT on production as an
output tax and exports in China are exempt from VAT (Ianchovichina and Martin, 2004).
The direction of the welfare effect is consistent with the predictions of the model
when the country is a price taker (column 3, Table 5). Since world prices are fixed in this
case, the welfare outcome of a duty exemption reform captures the allocative efficiency
effect (equation B), while the terms of trade effect is zero. The theory in section 3.2
suggests that in the absence of domestic distortions, the welfare effect of a removal of full
removed the requirement for a residence permit in urban areas, in practice migrant workers in urban areas still need to incur the costs of health care and schooling for children in urban areas. 52 Table 3 shows post-accession tariff structure with and without duty exemptions in China.
27
duty exemptions is likely to be negative when the tariff structure is escalating. According
to GTAP data, China had escalating tariff structure54 and output taxes were not large
(average output taxes were around 5%). Consequently, the expected allocative efficiency
effect is negative and the aggregate welfare gain, including the savings due to reduction
in fraud related to export processing, is zero (column 3, Table 5).
The cases in Table 5 are limiting cases. China is neither likely to be a price taker
in all commodities, nor it is likely that it will have a strong impact on world prices in
most goods. Furthermore, the Armington assumption tends to lead to strong terms of
trade effects. This implies that the welfare effect is likely to be smaller than US$6 billion
a year.
While the complete removal of duty drawbacks will not affect negatively
aggregate welfare, it will hurt exports (Table 4). The volume of total exports will decline
by 6% as China increases prices that will now reflect 2007 tariffs on imported
intermediate inputs (Table 3). Real GDP will however remain approximately unchanged
(-0.1%) as the decline in exports is offset by an increase in domestic sales (0.8%) (Table
4). Demand for labor employed in export processing industries will decline driving real
wages of unskilled and skilled nonfarm labor down by 0.3% (Table 4). Skilled and
unskilled labor is absorbed into industries producing for the domestic market and export-
oriented manufacturing sectors increase their demand for domestic manufactured
intermediates (e.g. metals, petrochemical, electronics, apparel, light and other
manufactures). The increase in production for the domestic market leads to a decline in
domestic prices (Table 4).
53 Employment taxes in nonfarm industries of 34% reflect the cost of a residence permit and the inability to sell farm land.
28
Sectors in which export processing is important lose competitiveness and contract
in the face of higher input costs. Exports of automobiles decline by 38%, plant-based
fibers – 17%,55 beverages – 11%, textiles – 7%, apparel by – 7%, electronics – 5 %, light
manufacturing – 4% (Table 4). The adverse effect on key manufacturing sectors suggests
that producers will increase their efforts to lobby in favor of the current duty exemption
system. The government may also be reluctant to make sweeping changes in the current
duty exemption system as such changes may threaten growth of key manufacturing
sectors that generate employment and allow specialization in sophisticated manufactured
goods.
The removal of duty exemptions will lead to a decline in the bilateral trade
surplus with North America of around US$7 billion or 6 percent. This will ease the trade-
related tensions between the two nations that are expected to intensify. Ianchovichina and
Martin (2004) find that the bilateral trade surplus with the United States is expected to
increase by 10 percent due to reforms associated with China’s entry into the WTO and
scheduled to take place between 2001 and 2007.
6. Concluding remarks
This paper reviews the literature and analyzes duty drawbacks in the presence of
domestic distortions. Introducing duty drawbacks is welfare enhancing in a small
economy if the import competing sectors are subsidized, have uniform or escalating tariff
structure and low intensity of import use, while the export-oriented sectors are taxed.
Reducing full duty drawbacks is likely to be welfare reducing when the import competing
54 Source: World Bank, Trade Department and Figure 2.
29
sectors have escalating tariff structure and are protected by domestic output subsidies,
while the exporting sectors are taxed. The higher the tariff on imported final goods, the
lower the tariff on imported inputs, and the import intensity of the import competing
sector, the more likely it is that the welfare effect will be negative. In general, the welfare
effect of a change in the duty drawback regime is ambiguous. The higher the protection
on the import competing sector and the tax on the exportables, the lower the initial duty
drawback, the tariff on imported inputs, and the import intensity of the import-competing
sector, the more likely it is that the allocative efficiency effects of an reduction in the
duty drawback is negative. The import intensity of the exporting sector and the level of
imported protection are positively related to the magnitude of the allocative efficiency
effect. In a large economy, there will be a nonnegative terms of trade effect, which in the
perfectly competitive case is inversely related to the direction of duty drawback change.
In general, it is impossible to estimate qualitatively and quantitatively the welfare
impact of a change in duty drawbacks without a systematic empirical framework. The
paper describes duty drawbacks in China, which are a key feature of the country’s export
processing system, and uses a empirical global general equilibrium model to assess the
effects of a potential complete abolition of China’s duty exemption system in 2007, when
China would have fulfilled almost all of its WTO commitments. While removal of duty
drawbacks may not affect adversely aggregate welfare, it will have a strong negative
effect on production, exports and employment of some key manufacturing sectors.
Hardest hit will be the automobile sector, whose exports and output will contract by
almost 40 percent and 16 percent, respectively, in the event that duty exemptions on
55 The negative impact on exports of plant based fibers illustrates the importance of production sharing in the region.
30
imported inputs are abolished. Removal of duty drawbacks will increase domestic value
added and lead to a decline in China’s bilateral trade surplus with North America by
about US $7 billion.
A number of caveats are important. The analysis abstracts from the effect of duty
drawbacks on investment. Duty exemptions have been cited as the most import factor
explaining the expanding exports of foreign invested enterprises. (Zhang and Song,
2000). The level of aggregation in this paper hides important information on intra-
industry trade in components. This is a serious limitation especially when analyzing the
impact on high-end manufacturing sectors benefiting from duty exemptions (e.g.
electronics, autos, machinery, and equipment).
31
References
Armington, P. 1969. ‘A theory of Demand for Products Distinguished by Place of Production’, IMF Staff Papers, 16:159-178. Balassa. B., et al. 1971. The Structure of Protection in Developing Countries, Baltimore, Maryland, The Johns Hopkins Press. Borrus, M., Ernst, D. and Haggard, S. 2000. International production networks in Asia: rivalry or riches? London and New York: Routledge. Cadot, O., de Melo, J. and Olarreaga M. 2003. “The Protectionist Bias of Duty Drawbacks: Evidence from MERCOSUR,” Journal of International Economics, 59(1), pp. 161-82. Dimaranan, B. and McDougall, R. 2002. Global Trade, Assistance, and Production: The GTAP 5 Data Base. West Lafayette, Ind.: Purdue University, Center for Global Trade Analysis. General Administration of Customs, PRC 2000. China’s Customs Statistics (Monthly Exports and Imports), Series No. 136, December, 2000. Gourevitch, P., Bohn, R. and McKendrick, D. 1997 “Who is us? The nationality of production in the hard disk drive industry,” Report 97-01, Data Storage Industry Globalization Project, Graduate School of International Relations and Pacific Studies, University of California, San Diego, March. Gruen, N. 1999. “Towards a More General Approach to Trade Liberalization,” The Economic Record 75, pp. 385-396. Harrison, J. and Pearson, K. 1996. ‘Computing Solutions for Large General Equilibrium Models Using GEMPACK’, Computational Economics 9(2), pp. 83-127. Herander, M. 1986. “Export Drawback and the Structure of Protection,” Bulletin of Economic Research 38(1), p. 43-8. Hinkle, L., Herrou-Aragon, A. and Kubota, K. 2003. “How Far Did Africa’s First Generation Trade Reforms Go?” Africa Region Working Paper Series No. 58, World Bank, Washington D.C., June 2003. Huang, Y. 2003. Selling China: Foreign Direct Investment During the Reform Era, Cambridge: Cambridge University Press. Hufbauer and Erb 1984. Subsidies in International Trade, Washington, D.C., Institute for International Economics.
32
Ianchovichina, E. 2004. “Trade Policy Analysis in the Presence of Duty Drawbacks,” Journal of Policy Modeling (forthcoming). Ianchovichina, E. and Martin, W. 2004. “Economic Impacts of China’s Accession to the WTO,” World Bank Economic Review (forthcoming). International Monetary Fund 2002. “The cases for and against tax incentives,” IMF Survey, Vol. 31 (11), p. 182-85, June 10. Konan, D. and Maskus, K. 2000. “Joint trade liberalization and tax reform in a small open economy: the case of Egypt,” Journal of Development Economics 6, pp. 365-392. Lardy, N. 2001. “Trade Reforms Prior to Entering the WTO,” Forthcoming Chapter 2 in Lardy, ed. Integrating China in the Global Economy. Lemoine, F. and Ünal-Kesenci, D. 2004. “Assembly Trade and Technology Transfer: The Case of China,” World Development 32(5), pp. 829-850. Maruya, T. 2000. “The Electric Appliance and Electronics Industry Clusters in China: Present Status and Future Prospects,” China Newsletter (144), pp.8-20. McDougall, R., Elbehri, A. and Truong, T. 1998. Global Trade, Assistance and Protection: The GTAP 4 Data Base. Center for Global Trade Analysis, Purdue University.
Naughton, B. 2000. “China’s Trade Regime on the Eve of WTO Accession: Achievements, Limitations, and Implications for the US,” Forthcoming in Ted Galen Carpenter and James Dorn, eds. China’s Future: Constructive Partner or Emerging Threat? Washington, D.C.: Cato Institute, July 2000.
Panagariya, A. 1992, “Input tariffs, duty drawbacks and tariff reforms,” Journal of International Economics 32, pp. 131-147. Shi, X. 2001. “Empirical Research on Urban-Rural Income Differentials: A Case of China,” Working Paper, Peking University, Beijing. Sicular, T. and Zhao, Y. 2002. “Employment, Earnings and Labor Market Responses in Rural China,” Working Paper, Peking University, Beijing, and the University of Western Ontario, London. Thomas, V., Nash, J. et al. 1991. Best Practices in Trade Policy Reform, a World Bank publication, Oxford University Press. World Bank 1994. China: Foreign Trade Reform, Washington DC. Zhang, K. and Song, S. 2000. “Promoting exports: the role of inward FDI in China,” China Economic Review 11, pp. 385-396.
33
0
1000
2000
3000
4000
5000
6000
7000
8000
1995 1996* 1997 1998 1999
US$
- m
illio
ns9000
Computer Imports (finished goods) Computer Exports (finished goods) Component Imports Component Exports
Figure 1. Chinese Information Technology Trade – Computers and Computer Components (Lardy, 2001). Source: Lardy (2001)
34
-120
-100
-80
-60
-40
-20
0
20
40
60
80
foodgrains
feedgrains
oilseeds
meatlstk
dairyothagr
extract
woodpaper
pchemineral
metals
electronics
othmnfcs
Sectors
%
Imp. Co mpeting Firm E xp. Co mpeting Firm
Figure 2. China’s Effective Rates of Protection in 1995. Source: Version 4 GTAP database (McDougall et al., 1998).
35
0
2
4
6
8
10
12
14
16
18
20
1978 1979 1980 1981 1982 1983 1984 1985 1986 1987 1988 1989 1990 1991 1992 1993 1994 1995 1996 1997 1998 1999
perc
ent
tariff revenue
Figure 3. Tariff Revenue as a Percentage of the Value of Imports: 1978-2000.
Source: Lardy (2001)
36
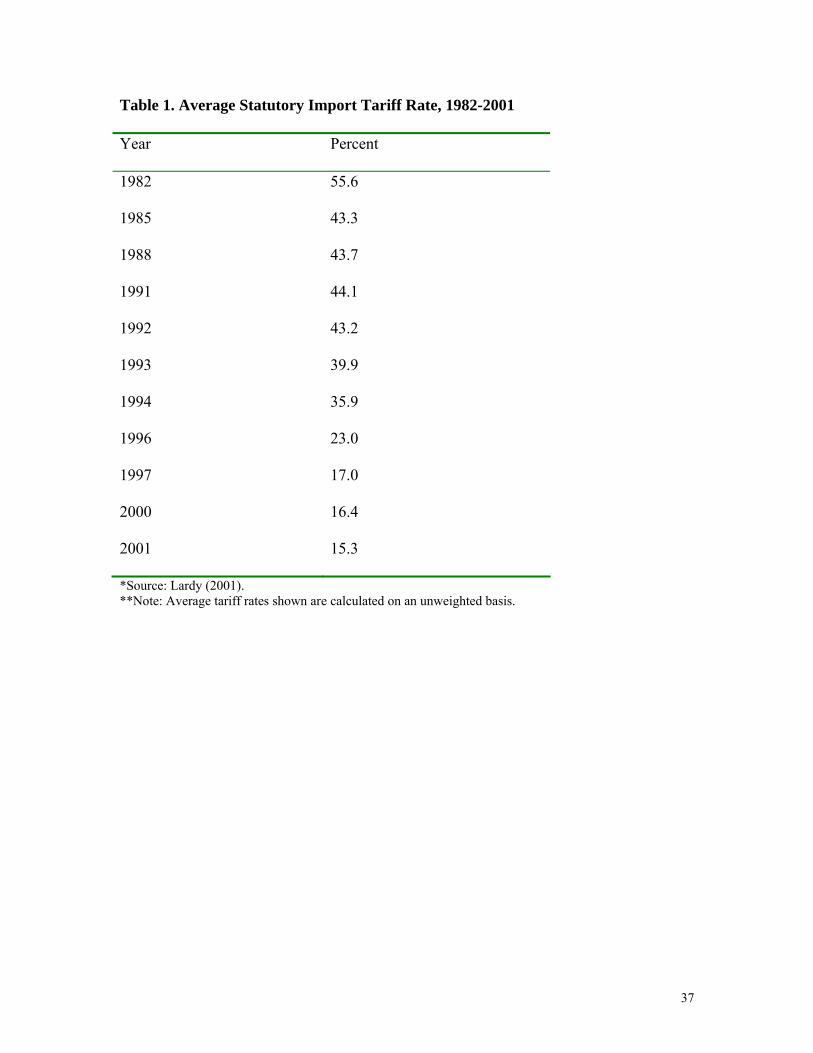
Table 1. Average Statutory Import Tariff Rate, 1982-2001
Year Percent
1982 55.6
1985 43.3
1988 43.7
1991 44.1
1992 43.2
1993 39.9
1994 35.9
1996 23.0
1997 17.0
2000 16.4
2001 15.3
*Source: Lardy (2001). **Note: Average tariff rates shown are calculated on an unweighted basis.
37
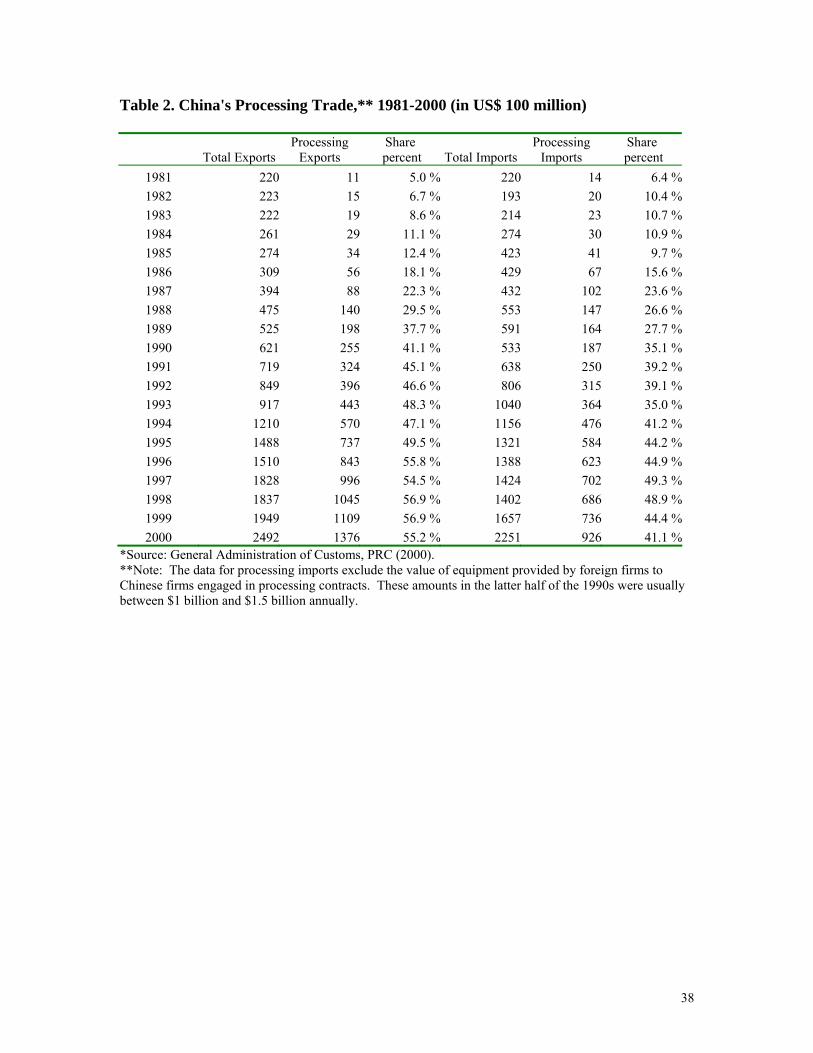
Table 2. China's Processing Trade,** 1981-2000 (in US$ 100 million)
Total Exports Processing
Exports Share
percent Total ImportsProcessing
Imports Share
percent 1981 220 11 5.0 % 220 14 6.4 %1982 223 15 6.7 % 193 20 10.4 %1983 222 19 8.6 % 214 23 10.7 %1984 261 29 11.1 % 274 30 10.9 %1985 274 34 12.4 % 423 41 9.7 %1986 309 56 18.1 % 429 67 15.6 %1987 394 88 22.3 % 432 102 23.6 %1988 475 140 29.5 % 553 147 26.6 %1989 525 198 37.7 % 591 164 27.7 %1990 621 255 41.1 % 533 187 35.1 %1991 719 324 45.1 % 638 250 39.2 %1992 849 396 46.6 % 806 315 39.1 %1993 917 443 48.3 % 1040 364 35.0 %1994 1210 570 47.1 % 1156 476 41.2 %1995 1488 737 49.5 % 1321 584 44.2 %1996 1510 843 55.8 % 1388 623 44.9 %1997 1828 996 54.5 % 1424 702 49.3 %1998 1837 1045 56.9 % 1402 686 48.9 %1999 1949 1109 56.9 % 1657 736 44.4 %2000 2492 1376 55.2 % 2251 926 41.1 %
*Source: General Administration of Customs, PRC (2000). **Note: The data for processing imports exclude the value of equipment provided by foreign firms to Chinese firms engaged in processing contracts. These amounts in the latter half of the 1990s were usually between $1 billion and $1.5 billion annually.
38
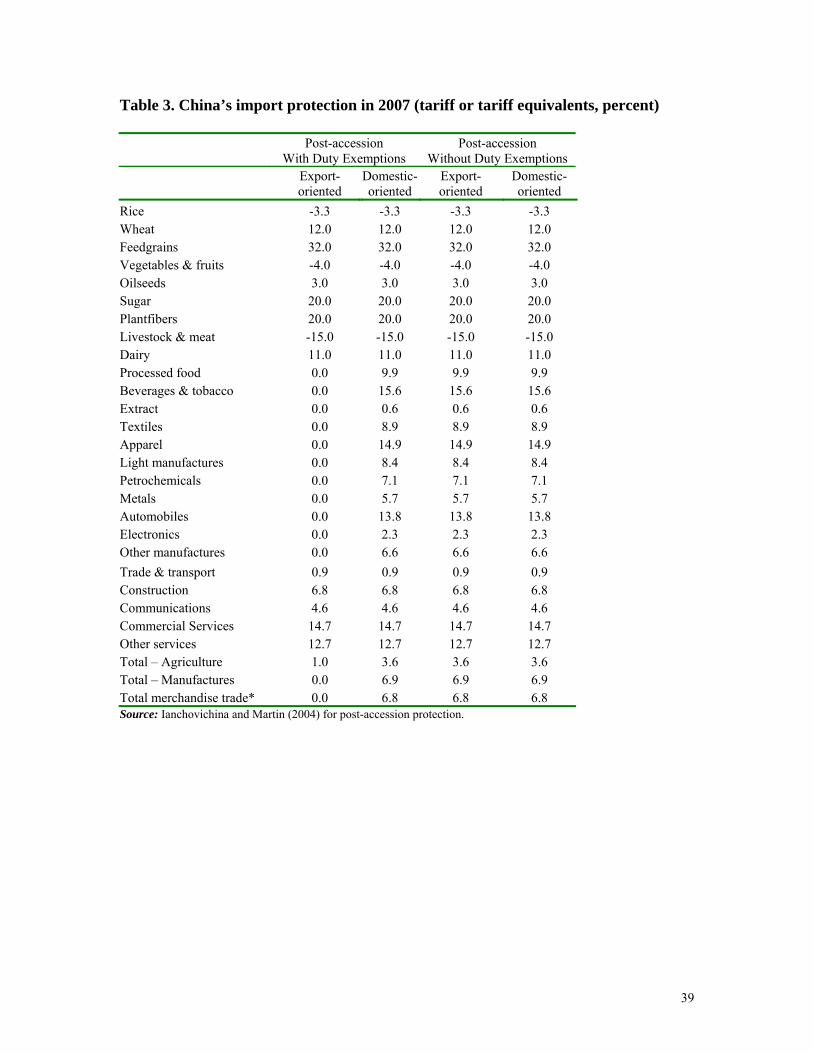
Table 3. China’s import protection in 2007 (tariff or tariff equivalents, percent)
Post-accession
With Duty Exemptions Post-accession
Without Duty Exemptions
Export-oriented
Domestic-oriented
Export-oriented
Domestic-oriented
Rice -3.3 -3.3 -3.3 -3.3 Wheat 12.0 12.0 12.0 12.0 Feedgrains 32.0 32.0 32.0 32.0 Vegetables & fruits -4.0 -4.0 -4.0 -4.0 Oilseeds 3.0 3.0 3.0 3.0 Sugar 20.0 20.0 20.0 20.0 Plantfibers 20.0 20.0 20.0 20.0 Livestock & meat -15.0 -15.0 -15.0 -15.0 Dairy 11.0 11.0 11.0 11.0 Processed food 0.0 9.9 9.9 9.9 Beverages & tobacco 0.0 15.6 15.6 15.6 Extract 0.0 0.6 0.6 0.6 Textiles 0.0 8.9 8.9 8.9 Apparel 0.0 14.9 14.9 14.9 Light manufactures 0.0 8.4 8.4 8.4 Petrochemicals 0.0 7.1 7.1 7.1 Metals 0.0 5.7 5.7 5.7 Automobiles 0.0 13.8 13.8 13.8 Electronics 0.0 2.3 2.3 2.3 Other manufactures 0.0 6.6 6.6 6.6 Trade & transport 0.9 0.9 0.9 0.9 Construction 6.8 6.8 6.8 6.8 Communications 4.6 4.6 4.6 4.6 Commercial Services 14.7 14.7 14.7 14.7 Other services 12.7 12.7 12.7 12.7 Total – Agriculture 1.0 3.6 3.6 3.6 Total – Manufactures 0.0 6.9 6.9 6.9 Total merchandise trade* 0.0 6.8 6.8 6.8 Source: Ianchovichina and Martin (2004) for post-accession protection.
39
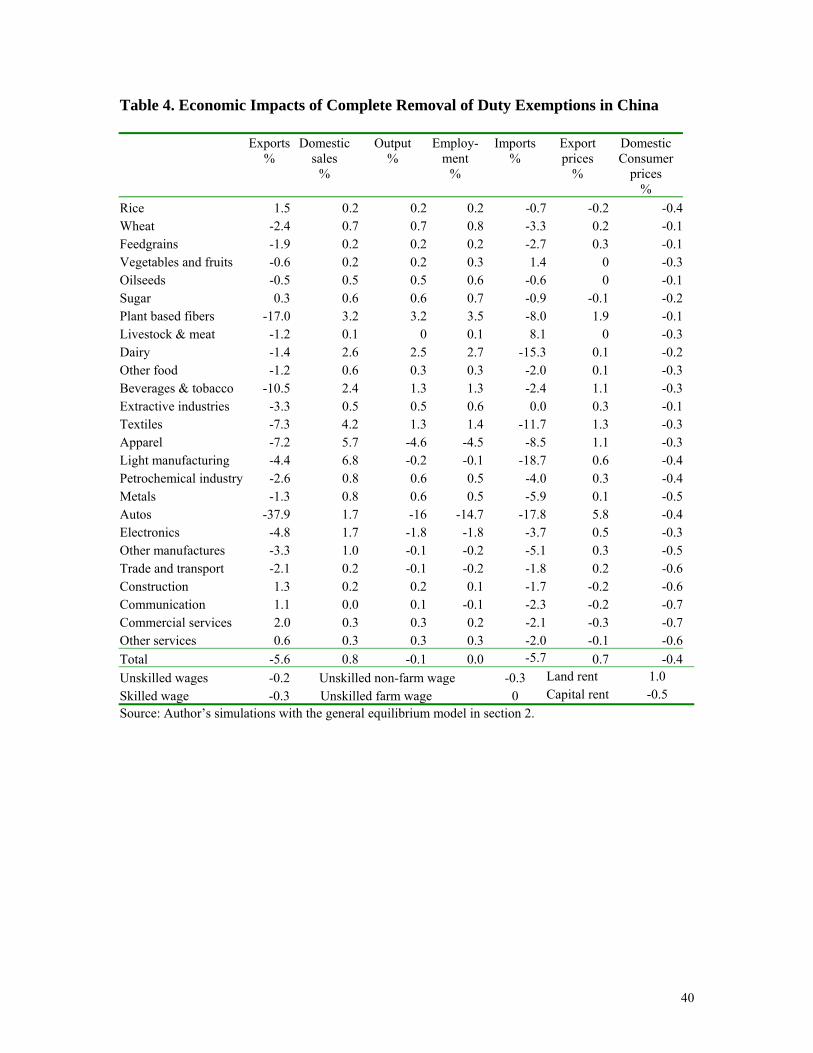
Table 4. Economic Impacts of Complete Removal of Duty Exemptions in China
Exports %
Domestic sales
%
Output %
Employ-ment
%
Imports %
Export prices
%
Domestic Consumer
prices %
Rice 1.5 0.2 0.2 0.2 -0.7 -0.2 -0.4Wheat -2.4 0.7 0.7 0.8 -3.3 0.2 -0.1Feedgrains -1.9 0.2 0.2 0.2 -2.7 0.3 -0.1Vegetables and fruits -0.6 0.2 0.2 0.3 1.4 0 -0.3Oilseeds -0.5 0.5 0.5 0.6 -0.6 0 -0.1Sugar 0.3 0.6 0.6 0.7 -0.9 -0.1 -0.2Plant based fibers -17.0 3.2 3.2 3.5 -8.0 1.9 -0.1Livestock & meat -1.2 0.1 0 0.1 8.1 0 -0.3Dairy -1.4 2.6 2.5 2.7 -15.3 0.1 -0.2Other food -1.2 0.6 0.3 0.3 -2.0 0.1 -0.3Beverages & tobacco -10.5 2.4 1.3 1.3 -2.4 1.1 -0.3Extractive industries -3.3 0.5 0.5 0.6 0.0 0.3 -0.1Textiles -7.3 4.2 1.3 1.4 -11.7 1.3 -0.3Apparel -7.2 5.7 -4.6 -4.5 -8.5 1.1 -0.3Light manufacturing -4.4 6.8 -0.2 -0.1 -18.7 0.6 -0.4Petrochemical industry -2.6 0.8 0.6 0.5 -4.0 0.3 -0.4Metals -1.3 0.8 0.6 0.5 -5.9 0.1 -0.5Autos -37.9 1.7 -16 -14.7 -17.8 5.8 -0.4Electronics -4.8 1.7 -1.8 -1.8 -3.7 0.5 -0.3Other manufactures -3.3 1.0 -0.1 -0.2 -5.1 0.3 -0.5Trade and transport -2.1 0.2 -0.1 -0.2 -1.8 0.2 -0.6Construction 1.3 0.2 0.2 0.1 -1.7 -0.2 -0.6Communication 1.1 0.0 0.1 -0.1 -2.3 -0.2 -0.7Commercial services 2.0 0.3 0.3 0.2 -2.1 -0.3 -0.7Other services 0.6 0.3 0.3 0.3 -2.0 -0.1 -0.6Total -5.6 0.8 -0.1 0.0 -5.7 0.7 -0.4Unskilled wages -0.2 Unskilled non-farm wage -0.3 Land rent 1.0 Skilled wage -0.3 Unskilled farm wage 0 Capital rent -0.5 Source: Author’s simulations with the general equilibrium model in section 2.
40
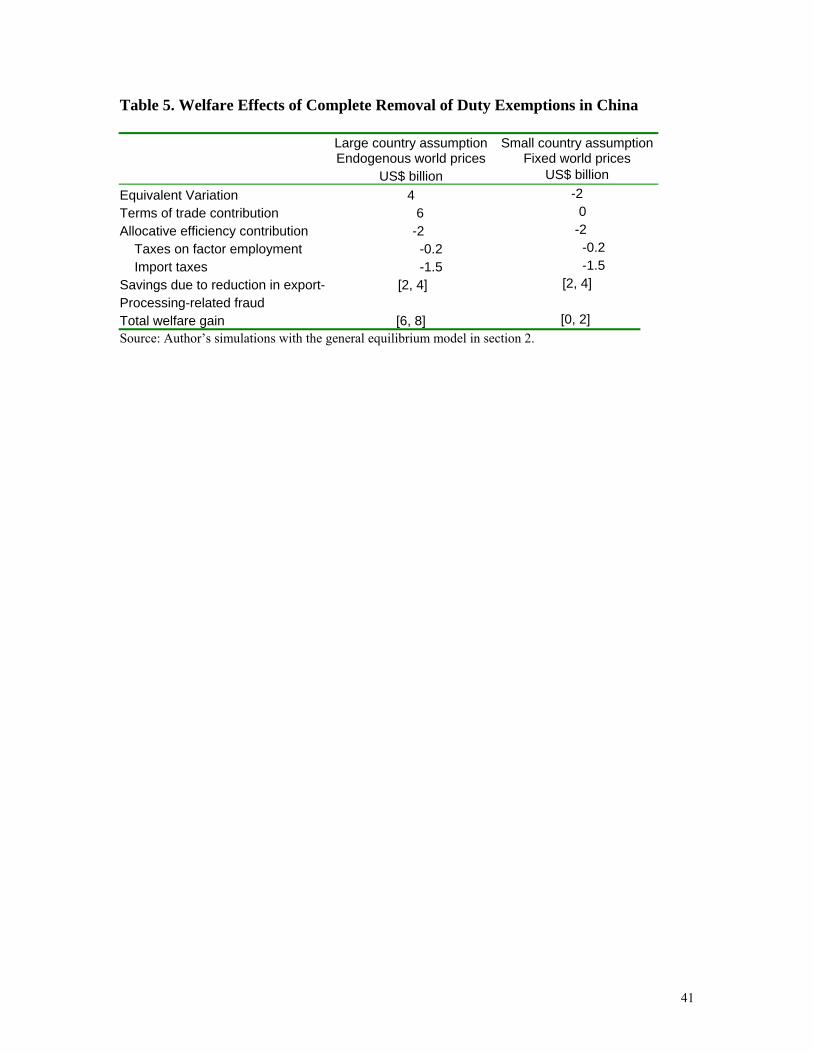
Table 5. Welfare Effects of Complete Removal of Duty Exemptions in China
Large country assumption Endogenous world prices
Small country assumption Fixed world prices
US$ billion US$ billion Equivalent Variation 4 -2 Terms of trade contribution 6 0 Allocative efficiency contribution -2 -2 Taxes on factor employment -0.2 -0.2 Import taxes -1.5 -1.5 Savings due to reduction in export- [2, 4] [2, 4] Processing-related fraud Total welfare gain [6, 8] [0, 2] Source: Author’s simulations with the general equilibrium model in section 2.
41