dss for monitoring agro-meteorological and crop conditions in india
Upload: ccafs-cgiar-program-climate-change-agriculture-and-food-security
Post on 17-Jul-2015
177 views
TRANSCRIPT

DSS for monitoring agro-meteorological
and crop conditions in India using remote
sensing for agro-advisory services
Vinay Sehgal, Malti Singh, Rakeshwar Verma,
Ananta Vashisth, Himanshu Pathak
ICAR - Indian Agricultural Research Institute, New Delhi – 110012
(www.iari.res.in)Montpellier
March 16-18, 2015

Rationale� Smart Agriculture
� Based on informed decisions
� By policy makers (Federal & State)
� By stakeholders (Farmers, Researchers, Developmental agencies)
� To fulfil immediate requirements and long term sustainability goal
� Hypothesis
� Real time monitoring of crop conditions at regional scales as affected by
climatic stresses for suggesting contingency measures to stakeholders and climatic stresses for suggesting contingency measures to stakeholders and
likely food situation (Production forecast) to policy makers is one of the
broad strategies of climate smart agriculture.
� Remote Sensing technology
� Range of Spatial / Spectral Resolutions – field scale to regional scale
� Repetitive – for regular monitoring
� Indices directly observe crop vigour and crop environment
� Multiple sources and historical standardized datasets

The IARI Satellite Ground Station (NICRA)The IARI Satellite Ground Station (NICRA)
� First such system in an
Agricultural Institute
� Receive direct
broadcast of remote
sensing data from
satellites
� US, European, Chinese
and Indian satelliteand Indian satellite
� Mid China to Indian
Ocean : Mid Iran to
Myanmar
� End-of-pass to level-2
product in less than 10
min
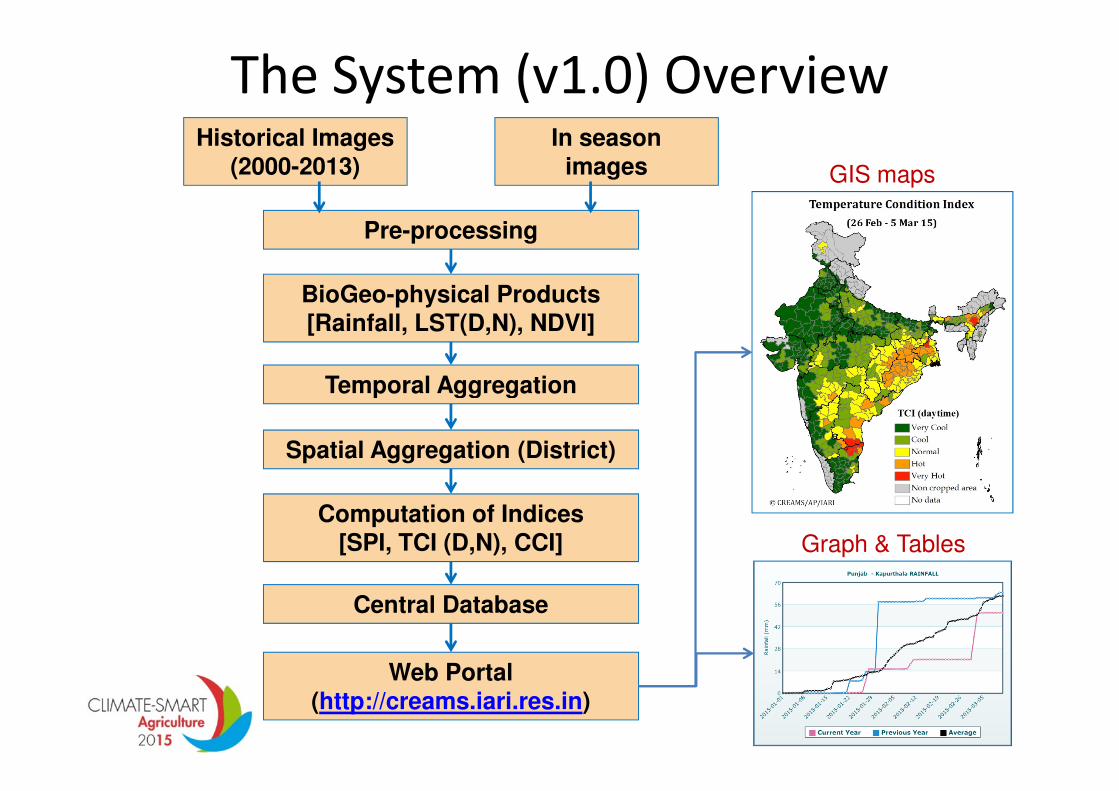
Temporal Aggregation
BioGeo-physical Products[Rainfall, LST(D,N), NDVI]
Pre-processing
Historical Images
(2000-2013)
In season
images
The System (v1.0) Overview
GIS maps
Temporal Aggregation
Spatial Aggregation (District)
Computation of Indices[SPI, TCI (D,N), CCI]
Central Database
Web Portal(http://creams.iari.res.in)
Graph & Tables

METHODOLOGY
ParameterDaily Rainfall
Daily NDVI
Day Land Surface
IndexWeekly Standardized Precipitation Index (SPI)Fortnightly Crop Condition Index (CCI)Weekly Daytime Day Land Surface
Temperature (LST)
Night Land Surface Temperature (LST)
Weekly Daytime Temperature Condition Index (TCI-day)Weekly Night time Temperature Condition Index (TCI-night)

METHODODLOGY
Standardized Precipitation Index (SPI)Index of rainfall anomalyComparable across regions & time scale
Classification of SPI values
2.0+ Extremely wet
1.5 to 1.99 Very wet
1.0 to 1.49 Moderately wet
-.99 to .99 Near normal
-1.0 to -1.49 Moderately dry
-1.5 to -1.99 Severely dry
-2 and less Extremely dry

METHODODLOGY
Crop Condition Index (CCI)Index of crop greenness/healthBased on NDVI scalingComparable across regions & time scale
Classification of CCI values
< 20 % Very poor
20 – 40 % Poor
40 – 60% Normal
60 – 80% Good
> 80% Very Good
(NDVIJ – NDVImin) *100CCIJ =-------------------------------
(NDVImax – NDVImin)

METHODODLOGY
Temp. Condition Index (TCI)Index of surface TemperatureSeparate for Day & NightComparable across regions & time scale
Classification of TCI values
(LSTmax – LSTj) *100TCIJ =-------------------------------
(LSTmax – LSTmin)
< 20 % Very Hot
20 – 40 % Hot
40 – 60% Normal
60 – 80% Cool
> 80% Very Cool

Suit of Technologies
�Specification
- Automatized the workflow (C, IDL)
- Map preparation in ArcGIS
- Database: MySQL
- Web programming: PhP
- Web server: Apache tomcat
�Visualization
http://creams.iari.res.in
�Visualization
- Country Level: as periodic &
seasonal maps
- District level: Temporal profile of parameters in current season as
compared to previous year and
average

Rainfall Monitoring Kharif 2014-15 (periodic)

Rainfall Monitoring Kharif 2014-15 (seasonal)

Rainfall Monitoring
Kharif season (2013-14) Kharif season (2014-15)

Kharif 2014-15
Temperature Condition index (day) (Periodic)
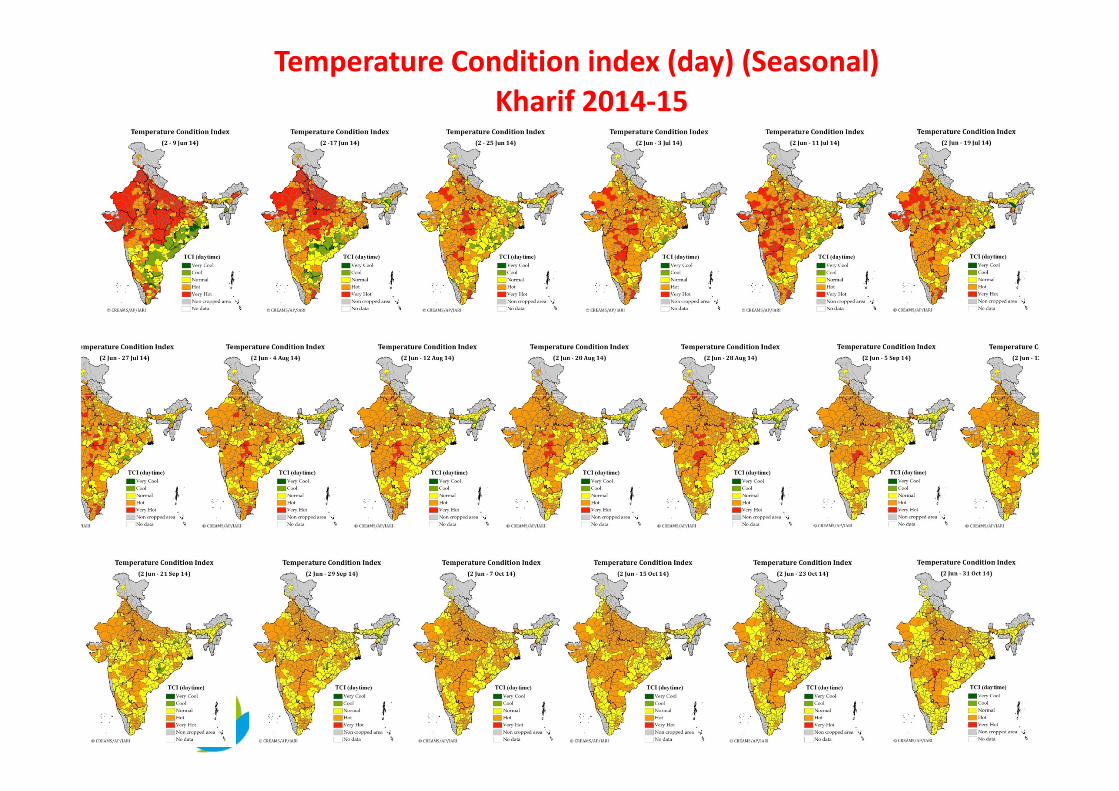
Kharif 2014-15
Temperature Condition index (day) (Seasonal)

Kharif 2014
Temperature Condition index (night) (Periodic)

Kharif 2014-15
Temperature Condition index (night) (Seasonal)

Kharif 2014-15
Crop Condition Index (Periodic)

Kharif 2014-15
Crop Condition Index (Seasonal)

Wheat Total Seasonal
Rabi 2013 -14
Districts with wheat crop area more than 10% of Net Sown Area

Kharif 2014-15
Rice Total Seasonal

Cumulative SPI of Rabi Season(29-Oct-14 to 11-Mar-2015)
� Extremely wet/very wet conditions over
many parts of North Punjab, foothills of
Himachal, southern districts of Haryana,
Delhi, few districts of east-central Uttar
Pradesh and Marthawada region of
Maharashtra.
Highlights
� Moderately wet conditions observed in
Hilly districts of Himachal, northern Haryana,
Central Uttar Pradesh, Madhya Pradesh and
Saurashtra.
� Extremely dry/ severely dry conditions
were observed over many parts of Tamil
Nadu, in few southern districts of Andhra
Pradesh and Karnataka,
� Rest of the country experienced normal
conditions.

District Level Time Series Data

Case of Extreme Rainfall in March 2015
Jalandhar
Shivpuri

Comparing Jalandhar & Shivpuri situation
Two districts need differential Contingency Measures Two districts need differential Contingency Measures

Surface Observations-
Manned/ Automatic
Upper-Air Observations
Aircraft Reports
Ship Reports
Multi Modal
Ensemble
Medium Range Weather Forecast Based Agro-Advisory System
Medium Range Forecast
District level Forecast
Subject Experts
AgrometAdvisory
Remote Sensing Indices
Satellite Observations
Ocean Buoys data
Global Data
Advisory Bulletin
National Level For Planners
District Level For Farmers
Radio/TV SMS PrintEmail

Wheat Yield Forecasting – Group of DistrictsWheat Yield Forecasting – Group of Districts
Punjab & Haryana Agro-ecoregions

The Models and their PerformanceThe Models and their Performance

Forecast for 2013-2014Change over previous year
Production
(M t)
Yield
(t/ha)Production (%) Yield (%)
Punjab 16.97 4.84 + 2.2 + 2.3
The ForecastsThe Forecasts
Haryana 11.48 4.59 + 3.0 + 2.9
First Forecast
Used Satellite Data upto 20 March 2014.

Summary & Path Ahead
It is a prototype system in its initial development /validation phaseThe information generated is both complementary and supplementary to current system with potential for improving the agro-advisories at national scale.Some more bio-physical product based indices, esp. those related to canopy and soil moisture to be those related to canopy and soil moisture to be includedGenerating and hosting pixel level indices maps for visualizing sub-district scale variabilityWorking on linking remote sensing inputs into crop simulation model for What-if analysis for advisory and better yield forecasting

http://creams.iari.res.in http://creams.iari.res.in
Acknowledgements:
� ICAR - National Initiative of Climate Resilient Agriculture (NICRA) project
� CGIAR – Climate Change Agriculture and Food Security (CCAFS) programme