dss-14 subreflector actuator dynamics during the … · dss-14 subreflector actuator dynamics...
TRANSCRIPT
N93-29600
TDA Progress Report 42-113 May 15, 1993
/,
\
DSS-14 Subreflector Actuator Dynamics During
the Landers Earthquake
R. Levy and D. Strain
Ground Antennas and Facilities Engineering Sec6on
The June 28, 1992, Landers earthquake ground motion records at the Echo
site (DSS-12 antenna) were adjusted to provide a better match with spectra from
the measured Mars site (DSS-14 antenna) instrument tower response. A finite-
element model of the antenna structural system was analyzed for response to this
ground motion. Dynamic forces and displacements were computed in the locality of
components that had failed during the earthquake. Calculated forces in the range
of from 30,000 to 35,000 lb on failed Y-axis actuator U-joints were consistent with
laboratory load tests. The load capacity of these joints was found to be below
the range of from 34,000 to 42,000 lb. Dynamic amplification factors of from fi to
16 were computed for the quadripod apex accelerations with respect to the ground
accelerations. The largest amplification factor--25--was found at the outboard end
of the X-actuator.
I. Introduction
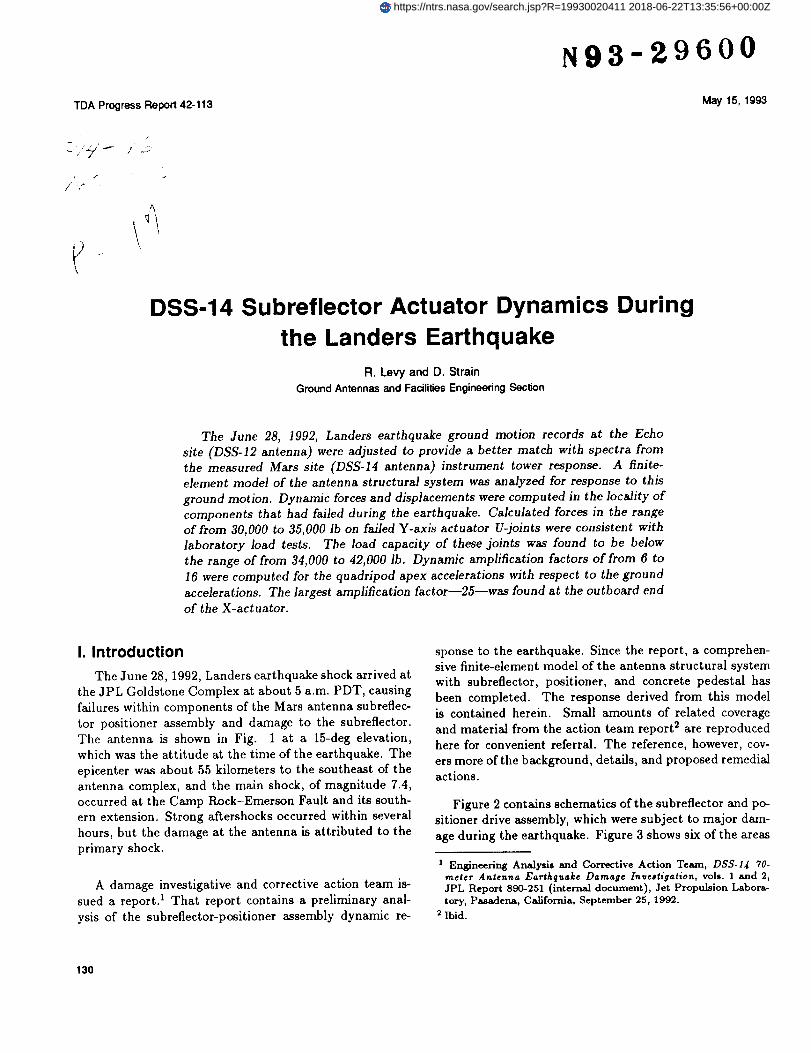
The June 28, 1992, Landers earthquake shock arrived at
the JPL Goldstone Complex at about 5 a.m. PDT, causing
failures within components of the Mars antenna subreflec-
tor positioner assembly and damage to the subreflector.
The antenna is shown in Fig. 1 at a 15-deg elevation,
which was the attitude at the time of the earthquake. The
epicenter was about 55 kilometers to the southeast of the
antenna complex, and the main shock, of magnitude 7.4,
occurred at the Camp Rock-Emerson Fault and its south-
ern extension. Strong aftershocks occurred within several
hours, but the damage at the antenna is attributed to the
primary shock.
A damage investigative and corrective action team is-
sued a report) That report contains a preliminary anal-
ysis of the subreflector-positioner assembly dynamic re-
sponse to the earthquake. Since the report, a comprehen-
sive finite-element model of the antenna structural system
with subreflector, positioner, and concrete pedestal has
been completed. The response derived from this model
is contained herein. Small amounts of related coverage
and material from the action team report 2 are reproduced
here for convenient referral. The reference, however, cov-
ers more of the background, details, and proposed remedial
actions.
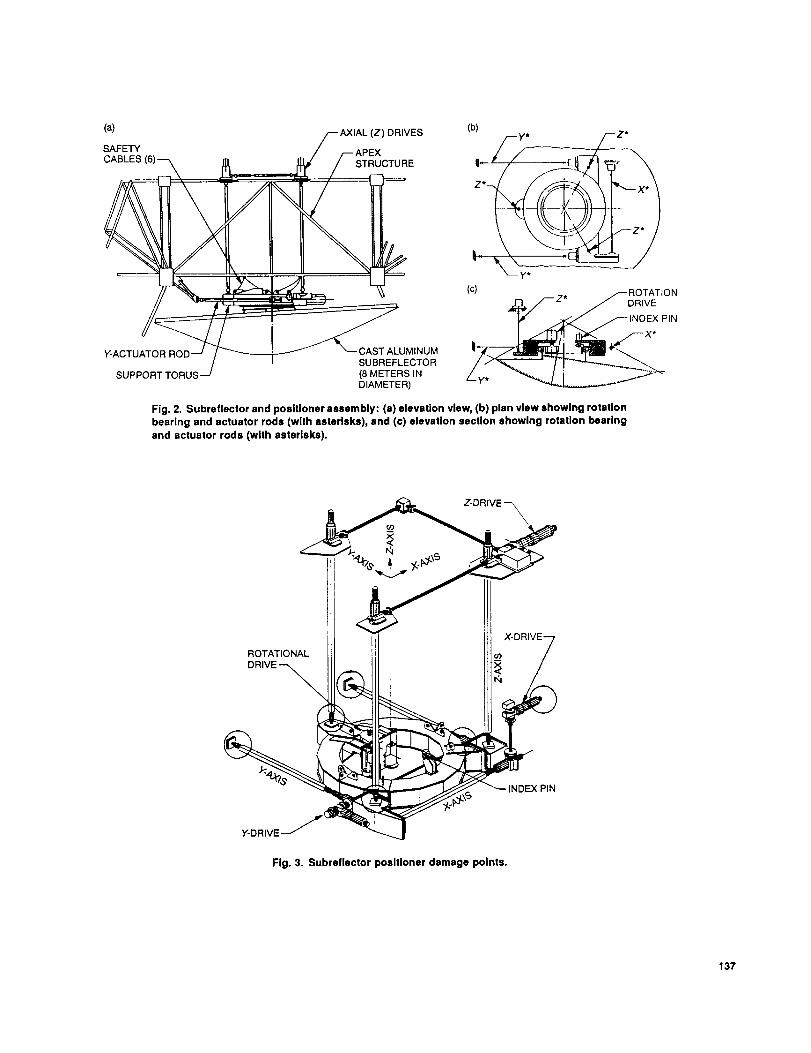
Figure 2 contains schematics of the subreflector and po-
sitioner drive assembly, which were subject to major dam-
age during the earthquake. Figure 3 shows six of the areas
z Engineering Analysis and Corrective Action Team, DSS-14 70-meter Antenna Earthquake Damage In_eatigation, vols. 1 and 2,JPL Report 890-251 (internal document), Jet Propulsion Labora-tory, Pasadena, California, September 25, 1992.
2 Ibid.
130
https://ntrs.nasa.gov/search.jsp?R=19930020411 2018-06-22T13:35:56+00:00Z
Z-axis actuator U-joints failed and have been circled in
the figure. Another circle has been placed at the X-axis
drive to indicate that the supporting bracket was bent.The X-axis actuator shaft was also bent, and four of the
six safety cables failed when the actuator failures allowed
the subreflector to drop. The axes denoted in these two
figures are local axes fixed on the antenna: the Z-axis is
the antenna-pointing axis, the X-axis is parallel to the el-
evation axis, and the Y-axis is vertical (positive upwards)when the antenna points to the horizon. At the 15-deg el-
evation angle, in effect at the time of the earthquake, the
Y-axis actuators support almost all of the static weight of
the positioner and the subreflector.
The subreflector impacted against a quadripod leg,
which caused some damage to the subreflector and the
leg. The subreflector was eventually wedged against the
quadripod leg and supported by one of the intact safetycables, and possibly by the remaining Z-axis actuator and
the damaged X-axis actuator. A failure scenario assem-
bled in the action team report 3 assigns the first failure
to the left side (as oriented in Fig. 3) Y-axis U-joint; the
next failure (attributed to effects of transference of gravity
loading and a rotation) was at a remaining Y-axis actua-
tor U-joint. Then, it was proposed, the top (Fig. 3) Z-axisactuator U-joint failed, and this was followed by the im-
pact of the falling torus on the X-actuator bracket. ARer
this, the scenario continues to explain further events andobservations of additional damage.
The original design called for identical Y- and Z-axis U-
joints and a lower capacity design for the X-axis U-joints.The four intact Z-axis U-joints, one Y-axis U-joint, and
both X-axis U-joints were returned to the laboratory forfailure load tests. The failure loads for the five Z- or Y-
axis U-joints were in the range of from 34,350 to 42,290 lbin tension, with a mean of 38,538 and standard deviation
of 3,320 lb. The catalog value of the tension-rated load
for these U-joints was 54,000 lb, and they were supposedly
capable of withstanding temporary loads of 150 percent of
the rated load. Therefore, it is evident that these U-joints
were substandard. One X-axis U-joint failed in tension at30,800 lb, and the other failed at 48,830 lb in compression.
The foregoing values are all based upon the U-joints thatsurvived the earthquake. Hence it could be concluded that
in the field, the U-joints failed from the earthquake at loadsless than those of the tests.
II. Ground Motion Time History Records
A California Institute of Technology Seismological Lab-
oratory instrumentation station provided three-axis ac-
a Ibid.
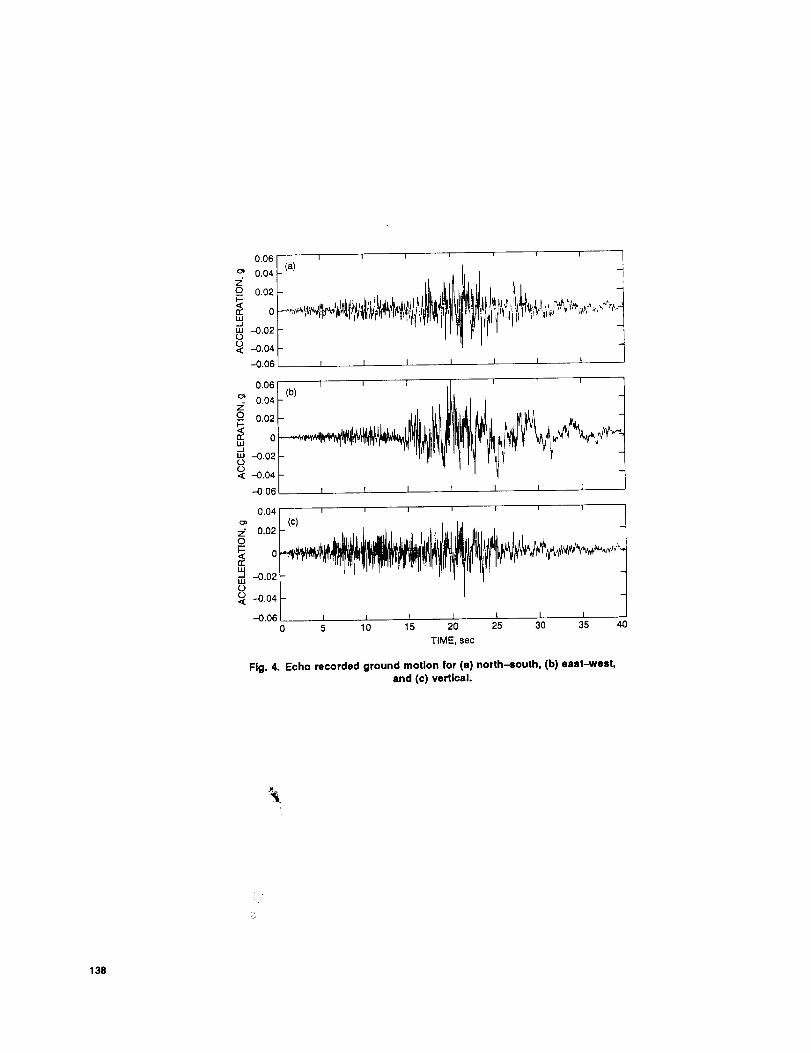
celerograph records of the ground motion in the north-south, east-west, and vertical directions at the Echo Site,which is about 6 kilometers to the south of the Mars an-
tenna. These records are plotted in Figs. 4(a), (b), and
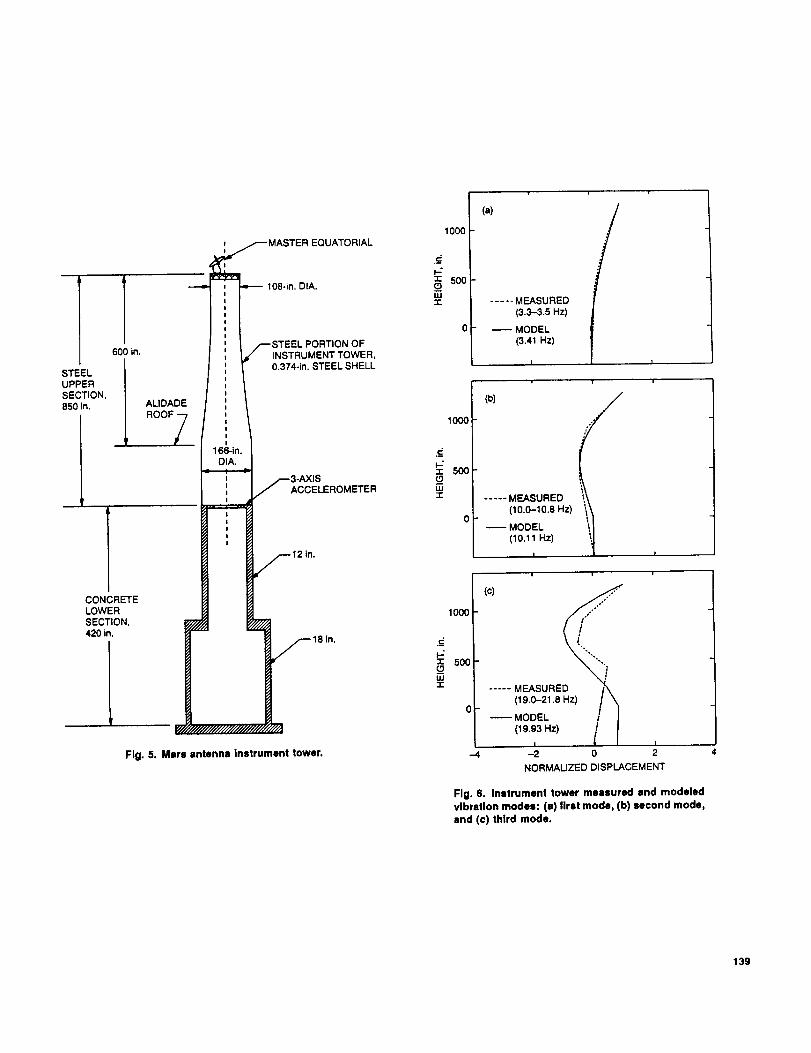
(c). Another set of tri-axial accelerograph records was also
obtained at an intermediate-level platform of the Mars an-tenna instrument tower, which is shown in Fig. 5. Recordsare available for 40-sec durations at both ]ocations and are
digitized at the rates of 100 per sec for the Echo site and
200 per sec for the Mars site.
The maximum accelerations recorded at Echo were 4.8
percent of gravity (0.048 g) for the north-south compo-nent, 0.058 g for the east-west component, and 0.041 g
for the vertical component. These are not large accelera-
tions in comparison with those of past damage-producing
earthquakes. However, the portions of the records show-
ing the strongest motion are of long enough duration tobe damaging.
The maximum accelerations recorded at the instrument
tower platform were 0.20 g in a "longitudinal" direction,
0.16 g in a "transverse" (lateral) direction, and 0.16 g inthe vertical direction. These records provide the responses
at the platform, which in fact represent some amplification
of the actual earthquake ground motion. Had the records
been available for the site ground motion, rather than forthe response to the ground motion, they would have served
as the input for the analytical dynamics investigation of
the earthquake response of the antenna.
III. Adjustments of Ground Motion Records
The Echo records would be an obvious choice for es-
timating the ground motion at the Mars antenna site,
provided that the 6 kilometers of intervening strata to
the Mars site were homogenous and not subject to dis-continuities in physical properties. To test this, an an-
alytical model of the instrument tower structure was as-sembled and subjected to the excitation defined by the
Echo records. The purpose was to compare the output of
the model derived at the platform level with the available
records of tower response to the earthquake.
The analytical model was developed from a prelimi-nary 12 degrees-of-freedom representation that was later
adjusted to improve the agreement with field modal tests
[1]. Since the tower appeared to be essentially symmetrical
with respect to any two orthogonal vertical planes, a single
two-dimensional mode/(height dimensions and horizontal
displacements) was estimated to be adequate for vibratory
motions parallel to the ground. The field testing programexcited and measured the tower vibrations in the longitu-
dinal and lateral directions. A separate one-dimensional
131
model (height dimensions and vertical displacements) wasdeveloped for vertical vibration modes, but it was not pos-sible to excite vertical mode vibrations in the field to check
or adjust this model. The lowest frequencies (more than
15 Hz) computed from the vertical vibration model ap-
pear to be much higher than typical important excitation
frequencies of earthquake ground motions.
Figure 6 contains comparisons of frequencies and mode
shapes for the first three vibration modes from measure-ment and from the adjusted model. The frequencies are
in agreement, as are the first two mode shapes. The thirdmode shapes differ, but this is not important because the
frequency is above the range of significant earthquake ex-citation. There is a small lack of symmetry in the as-built
tower with respect to the longitudinal and lateral direc-tions. Consequently, the measured frequencies are slightly
different for these two directions, and the tabulations in
the figure show the ranges.
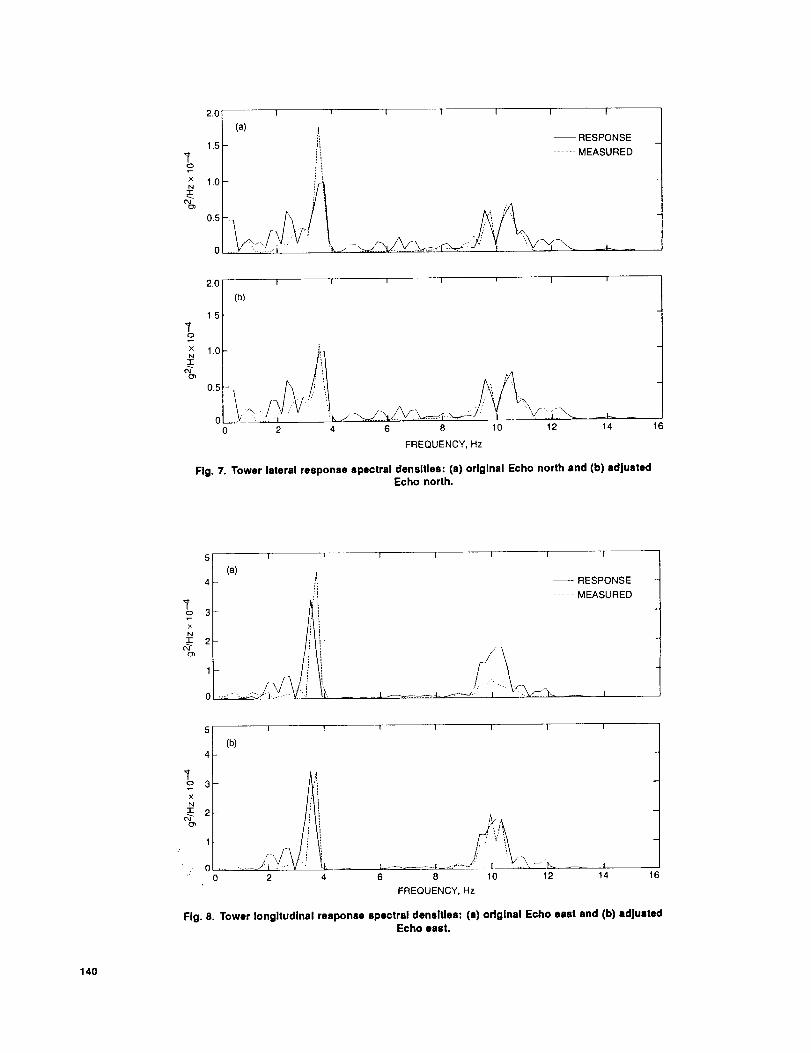
The recorded Echo north (north-south) and east (east-
west) acceleration records were integrated to provide theassociated ground displacements, which were then used
as input to the model. Differences in the power spectral
densities (PSD) of the computed acceleration responseswere evident at the 3.5- and 10-Hz first- and second-mode
natural frequencies when the spectral densities were com-
pared with the PSD obtained from the direct Mars-sitemeasurement records. The Echo acceleration records were
then adjusted to reduce these differences by supplementingthem with linear combinations of trim acceleration vectors.
The combining factors were determined by a nonlinear
least squares optimization to minimize the differences inthe 1-Hz to 12-Hz frequency range between the PSD com-
puted from the tower model and the PSD determined fromthe direct measurements. Figures 7(a) and 8(a) show thePSD curves obtained from the direct measurements and
the curves obtained by calculations that used the origi-
nal Echo ground motions as input. Figures 7(b) and 8(b)
show improved agreement of the measurements with thecalculations obtained by using the adjusted Echo records
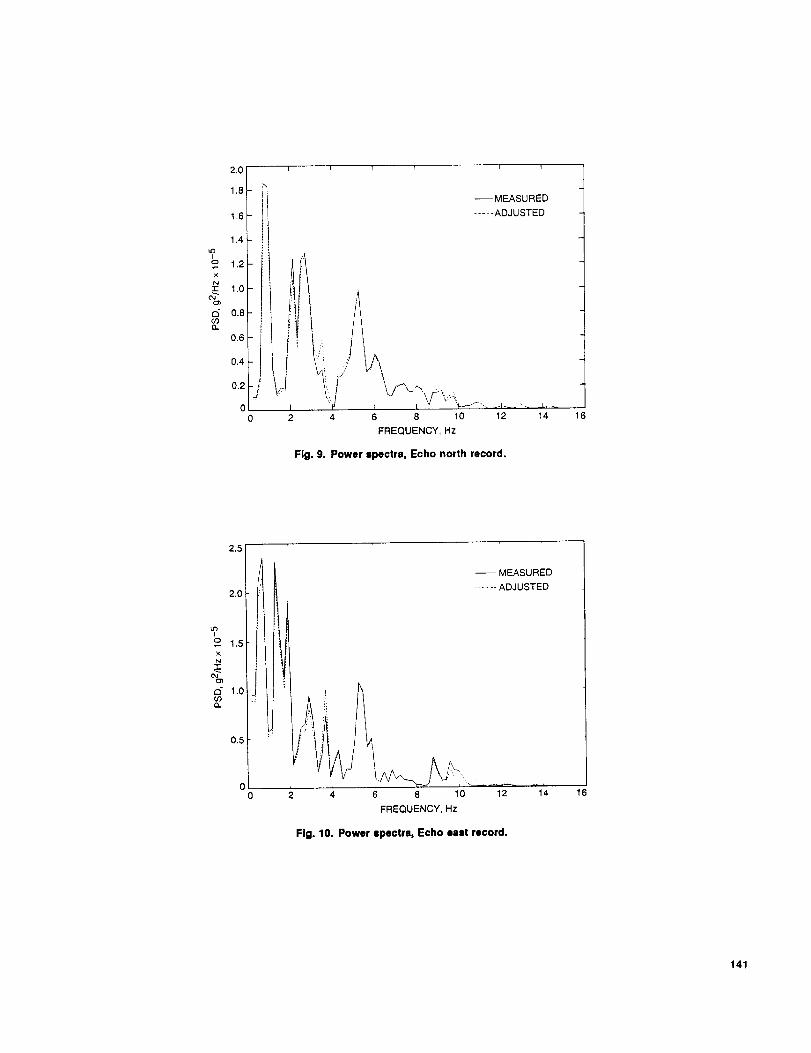
as inputs to the tower model. Figures 9 and 10 show the
power spectra for the original and adjusted Echo groundaccelerations. It can be seen that the adjustments pro-
vided only moderate changes to the original Echo data.
The assumptions made in processing all of the foregoing
data were (1) the ground motions could be assumed to
be approximately stationary during the 15-sec to 26-sec
time interval (11-sec) of the record, during which timeall the motion records were judged to be the most intense,
and (2) the effective damping ratio for the tower was 2 per-cent.
IV. Finite-Element Model
The finite-element method (FEM) design model forthe antenna-tipping structure was developed in the mid-
1980's. It contained 5500 degrees of freedom and rep-
resented one-half of the full structure. More recently,this model was extended to include the full structure,
and the original set of three translational degrees of free-dom at each node was supplemented by three more rota-
tional degrees of freedom. This model, which now contains38,000 degrees of freedom, runs on the NASTRAN struc-
tural analysis computer program and requires a Cray com-
puter to accommodate the problem size readily and to pro-vide a reasonable turnaround time. This model includes
a representation of the subreflector-positioner componentwith 2500 degrees of freedom and a concrete pedestal
component with an additional 11,000 degrees of freedom.
These latter two components were successfully incorpo-
rated within the primary structure model after the publi-cation of the action team report. 4
Figure 11 represents a side view of the complete an-tenna model at the 15-deg earthquake incidence eleva-tion. There are about 8000 nodes and 17,000 elements
(13,000 bar elements, 2000 plate elements, and 2000 solid
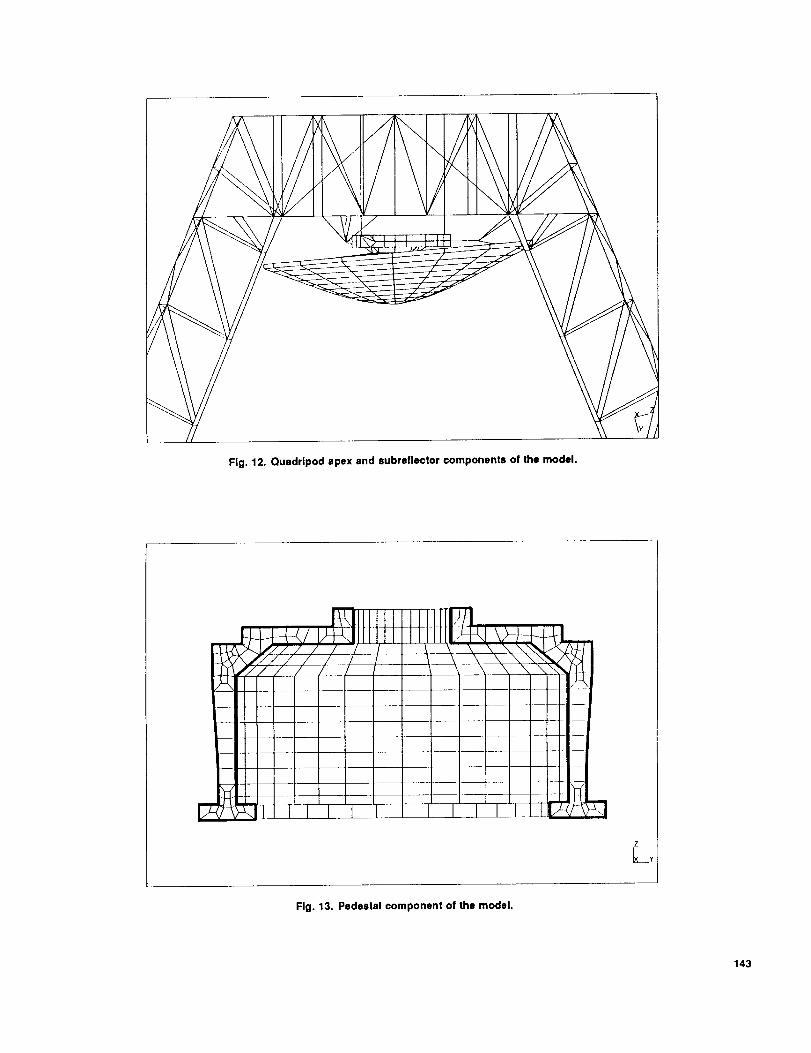
elements) in this model. Figure 12 shows a close-up of the
quadripod apex, subreflector-positioner, and subreflector
regions of the model. The tilt of the subreflector relativeto the apex is standard because of the tri-cone configu-
ration. Figure 13 shows a side-view cross-section of the
pedestal component model, which consists entirely of solidelements.
V. Dynamic Analysis
The finite-element model problem (38,000 degrees of
freedom) was processed by the NASTRAN structural anal-ysis program on the Cray computer. The NASTRAN pro-
cessing consisted only of solving the eigenvalue problemfor natural frequencies and mode shapes for the 40 lowest
modes. The NASTRAN output was post-processed by a
FORTRAN program written to compute the elastic-rigid
coupling matrix and effective modal weights according toalgorithms provided in [2]. Selected components of the
eigenvectors and modal forces in the actuator memberswere also extracted. All of the post-processed data were
written in ASCII files and transferred to a 386 PC, where
the dynamic response analysis to the earthquake was read-
ily developed.
Conventional modal superposition analysis was used to
generate response time histories of actuator forces and a
4 Ibid.
132
subset of displacements at nodes to which the actuatorswere connected. The physical system was described by the
generalized modal masses, elastic-rigid coupling matrices,and natural frequencies. The excitation to the system was
provided by the Echo three-axis ground acceleration timehistories as described above.
Two sets of ground motion time histories were pro-cessed; one set contained the original recorded Echo mo-
tions, and the other was the adjusted Echo motions. Themodel had been rotated about the elevation axis to the
15-deg elevation of the earthquake incident, so that thevertical earthquake records were applied along the modelZ-axis. The antenna azimuth at earthquake incidence was
67 deg clockwise from north. Therefore, to invoke a con-
sistent assumption, the Echo north-south and east-westdata were rotated about a vertical axis to be aligned with
the antenna model's north and east axes. Table 1 sum-
marizes the maximum and minimum ground accelerations
that were input to the models in the direction of the an-tenna axes after rotation.
VI. Computed Dynamic Actuator Forces
Three major assumptions in the computations were
(1) A power failure at the start of the earthquake causedan automatic application of the antenna brakes. The
dynamic effects on the structure were assumed to be
sufficiently attenuated at the time of the stronger
ground motions to be ignored in the analysis.
(2) The damping ratio for all modes was 1 percent. Thisis based upon preliminary field measurements, dur-
ing which the system was subjected to a sudden im-
position of the brakes.
(3) All components remained intact during the linear-response analysis. Consequently, this assumption
implies that the analysis can be meaningful only upto the time of the first component failure or yielding.
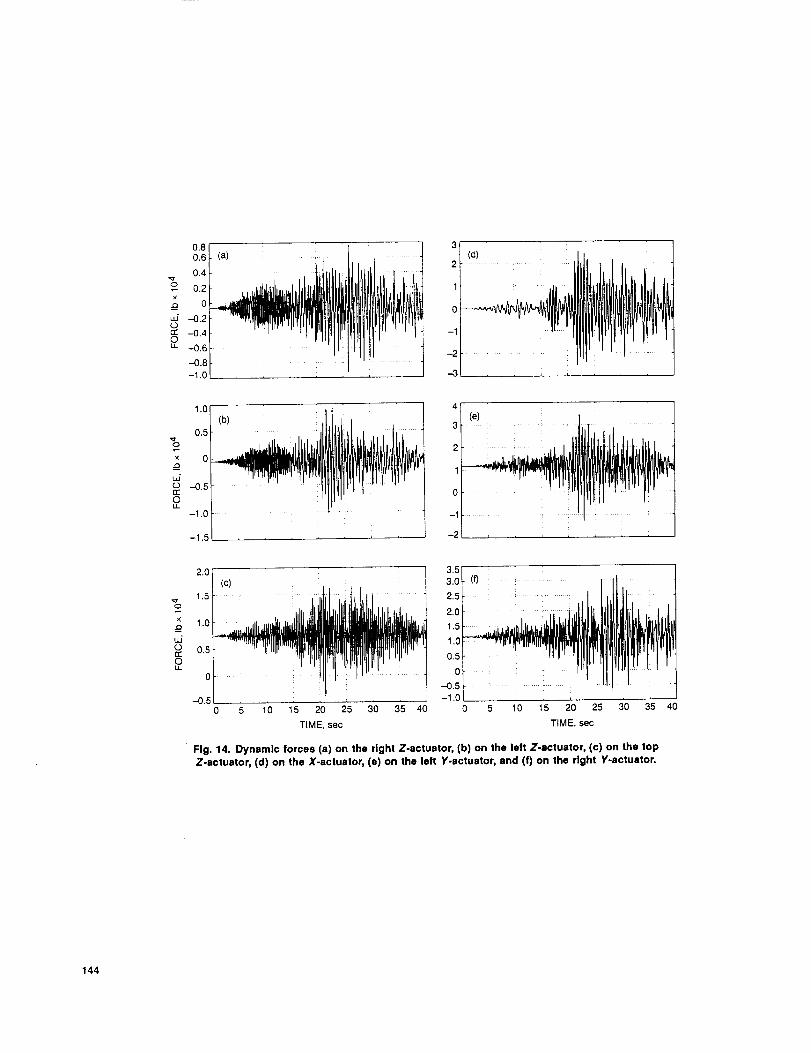
Figures 14 (a) through (f) show the dynamic force his-tories for the six actuators, based upon analysis of the full
model with the adjusted Echo ground motions as the in-
put excitations. The static weight loadings at the 15-deg
elevation of-670,-589, 7460, 0, 11,750, and 11,420 lb have
been included in the figure. Table 2 contains a summary ofcalculated dynamic forces based upon the conditions used
to develop Fig. 14 and also from several other cases.
VII. Computed Dynamic Displacements andAccelerations
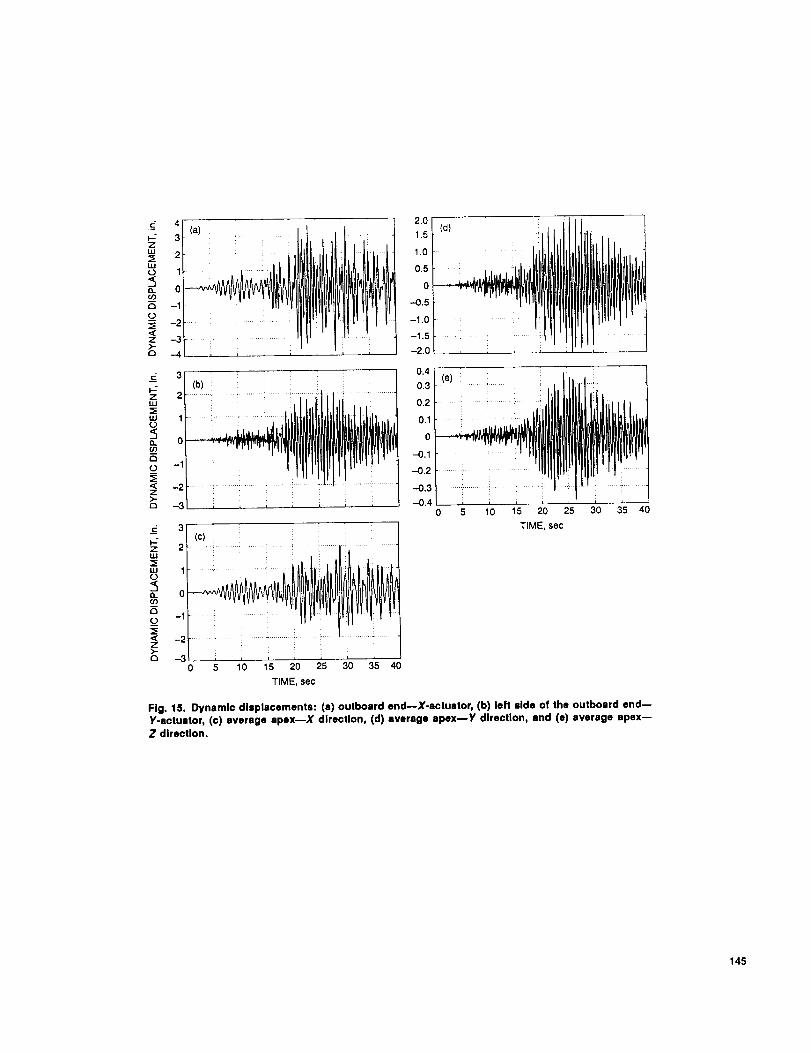
A few selected displacement time histories are shown in
Fig. 15. All of these are in relative coordinates with respect
to the ground motions. The total displacements are the
sum of the relative displacements and the ground motion
displacements. Although displacements in Figs. 15(a) and
(b) are at the outboard ends of the actuators, the displace-ments at the inboard ends differ by only small percentages.
The apex displacements in Figs. 15(c), (d), and (e) were
obtained by averaging the displacements for a pair of nodesto each side of the center of the apex. The peak displace-ments of the X-axis actuator are about 50 percent greater
than for the peak X-axis displacements of the apex. Thiscould be because there is only a single X-axis actuator,
which is supported by a relatively flexible bracket at itsinboard end. On the other hand, the Y-axis actuator dis-
placements are only slightly more than the apex Y-axis
displacements.
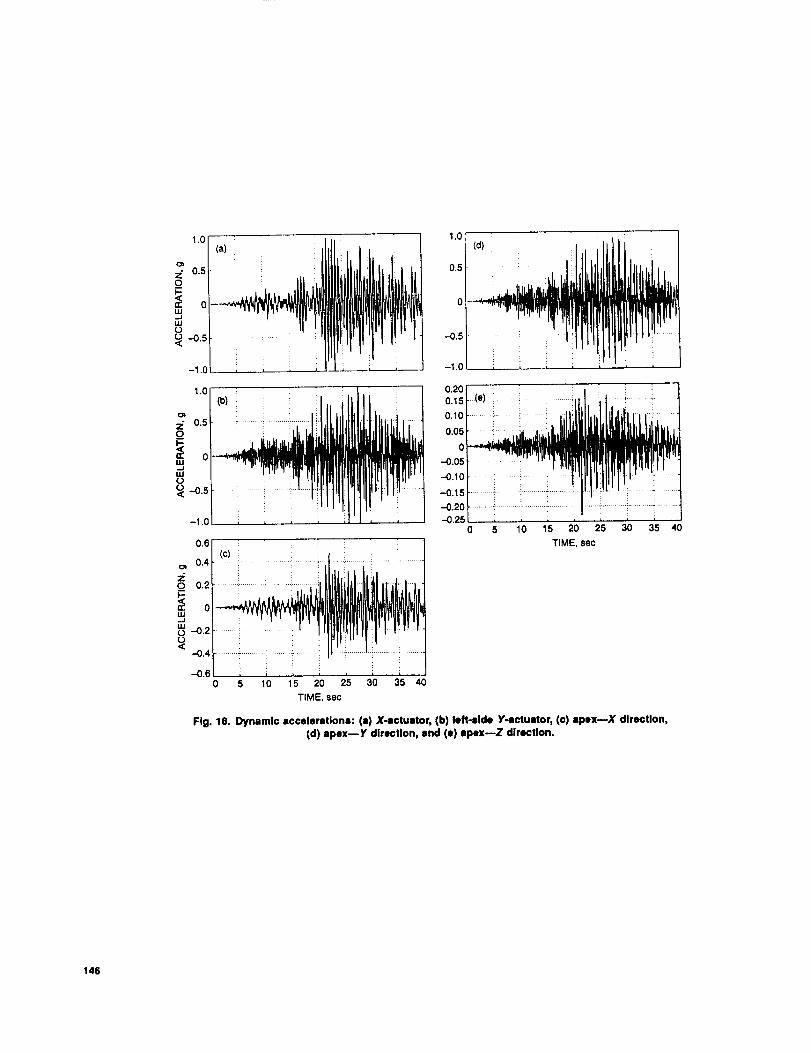
The accelerations corresponding to the above relative
displacements are shown in Fig. 16. To obtain the abso-lute accelerations, relative accelerations should be supple-
mented by adding the ground motion accelerations. Re-
ferring back to Table 1, it appears that the accelerationsof the X-axis actuator indicate an amplification factor of
about 25 with respect to the ground acceleration, and the
Y-axis actuator amplification factors are about 17. The
apex amplification factors are about 12, 16, and 6 in theX, Y, and Z directions, respectively.
VIII. Summary and Conclusions
The June 28 earthquake ground motion records at the
Echo site were adjusted to provide output power spectrathat were a close match to the power spectra of mea-sured Mars site instrument tower records at a distance of
6 kilometers. A comprehensive finite-element method an-
alytical model of the Mars antenna structural system was
subjected to the excitation of the adjusted Echo groundmotion. Dynamic analyses were completed to provide re-
sponse time histories of forces and displacements asso-
ciated with subreflector-positioner actuator components,some of which had failed during the earthquake.
The computed peak dynamic loads in the range of
30,000 to 35,000 lb for the two Y-axis actuators for which
the U-joints had failed during the earthquake are con-sistently lower than laboratory failure load tests on sur-
viving U-joints, which were in the range of 34,000 to
42,000 lb. The next largest forces from the analyses, ofabout 25,000 lb, were for the X-axis actuator. Neverthe-
less, this was still below the laboratory failure test toad
of 30,800 lb. Thus, it seems that the X-axis actuator
could have survived undamaged from the earthquake ex-
cept for the subsequent impact of the falling torus struc-ture. In particular, these calculated maximum dynamic
133
the U-joints had failed during the earthquake are con-
sistently lower than laboratory failure load tests on sur-viving U-joints, which were in the range of 34,000 to
42,000 lb. The next largest forces from the analyses, ofabout 25,000 lb, were for the X-axis actuator. Neverthe-
less, this was still below the laboratory failure test load
of 30,800 lb. Thus, it seems that the X-axis actuator
could have survived undamaged from the earthquake ex-
cept for the subsequent impact of the falling torus struc-
ture. In particular, these calculated maximum dynamicforces are consistent with the failure scenario of the ac-
tion team report. 5 All of the foregoing calculated resultsare sensitive to the structural damping. Here the damping
ratio was assumed to be 1 percent based upon a limited
amount of measured data.
Although the X-axis actuator could have survived the
earthquake, the analysis for the acceleration amplificationfactors shows that the X-axis actuator is excessively flex-
ible. The amplification factor for the X-axis actuator wasabout 25 times with respect to the input X-axis ground
acceleration. This was about twice the amplification factor
for the quadripod. The remaining Y- and Z-axis ampli-fication factors for the quadripod were about 16 and 6,
respectively. The Y-axis actuators, although deficient inload-carrying capacity, did not produce significantly differ-
ent acceleration amplification factors from the quadripod
apex.
The loads and displacement analyses here concentrated
on the actuators and U-joints of the subreflector posi-
tioner. A separate and lengthier study would be neededto examine the effects of this earthquake on the complete
structure. Nevertheless, it is possible that the examina-
tion here of the quadripod apex and subreflector positioner
components may have considered the most vulnerable re-
gions of the antenna. Future analysis of the seismic safetyof the antenna would, of course, require an evaluation of
the effects possible for a much broader range of seismic
excitations than the single event considered here.
Ibid.
Acknowledgments
JPL Engineering Analysis and Corrective Action (EACA) team members andcontributors who provided background and evaluations are acknowledged specifi-
cally in the action team report 6 and its distribution list. We also wish to specifi-
cally recognize California Institute of Technology staff members who participated
in the study--in particular, Professors J. Hall and W. Iwan for the suggestion thatthe Mars instrument tower response records be employed to particularize the site
ground motion; Professor G. Housner, who proposed that the Echo ground motioncould be used as a basis with supplemental adjustments to provide consistent tower
response spectra; and Senior Research Fellow E. Hauksson, who provided the Echo
ground motion records.
References
6Ibid.
[1] Experimental Modal Analysis of the DSS-14 Instrument Tower, Report R9227-6405, AGBABIAN Associates, Pasadena, California, September 8, 1992.
[2] R. Levy, "Computation of Vibration Mode Elastic-Rigid and Effective WeightCoefficients from Finite-Element Computer Program Output," The Telecom-
munications and Data Acquisition Progress Report 42-105, vol. January-March
1991, Jet Propulsion Laboratory, Pasadena, California, pp. 13-20, May 15, 1991.
134
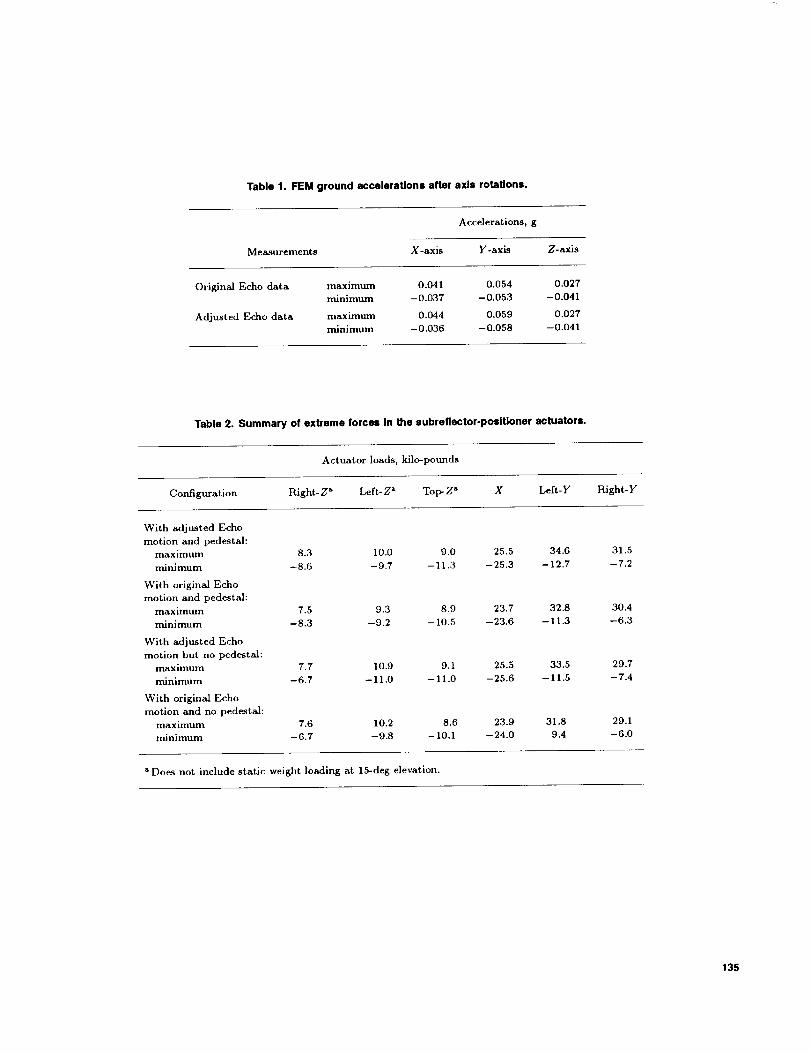
Table 1. FEM ground accelerations after axis rotations.
Accelerations, g
Measurements X-axis Y-axis Z-axis
Original Echo data maximum 0.041 0.054 0.027minimum - 0.037 - 0.053 - 0.041
Adjusted Echo data maximum 0.044 0.059 0.027
minimum -0.036 -0.058 -0.041
Table 2. Summary of extreme forces in the subreflector-positioner actuators.
Actuator loads, kilo-pounds
Configuration Right-Z a Left-Z a Top-Z _ X Left-Y Right-Y
With adjusted Echo
motion and pedestal:
maximum 8.3 10.0 9.0 25.5 34.6 31.5
minimum -8.6 -9.7 -11.3 -25.3 -12.7 -7.2
With original Echo
motion and pedestal:
maximum 7.5 9.3 8.9 23.7 32.8 30.4
minimum - 8.3 -9.2 -- 10.5 --23.6 - 11.3 --6.3
With adjusted Echo
motion but no pedestal:
maximum 7.7 10.9 9.1 25.5 33.5 29.7
minimum -6.7 --11.0 -11.0 -25.6 --11.5 -7.4
With original Echo
motion and no pedestal:
maximum 7.6 10.2 8.6 23.9 31.8 29.1
minimum --6.7 --9.8 -- 10.1 --24.0 9.4 --6.0
Does not include static weight loading at 15-deg elevation.
135
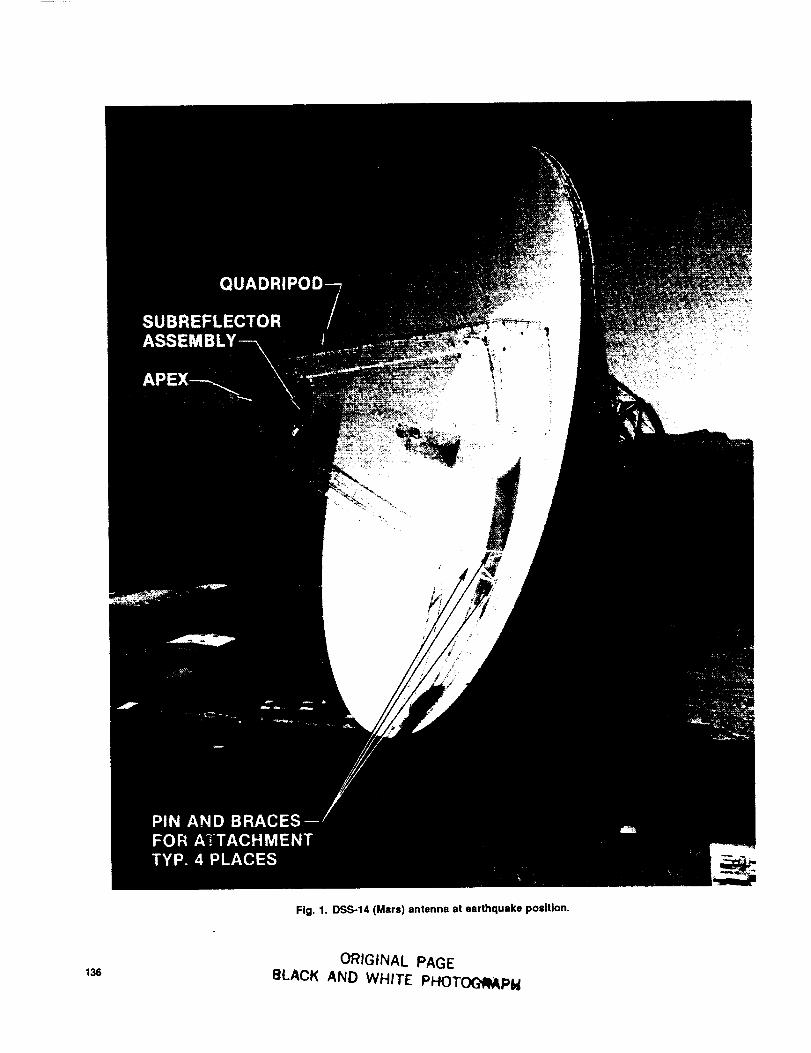
Fig.1.DSS-14(Mars)antennaat earthquake position.
136ORIGINAL PAGE
BLACK AND WHITE PHOT_PI4
SAFETy(a) F AXIAL (Z) DRIVES (b) _f--//_/ ,,--APEX E Q.. _C,.,,_-'_'_--_Z"
Z*_ X
Y-ACTUATOR /_ _ CAST ALUMINUM
suppoRTTORO=--/ ' l?_ll&Ic,_°RDIAMETER)
Z* /--ROTATION4_/- _DR,V=r ===
Fig. 2. Subreflector and posltloner assembly: (a) elevation view, (b) plan view showing rotation
bearing and actuator rods (with asterisks), and (c) elevation section showing rotation bearing
and actuator rods (with asterisks).
ROTATIONAL
)EX PIN
Y-DRIVE
Fig. 3. Subreflector posltloner damage points.
137
0.06
o,.0.04zo_ 0.02
o"' -0.02
_ -0,04
--0.06
0.06
c__ 0.04Z0 0.02
I,I_Jm -0,0200< -O.04
-0.06
0.04
Z 0.02o__ 0n"W_u -0.020
<0 -0.04
-0.06
i I I i i i I
(a) I
I I I I I I I
I I I I I I I
1 I I I I I I
I I I I I I I
I I I t I I t5 10 15 20 25 30 35
TIME, sec
4O
Fig. 4. Echo recorded ground motion for (a) north-south, (b) east-west,
and (c) vertical.
-,r
138
600in.
STEEL I
UPPER
SECTION,850 in. ALIDADE
CONCRETELOWER
SECTION,420 in.
,_._ MASTER EQUATORIAL
,,,."--- 108oin. DIA.
166-1nDIA.
_,I--II
!
-'7-!I
I!
FSTEEL PORTION OFINSTRUMENT TOWER,0.374-in. STEEL SHELL
3-AXISACCELEROMETER
Fig. 5. Mars antenna Instrument tower.
100o
r-
500LU"r"
1000
v.-"50O
W
-t-(._
UJ
1000
(a)
..... MEASURED
(3.3-3.5 Hz)
MODEL
(3.41 Hz)
!
v
(b)
..... MEASURED
(10.0-10.8 Hz)
MODEL
(10.11 Hz)
I
5OO
-4
i i i
(c)7 ''°
..... MEASURE_
-2 0 2
NORMALIZED DISPLACEMENT
Fig. 6. Instrument tower measured and modeled
vibration modes: (a) first mode, (b) second mode,
and (c) third mode.
139
,/o
x
%
x
N"i-
2.0
1.5
1.0
0.5
I I I I I
(a)_t
h
i'
''t--RESPONSE
...... MEASURED
2.0 I I I I I I I
(b)
1.5
1.0 _'
.. ,-.-.-" ......
0 2 4 6 8 10 12 14 16
FREQUENCY, Hz
Fig. 7. Tower lateral response spectral densities: (s) original Echo north and (b) adjustedEcho north.
o 3
x
2
5 I
(a)4
I 1 I I I I
-- RESPONSE
..... MEASURED
__ ,_-______-_.._._'_.._-..-_ __ ,
4
-fo 3
xN
-r 2
I I I I I 1 I
(b)
2 4 6 8 10 12
FREQUENCY, Hz
0 ;- I
"" 0 14 16
Fig. 8. Tower longltudlnal response spectral densltles: (s) original Echo east and (b) adjustedEcho east.
140
x
O9(3.
2.0
1.8
1.6
1.4
1.2
1.0
0.8i
0.6
0.4
0.2
0
i i I I I I I
-- MEASURED
..... ADJUSTED
I I2 4 6 8 10
FREQUENCY, Hz
Fig. 9. Power spectra, Echo north record.
12 14 16
2.5
2.0
_ 1'5 I
×
%o- 1.0t,,O .;.,.,,
0.5
0
-- MEASURED
...... ADJUSTED
2 4 6 8 10 12 14
FREQUENCY, Hz
Fig. 10. Power spectra, Echo east record.
16
141
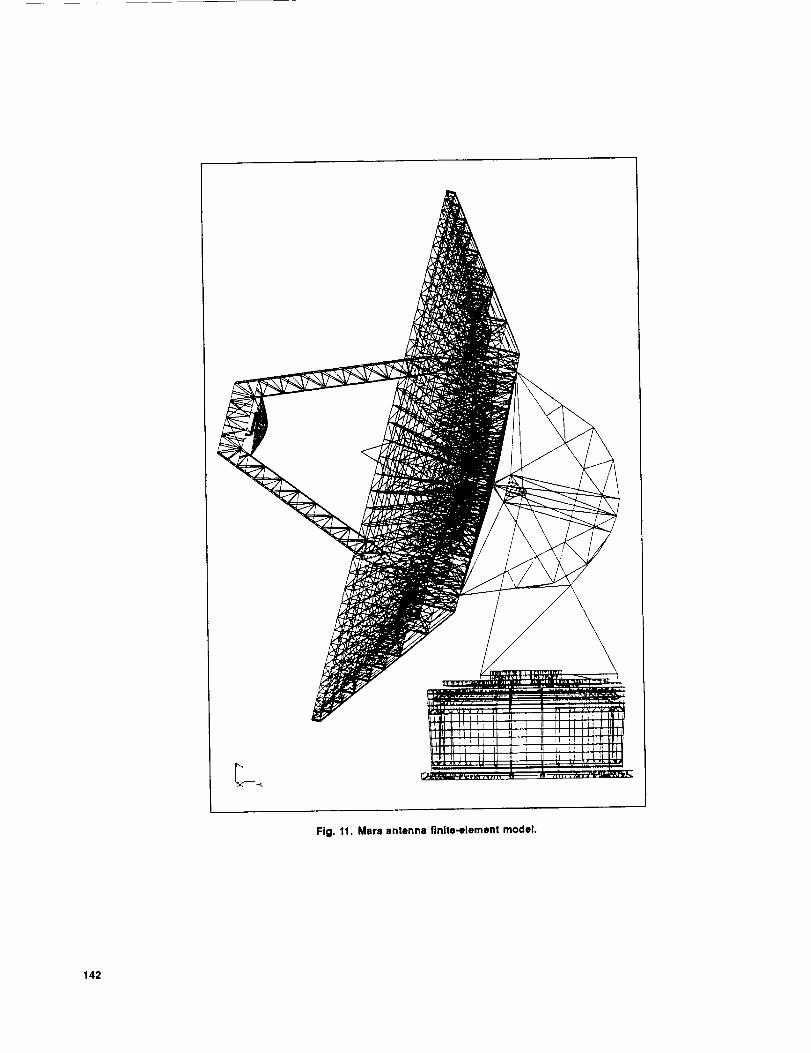
Fig.11.Mareantennafinite-elementmodel.
142
\
/
/// %
Fig. 12. Quadrlpod apex and eubreflector components of the model.
!
\
m
m
n
[_
fII
I
I
i
i I
_i i I I I i I I i I I LI_
Z
Flg. 13. Pedestal component of the model.
143
0.80.6
0.4
0.2×
0
uJ -0.2om -0.4o" -0.6
-0.8
-1.0
3 [ (d)
2
1.0
0.57,
x 0.Q
-0.5
ii-1.0
-1.5
7=×
&
©u..
(c)3,5 |
3.0_-(f) ........
2.5 ..... ; ....... ....
2,0 ..........1.5 .... .....
"'"'ltllJlfl - - i" I -
/
-0.5_1.0I................. :i ......
0 5 10 15 20 25
TIME, sec
5 10 15 20 25 30 35 40 30 35 40
TIME, sec
Fig. 14. Dynamic forces (a) on the right Z-actuator, (b) on the left Z-actuator, (c) on the top
Z-actuator, (d) on the X-actuator, (e) on the left Y-actuator, and (f) on the right Y-actuator.
144
(a)2.0
1.5 (d)
1.0
0.5
0
;15 20 25
TIME, sec
30 35 40
Fig. 15. Dynamic displacements: (a) outboard end--X-actuator, (b) left side of the outboard end--Y-actuator, (¢) average apex--X direction, (d) average spex--Y direction, and (e) average apex--Z direction.
145
10f1.o (a) (u)
_ 0.5
_ O- 0 •
-1.c -1 .o :, :, ;. :, i :, ,
0.20 ' :1.0
,_ o.lo.........i........:_........ _0.5
o 0.0F-
o -°ost "r lrlPlll-o._o[ -i ; : t
-o._ _o._5t _ ......_......
-1.0 , , , , -0.251 i , i ,0 5 10 15 20 25 30 35 40
0.6 ! _ TIME, sec(c)
zo 0.2
.J
_ --.0.2
_: -0.4 ...........-_..........................................
-0._0 5 10 1'5 20 15 30 35 40
TIME, sec
Fig. 16. Dynamic accelerations: (a) X-actuator, (b) left-side Y._©tuitor, (¢) apex--X direction,
(d) apex--Y direction, and (¢) =pex--Z direction.
146