driving and alternatives: older drivers in michigan
TRANSCRIPT
www.nsc.orgwww.elsevier.com/locate/jsr
Journal of Safety Research 34 (2003) 407–414
Driving and alternatives: Older drivers in Michigan
Lidia P. Kostyniuk*, Jean T. Shope
Transportation Research Institute, University of Michigan, 2901 Baxter Road, Ann Arbor, MI 48109-2150, USA
Abstract
Method: A statewide telephone survey of Michigan drivers and former drivers aged 65 and older collected information on transportation
mode choices, experience with alternatives to driving, and whether drivers planned for when they could no longer drive. Results: Results
showed that most older adult households owned at least one automobile, and that the automobile was the primary mode of transportation.
Most former drivers obtained rides from relatives and friends. Use of public transportation was low, and some seniors were not aware of
available public transportation services. Older drivers did not plan for driving cessation. Over half the drivers who perceived a likelihood of
driving problems within 5 years expected to keep driving beyond 5 years. Impact on industry: Because of their lifelong reliance on the
automobile, their desire to drive themselves, and their lack of experience with public transportation, efforts to enhance the mobility of older
people should consider this background while alternatives to the personal automobile are developed.
D 2003 National Safety Council and Elsevier Science Ltd. All rights reserved.
Keywords: Older drivers; Transportation mode choice; Mobility of older persons; Driving cessation
1. Introduction
As people age, physical changes associated with aging
and disease often affect perceptual, motor, and cognitive
abilities required for driving an automobile safely (Eby,
Trombley, Molnar, & Shope, 1998). Effects of these
changes are seen in crash rates based on vehicle miles
driven, which start increasing exponentially for drivers
around age 65 (Evans, 2000). Automobile-based transpor-
tation systems and land-use patterns in the United States,
however, have made Americans so dependent on the auto-
mobile that the ability to drive is often equated with
mobility, and perceived as necessary for maintaining inde-
pendence, autonomy, and self-esteem (Carp, 1988; Gonda,
1982; Eisenhandler, 1990). This presents a problem for
American society because the number of older drivers and
their proportion in the driving population are growing
(National Center for Statistics and Analysis, 2001) and will
continue to grow as the cohort of ‘‘baby boomers’’ ages
(Burkhardt & McGavock, 1999).
Many aging drivers continue to drive because they see no
other way of maintaining their mobility (Kostyniuk &
Shope, 1998). Unlike earlier cohorts of older people that
included many members never licensed to drive, and who
0022-4375/$ - see front matter D 2003 National Safety Council and Elsevier Sci
doi:10.1016/j.jsr.2003.09.001
* Corresponding author. Tel.: +1-734-764-2466; fax: +1-734-936-1076.
E-mail address: [email protected] (L.P. Kostyniuk).
relied on public transportation, the present cohort of older
drivers matured with the automobile and relies on it for
personal mobility. Because very few public transit options
provide the same mobility, convenience, and security that a
car provides, older individuals are reluctant to use public
transit and special paratransit services that may be offered in
their communities (Rosenbloom, 1988). Analysis of data
from the 1995 Nationwide Personal Transportation Survey
(Federal Highway Administration, 1997) shows that only
about 2.5% of all trips taken by Americans, aged 65 and
older, involved the use of public transit.
Many older people who no longer drive depend on
family and friends to provide transportation (Kostyniuk &
Shope, 1998). Although accepting rides as a passenger has
benefits such as personal contact to combat loneliness, this
option can exact a psychological price on the older pas-
senger. In a study of over 700 community-dwelling older
nondrivers, Carp (1972) found that older passengers iden-
tified several negative aspects of accepting rides: feelings
of indebtedness that became burdensome and demeaning
when reciprocation was impossible; schedules or routes of
drivers that did not meet their needs as passengers; and
nervousness about the driving skills of the people who gave
them rides.
Moving to a location or setting where driving is less
essential for meeting the basic necessities of life is one way
to address mobility problems. Although studies have exam-
ence Ltd. All rights reserved.
L.P. Kostyniuk, J.T. Shope / Journal of Safety Research 34 (2003) 407–414408
ined declining health as a factor in relocating one’s place of
residence (Colsher & Wallace, 1990; Litwak & Longino,
1988; Silverstein, 1995), no studies were found in which
driving was isolated and examined for its contribution to
such decisions. The ability to provide for one’s own
transportation, however, appears to be an implicit factor in
these decisions.
Transportation provides access to what is needed for
social and emotional well being as well as life’s necessities
(Carp, 1988). When access is not available to older people,
the resulting isolation and depression can be primary factors
in increased risk of disease and death (Kaplan, 1992, 1995).
As plans are made for transportation systems and services
for the older citizens of the future, several basic questions
should be answered. Do older drivers give any thought to
the time when they will be unable to drive and how they will
plan to meet their mobility needs? What can we learn that
might help older adults to plan? Knowledge about alter-
natives acceptable to older people is important for the
planning and marketing of transportation alternatives that
will be used by older people and that will help them to meet
their needs. Minimizing resource expenditures on systems
and services that will not be viable is essential.
Because of the wide variability in the aging process as
well as the various health conditions that can affect driving
abilities, there is no precise age at which a driver becomes
an ‘‘older driver.’’ However, examination of vehicle crash
data shows notable increases in vehicle crash rates and
mortality among drivers aged 55 to 70 (e.g., Evans,
2000). As noted earlier, one measure, crash rates based on
vehicle miles driven, starts increasing exponentially at about
age 65. Other measures, such as mortality rates per crash
and mortality rates per miles driven, start to increase at age
55. Most studies define older drivers as age 65 and older,
but some studies categorize drivers as ‘‘older’’ at age 55,
and others at age 70. This paper follows the more widely
accepted convention of considering drivers starting at age
65 as older.
This paper examines the mobility choices of drivers and
former drivers aged 65 and older in Michigan. Data are
from a multiyear research project on the reduction and
cessation of driving among older drivers conducted at the
University of Michigan Transportation Research Institute
(Kostyniuk, Shope, & Molnar, 2000, 2001), which included
a focus-group study of current and former older drivers as
well as adult children of older drivers, and a telephone
survey of 1,053 current and former older drivers from
Michigan. Specific questions explored in this paper are
the following:
� How much do older drivers and former drivers rely on
the private automobile?� What experience do older drivers and former drivers
have with public transportation?� Do older drivers plan for meeting their future mobility
needs if or when they might be unable to drive?
2. Methodology
A telephone survey about the experiences, behaviors, and
emotions associated with driving reduction and cessation
among people aged 65 and older in Michigan was developed.
The survey was preceded by a focus group study (Kostyniuk
& Shope, 1998) that identified issues faced by older drivers,
defined concepts, and identified dimensions to be studied.
These results were then used to develop the telephone
survey, quantitative findings from which could be general-
ized to the population of older drivers and former drivers in
Michigan. Only results concerned with transportation modes
used, experiences with alternatives to driving, and planning
for future mobility needs are reported in this paper.
Driver license records from the Michigan Department of
State were used to obtain a sample of subjects for the
survey. Names and addresses of people aged 65 and older
who were currently licensed to drive or whose driver’s
license had expired in the previous 2.5 years were obtained.
A random sample, stratified by the current or expired status
of the license, was then drawn. The selected sample was
proportional by urbanicity ( i.e., urban, suburban, or rural),
and by 5-year age increments. Letters were sent to potential
subjects explaining the purpose of the survey and inviting
them to participate when contacted by telephone.
Subjects were interviewed in May and June of 1999. The
interviews were conducted by professional interviewers
from a marketing research company using a computer-
assisted telephone interview (CATI) system. In all, 3,235
households were contacted. In 391 cases, the potential
respondents were not eligible to participate because they
were deceased, moved out of state, were in a hospital or
nursing home, or were unable to complete an interview
because of a physical or mental condition. A portion (1,777)
of potential respondents or their ‘‘gatekeepers’’ refused to
participate, and 1,067 agreed to be interviewed. In all, 1,053
telephone interviews were completed, a response rate of
37%. On average, interviews lasted 30 minutes. Upon
completion of an interview, a token payment of a $10 check
was sent to the respondent.
Weights were developed to account for nonresponse to
the survey and to expand the results to represent the total
population of Michigan citizens aged 65 and over who were
currently licensed to drive or whose drivers’ licenses had
expired in the last 2.5 years, and who were well enough to
respond to the survey.
3. Survey respondents
The average age of the 1,053 respondents was 74.2 years
with a standard deviation of 5.9 years. The oldest respon-
dent was 96 years old. Of all respondents, 58% were female,
60% were married, 55% had not gone beyond high school,
71% had an annual household income below $50,000, 95%
lived in their own home, 43% did volunteer work, and 12%
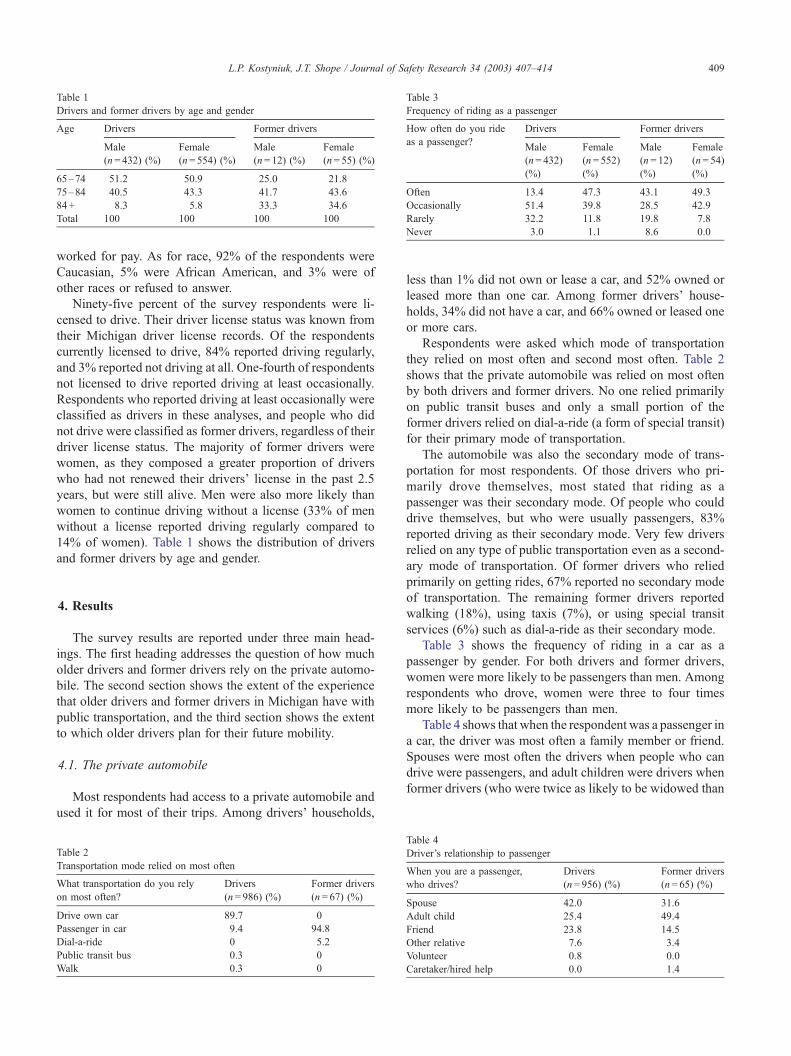
Table 1
Drivers and former drivers by age and gender
Age Drivers Former drivers
Male
(n= 432) (%)
Female
(n= 554) (%)
Male
(n= 12) (%)
Female
(n= 55) (%)
65–74 51.2 50.9 25.0 21.8
75–84 40.5 43.3 41.7 43.6
84 + 8.3 5.8 33.3 34.6
Total 100 100 100 100
Table 3
Frequency of riding as a passenger
How often do you ride Drivers Former drivers
as a passenger?Male
(n= 432)
(%)
Female
(n= 552)
(%)
Male
(n= 12)
(%)
Female
(n= 54)
(%)
Often 13.4 47.3 43.1 49.3
Occasionally 51.4 39.8 28.5 42.9
Rarely 32.2 11.8 19.8 7.8
Never 3.0 1.1 8.6 0.0
L.P. Kostyniuk, J.T. Shope / Journal of Safety Research 34 (2003) 407–414 409
worked for pay. As for race, 92% of the respondents were
Caucasian, 5% were African American, and 3% were of
other races or refused to answer.
Ninety-five percent of the survey respondents were li-
censed to drive. Their driver license status was known from
their Michigan driver license records. Of the respondents
currently licensed to drive, 84% reported driving regularly,
and 3% reported not driving at all. One-fourth of respondents
not licensed to drive reported driving at least occasionally.
Respondents who reported driving at least occasionally were
classified as drivers in these analyses, and people who did
not drive were classified as former drivers, regardless of their
driver license status. The majority of former drivers were
women, as they composed a greater proportion of drivers
who had not renewed their drivers’ license in the past 2.5
years, but were still alive. Men were also more likely than
women to continue driving without a license (33% of men
without a license reported driving regularly compared to
14% of women). Table 1 shows the distribution of drivers
and former drivers by age and gender.
4. Results
The survey results are reported under three main head-
ings. The first heading addresses the question of how much
older drivers and former drivers rely on the private automo-
bile. The second section shows the extent of the experience
that older drivers and former drivers in Michigan have with
public transportation, and the third section shows the extent
to which older drivers plan for their future mobility.
4.1. The private automobile
Most respondents had access to a private automobile and
used it for most of their trips. Among drivers’ households,
Table 2
Transportation mode relied on most often
What transportation do you rely
on most often?
Drivers
(n= 986) (%)
Former drivers
(n= 67) (%)
Drive own car 89.7 0
Passenger in car 9.4 94.8
Dial-a-ride 0 5.2
Public transit bus 0.3 0
Walk 0.3 0
less than 1% did not own or lease a car, and 52% owned or
leased more than one car. Among former drivers’ house-
holds, 34% did not have a car, and 66% owned or leased one
or more cars.
Respondents were asked which mode of transportation
they relied on most often and second most often. Table 2
shows that the private automobile was relied on most often
by both drivers and former drivers. No one relied primarily
on public transit buses and only a small portion of the
former drivers relied on dial-a-ride (a form of special transit)
for their primary mode of transportation.
The automobile was also the secondary mode of trans-
portation for most respondents. Of those drivers who pri-
marily drove themselves, most stated that riding as a
passenger was their secondary mode. Of people who could
drive themselves, but who were usually passengers, 83%
reported driving as their secondary mode. Very few drivers
relied on any type of public transportation even as a second-
ary mode of transportation. Of former drivers who relied
primarily on getting rides, 67% reported no secondary mode
of transportation. The remaining former drivers reported
walking (18%), using taxis (7%), or using special transit
services (6%) such as dial-a-ride as their secondary mode.
Table 3 shows the frequency of riding in a car as a
passenger by gender. For both drivers and former drivers,
women were more likely to be passengers than men. Among
respondents who drove, women were three to four times
more likely to be passengers than men.
Table 4 shows that when the respondent was a passenger in
a car, the driver was most often a family member or friend.
Spouses were most often the drivers when people who can
drive were passengers, and adult children were drivers when
former drivers (who were twice as likely to be widowed than
Table 4
Driver’s relationship to passenger
When you are a passenger,
who drives?
Drivers
(n= 956) (%)
Former drivers
(n= 65) (%)
Spouse 42.0 31.6
Adult child 25.4 49.4
Friend 23.8 14.5
Other relative 7.6 3.4
Volunteer 0.8 0.0
Caretaker/hired help 0.0 1.4
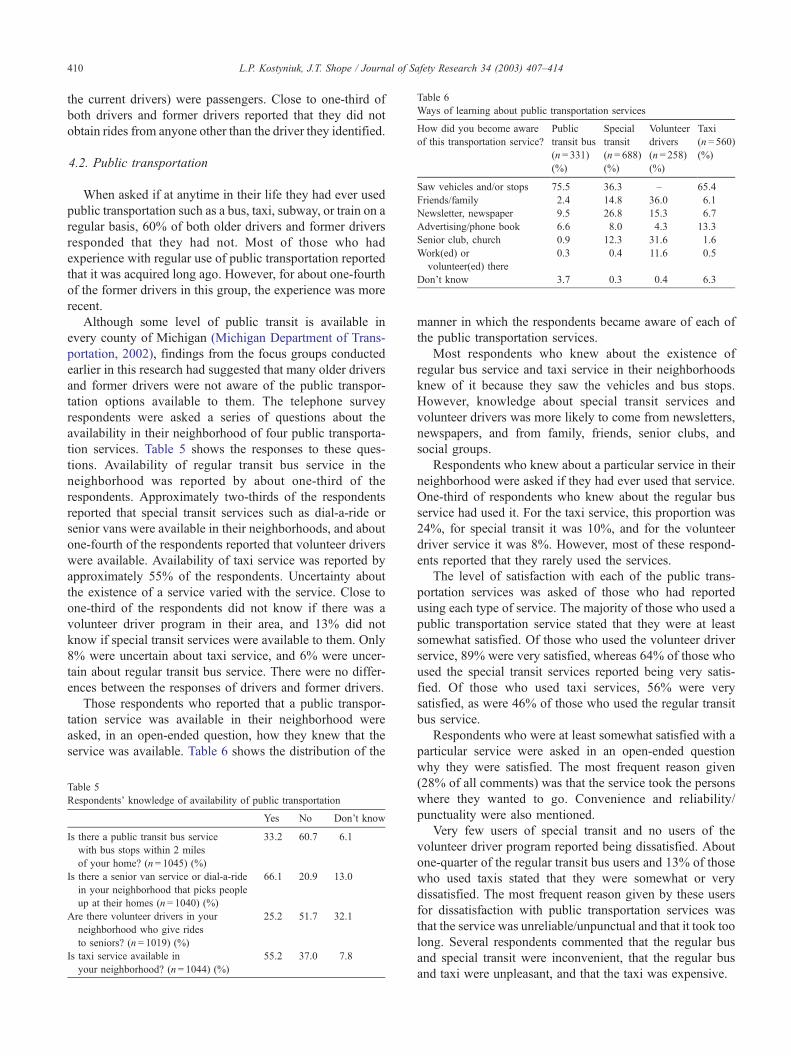
Table 6
Ways of learning about public transportation services
How did you become aware
of this transportation service?
Public
transit bus
(n= 331)
(%)
Special
transit
(n= 688)
(%)
Volunteer
drivers
(n= 258)
(%)
Taxi
(n= 560)
(%)
Saw vehicles and/or stops 75.5 36.3 – 65.4
Friends/family 2.4 14.8 36.0 6.1
Newsletter, newspaper 9.5 26.8 15.3 6.7
Advertising/phone book 6.6 8.0 4.3 13.3
Senior club, church 0.9 12.3 31.6 1.6
Work(ed) or
volunteer(ed) there
0.3 0.4 11.6 0.5
Don’t know 3.7 0.3 0.4 6.3
L.P. Kostyniuk, J.T. Shope / Journal of Safety Research 34 (2003) 407–414410
the current drivers) were passengers. Close to one-third of
both drivers and former drivers reported that they did not
obtain rides from anyone other than the driver they identified.
4.2. Public transportation
When asked if at anytime in their life they had ever used
public transportation such as a bus, taxi, subway, or train on a
regular basis, 60% of both older drivers and former drivers
responded that they had not. Most of those who had
experience with regular use of public transportation reported
that it was acquired long ago. However, for about one-fourth
of the former drivers in this group, the experience was more
recent.
Although some level of public transit is available in
every county of Michigan (Michigan Department of Trans-
portation, 2002), findings from the focus groups conducted
earlier in this research had suggested that many older drivers
and former drivers were not aware of the public transpor-
tation options available to them. The telephone survey
respondents were asked a series of questions about the
availability in their neighborhood of four public transporta-
tion services. Table 5 shows the responses to these ques-
tions. Availability of regular transit bus service in the
neighborhood was reported by about one-third of the
respondents. Approximately two-thirds of the respondents
reported that special transit services such as dial-a-ride or
senior vans were available in their neighborhoods, and about
one-fourth of the respondents reported that volunteer drivers
were available. Availability of taxi service was reported by
approximately 55% of the respondents. Uncertainty about
the existence of a service varied with the service. Close to
one-third of the respondents did not know if there was a
volunteer driver program in their area, and 13% did not
know if special transit services were available to them. Only
8% were uncertain about taxi service, and 6% were uncer-
tain about regular transit bus service. There were no differ-
ences between the responses of drivers and former drivers.
Those respondents who reported that a public transpor-
tation service was available in their neighborhood were
asked, in an open-ended question, how they knew that the
service was available. Table 6 shows the distribution of the
Table 5
Respondents’ knowledge of availability of public transportation
Yes No Don’t know
Is there a public transit bus service
with bus stops within 2 miles
of your home? (n= 1045) (%)
33.2 60.7 6.1
Is there a senior van service or dial-a-ride
in your neighborhood that picks people
up at their homes (n= 1040) (%)
66.1 20.9 13.0
Are there volunteer drivers in your
neighborhood who give rides
to seniors? (n= 1019) (%)
25.2 51.7 32.1
Is taxi service available in
your neighborhood? (n= 1044) (%)
55.2 37.0 7.8
manner in which the respondents became aware of each of
the public transportation services.
Most respondents who knew about the existence of
regular bus service and taxi service in their neighborhoods
knew of it because they saw the vehicles and bus stops.
However, knowledge about special transit services and
volunteer drivers was more likely to come from newsletters,
newspapers, and from family, friends, senior clubs, and
social groups.
Respondents who knew about a particular service in their
neighborhood were asked if they had ever used that service.
One-third of respondents who knew about the regular bus
service had used it. For the taxi service, this proportion was
24%, for special transit it was 10%, and for the volunteer
driver service it was 8%. However, most of these respond-
ents reported that they rarely used the services.
The level of satisfaction with each of the public trans-
portation services was asked of those who had reported
using each type of service. The majority of those who used a
public transportation service stated that they were at least
somewhat satisfied. Of those who used the volunteer driver
service, 89% were very satisfied, whereas 64% of those who
used the special transit services reported being very satis-
fied. Of those who used taxi services, 56% were very
satisfied, as were 46% of those who used the regular transit
bus service.
Respondents who were at least somewhat satisfied with a
particular service were asked in an open-ended question
why they were satisfied. The most frequent reason given
(28% of all comments) was that the service took the persons
where they wanted to go. Convenience and reliability/
punctuality were also mentioned.
Very few users of special transit and no users of the
volunteer driver program reported being dissatisfied. About
one-quarter of the regular transit bus users and 13% of those
who used taxis stated that they were somewhat or very
dissatisfied. The most frequent reason given by these users
for dissatisfaction with public transportation services was
that the service was unreliable/unpunctual and that it took too
long. Several respondents commented that the regular bus
and special transit were inconvenient, that the regular bus
and taxi were unpleasant, and that the taxi was expensive.
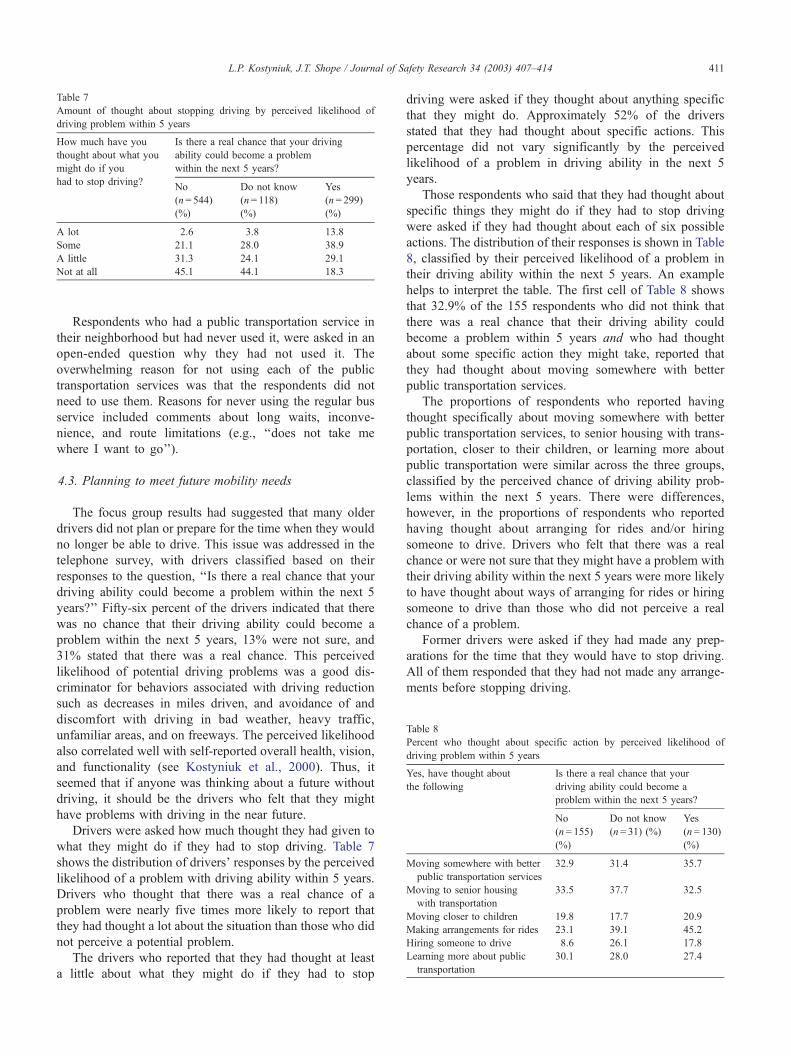
Table 7
Amount of thought about stopping driving by perceived likelihood of
driving problem within 5 years
How much have you
thought about what you
might do if you
Is there a real chance that your driving
ability could become a problem
within the next 5 years?
had to stop driving?No
(n= 544)
(%)
Do not know
(n= 118)
(%)
Yes
(n= 299)
(%)
A lot 2.6 3.8 13.8
Some 21.1 28.0 38.9
A little 31.3 24.1 29.1
Not at all 45.1 44.1 18.3
Table 8
Percent who thought about specific action by perceived likelihood of
driving problem within 5 years
Yes, have thought about
the following
Is there a real chance that your
driving ability could become a
problem within the next 5 years?
No
(n= 155)
(%)
Do not know
(n= 31) (%)
Yes
(n= 130)
(%)
Moving somewhere with better
public transportation services
32.9 31.4 35.7
Moving to senior housing
with transportation
33.5 37.7 32.5
Moving closer to children 19.8 17.7 20.9
Making arrangements for rides 23.1 39.1 45.2
Hiring someone to drive 8.6 26.1 17.8
Learning more about public
transportation
30.1 28.0 27.4
L.P. Kostyniuk, J.T. Shope / Journal of Safety Research 34 (2003) 407–414 411
Respondents who had a public transportation service in
their neighborhood but had never used it, were asked in an
open-ended question why they had not used it. The
overwhelming reason for not using each of the public
transportation services was that the respondents did not
need to use them. Reasons for never using the regular bus
service included comments about long waits, inconve-
nience, and route limitations (e.g., ‘‘does not take me
where I want to go’’).
4.3. Planning to meet future mobility needs
The focus group results had suggested that many older
drivers did not plan or prepare for the time when they would
no longer be able to drive. This issue was addressed in the
telephone survey, with drivers classified based on their
responses to the question, ‘‘Is there a real chance that your
driving ability could become a problem within the next 5
years?’’ Fifty-six percent of the drivers indicated that there
was no chance that their driving ability could become a
problem within the next 5 years, 13% were not sure, and
31% stated that there was a real chance. This perceived
likelihood of potential driving problems was a good dis-
criminator for behaviors associated with driving reduction
such as decreases in miles driven, and avoidance of and
discomfort with driving in bad weather, heavy traffic,
unfamiliar areas, and on freeways. The perceived likelihood
also correlated well with self-reported overall health, vision,
and functionality (see Kostyniuk et al., 2000). Thus, it
seemed that if anyone was thinking about a future without
driving, it should be the drivers who felt that they might
have problems with driving in the near future.
Drivers were asked how much thought they had given to
what they might do if they had to stop driving. Table 7
shows the distribution of drivers’ responses by the perceived
likelihood of a problem with driving ability within 5 years.
Drivers who thought that there was a real chance of a
problem were nearly five times more likely to report that
they had thought a lot about the situation than those who did
not perceive a potential problem.
The drivers who reported that they had thought at least
a little about what they might do if they had to stop
driving were asked if they thought about anything specific
that they might do. Approximately 52% of the drivers
stated that they had thought about specific actions. This
percentage did not vary significantly by the perceived
likelihood of a problem in driving ability in the next 5
years.
Those respondents who said that they had thought about
specific things they might do if they had to stop driving
were asked if they had thought about each of six possible
actions. The distribution of their responses is shown in Table
8, classified by their perceived likelihood of a problem in
their driving ability within the next 5 years. An example
helps to interpret the table. The first cell of Table 8 shows
that 32.9% of the 155 respondents who did not think that
there was a real chance that their driving ability could
become a problem within 5 years and who had thought
about some specific action they might take, reported that
they had thought about moving somewhere with better
public transportation services.
The proportions of respondents who reported having
thought specifically about moving somewhere with better
public transportation services, to senior housing with trans-
portation, closer to their children, or learning more about
public transportation were similar across the three groups,
classified by the perceived chance of driving ability prob-
lems within the next 5 years. There were differences,
however, in the proportions of respondents who reported
having thought about arranging for rides and/or hiring
someone to drive. Drivers who felt that there was a real
chance or were not sure that they might have a problem with
their driving ability within the next 5 years were more likely
to have thought about ways of arranging for rides or hiring
someone to drive than those who did not perceive a real
chance of a problem.
Former drivers were asked if they had made any prep-
arations for the time that they would have to stop driving.
All of them responded that they had not made any arrange-
ments before stopping driving.
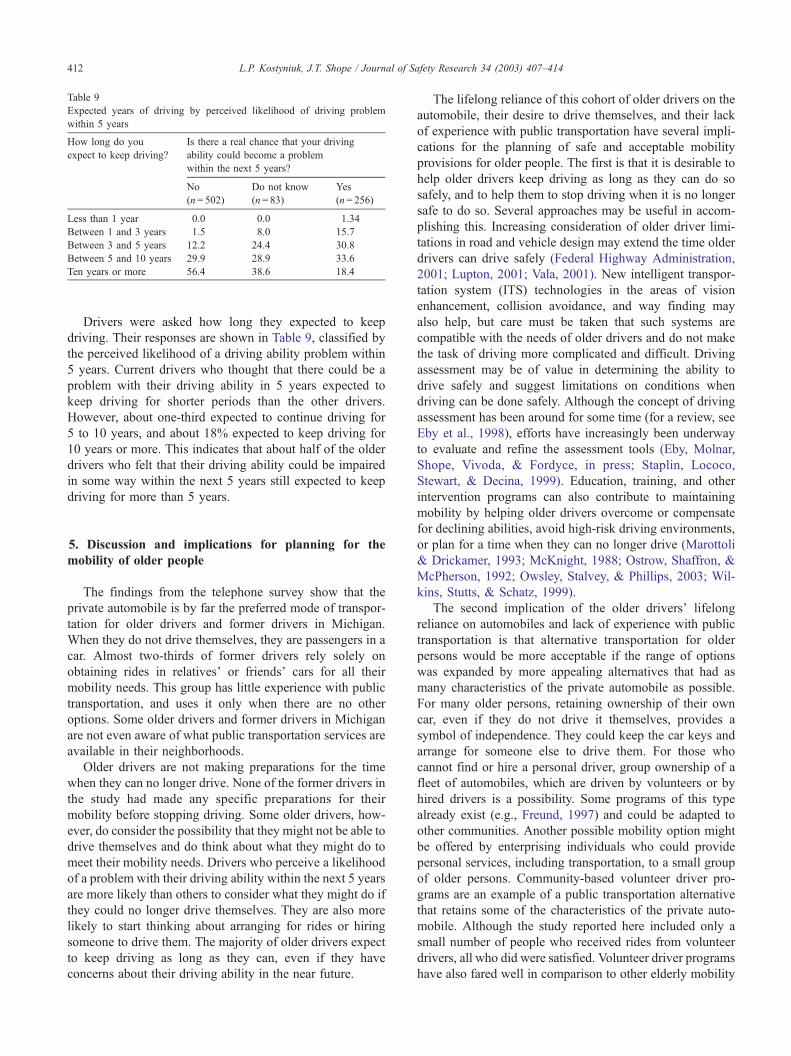
Table 9
Expected years of driving by perceived likelihood of driving problem
within 5 years
How long do you
expect to keep driving?
Is there a real chance that your driving
ability could become a problem
within the next 5 years?
No
(n= 502)
Do not know
(n= 83)
Yes
(n= 256)
Less than 1 year 0.0 0.0 1.34
Between 1 and 3 years 1.5 8.0 15.7
Between 3 and 5 years 12.2 24.4 30.8
Between 5 and 10 years 29.9 28.9 33.6
Ten years or more 56.4 38.6 18.4
L.P. Kostyniuk, J.T. Shope / Journal of Safety Research 34 (2003) 407–414412
Drivers were asked how long they expected to keep
driving. Their responses are shown in Table 9, classified by
the perceived likelihood of a driving ability problem within
5 years. Current drivers who thought that there could be a
problem with their driving ability in 5 years expected to
keep driving for shorter periods than the other drivers.
However, about one-third expected to continue driving for
5 to 10 years, and about 18% expected to keep driving for
10 years or more. This indicates that about half of the older
drivers who felt that their driving ability could be impaired
in some way within the next 5 years still expected to keep
driving for more than 5 years.
5. Discussion and implications for planning for the
mobility of older people
The findings from the telephone survey show that the
private automobile is by far the preferred mode of transpor-
tation for older drivers and former drivers in Michigan.
When they do not drive themselves, they are passengers in a
car. Almost two-thirds of former drivers rely solely on
obtaining rides in relatives’ or friends’ cars for all their
mobility needs. This group has little experience with public
transportation, and uses it only when there are no other
options. Some older drivers and former drivers in Michigan
are not even aware of what public transportation services are
available in their neighborhoods.
Older drivers are not making preparations for the time
when they can no longer drive. None of the former drivers in
the study had made any specific preparations for their
mobility before stopping driving. Some older drivers, how-
ever, do consider the possibility that they might not be able to
drive themselves and do think about what they might do to
meet their mobility needs. Drivers who perceive a likelihood
of a problem with their driving ability within the next 5 years
are more likely than others to consider what they might do if
they could no longer drive themselves. They are also more
likely to start thinking about arranging for rides or hiring
someone to drive them. The majority of older drivers expect
to keep driving as long as they can, even if they have
concerns about their driving ability in the near future.
The lifelong reliance of this cohort of older drivers on the
automobile, their desire to drive themselves, and their lack
of experience with public transportation have several impli-
cations for the planning of safe and acceptable mobility
provisions for older people. The first is that it is desirable to
help older drivers keep driving as long as they can do so
safely, and to help them to stop driving when it is no longer
safe to do so. Several approaches may be useful in accom-
plishing this. Increasing consideration of older driver limi-
tations in road and vehicle design may extend the time older
drivers can drive safely (Federal Highway Administration,
2001; Lupton, 2001; Vala, 2001). New intelligent transpor-
tation system (ITS) technologies in the areas of vision
enhancement, collision avoidance, and way finding may
also help, but care must be taken that such systems are
compatible with the needs of older drivers and do not make
the task of driving more complicated and difficult. Driving
assessment may be of value in determining the ability to
drive safely and suggest limitations on conditions when
driving can be done safely. Although the concept of driving
assessment has been around for some time (for a review, see
Eby et al., 1998), efforts have increasingly been underway
to evaluate and refine the assessment tools (Eby, Molnar,
Shope, Vivoda, & Fordyce, in press; Staplin, Lococo,
Stewart, & Decina, 1999). Education, training, and other
intervention programs can also contribute to maintaining
mobility by helping older drivers overcome or compensate
for declining abilities, avoid high-risk driving environments,
or plan for a time when they can no longer drive (Marottoli
& Drickamer, 1993; McKnight, 1988; Ostrow, Shaffron, &
McPherson, 1992; Owsley, Stalvey, & Phillips, 2003; Wil-
kins, Stutts, & Schatz, 1999).
The second implication of the older drivers’ lifelong
reliance on automobiles and lack of experience with public
transportation is that alternative transportation for older
persons would be more acceptable if the range of options
was expanded by more appealing alternatives that had as
many characteristics of the private automobile as possible.
For many older persons, retaining ownership of their own
car, even if they do not drive it themselves, provides a
symbol of independence. They could keep the car keys and
arrange for someone else to drive them. For those who
cannot find or hire a personal driver, group ownership of a
fleet of automobiles, which are driven by volunteers or by
hired drivers is a possibility. Some programs of this type
already exist (e.g., Freund, 1997) and could be adapted to
other communities. Another possible mobility option might
be offered by enterprising individuals who could provide
personal services, including transportation, to a small group
of older persons. Community-based volunteer driver pro-
grams are an example of a public transportation alternative
that retains some of the characteristics of the private auto-
mobile. Although the study reported here included only a
small number of people who received rides from volunteer
drivers, all who did were satisfied. Volunteer driver programs
have also fared well in comparison to other elderly mobility
L.P. Kostyniuk, J.T. Shope / Journal of Safety Research 34 (2003) 407–414 413
programs. In a nationwide examination of community-based
transportation programs for the elderly (Beverly Foundation,
2002) five volunteer driver programs were selected among
the top 11 ‘‘senior-friendly’’ programs. Other combinations
of vehicle ownership using volunteers or drivers might also
be acceptable. There may be logistic and legal issues with
some of these approaches that need to be addressed. How-
ever, they do not appear to be insurmountable barriers to the
implementation of badly needed innovative alternatives.
In planning transportation options and services to meet
the mobility needs of the elderly in the near future, it is
important to recognize the value placed on transportation.
Transportation enables older persons to maintain the social
support systems needed for good quality of life and reduces
the risk of premature morbidity and mortality by decreasing
isolation and depression. It should also be recognized that
personal control in deciding where and when to go is very
important to older persons (Kostyniuk & Shope, 1998;
Marottoli et al., 1997). There will always be a place for
special public transit services similar to those in place now
for some portion of the elderly population. However, there is
a growing critical need for more desirable options that
provide mobility for older people while allowing them to
retain as much independence as possible.
Acknowledgements
This work was sponsored by the Great Lakes Center
for Truck and Transit Research and by the General
Motors Corporation pursuant to an agreement between the
General Motors Corporation and the U.S. Department of
Transportation.
References
Beverly Foundation. (2002). Supplemental transportation programs for
seniors. Washington, DC: AAA Foundation for Traffic Safety.
Burkhardt, J. E., & McGavock, A. T. (1999). Tomorrow’s older drivers,
Who? How many? What impacts? Transportation Research Record,
1693, 62–70.
Carp, F. M. (1972). Retired people as automobile passengers. Gerontolo-
gist, 12, 73–78.
Carp, F. M. (1988). Significance of mobility for the well-being of the elderly
(TRB Special Rep. 218). Transportation in an aging society: Improving
mobility and safety for older persons, vol. 2 (pp. 1–20). Washington,
DC: National Research Council.
Colsher, P. L., & Wallace, R. B. (1990). Health and social antecedents of
relocation in rural elderly persons. Journal of Gerontology, 45, S32–S38.
Eby, D. W., Molnar, L. J., Shope, J. T., Vivoda, J. M., & Fordyce, T. A.
(2003). Improving older driver knowledge and self-awareness through
self-assessment: The driving decisions workbook. Journal of Safety
Research, 34(4). (doi: 0.1016/j.jsr.2003.09.006)
Eby, D. W., Trombley, D., Molnar, L. J., & Shope, J. T. (1998). The assess-
ment of older driver’s capabilities: A review of the literature (Rep. No.
UMTRI-98-24). Ann Arbor, MI: University of Michigan Transportation
Research Institute.
Eisenhandler, S. A. (1990). The asphalt identikit: Old age and the driver’s
license. International Journal of Aging and Human Development, 30,
1–14.
Evans, L. (2000). Risks older drivers face themselves and threats they pose to
other road users. International Journal of Epidemiology, 29, 315–322.
Federal Highway Administration. (1997). 1995 Nationwide personal trans-
portation survey data files (FHWA PL-97-034). Washington, DC: U.S.
Department of Transportation.
Federal Highway Administration. (2001). Highway design handbook for
older drivers and pedestrians (FHWA RD-01-103). Washington, DC:
U.S. Department of Transportation.
Freund, K. (1997). Independent transportation network: Alternative trans-
portation for the elderly (Idea Project Final Rep.). Washington, DC:
Transportation Research Board.
Gonda, J. (1982). Transportation, perceived control, and well-being in the
elderly. Specialized Transportation Planning and Practice, 1, 61–72.
Kaplan, G. A. (1992). Health and aging in the Alameda County Study. In:
K. W. Schaie, D. Blazer, & J. S. House (Eds.), Aging, health behaviors,
and health outcomes ( pp. 69–88). Hillsdale, NJ: Erlbaum.
Kaplan, G. A. (1995). Where do shared pathways lead? Some reflections
on a research agenda. Psychosomatic Medicine, 57, 208–212.
Kostyniuk, L. P., & Shope, J. T. (1998). Reduction and cessation of driving
among older drivers: Focus groups (Rep. No. UMTRI-98-26). Ann Ar-
bor, MI: The University of Michigan Transportation Research Institute.
Kostyniuk, L. P., Shope, J. T., & Molnar, L. J. (2000). Reduction and
cessation of driving among older drivers: Final report (Rep. No. UM-
TRI-2000-6). Ann Arbor, MI: The University of Michigan Transporta-
tion Research Institute.
Kostyniuk, L. P., Shope, J. T., & Molnar, L. J. (2001). Reduction and
cessation of driving among older drivers: Toward a behavioural frame-
work. Travel behaviour research: The leading edge ( pp. 783–795).
Amsterdam: Pergamon Press.
Litwak, E., & Longino, C. F. (1988). Migration patterns among the elderly:
A developmental perspective. Gerontologist, 27, 266–272.
Lupton, F. (2001). The 3rd age suit. Aging and driving symposium. Des
Plaines, IL: Association for the Advancement of Automobile Medicine.
Marottoli, R. A., & Drickamer, A. (1993). Psychomotor mobility and the
elderly driver. Clinics in Geriatric Medicine, 9(2), 403–411.
Marottoli, R. A., Mendes de Leon, C. F., Glass, T. A., Williams, C. S.,
Cooney, L. M., Berkman, L. F., & Tinetti, M. E. (1997). Driving ces-
sation and increased depressive symptoms: Prospective evidence from
the New Haven EPESE. Journal of the American Geriatrics Society,
45(2), 202–206.
McKnight, J. A. (1988). Driver and pedestrian training (TRB Special Rep.
218). Transportation in an aging society: Improving mobility and safety
for older persons, vol. 2 ( pp. 101–133). Washington, DC: National
Research Council.
Michigan Department of Transportation. (2002). Michigan public transit
facts for 2001. Available at: http://www.michigan.gov/MDOT (Ac-
cessed November 2002).
National Center for Statistics and Analysis. (2001). Traffic safety facts
2000—Older population. Washington, DC: National Highway Traffic
Safety Administration.
Ostrow, A. C., Shaffron, P., & McPherson, K. (1992). The effects of a joint
range-of-motion physical fitness training program on the automobile
driving skills of older adults. Journal of Safety Research, 23, 207–219.
Owsley, C., Stalvey, B. T., & Phillips, J. M. (2003). The efficacy of an
educational intervention in promoting self-regulation among high-risk
older drivers. Accident Analysis and Prevention, 35(3), 393–400.
Rosenbloom, S. (1988). The mobility needs of the elderly (TRB Special
Rep. 218). Transportation in an aging society: Improving mobility and
safety for older persons, vol. 2 (pp. 21–71). Washington, DC: National
Research Council.
Silverstein, M. (1995). Stability and change in temporal distance between
the elderly and their children. Demography, 32, 29–45.
Staplin, L., Lococo, K. H., Stewart, J., & Decina, L. E. (1999). Safe
mobility for older people (Rep. No. DOT HSS 808 853). Washington,
DC: National Highway Traffic Safety Administration.

L.P. Kostyniuk, J.T. Shope / Journal of Safety Research 34 (2003) 407–414414
Vala, M. (2001). Designing vehicle interiors for the mature driver. Aging
and driving symposium. Des Plaines, IL: Association for the Advance-
ment of Automobile Medicine.
Wilkins, J. W., Stutts, J. C., & Schatz, S. (1999). The premature reduction
and cessation of driving: A preliminary study of women who choose not
to drive or who drive infrequently. Transportation Research Record,
1693, 86–90.
Lidia P. Kostyniuk, PhD, is a research scientist in the Social and
Behavioral Analysis Division at the University of Michigan Transportation
Research Institute. Dr. Kostyniuk’s research interests are in older driver
safety and mobility, travel behavior, and transportation safety.
Jean T. Shope is a senior research scientist and head of the Social and
Behavioral Analysis Division at the University of Michigan Transportation
Research Institute. She is also on the faculty of the Department of Health
Behavior and Health Education in the University of Michigan School of
Public Health. Dr. Shope’s research interests are older driver safety and
mobility, adolescent and young driving behavior, and the development and
evaluation of health education programs, especially substance abuse
prevention.