drinking water health advisory for boron, may 2008. · boron may 2008 iii drinking water health...
TRANSCRIPT
Drinking Water Health Advisory
For Boron

Boron
May 2008
ii

Boron
May 2008
iii
Drinking Water Health Advisory For Boron
Prepared by:
Health and Ecological Criteria Division Office of Science and Technology
Office of Water U.S. Environmental Protection Agency
Washington, DC 20460
http://www.epa.gov/waterscience/
Document Number: 822-R-08-013 May, 2008

Boron
May 2008
iv
Boron
May 2008 v
TABLE OF CONTENTS Page
ACKNOWLEDGMENTS ........................................................................................................................IX
LIST OF ABBREVIATIONS ..................................................................................................................XI
1.0 INTRODUCTION........................................................................................................................... 1
2.0 GENERAL INFORMATION AND PROPERTIES .................................................................... 3
2.1 PHYSICAL AND CHEMICAL PROPERTIES........................................................................................ 3 2.2 USES .............................................................................................................................................. 6 2.3 NUTRITIONAL PROPERTIES ........................................................................................................... 6
3.0 OCCURRENCE AND EXPOSURE.............................................................................................. 7
3.1 AIR ................................................................................................................................................ 7 3.2 FOOD ............................................................................................................................................. 8 3.3 WATER .......................................................................................................................................... 9 3.4 SOIL............................................................................................................................................. 10 3.5 OTHER SOURCES ......................................................................................................................... 10
4.0 HEALTH EFFECTS DATA ........................................................................................................ 13
4.1 HUMAN STUDIES ......................................................................................................................... 13 4.1.1 Short-term Exposure ............................................................................................................... 13 4.1.2 Long-term Exposure................................................................................................................ 14 4.1.3 Reproductive and Developmental Effects ............................................................................... 14 4.1.4 Carcinogenicity....................................................................................................................... 15
4.2 ANIMAL STUDIES ........................................................................................................................ 15 4.2.1 Short-term Exposure ............................................................................................................... 16 4.2.2 Long-term Exposure................................................................................................................ 18 4.2.3 Reproductive and Developmental Effects ............................................................................... 19
4.2.3.1 Reproductive Effects................................................................................................... 19 4.2.3.2 Developmental Effects ................................................................................................ 22
4.2.4 Genotoxicity ............................................................................................................................ 24 4.2.5 Carcinogenicity....................................................................................................................... 25
4.3 PROPOSED MODE OF ACTION...................................................................................................... 26
5.0 QUANTIFICATION OF TOXICOLOGICAL EFFECTS ....................................................... 27
5.1 ONE-DAY HEALTH ADVISORY FOR CHILDREN........................................................................... 28 5.2 TEN-DAY HEALTH ADVISORY FOR CHILDREN............................................................................ 29 5.3 LONGER-TERM HEALTH ADVISORY............................................................................................ 30 5.4 LIFETIME HEALTH ADVISORY..................................................................................................... 33 5.5 EVALUATION OF CARCINOGENIC POTENTIAL............................................................................. 34
6.0 OTHER CRITERIA, GUIDANCE, AND STANDARDS ......................................................... 37
7.0 ANALYTICAL METHODS ........................................................................................................ 39
8.0 TREATMENT TECHNOLOGIES ............................................................................................. 41
9.0 REFERENCES............................................................................................................................. 43

Boron
May 2008 vi

Boron
May 2008 vii
LIST OF TABLES TABLE 1. Chemical and Physical Properties of Boron and Related Compounds ...................................... 5 TABLE 2. Fetal Weight Analysis Data ..................................................................................................... 32 TABLE 3. Results of BMD Analysis......................................................................................................... 32

Boron
May 2008 viii
Boron
May 2008 ix
ACKNOWLEDGMENTS This document was prepared by Oak Ridge National Laboratory, Oak Ridge, Tennessee, work assignment 2006-002-2, under the U.S. EPA IAG Number DW-89-92209701. The Lead EPA Scientist is Santhini Ramasamy, PhD, MPH, DABT, Health and Ecological Criteria Division, Office of Science and Technology, Office of Water, U. S. Environmental Protection Agency.
Boron
May 2008 x
This page has been intentionally left blank
Boron
May 2008 xi
LIST OF ABBREVIATIONS AFAK interspecies toxicokinetic adjustment factor AFAD interspecies toxicodynamic adjustment factor AFHK intraspecies toxicokinetic adjustment factor AFHD intraspecies toxicodynamic adjustment factor atm atmosphere ATSDR Agency for Toxic Substances and Disease Registry B boron BA boric acid BMD benchmark dose BMDL 95% lower confidence limit on the BMD BMR benchmark response bw body weight CAS Chemical Abstracts Registry CDC Centers for Disease Control and Prevention cm centimeter CNS central nervous system CSF cancer slope factor ECETOC European Centre for Ecotoxicology and Toxicology of Chemicals EPA Environmental Protection Agency F0 parental generation F1 offspring of the parental (F0) generation F2 offspring of the F1 generation FR Federal Register FSH follicle-stimulating hormone g gram GD gestation day HA Health Advisory HF hollow-fiber Hg mercury HSDB Hazardous Substances Database ICP-AES Inductively coupled plasma - Atomic Emission Spectrometry IOM Institute of Medicine IRIS Integrated Risk Information System kg kilogram L liter LH luteinizing hormone LOAEL lowest-observed-adverse-effect level m meter M molar m3 cubic meters mg milligram min minute mL milliliter MDL method detection limit

Boron
May 2008 xii
mm millimeter NIRS National Inorganic and Radionuclide Survey NOAEL no-observed-adverse-effect level NTP National Toxicology Program OPP Office of Pesticides Programs OW Office of Water pKa acid-base dissociation constant PND postnatal day POD point of departure ppm parts per million PTFE polytetrafluoroethylene PWS Public Water Systems RED Re-registration Eligibility Document RfD reference dose RO reverse osmosis RSC relative source contribution SD standard deviation SDWA Safe Drinking Water Act SM Standard Method SW spiral-wound TRED Tolerance Reassessment Eligibility Decision μg microgram μmol micromole UL upper intake level USBM U.S. Bureau of Mines U.S. EPA U.S. Environmental Protection Agency USGS U.S. Geological Survey

Boron
May 2008 1
1.0 INTRODUCTION The Health Advisory (HA) Program, sponsored by the Office of Water (OW), provides information on the environmental properties, health effects, analytical methodology, and treatment technology for regulated and unregulated drinking water contaminants. HAs establish nonregulatory concentrations of drinking water contaminants at which adverse health effects are not anticipated to occur over specific exposure durations (one-day, ten-days, several years, and a lifetime). HAs serve as informal technical guidance to assist Federal, State and local officials, and managers of public or community water systems in protecting public health when emergency spills or contamination situations occur. They are not to be construed as legally enforceable Federal standards. The HAs are subject to change as new information becomes available. The Toxicological Review of Boron and Compounds on the Integrated Risk Information System (IRIS) (U.S. EPA, 2004) is the peer-reviewed, risk assessment that supports this HA. This document can be assessed at www.epa.gov/iris. The Health Effects Support Document for Boron (U.S. EPA, 2005a) is another comprehensive summary of the available data. This document can be found at www.epa.gov/safewater/ccl/pdf/boron.pdf . Additional information can be found in Boric Acid/Sodium Borate Salts: HED Chapter of the Tolerance Reassessment Eligibility Decision Document (TRED). This document can be accessed by searching the term “boric” in the electronic docket (Docket Id.: EPA-HQ-OPP-2005-0062) at http://www.regulations.gov/fdmspublic/component/main. The less than lifetime HA values were independently peer reviewed by the Office of Water.

Boron
May 2008 2

Boron
May 2008 3
2.0 GENERAL INFORMATION AND PROPERTIES 2.1 Physical and Chemical Properties Boron is a nonmetallic element that belongs to Group IIIA of the periodic table and has an oxidation state of +3. It has an atomic number of 5 and atomic weight of 10.81. Boron is actually a mixture of two stable isotopes, 10B (19.8%) and 11B (80.2%) (WHO, 1998). Boron is a naturally-occurring element found in rocks, soil, and water. The concentration of boron in the earth’s crust has been estimated to be <10 ppm, but concentrations as high as 100 ppm can be found in boron-rich areas (Woods, 1994). Boron is a polymorphic element that exists in a variety of different crystalline forms: α-rhombohedral (clear red crystals); β-α-rhombohedral (black); α-tetragonal (black, opaque crystals with metallic luster); amorphous (black or dark brown powder); and yellow monoclinic crystals or brown amorphous powder (O’Neil et al., 2001; Weast, 1988). It is an electron-deficient element that has a high affinity for and a strong tendency to form highly stable covalent bonds with electronegative atoms such as oxygen to form either planar trigonal BO3 or the negatively charged tetrahedral BO4
- (Culver et al., 2001). Therefore, boron often exists in the form of compounds with boron being bonded with oxygen (Woods, 1994).
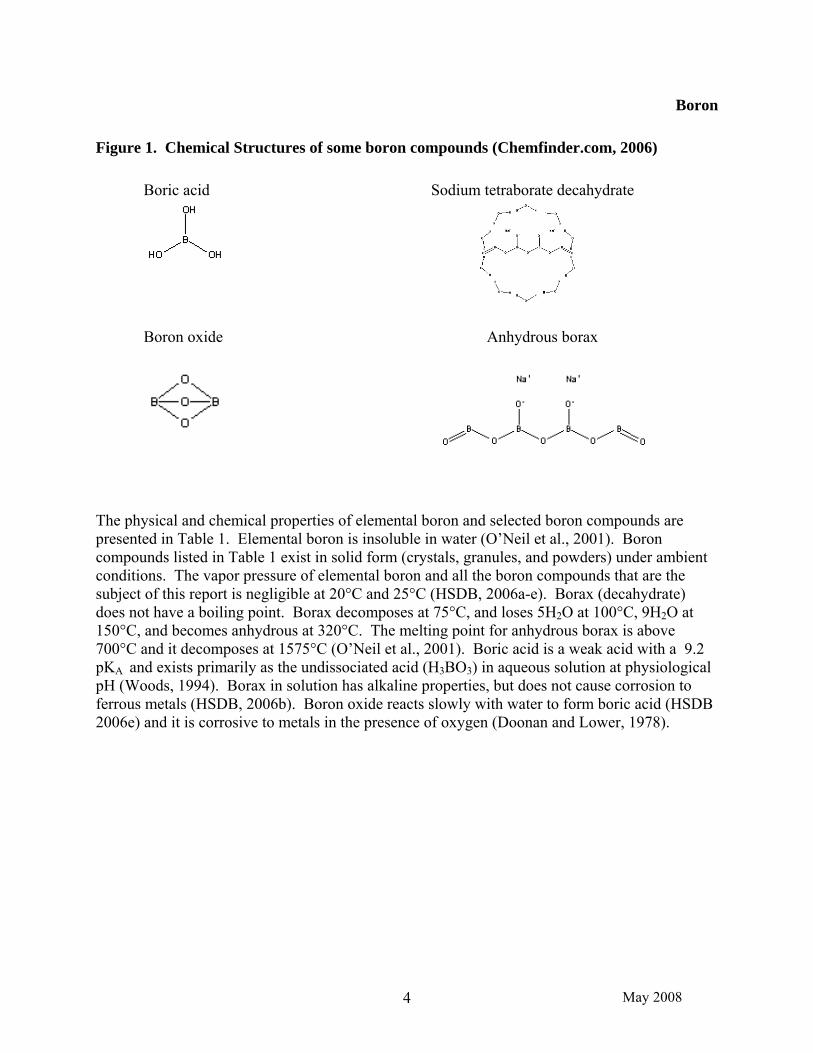
The generic term “boron” refers to the boron content in boron-containing compounds and to elemental boron. Inorganic boron compounds share many chemical and biological characteristics attributed to the properties of boron contained in the compound. Borate minerals are ubiquitous in nature and are found in low concentrations as alkali-metal (e.g. sodium) and alkaline-earth (e.g., calcium) borate and borosilicate minerals; boron rarely occurs naturally as boric acid. Borates are found in ocean water, sedimentary rock, coal, shale, and soils. Elemental boron is recovered from borate minerals by the reduction of borates. Borax is produced by dissolving borate minerals in water and recovering the crystallized product. Anhydrous borax is produced by high temperature fusion of borax, and boric acid is a crystallized product recovered from borax reacted with hot sulfuric acid. Boric oxide is produced by thermal fusion of boric acid (Culver et al., 2001). The chemical structure of some boron compounds is found in Figure 1.
Boron
May 2008 4
Figure 1. Chemical Structures of some boron compounds (Chemfinder.com, 2006)
Boric acid Sodium tetraborate decahydrate Boron oxide Anhydrous borax The physical and chemical properties of elemental boron and selected boron compounds are presented in Table 1. Elemental boron is insoluble in water (O’Neil et al., 2001). Boron compounds listed in Table 1 exist in solid form (crystals, granules, and powders) under ambient conditions. The vapor pressure of elemental boron and all the boron compounds that are the subject of this report is negligible at 20°C and 25°C (HSDB, 2006a-e). Borax (decahydrate) does not have a boiling point. Borax decomposes at 75°C, and loses 5H2O at 100°C, 9H2O at 150°C, and becomes anhydrous at 320°C. The melting point for anhydrous borax is above 700°C and it decomposes at 1575°C (O’Neil et al., 2001). Boric acid is a weak acid with a 9.2 pKA and exists primarily as the undissociated acid (H3BO3) in aqueous solution at physiological pH (Woods, 1994). Borax in solution has alkaline properties, but does not cause corrosion to ferrous metals (HSDB, 2006b). Boron oxide reacts slowly with water to form boric acid (HSDB 2006e) and it is corrosive to metals in the presence of oxygen (Doonan and Lower, 1978).

Boron
May 2008 5
1 2
TABLE 1. Chemical and Physical Properties of Boron and Related Compounds
Property Boron Boric Acid Borax Borax Pentahydrate Anhydrous Borax Boron Oxide
Chemical Abstracts Registry (CAS) No. 7440-42-8 10043-35-3 1303-96-4 12179-04-3
11130-12-4 1330-43-4 1303-86-2
U.S. EPA Pesticide Chemical Code 128945 011001 029601 or 011102 011110 011112 011002
Synonyms none identified
boron trihydroxide; trihydroxy borate; orthoboric acid; boracic acid
disodium tetraborate decahydrate, borax decahydrate, borax 10
Sodium tetraborate pentahydrate; Borax 5
Sodium tetraborate; borax glass; disodium tetraborate; fused borax
Boric oxide; boron trioxide; anhydrous boric acid
Chemical Formula B H3BO3 Na2B4O7.10H2O Na2B4O7.5H2O Na2B4O7 B2O3
Molecular Weight 10.81 61.83 381.43 291.35 201.27 69.62
Physical State Solid; black crystal or yellow-brown amorphous powder
Solid; white or colorless crystalline granules or powder; colorless triclinic crystals
Solid; white or colorless crystalline granules or powder
Solid; white or colorless crystalline granules or powder
Solid; white or colorless vitreous granules
Solid; white or colorless vitreous granules
Boiling Point 2,550°C 300°C not identified none identified 1,575°C (decomposes) 1500°C
1,860°C
Melting Point 2,300°C 171°C (closed space) 450°C (anhydrous, crystal form)
>62°C (closed space) 75°C (decomposes) <200°C (closed space) 742°C 450°C
Density (at 20 °C) 2.34 1.51 1.73 1.81 2.37 2.46 (crystals); 1.85 (powder)
Solubility in: Water
Insoluble in water; slightly soluble in HNO3
2.52% at 0°C; 3.49% at 10°C; 4.72% at 20°C; 6.23% at 30°C; 15.75% at 70°C; 27.53% at 100°C
62.5 g/L at 25°C
35.9 g/L at 20°C 482.4 g/L at 100°C
24.8 g/L at 20°C 331.2 g/L at 100°C
rapidly hydrates to boric acid
Other Solvents none identified methanol, acetone, alcohol, glycerol glycerol glycerol ethylene glycol alcohol, glycerol
Source(s): HSDB, 2006a-e; Weast, 1988; O’Neil et al., 2001; Culver et al., 2001. 3

Boron
May 2008 6
2.2 Uses In 2003, glass production accounted for 78% of the boron compounds consumed in the U.S. (insulation-grade glass fiber, 42, textile-grade glass fibers, 19%, borosilicate glass, 6%, and enamels, frits, and glazes, 14%), soaps and detergents accounted for 4%, fire retardants accounted for 4%, agricultural products accounted for 3%, miscellaneous uses accounted for 4%, and 10% was sold to distributors (USGS, 2003). The use pattern was similar in 2004, with glass and ceramics accounting for 70% (insulation-grade glass fibers, 46%; textile-grade glass fiber, 16%; borosilicate glass, 5%; and enamels, frits, and glazes, 3%); soaps and detergents accounted for 6%; fire retardants accounted for 3%, agriculture accounted for 4%; and other unnamed uses accounted for 19% (USGS, 2006). The use of boron in soaps and detergents is beginning to decline because of the environmental concerns about boron in wastewater (USGS, 2003). 2.3 Nutritional Properties Boron is suspected but has not been directly proven of being a trace nutrient in humans. The National Academy of Science Institute of Medicine categorizes boron as a possible trace mineral nutrient for humans. Boron is essential for plant growth. Deficiency studies in animals and humans have provided some evidence that low intakes of boron affect cellular function and the activity of other nutrients. It may interact with Vitamin D and calcium, influence estrogen metabolism, and play a role in cognitive function. The average dietary intake for male adults is about 1.5 mg/day.

Boron
May 2008 7
3.0 OCCURRENCE AND EXPOSURE The world’s largest producers of boron minerals are the United States and Turkey (Moore et al., 1997). The U.S. produced 626,000 metric tons of boron compounds in 1991 and 521,000 metric tons in 1992 (USBM, 1993). Boron minerals, primarily sodium borates, are currently produced by three companies in southern California (USGS, 2006). In 2004 and 2005, U.S. production of all forms of boron was 1,210-1,230 × 103 metric tons, and the U.S. was the world’s leading producer of refined boron compounds (USGS, 2006).
The richest known boron-containing deposits in the U.S. are found in the desert areas of southern California; however, rich deposits are also found in Nevada and Oregon in the U.S. and in Turkey, Russia, Chile and China (Moore et al., 1997). Boron is found in high concentrations in marine sediments, sedimentary rocks, natural rich deposits of boron minerals and soils formed from the minerals, coal, shale, and geothermal fluids. Boron is a naturally occurring element widely distributed in nature at concentrations approaching 30 ppm in some geologic formations (Moore et al., 1997). Boron concentrations in rocks range from 5 to 100 ppm and the average concentration in the earth’s crust is 10 ppm (Woods, 1994). Boron is released into the environment from these sources by natural weathering processes (Moore et al., 1997). Human causes of boron contamination include releases to air from power plants, chemical plants, and manufacturing facilities. Fertilizers, herbicides, and industrial wastes are among the sources of soil contamination. Contamination of water can come directly from industrial wastewater and municipal sewage, as well as indirectly from air deposition and soil runoff (ATSDR, 1992). Borates in detergents, soaps, and personal care products can also contribute to the presence of boron in the environment. 3.1 Air Boron is released to air from oceans, volcanoes, geothermal steam, and other natural environment sources (Graedel, 1978). The largest source of atmospheric boron is evaporation of seawater, and the concentration of boron in seawater is ~4.5 ppm. Approximately 800,000 to 4,000,000 metric tons of boron is released into the atmosphere from sea water (Anderson et al., 1994). About 180,000 to 650,000 metric tons of boron are released into the atmosphere from anthropogenic (man-made) sources (Anderson et al., 1994). Anthropogenic sources of boron in the air include coal-fired and geothermal power plants, chemical plants, rocket fuels, and production of boron compounds and boron-containing products (Moore et al., 1997). Boron has been found in fly ash from coal-fired power plants and waste incinerators. Narukawa et al. (2003) reported that concentrations of boron in fly ash range from 8-19 mg B/kg of fly ash from one power plant to 49-180 mg B/kg of fly ash from another power plant with the concentrations increasing as the particle size decreases at both power plants. The author noted that the small particle size would result in the spread of the boron over a wide area. However, a previous report noted concentrations as high as 1900 mg/kg of fly ash (Cox et al., 1978 as cited by Culver et al., 2001). The leachability of the boron in fly ash was tested and found to be most efficient at acid pH approximating that of acid rain (Narukawa et al., 2003). Mastromatteo and Sullivan (1994) reported that atmospheric boron concentration averages about 0.5 ng/m3, but Culver et al. (2001) reported that the mean boron concentration in air is 20 ng/m3 with a range of <0.5 to 80 ng/m3.
Boron
May 2008 8
3.2 Food The concentration of boron in food products is related to boron in soil where they are grown, and the concentrations show some geographic fluctuations depending on location (IOM, 2001). Boron is found naturally in fruits, vegetables, nuts, legumes, and grains. Hunt et al. (1991) reported that the concentration of boron in prepared food products ranged from nondetectable to 26.9 μg/g or mL of product. Products such as dry beef bouillon, grape jelly, grape juice, apple juice, applesauce, cherries, canned peaches, dried onion flakes, dry potato flakes, ground cinnamon, and dried parsley flakes contained high to very high (0.001-0.030 mg/g or mL of food product) concentrations of boron. Boron also is found in some animal products because it is present in feed (Moore, et al. 1997). Therefore, boron is a natural constituent in the diet. Mastromatteo and Sullivan (1994) reported that the average U.S. diet contains 0.0025-0.003 mg B/g of food delivering an average of 1.5 mg B/day. The average daily boron intake by adult males 25-30 years old living in the Southeast and North Central regions of the U.S determined using the FDA Total Diet Study Methodology was 1.52 ± 0.38 mg B/day (Moore, et al. 1997). The concentration of boron (mg B/100 g food item) in some raw foods is as follows: raisins, 2.220; peanuts, 1.700; peaches, 0.530; grapes, 0.490; apples, 0.360; pears, 0.280; oranges, 0.260; carrots, 0.230; onions, 0.190; cantaloupe, 0.180; bananas, 0.135; lettuce, 0.105; tomatoes, 0.063; and whole milk, 0.018 (Rainey et al., 1999). Very high boron concentrations were found in peanut butter and dry table wine. In the 1994 Total Diet Study from the United Kingdom, the food groupings with the highest boron concentrations were nuts (14 mg/kg fresh weight), fruits and fruit products (2.4-3.4 mg/kg), green vegetables (2.0 mg/kg), potatoes and other vegetables (1.2-1.4 mg/kg). The levels were below 1 mg/kg for other food categories (Ysart et al., 1999). Fish samples taken from the Tualatin River Basin in Oregon had a median boron concentration of 0.0012 mg/g and a maximum concentration of 0.0035 mg/g of tissue (Bonn, 1999). Fish taken from the Lower Snake River Basin has concentrations as high as 0.0018 mg/g tissue (Clark and Maret, 1998 as cited by U.S. EPA, 2005a). Rainey et al. (1999) developed a Boron Nutrient Database and linked it to the 3-day food records of about 11,000 individuals who responded to the 1989-1991 Continuing Survey of Food Intakes by Individuals and generated daily boron intake for each individual. Their data showed that the mean intake of boron in the U.S. diet from all food sources was 0.85 mg B/day for 4-8 year old, 0.91 mg B/day for 9-13 year old, and 0.88 mg B for 14-18 year old males and females; 1.17 mg B/day for males ≥19 years and 0.96 mg B/day for females ≥19 years. Boron intake by pregnant females was 1 mg B/day. The highest level of intake reported by Rainey et al. was 1.47 mg B/day for male vegetarian followed by 1.29 mg B/day for female vegetarians and 1.28 for males 51-70 years old. The highest median intake was 1.30 mg/day by adult male vegetarians and the lowest intake was 0.72 mg/day by adult females 19-30 years old (Rainey et al., 1999). Richold (1998) reported that consumption of boron in food, water, and wine is about 5-6 mg/day and about 7 mg/day if wine is included. Hunt and Meacham (2001) reported that a large portion of boron intake in infants came from infant foods, whereas fruits and fruit juices contributed the largest boron intake for toddlers. The primary source of boron for adolescents came from milk and cheese products and the primary source for adults and seniors was instant regular coffee (Hunt and Meacham, 2001). Rainey et al. (1999) noted that coffee and milk are the top two contributors of boron in the diet because of the large volume in which they are consumed. The

Boron
May 2008 9
overall consumption of boron in the diet is dependent on lifestyle, eating habits, and geographical location (Richold, 1998). 3.3 Water EPA (U.S.EPA, 2005b) used data from several sources to evaluate the potential occurrence of boron in Public Water Systems (PWS) and exposure to boron through drinking water. The primary source for the drinking water occurrence data is the National Inorganic and Radionuclide Survey (NIRS). In addition to this primary source, EPA evaluated supplemental sources of occurrence information, including United State Geological Survey groundwater and surface water data, American Water Works Association Research Foundation data (AWWARF), the USEPA Community System Water Survey, and information from the published literature. NIRS collected contaminant occurrence data from 989 public water systems (PWSs) served by ground water. The statistical selection of PWSs was designed to be geographically representative of national occurrence in ground water. NIRS data were collected from PWSs in 49 states. Approximately 81.9% of groundwater PWSs had detections of boron (≥0.005 mg/L). Therefore, about 88.1% of the population (equivalent to approximately 75.5 million people) served by the surveyed groundwater PWSs are exposed to boron in drinking water. Boron was detected at a concentration >0.7 mg/L (Half of Health Reference Level) in 4.3% of surveyed groundwater PWSs, indicating that 2.9% of the population (equivalent to approximately 2.5 million people), are exposed to this level of boron. Concentrations greater than >1.4 mg/L (Health Reference Level) were found in approximately 1.7% of surveyed groundwater PWSs, indicating that exposure at this level occurs in 0.4% of the population served, equivalent to approximately 0.4 million people. Butterick et al. (1989) reported that boron concentrations in shallow groundwater in the San Joaquin Valley region in California ranged from 0.14 to 120 mg B/L in 1984. Because NIRS did not include surface water systems, EPA consulted another study as well, a boron survey funded by the American Water Works Research Foundation (Frey et al., 2004). In the AWWARF study, samples were analyzed for boron with a method detection limit of 0.002 mg/L, or 2.0 Fg/L. Boron was detected with concentrations equal or greater than the method detection limit in 226 of 228 ground water samples (99.1%) and 110 of 113 surface water samples (97.3%). Boron concentrations greater than 0.7 mg/L (Half of Health Reference Level), were found in 20 of 228 ground water samples (8.8%) and no surface water samples (0%). Boron concentrations greater than the 1.4 mg/L (Health Reference Level) were found in 7 of 228 ground water samples (3.1%) and no surface water samples (0%). The median concentrations were 0.0514 mg/L in ground water and 0.029 mg/L in surface water. The USEPA (2002a; 2002b ) Community Water System Survey (CWSS) gathered data on the financial and operating characteristics of a random sample of community water systems nationwide. In addition, it compiled system data for all very large community water systems, those that serve more than 500,000 people (a total of 83 systems), and monitoring results for a small subset of regulated compounds and unregulated compounds, which included boron. In finished water, 5 observations of boron occurrence were reported in ground water, and among detects, the median concentration was 102 µg/L and the 90th percentile value 234 μg/L. For

Boron
May 2008 10
surface water, 14 observations of boron occurrence were reported, and among detects, the median concentration was 56 µg/L and the 90th percentile was 500 μg/L (USEPA, 2002b). In raw ground water, 34 observations of boron occurrence were reported; among detects, the median concentration was 120 µg/L and the 90th percentile concentration 273 μg/L. In raw surface water, 15 observations of boron occurrence were reported; among detects, the median concentration was 59 µg/L and the 90th percentile concentration was 180 µg/L (USEPA, 2002b). Boron was among the analytes in the USGS ground water monitoring in the Sacramento Valley in California in 1996 (Dawson, 2001) and the lower Illinois River Basin from 1984 to 1991 (Warner, 1999). In ground water from the Sacramento Valley aquifer, boron was detected in all thirty-one samples; concentrations ranged from 2 μg/L to 1,100 μg/L. The median concentration was 42 μg/L. Two of the thirty-one samples had concentrations in excess of 600 μg/L (Dawson, 2001). In ground water from the lower Illinois River Basin, 71% of samples collected between 1984 and 1991 contained boron concentrations higher than the minimum reporting level (50 μg/L). The highest detected concentration was 2,100 μg/L. Higher boron concentration samples generally were from deeper aquifers (Warner, 1999). 3.4 Soil Boron is a naturally-occurring element in soil. High concentrations are found in soil originating from marine sediments and arid regions (Brown et al., 1983). The concentrations in soil range from 10 to 30 ppm as boron as reported by one investigator (Sprague, 1972), but may be as high as 300 ppm at hazardous waste sites (Eckel and Langley, 1988). Boron was detected in the soils in Idaho at geometric mean concentrations of 4.6-9.8 mg/kg of soil (4.6-9.8 ppm) (Rope et al., 1988). Additional information on boron in soil can be found in Section 3.0. 3.5 Other Sources Boron is found in numerous consumer products that can be a source of exposure to humans. Boron is found in body-building dietary supplements at concentrations ranging from 1.5 to 10 mg B/servings (Loscutoff, 1994). Bottled water contains boron at concentrations ranging from <0.005-4.35 mg/L of water; the average concentration was 0.75 mg/L (Allen, et al., 1989). Boron compounds are incorporated in a number of cosmetic and personal care products (shampoos, bath oils, face and bath powders, hair rinses, soaps, detergents, underarm deodorants, moisturizing creams, shaving lotions, dental hygiene products, and breath fresheners (Hunt et al., 1991). High to extremely high concentrations were found in some lipsticks (1.23-11.5 μg/g), dental hygiene products (1.37-184 μg/g), gastric antacids (2.2-34.7 μg/g), laxatives and stool softeners (2.37-34.7 μg/g), hair conditioners (3.8-10.8 μg/g), creams and lotions (2.51-59.6 μg/g), and baby oil (1.17 μg/g). However, absorption of boron from some of these products that are applied to the skin may be low because of the inefficient uptake of boron by intact skin (Moore et al, 1997). Mulinos et al. (1953) reported that boron was absorbed through the skin of infants with moderate to marked diaper rash after application of 5% boric acid in talcum powder. Draize and Kelly (1959) reported that 5% aqueous boric acid (50 g/L or 8.8 g B/L) applied to intact skin of rabbits for 1.5 h/d for 4 days was not absorbed through intact skin, but it was absorbed through mildly abraded skin. It should be noted that the concentration of boron in the powder and aqueous solution was very high and the skin of the infants and rabbits was occluded.

Boron
May 2008 11
Boric acid is very toxic to insects and is used as an insecticide in the control of cockroaches and termites (Doonan and Lower, 1978).

Boron
May 2008 12
Boron
May 2008 13
4.0 HEALTH EFFECTS DATA Studies in both humans and animals show that boron is readily absorbed from the gastrointestinal tract. Boric acid and borate compounds in the body exist primarily as undissociated boric acid, which distributes evenly throughout the soft tissues, but shows some accumulation in bone. 4.1 Human Studies 4.1.1 Short-term Exposure A large number of cases of accidental boron poisoning have been reported in the literature; however, quantitative estimates of absorbed dose are limited. Baker and Bogema (1986) estimated the doses of boric acid in two sibling infants weighing 4.8 (24 days old) and 11.2 kg (14 months old) who accidentally ingested formulas prepared from a boric acid eyewash solution. These estimated doses of boric acid were 2.6 g (0.45 g B or 94.7 mg B/kg bw) and 1.95 g (0.34 g B or 30.4 mg B/kg bw), respectively. The sibling who ingested 2.6 g boric acid vomited a small amount of the formula, suffered from mild diarrhea, showed signs of irritability, and developed marked erythema in the diaper area and a purulent discharge from the eye. The infant who ingested 1.95 g developed only a mild erythematous macular rash on the face and neck and mild bilateral conjunctival congestion. Boric acid level in the serum was 147 μg/mL (25.7 μg B/mL) after 10 hours in the infant that ingested 2.6 g and 56 μg/mL (9.8 μg B/mL) after 3.5 hours in the infant that ingested 1.95 g. The investigators estimated a half-life of approximately 8 hours for the infant who ingested the lowest dose and did not receive dialysis therapy. O’Sullivan and Taylor (1983) reported convulsions and seizures along with irritability, vomiting, diarrhea, and loose stool in seven, 6-16 weeks old infants who ingested a honey-borax mixture applied to their pacifier for 4-10 weeks. Five infants had a history suggestive of a familial-reduced convulsive threshold. The seizures ceased when the honey-borax treatment was stopped. Average estimated daily intakes of borax ranged from 429-1287 mg and estimated average body weights ranged from 4.3-5.3 kg (U.S. EPA, 1997). The boron equivalent dose ranged from 9.6-33 mg B/kg bw/day. The lowest dose of 9.6 mg B/kg bw/day is considered the lowest-observed-adverse-effect-level (LOAEL) for a fairly severe effect. Concentrations of boron in blood of 2.6, 8.4, and 8.5 μg B/mL were reported for three of the infants, but did not correlate with estimated ingestion levels. A control group had blood boron values ranging from 0-0.63 μg/mL (average = 0.21 μg/mL). Therefore, the lowest level associated with seizures, 2.6 μg/mL, is 4 times the highest control level and 12 times the average control level, suggesting that the standard 10-fold uncertainty factor may be adequate for estimating a NOAEL (0.32 mg B/kg/day). These data may not be completely reliable given the relatively uncomplicated boron toxicokinetics and the lack of correlation of blood boron. Therefore, this study should not be used to derive an HA level for children. Adult quantitative dose-response data for acute oral exposure ranged from 1.4 mg B/kg to a high of 70 mg B/kg (Culver and Hubbard, 1996). In cases where ingestion was less than 3.68 mg B/kg, subjects were asymptomatic. Data in the 25-35 mg B/kg range were from patients undergoing boron neutron capture therapy for brain tumors. They displayed nausea and

Boron
May 2008 14
vomiting at 25 mg B/kg, and additional symptoms included skin flush at 35 mg B/kg. A 72-year old woman who accidentally ingested boric acid in two doses of 45 g 12 hours apart experienced vomiting and diarrhea after the first dose and vomiting after the second dose, showed signs of non-pruriginous (non-itching) erythema that lasted 4 days, and had ulceration of the esophagus and a bloody diarrhea on the second day (Astier et al., 1988). 4.1.2 Long-term Exposure
From the mid 1800s until around 1900, boron compounds were used for treating various medical conditions including epilepsy, malaria, urinary tract infections, and exudative pleuritis; therefore, some information is available on longer term exposure. Culver and Hubbard (1996) report on early cases of boron treatment for epilepsy at doses ranging from 2.5 to 24.8 mg B/kg-day for many years. Signs and symptoms reported in patients receiving 5 mg B/kg-day and above were indigestion, dermatitis, alopecia (loss of hair), and anorexia. One epilepsy patient who received 5.0 mg B/kg-day for 15 days displayed indigestion, anorexia, and dermatitis, but the signs and symptoms disappeared when the dose was reduced to 2.5 mg B/kg-day. 4.1.3 Reproductive and Developmental Effects Sayli et al. (1998) reported on the relationship between exposure to boron in the drinking water and fertility of residents living in two geographic regions of Turkey. Drinking water boron concentrations were 2.05-29 mg/L in the high borate region and 0.03-0.4 mg/L in the low borate. The study population consisted of male and female residents (primarily males, who had ever been married) who could provide reproductive histories for three generations of family members and kindred. A total of 159 residents were from the high borate region and 154 were from the low borate region representing 1068 and 610 families, respectively. In the high borate region, 139 of the residents interviewed were male, and 28.3% of these were current workers in the borate mine or plant and 18.9% were past borate workers. In the low-borate region, the 94 residents were male and 11.7% of these were current borate workers and 12.8% were past borate workers. There was no difference between the regions regarding percentage of married couples with live births in any generation in the high borate region compared with the low borate region. Sex ratios appeared to differ, with an excess of female births in the high-boron region (males/females = 0.89) and a slight excess of male births in the low-boron region (males/females = 1.04), but no statistical analysis was performed, and other factors reported to affect sex ratio (parental age, rate of elective abortion, multiple births) were not taken into account. In a follow-up study, Sayli (2001) studied the reproductive history of the male and female siblings of the probands (married adults) and their spouses. A total of 2197 participants provided information on a total of 12,891 siblings. Infertility was defined as childlessness after 2 years of marriage. No differences were noted among these groups. In addition, no differences were found among family members who were borate workers. The investigators concluded that this study provided additional evidence that boron exposure had no effect on human reproduction. In a second follow-up study, Sayli et al. (2003) obtained reproductive information via a questionnaire on 191 workers at the borate facility, all of whom were considered exposed. In addition, the investigators obtained reproductive information without interview on 712 new

Boron
May 2008 15
subjects that included office employees and general management, active borate workers, and former borate workers. The percentage of infertility among borate workers was similar to that of the general population. Although these follow-up studies appeared to confirm the previous results that potential exposure to boron did not affect reproduction among humans, the lack of specific interview data for the majority of the population in all the studies and small population size in worker limit the use of these studies for risk assessment purposes. Chang et al. (2006) studied the reproductive health of 936 male workers in the boron mine and processing industry and a comparison group of 251 men in China. Occupational exposure of the boron workers contributed 0.06-51 mg B to daily intake assuming15 m3 air inhaled over an 8-hour work day, and workplace exposure contributed only 0.005-0.016 mg B in the comparison group. Boron concentration ranged from 2.-3.8 mg/L in surface water, 1.2-25.1 mg/L in well water, and up to 1,195 mg/kg in soil in the boron area compared with ≤0.67 mg/L in surface and well water and up to 82 mg/kg in soil in the comparison area. Demographic and lifestyles were not vastly different between the two groups; both groups had a very high percentage of current smokers and subjects exposed to second hand smoke. Reproductive information gained by interview of the workers. The only statistically significant effects on reproductive health were the increased percent of boron workers whose wives experienced delays in pregnancy and a decrease in mean number of live births among boron workers. These differences were not statistically significant after accounting for smoking, alcohol consumption, education, and race. The percentage of males offspring sired by boron workers was lower than that of the comparison group, but the difference did not reach statistical significance. This study is not reliable and may have been confounded by large percentage of workers who smoked or were exposed to environmental tobacco smoke, potential recall errors, the large percentage of induced abortions (higher in comparison group), and the one-child per family policy. Yazbeck et al. (2005) found no difference in the birth rate in three areas of France where the concentration of boron in drinking water was ≥0.30 mg/L than in areas where the concentration was 0.10-0.29 or 0.00-0.09 mg/L. The ratio of female offspring was slightly, but not signficantly higher in the areas where the boron concentration was ≥0.30 mg/L than in the other areas. 4.1.4 Carcinogenicity No data were found on the carcinogenicity of boron and compounds in humans. 4.2 Animal Studies In the following studies, doses not reported by the investigators were approximated from dietary or drinking water concentrations of boron using food factors (rat: 0.05; dog: 0.025; mouse: 0.1) (1 ppm = 0.025 mg/kg-day assumed dog food consumption) and body-weight and water consumption values (mouse: 0.03 kg and 0.0057 L/day; rat: 0.35 kg and 0.049 L/day) specified by the U.S. EPA (1980, 1988). Doses in mg boric acid were converted to mg boron by multiplying by the ratio of the formula weight of boron to the molecular weight of boric acid 10.81/61.84 = 0.1748). Similarly, doses in mg borax were converted to mg boron by multiplying

Boron
May 2008 16
by the ratio of the formula weight of boron to the molecular weight of borax (4 × 10.81/381.3 = 0.1134). 4.2.1 Short-term Exposure Groups of five male and five female B6C3F1 mice were fed diets containing 0, 600, 1200, 2400, 4900, or 9800 ppm boric acid for 14 days (NTP, 1987). All mice survived and no gross or microscopic lesions were observed at any dietary concentration. In a second feeding study, groups of five male and five female B6C3F1 mice were fed diets containing 0, 6200, 12,500, 25,000, 50,000, or 100,000 ppm boric acid (0, 108.4, 218.5, 437.0, 874.0, or 1748 mg B/kg/day, respectively, based on a food factor of 0.1 and ratio of boron:boric acid of 0.1748) for 14 days. Body weight and feed consumption were measured during the study. At study termination, the mice were subjected to gross examination and selected tissues were examined microscopically. All males and one female in the 100,000-ppm group, three males in the 50,000-ppm group, and one male in the 25,000-ppm group died during the study. Mean body weights of males in the 50,000- and 25,000-ppm groups were 12% and 18% less, respectively, than that of controls, whereas mean body weight of females was within 7% of controls at 50,000 ppm or less. Food consumption was not affected; lethargy was observed and the liver, spleen, and renal medullae were discolored. Hyperplasia (abnormal increase in number of cells) and/or dysplasia (cells that appear abnormal) of the forestomach were observed in two to four males and females fed 25,000 ppm or more. No effects were observed in mice receiving 12,500 ppm or less. Therefore, the LOAEL for this study is 25,000 ppm (437 mg B/kg bw/day, and the NOAEL is 12,500 ppm (218.5 mg B/kg bw/day). In a subchronic study, groups of 10 male and 10 female B6C3F1 mice were fed diets containing 0, 1200, 2500, 5000, 10,000, or 20,000 ppm boric acid (0, 210, 437, 874, 1748, or 3496 ppm boron) for 13 weeks (NTP, 1987; Dieter, 1994). These dietary levels corresponded to 0, 34, 70, 141, 281, and 563 mg B/kg-day for males and 0, 47, 97, 194, 388, and 776 mg B/kg-day for females, respectively, based on average feed consumption of 161 g food/kg bw/day for males and 222 g food/kg bw/day for females in the control group at week 4 of the study. Food consumption measurements for the treated animals were unreliable because of spillage. Eight males and six females receiving 20,000 ppm and one male receiving 10,000 ppm died during the study. Decreases in mean body weight ranged from 10-23% less than that of controls in males at ≥5000 ppm and females at ≥10,000 ppm and weight gain was decreased by 23% or more in both sexes receiving ≥5000 ppm. Hyperkeratosis (thickening of outer skin layer) and/or acanthosis (an abnormal but benign thickening) of the stomach were observed in both sexes at 20,000 ppm and degeneration/atrophy of the seminiferous tubules in the testes was observed in males receiving ≥5000 ppm. Minimal to mild extramedullary hematopoiesis of the spleen was observed in all dosed groups of both sexes and in one male control. Because extramedullary hematopoiesis (production of red blood cells outside the bone marrow) was observed at 1200 ppm, the lowest dose tested, the LOAEL for this study is 1200 ppm (34 and 47 mg B/kg/day for male and female mice, respectively). Therefore, a NOAEL was not established for this study. Sprague-Dawley rats (10/sex/dose) were fed borax or boric acid in the diet at concentrations of 0, 52.5, 175, 525, 1750, and 5250 ppm as boron equivalent for 90 days (Weir and Fisher, 1972, Paynter, 1962a and b). The dietary concentrations were equivalent to 0, 3.9, 13, 38, 124, or 500

Boron
May 2008 17
mg B/kg/day, respectively for boric acid and 0, 4.0, 14, 42, 125, or 455 mg B/kg/day, respectively, for borax (U.S. EPA, 2006). All rats fed the 5250-ppm diet as borax or boric acid died within 6 weeks and one rat each fed the 52.5- and 1750-ppm diets also died during the study. Clinical signs of toxicity at 1750 and 5250 ppm included rapid respiration, eye inflammation, swelling of the paws, desquamation of the skin on the paws and tails, and excitation during handling. Both sexes fed boric acid and males fed borax at 1750 ppm had significantly reduced body weight as did males and females fed the 5250-ppm boron diet as borax. Males fed the 1750-ppm diet and both sexes fed the 5250-ppm diet also had significantly reduced food utilization efficiency. Absolute weight of most organs including brain, liver, kidneys, and testes, was significantly reduced in male rats at 1750 ppm boron and absolute weight of the liver, spleen, adrenals, and ovaries was significantly reduced in females at 1750 ppm boron. Relative weight (organ:body weight) of brain, thyroid, liver, kidneys, adrenals, and testes were significantly reduced in males fed 1750 ppm as borax or boric acid. Only the relative weight of the brain, thyroids, liver, and ovaries were significantly reduced in females at 1750 ppm. Similar effects on organ:brain weight ratios were observed in male and female rats fed the 1750 ppm diet. Organ weight changes were observed at dietary concentrations below 1750 ppm but were inconsistent and showed no clear dose-related trends. Gross examination of rats that died at the 5250-ppm level revealed congestion of the liver and kidneys, bright red lungs, a swollen appearance of the brain, small gonads, and a thickened pancreas. Microscopic examination revealed complete testicular atrophy in all males at 1750 ppm and four males at 52.5 ppm and in one male at 525 ppm boron (Paynter, 1962 a and b). The cells of the zona reticularis in the adrenal gland were increased in size and had increased lipid content in a large number of males and females fed 1750 ppm as borax and in four males fed the same dose of boron as boric acid; the lesions were less severe in rats fed boric acid. No microscopic lesions corresponding to the changes in weight of other organs were observed in rats of either sex. The LOAEL for this study is 1750 ppm boron (124-125 mg B/kg-day) based on testicular atrophy in male rats. The NOAEL for this study is 525 ppm boron (38-42 mg B/kg-day). In a second subchronic study, groups of 10 male Sprague-Dawley rats were fed borax at concentrations of 0.0%, 0.0154%, 0.0463%, 0.154%, and 0.463% of borax (equivalent to 0, 17.5, 52.5, 175, or 525 ppm B, respectively, or 0, 1.3, 4.3, 13.1. or 41 mg B/kg/day, respectively) for 90 days (Weir, 1963). No effect was observed on the testes, clinical signs, body weight, food consumption, food efficiency, organ weights at any dose. The NOAEL for this study was 0.463% (525 ppm B or 41 mg B/kg/day), thus confirming the NOAEL of 525 ppm for the first 90-day study using Sprague-Dawley rats (Weir and Fisher, 1972; Paynter, 1962 a and b). In a subchronic study, five male (7-11 kg) and five female (4-10 kg) Beagle dogs were fed borax or boric acid at concentrations of 17.5, 175, or 1750 ppm for 90 days (Weir and Fisher, 1972; U.S. Borax Research Corp., 1963, 1966, 1967). The boron equivalent doses were 0, 0.34/0.25, 4.1/2.6, or 32/23 mg B/kg/day, respectively, for males/females fed borax and 0, 0.46, 4.2, or 35 mg B/kg/day, respectively, for both sexes fed boric acid (U.S. EPA, 2006). The primary target was the testes; all males in the 1750-ppm group showed evidence of severe testicular atrophy resulting in complete degeneration of the spermatogenic epithelium in 4/5 animals. Evidence indicating breakdown of red blood cells in both sexes, and effect on the thyroid gland of both sexes and the adrenal gland of females were observed at 1750 ppm. The LOAEL for this study was 1750 ppm (23-35 mg B/kg/day) and the NOAEL was 175 ppm (2.6-4.2 mg B/kg/day). The
Boron
May 2008 18
NOAELs and LOAELs in other studies show that the dose-response relationship for testicular toxicity in boron treated-animals is very steep. The 10-fold reduction from the LOAEL to the NOAEL in the dog study, suggests that the dose-response relationship was not adequately characterized 4.2.2 Long-term Exposure In a chronic toxicity study, groups of beagle dogs (4/sex/dose for each compound) were administered borax or boric acid from a dietary admix at concentrations of 58, 117, and 350 ppm boron (1.4, 2.9, and 8.8 mg B/kg-day) for 104 weeks (Weir and Fisher, 1972; U.S. Borax Research Corp., 1966). Four male and four female dogs served as controls for the borax and boric acid dosed animals. This study included a 52-week interim sacrifice and a 13-week “recovery” period following 104 weeks on test article for some dogs. One dog of each sex/dose group was sacrificed at week 52; the remaining three dogs of each sex/dose fed the 58 and 117-ppm diets and two dogs of each sex fed the control and 350-ppm diets were sacrificed after 104 weeks; the remaining dog of each sex fed the control and 350-ppm diets were sacrificed after the recovery period. According to Weir and Fisher (1972), testicular changes were not observed in any dog fed borax or boric acid for 2 years. Sperm samples used for counts and motility testing were taken only from the control and high-dose male dogs prior to the 2-year sacrifice. Tumors were not reported. A LOAEL could not be established from this study; the NOAEL was 350 ppm (8.8 mg B/kg/day). Because feeding boron at concentrations up to 350 ppm had no effect on testes of male dogs, a follow-up study was conducted using a higher dietary concentration. Groups of beagle dogs (4/sex/dose/compound) were given borax or boric acid in the diet at concentrations of 0 and 1170 ppm boron (0 and 29.2 mg B/kg-day) for up to 38 weeks (Weir and Fisher, 1972; U.S. Borax Research Corp., 1967, Weir, 1967). Two controls of each sex were sacrificed after 26 and 38 weeks, and two dogs of each sex per compound were sacrificed at 26 weeks and one of each sex per compound were sacrificed after 38 weeks and after a recovery period of 25 days (Weir, 1967). Weight gain was decreased about 11% throughout the study in test animals when compared with control animals. Sacrifice of two animals from each group at 26 weeks revealed severe testicular atrophy and spermatogenic arrest in male dogs treated with either boron compound. Testes weight, testes weight:body weight ratio, and testes:brain weight ratios were all decreased. Effects on other organs were not observed. Exposure was stopped at 38 weeks; at this time, one animal from each group was sacrificed and the remaining animal from each group was placed on the control diet for a 25-day recovery period prior to sacrifice. After the 25-day recovery period, testes weight and testes weight:body weight ratio were similar to controls in both boron-treated males, and microscopic examination revealed the presence of moderately active spermatogenic epithelium in one of the dogs. The researchers suggested that this finding, although based on a single animal, indicates that boron-induced testicular degeneration in dogs may be reversible upon cessation of exposure. Although the dogs were treated with 1170 ppm for only 38 weeks, the 2-year and 38-week dog studies considered together, established an overall NOAEL of 350 ppm (8.8 mg B/kg/day) based on testicular atrophy/degeneration and spermatogenic arrest observed at the LOAEL of 1170 ppm (29.2 mg B/kg-day) for a 38-week treatment.

Boron
May 2008 19
In another chronic study Sprague-Dawley rats were fed a diet containing 0, 117, 350, or 1170 ppm boron as borax or boric acid for 2 years (Weir and Fisher, 1972, Weir and Crews, 1967). The boron equivalent doses were 0, 5.2, 16, and 58 mg B/kg/day, respectively, for males and 0, 6.3, 19, and 70 mg B/kg/day, respectively, for females administered boric acid and 0, 7.3, 17, or 58 mg/kg/day, respectively, for both sexes administered borax (U.S. EPA, 2006). The control group for both studies had 70 rats/sex and the boron-treated groups had 35 rats/sex. Five rats from each group were sacrificed at 6 and 12 months and the surviving animals were sacrificed after 2 years. No treatment-related effects were observed in rats receiving 350 or 117 ppm boron as borax or boric acid. Clinical signs of toxicity observed at 1170 ppm included swelling and desquamation of the paws, scaly tails, inflammation of the eyelids, and bloody discharge from the eyes. In addition, the scrotum appeared shrunken in male rats fed the 1170-ppm diet. At 1170 ppm, rats receiving both boron compounds had decreased food consumption during the first 13 weeks of study and suppressed growth throughout the study. Males and females fed 1170 ppm as borax gained about 19% and 41% less weight during the 2-year treatment period. Testes weight and the testes:body weight ratio were significantly (p<0.05) and markedly decreased by 80-84% as early as 6 months in males receiving the 1170-ppm diet and remained significantly below that of controls at 12 and 24 months. Brain and thyroid: body weight ratios were significantly (p<0.05) increased at 1170 ppm, but no microscopic changes were observed in these organs. Severe testicular atrophy was observed in all high-dose males at 6 months and at 12 and 24 months. The seminiferous epithelium was atrophied and the tubular size in the testes was decreased in male rats. This study identified a LOAEL of 1170 ppm (58.5 mg B/kg-day) and a NOAEL of 350 ppm (17.5 mg B/kg-day) for testicular effects. This study was designed only to assess systemic toxicity and not carcinogenicity; tumors were not mentioned in the report. Nevertheless, NTP (1987) concluded that this study provided adequate data on the lack of carcinogenic effects of boric acid in rats, and accordingly, conducted its carcinogenicity study only in mice.
In a chronic toxicity study, groups of 50 male and 50 female B6C3F1 mice were fed 0, 2500, or 5000 ppm boric acid (0, 275 and 550 mg boric acid /kg/day or 0, 48 or 96 mg B/kg/day, respectively (NTP, 1987; Dieter, 1994) for 103 weeks. Effects observed at the high dose included reduced body weight in both sexes and testicular atrophy and interstitial cell hyperplasia in males. The LOAEL for this study was 5000 ppm (212 mg B/kg/day) and the NOAEL was 2500 ppm (48 mg B/kg/day). Increased incidences of neoplasms were observed in low-dose male mice but not at the high-dose. Therefore, no evidence of carcinogenicity was observed; the low number of surviving animals may have affected the sensitivity of this study.
4.2.3 Reproductive and Developmental Effects Numerous studies have been conducted on the reproductive and developmental effects of boron compounds. The following discussion focuses on key multigenerational reproduction studies and developmental toxicity studies.
4.2.3.1 Reproductive Effects Linder et al. (1990) examined the time- and dose-response of male rat reproductive endpoints after acute administration of boric acid. In the time-response study, groups of six male Sprague-
Boron
May 2008 20
Dawley rats were administered 0 or 2000 mg boric acid/kg bw (0 or 350 mg B/kg, respectively) by gavage and sacrificed for evaluation of reproductive endpoints at 2, 14, 28, and 57 days after dosing. In the dose-response study, groups of eight male rats were administered 0, 250, 500, 1000, or 2000 mg boric acid/kg (0, 44, 87, 175, or 350 mg B/kg) by gavage and sacrificed 14 days after dosing. In both the time-response and the dose-response studies, the doses were the sum of two doses administered at 9:00 a.m. and 4:00 p.m. on the same day. No treatment-related clinical signs of toxicity were observed during the study; body weight was affected at 2000 mg/kg. Treated male rats lost 9 g during the first 2 days after dosing, whereas control rats gained 1 g; the treated rats made up the difference by day 14 after dosing. Organ weight changes observed in testes, epididymis, prostate, and seminal vesicle weight in the time- and dose-response studies were inconsistent and did not appear to be related to treatment or to be biologically significant. Histopathologic examinations of the testes and epididymis revealed adverse effects on spermiation, epididymal sperm morphology, and caput epididymal sperm reserves. The testicular effects observed in rats dosed with 2000 mg/kg were apparent at 14 days and at 28 days in the time-response study. These effects included retention of Step 19 spermatids in stage IX-XII and occasionally in XIII seminiferous tubules at 14 days and up to Stage X at 28 days in the time-response study. No changes were observed at day 2 or day 57 in the time-response study. Step 19 spermatids are usually released at the end of stage VIII. Accompanying the retention of Step 19 spermatids were residual cytoplasmic bodies in the seminiferous tubular epithelium and testicular debris (sloughed lobes of cytoplasm and immature germ cells) in the caput epididymis. In the dose-response study, no retention of Step 19 spermatids was observed at 250 or 500 mg/kg; however, Step 19 spermatid retention in Stage IX-XII tubules was observed at 1000 and 2000 mg/kg and atypical cytoplasmic lobes of Step 19 spermatids were observed in Stage XIII tubules at 2000 mg/kg. Testicular debris was observed in the epididymis. A significant (p<0.05) increase in the testicular sperm head count per testis and per g testis was observed in the 2000-mg/kg group at day 14 in the time-response study but not in the dose-response study. Caput sperm reserves were significantly decreased in the 2000-mg/kg group on day 14 of each study and in the 1000-mg/kg group in the dose-response study. There was a significant decrease in the percent normal sperm at 1000 and 2000 mg/kg, a significant increase in the percentage of abnormal caput epididymal sperm (head or tail defects, p<0.05) at 1000 and 2000 mg/kg. The increased percentage of abnormal sperm heads also was observed on day 28 of the time-response study. The only effects observed on cauda sperm morphology and motility was a significant increase in the percentage of head and tail defects, a decrease in the percent of progressively motile caudal sperm, and sperm velocity on day 28 of the time-response study. The LOAEL for male reproductive toxicity after acute administration of boron to rat was 1000 mg/kg bw (175 mg B/kg bw) and the NOAEL was 500 mg/kg bw (87 mg B/kg bw) based on effects on spermiation and sperm measures.
Dixon et al. (1976) showed that a single dose of borax (0, 45, 150, or 450 mg B/kg) had no effect on fertility of male Sprague-Dawley rats when assessed in serial mating trials using virgin females. Administration of borax in drinking water (0, 0.3, 1.0, or 6.0 mg B/L of water, equivalent to 0, 0.042, 0.14, or 0.84 mg B/kg/day, respectively) for 30, 60, or 90 days had no effects on reproductive parameters or on plasma follicle stimulating hormone (FSH) or

Boron
May 2008 21
luteneizing hormone (LH) or body, testes, epididymis, prostate, or seminal vesicle weights (Dixon et al., 1976). In another study (Dixon et al., 1979; Lee et al., 1978), borax was administered to groups of 18 male Sprague Dawley rats in feed at 0, 500, 1000, or 2000 ppm boron (0, 25, 50, and 100 mg B/kg/day, respectively, based on a food factor of 0.05) for 30 or 60 days. Although Lee et al. (1978) reported the dose values for 500, 1000 and 2000 ppm as 12.5, 25 and 50 mg boron ingested/day, it is not clear that is adjusted to body weight. No data on food consumption was reported in the study. The estimated boron intake values of 0, 25, 50, and 100 mg B/kg/day using the default food conversion factor of 0.05 are closer to the doses reported by the study author than would have been derived using the default food conversion factor of 0.1 for the subchronic studies. A small decrease in epididymis weight was observed at 1000 and 2000 ppm after treatment for 30 days and decreases in liver, testes, and epididymides were observed after 60 days. Plasma FSH was elevated at all doses in a dose- and time related manner but was not accompanied by testicular changes at 500 ppm and is not considered adverse at this dose. Testicular morphology was adversely affected resulting in reduced spermatocytes, spermatids, and spermatozoa at 1000 ppm and more severe effects at 2000 ppm after 30 days. Evidence of more severe morphological changes was observed in the testes of rats receiving 1000 and 2000 ppm boron for 60 days. The morphological changes were associated with reduction in specific activities of the hyaluronidase, sorbitol dehydrogenase, and lactate dehydrogenase-X, markers of postmeiotic germ cells and increase in specific activities of glyceraldehyde3-phosphate and malate dehydrogenase, probable markers of sertoli and spermatogonial cells (premeiotic germ cells). Fertility was reduced for 3 weeks in the 1000-ppm group of male rats mated after the end of the 30-day treatment period and for 8 weeks when mated after the end of the 60-day treatment period. Germinal aplasia and fertility persisted 32 weeks after the cessation of boron exposure at 2000 ppm. Fertility was not affected at 500 ppm. Therefore, the LOAEL for this study was 1000 ppm (50 mg B/kg/day) based on testicular toxicity and the NOAEL was 500 ppm (25 mg B/kg/day).
Ku et al. (1993) and Chapin and Ku (1994) compared testis boron dosimetry to lesion development. Fischer 344 rats were fed 0, 3000, 4500, 6000, or 9000 ppm boric acid (0, 545, 788, 1050, or 1575 ppm boron) for up to 9 weeks and examined. Based on food intake and body weight data, the investigators estimated the daily intake of boron as <0.2, 26, 38, 52, or 68 mg B/kg-day. Recovery was assessed 32 weeks post-treatment. Spermiation was inhibited at 3000 and 4500 ppm, and decreased testes weight and testicular atrophy was observed at 6000 and 9000 ppm. Severely inhibited spermiation at 4500 ppm was resolved by 16 weeks post-treatment, but some areas of focal atrophy in the 6000 and 9000 ppm dose groups persisted post-treatment. In a range-finding study, Chapin and Ku (1994) reported no signs of microscopic testicular damage in male rats administered 2000 ppm boric acid in the diet for 9 weeks. Therefore, the LOAEL was 26 mg B/kg-day was based on inhibition of spermiation and the NOAEL from the range-finding study was17 mg B/kg/day. The LOAEL was 52 mg/kg/day and the NOAEL was 38 mg/kg/day, based on decreased testes weight and testicular atrophy,. The mean testicular boron level associated with inhibited spermiation was 5.6 μg B/g tissue and 11.9 μg B/g tissue for testicular atrophy. These results suggest separate mechanisms for these effects based on testis boron concentration. It also should be noted that the dose-response relationships
Boron
May 2008 22
for inhibited spermiation and testicular atrophy are very steep as indicated by the small differences between the NOAELs and LOAELs for each endpoint.
In continuous breeding study, the effects of boric acid on reproduction were examined in groups of 20 male and 20 female 11-week old Swiss CD-1 F0 mice fed a diet containing 1000, 4500, or 9000 ppm boric acid (Fail et al., 1990, 1991). The control group contained 40 mice of each sex. The estimated doses were 152, 636, and 1260 mg/kg/day (26.6, 111, and 220 mg B/kg/day) for males and 182, 846, and 1660 mg/kg/day (31.8, 152, and 257mg B/kg/day) for females in the 1000-, 4500-, and 9000-ppm group, respectively (Fail et al., 1991). After 1 week of treatment, the F0 mice were allowed to mate continuously for 14 weeks (cohabitation phase) and separated for 6 weeks to allow the dams to deliver and rear their last litter. After the separation period, F0 males and females from the 4500-ppm group were cross-mated with control mice and sacrificed after weaning their litters, and the F1 mice were maintained on the same diet as their parents, mated to non-sibling mice in the same dose group, and sacrificed after evaluation of the F2 litters. Weight gain and food consumption was decreased in F0 males and females in the 9000-ppm group, and water consumption was increased in the 4500- and 9000-ppm F0 mating pairs. The 9000-ppm group produced no litters and the 4500-ppm group produced only four litters. In a cross-over mating study, mating and fertility indices were significantly decreased in the 4500-ppm male × control female group, but was unaffected in the control male × 4500 ppm female mating pairs. The pup body weight from the control male × 4500 ppm female pairs were significantly reduced, the dams also weighed significantly less on postnatal day (PND) 0 and had a slightly longer gestation period. Necropsy examination showed evidence of testicular toxicity in F0 males at 4500 and 9000 ppm. The 1000-ppm group was used to produce the F2 generation. The mating and fertility indices, number of live pups/litter, proportion of pups born alive, and sex ratio were not affected by treatment with 1000 ppm boric acid, but the litter-adjusted body weight of the F2 pups was significantly decreased relative to controls. A marginally significant (p=0.053) effect was observed on epididymal sperm concentration; sperm motility and morphology were not significantly affected. The LOAEL for this study is 1000 ppm boric acid (26.6 and 31.8 mg B/kg-day for males and females, respectively). A NOAEL was not identified.
4.2.3.2 Developmental Effects
Groups of 29 time-mated Sprague-Dawley female rats were administered diets containing 0, 0.1, 0.2, or 0.4% boric acid from gestation day (GD) 0-20 (Heindel et al., 1994, 1992; Price et al., 1990). Additional groups of 14 rats were administered diets containing 0 or 0.8% boric acid in the diet on GD 6-15 only. The average daily boric acid intake reported by the investigators was 0, 78, 163, 330, and 539 mg boric acid/kg/day (equivalent to 0, 13.6, 28.5, 57.7, and 94.2 mg B/kg-day) at 0, 0.1, 0.2, 0.4, and 0.8%, respectively. Rats were exposed to 0.8% to provide a greater opportunity for observing developmental effects on the fetus, because the range-finding study found that treatment with the 0.8% diet on GD 0-20 resulted in a decrease in pregnancy rate and an increase in resorption rate per litter. Food and water intake, body weight, and clinical signs of toxicity were monitored throughout gestation. The animals were sacrificed and the fetuses were evaluated for effects on weight and for external, visceral, and skeletal malformations. The only maternal effects observed were decreased food and water intake and a significant increase in kidney weight at 0.8%, a significant increase in relative liver and kidney
Boron
May 2008 23
weight at 0.2-0.8%, and minimal nephropathy, the incidence and severity of which was not dose related.
Developmental effects were observed at all dietary concentrations tested (Heindel et al., 1992, 1994). The percentages of resorptions and late fetal deaths were significant increased and the number of live fetuses/litter was significantly decreased at 0.8%. Average fetal body weight was significantly reduced in all treated groups. The percentage of litters with at least one malformed fetus, the percentage of litters with skeletal malformations were significantly increased at 0.2-0.8%, the percentage of litters with visceral malformation was significantly increased at 0.4 and 0.8% and the percentage of litters with gross malformations was significantly increased at 0.8%. The malformations consisted primarily of anomalies of the eyes, the central nervous system (CNS), the cardiovascular system, and the axial skeleton. The most common visceral malformation was enlarged lateral ventricles of the brain and the most common skeletal malformations involved the ribs (agenesis and shortening of rib XIII). Variations that showed the greatest increased incidence was incomplete ossification of the ribs and unilateral or no ossification of the thoracic centrum at 0.8% and wavy ribs at 0.2% and 0.4%. Overall, the percentage of litters with one or more adversely affected implants (non-live implants plus malformed fetuses) was significantly increased at all doses. Based on the changes in organ weights, the maternal LOAEL was 0.2% boric acid in the feed (28.5 mg B/kg-day) and the maternal NOAEL was 0.1% 1(3.6 mg B/kg-day). Based on the decrease in fetal body weight and increased percentage of litters with one or more affected implants, the LOAEL for developmental toxicity was 0.1% boric acid (13.6 mg B/kg-day); a NOAEL was not defined.
In a follow-up study to establish a NOAEL for developmental toxicity, Price et al. (1996a, 1994) administered boric acid in the diet to 60 timed-mated CD rats per group from GD 0-20 at 0, 0.025, 0.050, 0.075, 0.100, or 0.200%. The average intake of boric acid was 0, 18.6, 36.2, 55.1, 75.9, and 142.9 mg/kg/day (equivalent to 3.3, 6.3, 9.6, 13.3, and 25.0 mg B/kg/day), respectively, for Phase l dams and 0, 18.5, 37.2, 55.7, 74.0, and 144.6 mg/kg/day (equivalent to 0, 3.2, 6.5, 9.7, 12.9, and 25.3 mg B/kg/day), respectively, for Phase II dams. Phase I animals were terminated on GD 20 and Phase II dams were allowed to rear their offspring until weaning (postnatal day 21) for evaluation of postnatal development.
No treatment-related adverse effects were observed in maternal animals. Boric acid treatment of dams adversely affected prenatal development of fetuses, and some effects persisted postnatally in the offspring (Price et al., 1994, 1996a). Male and female fetuses in the 0.1 and 0.2% groups weighed significantly less than control fetuses on GD 20. On GD 20, the incidence of litters with short rib XIII was increased at 0.1% and significantly increased at 0.2% and the incidence of litters with wavy ribs/wavy rib cartilage was significantly increased at 0.1% and 0.2%. The LOAEL for maternal toxicity was not determined because no toxicity was observed. The LOAEL for prenatal developmental toxicity was 0.1% boric acid (13.3 mg B/kg-day), based on decreased fetal body weight. The NOAEL was 0.075% boric acid (9.6 mg B/kg-day).
During postnatal development, offspring body weight was not significantly affected at birth or up to weaning. The percent dead pup/litter was increased from PND 0-4 but not after PND 4. The number of live pups/litter was not affected on PND 21 suggesting that the increase in pup death from PND 0-4 did not produce an overall adverse outcome. The litter incidence of skeletal

Boron
May 2008 24
malformations was significantly increased at 0.025% and 0.2% because of a significantly increased litter incidence of short rib XIII. These findings did not show a clear dose-related trend and may not be treatment related. The investigators reported that the NOAEL during the postnatal developmental phase was 0.1% (12.9 mg B/kg-day) based on increased litter incidence of short rib III. Price et al. (1997) collected maternal whole blood on GD 20 from the confirmed Phase I pregnant rats previously described by Price et al. (1996a, 1994); the dietary concentration of boric acid yielded average daily boron intakes equivalent to 0, 3.3, 6.3, 9.6, 13.3, or 25.4 mg B/kg bw/day. The concentration of boron in maternal blood correlated with indices of maternal dietary intake of boron (r2 = 0.7) and with decreases in fetal body weight (r2 = 0.34) (Price et al., 1996a, 1994). Blood boron concentrations of 1.27 ± 0.298 and 1.53 ± 0.546 μg boron/g were associated with the NOAEL (9.6 mg B/kg-day) and the LOAEL (13.3 mg B/kg-day) for developmental toxicity in the study reported by Price et al. (1996a, 1994).
Heindel et al. (1994, 1992) and Field et al. (1989) examined the developmental effects of boric acid in groups of 28 or 29 pregnant CD-1 mice fed diets containing 0, 0.1, 0.2, or 0.4% boric acid ( 0, 248, 452, or 1003 mg boric acid/kg-day or 0, 43.4, 79.0, or 175.3 mg B/kg-day) from GD 0-17. A significant increase in the incidence of maternal renal tubular dilation and/or regeneration was observed in the 0.2% and 0.4% dosage groups. Average fetal body weight/litter was decreased at 0.2% and 0.4% and malformations (short rib XIII) were observed among fetuses of the 0.4% group. The 0.1% level (43.4 mg B/kg-day) is the NOAEL and the 0.2% level (79 mg B/kg-day) is the maternal LOAEL for maternal and developmental toxicity based on renal effects in maternal animals and decreased body weight in the fetuses.
In New Zealand White rabbits (30/group) administered boric acid (0, 62.5, 125, and 250 mg/kg/day or 0, 10.9, 21.9, and 43.7 mg B/kg/day) by gavage on GD 6-19, maternal effects related to boron administration included vaginal bleeding and developmental effects included increased prenatal mortality, percentage of pregnant females with no live fetuses, number of live fetuses per litter, incidence of live fetuses with malformations (cardiovascular defects primarily interventricular septal defect), and decreased fetal body weight at 250 mg/kg/day (Price et al., 1996b, 1991; Heindel et al., 1994). No developmental effects were found at 62.5 or 125 mg/kg/day. In this study, the mid dose of 125 mg boric acid/kg-day (21.9 mg B/kg-day) represents the NOAEL based on maternal and developmental effects. The high dose of 250 mg boric acid/kg-day (43.7 mg B/kg-day) is the LOAEL. 4.2.4 Genotoxicity
Results from most short-term mutagenicity studies indicate that boron is not genotoxic. In the streptomycin-dependent Escherichia coli Sd-4 assay, boric acid was either not mutagenic (Iyer and Szybalski, 1958; Szybalski, 1958) or produced equivocal results (Demerec et al., 1951). In Salmonella typhimurium strains TA1535, TA1537, TA98, and TA100, boric acid was not mutagenic in the presence or absence of either a rat or hamster liver S-9 activating system (Benson et al., 1984; Haworth et al., 1983; NTP, 1987). Boric acid (concentration, stability, and purity not tested by investigators) was also negative for mutagenicity in the Salmonella microsome assay using strains TA1535, TA1537, TA1538, TA98, and TA100 in both the
Boron
May 2008 25
presence and absence of rat liver metabolic activation (Stewart, 1991). Although a positive result was reported both with and without metabolic activation for induction of β-galactosidase synthesis (a response to DNA lesions) in E. coli PQ37 (SOS chromotest) (Odunola, 1997), this is an isolated finding at present.
Results from in vitro mammalian mutagenicity test systems were all negative. Boric acid (concentration and purity not reported by investigators) was negative in inducing unscheduled DNA synthesis in primary cultures of male F344 rat hepatocytes (Bakke, 1991). Boric acid did not induce forward mutations in L5178Y mouse lymphoma cells with or without S-9 (NTP, 1987). Boric acid did not induce mutations at the thymidine kinase locus in the L5178Y mouse lymphoma cells in either the presence or absence of a rat liver activation system (Rudd, 1991). Crude borax ore and refined borax were both negative in assays for mutagenicity in V79 Chinese hamster cells, C3H/1OT1/2 mouse embryo fibroblasts, and diploid human foreskin fibroblasts (Landolph, 1985). Similarly, boric acid did not induce chromosome aberrations or increase the frequency of sister chromatid exchanges in Chinese hamster ovary cells with or without rat liver metabolic activating systems (NTP, 1987).
O'Loughlin (1991) performed a micronucleus assay on Swiss-Webster mice (10 animals/sex/dose). Boric acid in deionized water was administered orally (no verification of concentration or homogeneity was made of the boric acid by the investigators) for 2 consecutive days at 900, 1800 or 3500 mg/kg. Five mice/sex/dose were sacrificed 24 hours after the final dose, and 5/sex/dose were sacrificed 48 hours after the final dose. A deionized water vehicle control (10/sex) and a urethane positive control (10 males) were also tested. Boric acid did not induce chromosomal or mitotic spindle abnormalities in bone marrow erythrocytes in the micronucleus assay in Swiss-Webster mice.
4.2.5 Carcinogenicity
NTP (1987) considered the Weir and Fisher. (1972) long-term study described in Section 4.2.2 adequate for evaluating the carcinogenicity of boron in rats. Weir and Fisher (1972) showed no treatment-related neoplasms in rats administered 1170 ppm boron as boric acid or borax in the feed.
In the chronic study, male and female (50/sex/group) B6C3F1 mice were fed a diet containing 0, 2500, or 5000 ppm boric acid for 103 weeks (NTP, 1987; Dieter, 1994). The low-and high-dose diets provided approximate doses of 485 and 1211 mg/kg/day (85 and 212 mg B/kg/day), respectively. Low-dose male mice had increased incidences of hepatocellular carcinoma and adenoma/carcinoma combined relative to control and the high-dose male mice. The incidence) in low-dose mice was significantly increased when tested by the life-table test but not the more appropriate incidental tumor test, and the incidence was within range of historical controls. Therefore, NTP (1987) concluded that the increase in hepatocellular tumors in low-dose male mice was not caused by administration of boric acid. The incidence of fibromas, sarcomas, fibrosarcomas, and neurofibrosarcomas combined in subcutaneous tissue was significantly increased in low-dose male mice when analyzed by both incidental and life table pair-wise tests (NTP, 1987; Dieter, 1994). The incidence of subcutaneous tissue tumors was within range of historical controls for group-housed male mice from other dosed feed studies (Elwell, 1993).

Boron
May 2008 26
Based on the comparison to historical controls and lack of any increase in the high-dose group, the increase in subcutaneous tumors in low-dose male mice is not considered compound-related. NTP (1987) concluded that there was no evidence of carcinogenicity of boric acid at doses of 2500 or 5000 ppm for in male or female mice; the low number of surviving males may have reduced the sensitivity of the study.
4.3 Proposed Mode of Action
The occurrence of testicular toxicity in the absence of other overt systemic toxicity (see Section 4.2.4) suggests a testicular-specific mechanism of action for boron. Many studies have been conducted to elucidate the mechanism by which boron produces testicular lesions. This work has been reviewed by Fail et al. (1998) and ECETOC (1994). Despite the number of studies that have been conducted, the mechanism of boron testicular toxicity remains unknown. The available data suggest an effect on the Sertoli cell, resulting in altered physiological control of sperm maturation and release (Fail et al., 1998).
Studies regarding the mechanism of developmental toxicity produced by boron also were reviewed by Fail et al. (1998). The two most sensitive effects of boron on developing rodents are decreased fetal body weight and malformations and variations of the ribs. Fail et al. (1998) concluded that reduced fetal growth probably results from a general inhibition of mitosis produced by boric acid, as documented in studies on the mammalian testis, insects, yeast, fungi, bacteria, and viruses (Beyer et al., 1983; Ku et al., 1993), while the rib malformations may be due to direct binding of boron to the bone tissue. More recent investigations of the developmental effects of boric acid (Narotsky et al., 2003; Wery et al., 2003) have produced evidence supporting a role for altered gene expression in developmental effects of boron. These data indicate that boric acid administration during the normal period of expansion of hox gene expression results in rib and vertebrae alterations, coincident with altered hox gene expression.

Boron
May 2008 27
5.0 QUANTIFICATION OF TOXICOLOGICAL EFFECTS HAs describe nonregulatory concentrations of drinking water contaminants at which adverse health effects are not anticipated to occur over specific exposure durations. HAs are developed for both short-term and long-term (Longer-term and Lifetime) exposure periods based on data describing noncarcinogenic endpoints of toxicity. Short Term exposures can include One-day and Ten-day exposure periods. One-day and Ten-day HAs use parameters that reflect exposures and effects for a 10 kg child consuming 1 liter of water per day. A Longer-term HA covers an exposure period of approximately 7 years, or 10 percent of an individual's lifetime. Longer-term HAs can incorporate parameters for either a child (10 kg body weight consuming 1 liter per day water) or an adult (70 kg body weight consuming 2 liters per day water) parameters A Lifetime HA covers an individual lifetime, approximately 70 years. A Lifetime HA considers a 70 kg adult consuming 2 liters of water per day. The Lifetime HA is considered protective of non-carcinogenic adverse health effects over a lifetime exposure. A relative source contribution from water is also factored into the lifetime HA calculation to account for exposures from other sources (air, food, soil, etc) of the contaminant. For those substances that are “Carcinogenic to Humans” or “Likely To be Carcinogenic to Humans” (US EPA, 2005a), known (Group A), or probable (Groups B1 and B2) human carcinogens (U.S. EPA, 1986a), the development of a Lifetime Health Advisory is not recommended. A Lifetime HA can be calculated for substances that are possible carcinogens (U.S. EPA, 1986) or provide "Suggestive Evidence of Carcinogenicity, but Not Sufficient to Assess Human carcinogenic Potential" (U.S. EPA 2005). The One-day, Ten-day, or Longer-term HA is derived using the following formula:
HA = NOAEL or LOAEL x BW UF x DWI
Where: NOAEL or LOAEL = No- or Lowest-Observed-Adverse-Effect Level (in mg/kg bw/day)
from a study of an appropriate duration BW = Assumed body weight of a child (10 kg) or an adult (70 kg). UF = Uncertainty factor in accordance with EPA guidelines DWI = Assumed human daily consumption for a child (1 L/day) or an
adult (2 L/day) The Lifetime HA is calculated in a three-step process: Step 1: Adopt a pre-existing Reference Dose (RfD or calculate an RfD using the following equation:

Boron
May 2008 28
RfD = NOAEL, LOAEL or BMDL UF
Where: NOAEL or LOAEL = No- or Lowest-Observed-Adverse-Effect Level (in mg/kg bw/day).BMDL = Lower confidence bound on the Bench Mark Dose (BMD). The
BMD and BMDL are obtained through modeling of the dose-response relationship.
UF = Uncertainty factor established in accordance with EPA guidelines. The RfD is an estimate (with uncertainty spanning perhaps and order of magnitude) of a daily human exposure to the human population (including sensitive subgroups) that is likely to be without an appreciable risk of deleterious effects during a lifetime. It can be derived from a NOAEL, LOAEL, or benchmark dose with uncertainty factors generally applied to reflect limitations in the data used. Step 2: Calculate a Drinking Water Equivalent Level (DWEL) from the RfD . The DWEL assumes that 100% of the exposure comes from drinking water.
DWEL = RfD x BW DWI
Where: RfD = Reference Dose (in mg/kg bw/day). BW = Assumed body weight of an adult (70 kg). DWI = Assumed human daily consumption for an adult (2 L/day)
Step 3: The Lifetime HA is calculated by factoring in other sources of exposure (such as air, food, soil) in addition to drinking water using the relative source contribution (RSC) for the drinking water.
Lifetime HA = DWEL x RSC Where: DWEL = Drinking Water Equivalent Level (calculated from step 2) RSC = Relative source contribution
Note. The procedure for establishing the RSC is described in U.S. EPA (2000) Human Health Methodology (pages 4-5 to 4-17). The methodology can be accessed at: http://www.epa.gov/waterscience/criteria/humanhealth/method/complete.pdf 5.1 One-day Health Advisory for Children No suitable study is identified from the literature to derive the one day health advisory for the children. It is recommended that the 10-day health advisory be adopted for the one-day health advisory for children.

Boron
May 2008 29
5.2 Ten-day Health Advisory for Children Several relevant studies are available for deriving the ten-day Health Advisory for children. The most sensitive targets for boron toxicity are the testes and the developing fetus,i.e., males and pregnant females are the most sensitive individuals in the population. No specific toxicity has been observed in non-pregnant females that would suggest that non-pregnant females are more sensitive to boron than males. Therefore, the HA developed from studies in males would be protective of females. Since exposure during fetal development is not relevant to pre-puberal children, developmental toxicity studies are not considered for deriving the ten-day Health Advisory. The studies that could be relevant to a 10-kg child include: a 14-day study in mice that established NOAEL/LOAEL values of 219/437 mg B/kg/day based on one death, forestomach lesions, and decreased body weight (NTP, 1987); a 90-day study in mice that established the NOAEL/LOAEL values of 34/70 mg B/kg/day based on extramedullary hematopoiesis (peripheral production of red blood cells) (NTP, 1987; Dieter, 1994); a 30-/60-day study using rats that established NOAEL/LOAEL values of 25/50 mg B/kg/day based on decreased epididymis weight, germinal aplasia and changes in marker enzymes associated with spermatogenic cells in rats (Dixon et al., 1979; Lee et al., 1978); a 90-day study using rats that established a NOAEL/LOAEL of 38 and 124 mg/kg/day, respectively, based on testicular toxicity (Weir and Fisher, 1972, Paynter 1962a and b); and a 9-week study in rats that established a NOAEL/LOAEL of 38/52 mg/kg/day based on decreased testes weight and irreversible testicular atrophy (Ku et al.,1993 and Chapin and Ku, 1994). Weir and Fisher (1972) reported degeneration of the spermatogenic epithelium and testicular atrophy at 30 mg B/kg/day (LOAEL) in Beagle dogs treated with borax or boric acid for 90 days and a NOAEL of 3.9 mg B/kg/day. Because of the steep dose-response relationship for testicular toxicity in other studies; a tenfold reduction in the next dose level may not be a good approximation of the highest NOAEL for testicular toxicity in dogs. Ku et al. (1993) described a 9-week study in male rats that established a NOAEL/LOAEL of 17/ 26 mg B/kg/day based on inhibition of spermiation (spermatocyte production and sperm maturation). However, this endpoint is not relevant to the child because spermatocyte maturation and sperm production is initiated only at puberty in humans. For deriving the 10 day HA, the study by Dixon et al. (1979) and Lee et al. (1978) was selected because the study addressed the sensitive endpoint for boron, conducted in appropriate species, provided lowest LOAEL, and addressed the steep dose response effects of boron for testicular toxic effects. Further, the study selected for 10-day HA using Sprague Dawley rats is supported by another subchronic study using alternate rat strain, i.e., Fisher rats (for decreased testes weight and irreversible testicular atrophy (Ku et al. 1993 and Chapin and Ku 1994). The subchronic studies in mice (NTP, 1987 and Dieter, 1994) and rats (Weir and Fisher, 1972, Paynter 1962a and b) are not suitable since the LOAELs were higher than the study selected for the 10-day HA. There is compelling lines of evidence to suggest that the testicular morphological effects reported in young rats (200 g) and/or adult rats are applicable for the children. 1) Boron is identified as a potent Sertoli cell toxicant and it is known to disrupt Sertoli cell – germ cells

Boron
junctions (Richburg et al., 1997). 2) Development and population with spermatocytes and the highly interdependent Sertoli cells occur prepubertally in both rodents (postnatal days 10-28 in mouse, 17-25 in rat) and humans (age 4-12 years) (Bustos-Obregon et al., 1975). Spermatogenic stem cells are found in 2-year old boys, spermatocytes and immature Sertoli cell interactions in 4-year olds (Yuasa et al., 2001). Spermatogenic lesions associated with Sertoli cell toxicity include delayed spermiation and irreversible germ cell depletion (i.e. seminiferous tubule atrophy or Sertoli cell only appearing tubules) and compromised FSH-induced signaling. Therefore, exposure to boron between birth and puberty may result in significantly reduced numbers of Sertoli cells and /or Sertoli cells that fail to display all facets of differentiated function that would consequently affect testicular function. The Ten-day HA for a 10-kg child is calculated as follows: 25mg B / kg / day x10kgTen − day HA= ( ) = (2.5mg B / L (3.0 mg B / L) 100 x1 L / day Where: 25 mg/kg/day = NOAEL for testicular toxicity in male rats (Dixon et al., 1979) 10 kg = assumed body weight of a child. 100 = uncertainty factor, chosen for interspecies and intraspecies adjustments
(10 each) in accordance with NAS/OW guidelines 1 L/day = assumed daily water consumption of a child. 5.3 Longer-term Health Advisory The Longer-term HA for Children The chronic (2-year study) toxicity study established a NOAEL of 17.5 mg B/kg/day (350 ppm B) and a LOAEL of 58 mg B/kg/day (1170 ppm B) based on testicular toxicity (Weir and Fisher, 1972; Weir and Crews, 1967). Section 5.2 has the rationale for considering testicular atrophy an appropriate endpoint for developing HA for children. The duration of this study is appropriate for the Longer-term HA for the 10-kg child because markedly decreased testes weight and severe testicular atrophy were observed as early as 6 months at 58 mg B/kg/day, suggesting that the latency for development of these lesions was much earlier than 6 months. The 90-day rat study (Weir and Fisher, 1972; Paynter, 1962a and b; Weir, 1963) was considered but not used, because the NOAEL/LOAEL (40/124 mg B/kg/day) was higher than that of the chronic study. The subchronic dog study was considered, but not used for the longer-term HA for the 10-kg child, because the dose-response relationship was not well-characterized by doses selected for this study. The chronic study in dogs was not considered but not used, because this study did not establish a NOAEL/LOAEL and the follow-up 38-week study had too few (only one or two) dogs sacrificed at each time point. Therefore, the chronic study in rats served as the basis for the Longer-term HA for the 10-kg child. The longer-term HA was developed from a study using males; since, testicular toxicity in males is the most sensitive endpoint relevant to children, the HA would be protective of female children.
May 2008 30
Boron
May 2008 31
For a 10-kg child, the Longer-term HA is calculated as follows:
(17.5mg B / kg / day) x (10kg)Longer − term HA= [ ]= (1.8mg B / L (2.0mg B / L (100) x (1 L / day)
Where: 17.5 mg/kg/day = NOAEL for testicular toxicity in rats exposed to boron (Weir and
Fisher, 1972) 10 kg = assumed human body weight. 100 = uncertainty factor, chosen for interspecies and intraspecies adjustments
(10 each) in accordance with NAS/OW guidelines 1 L/day = assumed daily water consumption of a child. The Longer-term HA for Adults The combined studies by Heindel et al. (1992) and Price et al. (1996a) served as the basis for the Longer-Term HA for boron for adults. In these studies, the NOAEL for boron-induced developmental toxicity in rats fed boric acid in the diet from GD 0-20 was not established in the Heindel et al. (1992) study so a follow-up study was performed by Price et al. (1996a) to establish the NOAEL. The NOAEL based on the two studies was 9.6 mg B/kg/day in dam fed a diet containing 0.075% boric acid. Allen et al. (1996) conducted a benchmark dose (BMD) analysis of these two studies (Heindel et al., 1992; Price et al., 1996a) and determined the most sensitive endpoint for the point-of-departure (POD), which was fetal body weight. The BMDs derived using the other developmental endpoints (total malformations, enlarged lateral ventricles in the brain, shortening of rib XIII, and variations of the first lumbar rib) were higher. EPA (U.S. EPA, 2004) used the BMD approach developed by Allen et al. (1996) as the basis for deriving the reference dose (RfD) for boron. It is appropriate to use the same approach for developing the health advisory instead of the NOAEL established from the Price et al. (1996a) study. The benchmark response (BMR) for the Allen et al. (1996) BMD analysis was a 5% decrease in fetal body eight. This BMR was considered appropriate because it is approximately equivalent to a 0.5 standard deviation decrease in the control mean, or an extra risk of about 5% of an exposed population having litters with mean fetal body weights less than those of 98% of the control population (U.S. EPA, 2004). Allen et al. (1996) conducted a BMD analysis of decreased fetal body weight for the Heindel et al. (1992) and the Price et al. (1996a) data separately and as a combined data set. The mean fetal body weights and doses of boric acid are reported in Table 2 and the resulting BMD and BMDL values along with statistical results are reported in Table 3. The BMDL of 10.3 mg B/kg/day (converted to boron equivalent) from the combined studies is used as the POD for developing the Longer-term adult HA. The BMDL for the combined studies is similar to the NOAEL (9.6 mg B/kg/day) from the Price et al. (1996a) study and the BMDL for the individual studies. A chemical-specific adjustment factor of 66 was applied to the BMDL. The chemical specific adjustment factor should protect the public from excessive exposure without jeopardizing the potential beneficial effects of boron (Murray and Schlekat, 2004).
)

Boron
May 2008 32
TABLE 2. Fetal Weight Analysis Data
Fetal Weight (litter mean ± std dev, in g) Dose of Boric Acid
(mg/kg/day) Heindel et al., 1992 Price et al., 1996a, 1994
0 3.70 ± 0.32 3.61 ± 0.24
19 ─ 3.56 ± 0.23
36 ─ 3.53 ± 0.28
55 ─ 3.50 ± 0.38
76 ─ 3.38 ± 0.26
78 3.45 ± 0.25 ─
143 ─ 3.16 ± 0.31
163 3.21 ± 0.26 ─
330 2.34 ± 0.25 ─ Source: U.S. EPA (2004) adapted from Allen et al., 1996. TABLE 3. Results of BMD Analysis
Dose Corresponding to BMRd Study Significant
Trenda
Max LLb Goodness-of-fit
p-valuec BMDe
(mg BA/kg/day)f
BMDLg
(mg BA/kg/day)f
Heindel et al., 1992 Yes 141.74 0.24 80 (14.0) 56 (9.8)
Price et al., 1996a, 1994 Yes 215.87 0.89 68 (11.9) 47 (8.2)
Combined − 353.43 0.58 78 (13.7) 59 (10.3) Source: U.S. EPA, 2004 aTested for trend by Mantel-Haenszel trend test. A significant trend corresponds to a p-value less than 0.05. Combined study results were not tested for trend. bMaximum value of the log-likelihoods of the models fit to the data, ignoring constant terms not related to parameter estimates. The Max LL for the studies combined is not significantly different (p=0.01) from the sum of the Max LL values for the studies individually, indicating that the data are consistent with a single dose-response curve. cSignificant fit of the model to the data is indicated by p-value >0.05. dBMR = benchmark response, a 5% decrease in the mean fetal weight per litter. eBMD = benchmark dose, maximum likelihood estimate of the dose at the BMR. fDoses in boron equivalents are in parentheses. gBMDL = 95% lower confidence limit on the BMD.

Boron
For an adult, the Longer-term HA is calculated as follows:
(10.3mg B / kg / day) x (67 kg)Longer − term HA= [ ]= (5.2mg B / L (5.0 mg B / L (66) x (2 L / day)
Where: 10.3 mg B/kg/day = BMDL for decreased fetal body weight in rats exposed during
gestation (Heindel et al., 1992; Price et al., 1996a) 67 kg = assumed human body weight (pregnant women). 66 = data-derived adjustment factor replacing the default uncertainty factors
for interspecies and intraspecies components of the uncertainty factors. The data-derived adjustment factor is a product of the following: AFAK (interspecies toxicokinetic adjustment factor) = 3.3 replaces the default of 3.16; AFAD (interspecies toxicodynamic adjustment factor) = 3.16, the default value; AFHK (intraspecies toxicokinetic adjustment factor) = 2.0, replaces the default of 3.16; AFHD (intraspecies toxicodynamic adjustment factor) = 3.16, the default value (U.S. EPA, 2004).
2 L/day = assumed human daily water consumption. 5.4 Lifetime Health Advisory The Reference Dose as established by USEPA (2004) and described above for the Longer-Term adult HA is used as the basis of the lifetime HA
10.3mg B / kg / dayRfD = = 0.16mg / kg / day (rounded to 0.2mg/kg/day)
66
Where:
10.3 mg B/kg/day = BMDL for decreased fetal body weight in rats exposed during gestation (Heindel et al., 1992; Price et al., 1996a)
66 = data-derived adjustment factor replacing the default uncertainty factors for interspecies and intraspecies components of the uncertainty factors. The data-derived adjustment factor is a product of the following: AFAK (interspecies toxicokinetic adjustment factor) = 3.3 replaces the default of 3.16; AFAD (interspecies toxicodynamic adjustment factor) = 3.16, the default value; AFHK (intraspecies toxicokinetic adjustment factor) = 2.0, replaces the default of 3.16; AFHD (intraspecies toxicodynamic adjustment factor) = 3.16, the default value (U.S. EPA, 2004).
A Drinking Water Equivalent Level (DWEL) can be derived from the oral RfD as follows:
(0.2 mg B / kg / day)(67kg)DWEL = =6.7 mg / L (rounded to 7.0 mg / L)
2L / day
May 2008 33
)

Boron
Where: DWEL = Drinking Water Equivalent Level RfD = 0.2 mg/kg bw/day. BW = assumed body weight for pregnant women (67 kg). The Lifetime HA is calculated as follows:
Lifetime HA= (6.7mg / L)x (0.8) =5.4 mg / L (rounded 5mg / L)
Where: DWEL = 6.7 mg/L (calculated from step 2)
May 2008 34
RSC = Relative source contribution from drinking water exposure (0.8). The relative source contribution is determined using the Exposure Decision Tree approach described in the Methodology for Deriving Ambient Water Quality Criteria for the Protection of Human Health (USEPA, 2000). The target population is pregnant women because the in utero developmental endpoint is the most sensitive. Available data are considered adequate to describe anticipated exposures. The RSC subtraction calculation method is considered appropriate since there are no other existing health-based numeric criteria for boron. Dietary sources represent the main background intake for boron (IOM, 2001). IOM (2001) reported a mean boron intake value of 1.0 mg/day from food sources for women of childbearing age and pregnant women. The background dietary intake value, when adjusted to the recommended 67 kg body weight for women of childbearing age, corresponds to a daily intake value of 0.015 mg/kg/day. When subtracted from the Reference Dose (RfD) of 0.2 mg/kg/day, 0.185 mg/kg/day remains. This latter value represents approximately 93 percent of the RfD. Therefore, the RSC ceiling value of 80 percent is applied, consistent with both the 2000 Human Health Methodology and past drinking water program regulatory practice. 5.5 Evaluation of Carcinogenic Potential The HA evaluation of carcinogenic potential includes the U.S. EPA descriptors for the weight of evidence of the likelihood that the agent is a human carcinogen and the conditions under which the carcinogenic effects may be expressed, as well as a quantitative estimate of cancer potency (slope factor), where available. The Cancer Slope Factor (CSF) is the result of the application of a low-dose extrapolation procedure and is presented as the risk per mg/kg/day of the contaminant. In cases where a CSF has been derived, HAs include the drinking water concentrations equivalent to an upper-bound excess lifetime cancer risk of one-in-ten-thousand (1 x 10⁻⁴), one-in-one-hundred-thousand (1 x 10⁻⁵), to one-in-one-million (1 x 10⁻⁶). Cancer assessments conducted before 1996 used the five-category, alphanumeric system for classifying carcinogens established by the Guidelines for Carcinogen Risk Assessment (US EPA, 1986). The EPA, currently, requires that all new cancer risk assessments comply with the Guidelines for Carcinogen Risk Assessment (U.S. EPA, 2005), or, if conducted between 1996 and 2005, comply with the draft versions of the 2005 Cancer guidelines.

Boron
May 2008 35
Based on the Guidelines for Carcinogen Risk Assessment (U.S. EPA, 2005b), data are inadequate for an assessment of human carcinogenic potential for boron. This characterization is based on the following summary of available evidence. No reliable data were located regarding an association between carcinogenicity and boron exposure in humans. Studies were inadequate to assess the carcinogenicity of boron in animals. A chronic rat feeding study conducted by Weir and Fisher (1972) was not designed to assess carcinogenicity; only a limited number of tissues were examined microscopically, and the report failed to report any neoplastic lesions. The chronic mouse study conducted by NTP (1987) was adequately designed, but produced mixed results. An increase in the incidence of hepatocellular carcinomas was observed at the low dose in male mice, but not at the high dose. The low dose incidence was within the range of historical controls. The increase incidence was statistically significant using the life table test, but not with the incidental tumor test. The latter test is more appropriate when the tumor in question is not the cause of death, which appeared to be the case for this study. A statistically significant increase in the incidence of subcutaneous tumors was observed in low-dose male mice but not in high-dose male mice. The increase was within the range of historical controls. Lower than ideal survival, particularly in the high dose male groups (44%) may have reduced the sensitivity of this study for evaluation of carcinogenicity. The chronic mouse study conducted by Schroeder and Mitchener (1975) was inadequate to detect carcinogenicity because only one, very low dose level was used (0.95 mg B/kg-day) and the animals could have tolerated a higher dose. Boron compounds have been found to be overwhelmingly negative for genotoxicity in bacteria, mammalian cells and mice in vivo. Overall, available data are inadequate for evaluation of the carcinogenic potential of boron in humans (U.S. EPA, 2004).

Boron
May 2008 36
Boron
May 2008 37
6.0 OTHER CRITERIA, GUIDANCE, AND STANDARDS ATSDR (1992) derived an intermediate oral MRL (Minimal Risk Level) of 0.01 mg B/kg/day based on a LOAEL value of 13.6 mg B/kg/day for decreased fetal body weight in rats and an uncertainty factor of 1000 (10 for LOAEL to NOAEL, 10 for interspecies, and 10 for intraspecies). A chronic oral MRL was not derived. The IOM (2001) developed a tolerable upper intake level (UL) for various life stages of humans. These ULs were based on the NOAEL (9.6 mg B/kg-day) from Price et al. (1996a) and an uncertainty factor of 30 (10 for interspecies uncertainty and 3 for intraspecies uncertainty based on the similarity in pharmacokinetics among humans). Using the appropriate reference body weight for women, the UL was set at 17 mg B/day for pregnant women of 14-18 years of age, and 20 mg B/day for pregnant women of 19-50 years of age. WHO (2003) derived a provisional guideline value of 0.5 mg/L using the tolerable daily intake value (TDI) of 0.16 mg B /kg/day and the drinking water consumption of 2L for 60 Kg adults and the source allocation of 10%. The TDI is based on the NOAEL of 9.6 mg B/kg-day for fetal body weight effects and an uncertainty factor of 60 (10 for interspecies and 6 for intraspecies). The guideline value is designated as provisional, because it is difficult to achieve in areas with high natural background levels with the treatment technology available. The state drinking water guidelines are as follows: California, 1000 μg/L (1 mg B/L); Wisconsin, 900 μg/L (0.9 mg B/L); Florida, Maine, and New Hampshire, 630 μg/L (0.63 mg B/L); and Minnesota, 600 μg/L (0.6 mg B/L) (HSDB, 2006d)

Boron
May 2008 38

Boron
May 2008 39
7.0 ANALYTICAL METHODS Boron can be detected using EPA Method 200.7. Method 200.7 relies on inductively coupled plasma-atomic emission spectrometry (ICP-AES). A full description of EPA Method 200.7 can be found in EPA’s Methods for the Determination of Metals in Environmental Samples Supplement 1 (U.S. EPA, 1994). A brief summary of this method is provided below. It should be noted that the analytical result of this method is for the amount of elemental boron; the method does not identify the boron compound (s) present. EPA Method 200.7
In EPA Method 200.7 (Revision 4.4), A Determination of Metals and Trace Elements in Water and Wastes by ICP/Atomic Emission Spectrometry, an aliquot of a well-mixed, acid-preserved aqueous sample is accurately transferred for sample processing. The sample is made up to one-half the original aliquot volume, mixed, and then allowed to settle overnight if the prepared aliquot contains undissolved material. Note that in low-turbidity water, boron determinations can be completed by a direct analysis of acid-preserved samples. The analysis involves multielemental determinations by ICP-AES using sequential or simultaneous instruments. The instruments measure characteristic atomic-line emission spectra by optical spectrometry. Samples are nebulized and the resulting aerosol is transported to the plasma torch. Element-specific emission spectra are produced by a radio-frequency ICP. The spectra are dispersed by a grating spectrometer, and the intensities of the line spectra are monitored at specific wavelengths by a photosensitive device (U.S. EPA, 1994). Note that boron samples can become contaminated by borosilicate glass. Only plastic or polytetrafluoroethylene (PTFE) labware should be used when collecting, storing, and handling water samples for boron analysis (U.S. EPA, 1994).
The method detection limit (MDL ) for boron using Method 200.7 is reported to be 0.003 mg/L (U.S. EPA, 1994). The average recovery ranges from 97 to 98 percent depending on the spike concentration and whether tap or well water was used. The Method Detection Limit is a statistical estimate of the minimum concentration of a substance that can be measured and reported with 99 percent confidence that the analyte concentration is greater than zero, i.e., greater than the background signal. The calculation of the MDL is based upon the precision of a series of replicate measurements of the analyte at low concentrations. The MDL incorporates estimates of the accuracy of the determination. The MDL is not a concentration that can typically be measured by the method on a routine basis. Detection limits may vary between analysts and laboratories under various laboratory conditions.
Another possible method for boron detection is Standard Method (SM) 4500-B B. The analytical range for this method is between 100 to1,000 Fg/L. This method, known as the Curcumin Method, is available in the 19th
edition of Standard Methods for the Examination of Water and
Wastewater (AWWA, 1995).

Boron
May 2008 40

Boron
May 2008 41
8.0 TREATMENT TECHNOLOGIES There is no evidence that boron and boron compounds are significantly removed by conventional treatments, such as coagulation/flocculation, sedimentation, and inert media filtration. Two treatment technologies that may be appropriate are ion exchange and reverse osmosis. Wong (1984) evaluated eight technologies for their ability to remove boron from evaporator product water at power plants. Boron concentration in the evaporator-product water averaged 11 mg/L, and ranged as high as 38 mg/L. Only three technologies successfully reduced boron levels to below 0.3 mg/L. These were a boron-specific ion exchange resin, a process of coagulation, precipitation and filtration, and a strong-base anion-exchange resin. Wong dismissed the coagulation, precipitation, and filtration process as unacceptable due to high chemical dosage requirements and high operating cost. Ion exchange involves the selective removal of charged inorganic species from water using an ion-specific resin. The surface of the ion exchange resin contains charged functional groups that hold ionic species by electrostatic attraction. As water passes by the resin, charged ions on the resin surface are exchanged for the contaminant species in the water. When all of the resin’s available exchange sites have been replaced with ions from the feed water, the resin is exhausted and must be regenerated or replaced. Of the two ion exchange methods, Wong determined that the strong-base anion exchange resin would have lower regeneration costs, at least in the case of the evaporator product water, which is low in dissolved solids. Reverse osmosis (RO) can also be used to remove boron from drinking water but has limited capabilities. It is similar to other membrane processes, such as ultrafiltration and nanofiltration, in that water passes through a semi-permeable membrane. However, in the case of RO, the membrane is non-porous. RO involves the use of applied hydraulic pressure to oppose the osmotic pressure across the membrane, forcing the water from the concentrated-solution side to the dilute-solution side. The water dissolves into the membrane, diffuses across, then dissolves out into the permeate. Most inorganic and many organic contaminants are rejected by the membrane and will be retained in the concentrate. Folster et al. (1980) tested hollow-fiber (HF) RO and spiral-wound (SW) RO in two separate treatment plants in New Mexico. At the treatment plant in San Jon, with influent boron levels of 0.75 mg/L, HF RO and SW RO removed 15 percent and 3 percent of boron, respectively. At Alamogordo, however, where influent concentrations were lower (0.09 mg/L), HF RO and SW RO were ineffective; in fact, boron concentrations rose to 0.14 mg/L and 0.13 mg/L, respectively. These findings suggest that the potential for RO use in boron treatment is limited.

Boron
May 2008 42

Boron
May 2008 43
9.0 REFERENCES Allen, B.C., P.L. Strong, C.J. Price, et al. 1996. Benchmark dose analysis of developmental
toxicity in rats exposed to boric acid. Fund. Appl. Toxicol. 32:194-204 (as cited in U.S. EPA, 2004).
Allen, H.E., M.A. Halley-Henderson, and C.N. Hass. 1989. Chemical composition of bottled
mineral water. Arch. Environ. Health. 44: 102-116. Anderson, D.L., M.E. Kitto, L. McCarthy, and W.H. Zoller. 1994. Sources of atmospheric
distribution of particulate and gas-phase boron. Atmos. Environ. 28: 1401-1410. (as cited in Culver et al., 2001).
Astier, A., F. Baud, and A. Fournier. 1988. Toxicokinetics of boron after a massive accidental
ingestion of boric acid. J. Pharm. Clin. 7:57-62. ATSDR. 1992. Agency for Toxic Substances and Disease Registry. Toxicological Profile for
Boron and Compounds; TP-91/05. Available from ATSDR, Atlanta, GA. AWWA (American Water Works Association). 1995. Standard Methods for the Examination of
Water and Wastewater, 19th Edition. Baker, M.D. and S.C. Bogema. 1986. Ingestion of boric acid by infants. Am. J. Emerg. Med.
4(4):358-361 (as cited in U.S. EPA, 2004). Bakke, J.P. 1991. Evaluation of the potential of boric acid to induce unscheduled DNA synthesis
in the in vitro hepatocyte DNA repair assay using the male F-344 rat [Unpublished study]. Submitted by U.S. Borax Corp; MRID No. 42038903 (as cited in U.S. EPA, 2004).
Benson, W.H., W.J. Birge, and H.W. Dorough. 1984. Absence of mutagenic activity of sodium
borate (borax) and boric acid in the Salmonella preincubation test. Environ. Toxicol. Chem. 3:209-214 (as cited in U.S. EPA, 2004).
Beyer, K.H., F.W. Bergfeld, W.O. Berndt, et al. 1983. Final report on the safety assessment of
sodium borate and boric acid. J. Am. Coll. Toxicol. 2(7):87-125 (as cited in U.S. EPA, 2004). Bonn, B.A. 1999. Selected elements and organic chemicals in bed sediment and fish tissue of the
Tualatin River Basin, Oregon, 1992-96. U.S. Geological Survey Water-Resources Investigations Report 99-4107. Available on-line at: http://or.water.usgs.gov/pubs_dir/Online/Pdf/99-4107.pdf. Link to document from: http://co.water.usgs.gov/trace/pubs/index.html. (as cited in U.S. EPA, 2005a).
Brown, K.W., G. B. Evans, Jr., and B.D. Frentrup (eds.). 1983. Hazardous Waste Land
Treatment. Boston, MA: Butterworth Publishers. p. 211 (as cited in HSDB, 2003a,c,d) (as cited in U.S. EPA, 2005a).
Boron
May 2008 44
Bustos-Obregon, E., Courot M, Flechon J.E., Hochereau-de-Reviers, M.T., Holstein A.F. 1975. Morphological appraisal of gametogenesis. Spermatogenetic process in mammals with particular reference to man. Andrologia. 7 (2):141-63.
Butterwick, L., de Oude N. Raymond K., 1989. Safety assessment of boron in aquatic and
terrestrial environments. Ecotoxicol Environ Saf. 17:339-371. Chang, B.L., W.A. Robbins, F. Wei, et al. 2006. Boron workers in China. Exploring work and
lifestyle factors related to boron exposure. Am. Assoc. Occup. Health Nurses J. 54:435-443. Chapin, R.E. and W.W. Ku. 1994. The reproductive toxicity of boric acid. Environ. Health
Perspect. 102(Suppl 7):87-91 (as cited in U.S. EPA, 2004). Chemfinder.com. 2006. Database and Internet Searching. Available online at
http://chemfinder.cambridgesoft.com/ Clark, G.M. and T.R. Maret. 1998. Organochlorine compounds and trace elements in fish tissue
and bed sediments in the lower Snake River Basin, Idaho and Oregon. U.S. Geological Survey Water-Resources Investigations Report 98-4103. Available on-line at: http://id.water.usgs.gov/PDF/wri984103/ORGANOSX.PDF. Link to document from: http://co.water.usgs.gov/trace/pubs/index.html. (as cited in U.S. EPA, 2005a).
Cox, J.A., et al. 1978. Leaching of boron from coal ash. Environ. Sci. Technol. 12: 722-723.
(as cited in Culver et al., 2001). Culver, B.D. and S.A. Hubbard. 1996. Inorganic boron health effects in humans: an aid to risk
assessment and clinical judgment. J. Trace Elem. Exp. Med. 9:175-184 (as cited in U.S. EPA, 2004).
Culver, B.D., P.L. Strong, and J.F. Murray. 2001. Boron. In: Patty’s Toxicology. Vol. 3.
Metals and Metal Compounds of Inorganic Nitrogen, Carbon, Oxygen, and Halogens. 5th edition, E. Bingham, B. Cohrssen, and C.H. Powell, Ed.,` John Wiley & Sons, Inc., New York. Pp. 519-582.
Dawson, B.J.M. 2001. Ground-water quality in the southeastern Sacramento Valley aquifer,
California. U.S. Geological Survey Water-Resources Investigations Report 01-4125. Available on-line at: http://water.usgs.gov/pubs/wri/wri014125/wrir01-4125.pdf. Link to document from: http://co.water.usgs.gov/trace/pubs/index.html. (as cited in U.S. EPA, 2005a).
Demerec, M., G. Bentani, and J. Flint. 1951. A survey of chemicals for mutagenic action on E.
coli. Am. Nat. 84(821):119-136 (as cited in U.S. EPA, 2004). Dieter, M.P. 1994. Toxicity and carcinogenicity studies of boric acid in male and female
B6C3F1 mice. Environ. Health Perspect. 102(Suppl 7):93-97 (as cited in U.S. EPA, 2004).

Boron
May 2008 45
Dixon, R.L., I.P. Lee, and R.J. Sherins. 1976. Methods to assess reproductive effects of environmental chemicals. Studies of cadmium and boron administered orally. Environ. Health Perspect. 13:59-67 (as cited in U.S. EPA, 2004).
Dixon, R.L., R.J. Sherins, and I.P. Lee. 1979. Assessment of environmental factors affecting
male fertility. Environ. Health Perspect. 30:53-68 (as cited in U.S. EPA, 2004). Doonan, D.J. and L.D. Lower. 1978. Boron compounds. In: Kirk-Othmer Encyclopedia of
Chemical Technology. 3rd ed., Vol. 4. Blood, Coagulants and Anticoagulants to Cardiovascular Agents. John Wiley & Sons, New York. Pp. 67-109.
Draize, J.H. and E.A. Kelly. 1959. The urinary excretion of boric acid preparations following
oral administration and topical applications to intact and damaged skin of rabbits. Toxicol. Appl. Pharmacol. 1:267-276 (cited in Moore et al., 1997).
ECETOC. 1994. European Centre for Ecotoxicology and Toxicology of Chemicals.
Reproductive and general toxicology of some inorganic borates and risk assessment for human beings. Technical Report No. 65. Brussels: European Centre for Ecotoxicology and Toxicology of Chemicals (as cited in U.S. EPA, 2004).
Eckel, W.P. and W.D. Langley. 1988. A background-based ranking technique for assessment of
elemental enrichment in soils at hazardous waste sites: 9th National Superfund ’88 Conference. Washington, DC. pp. 282-286. (as cited in Moore et al., 1997).
Elwell, M. 1993. Letter to C. Smallwood, U.S. EPA, Cincinnati, OH. March 5 (as cited in U.S.
EPA, 2004). Fail, P.A., J.D. George, T.B. Grizzle, et al. 1990. Final report on the reproductive toxicity of
boric acid (CAS No. 10043-35-3) in CD-1-Swiss mice. National Toxicology Program, Public Health Service, U.S. Department of Health and Human Services, Research Triangle Park, NC; NTP Report 90-105 (as cited in U.S. EPA, 2004).
Fail, P.A., J.D. George, J.C. Seely, et al. 1991. Reproductive toxicity of boric acid in CD-1 Swiss
mice: Assessment using the continuous breeding protocol. Fund. Appl. Toxicol. 17:225-239 (as cited in U.S. EPA, 2004).
Fail, P.A., R.E. Chapin, C.J. Price, et al. 1998. General, reproductive, developmental, and
endocrine toxicity of boronated compounds. Reprod. Toxicol. 12:1-18 (as cited in U.S. EPA, 2004).
Field, E.A., C.J. Price, M.C. Marr, et al. 1989 Final report on the developmental toxicity of boric
acid (CAS No. 10043-35-3) in CD-1-Swiss Mice. National Toxicology Program, Public Health Service, U.S. Department of Health and Human Services, Research Triangle Park, NC; NTP Final Report No. 89-250 (as cited in U.S. EPA, 2004).

Boron
May 2008 46
Frey, M.M., C. Seidel, M. Edwards, J. Parks, and L. McNeill. 2004. Occurrence Survey for Boron and Hexavalent Chromium. AwwaRF Report 91044F.
Folster, H.G., D.B. Wilson, S. Hanson and R. Duran. 1980. New Mexico Water Resources
Research Institute. Water treatment for small public supplies. WRRI Report No. 119. Graedel, T.E. 1978. Inorganic elements, hydrides, oxides, and carbonates. In: Chemical
Compounds in the Atmosphere. New York, NY: Academic Press. pp. 35-49 (as cited in ATSDR, 1992).
Haworth, S., T. Lawlor, K. Mortelmans, et al. 1983. Salmonella mutagenicity test results for 250
chemicals. Environ. Mutagen (Suppl.)1:3-142 (as cited in U.S. EPA, 2004). Heindel, J.J., C.J. Price, E.A. Field, et al. 1992. Developmental toxicity of boric acid in mice and
rats. Fund. Appl. Toxicol. 18:266-277 (as cited in U.S. EPA, 2004). Heindel, J.J., C.J. Price, and B.A. Schwetz, BA. 1994. The developmental toxicity of boric acid
in mice, rats and rabbits. Environ. Health Perspect. 102(Suppl 7):107-112 (as cited in U.S. EPA, 2004).
HSDB. 2003. Hazardous Substance Data Bank. Boric acid. Division of Specialized Information
Services, National Library of Medicine. Available on-line at: http://toxnet.nlm.nih.gov/ (last revised March 5, 2003).
HSDB (Hazardous Substance Data Bank) 2006a. Anhydrous Borax. Generated from the
Hazardous Substances Data Bank (HSDB), a database of the National Library of Medicine's TOXNET system (http://toxnet.nlm.nih.gov) on April 4, 2006.
HSDB (Hazardous Substance Data Bank) 2006b. Borax. Generated from the Hazardous
Substances Data Bank (HSDB), a database of the National Library of Medicine's TOXNET system (http://toxnet.nlm.nih.gov) on April 4, 2006.
HSDB (Hazardous Substance Data Bank) 2006c. Boric acid. Generated from the Hazardous
Substances Data Bank (HSDB), a database of the National Library of Medicine's TOXNET system (http://toxnet.nlm.nih.gov) on April 4, 2006.
HSDB (Hazardous Substance Data Bank) 2006d. Boron. Generated from the Hazardous
Substances Data Bank (HSDB), a database of the National Library of Medicine's TOXNET system (http://toxnet.nlm.nih.gov) on April 4, 2006.
HSDB (Hazardous Substance Data Bank) 2006de Boron Oxide. Generated from the Hazardous
Substances Data Bank (HSDB), a database of the National Library of Medicine's TOXNET system (http://toxnet.nlm.nih.gov) on April 4, 2006.

Boron
May 2008 47
Hunt, C.D. and S.L. Meacham. 2001. Aluminum, boron, calcium, copper, iron, magnesium, manganese, molybdenum, phosphorus, potassium, sodium, and zinc: concentrations in common Western foods and estimated daily intakes by infants; toddlers; and male and female adolescents, adults, and seniors in the United States. J. Am. Diet. Assoc. 101:1058-1060.
Hunt, C.D., T.R. Shuler, and L.M. Mullen. 1991. Concentration of boron and other elements in
human foods and personal-care products. J. Am. Diet. Assoc. 91: 558-568. IOM. 2001. Institute of Medicine. Dietary Reference Intakes for Vitamin A, Vitamin K, Arsenic,
Boron, Chromium, Copper, Iodine, Iron, Manganese, Molybdenum, Nickel Silicon, Vanadium and Zinc. Washington, DC: National Academy Press (as cited in U.S. EPA, 2004).
Iyer, V.N. and W. Szybalski. 1958. Two simple methods for the detection of chemical mutagens.
Appl. Microbiol. 6:23-29 (as cited in U.S. EPA, 2004). Ku, W.W., R.E. Chapin, R.N. Wine, et al. 1993. Testicular toxicity of boric acid (BA):
relationship of dose to lesion development and recovery in the F344 rat. Reprod. Toxicol. 7:305-319 (as cited in U.S. EPA, 2004).
Landolph, J.R. 1985. Cytotoxicity and negligible genotoxicity of borax and borax ores to
cultured mammalian cells. Am. J. Ind. Med. 7:31-43 (as cited in U.S. EPA, 2004). Lee, I.P., R.J. Sherins, and R.L. Dixon. 1978. Evidence for induction of germinal aplasia in male
rats by environmental exposure to boron. Toxicol. Appl. Pharmacol. 45:577-590 (as cited in U.S. EPA, 2004).
Linder, R.E., L.F. Strader, and G.L. Rehnberg. 1990. Effect of acute exposure to boric acid on
the male reproductive system of the rat. J. Toxicol. Environ. Health 31:133-146. Loscutoff, S. 1994. Personal Communication (Memorandum). Food and Drug Branch,
California Environmental Protection Agency; November 7, 1994. (as cited in Moore et al., 1997).
Mastromatteo, E. and F. Sullivan. 1994. Summary: International symposium on health effects
of boron and its compounds. Environ. Health. Perspect. 102 (Suppl. 7): 139-141. Moore, J.A. and an Expert Scientific Committee. 1997. An assessment of boric acid and borax
using the IEHR Evaluative Process for Assessing Human Developmental and Reproductive Toxicity of Agents. Reprod. Toxicol. 11: 123-160.
Mulinos, M., C. Conant, and E. Hauser. 1953. The toxicity of boric acid and the clinical
implications of borated baby powders. Bull. NY Med. Coll. 16:92-101. (cited in Moore et al., 1997)
Murray, E.J. and C.E. Schlekat. 2004. Comparison of risk assessments of boron: alternate
approaches to chemical-specific adjustment factors. Human Ecol. Risk Asses. 10:57-68.
Boron
May 2008 48
Narotsky, M.G., N. Wery, B.T. Hamby, et al. 2003. Effects of boric acid on hox gene expression
and the axial skeleton in the developing rat. In: Massaro, E.J. and J.M. Rogers (eds.). The Skeleton: Biochemical, Genetic and Molecular Interactions in Development and Homeostasis. Totowa, NJ: Humana Press (in press) (as cited in U.S. EPA, 2004).
Narukawa, T., K.W. Riley, D.H. French, A. Takatsu, and K. Chiba. 2003. Investigation into the
relationship between major and minor element contents and particle size and leachability of boron in fly ash from coal fuel thermal power plants. J. Environ. Monit. 5:831-836.
NTP. 1987. National Toxicology Program. Toxicology and carcinogenesis studies of boric acid
(CAS No. 10043-35-3) in B6C3F1 mice (feed studies). Public Health Service, U.S. Department of Health and Human Services; NTP TR-324. Available on-line at: http://ntp-server.niehs.nih.gov/htdocs/LT_rpts/tr324.pdf
Odunola, O.A. 1997. Individual and combined genotoxic response of boric acid and aflatoxin B1
in Escherichia coli PQ37. East Afr. Med. J. 74:499-502 (as cited in U.S. EPA, 2004). O’Loughlin, K.G. 1991. Bone marrow erythrocyte micronucleus assay of boric acid in Swiss-
Webster mice [Unpublished study]. Submitted by U.S. Borax Corp. MRID No. 42038904 (as cited in U.S. EPA, 2004).
O’Neil, M.J., A. Smith, P.E. Heclelman, et al. (Ed.) 2001. The Merck Index. An Encyclopedia
of Chemicals, Drugs, and Biologicals. 13th edition. Merck & Co., Inc., Whitehouse Station, NJ, pp. 1326, 1327, 1338, 8668.
O’Sullivan, K; Taylor, M. (1983) Chronic boric acid poisoning in infants. Arch Dis Child
58:737-739. Paynter, O.E., Kundzin, M. and Kundzin, T. (1962a) Boric Acid 90-Day Dietary Feeding-
Rats. Hazleton Laboratories, Falls Church, VA, December 12, 1962; submitted by United States Borax. Unpublished report. MRID 00068025
Paynter, O. 1962b. 90-Day Dietary Administration – Rats with 20 MULE TEAM® Borax
(Sodium tetraborate decahydrate). Hazelton Laboratories, Inc., Vienna, VA. December 13, 1962. MRID 40692305.
Price, C.J., E.A. Field, M.C. Marr, et al. 1990. Developmental toxicity of boric acid (CAS No.
10043-35-3) in Sprague Dawley rats. National Toxicology Program, Public Health Service, U.S. Department of Health and Human Services, Research Triangle Park, NC; NTP Report No. 90-105 (and Report Supplement No. 90-105A) (as cited in U.S. EPA, 2004).
Price, C.J., M.C. Marr, C.B. Myers, et al. 1991. Developmental toxicity of boric acid (CAS No.
10043-35-3) in New Zealand White rabbits. National Toxicology Program, Public Health Service, U.S. Department of Health and Human Services, Research Triangle Park, NC; NTP TER90003 (and Laboratory Supplement No. TER-90003) (as cited in U.S. EPA, 2004).

Boron
May 2008 49
Price, C.J., M.C. Marr, and C.B. Myers. 1994. Determination of the no-observable-
adverse-effect level (NOAEL) for developmental toxicity in Sprague-Dawley (CD) rats exposed to boric acid in feed on gestational days 0 to 20, and evaluation of postnatal recovery through postnatal day 21 [Final report]. Research Triangle Institute, Center for Life Science, Research Triangle Park, NC; RTI Identification No. 65C-5657-200 (as cited in U.S. EPA, 2004).
Price, C.J., P.L. Strong, M.C. Marr, et al. 1996a. Developmental toxicity NOAEL and postnatal
recovery in rats fed boric acid during gestation. Fund. Appl. Toxicol. 32:179-193 (as cited in U.S. EPA, 2004).
Price, C.J., M.C. Marr, C.B. Myers, et al. 1996b. The developmental toxicity of boric acid in
rabbits. Fund. Appl. Toxicol. 34:176-187 (as cited in U.S. EPA, 2004). Price, C.J., P.L. Strong, F.J. Murray, et al. 1997. Blood boron concentrations in pregnant rats fed
boric acid throughout gestation. Reprod. Toxicol. 11(6):833-842 (as cited in U.S. EPA, 2004).
Rainey C.J., L.A. Nyquist, R.E. Christensen, P.L. Strong, B.D. Culver, and J.R. Coughlin. 1999.
Daily boron intake from the American diet. J. Am. Diet Assoc. 99(3):335-40. Richburg, J.H., Boekelheide K., and Blanchard, K.T., 1997. The Sertoli Cell as a Target for
Toxicants. In:Comprehensive Toxicology, Vol. 10, Reproductive and Endocrine Toxicology, Boekelheide K., Chapin R.E., Hoyer P.B., and Harris C. (Eds.), Elsevier Science Inc., pp 127-138.
Richold, M. 1998. Boron exposure from consumer products. Biol. Trace Element Res. 66:121-
129. Rope, S.K., W.J. Arthur, T.H. Craig, et al. 1988. Nutrient and trace elements in soil and desert
vegetation of southern Idaho. Environ. Monit. Assess.10:l-24 (as cited in U.S. EPA, 2005a). Rudd, C.J. 1991. Mouse lymphoma cell mutagenesis assay (tK+/-/tK-/-) of boric acid
[Unpublished study]. Submitted by U.S. Borax Corp. MRID No. 420390 (as cited in U.S. EPA, 2004).
Sayli, B.S., E. Tuccar, and A.H. Elhan. 1998. An assessment of fertility in boron -exposed
Turkish subpopulations. Reprod. Toxicol. 12(3):297-304 (as cited in U.S. EPA, 2004). Sayli, B.S. 2001. Assessment of fertility and infertility in boron-exposed Turkish
subpopulations. Biol. Trace Element Res.81:255-267. Sayli, B.S. 2003. Low frequency of infertility among workers in a borate processing
facility. Biol. Trace Element Res. 93:19-30.

Boron
May 2008 50
Schroeder, HA; Mitchener, M. (1975) Life-term effects of mercury, methyl mercury, and nine other trace metals on mice. J Nutr 105:453-458.
Sprague, R.W. 1972. The ecological significance of boron. U.S. Borax Research
Corporation. (as cited in Moore et al., 1997). Stewart, K.R. 1991. Salmonella/microsome plate incorporation assay of boric acid [Unpublished
study]. Submitted by U.S. Borax Corporation; MRID No. 4203901 (as cited in U.S. EPA, 2004).
Szybalski, W. 1958. Special microbiological system. II. Observations on chemical mutagenesis
in microorganisms. Ann. NY Acad. Sci 76:475-489 (as cited in U.S. EPA, 2004). U.S. Borax Research Corporation. 1963. MRID No. 00068026; HED Doc. No. 009301.
Available from EPA. Write to FOI, EPA, Washington, DC, 20460 (as cited in U.S. EPA, 2004).
U.S. Borax Research Corporation. 1966. MRID No. 00005622, 00068021, 00068881; HED
Doc. No. 009301. Available from EPA. Write to FOI, EPA, Washington, DC, 20460 (as cited in U.S. EPA, 2004).
U.S. Borax Research Corporation. 1967. MRID No. 00005623, 005624; HED Doc. No.
009301. Available from EPA. Write to FOI, EPA, Washington, DC, 20460 (as cited in U.S. EPA, 2004).
USBM (U.S. Bureau of Mines). 1993. Mineral commodity summaries. 1993. U.S.
Department of Interior, Washington, DC. (as cited in Moore et al., 1997). U.S. EPA (U.S. Environmental Protection Agency). 1980. United States Environmental
Protection Agency. Guidelines and methodology used in the preparation of health effect assessment chapters of the consent decree water criteria documents. Fed. Reg. 45(231):79347-79357.
U.S. EPA (U.S. Environmental Protection Agency). 1986. Guidelines for Carcinogen
risk assessment. Fed. Regist. 51:33992-34003. U.S. EPA (U.S. Environmental Protection Agency). 1988. United States Environmental
Protection Agency. Recommendations for and documentation of biological values for use in risk assessment. Prepared by the Office of Health and Environmental Assessment, Environmental Criteria and Assessment Office, Cincinnati, OH for the Office of Solid Waste and Emergency Response, Washington, DC; EPA 600/6-87/008. Available from: National Technical Information Service, Springfield, VA; PB-88179874.
U.S.EPA (U.S. Environmental Protection Agency). 1994. Method 200.7: Determination
of Metals and Trace Elements in Water and Wastes by Inductively Coupled Plasma-

Boron
May 2008 51
Atomic Emission Spectrometry Revision 4.4. Martin, T.D., C.A. Brockhoff, J.T. Creed, and EMMC Methods Work Group. In: Methods for the Determination of Metals in Environmental Samples Supplement 1. EPA Report 600-R-94-111.
U.S. EPA (U.S. Environmental Protection Agency). 1997. Exposure Factors Handbook.
Available online at http://cfpub.epa.gov/ncea/cfm/recordisplay.cfm?deid=12464#moj U.S. EPA (U.S. Environmental Protection Agency). 2000. Methodology for Deriving Ambient
Water Quality Criteria for the Protection of Human Health (2000). U.S. EPA, Office of Water, Office of Science and Technology, Washington, DC. EPA-822-B-00-004. Available online at http://www.epa.gov/waterscience/criteria/humanhealth/method/complete.pdf
U.S. EPA (U.S. Environmental Protection Agency). 2002a. Community Water System Survey
2000. Volume I: Overview. EPA Report 815-R-02-005A. December 2002. Available on the Internet at: http://www.epa.gov/safewater/consumer/pdf/cwss_2000_volume_i.pdf.
U.S. EPA (U.S. Environmental Protection Agency). 2002b. Community Water System Survey
2000. Volume II: Detailed Tables and Survey Methodology. EPA Report 815-R-02-005B. Available on the Internet at: http://www.epa.gov/safewater/consumer/pdf/cwss_2000_volume_ii.pdf.
U.S. EPA (U.S. Environmental Protection Agency). 2004. Toxicological Review of Boron and
Compounds (CAS 7440-42-8). In Support of Summary Information on the Integrated Risk Information System (IRIS). U.S. Environmental Protection Agency, Washington, DC. EPA 635/04/052. Available online at www.epa.gov/iris
U.S. EPA (U.S. Environmental Protection Agency). 2005a. Health Effects Support Document
for Boron. U. S. EPA, Office of Water, Human and Ecological Criteria Division, Washington, DC. (Draft).
U.S. EPA. (United States Environmental Protection Agency). 2005b. Guidelines for Carcinogen
Risk Assessment. EPA/630/P-03/001B. Risk Assessment Forum, Washington, DC. U.S. EPA (U.S. Environmental Protection Agency). 2006. Boric Acid/Sodium Borate Salts:
HED Chapter of the Tolerance Reassessment Eligibility Decision Document (TRED). June, 26, 2006. Office of Prevention, Pesticides, and Toxic Substances, Washington, D.C.
USGS (U.S. Geological Survey). 2003. U.S. Geological Survey Minerals Yearbook─2003.
Prepared by P.A. Lyday. Available online at: http://minerals.usgs.gov/minerals/pubs/commodity/boron/boronmyb03.pdf
USGS (U.S. Geological Survey). 2006. U.S. Geological Survey, Mineral Commodity
Summaries, January 2006. Prepared by P.A. Lyday. Available online at: http://minerals.usgs.gov/minerals/pubs/commodity/boron/boronmcs06.pdf.
Boron
May 2008 52
Warner, K.L. 1999. Analysis of nutrients, selected inorganic constituents, and trace elements in water from Illinois community-supply wells, 1984-91. U.S. Geological Survey Water-Resources Investigations Report 99-4152. Available on-line at: http://il.water.usgs.gov/proj/lirb/pubs/pdfs/topicalbook.pdf. Link to document from: http://co.water.usgs.gov/trace/pubs/index.html.
Weast, R.C. (ed.). 1988. CRC Handbook of Chemistry and Physics. 68th ed. Boca Raton, FL:
CRC Press Inc. (as cited in HSDB, 2003). Weir, R.J. 1963. 90-Day Dietary Administration – Rats with 20 MULE TEAM® Borax (Sodium
tetraborate decahydrate). Hazelton Laboratories, Inc., Vienna, VA. February 15, 1963. MRID 40692306.
Weir, R.J. 1967. 38-Week Dietary Feeding – Dogs with 20 MULE TEAM® Borax (Sodium
tetraborate decahydrate). Hazelton Laboratories, Inc., Vienna, VA. February 28, 1967. MRID 40692308.
Weir, R.J. and L.M. Crews. 1967. Two-Year Dietary Administration – Albino Rats – Borax
(Sodium Tetraborate Decahydrate) and Addendum. Hazelton Laboratories, Inc., Vienna, VA. February 15, 1963. MRID 40692309.
Weir, R.J. and R.S. Fisher. 1972. Toxicologic studies on borax and boric acid. Toxicol. Appl.
Pharmacol. 23:351-364. Wery, N., M.G. Narotsky, N. Pacico, et al. 2003. Defects in cervical vertebrae in boric acid-
exposed rat embryos are associated with anterior shifts of hox gene expression domains. Birth Defects Res. (Part A) 67:59-67 (as cited in U.S. EPA, 2004).
WHO. 1998. World Health Organization. Environmental Health Criteria 204: Boron. Geneva,
Switzerland: World Health Organization (as cited in U.S. EPA, 2004). WHO. 2003. World Health Organization. WHO Guidelines for drinking-water quality. Geneva,
World Health Organization (WHO/SDE/WSH/03.04/54). Wong, J.M. 1984. Boron Control in Power Plant Reclaimed Water for Potable Reuse.
Environmental Progress. 3(1):5-11. Woods, W.G. 1994. An introduction to boron: history, sources, uses, and chemistry. Environ.
Health Perspect. 102(Suppl 7):5-11. Yazbeck, C., W. Kloppmann, R. Cottier, et al. 2005. Health impact evaluation of boron in
drinking water: a geographical risk assessment in Northern France. Environ. Geochem. Health. 27:419-427.
Boron
May 2008 53
Ysart, G, Miller, P, Crews, H, Robb, P, Baxter, M, DeLrgy, C, lofthouse, S, Sargent, C and N Harrison. 1999. Dietary exposure estimated of 30 elements from the UK Total Diet Study. Food Additives and Contamination 16 (9):391-403 (as cited in U.S. EPA, 2005a).