dresden discussion paper series in economicsrcswpecono/restore/wpeconom/public_html/... · dresden...
TRANSCRIPT
Dresden University of Technology Faculty of Business Management and Economics
Dresden Discussion Paper Series in Economics
Implications of Diverging Social and Private Discount Rates for Investments in the German
Power Industry. A New Case for Nuclear Energy?
CHRISTOPH HEINZEL
Dresden Discussion Paper in Economics No. 03/08
ISSN 0945-4829
Address of the author: Christoph Heinzel Dresden University of Technology 01062 Dresden Germany e-mail : [email protected] Editors:
Faculty of Business Management and Economics, Department of Economics Internet:
An electronic version of the paper may be downloaded from the homepage: http://rcswww.urz.tu-dresden.de/wpeconomics/index.htm
English papers are also available from the SSRN website: http://www.ssrn.com Working paper coordinator: Dominik Maltritz e-mail: [email protected]
Dresden Discussion Paper in Economics No. 03/08
Implications of Diverging Social and Private Discount Rates for Investments in the German Power Industry.
A New Case for Nuclear Energy?
Christoph Heinzel
Dresden University of Technology 01062 Dresden
[email protected] Abstract:
For power-plant investments, utilities rely after liberalisation on private financial markets, which are in general distorted. The (related) split of social and private time-preference rates provides a new reason for a welfare-enhancing policy intervention, complementary to environmental policy (Heinzel and Winkler 2007). This paper quantifies it and studies its relevance for the German power industry around 2015. The distortions remain moderate as compared to other investment subsidies. However, in contrast to environmental policy alone, its additional implementation makes nuclear power the first option even in the nuclear high-cost scenario. Both policies enhance ecological structural change, which end-of-pipe abatement delays. JEL-Classification: Q48, D92, H23, H43 Keywords: distorted time preferences, environmental and technology policy, conventional energy technologies Acknowledgements: The author is grateful to Udo Broll, Christian von Hirschhausen, Marco Lehmann-Waffenschmidt, Normann Lorenz, Martin Quaas, Marcel Thum and Ralph Winkler for valuable comments on an earlier draft. The usual disclaimer applies.
1 Introduction
In liberalised energy markets, private utilities rely on private financial markets to financepower-plant investments. However, as is well recognised in economics and finance, finan-cial markets in real world are systematically distorted. The distortion derives in generalfrom different sources. They include, e.g., distortionary taxation, distortionary publicinvestment, imperfect competition, production externalities, adverse-selection problems,or uninsurable long-run risks (e.g. Gollier 2002, Grant and Quiggin 2003, Hubbard 1998,Lind 1982, Mehra and Prescott 2003). The (related) split of social and private time-preference rates induces, in addition to that from the emission externality, a further dis-tortion in the investment conditions for new technologies (Heinzel and Winkler 2007).It provides a new reason to complement environmental policy by another policy, suchas technology policy, in the transition to a low-emission energy industry. The purposeof this paper is to quantify and to study the relevance of the welfare implications ofdiverging social and private discount rates for the German electricity industry around2015. In Germany, by 2020 40 GWe or about one third of the net installed capacity isto be replaced as a part of usual reinvestment cycles. To this by about 2022 another 20GWe add due to the political decision to phase out nuclear energy.
The analysis focuses on the threefold investment-related trade-off of a single cost-minimising utility under environmental policy. Disposing over an established pollutingpower plant with finite lifetime, it has, eventually, not only to decide (i) which newtechnology to introduce and (ii) when, but also (iii) whether first, or never, to graduallyrefine its existing plant, e.g., by enactment of an end-of-pipe abatement technology. Theanalysis proceeds in two steps. First, its choice among three new generation technolo-gies (hard coal, gas, nuclear) is investigated, then its choice of the optimal moment oftransition from the established polluting to a new less polluting plant. For the secondstep the investment conditions are projected on a temporal scale. Seven scenarios areconsidered. Apart from the no-policy benchmark the cases of environmental policy andvarying levels of the social imputed interest rate (rs) as distinct from the private (rp)are analysed, first separately, then combined, for the cases of both the absence and thepresence of an end-of-pipe abatement option. The focus is on conventional technologiesfor baseload electricity generation, as they will still play the major role in upcomingreinvestment cycles and are likely to be the most affected by the interest-rate distortion.The unit costs of electricity (UCel) are calculated using the levelised-cost-of-electricity(LCOE) methodology. Technical and economic parameters and sensitivity ranges of thepolicy parameters are derived from scientific and public studies as cited below.
The paper exceeds previous studies, such as BEI (2004), Enquetekommission (2002),EWI and Prognos (2005), and IEA and NEA (2005), in five ways. First, while the impor-tance of the discount rate is well recognised and results are often considered for differentlevels, the impact of correcting optimal policy interventions as induced by deviationsfrom its socially optimal level has not yet been analysed. Second, the study of their ef-fect against the background of varying CO2-price levels also provides a detailed analysisof the impact of environmental policy on the ranking of the considered technologies.Third, the projection of the investment conditions on a temporal scale allows to explic-
2
itly account for effects on the timing of structural change in the energy industry. Fourth,by taking into account nuclear power, notably in two different cost scenarios, someclarification is added to the relative prospects of this technology in the future Germangeneration mix. Finally, treating emission and abatement costs as separate categories inthe financial model, necessary levels of abatement unit costs (AUC) and CO2 prices aredetermined for a new end-of-pipe abatement option, such as carbon-capture-and-storage(CCS) technologies, to be relevant.
The paper is structured as follows. Section 2 introduces analytical setting and finan-cial model. Section 3 specifies and discusses the technological and economic parameters.Section 4 analyses the utility’s technology choice, section 5 the optimal moments of tran-sition to the new technologies under the seven mentioned scenarios. Section 6 summarisesand discusses the results. Section 7 concludes.
2 Analytical setting and financial model
Consider a single cost-minimising utility which runs a coal-fired power plant (T1) com-missioned in 1990, and disposes at its hand over three types of new specific technologies(T2), a new coal-fired, a gas-fired, and a nuclear power plant available for commercialoperation by 2015.1 In contrast to the fossil technologies, nuclear power is clean in termsof CO2 emissions.2 For emission abatement, a CCS technology may be enacted. In accordwith the ideal of, in particular, liberalised energy markets perfect competition is assumedfor all markets such that the utility acts as a price taker. Electricity is homogeneous.The construction of a new power plant constitutes a small private investment projectand does, thus uncorrelated with GDP, not affect the social rate of return, is.
The analysis focuses on the influence of two market failures on the utility’s optimaldecisions, the one stemming from the (negatively valued) CO2 emissions, the other oneassociated with the split of social and private rates of time preference. Given a pollutingproduction system, the two externalities become apparent considering a representativeprivate household’s (p) and the social (s) welfare functions,
Wi =T
∑
t=1
U [c(t), e(t)](1 + ρi)−(t−1) , (1)
with i = p, s.3 Both are assumed to derive instantaneous utility from energy consump-tion, c, and disutility from net emissions, e, i.e. ∂U
∂c> 0, ∂U
∂e< 0. The emission externality
induces environmental policy. As it does not matter whether the optimal CO2-price level
1 Lignite, though the most important domestic energy carrier, is not considered as there is no actualmarket for it. Due to its persistently low price it is expected to keep its share in the German generationmix in the period under consideration despite a cost-intensive rise in net thermal efficiency from 43to 48% and its higher emission factor of 0.396 t CO2/MWh (BEI 2004, EWI and Prognos 2005).
2 Life cycle assessments show for nuclear power similarly low greenhouse-gas emissions as for renewableenergies. For coal they are about 30, for gas about 13 times higher (Owen 2004, Fritsche et al. 2007).
3 See Heinzel and Winkler (2007) for an encompassing welfare analysis in a general equilibrium model.
3

is implemented via an emission tax or an emission permit trading scheme, in the fol-lowing only directly positive CO2-price levels (τe > 0) are considered. As an outcomeof the economic discounting debate, the representative consumer is moreover generallyrecognised to apply in general a higher rate of time preference than socially optimal, i.e.ρp > ρs (Heinzel and Winkler 2007). The split time-preference rates do not constitutea market failure in themselves. Their split rather occurs as an effect of some underly-ing distortion. It provides a general case for a welfare-enhancing policy intervention. Ingeneral it results from several different causes such that for the correction of the implieddistortions a policy mix is necessary. Thus far, there has been no systematic researchwith respect to the causes of, as well as their quantitative contribution to the split.Therefore, in this paper the bundle of policy measures necessary to correct the splitand resulting distortions is summarised by the term technology policy. For the investingutility the diverging time-preference rates materialise in a distorted financial market.Thus, the (private) imputed interest rate, based on its market observations, exceeds thesocially optimal, i.e. rp > rs.
The unit costs of electricity are determined based on the LCOE methodology. Theparticular financial model, adapted from Bejan et al. (1996: ch. 7), is introduced inappendix A.1. This methodology has been criticised for not sufficiently accounting for theincreased uncertainty of power-plant investments after liberalisation (e.g. IEA and NEA2005, MIT 2003). Instead, especially real-option approaches have been used (Epaulardand Gallon 2001, Gollier et al. 2005, Roques et al. 2006, Rothwell 2006). However, forthe sake of comparability with previous studies and as there is thus far no alternativeanalytical scheme established, this paper stays with the conventional approach.
3 Data and parameter specification
The data at the basis of the analysis in sections 4 and 5 refer as far as possible to thesituation in Germany around 2015. The parameters are summarised in appendix A.3.
3.1 Technical parameters
The technical and economic estimates for the reference power plants refer in the case ofcoal to plants operating on the basis of combustion of pulverised coal in conventionalboilers, in the case of gas to a combined cycle gas turbine (CCGT). For nuclear powerthey refer to the European Pressurised Water Reactor (EPR), a large boiling- (i.e. light-)water reactor of generation III+ of nuclear power stations, designed to meet Germanand French safety standards. It is currently the most seriously discussed build for newdeployment in Europe. Oriented towards the prospected size of the EPR, a net installedcapacity to be replaced of 1,500 MWe is considered. The plants are supposed to operatewith a capacity factor 85%. Generally accurate for coal, this figure is relatively highfor gas and rather low for nuclear. As regards the technical parameters of the coal-firedreference power plants, net thermal efficiencies of 45 and 51%, respectively, a constructionperiod of 4 and an economic lifetime of 40 years are assumed, for the gas-fired powerplant 60%, 2 and 25 years, for the nuclear power plant 38%, 5 and 40 years, respectively.
4
3.2 Cost parameters
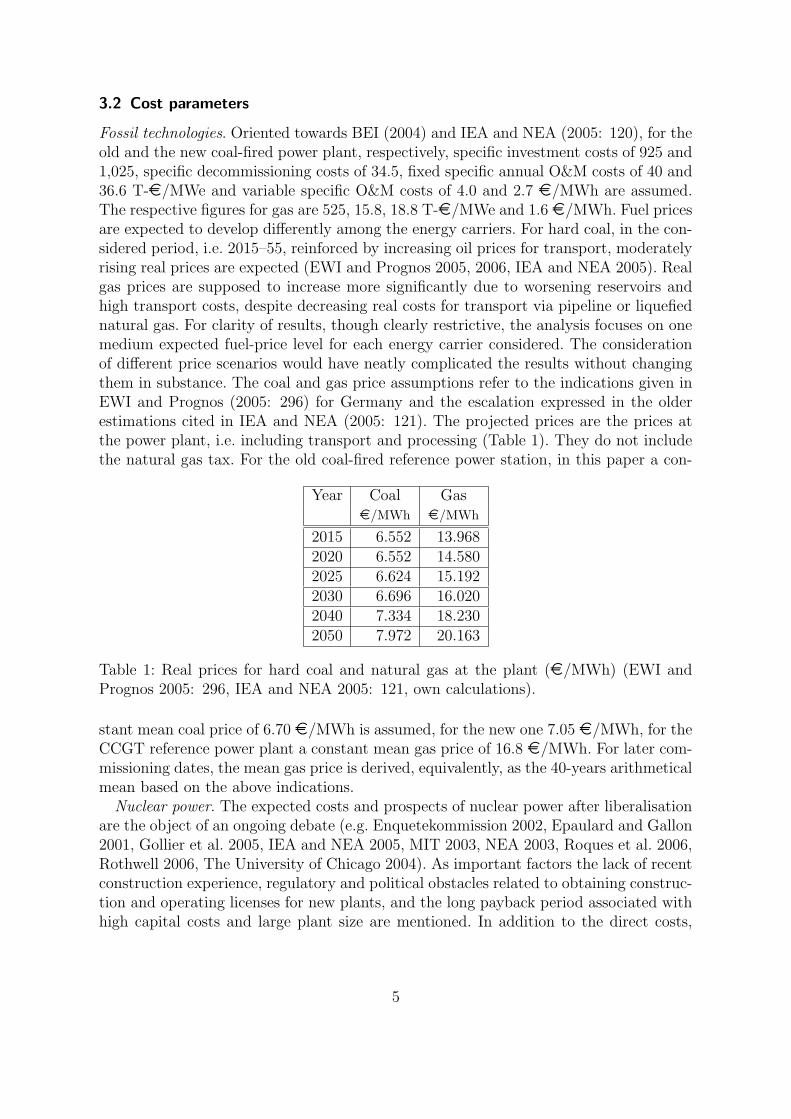
Fossil technologies. Oriented towards BEI (2004) and IEA and NEA (2005: 120), for theold and the new coal-fired power plant, respectively, specific investment costs of 925 and1,025, specific decommissioning costs of 34.5, fixed specific annual O&M costs of 40 and36.6 T-¤/MWe and variable specific O&M costs of 4.0 and 2.7 ¤/MWh are assumed.The respective figures for gas are 525, 15.8, 18.8 T-¤/MWe and 1.6 ¤/MWh. Fuel pricesare expected to develop differently among the energy carriers. For hard coal, in the con-sidered period, i.e. 2015–55, reinforced by increasing oil prices for transport, moderatelyrising real prices are expected (EWI and Prognos 2005, 2006, IEA and NEA 2005). Realgas prices are supposed to increase more significantly due to worsening reservoirs andhigh transport costs, despite decreasing real costs for transport via pipeline or liquefiednatural gas. For clarity of results, though clearly restrictive, the analysis focuses on onemedium expected fuel-price level for each energy carrier considered. The considerationof different price scenarios would have neatly complicated the results without changingthem in substance. The coal and gas price assumptions refer to the indications given inEWI and Prognos (2005: 296) for Germany and the escalation expressed in the olderestimations cited in IEA and NEA (2005: 121). The projected prices are the prices atthe power plant, i.e. including transport and processing (Table 1). They do not includethe natural gas tax. For the old coal-fired reference power station, in this paper a con-
Year Coal Gas¤/MWh ¤/MWh
2015 6.552 13.9682020 6.552 14.5802025 6.624 15.1922030 6.696 16.0202040 7.334 18.2302050 7.972 20.163
Table 1: Real prices for hard coal and natural gas at the plant (¤/MWh) (EWI andPrognos 2005: 296, IEA and NEA 2005: 121, own calculations).
stant mean coal price of 6.70 ¤/MWh is assumed, for the new one 7.05 ¤/MWh, for theCCGT reference power plant a constant mean gas price of 16.8 ¤/MWh. For later com-missioning dates, the mean gas price is derived, equivalently, as the 40-years arithmeticalmean based on the above indications.
Nuclear power. The expected costs and prospects of nuclear power after liberalisationare the object of an ongoing debate (e.g. Enquetekommission 2002, Epaulard and Gallon2001, Gollier et al. 2005, IEA and NEA 2005, MIT 2003, NEA 2003, Roques et al. 2006,Rothwell 2006, The University of Chicago 2004). As important factors the lack of recentconstruction experience, regulatory and political obstacles related to obtaining construc-tion and operating licenses for new plants, and the long payback period associated withhigh capital costs and large plant size are mentioned. In addition to the direct costs,
5
different aspects are often suggested to entail external costs. They include radioactivityreleases in routine operation, radioactive waste disposal, future financial liabilities fromdecommissioning and dismantling, and severe accidents. Under current regulation, capi-tal and operating costs and fuel-cycle facilities internalise most of the potential externalcosts. In particular, high level waste disposal costs, until final repositories are in opera-tion, are treated as future financial liabilities and included in the fuel costs. With regardto effects of severe accidents the third-party liability system has been implemented asa special legal regime to provide insurance coverage for any potential damages. For thecase of Germany, it is to be noted that the question of nuclear waste treatment and finaldisposal is, however, not yet fully decided on political level. Uncertainties are, moreover,still associated with the valuation of severe accidents. They are discussed in economics asa part of the more general debate on the valuation of low-probability high-consequencenegative events (e.g. Eeckhoudt et al. 2000, Itaoko et al. 2006, Kunreuther et al. 2001,Schneider and Zweifel 2004). While these studies have considerably been refining therespective tools and considerations, still more research needs to be done, notably forGermany, in order to provide for a well-pondered basis for political decisions.
In view of the wide range of figures in the literature, two nuclear cost scenarios are con-sidered. The low-cost scenario (Nl) assumes specific investment costs of 1,800 T-¤/MWe,as a moderate lower bound oriented towards Enquetekommission (2002) and IEA andNEA (2005), the high-cost scenario (Nh) 2,600 T-¤/MWe, as a moderate upper boundaccording to the more pessimistic Enquetekommission (2002) figures.4 For both cases,the specific decommissioning costs are assumed to amount to 155 T-¤/MWe, the fixedspecific annual O&M costs to 30 T-¤/MWe and the variable specific O&M costs to3.6 ¤/MWh (IEA and NEA 2005: 120). Nuclear fuel costs, comprising front- and back-end costs, are expected to continue to stay constant in the next decades (The Universityof Chicago 2004). Following the indications in IEA and NEA (2005: 44) for Germany,the total nuclear fuel cycle unit costs are assumed to amount to 4.0 ¤/MWh.
Abatement costs. The pollution intensity of a technology depends on the emissionfactor of its fuel input and a plant’s gross thermal efficiency. The emission factor isdefined as the mean mass of pollutant per energy unit (calorific value) of the fuel input.For the subsequent analysis, CO2 emission factors for coal and gas of 0.338 and 0.2t CO2/MWh input, respectively, are assumed (BEI 2004: A–9). In the given analyticalsetting the utility disposes over two abatement options. First, it can introduce a new lesspolluting technology. Second, it can enact an end-of-pipe abatement technology refiningits existing and, if polluting, its new electric generation technology. Only in the secondcase particular abatement costs arise. The debate on end-of-pipe abatement has recentlybeen revived by the development of CCS technologies as a major approach for the (quasi)complete abatement of carbon emissions of (large) power stations (EWI and Prognos2005: 121–125, WI et al. 2007). In conventional processes, CO2 is captured from theflue gases produced during combustion. Best known is chemical absorption via aqueousalkaline solvents such as monoethanolamine (MEA). It is expected to be among the firstsuch technologies available by 2015. Thus far, only relatively broad cost estimates for
4 Neither BEI (2004) nor EWI and Prognos (2005) particularly treat nuclear power.
6
CO2 capture, transport and storage have been indicated. Following EWI and Prognos(2005: 125), specific CCS full cost ranges of 37–70 and 32–65 ¤/t CO2 for coal and gas,respectively, are assumed. In the analysis below, AUC of 10–60 ¤/t are considered.
3.3 Policy parameters
Environmental policy. For the utility, environmental policy becomes relevant in form ofa positive emission price, τe. τe(t) indicates the constant mean real price per ton CO2 forthe period t under consideration. It directly imposes the emission costs to the pollutingutility. The sensitivity range for τe in the analysis below is oriented towards the CO2
prices which have been occurring under the EU emission trading scheme to which theEU Member States, including Germany, are subject since 2005. In its first phase 2005–2007 CO2 prices have been ranging between 6 and 30 ¤/t, with a core range of about15–25 ¤/t (e.g. Borak et al. 2006, ECX 2007, Sijm et al. 2005, 2006, Uhrig-Homburg andWagner 2007).5 In the second period the supply of EU allowances (EUA) will be reducedas compared to the first and later on generally continue to decrease, such that for anat best similarly decreasing demand, non-decreasing prices might be expected. However,notably in view of ongoing discussions concerning, e.g., the initial allowance allocation,the banking option, and polluter participation more generally, concrete projections for2015 and later remain difficult. The penalty levels for illegal emissions, fined with 40 ¤/tin the first trading period and 100 ¤/t from the second period onwards, set a neat upperbound for the expected price development. For the environmental-policy parameter, τe,in this study a sensitivity range of 0–60 ¤/t is considered. The range of 5–30 ¤/t istaken as its relevant range in the period under consideration, i.e. the range in which CO2
prices are expected to stay most likely.Technology policy. A power-plant construction project should yield at least the return
of an alternative investment on financial markets. This is generally equivalent to havinga positive net present value. Decisive for its calculation is the real imputed interest rate.It derives as the mean of the (real) rates of return on equity and debt weighted with thefractions of equity and debt financing, respectively. To account for the distorted financialmarkets, the analysis below considers a private (benchmark) level of the real imputedinterest rate (rp) as deriving from the utility’s market observations as against a range ofsocially optimal ones (rs). For convenience and corresponding to the common practicein the literature, no distinction is made regarding the specific financing conditions ofparticular technologies. The welfare implications of the time-preference distortion arequantified at the deviation of the UCel at the busbar from their socially optimal level.
In the cited studies the discounting issue has been treated in varying degrees of inten-sity. IEA and NEA (2005: 183) considers a 5% discount rate as approximately consistentwith investments in the former regulated environment, and 10% as a proxy for power-plant investments in deregulated markets in the U.S. MIT (2003) and The University ofChicago (2004) calculate for upcoming US nuclear power investments with rp = 0.125.
5 At present, studies on the issue have not left the working-paper status. In this paper no distinctionis made between spot and forward prices. Preliminary results indicate that the latter exceed the firstand that forward markets lead the price discovery process.
7
For Germany, IEA and NEA (2005: 122f) adopts the general 5 and 10% rates, whileBEI (2004: 8-2) uses an 8% imputed interest rate. Schneider (1998: 51) considers sce-narios with real rates of ‘low’ 5.7, ‘probable’ 8.9, and ‘high’ 12.2%. EWI and Prognos(2005: 295) uses a 10% rate, referring to Enzensberger (2003) who found rp ∈ [0.08, 0.12]for respective investments in Germany.6 Social discount rates, on the other hand, havethus far been determined in different ways. Germany has been applying a 3% rate forthe evaluation of public projects based on the federal government’s average real refi-nancing rate over the past five years, France an 8% real rate derived with respect tothe marginal product of capital. In the UK, until 2003 a 6% rate was applied based onconsiderations of both capital costs and social time preferences. After re-basing it thenentirely on social time preferences, it dropped to 3.5%. Evans and Sezer (2004, 2005)apply the latter approach to major EU and OECD countries, finding, e.g., for France areal rate of 3.2, for Germany 4.3, for Japan 5.0, for the UK 4.0, and for the U.S. 4.6%.Denmark and Ireland display the extrema with 2.4 and 6.8%, respectively. The variationbetween the rates is mainly due to differences in the national per capita growth ratesin the considered years, 1970–2001. Given the current state of research, the above ratesfor power-plant financing and the social discount rates are derived with respect to bothdifferent models and data. Inhowfar the latter rates are actually consistent with thoseoccuring on undistorted financial markets is an important matter for further investiga-tion. Probably, the present figures rather describe a lower bound for the socially optimaldiscounting of private investments. This paper assumes rp = 0.1. For the social level asensitivity range of rs ∈ [0.02, 0.08] is considered.
4 Technology choice under environmental and technology policies
This section studies based on the above assumptions the single and combined influencesof environmental and technology policies on the utility’s choice of a new electric genera-tion technology, first in the absence, then the presence of a CO2 abatement technology.
4.1 Technology choice without abatement technology
In the no-policy benchmark, the new hard-coal power plant displays the lowest unit costsof electricity (UCT2
), before gas, nuclear in the Nl and Nh scenarios (Table 2).
UCT2
rp C G Nl Nh
0.1 37.12 40.33 46.05 58.16
Table 2: Unit costs of electricity at busbar of new plant alternatives in no-policy bench-mark (¤/MWh) (own calculations).
To understand the following results it is useful to know the UCT2contributions of the
single cost components distinguished in appendix A.1 (Table 3). Striking are the high
6 Enquetekommission (2002) does not contain a treatment of the discounting issue.
8
CC and low FC shares in the cases of nuclear, and the high FC and low CC shares inthe case of gas. The DC share amounts in any case to less than 1%.
Shares in UCT2
C G Nl Nh
CC 41.6 18.8 59.2 67.7OMC 20.5 10.2 16.5 13.1FC 37.7 70.9 23.5 18.6DC 0.2 0.1 0.8 0.6
Table 3: Shares of capital investment, O&M, fuel, and decommissioning costs in unitcosts of electricity of new plant alternatives in no-policy benchmark, discounted to yearof commissioning (percent) (own calculations).
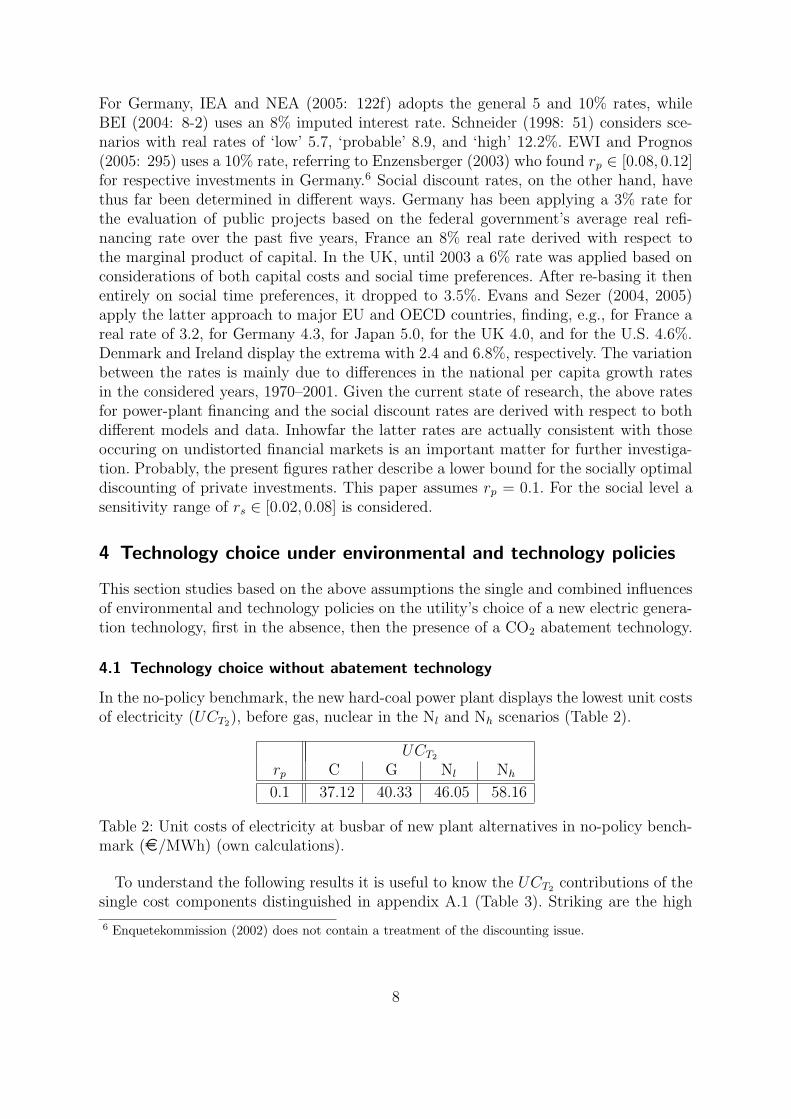
4.1.1 Sensitivity under environmental policy
The UCT2behavior of the reference power plants if an emission price τe as described in
section 3.3 is implemented is displayed in Figure 1. Hard coal remains the first alternative
35,00
40,00
45,00
50,00
55,00
60,00
65,00
70,00
75,00
80,00
0 5 10 15 20 25 30 35 40 45 50 55 60
C G N_l N_h
PSfrag replacements
UC
T2
τe
Figure 1: Unit costs of electricity of new plant alternatives for varying CO2-price levels(¤/t) under rp = 0.1 (¤/MWh) (own calculations).
as long as τe ≤ 9.75 ¤/t. For τe ∈ (9.75, 17.0(53.5)] ¤/t gas dominates in the Nl (Nh)scenario. For τe > 17.0 (53.5) ¤/t nuclear is the first option. The varied UCT2
impactof environmental policy reflects the different emission factors and efficiencies among thetechnologies. Accordingly, gas becomes, despite its high FC share, dominant over coal
9
for lower τe within the relevant range. For nuclear power there is a certain τe at whichits ecological advantage also turns into an economic.
4.1.2 Sensitivity under technology policy
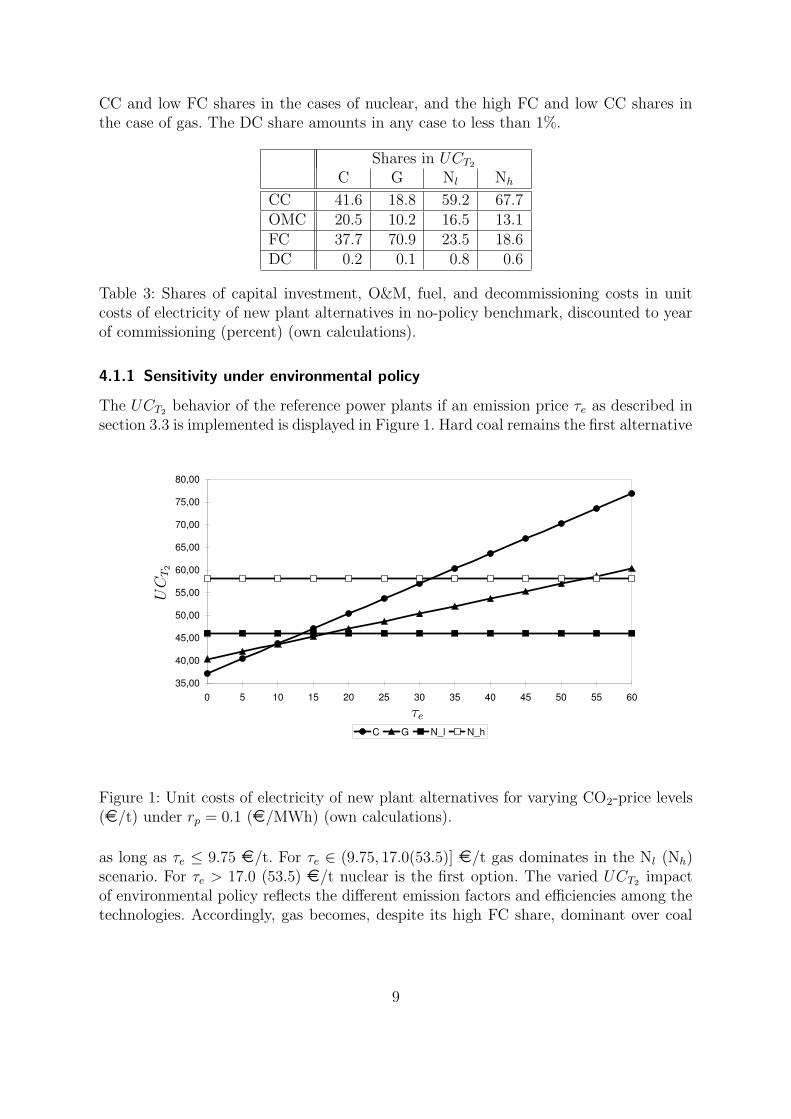
Figure 2 shows the UCT2behavior of the new plant alternatives if the socially optimal
level of the imputed interest rates is implemented as described in section 3.3. Apart from
25,00
30,00
35,00
40,00
45,00
50,00
55,00
0,08 0,075 0,07 0,065 0,06 0,055 0,05 0,045 0,04 0,035 0,03 0,025 0,02
C G N_l N_h
PSfrag replacements
UC
T2
rs
Figure 2: Unit costs of electricity of new plant alternatives for varying levels of socialimputed interest rate (¤/MWh) (own calculations).
the reversal between gas and nuclear in the Nl scenario as second cheapest technologyfor rs < 0.054, the technology ranking remains unaltered over the considered rs range ascompared to the no-policy benchmark. The varied UCT2
impact of the rs implementationamong the technologies depends on their different CC shares, clearly dominating a slightcounteracting DC impact. It is, accordingly, the strongest in the case of nuclear inthe Nh scenario, before nuclear in the Nl scenario, coal and gas. The UCT2
distortioncan be calculated as the difference between their levels evaluated at rp and rs. Forrs ∈ [0.02, 0.08], for coal, gas, and nuclear in the Nl (Nh) scenario the respectivedistortions range between 2.12–7.24, 1.04–3.55, and 3.68–12.48 (5.36–18.25) ¤/MWh,or 5.7–19.5, 2.6–8.8, and 8.0–27.1 (9.2–31.4)% of the distorted UCT2
, respectively.
4.1.3 Sensitivity under environmental and technology policies combined
The combined influence of environmental and technology policies in the Nl and the Nh
scenario, respectively, over the τe range considered for rp = 0.1 and exemplary rs of0.08 and 0.02 can be seen from the strong UCT2
lines and their parallels in Figures 3
10
and 4 below. In the Nl scenario, for rs ∈ [0.02, 0.08] coal remains the first option untilτe ∈ [5.5, 11.0] ¤/t. Above τe ∈ [5.5, 11.0] ¤/t, nuclear directly follows coal as mosteconomic option. In the Nh scenario, for rs ∈ [0.04, 0.08] coal remains the least-costoption until τe ∈ [13.0, 18.5] ¤/t, for rs ∈ [0.02, 0.04) until τe ∈ [15.0, 18.5) ¤/t. Forrs ∈ [0.04, 0.08] gas is the first option for τe in intervals of (13.0,40.5]–18.5 ¤/t, butvanishes as such for rs < 0.04 irrespective of τe. For rs ∈ [0.04, 0.08] nuclear follows gasas the most economic option above τe ∈ [18.5, 40.5] ¤/t, for rs ∈ [0.02, 0.04) directly coalabove τe ∈ [15.0, 18.5) ¤/t. The impact of the additional technology-policy enactmentto environmental policy reflects its effect in the case of technology policy alone. Coaltends to be favored, though less than nuclear. Gas persists as least-cost option only inthe Nh scenario, for more moderate levels of technology policy. Also there it is, however,succeeded by nuclear for rs ∈ [0.04, 0.0625) already within the relevant τe range.
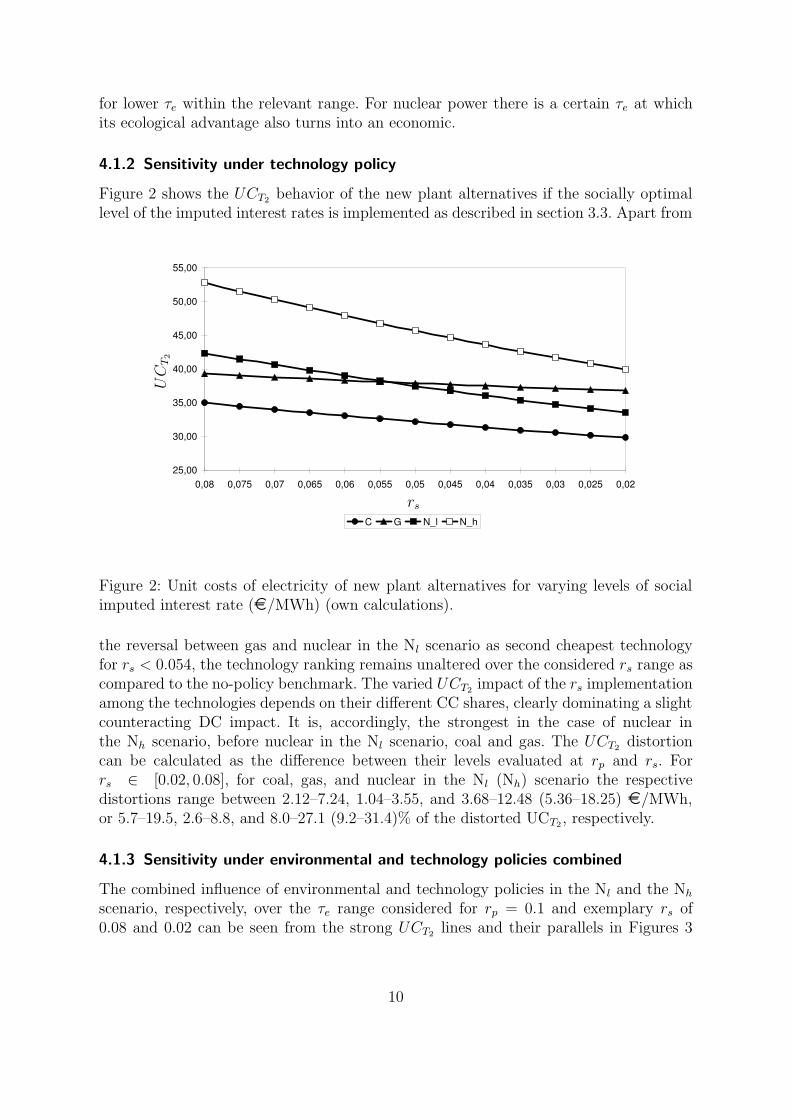
4.2 Technology choice with abatement technology
The end-of-pipe abatement technology with fixed abatement unit costs (AUC) may con-stitute a relevant option only if environmental policy is enacted. It fixes the UCT2
for anyτe ≥ AUC at the level they have for the given AUC. Under environmental policy alone,in both scenarios thus coal remains the least-cost option until τe ≤ 9.75 ¤/t irrespectiveof the AUC level. For τe ∈ (9.75, 17.0(53.5)] ¤/t gas is the most economic option in theNl (Nh) scenario irrespective of the AUC level, and for AUC ∈ [10.0, 17.0(53.5)] ¤/tand τe > 9.75 ¤/t. Nuclear power is the first option for τe, AUC > 17.0 (53.5) ¤/t.
30,00
35,00
40,00
45,00
50,00
0 5 10 15 20 25 30 35 40
C (0.1) G (0.1) N_l (0.1)C (0.08,0.02) G (0.08,0.02) N_l (0.08,0.02)
PSfrag replacements
UC
T2
τe
Figure 3: Unit costs of electricity for varying CO2-price levels and abatement unit costlevels between 10 and 60 ¤/t in steps of 10 ¤ under rp = 0.1 and social imputed interestrates of 0.08, 0.02 in Nl scenario (¤/MWh) (own calculations).
11
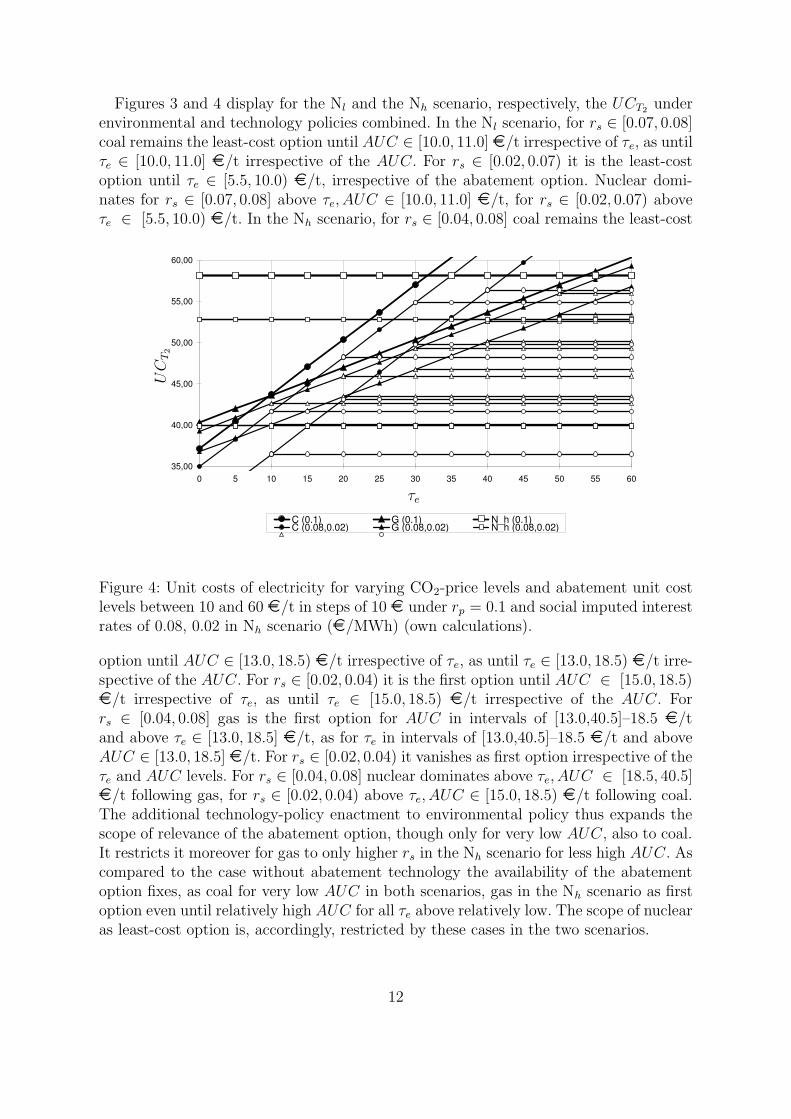
Figures 3 and 4 display for the Nl and the Nh scenario, respectively, the UCT2under
environmental and technology policies combined. In the Nl scenario, for rs ∈ [0.07, 0.08]coal remains the least-cost option until AUC ∈ [10.0, 11.0] ¤/t irrespective of τe, as untilτe ∈ [10.0, 11.0] ¤/t irrespective of the AUC. For rs ∈ [0.02, 0.07) it is the least-costoption until τe ∈ [5.5, 10.0) ¤/t, irrespective of the abatement option. Nuclear domi-nates for rs ∈ [0.07, 0.08] above τe, AUC ∈ [10.0, 11.0] ¤/t, for rs ∈ [0.02, 0.07) aboveτe ∈ [5.5, 10.0) ¤/t. In the Nh scenario, for rs ∈ [0.04, 0.08] coal remains the least-cost
35,00
40,00
45,00
50,00
55,00
60,00
0 5 10 15 20 25 30 35 40 45 50 55 60
C (0.1) G (0.1) N_h (0.1)C (0.08,0.02) G (0.08,0.02) N_h (0.08,0.02)
PSfrag replacements
UC
T2
τe
Figure 4: Unit costs of electricity for varying CO2-price levels and abatement unit costlevels between 10 and 60 ¤/t in steps of 10 ¤ under rp = 0.1 and social imputed interestrates of 0.08, 0.02 in Nh scenario (¤/MWh) (own calculations).
option until AUC ∈ [13.0, 18.5) ¤/t irrespective of τe, as until τe ∈ [13.0, 18.5) ¤/t irre-spective of the AUC. For rs ∈ [0.02, 0.04) it is the first option until AUC ∈ [15.0, 18.5)¤/t irrespective of τe, as until τe ∈ [15.0, 18.5) ¤/t irrespective of the AUC. Forrs ∈ [0.04, 0.08] gas is the first option for AUC in intervals of [13.0,40.5]–18.5 ¤/tand above τe ∈ [13.0, 18.5] ¤/t, as for τe in intervals of [13.0,40.5]–18.5 ¤/t and aboveAUC ∈ [13.0, 18.5] ¤/t. For rs ∈ [0.02, 0.04) it vanishes as first option irrespective of theτe and AUC levels. For rs ∈ [0.04, 0.08] nuclear dominates above τe, AUC ∈ [18.5, 40.5]¤/t following gas, for rs ∈ [0.02, 0.04) above τe, AUC ∈ [15.0, 18.5) ¤/t following coal.The additional technology-policy enactment to environmental policy thus expands thescope of relevance of the abatement option, though only for very low AUC, also to coal.It restricts it moreover for gas to only higher rs in the Nh scenario for less high AUC. Ascompared to the case without abatement technology the availability of the abatementoption fixes, as coal for very low AUC in both scenarios, gas in the Nh scenario as firstoption even until relatively high AUC for all τe above relatively low. The scope of nuclearas least-cost option is, accordingly, restricted by these cases in the two scenarios.
12
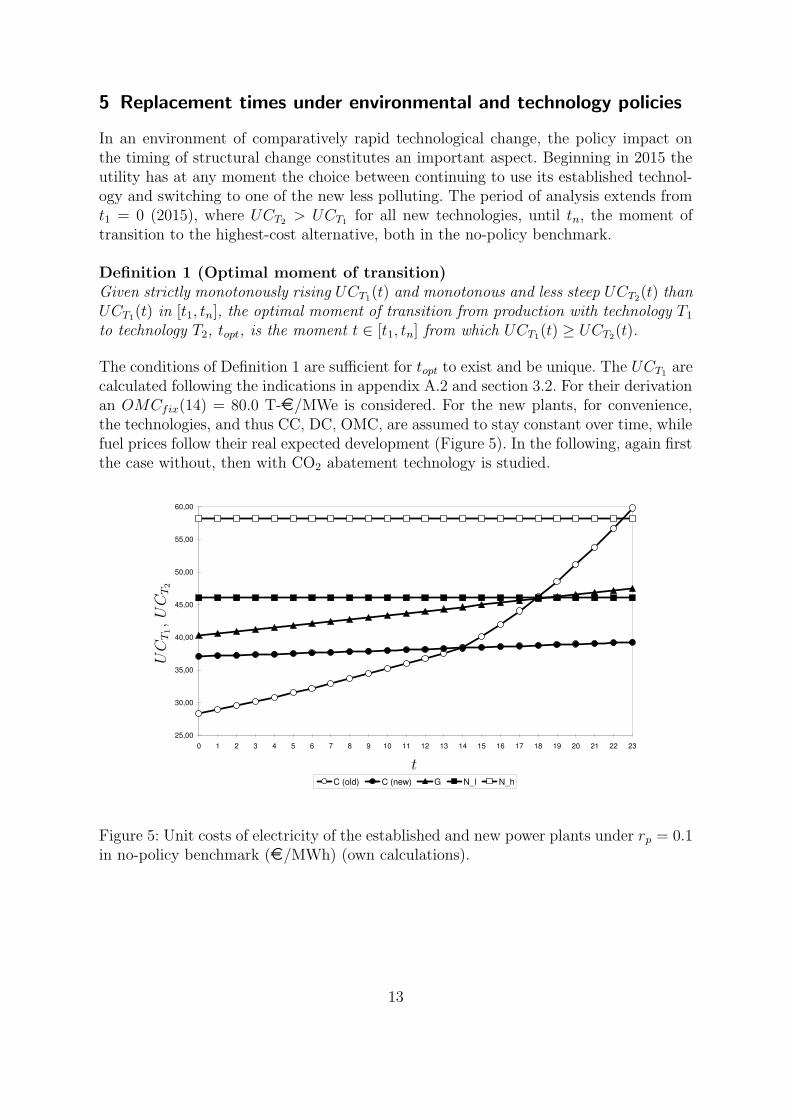
5 Replacement times under environmental and technology policies
In an environment of comparatively rapid technological change, the policy impact onthe timing of structural change constitutes an important aspect. Beginning in 2015 theutility has at any moment the choice between continuing to use its established technol-ogy and switching to one of the new less polluting. The period of analysis extends fromt1 = 0 (2015), where UCT2
> UCT1for all new technologies, until tn, the moment of
transition to the highest-cost alternative, both in the no-policy benchmark.
Definition 1 (Optimal moment of transition)Given strictly monotonously rising UCT1
(t) and monotonous and less steep UCT2(t) than
UCT1(t) in [t1, tn], the optimal moment of transition from production with technology T1
to technology T2, topt, is the moment t ∈ [t1, tn] from which UCT1(t) ≥ UCT2
(t).
The conditions of Definition 1 are sufficient for topt to exist and be unique. The UCT1are
calculated following the indications in appendix A.2 and section 3.2. For their derivationan OMCfix(14) = 80.0 T-¤/MWe is considered. For the new plants, for convenience,the technologies, and thus CC, DC, OMC, are assumed to stay constant over time, whilefuel prices follow their real expected development (Figure 5). In the following, again firstthe case without, then with CO2 abatement technology is studied.
25,00
30,00
35,00
40,00
45,00
50,00
55,00
60,00
0 1 2 3 4 5 6 7 8 9 10 11 12 13 14 15 16 17 18 19 20 21 22 23
C (old) C (new) G N_l N_h
PSfrag replacements
UC
T1,U
CT2
t
Figure 5: Unit costs of electricity of the established and new power plants under rp = 0.1in no-policy benchmark (¤/MWh) (own calculations).
13
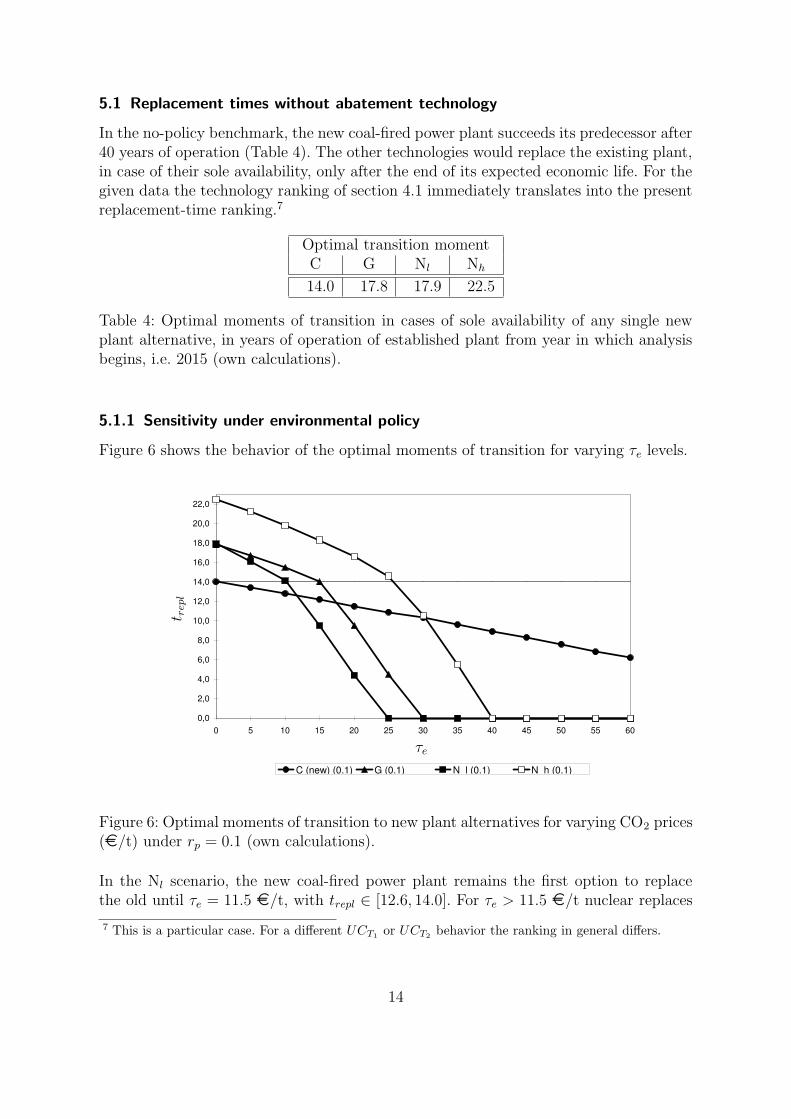
5.1 Replacement times without abatement technology
In the no-policy benchmark, the new coal-fired power plant succeeds its predecessor after40 years of operation (Table 4). The other technologies would replace the existing plant,in case of their sole availability, only after the end of its expected economic life. For thegiven data the technology ranking of section 4.1 immediately translates into the presentreplacement-time ranking.7
Optimal transition momentC G Nl Nh
14.0 17.8 17.9 22.5
Table 4: Optimal moments of transition in cases of sole availability of any single newplant alternative, in years of operation of established plant from year in which analysisbegins, i.e. 2015 (own calculations).
5.1.1 Sensitivity under environmental policy
Figure 6 shows the behavior of the optimal moments of transition for varying τe levels.
0,0
2,0
4,0
6,0
8,0
10,0
12,0
14,0
16,0
18,0
20,0
22,0
0 5 10 15 20 25 30 35 40 45 50 55 60
C (new) (0.1) G (0.1) N_l (0.1) N_h (0.1)
PSfrag replacements
t repl
τe
Figure 6: Optimal moments of transition to new plant alternatives for varying CO2 prices(¤/t) under rp = 0.1 (own calculations).
In the Nl scenario, the new coal-fired power plant remains the first option to replacethe old until τe = 11.5 ¤/t, with trepl ∈ [12.6, 14.0]. For τe > 11.5 ¤/t nuclear replaces
7 This is a particular case. For a different UCT1or UCT2
behavior the ranking in general differs.
14
it with trepl ∈ [0.0, 12.5], for τe ≥ 23.5 ¤/t immediately (i.e. in t = 0). Gas playsno role as first option. In the Nh scenario, the new coal-fired plant remains the firstoption until τe = 17.75 ¤/t, with trepl ∈ [11.8, 14.0]. For τe ∈ (17.75, 53.5] ¤/t gasreplaces the established plant, with trepl ∈ [0, 11.8), immediately for τe ≥ 28.75 ¤/t. Forτe > 53.5 ¤/t nuclear is the first alternative, replacing the old plant immediately. Thedifferences among the technologies mainly depend on the varied differences in emissionfactors and net thermal efficiencies between the established and the new technologies.Moreover, the trepl shapes differ over the τe range, due to the particular UCT1
shape overtime, depending on whether the optimal moments of transition lie beyond or within theexpected economic lifetime of the established plant.
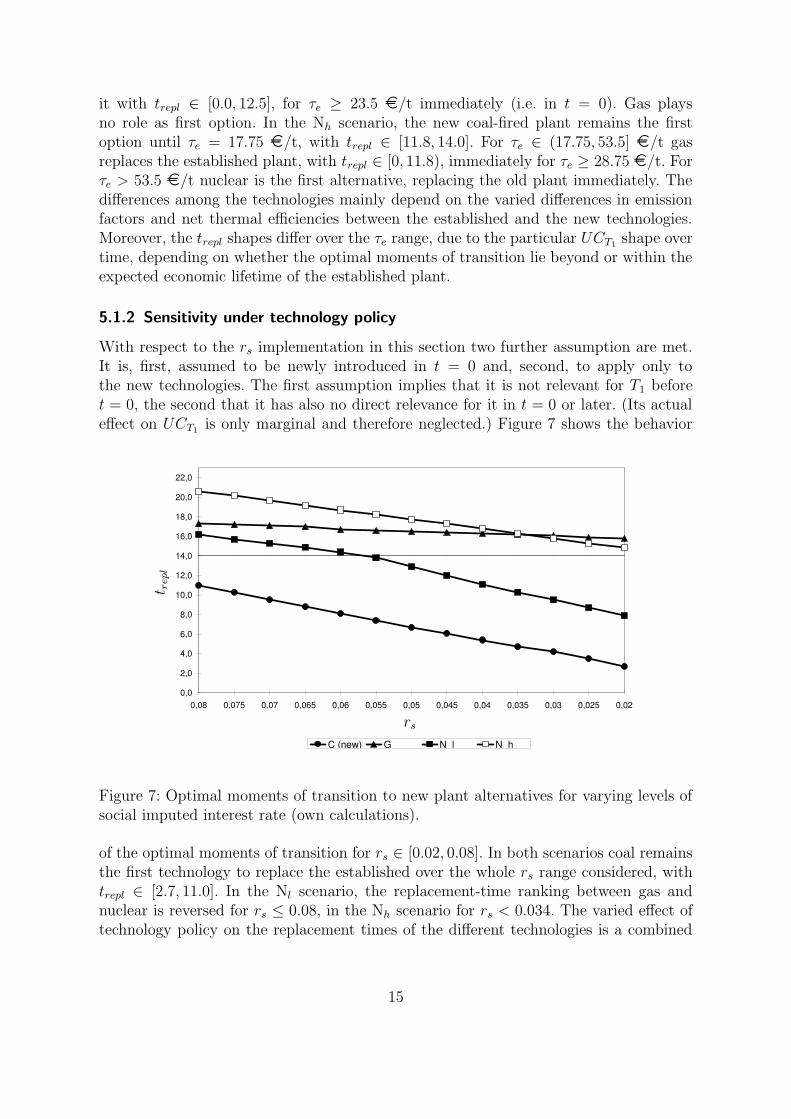
5.1.2 Sensitivity under technology policy
With respect to the rs implementation in this section two further assumption are met.It is, first, assumed to be newly introduced in t = 0 and, second, to apply only tothe new technologies. The first assumption implies that it is not relevant for T1 beforet = 0, the second that it has also no direct relevance for it in t = 0 or later. (Its actualeffect on UCT1
is only marginal and therefore neglected.) Figure 7 shows the behavior
0,0
2,0
4,0
6,0
8,0
10,0
12,0
14,0
16,0
18,0
20,0
22,0
0,08 0,075 0,07 0,065 0,06 0,055 0,05 0,045 0,04 0,035 0,03 0,025 0,02
C (new) G N_l N_h
PSfrag replacements
t repl
rs
Figure 7: Optimal moments of transition to new plant alternatives for varying levels ofsocial imputed interest rate (own calculations).
of the optimal moments of transition for rs ∈ [0.02, 0.08]. In both scenarios coal remainsthe first technology to replace the established over the whole rs range considered, withtrepl ∈ [2.7, 11.0]. In the Nl scenario, the replacement-time ranking between gas andnuclear is reversed for rs ≤ 0.08, in the Nh scenario for rs < 0.034. The varied effect oftechnology policy on the replacement times of the different technologies is a combined
15
outcome of, first, its varied UCT1effect and, second, the particular shapes of the different
UCel curves, especially the UCT1curve. The negative UCT2
impact of technology policymaterialises here in the higher replacement-time reductions the flatter the UCT1
curveat the place in question. For the rs levels considered, the effect is accordingly, in general,the strongest for coal, before nuclear in the Nl scenario, nuclear in the Nh scenario,and gas. An exception to this rule is nuclear in the Nl scenario. For rs ∈ [0.02, 0.057],where its optimal moments of transition lie beyond the expected economic life of theestablished power plant, it is, in absolute terms, less strongly affected than in the Nh
scenario. Moreover, for rs < 0.057, where its optimal moments of transition lie withinthe expected economic life of the established power plant, it is, at the margin, in absoluteterms, at least as strongly affected as coal, and usually more.
5.1.3 Sensitivity under environmental and technology policies
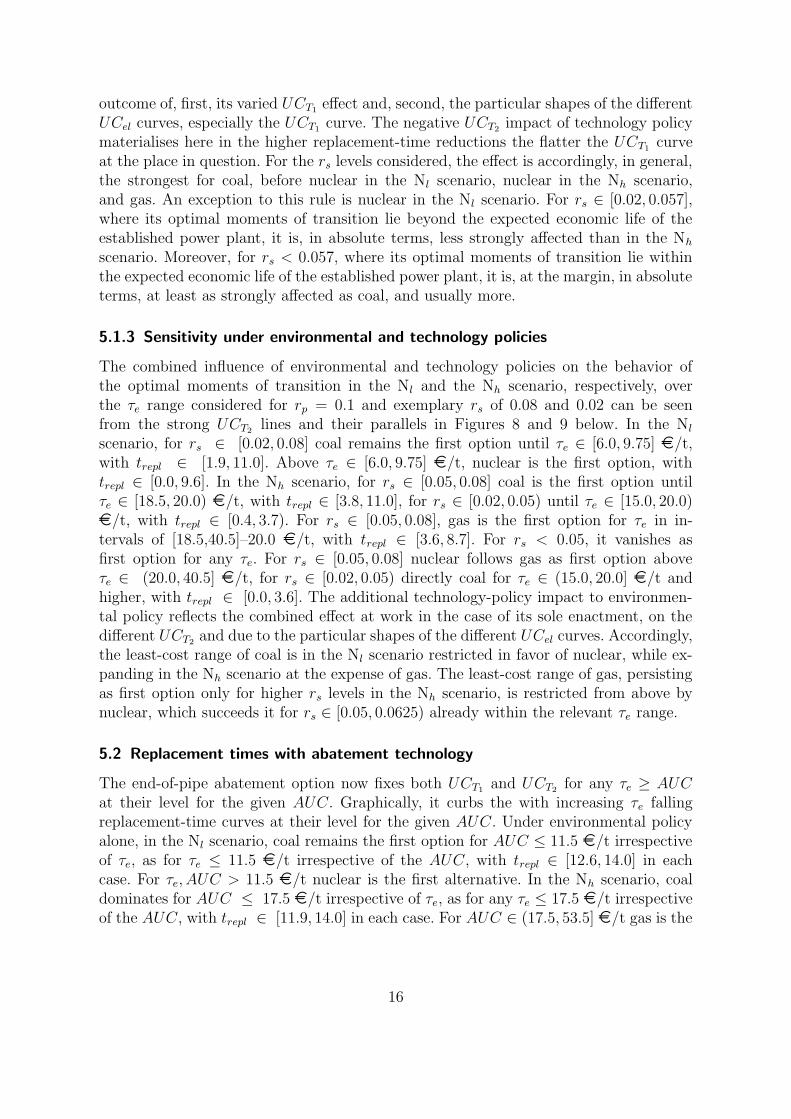
The combined influence of environmental and technology policies on the behavior ofthe optimal moments of transition in the Nl and the Nh scenario, respectively, overthe τe range considered for rp = 0.1 and exemplary rs of 0.08 and 0.02 can be seenfrom the strong UCT2
lines and their parallels in Figures 8 and 9 below. In the Nl
scenario, for rs ∈ [0.02, 0.08] coal remains the first option until τe ∈ [6.0, 9.75] ¤/t,with trepl ∈ [1.9, 11.0]. Above τe ∈ [6.0, 9.75] ¤/t, nuclear is the first option, withtrepl ∈ [0.0, 9.6]. In the Nh scenario, for rs ∈ [0.05, 0.08] coal is the first option untilτe ∈ [18.5, 20.0) ¤/t, with trepl ∈ [3.8, 11.0], for rs ∈ [0.02, 0.05) until τe ∈ [15.0, 20.0)¤/t, with trepl ∈ [0.4, 3.7). For rs ∈ [0.05, 0.08], gas is the first option for τe in in-tervals of [18.5,40.5]–20.0 ¤/t, with trepl ∈ [3.6, 8.7]. For rs < 0.05, it vanishes asfirst option for any τe. For rs ∈ [0.05, 0.08] nuclear follows gas as first option aboveτe ∈ (20.0, 40.5] ¤/t, for rs ∈ [0.02, 0.05) directly coal for τe ∈ (15.0, 20.0] ¤/t andhigher, with trepl ∈ [0.0, 3.6]. The additional technology-policy impact to environmen-tal policy reflects the combined effect at work in the case of its sole enactment, on thedifferent UCT2
and due to the particular shapes of the different UCel curves. Accordingly,the least-cost range of coal is in the Nl scenario restricted in favor of nuclear, while ex-panding in the Nh scenario at the expense of gas. The least-cost range of gas, persistingas first option only for higher rs levels in the Nh scenario, is restricted from above bynuclear, which succeeds it for rs ∈ [0.05, 0.0625) already within the relevant τe range.
5.2 Replacement times with abatement technology
The end-of-pipe abatement option now fixes both UCT1and UCT2
for any τe ≥ AUC
at their level for the given AUC. Graphically, it curbs the with increasing τe fallingreplacement-time curves at their level for the given AUC. Under environmental policyalone, in the Nl scenario, coal remains the first option for AUC ≤ 11.5 ¤/t irrespectiveof τe, as for τe ≤ 11.5 ¤/t irrespective of the AUC, with trepl ∈ [12.6, 14.0] in eachcase. For τe, AUC > 11.5 ¤/t nuclear is the first alternative. In the Nh scenario, coaldominates for AUC ≤ 17.5 ¤/t irrespective of τe, as for any τe ≤ 17.5 ¤/t irrespectiveof the AUC, with trepl ∈ [11.9, 14.0] in each case. For AUC ∈ (17.5, 53.5] ¤/t gas is the
16
first alternative for any τe > 17.5 ¤/t, as for τe ∈ (17.5, 53.5] ¤/t if AUC > 17.5 ¤/t,with trepl ∈ [0.0, 11.9] in each case. Nuclear is the first option for τe, AUC > 53.5 ¤/t.
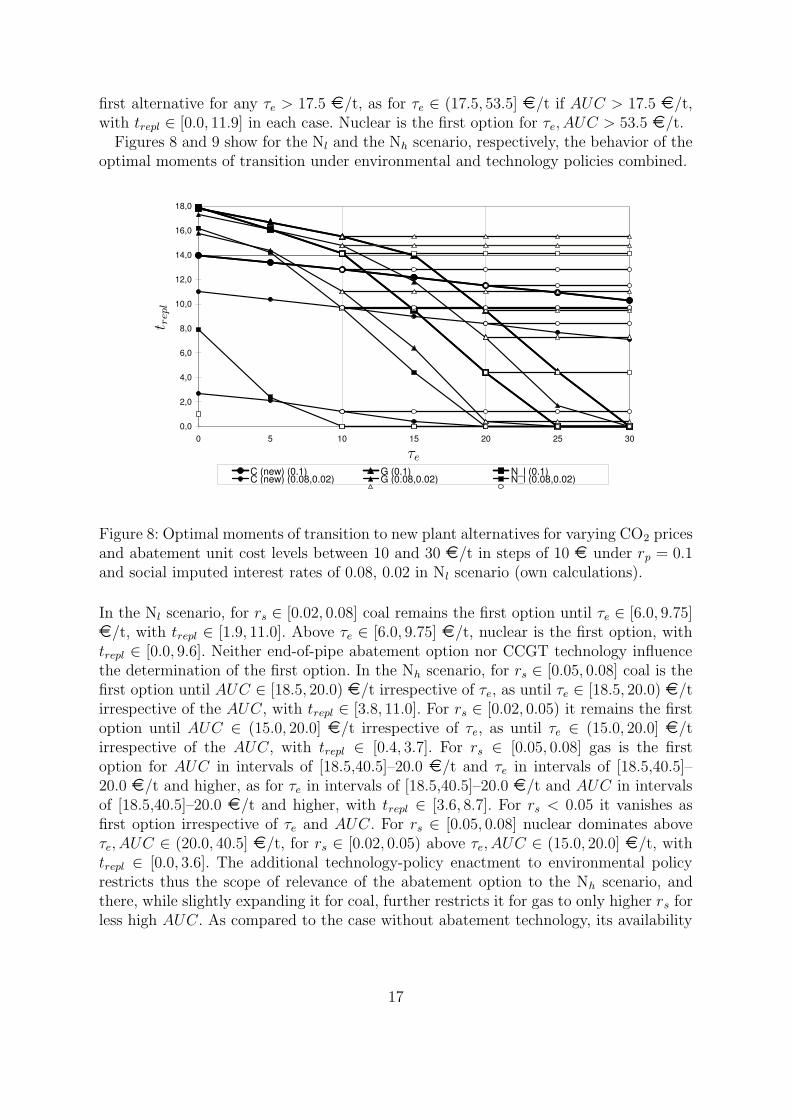
Figures 8 and 9 show for the Nl and the Nh scenario, respectively, the behavior of theoptimal moments of transition under environmental and technology policies combined.
0,0
2,0
4,0
6,0
8,0
10,0
12,0
14,0
16,0
18,0
0 5 10 15 20 25 30
C (new) (0.1) G (0.1) N_l (0.1)C (new) (0.08,0.02) G (0.08,0.02) N_l (0.08,0.02)
PSfrag replacements
t repl
τe
Figure 8: Optimal moments of transition to new plant alternatives for varying CO2 pricesand abatement unit cost levels between 10 and 30 ¤/t in steps of 10 ¤ under rp = 0.1and social imputed interest rates of 0.08, 0.02 in Nl scenario (own calculations).
In the Nl scenario, for rs ∈ [0.02, 0.08] coal remains the first option until τe ∈ [6.0, 9.75]¤/t, with trepl ∈ [1.9, 11.0]. Above τe ∈ [6.0, 9.75] ¤/t, nuclear is the first option, withtrepl ∈ [0.0, 9.6]. Neither end-of-pipe abatement option nor CCGT technology influencethe determination of the first option. In the Nh scenario, for rs ∈ [0.05, 0.08] coal is thefirst option until AUC ∈ [18.5, 20.0) ¤/t irrespective of τe, as until τe ∈ [18.5, 20.0) ¤/tirrespective of the AUC, with trepl ∈ [3.8, 11.0]. For rs ∈ [0.02, 0.05) it remains the firstoption until AUC ∈ (15.0, 20.0] ¤/t irrespective of τe, as until τe ∈ (15.0, 20.0] ¤/tirrespective of the AUC, with trepl ∈ [0.4, 3.7]. For rs ∈ [0.05, 0.08] gas is the firstoption for AUC in intervals of [18.5,40.5]–20.0 ¤/t and τe in intervals of [18.5,40.5]–20.0 ¤/t and higher, as for τe in intervals of [18.5,40.5]–20.0 ¤/t and AUC in intervalsof [18.5,40.5]–20.0 ¤/t and higher, with trepl ∈ [3.6, 8.7]. For rs < 0.05 it vanishes asfirst option irrespective of τe and AUC. For rs ∈ [0.05, 0.08] nuclear dominates aboveτe, AUC ∈ (20.0, 40.5] ¤/t, for rs ∈ [0.02, 0.05) above τe, AUC ∈ (15.0, 20.0] ¤/t, withtrepl ∈ [0.0, 3.6]. The additional technology-policy enactment to environmental policyrestricts thus the scope of relevance of the abatement option to the Nh scenario, andthere, while slightly expanding it for coal, further restricts it for gas to only higher rs forless high AUC. As compared to the case without abatement technology, its availability
17
0,0
2,0
4,0
6,0
8,0
10,0
12,0
14,0
16,0
18,0
20,0
22,0
0 5 10 15 20 25 30 35 40
C (new) (0.1) G (0.1) N_h (0.1)C (new) (0.08,0.02) G (0.08,0.02) N_h (0.08,0.02)
PSfrag replacements
t repl
τe
Figure 9: Optimal moments of transition to new plant alternatives for varying CO2 pricesand abatement unit cost levels between 10 and 40 ¤/t in steps of 10 ¤ under rp = 0.1and social imputed interest rates of 0.08, 0.02 in Nh scenario (own calculations).
fixes in the Nh scenario coal until low AUC and gas even until relatively high AUC
for all τe above relatively low as first option. The scope of nuclear as first option is,accordingly, restricted only in the Nh scenario.
6 Summary and discussion of results
This section summarises and discusses the results of sections 4 and 5 in four points.(1) Environmental policy alone raises the UCT2
, the more the more polluting a tech-nology, and reduces the replacement times, the more the cleaner the new technologyas compared to the established. The technology and replacement-time rankings, of coalbefore gas and nuclear in the no-policy benchmark, reverse for τe > 17.0 (53.5) andτe > 17.5 (53.5) ¤/t, respectively, in the Nl (Nh) scenario. While in the earlier studiesBEI (2004) and IEA and NEA (2005) gas becomes profitable over hard coal from higherτe at lower rp (30–35 ¤/t for r = 0.08, 30 ¤/t for r = 0.05, respectively), EWI andPrognos (2005) forecasts for a linearly rising τe until 15 ¤(2000)/t in 2030 a neat cutback of hard coal in favor of gas. For τe ≤ 15 ¤/t the latter projection occurs as roughlyconsistent with the present results for environmental policy alone, even including nuclearin the Nl scenario.
(2) Technology policy lowers the UCT2, the more the higher the technology-specific
capital-investment costs. It also reduces the replacement times as compared to the no-policy benchmark. Due to the particular shapes of the UCel curves, the latter impact is
18
in general the strongest for coal before nuclear and gas. While coal keeps its no-policystatus as first option in both the technology and the replacement-time ranking, in theformer nuclear and gas reverse their order below higher rs levels in the Nl scenario. Inthe latter, nuclear replaces gas as second option over the whole rs range (below lowerrs levels) in the Nl (Nh) scenario. The distortion induced by the split imputed interestrates amounts for rs ∈ [0.02, 0.08] to about 1.0–12.5 (18.5) ¤/MWh or 2.5–27.0 (31.5)%of the distorted UCT2
at the busbar in the Nl (Nh) scenario. It stays thus, e.g., neatly be-low the payments under the German “Erneuerbare-Energien-Gesetz” (EEG, RenewableEnergy Sources Act), which prescribes feed-in tariffs for renewable energy technologies.8
According to it, suppliers receive 457–624, 55–91, and 71.6–150 ¤/MWh for power fromphotovoltaics, wind energy, and geothermal energy, respectively.
(3) The additional enactment of technology policy to environmental policy gener-ally favors coal, but less than nuclear. Gas is never the first option in the Nl scenarioanymore. The technology and replacement-time rankings reverse, as compared to the no-policy benchmark, over the rs range considered for τe ∈ [13.0, 21.0] ([15.0,40.5]) ¤/t andτe ∈ [18.75, 21.0] ([20.0,40.5]) ¤/t, respectively, and higher. Nuclear now competes inboth rankings, for probable τe and rs levels, also in the Nh scenario. This results derivesdeparting from slightly higher CC than in IEA and NEA (2005) in the Nl, and slightlylower CC than in Enquetekommission (2002) in the Nh scenario and contrasts notably tothe latter study. It underlines the importance of the CC level which ultimately realises.
(4) The end-of-pipe abatement option fixes, for τe ≥ AUC, UCT1and UCT2
, and withthem also the replacement times, at their level for those AUC. For τe > AUC, it thusextends the economic life of the established plant and delays the structural change. Underenvironmental policy, it does not affect the results for coal in the technology ranking. Inthe replacement-time ranking it affects them only for very low AUC. Gas is fixed as firstoption for sufficiently low AUC levels, of 10.0–17.0 (53.5) ¤/t in the Nl (Nh) scenarioin the former ranking and AUC ∈ (17.5, 53.5] ¤/t in the Nh scenario in the latter, forany τe within these ranges and higher. The additional enactment of technology policyrestricts its scope of relevance in any case. Nuclear is excluded as first option for any τe,where the abatement option is relevant for coal or gas. The derived AUC ranges to fix atechnology as first option for respective τe coincide only for gas in the Nh scenario withparts of its expected AUC range (section 3.2), also for technology policy. Otherwise,they stay below the relevant ranges, for coal neatly. These results confirm other studies,such as EWI and Prognos (2005), WI et al. (2007), projecting as yet only a minor rolefor CCS technologies in the period under consideration.
7 Conclusion
This paper studies the welfare implications of diverging social and private discount ratesfor investments in the German power industry around 2015 against the standard back-
8 The EEG was first enacted in April 2000, succeeding the 1991 “Stromeinspeisegesetz”, the first actto promote the introduction of renewable energies in Germany by subsidies. Its stated purpose is toincrease the share of electricity from renewable energies to at least 12.5% in 2010 and 20% in 2020.
19
ground of environmental policy. Several results of interest derive. Whether environmentalpolicy alone induces the reversal of the no-policy technology ranking (coal before gasand nuclear) in the middle of, or well beyond the expected CO2-price range depends onwhether the low or the high nuclear cost scenario is considered. In the hypothetic soleimplementation of the social imputed interest rate coal remains the first option over thewhole rs parameter range considered. The order of gas and nuclear may reverse. The dis-tortions implied by the diverging imputed interest rates remain moderate as compared,e.g., to the payments under the German 2000 Renewable Energy Sources Act. The addi-tional implementation of the social imputed interest rate to environmental policy makesnuclear the first option also in the high-cost scenario for probable τe and rs levels. Anew end-of-pipe abatement option delays for sufficiently high τe the introduction of newcleaner technologies. However, according to the derived AUC ranges to fix a technologyas first option only a minor role for CCS technologies is to be expected in the periodunder consideration.
The paper points to different issues for further research. Especially, there is thus far nosystematic literature treating the causes of the split of social and private interest ratesand respective policy implications. To more accurately quantify the discount-rate dis-tortion technology-specific financing conditions should moreover be taken into account.As regards particular technologies, despite advancing research the nuclear option is tobe further investigated for Germany. For a more complete comparison among relevanttechnological options the extension of the present analysis to renewable energy sourcesis desirable. Interesting differentiations to the present results could derive from the ex-tension of the analysis in section 5 to real option values as associated with the waitingto invest in new technologies. The development of a financing model better accountingfor the utilities’ varied risk exposure after liberalisation remains a pending task.
Appendix
A.1 Financial model
A.1.1 Capital costs
The capital costs of a power plant comprise its capital-investment and decommissioning costs.9
The two cost types occur before commissioning and after the end of a plant’s operating life,respectively. They constitute one-time costs.
The capital-investment costs, CC, consist of the power plant’s construction-investment costsand the imputed interest payment. The construction-investment costs, Ic, derive as the productof technology specific investment costs, Isp, and net installed capacity ICnet,
Ic = IspICnet . (A.1)
The CC are included in the annual cost analysis via the cost-accounting depreciation. As-suming straight-line depreciation, the annual amount of depreciation, D(t), derives as the T th
d
9 In accord with the empirical data available, major refurbishment, as a type of capital cost occuringduring operation, is included in the O&M costs (appendix A.1.2).
20
part of Ic, where Td is the cost-accounting term of depreciation,
D(t) =Ic
Td
. (A.2)
Economically, Td coincides with a plant’s (expected) economic life. In this paper, in accordwith the applied literature, to account for the increased uncertainty after liberalisation, Td isassumed not to exceed the planning horizon, T , of an investment project. For all technologiesTd = 20 is supposed.10
The annual imputed interest payment, IIP (t), refers to the salvage value of Ic in t. Pay-ments and depreciation are assumed to be made at the end of a period. In the first year ofoperation, the interest is thus paid on the full construction-investment costs. The imputedinterest payment in period t is determined as
IIP (t) =
{
Ic(1 − t−1Td
)r , if t ≤ Td
0 , if t > Td
, (A.3)
where r is the real imputed interest rate, which is assumed to be constant.The annual capital-investment costs of a power plant in period t of operation amount to
CC(t) =
{
Ic
Td
(
1 + (Td − t + 1)r)
, if t ≤ Td
0 , if t > Td
. (A.4)
A plant’s decommissioning costs, DC, derive as the product of the specific decommissioningcosts of the technology, DCsp, and net installed capacity, ICnet,
DC = DCspICnet . (A.5)
A.1.2 Costs during operation
As costs categories incurred during a plant’s economic lifetime, in this paper (i) operation andmaintenance (O&M), (ii) fuel, (iii) emission, and (iv) abatement costs are distinguished.
O&M costs, OMC, include all costs for plant operation and maintenance, apart from fuel,emission, and abatement costs. Fixed specific annual O&M costs, OMCfix(t), comprise labor,maintenance and insurance costs per unit of ICnet in t. Variable specific O&M costs, OMCvar,consist of the costs for operating supplies other than fuel and emission costs, per amount ofoutput produced in t, x(t). The latter derives as ICnet times hours of full-load operation, hfl(t),
x(t) = ICnethfl(t) . (A.6)
The O&M costs in period t can thus be determined as
OMC(t) = OMCfix(t)ICnet + OMCvarx(t) . (A.7)
10 This facilitates the calculations, but constitutes a simplification. The reduced depreciation term pro-vides, to some extent, for less favorable UCel, the more the higher the CC. The appropriate Td
treatment constitutes a particular issue to be clarified with respect to the systematic considerationof the utilities’ varied risk exposure.
21
Fuel costs, FC, include the costs related to fuel supply at the plant, including commodityprice and transport.11 This paper refers to the estimated (mean) fuel price, pfuel, during theremaining economic life of a power plant. The annual fuel costs are further determined by theannual fuel consumption, FCs(t), deriving as x(t) divided by the net thermal efficiency, ηnet,
FCs(t) =x(t)
ηnet. (A.8)
The annual fuel costs are calculated as
FC(t) = FCs(t)pfuel . (A.9)
Emission costs, EC, are calculated as the product of annual amount of emissions generated,E(t), deriving as annual fuel consumption times technology specific emission factor, fem,
E(t) = FCs(t)fem , (A.10)
and the emission price, τe(t), which is assumed to be in real terms,
EC(t) = τe(t)E(t) . (A.11)
Abatement costs, AC, are calculated as the product of the annual amount of emissionsgenerated, E(t), and specific abatement costs, ACsp(t), per mass unit of emission,12
AC(t) = ACsp(t)E(t) . (A.12)
A.1.3 Unit costs of electricity generation
To determine the UCel, first, the real levelised costs of electricity generation, RLC, over T arecalculated. Then, they are divided by the mean annual amount of electricity generated, x.
The real levelised costs, RLC, indicate the mean annual costs of electricity generation bya power plant in a particular year of operation during T . In this paper, following the co-
termination approach (Bejan et al. 1996: 386f), for all investment projects a common T ischosen, equal to the expected economic life of the shortest lived alternative. In this case forany longer lived alternative the salvage value at the end of T is added to the particular project’snet present value discounted with the discount rate of the last year of T . To calculate the RLC,first, the present value of the costs incurred before decommissioning, PVbd(T ), is determined:
PVbd(T ) =T
∑
t=1
CC(t) + OMC(t) + FC(t) + EC(t) + AC(t)
(1 + r)t. (A.13)
The corresponding RLC part derives by multiplication with the capital-recovery factor, r(1+r)T
(1+r)T−1
(Bejan et al. 1996: 355–357). The DC are to be levelised using the uniform-series sinking fundfactor, r
(1+r)Td−1. The RLC thus amount to
RLC = PVbd(T )r(1 + r)T
(1 + r)T − 1+ DC
r
(1 + r)Td − 1. (A.14)
Finally the unit costs of electricity of a particular reference power plant derive as
UCel =RLC
x. (A.15)
11 In the case of nuclear power they include all costs related to the up-stream and down-stream stepsof the fuel cycle as well as the costs of transportation between the steps.
12 Despite the capital-cost component of the end-of-pipe abatement facility, in accord with the empiricaldata, in this study abatement costs are only considered as proportional to current emissions.
22

A.2 Unit costs of electricity of the established technology
In general, the UCT1are determined as indicated above. As T1 enters the analysis at some
time t1 during its time of operation and for the analysis its unit costs in that period and thefollowing years of operation are needed, their determination is subject to some particularities.t1 is the first year in which the new power plants could be commissioned. tn the moment oftransition to the highest-cost alternative in the no-policy benchmark. By definition, for theend of the plant’s expected economic lifetime tend ∈ [t1, tn] holds. By lack of reliable empiricaldata in the literature, in this paper the UCT1
shape in the no-policy benchmark is callibratedwith respect to the following stylised indications, ceteris paribus:
(1) In t1, the established plant is fully depreciated and financial reserves are built up fordecommissioning, such that all capital costs are sunk. Over the whole of the plant’s timeof operation, ICnet, x, and, with ηnet, also FCs(t) are fixed. The UCT1
(t) behavior,t ∈ [t1, tn], is thus only determined by the development of pfuel, OMCfix, and OMCvar.While the pfuel schedule is empirically given, for the OMCk, k ∈ {fix, var}, only meanvalues over the plant’s expected economic lifetime are available in the literature.
(2) In t1, the OMCk, k ∈ {fix, var}, meet their arithmetical mean over the plant’s expectedeconomic lifetime, OMCk.
(3) In tend, the UCT1are equal to the UCT2
of the least-cost alternative among the newtechnologies, such that for t = tend the following equation holds:
UCT1(t) =
OMCfix(t) ICnet + OMCvar(t) x + pfuel(t)FCs
x= UCT2
(t) . (A.16)
(4) For any t ∈ {t1, t2, ..., tn}, the OMCk(t), k ∈ {fix, var}, are determined as
OMCk(t) = OMCk
(OMCk(tend)
OMCk
)t−1
tend−1
, (A.17)
such that
1
TL
tend∑
t=tcom
OMCk(t) = OMCk , (A.18)
where tcom is the plant’s year of commissioning, TL its expected economic lifetime.
(5) In any specific year t ∈ {t1, t2, ..., tend}, the UCT1(t) are determined like UCel in equation
(A.14), with T = tend − t+1. In each further period t ∈ {tend+1, tend+2, ..., tn}, the newplanning horizon T = 1, which comes to the same as to substitute in equation (A.14)for RLC the current costs, i.e. here OMC(t) + FC(t).
Under environmental policy, the UCT1are further determined by EC as well as eventual AC.
23
A.3 Summary of technical, financing, and cost parameters
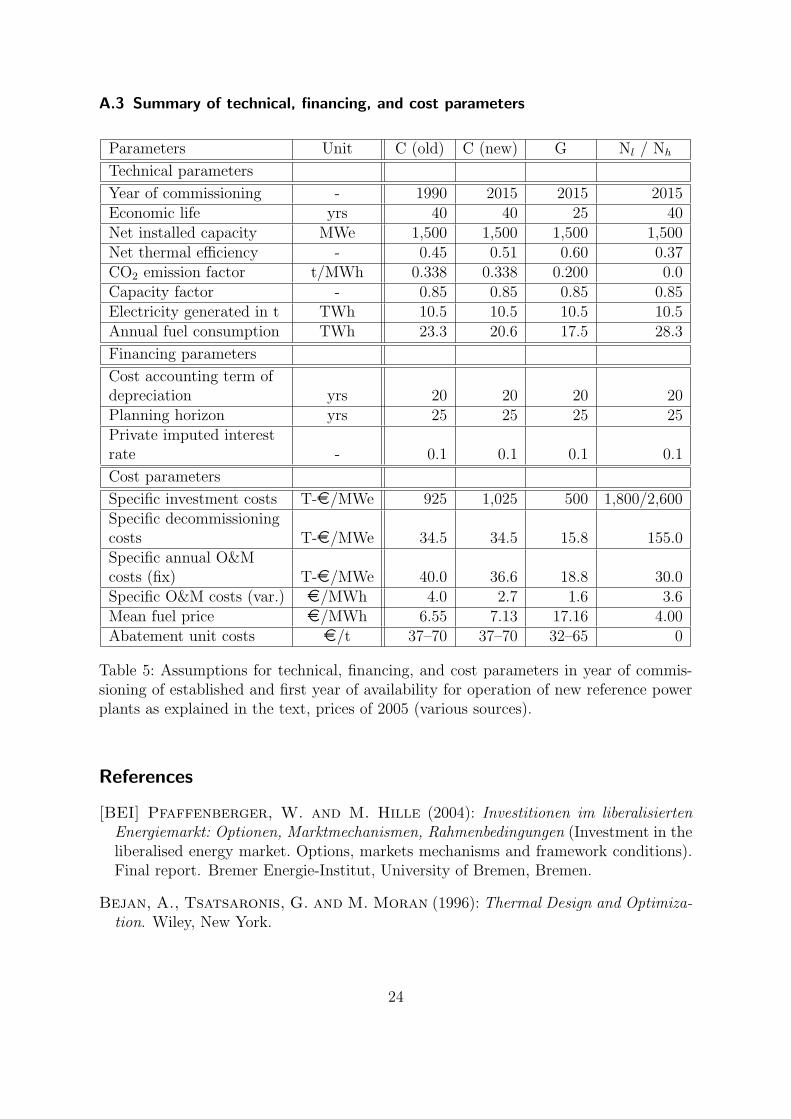
Parameters Unit C (old) C (new) G Nl / Nh
Technical parameters
Year of commissioning - 1990 2015 2015 2015Economic life yrs 40 40 25 40Net installed capacity MWe 1,500 1,500 1,500 1,500Net thermal efficiency - 0.45 0.51 0.60 0.37CO2 emission factor t/MWh 0.338 0.338 0.200 0.0Capacity factor - 0.85 0.85 0.85 0.85Electricity generated in t TWh 10.5 10.5 10.5 10.5Annual fuel consumption TWh 23.3 20.6 17.5 28.3
Financing parameters
Cost accounting term ofdepreciation yrs 20 20 20 20Planning horizon yrs 25 25 25 25Private imputed interestrate - 0.1 0.1 0.1 0.1
Cost parameters
Specific investment costs T-¤/MWe 925 1,025 500 1,800/2,600Specific decommissioningcosts T-¤/MWe 34.5 34.5 15.8 155.0Specific annual O&Mcosts (fix) T-¤/MWe 40.0 36.6 18.8 30.0Specific O&M costs (var.) ¤/MWh 4.0 2.7 1.6 3.6Mean fuel price ¤/MWh 6.55 7.13 17.16 4.00Abatement unit costs ¤/t 37–70 37–70 32–65 0
Table 5: Assumptions for technical, financing, and cost parameters in year of commis-sioning of established and first year of availability for operation of new reference powerplants as explained in the text, prices of 2005 (various sources).
References
[BEI] Pfaffenberger, W. and M. Hille (2004): Investitionen im liberalisiertenEnergiemarkt: Optionen, Marktmechanismen, Rahmenbedingungen (Investment in theliberalised energy market. Options, markets mechanisms and framework conditions).Final report. Bremer Energie-Institut, University of Bremen, Bremen.
Bejan, A., Tsatsaronis, G. and M. Moran (1996): Thermal Design and Optimiza-tion. Wiley, New York.
24
[BMWA] Bundesministerium fur Wirtschaft und Arbeit (2003): Forschungs-und Entwicklungskonzept fur emissionsarme fossil befeuerte Kraftwerke. Bericht derCOORETEC-Arbeitsgruppen (R&D concept for low-emission fossil-fuelled power sta-tions. Report of the COORETEC working groups). Dokumentation, no. 527
Borak, S., Hardle, W., Truck, S. and R. Weron (2006): Convenience Yields forCO2 Emission Allowance Futures Contracts. SFB 649 Discussion Paper 2006–076,Humboldt University, Berlin.
[ECX] European Climate Exchange (2007): ECX CFI Futures Contracts: HistoricData 2005-2007.
Eeckhoudt, L., Schieber, C. and T. Schneider (2000): Risk aversion and the ex-ternal cost of a nuclear accident. Journal of Environmental Management 58, 109–117.
Enquetekommission (2002): Abschlussbericht der Enquetekommission “NachhaltigeEnergieversorgung unter den Bedingungen der Globalisierung und der Liberalisierung”des 14. Deutschen Bundestages (Final report of the commission of enquiry ‘Sustainableenergy supply under the conditions of globalisation and liberalisation’ of the 14th
German Bundestag). Berlin.
Enzensberger, N. (2003): Entwicklung und Anwendung eines Strom- und Zertifikat-marktmodells fur den europaischen Energiesektor (Development and application of anelectricity and permit market model for the European energy sector). VDI Verlag,Dusseldorf.
Epaulard, A. and S. Gallon (2001): La Valorization du Project Nucleaire EPR parla Methode des Options Reelles (The evaluation of the nuclear project EPR by thereal-options method). Economie et Prevision 149(3), 29–50.
Evans, D.J. and H. Sezer (2004): Social discount rates for six major countries.Applied Economics Letters 11, 557–560.
Evans, D.J. and H. Sezer (2005): Social discount rates for member countries of theEuropean Union. Journal of Economic Studies 32(1), 47–59.
[EWI and Prognos] Energiewirtschaftliches Institut an der Univer-sitat zu Koln and Prognos (2005): Energiereport IV. Die Entwicklung der En-ergiemarkte bis zum Jahr 2030. Energiewirtschaftliche Referenzprognose (Energy re-port IV. The development of the energy markets until 2030. Reference prognosis forthe energy industry). Study on behalf of the Bundesministerium fur Wirtschaft undArbeit (BMWA). Oldenbourg, Munich.
EWI and Prognos (2006): Auswirkungen hoherer Olpreise auf Energieangebot und-nachfrage. Olpreisvariante der Energiewirtschaftlichen Referenzprognose 2030 (Im-plications of higher oil prices on energy supply and demand. Oil-price variant of theReference prognosis for the energy industry 2030). Study on behalf of the Bundesmin-isterium fur Wirtschaft und Technologie (BMWi).
25
Fritsche, U.R., Rausch, L. and K. Schmidt (2007): Treibhausgasemissionen undVermeidungskosten der nuklearen, fossilen und erneuerbaren Energiebereitstellung(Greenhouse emissions and abatement costs of nuclear, fossil and renewable energysupply). Working paper. Oko-Institut, Darmstadt.
Gerlagh, R. and B. van der Zwaan (2006): Options and Instruments for a DeepCut in CO2 Emissions: Carbon Dioxide Capture or Renewables, Taxes or Subsidies?The Energy Journal 27(3), 25–48.
Gollier, C. (2002): Discounting an uncertain future. Journal of Public Economics 85,149–166.
Gollier, C., Proult, D., Thais, F. and G. Walgenwitz (2005): Choice of nuclearpower investments under price uncertainty: Valuing modularity. Energy Economics 27,667–685.
Grant, S. and J. Quiggin (2003): Public investment and the risk premium for equity.Economica 70, 1–18.
Heinzel, C. and R. Winkler (2007): The Role of Environmental and TechnologyPolicies in the Transition to a Low-carbon Energy Industry. CER Working Paper07/71, ETH Zurich.
Hubbard, R.G. (1998): Capital-Market Imperfections and Investment. Journal of Eco-nomic Literature 36, 193–225.
IEA and NEA (2005): Projected Costs of Generating Electricity. 2005 Update.OECD/IEA, Paris.
Itaoko, K., Saito, A., Krupnick, A., Adamowicz, W. and T. Taniguchi(2006): The Effect of Risk Characteristics on the Willingness to Pay for MortalityRisk Reductions from Electric Power Generation. Environmental and Resource Eco-nomics 33, 371–398.
Kunreuther, H., Novemsky, N. and D. Kahnemann (2001): Making low proba-bilities useful. The Journal of Risk and Uncertainty 23(2), 103–120.
Lind, R.C. (1982): A Primer on the Major Issues Relating to the Discount Rate forEvaluating National Energy Options. In: Lind, R.C., Arrow, K.J., Corey, G.R.,Dasgupta, P., Sen, A.K., Stauffer, T., Stiglitz, J.E., Stockfisch, J.A.and R. Wilson (eds.) (1982): Discounting for Time and Risk in Energy Policy.John Hopkins Press, Baltimore, 23–94.
Mehra, R. and E.C. Prescott (2003): The Equity Premium in Retrospect. In:Constantinides, G.M., Harris M. and R. Stulz (eds.) (2003): Handbook of theEconomics of Finance. Elsevier B.V., Amsterdam, 887–936.
26

MIT (2003): The Future of Nuclear Power. An Interdisciplinary Study. MassachusettsInstitute of Technology, Boston, MA.
NEA (2003): Nuclear Electricity Generation: What Are the External Costs? Report.OECD, Paris.
Owen, A.D. (2004): Environmental externalities, market distortions and the economicsof renewable energy technologies. The Energy Journal 25(3), 127–156.
Roques, F.A., Nuttall, W.J., Newbery, D.M., de Neufville, R. and S. Con-nors (2006): Nuclear Power: A Hedge against Uncertain Gas and Carbon Prices? TheEnergy Journal 27(4), 1–23.
Rothwell, G. (2006): A Real Options Approach to Evaluating New Nuclear PowerPlants. The Energy Journal 27(1), 37–53.
Schneider, L. (1998): Stromgestehungskosten von Großkraftwerken. Entwicklungen imSpannungsfeld von Liberalisierung und Okosteuern (Unit costs of electricity of greatpower stations. Developments under the conditions of liberalisation and ecotaxation).Werkstattreihe 112, Oko-Institut, Freiburg.
Schneider, Y. and P. Zweifel (2004): How Much Internalization of Nuclear RiskThrough Liability Insurance? The Journal of Risk and Uncertainty 29(3), 219–240.
Sijm, J.P.M., Bakker, S.J.A., Chen, Y., Harmsen, H.W. and W. Lise (2005):CO2 price dynamics: The implications of the EU emissions trading for the price ofelectricity. Energy Research Centre of the Netherlands (ECN), working paper, 05/081.
Sijm, J.P.M., Chen, Y., Donkelaar, M. ten, Hers, J.S. and M.J.J. Scheepers(2006): CO2 Price Dynamics: A follow-up analysis of the implications of the EU emis-sions trading for the price of electricity. Energy Research Centre of the Netherlands(ECN), working paper, 06/015.
The University of Chicago (2004): The Economic Future of Nuclear Power. AStudy Conducted at The University of Chicago. Chicago, IL.
Uhrig-Homburg, M. and M.W. Wagner (2007): Forward Price Dynamics of CO2
Emission Certificates – An Empirical Analysis. Working paper, TH Karlsruhe.
[WI et al.] Wuppertal Institut fur Klima, Umwelt, Energie, DeutschesZentrum fur Luft- und Raumfahrt, Zentrum fur Sonnen-energie-und Wasserstoff-Forschung and Potsdam-Institut fur Klimafolgen-forschung (2007): RECCS: Strukturell-okonomisch-okologischer Vergleich regener-ativer Energietechnologien (RE) mit Carbon Capture and Storage (CCS) (RECCS:Structural economic-ecological comparison of renewable energy sources with car-bon capture and storage). Study on behalf of the Bundesministerium fur Umwelt,Naturschutz und Reaktorsicherheit (BMU).
27

Dresden Discussion Paper Series in Economics
11/06 Wahl, Jack E. / Broll, Udo: Bankmanagement mit Value at Risk
12/06 Karmann, Alexander / Huschens, Stefan / Maltritz, Dominik / Vogl, Konstantin: Country Default Probabilities: Assessing and Backtesting
13/06 Kemnitz, Alexander: Can Immigrant Employment Alleviatethe Demographic Burden? The Role of Union Centralization
14/06 Kemnitz, Alexander / Eckhard Janeba / Ehrhart, Nick: Studiengebühren in Deutschland: Drei Thesen und ihr empirischer Gehalt
01/07 Kemnitz, Alexander: University Funding Reform, Competition and Teaching Quality
02/07 Sülzle, Kai: Innovation and Adoption of Electronic Business Technologies
03/07 Lehmann-Waffenschmidt, Marco / Sandri, Serena: Recursivity and Self-Referentiality of Economic Theories and Their Implications for Bounded Rational Actors
04/07 Lehmann-Waffenschmidt, Marco / Hain, Cornelia: Neuroökonomie und Neuromarketing: Neurale Korrelate strategischer Entscheidungen
05/07 Günther, Edeltraud / Lehmann-Waffenschmidt, Marco: Deceleration - Revealed Preference in Society and Win-Win-Strategy for Sustainable Management
06/07 Wahl, Jack E. / Broll, Udo: Differential Taxation and Corporate Futures-Hedging
07/07 Bieta, Volker / Broll, Udo / Milde, Hellmuth / Siebe, Wilfried: The New Basel Accord and the Nature of Risk: A Game Theoretic Perspective
08/07 Kemnitz, Alexander: Educational Federalism and the Quality Effects of Tuition Fees
09/07 Mukherjee, Arijit / Broll, Udo / Mukherjee, Soma: Licensing by a Monopolist and Unionized Labour Market
10/07 Lochner, Stefan / Broll, Udo: German Foreign Direct Investment and Wages
11/07 Lehmann-Waffenschmidt, Marco: Komparative Evolutorische Analyse – Konzeption und Anwendungen
12/07 Broll, Udo / Eckwert, Bernhard: The Competitive Firm under Price Uncertainty: The Role of Information and Hedging
13/07 Dittrich, Marcus: Minimum Wages and Union Bargaining in a Dual Labour Market
14/07 Broll, Udo / Roldán-Ponce, Antonio / Wahl, Jack E.:: Barriers to Diversification and Regional Allocation of Capital
15/07 Morone, Andrea / Fiore, Annamaria / Sandri, Serena: On the Absorbability of Herd Behaviour and Informational Cascades: An Experimental Analysis
16/07 Kemnitz, Alexander: Native Welfare Losses from High Skilled Immigration
17/07 Hofmann, Alexander / Seitz, Helmut: Demographiesensitivität und Nachhaltigkeit der Länder- und Kommunalfinanzen: Ein Ost-West-Vergleich
01/08 Hirte, Georg / Brunow, Stephan: The Age Pattern of Human Capital and Regional Productivity
02/08 Fuchs, Michaela / Weyh, Antje: The Determinants of Job Creation and Destruction: Plant-level Evidence for Eastern and Western Germany
03/08 Heinzel, Christoph: Implications of Diverging Social and Private Discount Rates for Investments in the German Power Industry. A New Case for Nuclear Energy?
