drawing conclusions from data: computational journalism week 10
DESCRIPTION
Columbia University, Fall 2014 Syllabus at http://www.compjournalism.com/?p=113TRANSCRIPT
Fron%ers of Computa%onal Journalism
Columbia Journalism School
Week 10: Drawing Conclusions from Data November 14, 2014
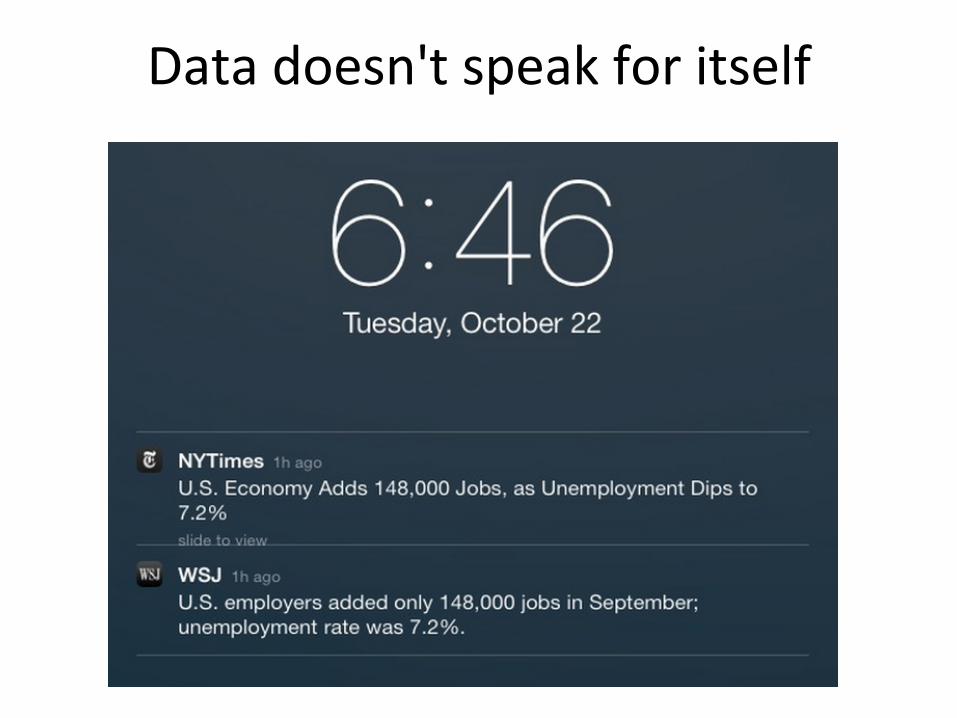
Data doesn't speak for itself
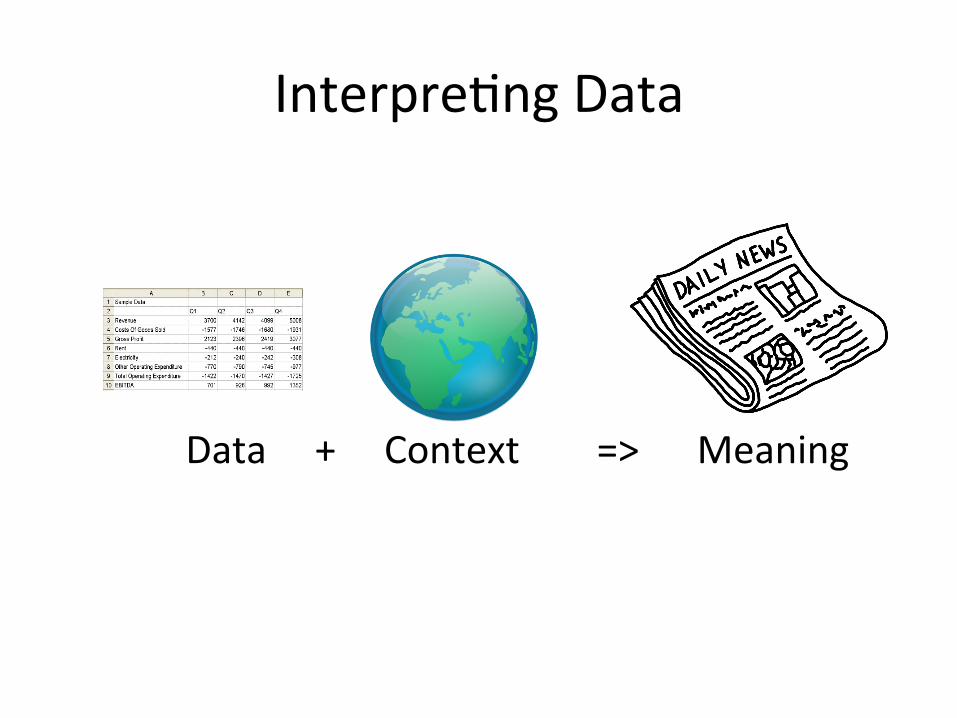
Interpre%ng Data
Data + Context => Meaning
Interpreta%on
There may be more than one defensible
interpreta%on of a data set.
Our goal in this class is to rule out indefensible interpreta%ons.
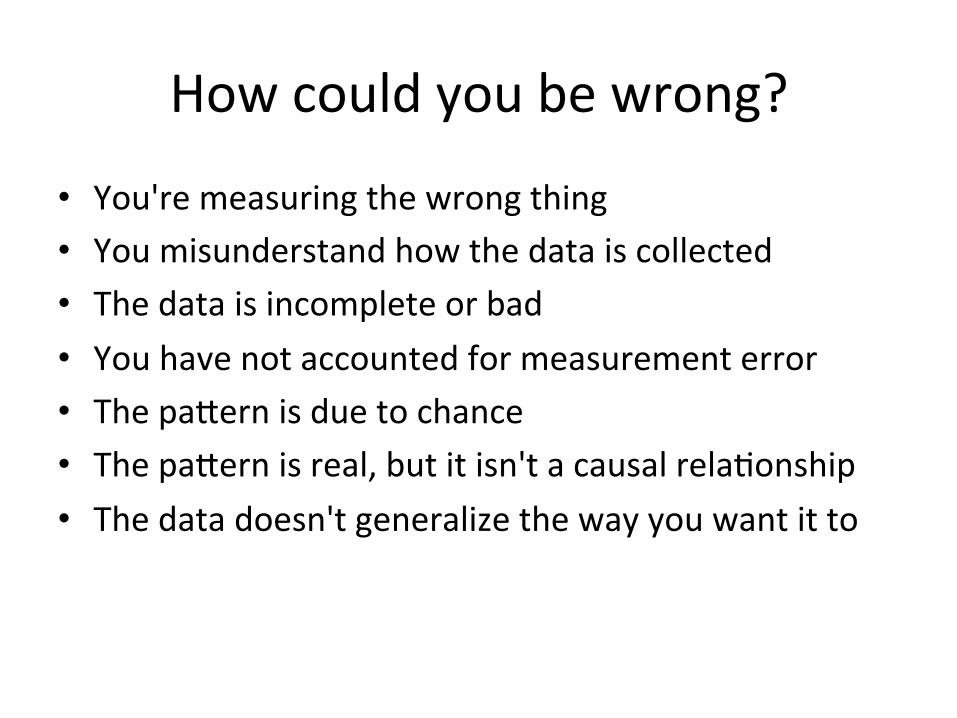
How could you be wrong?
• You're measuring the wrong thing • You misunderstand how the data is collected • The data is incomplete or bad • You have not accounted for measurement error • The paSern is due to chance • The paSern is real, but it isn't a causal rela%onship • The data doesn't generalize the way you want it to
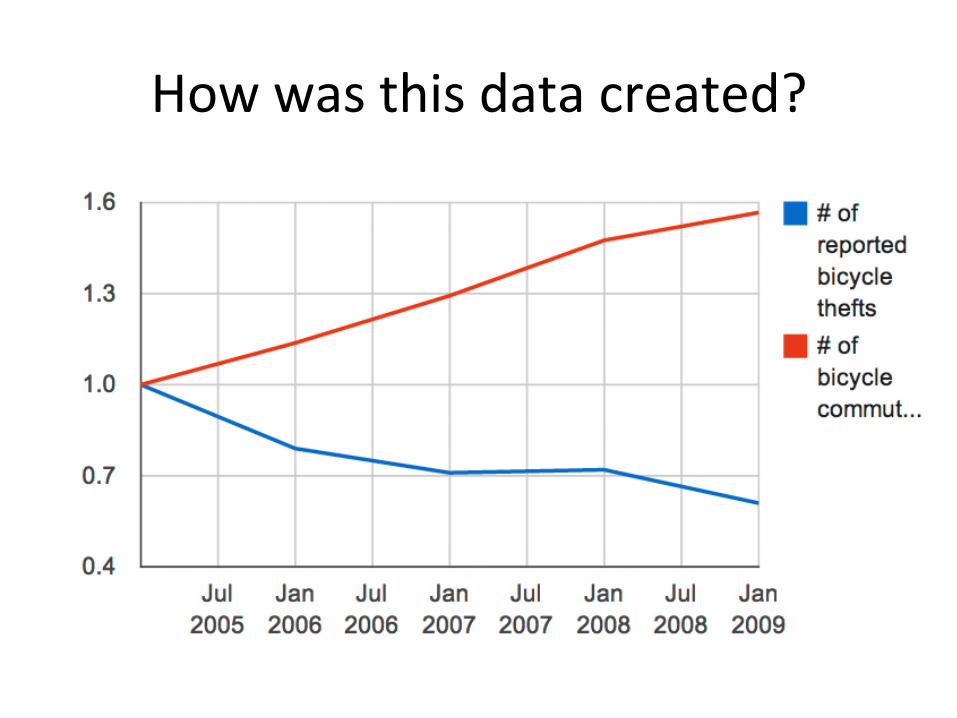
How was this data created?
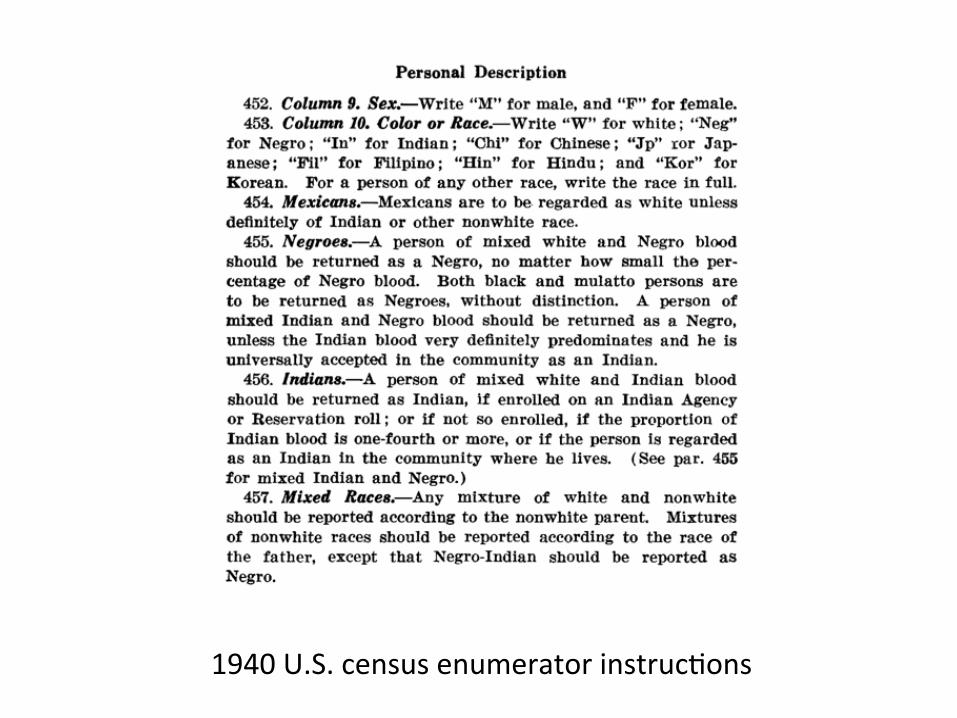
1940 U.S. census enumerator instruc%ons
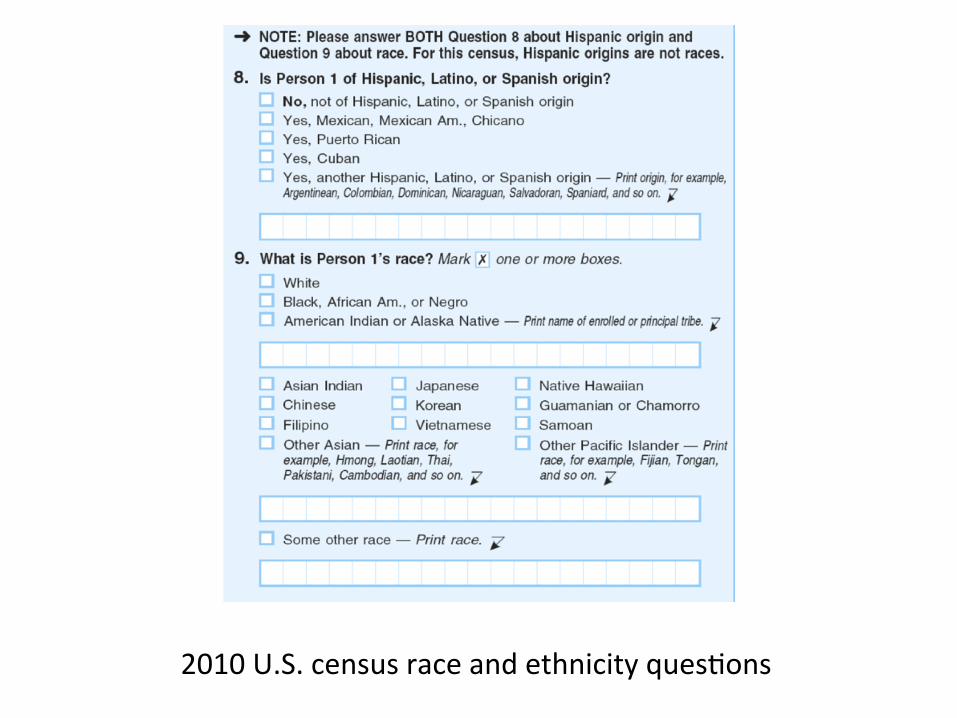
2010 U.S. census race and ethnicity ques%ons
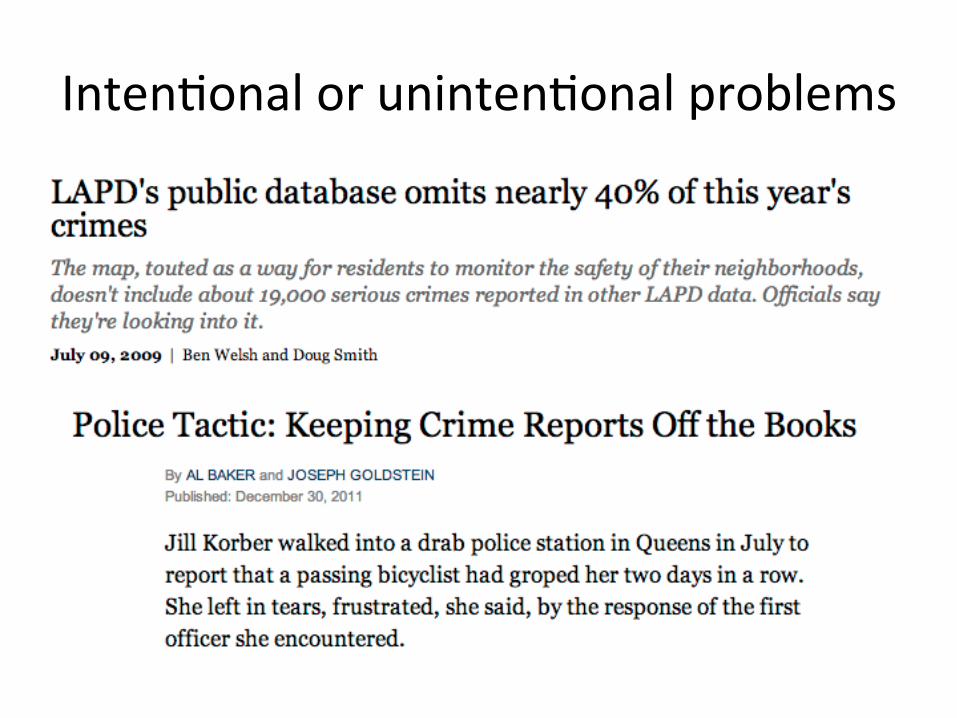
Inten%onal or uninten%onal problems
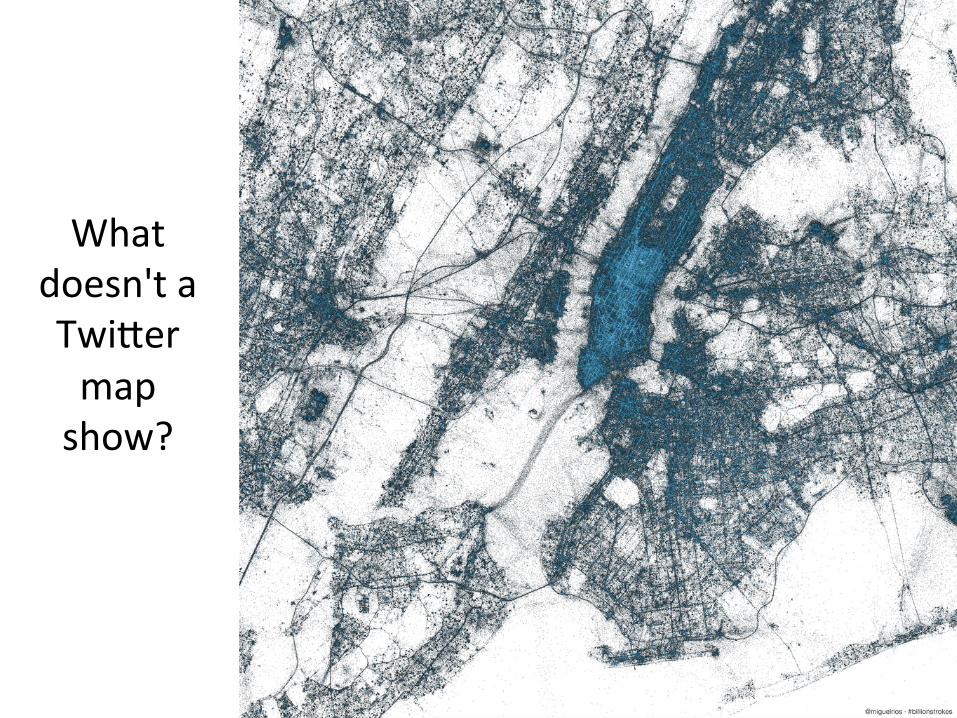
What doesn't a TwiSer map show?
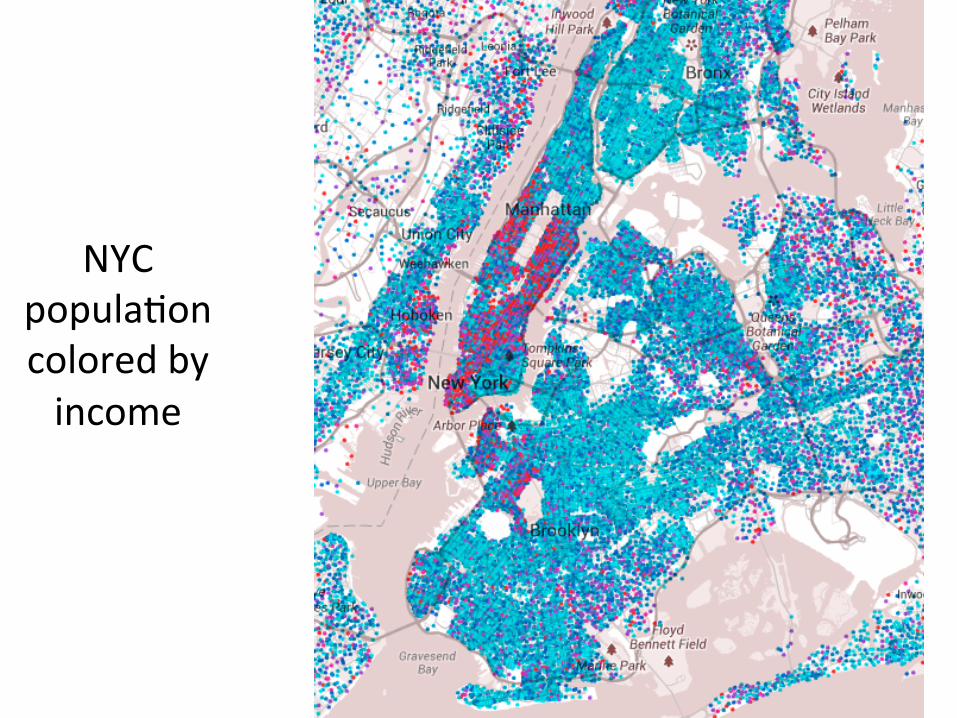
NYC popula%oncolored by income
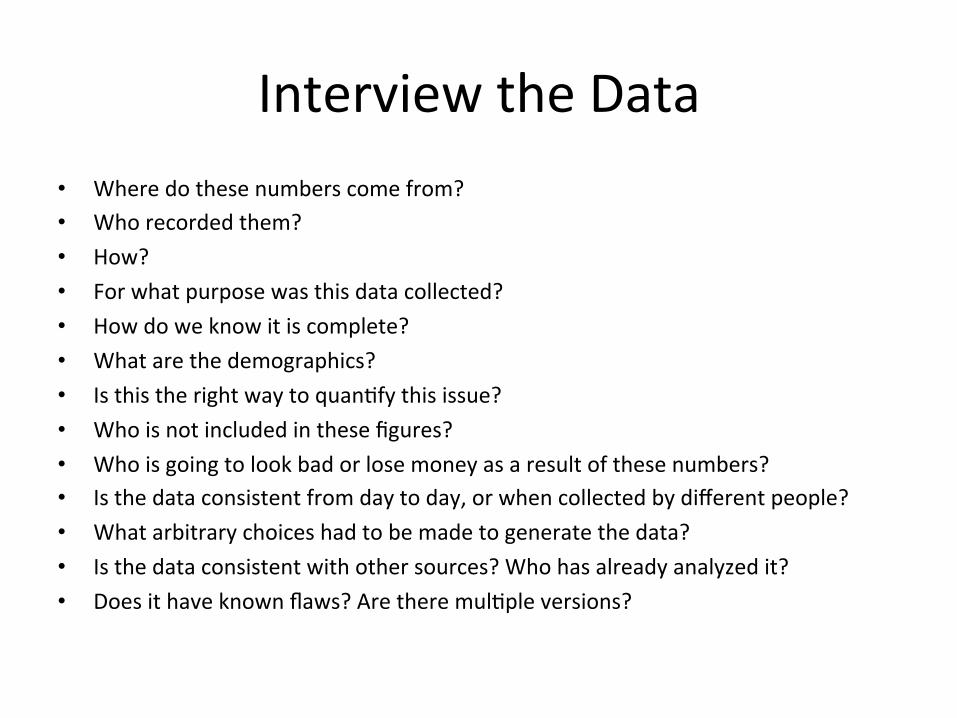
Interview the Data • Where do these numbers come from? • Who recorded them? • How? • For what purpose was this data collected? • How do we know it is complete? • What are the demographics? • Is this the right way to quan%fy this issue? • Who is not included in these figures? • Who is going to look bad or lose money as a result of these numbers? • Is the data consistent from day to day, or when collected by different people? • What arbitrary choices had to be made to generate the data? • Is the data consistent with other sources? Who has already analyzed it? • Does it have known flaws? Are there mul%ple versions?
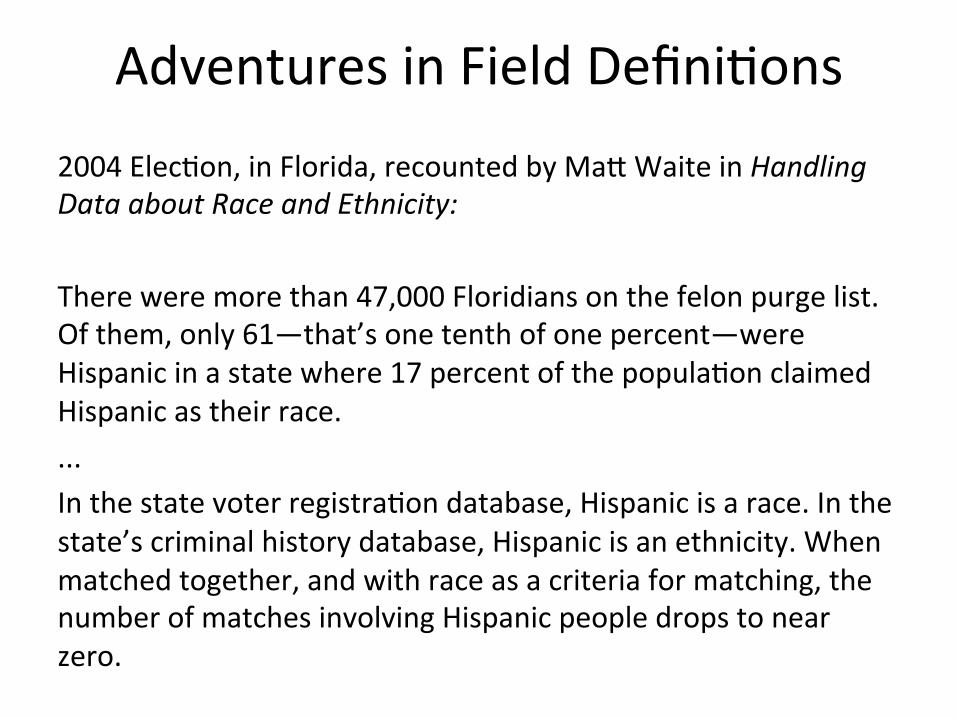
Adventures in Field Defini%ons 2004 Elec%on, in Florida, recounted by MaS Waite in Handling Data about Race and Ethnicity: There were more than 47,000 Floridians on the felon purge list. Of them, only 61—that’s one tenth of one percent—were Hispanic in a state where 17 percent of the popula%on claimed Hispanic as their race. ... In the state voter registra%on database, Hispanic is a race. In the state’s criminal history database, Hispanic is an ethnicity. When matched together, and with race as a criteria for matching, the number of matches involving Hispanic people drops to near zero.
What stats know-‐how gets you
• You're measuring the wrong thing • You misunderstand how the data is collected • The data is incomplete or bad • You have not accounted for measurement error • The paSern is due to chance • The paSern is real, but it isn't a causal rela%onship • The data doesn't generalize the way you want it to
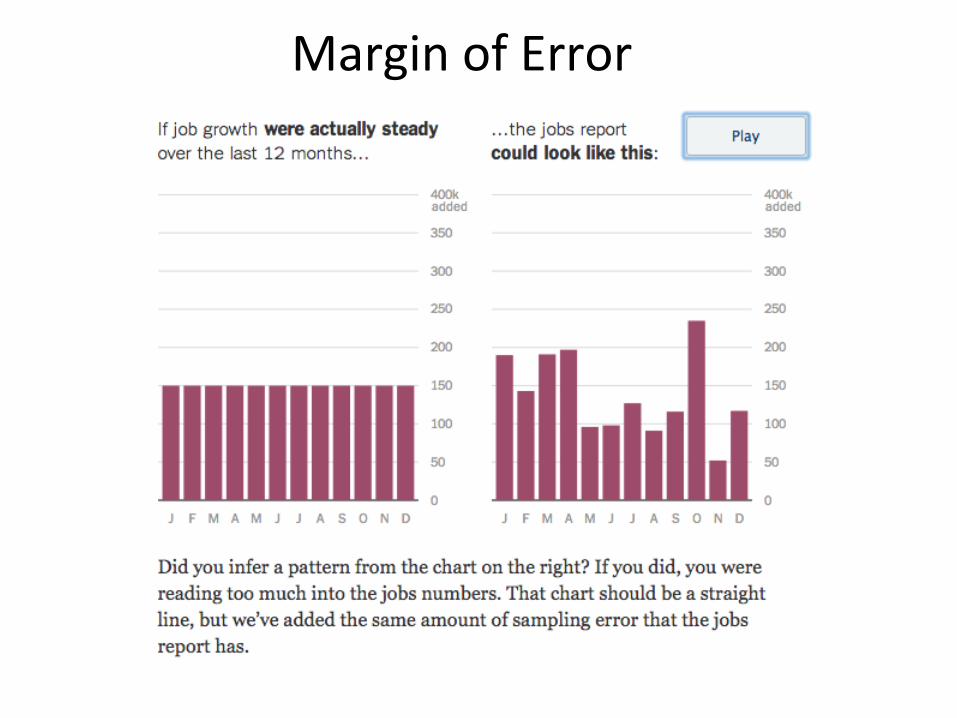
Margin of Error
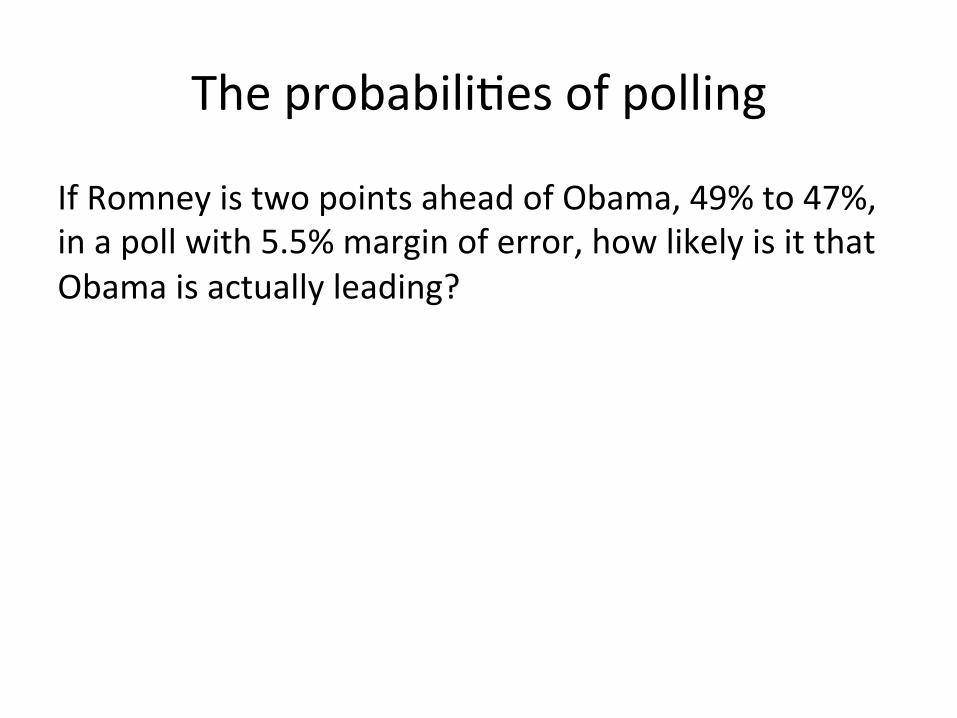
The probabili%es of polling
If Romney is two points ahead of Obama, 49% to 47%, in a poll with 5.5% margin of error, how likely is it that Obama is actually leading?
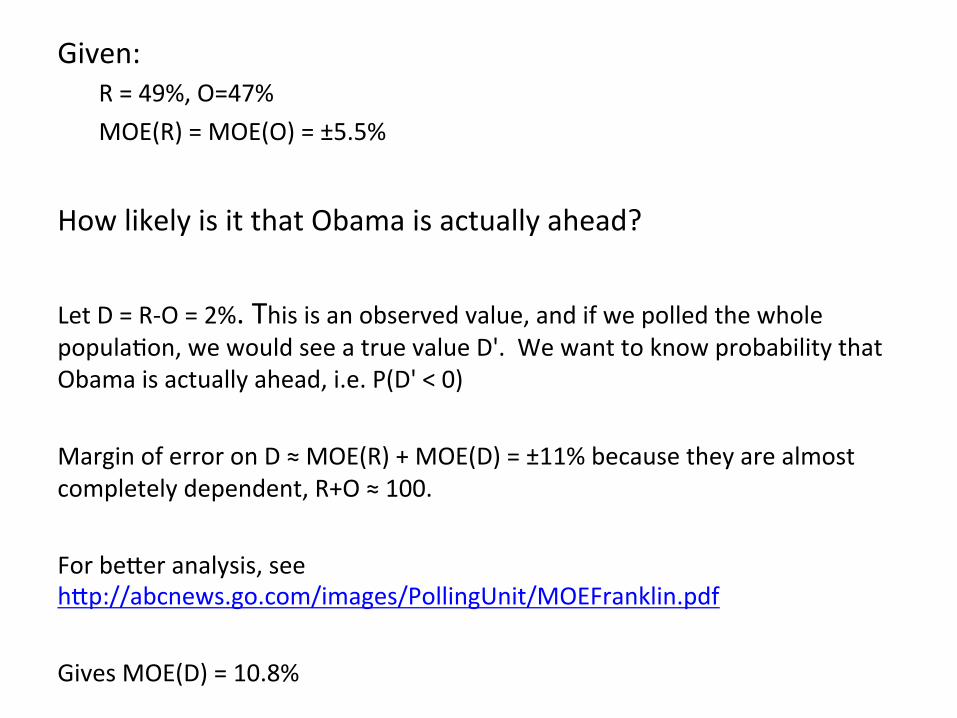
Given: R = 49%, O=47% MOE(R) = MOE(O) = ±5.5%
How likely is it that Obama is actually ahead? Let D = R-‐O = 2%. This is an observed value, and if we polled the whole popula%on, we would see a true value D'. We want to know probability that Obama is actually ahead, i.e. P(D' < 0) Margin of error on D ≈ MOE(R) + MOE(D) = ±11% because they are almost completely dependent, R+O ≈ 100. For beSer analysis, see hSp://abcnews.go.com/images/PollingUnit/MOEFranklin.pdf Gives MOE(D) = 10.8%
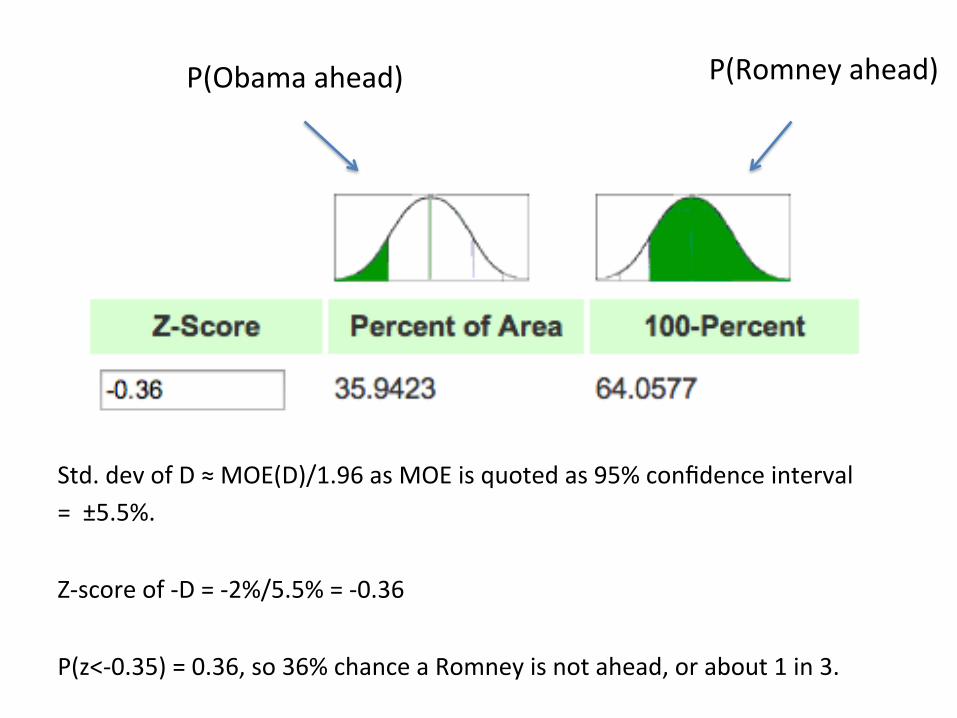
Std. dev of D ≈ MOE(D)/1.96 as MOE is quoted as 95% confidence interval = ±5.5%. Z-‐score of -‐D = -‐2%/5.5% = -‐0.36 P(z<-‐0.35) = 0.36, so 36% chance a Romney is not ahead, or about 1 in 3.
P(Obama ahead) P(Romney ahead)
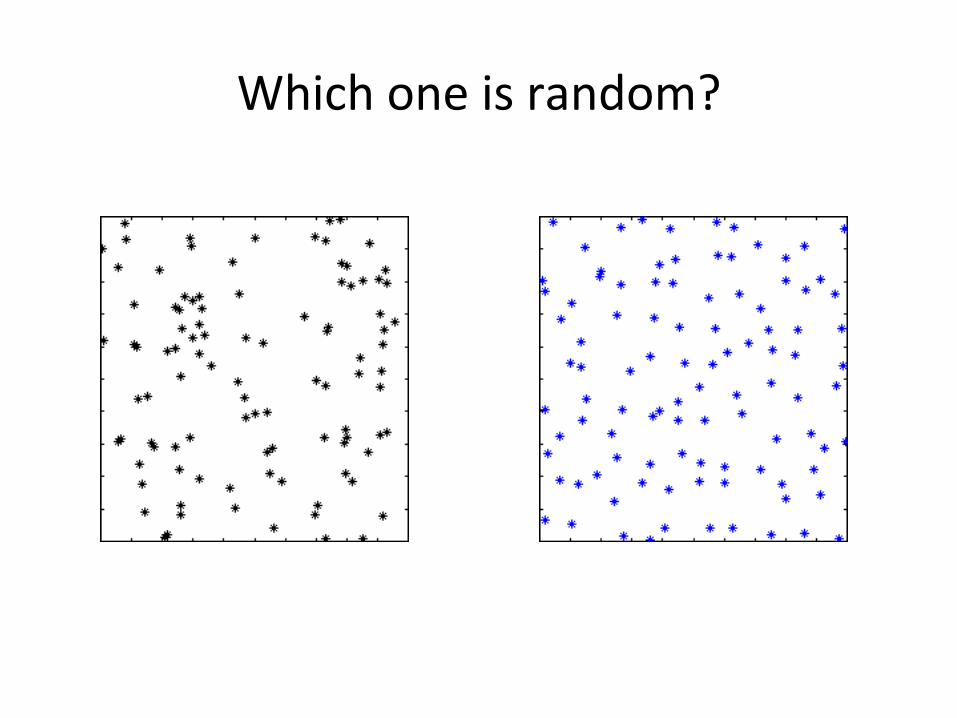
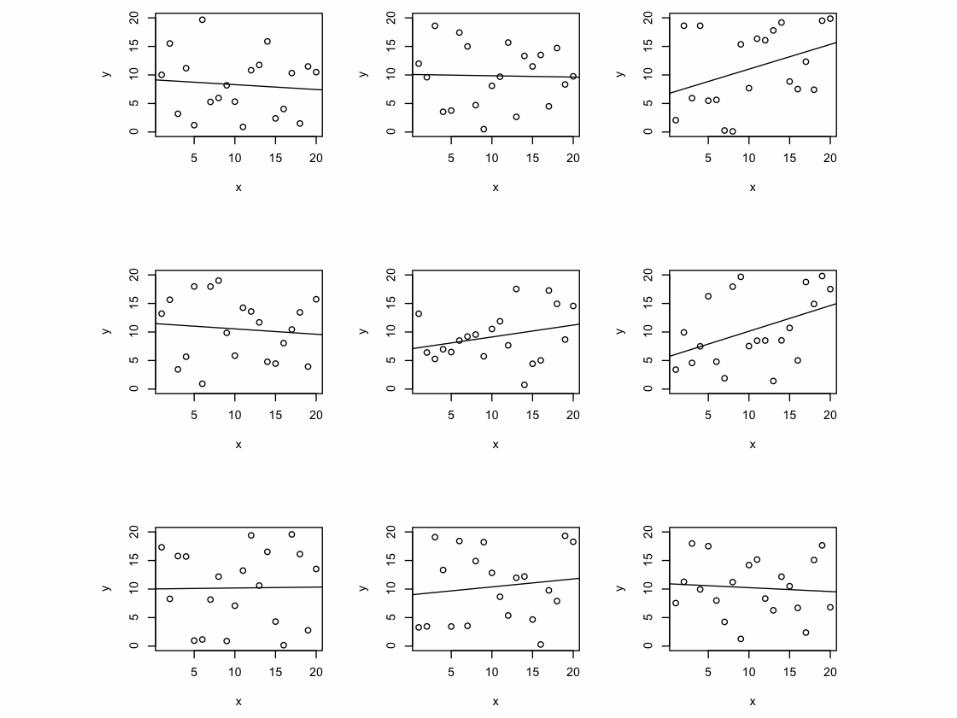
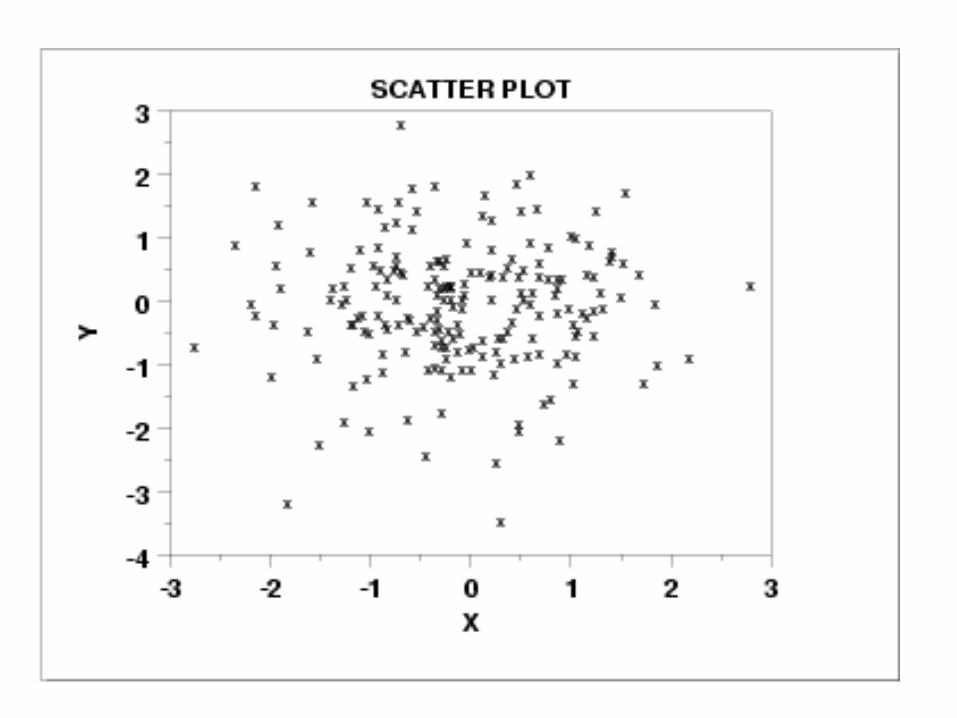
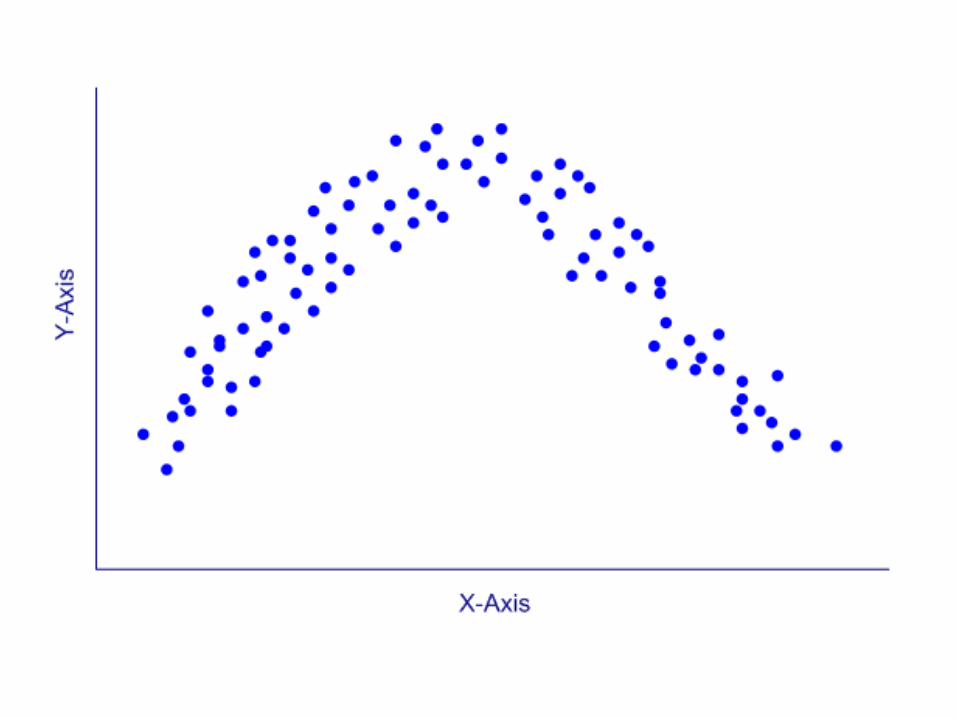
Which one is random?
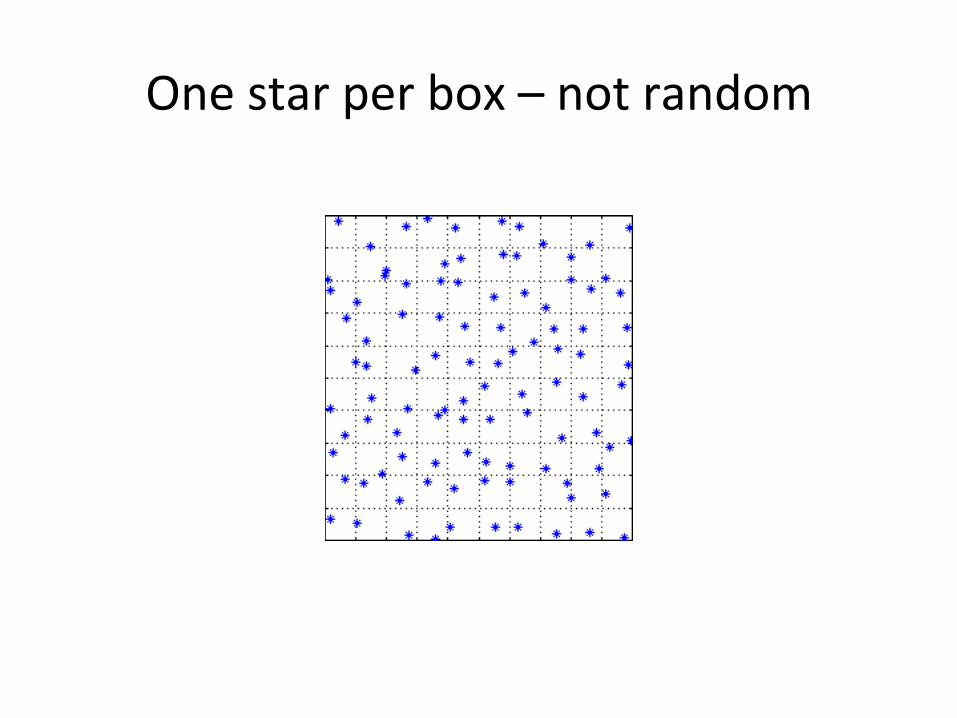
One star per box – not random
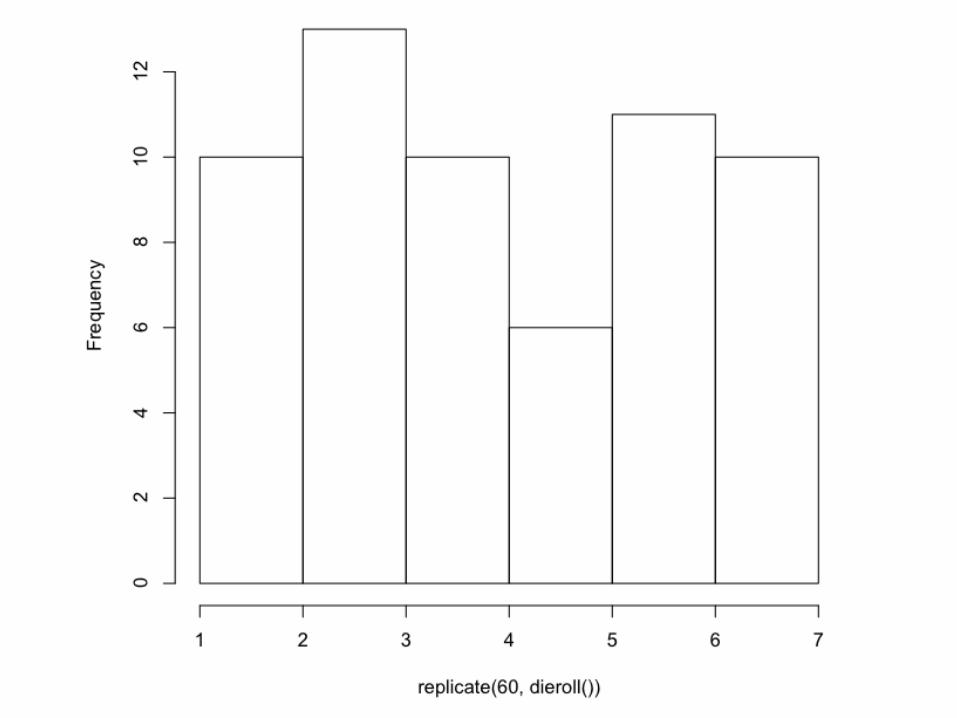
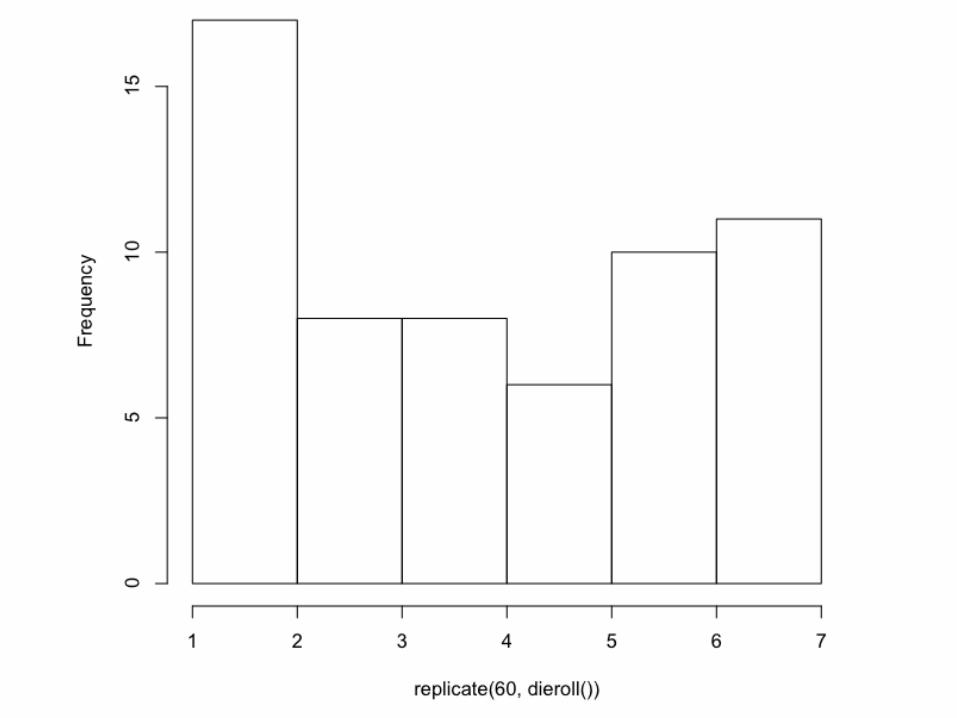
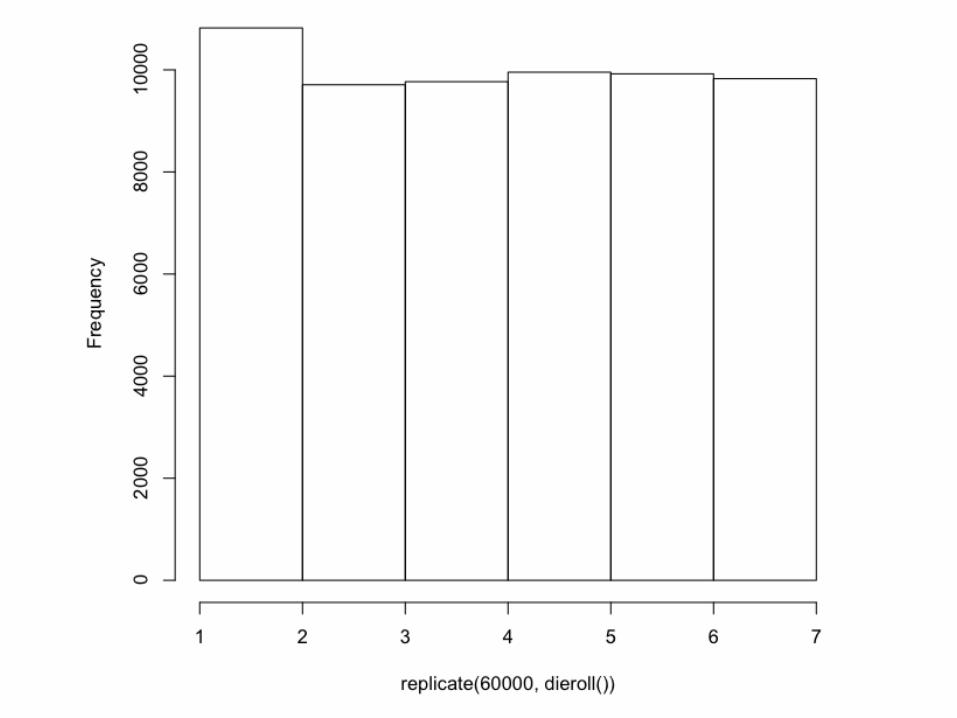
Is this die loaded?
Are these two dice loaded?
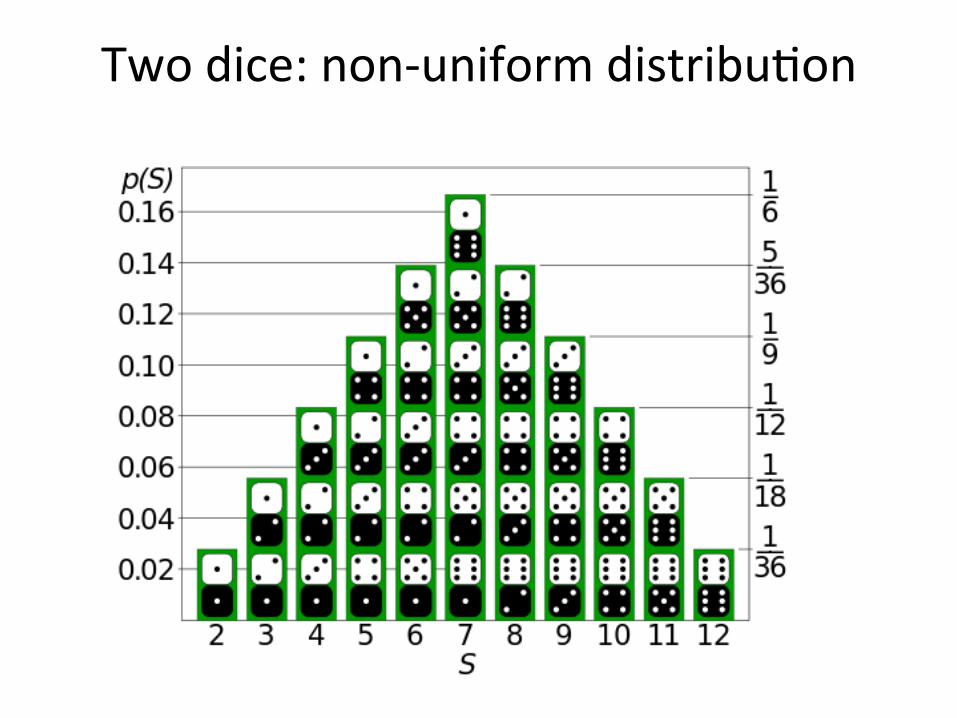
Two dice: non-‐uniform distribu%on
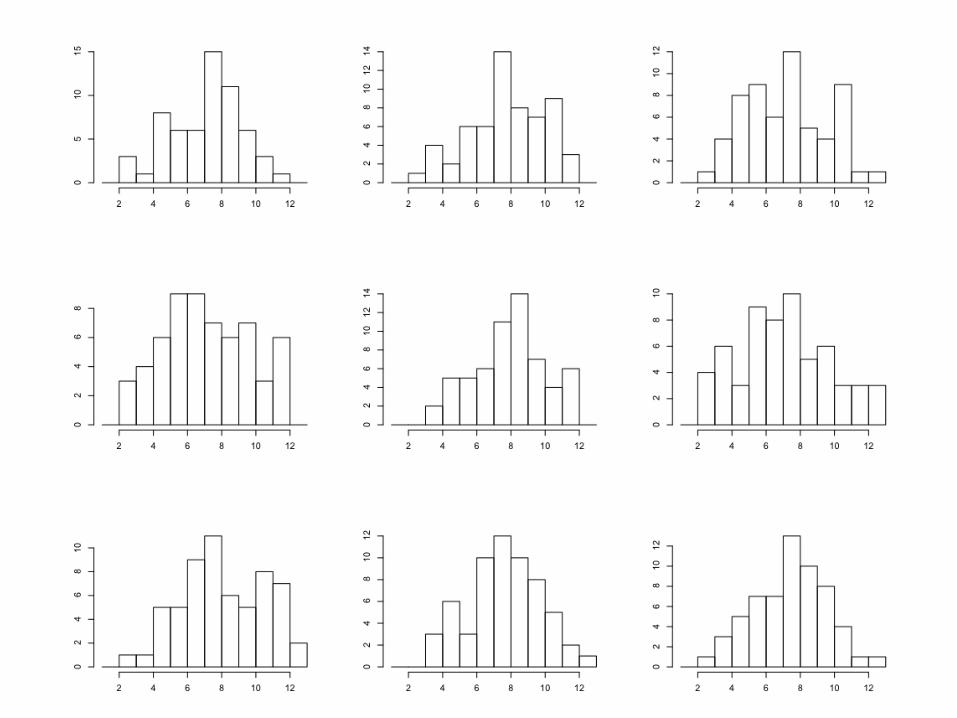
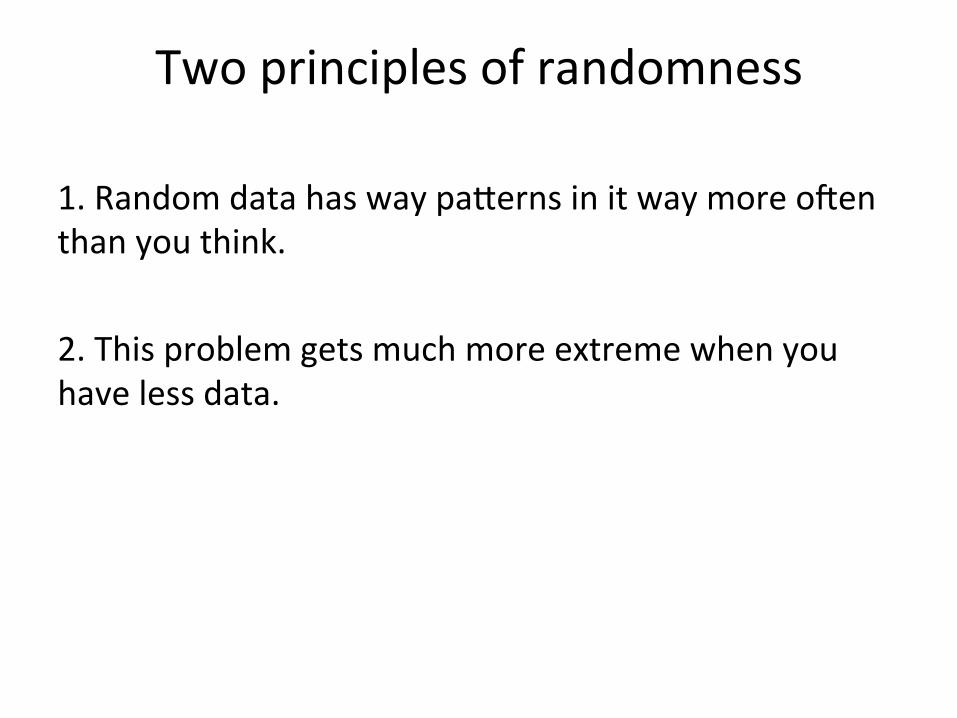
Two principles of randomness
1. Random data has way paSerns in it way more oren than you think. 2. This problem gets much more extreme when you have less data.
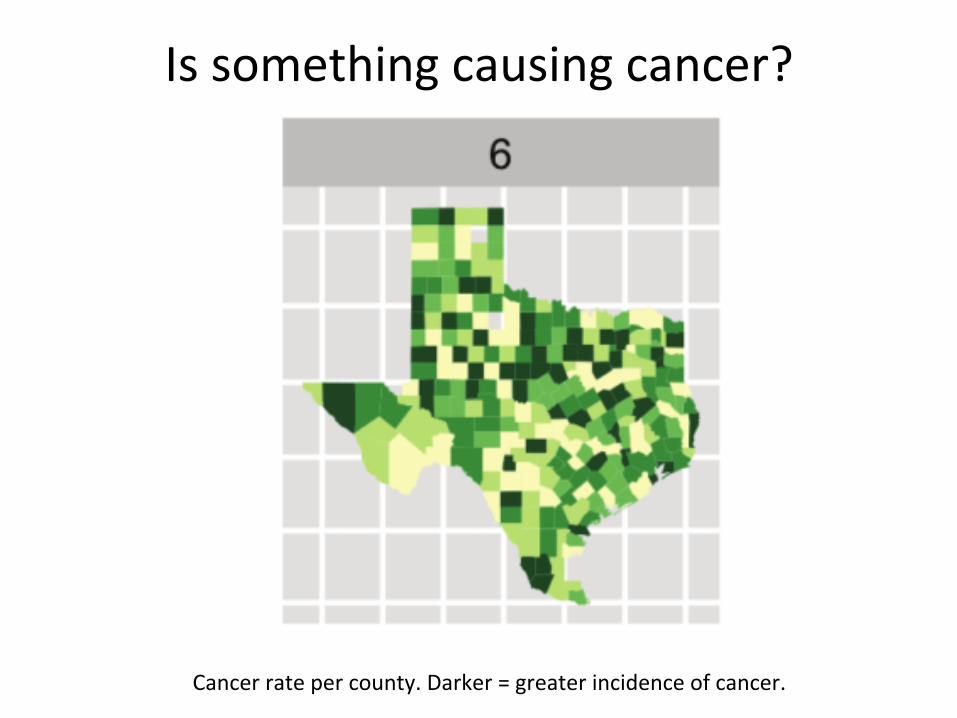
Is something causing cancer?
Cancer rate per county. Darker = greater incidence of cancer.
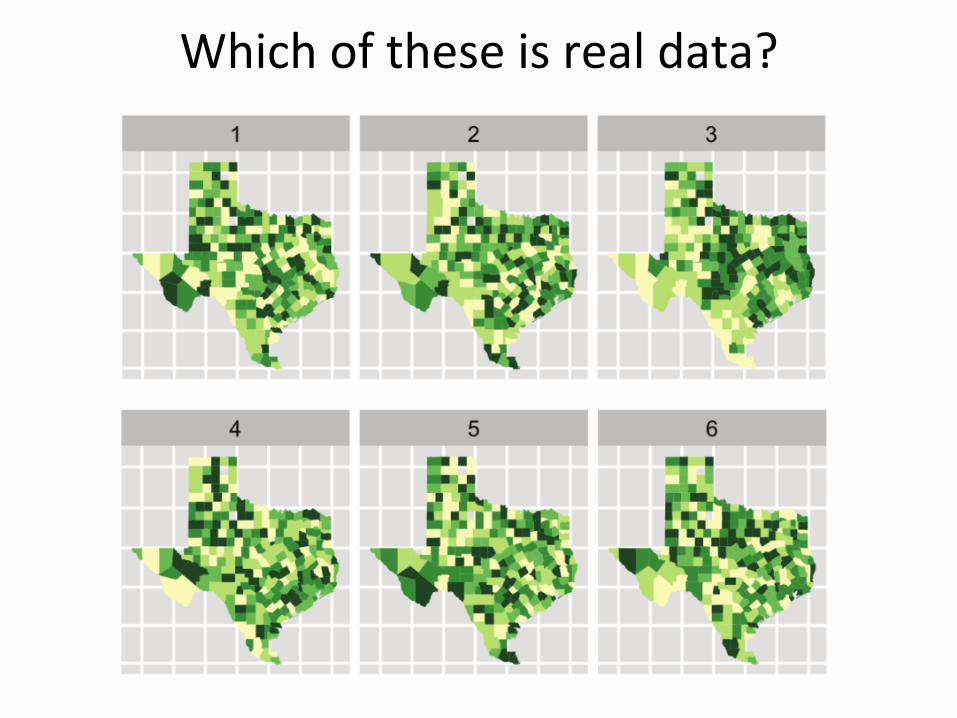
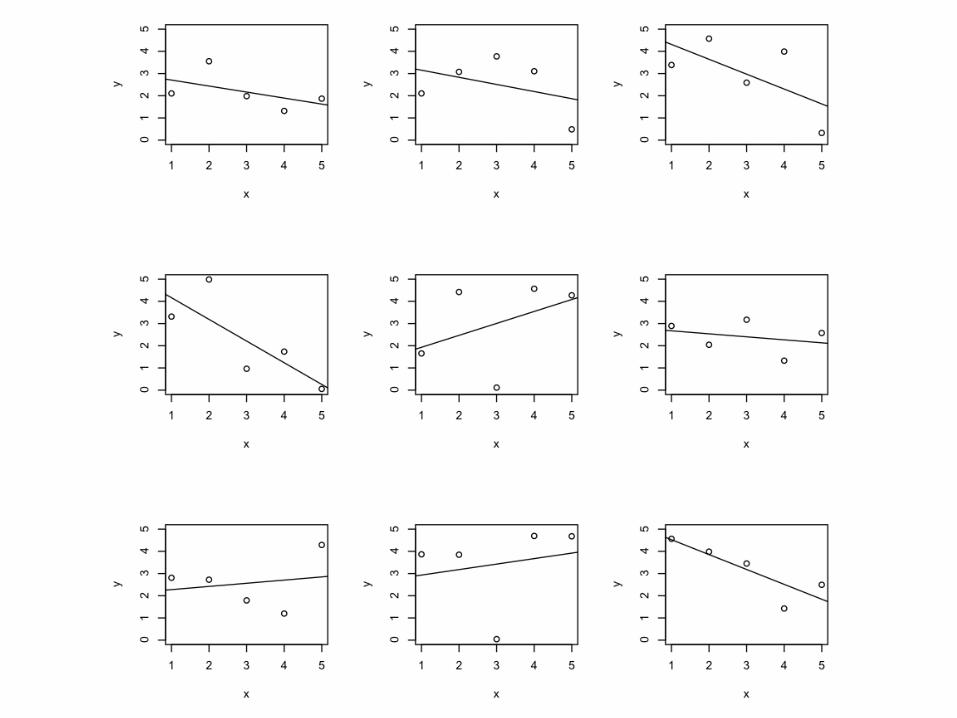
Which of these is real data?
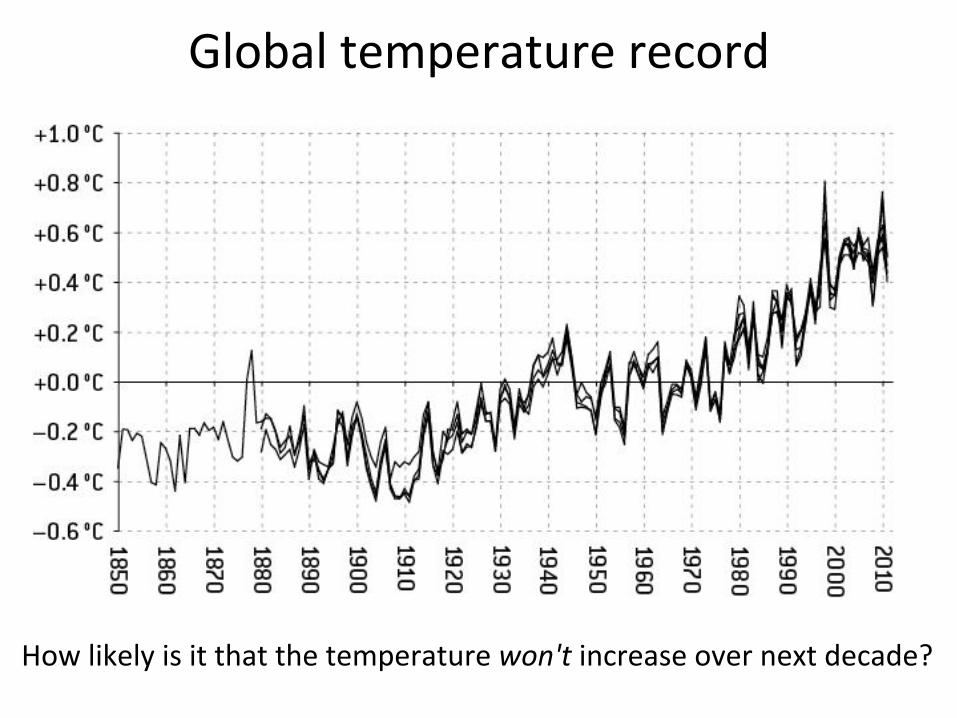
Global temperature record
How likely is it that the temperature won't increase over next decade?
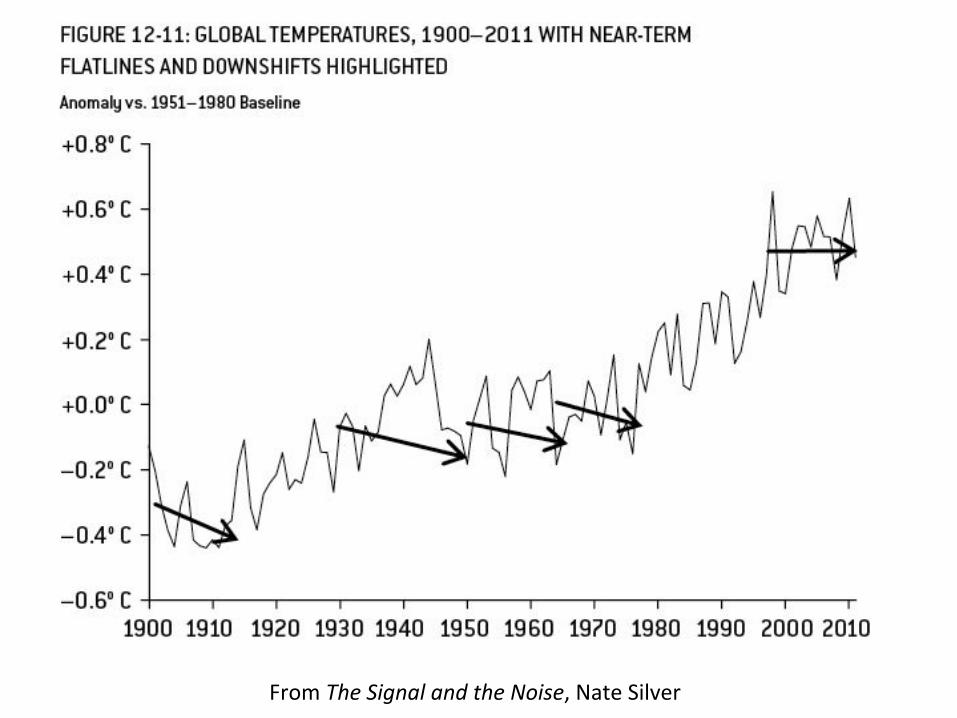
From The Signal and the Noise, Nate Silver
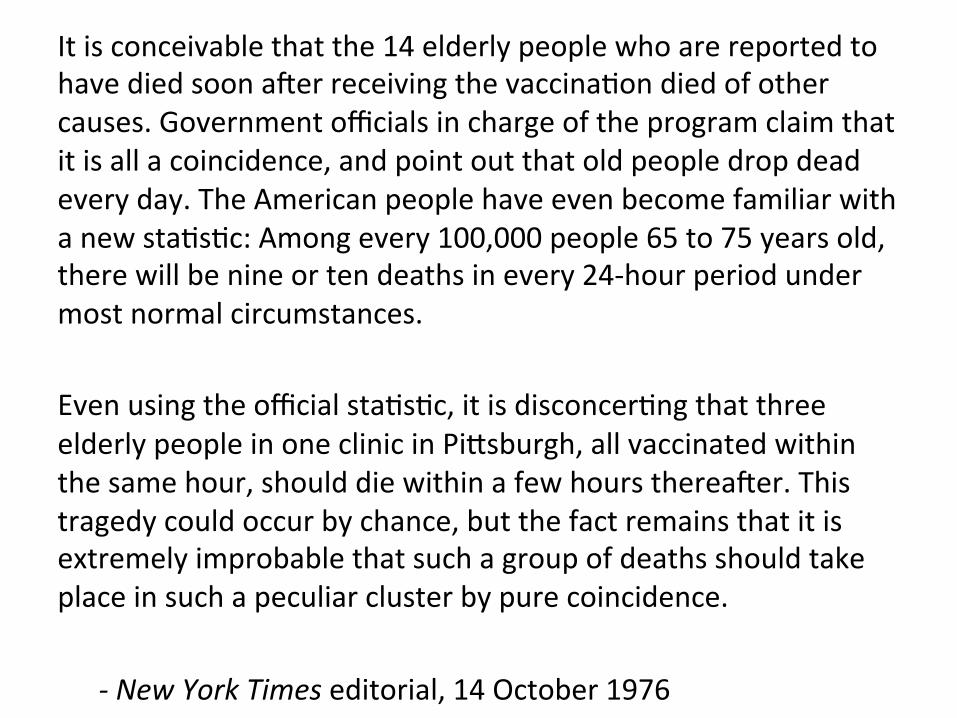
It is conceivable that the 14 elderly people who are reported to have died soon arer receiving the vaccina%on died of other causes. Government officials in charge of the program claim that it is all a coincidence, and point out that old people drop dead every day. The American people have even become familiar with a new sta%s%c: Among every 100,000 people 65 to 75 years old, there will be nine or ten deaths in every 24-‐hour period under most normal circumstances. Even using the official sta%s%c, it is disconcer%ng that three elderly people in one clinic in PiSsburgh, all vaccinated within the same hour, should die within a few hours therearer. This tragedy could occur by chance, but the fact remains that it is extremely improbable that such a group of deaths should take place in such a peculiar cluster by pure coincidence.
-‐ New York Times editorial, 14 October 1976
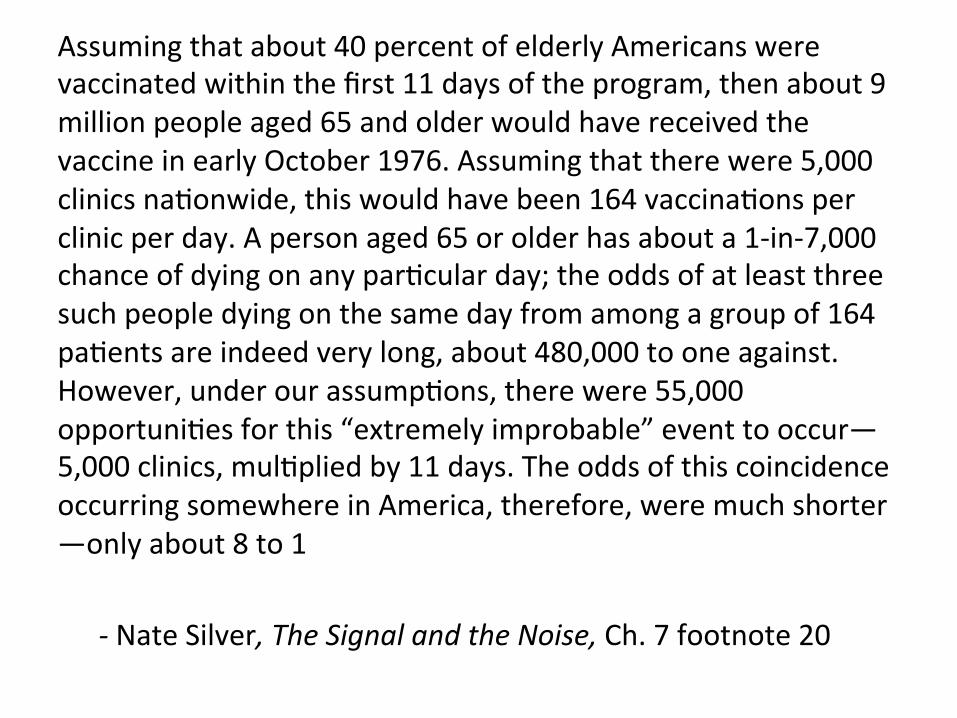
Assuming that about 40 percent of elderly Americans were vaccinated within the first 11 days of the program, then about 9 million people aged 65 and older would have received the vaccine in early October 1976. Assuming that there were 5,000 clinics na%onwide, this would have been 164 vaccina%ons per clinic per day. A person aged 65 or older has about a 1-‐in-‐7,000 chance of dying on any par%cular day; the odds of at least three such people dying on the same day from among a group of 164 pa%ents are indeed very long, about 480,000 to one against. However, under our assump%ons, there were 55,000 opportuni%es for this “extremely improbable” event to occur—5,000 clinics, mul%plied by 11 days. The odds of this coincidence occurring somewhere in America, therefore, were much shorter—only about 8 to 1
-‐ Nate Silver, The Signal and the Noise, Ch. 7 footnote 20
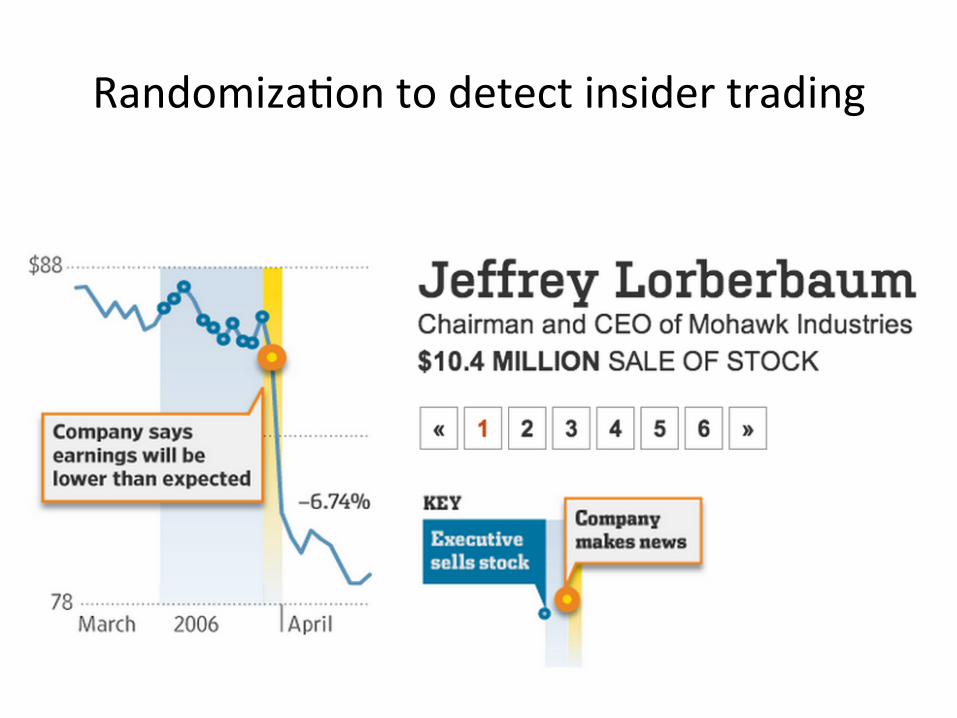
Randomiza%on to detect insider trading
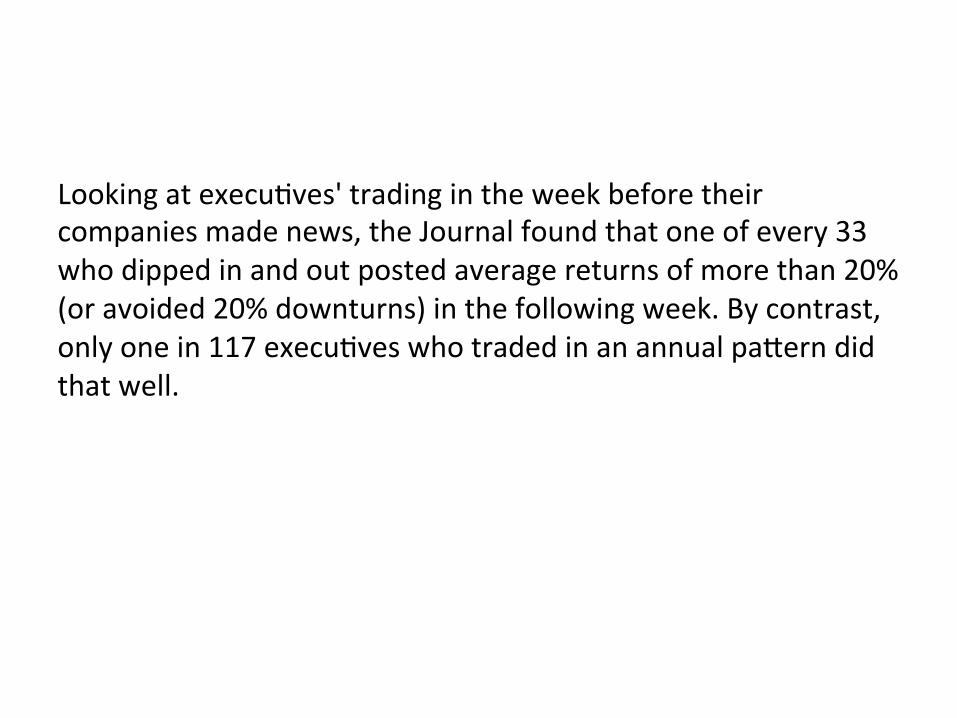
Looking at execu%ves' trading in the week before their companies made news, the Journal found that one of every 33 who dipped in and out posted average returns of more than 20% (or avoided 20% downturns) in the following week. By contrast, only one in 117 execu%ves who traded in an annual paSern did that well.
Random Happens
"Unlikely to happen by chance" is only a good argument if you've es%mated the chance. Also: a parCcular coincidence may be rare, but some coincidence somewhere occurs constantly.
Belief
"What you believe" or "what you think is true" is the en%re defini%on. Says nothing about whether a belief is actually true, or how we would determine that. There are degrees of belief, which can be modeled with a probability distribu%on over alterna%ve hypotheses.
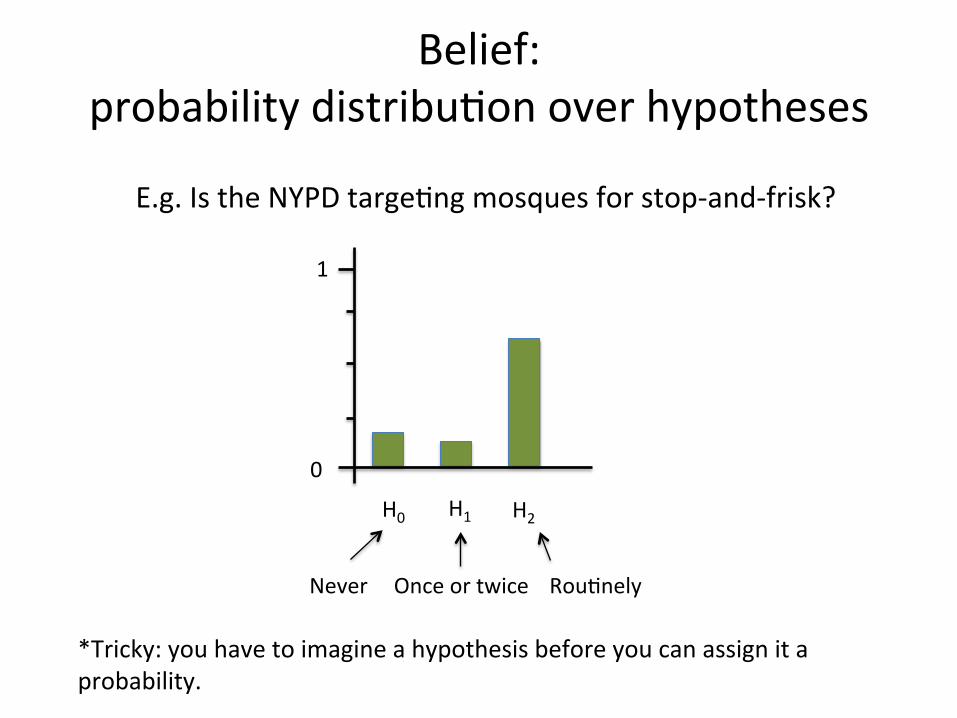
Belief: probability distribu%on over hypotheses
E.g. Is the NYPD targe%ng mosques for stop-‐and-‐frisk?
1
0
H0 H1 H2
Never Rou%nely Once or twice
*Tricky: you have to imagine a hypothesis before you can assign it a probability.
Evidence
Informa%on that jus%fies a belief. Presented with evidence E for X, we should believe X "more." In terms of probability, P(X|E) > P(X)
Strength of Evidence
Is coughing strong or weak evidence for a cold? Expressed in terms of condi%onal probabili%es.
P(cold|coughing)
High values = strong evidence.
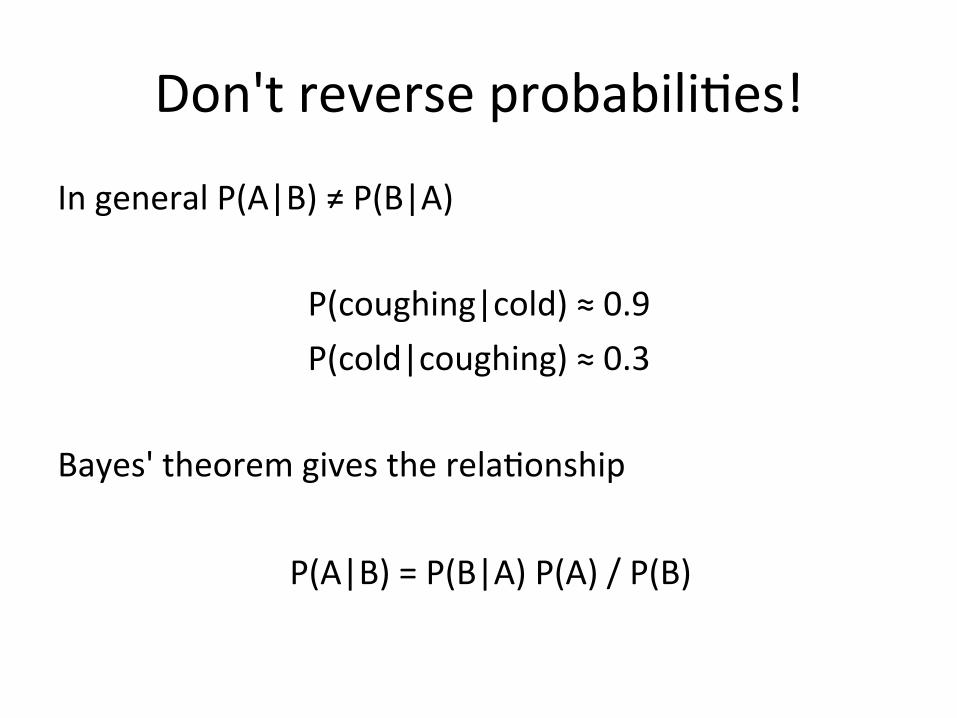
Don't reverse probabili%es!
In general P(A|B) ≠ P(B|A)
P(coughing|cold) ≈ 0.9 P(cold|coughing) ≈ 0.3
Bayes' theorem gives the rela%onship
P(A|B) = P(B|A) P(A) / P(B)
Quan%fied support for hypotheses
How likely is a hypothesis H, given evidence E? Or, what is Pr(H|E)? It depends on: how likely H was before E, Pr(H) how likely the E would be if H is true, Pr(E|H) how common is the evidence, Pr(E)
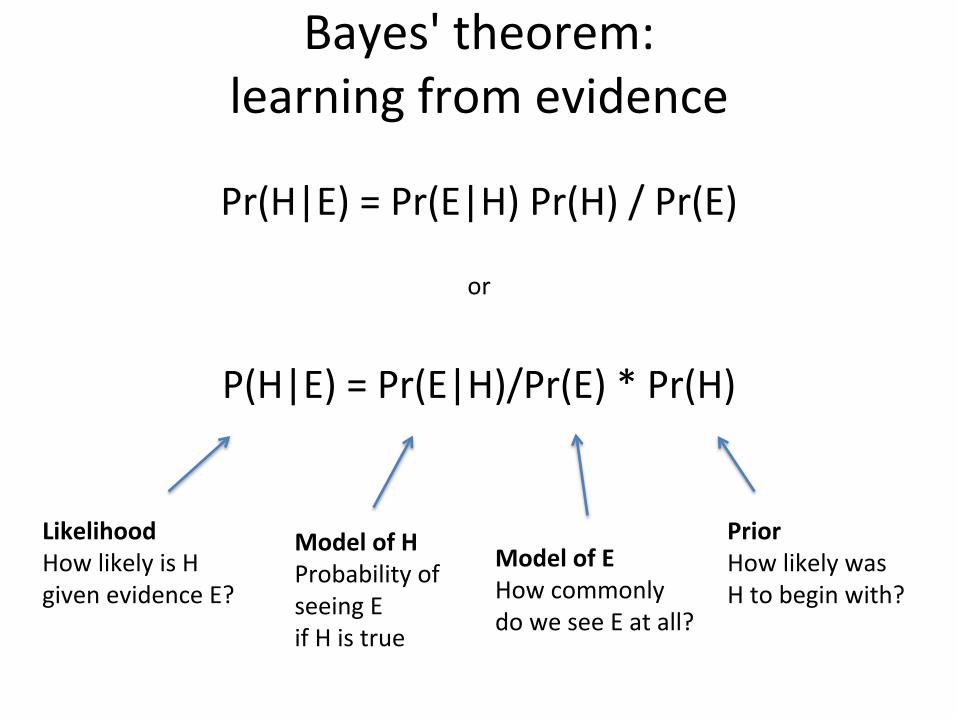
Bayes' theorem: learning from evidence
Pr(H|E) = Pr(E|H) Pr(H) / Pr(E) or
P(H|E) = Pr(E|H)/Pr(E) * Pr(H)
Likelihood How likely is H given evidence E?
Prior How likely was H to begin with?
Model of H Probability of seeing E if H is true
Model of E How commonly do we see E at all?
Alice is coughing. Does she have a cold?
Hypothesis H = Alice has a cold Evidence E = we just saw her cough
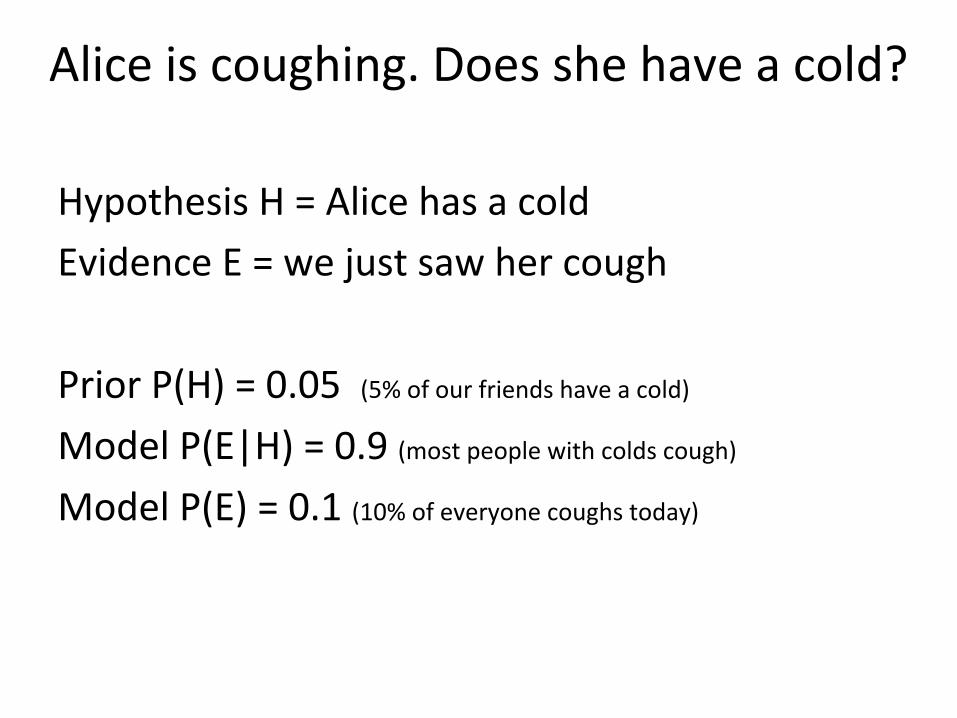
Alice is coughing. Does she have a cold?
Hypothesis H = Alice has a cold Evidence E = we just saw her cough Prior P(H) = 0.05 (5% of our friends have a cold) Model P(E|H) = 0.9 (most people with colds cough)
Model P(E) = 0.1 (10% of everyone coughs today)
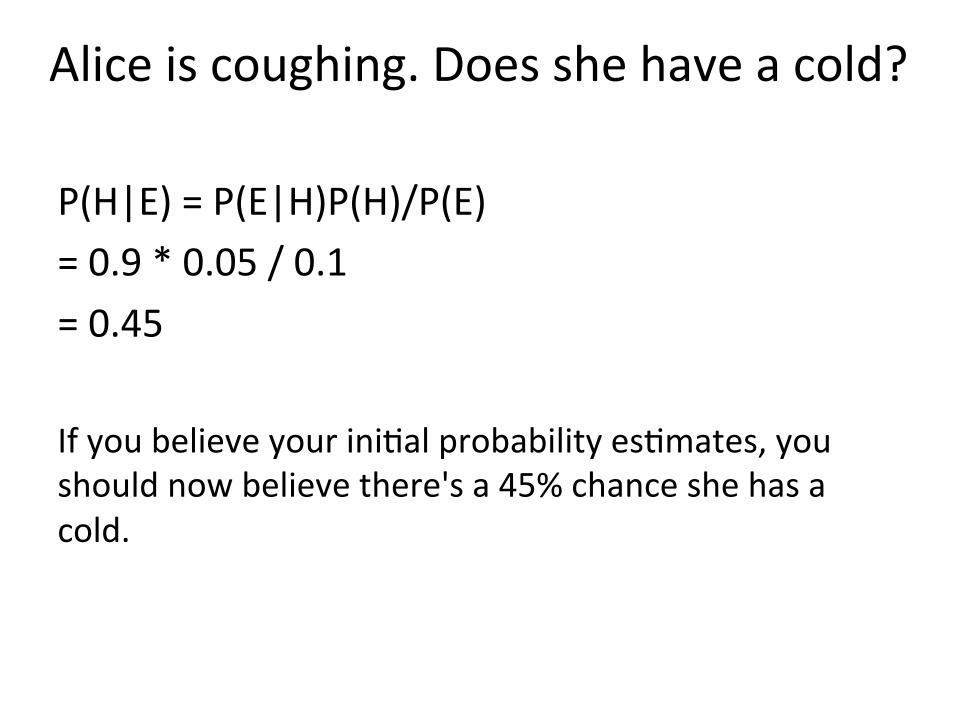
Alice is coughing. Does she have a cold?
P(H|E) = P(E|H)P(H)/P(E) = 0.9 * 0.05 / 0.1 = 0.45 If you believe your ini%al probability es%mates, you should now believe there's a 45% chance she has a cold.
Bias
A systemaCc tendency to produce an incorrect answer. SystemaCc means it's not a random error. There's a paSern to the errors. Implies we could do beSer if we corrected for the paSern.
*Tricky: evalua%ng bias requires knowledge of correct answer.
Cogni%ve biases
Availability heuris%c: we use examples that come to mind, instead of sta%s%cs. Preference for earlier informa%on: what we learn first has a much greater effect on our judgment. Memory forma%on: whatever seems important at the Cme is what gets remembered. Confirma%on bias: we seek out and give greater importance to informa%on that confirms our expecta%ons.
Confirma%on bias
Comes in many forms. ...unconsciously filtering informa%on that doesn't fit expecta%ons. ...not looking for contrary informa%on. ...not imagining the alterna%ves.
The thing about evidence...
As the amount of informa%on increases, it gets more likely that some informa%on somewhere supports any par%cular hypothesis. In other words, if you go looking for confirma%on, you will find it. This is not a complete truth-‐finding method.
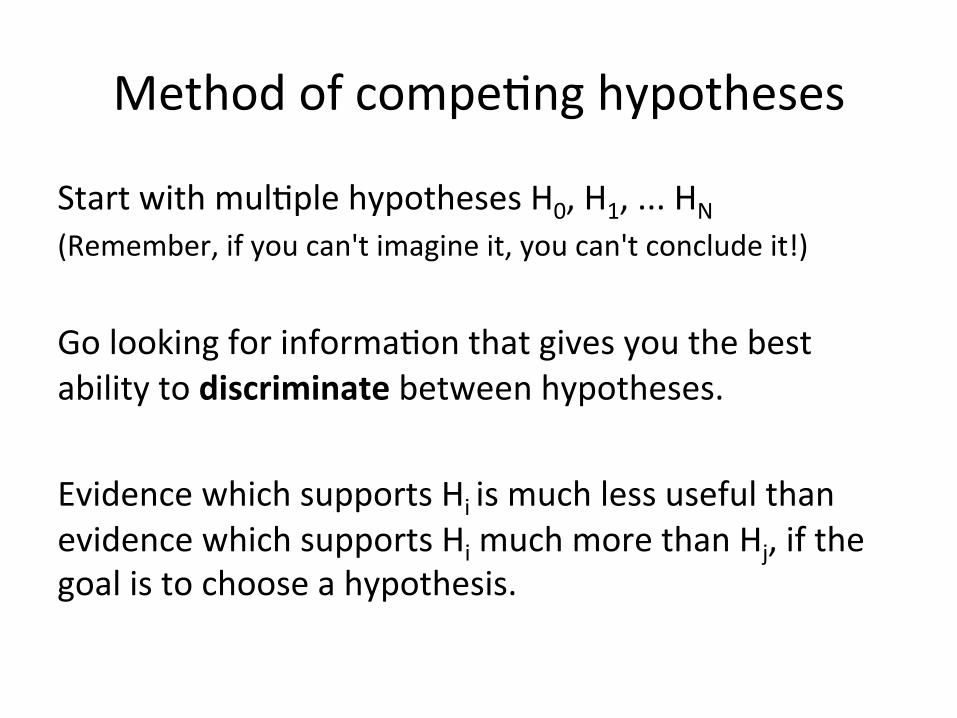
Method of compe%ng hypotheses
Start with mul%ple hypotheses H0, H1, ... HN (Remember, if you can't imagine it, you can't conclude it!)
Go looking for informa%on that gives you the best ability to discriminate between hypotheses. Evidence which supports Hi is much less useful than evidence which supports Hi much more than Hj, if the goal is to choose a hypothesis.
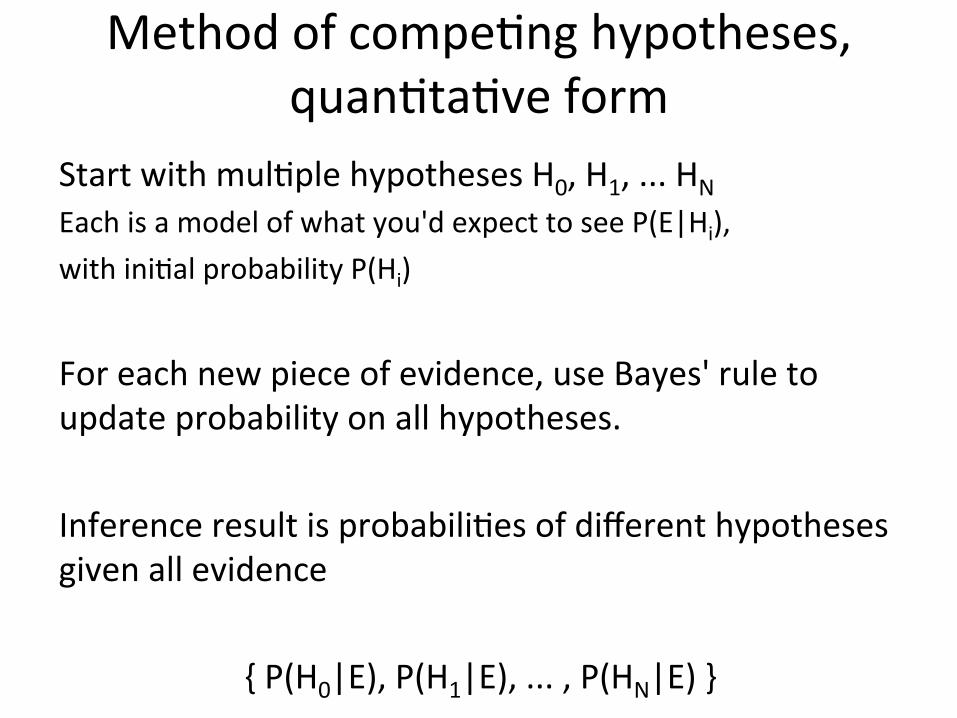
Method of compe%ng hypotheses, quan%ta%ve form
Start with mul%ple hypotheses H0, H1, ... HN Each is a model of what you'd expect to see P(E|Hi), with ini%al probability P(Hi)
For each new piece of evidence, use Bayes' rule to update probability on all hypotheses. Inference result is probabili%es of different hypotheses given all evidence
{ P(H0|E), P(H1|E), ... , P(HN|E) }
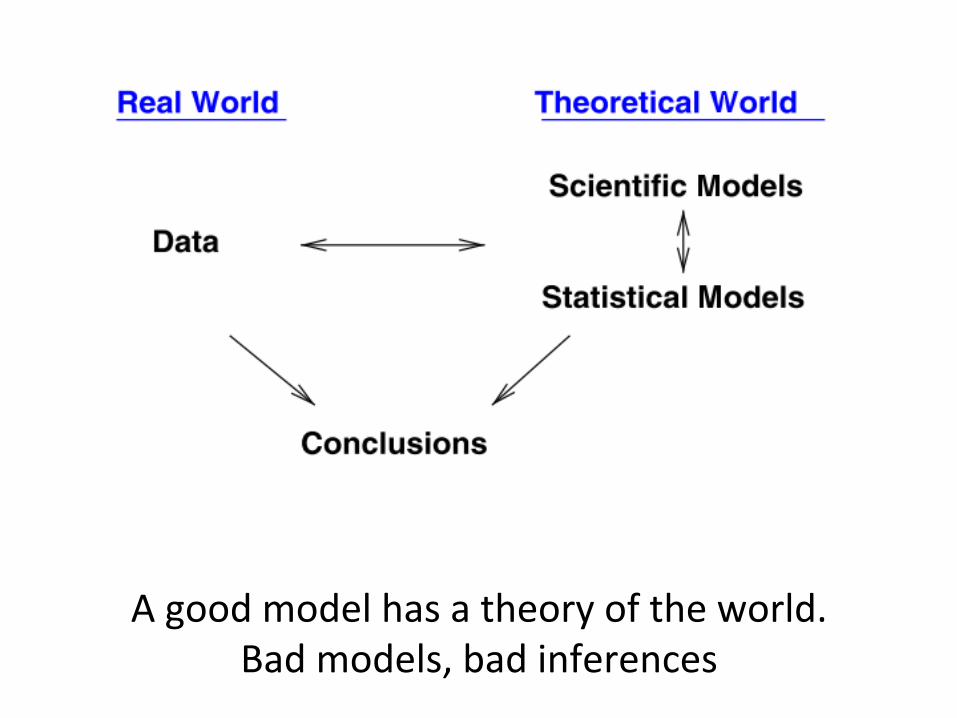
A good model has a theory of the world. Bad models, bad inferences
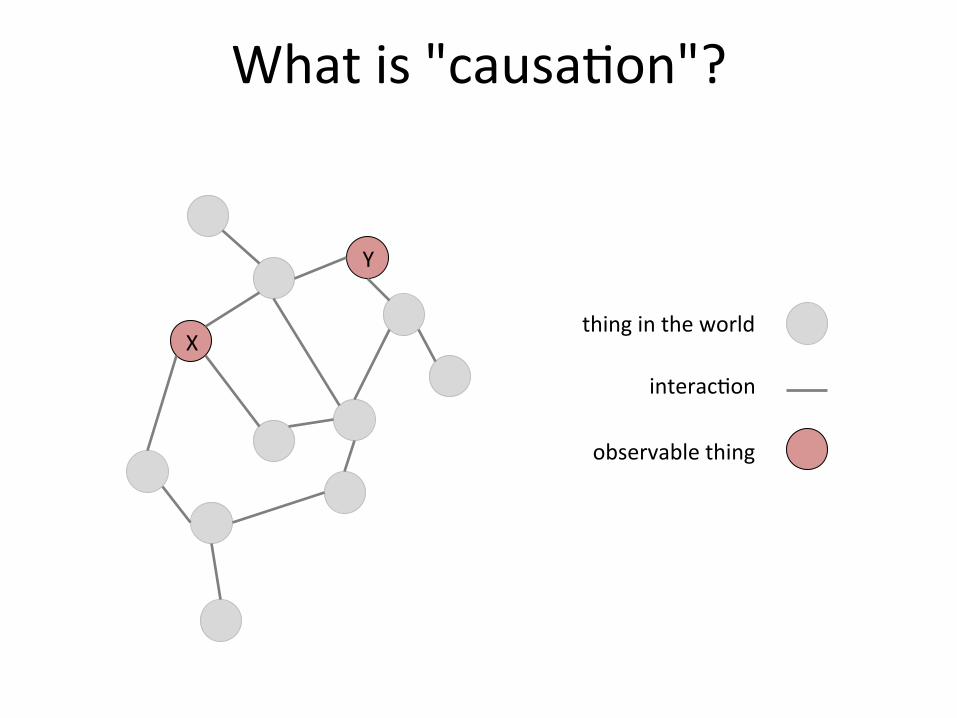
What is "causa%on"?
Y
X
observable thing
thing in the world
interac%on
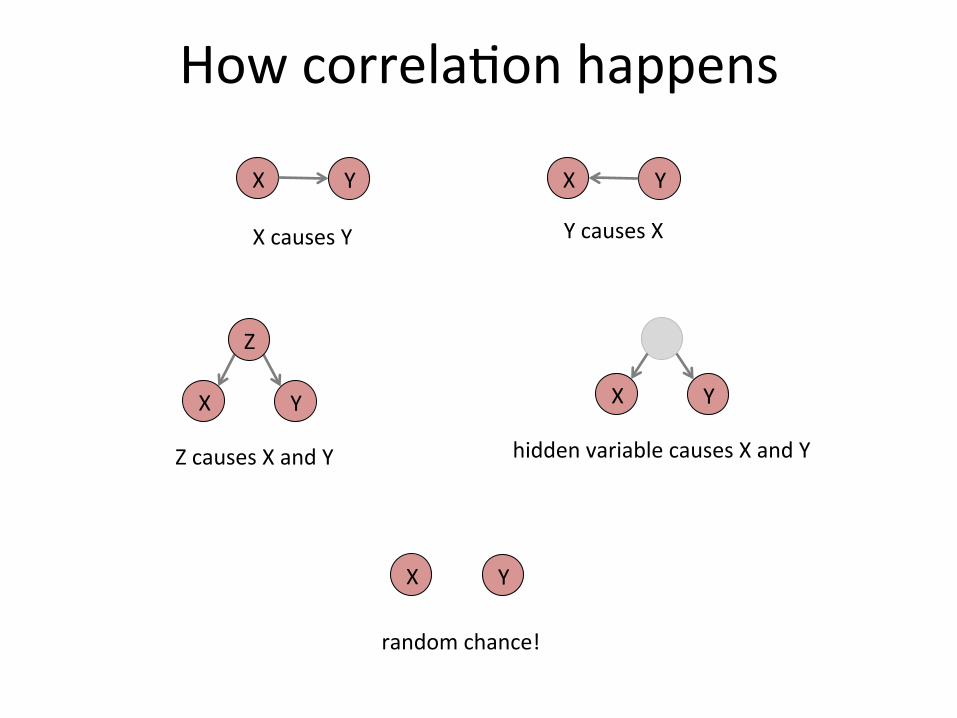
How correla%on happens
YX
X causes Y
YX
Y causes X
YX
random chance!
YX
hidden variable causes X and Y
YX
Z causes X and Y
Z
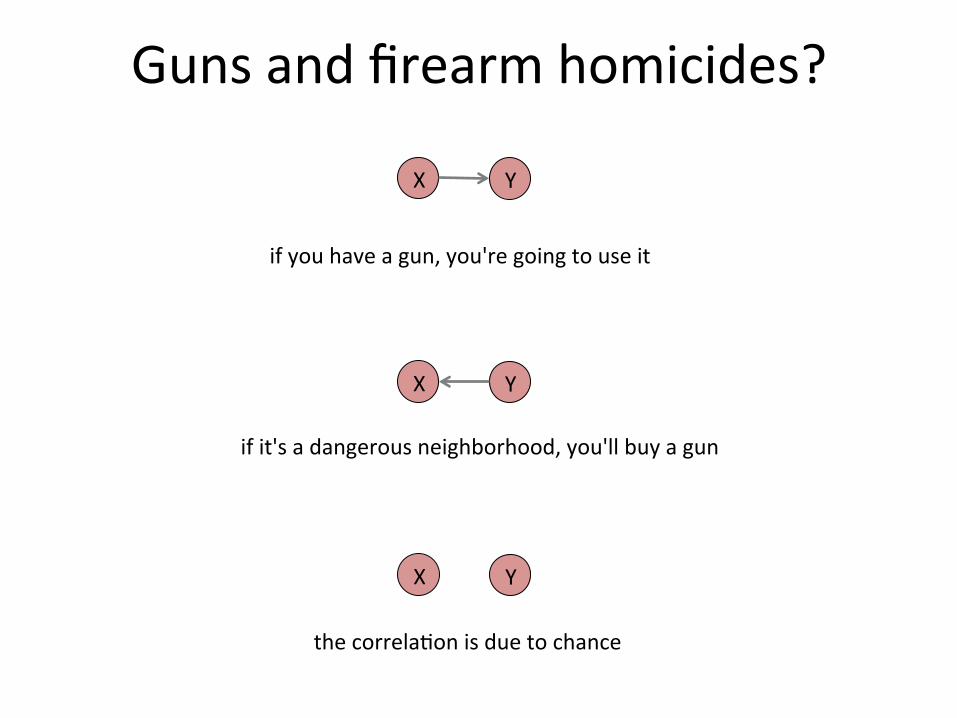
Guns and firearm homicides?
YX
if you have a gun, you're going to use it
YX
if it's a dangerous neighborhood, you'll buy a gun
YX
the correla%on is due to chance
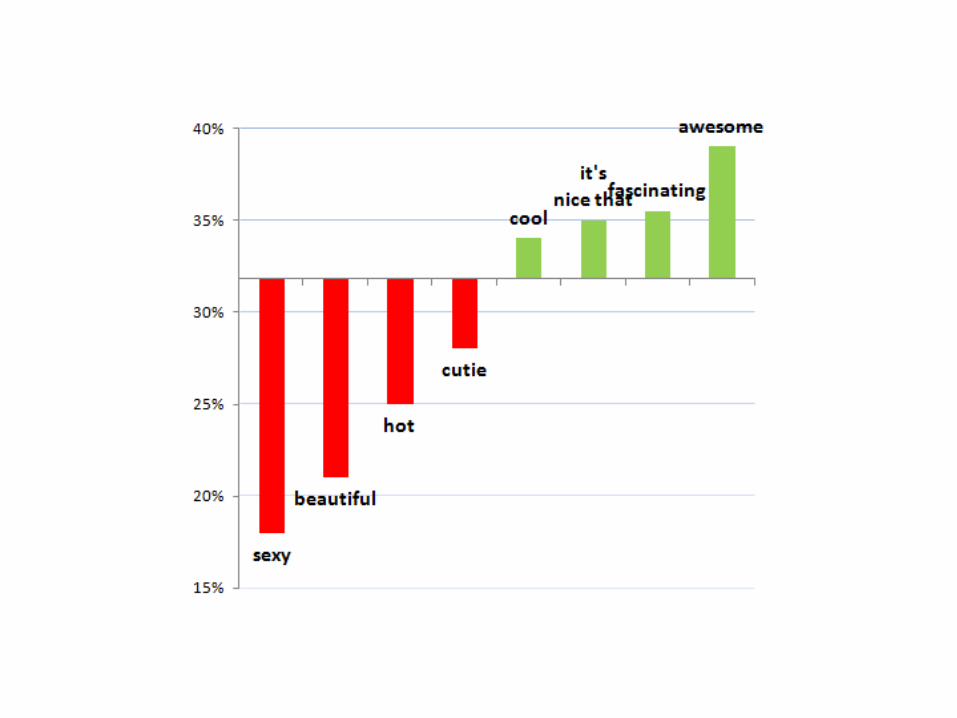
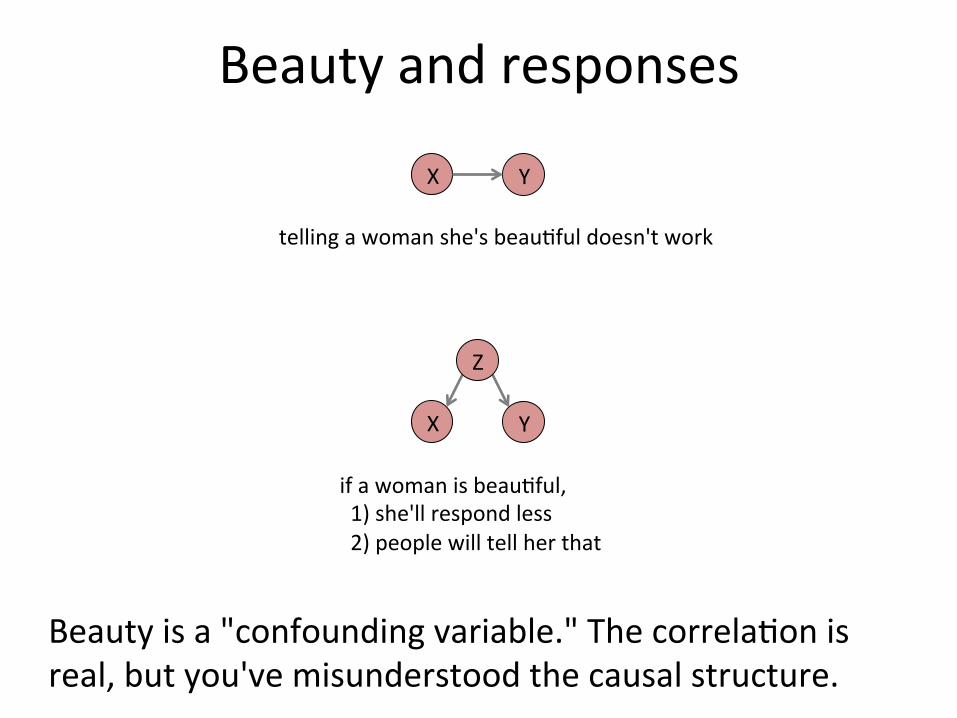
Beauty and responses
YX
telling a woman she's beau%ful doesn't work
YX
if a woman is beau%ful, 1) she'll respond less 2) people will tell her that
Z
Beauty is a "confounding variable." The correla%on is real, but you've misunderstood the causal structure.
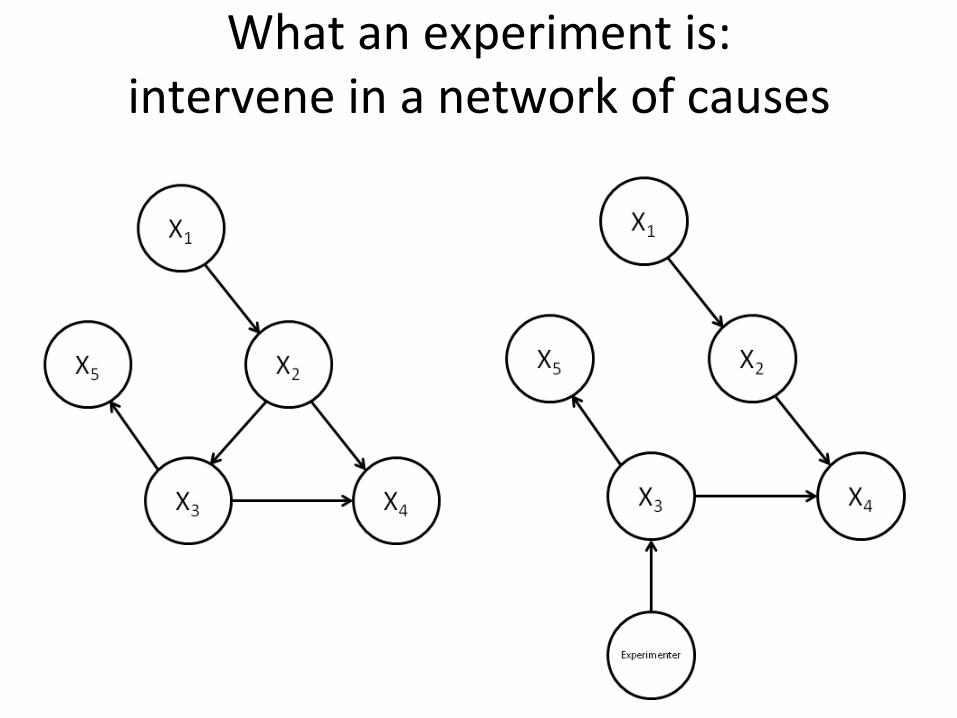
What an experiment is: intervene in a network of causes
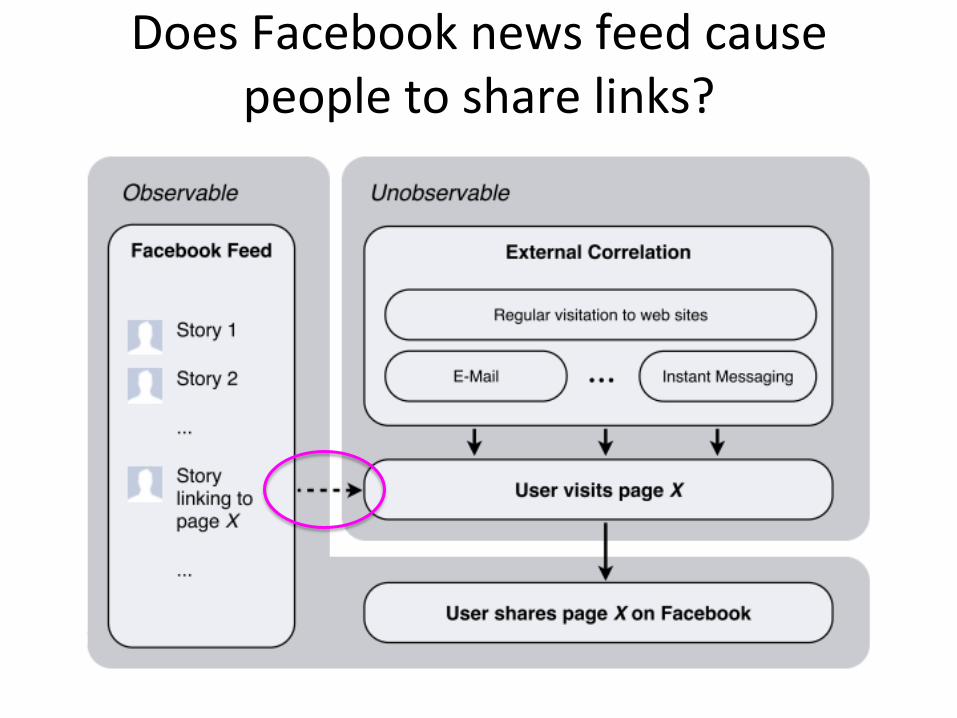
Does Facebook news feed cause people to share links?
A difficult example
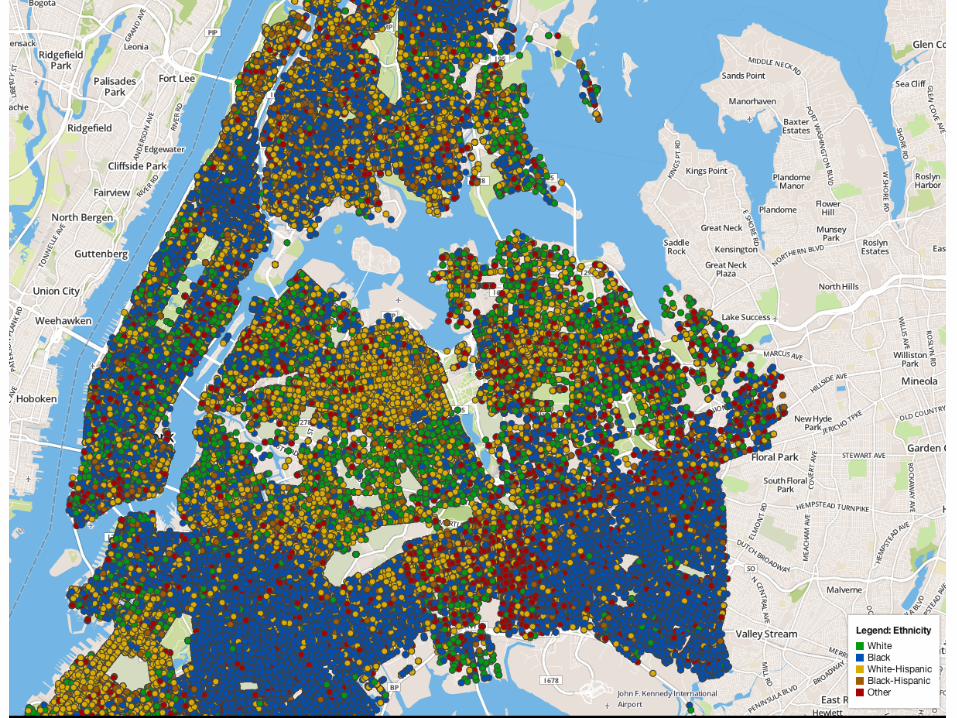
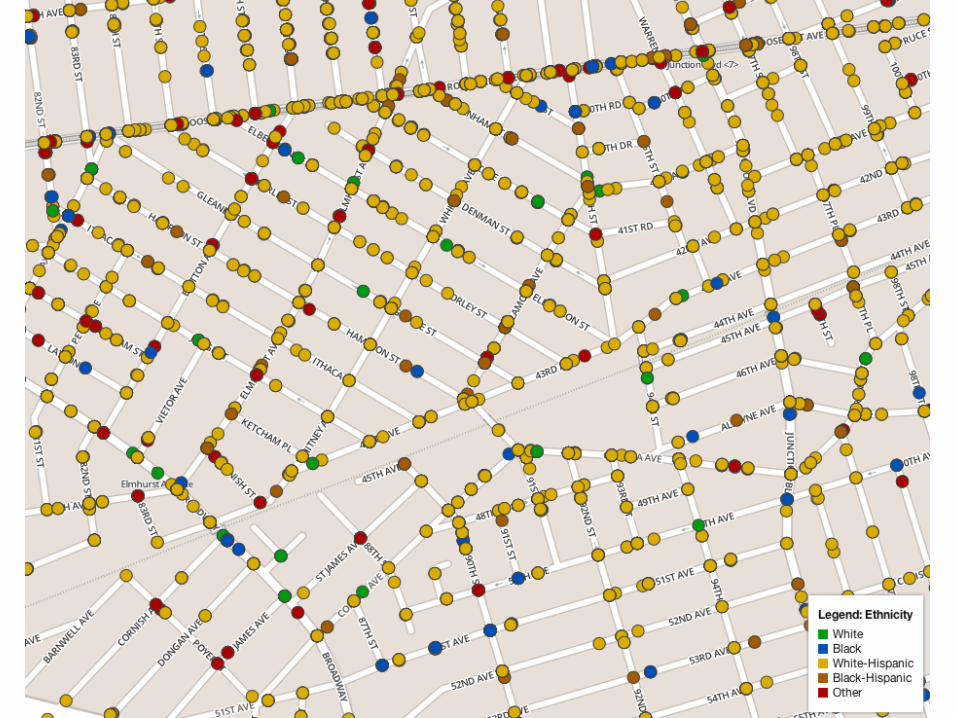
NYPD performs ~600,000 street stop and frisks
per year.
What sorts of conclusions could we draw from this data? How?
Stop and Frisk Causa%on
Suppose you take the address of every mosque in NYC, and discover that there are 15% more stop-‐and-‐frisks within 100m of mosques than the overall average. Can we conclude that the police are targe%ng Muslims?