draft 2010 mta customer satisfaction research...
TRANSCRIPT
2011 MTA CUSTOMER SATISFACTION
RESEARCH RESULTS FOR MTA Bridges and Tunnels
2
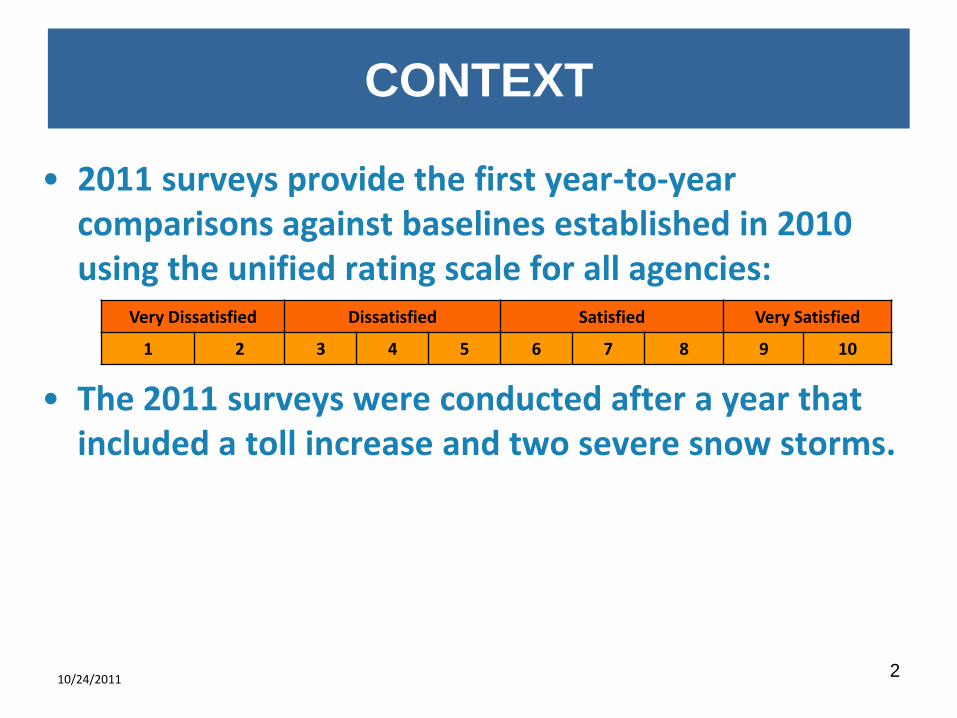
CONTEXT
• 2011 surveys provide the first year-to-year comparisons against baselines established in 2010 using the unified rating scale for all agencies:
• The 2011 surveys were conducted after a year that included a toll increase and two severe snow storms.
Very Dissatisfied Dissatisfied Satisfied Very Satisfied
1 2 3 4 5 6 7 8 9 10
10/24/2011
BRIDGES AND TUNNELS SURVEY RESULTS
10/24/2011 3
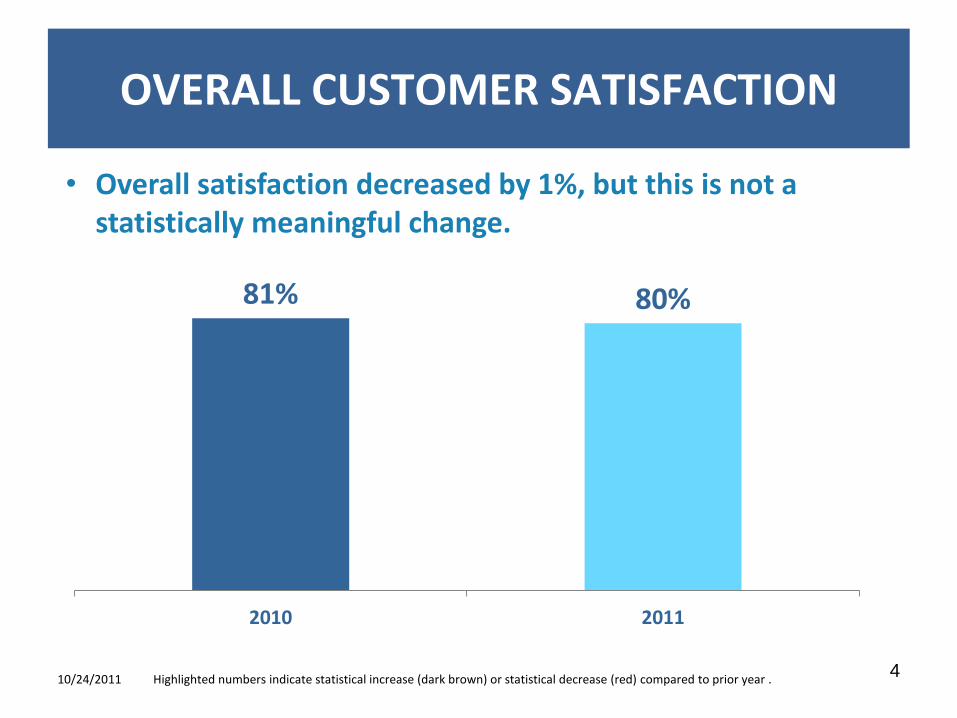
OVERALL CUSTOMER SATISFACTION
Highlighted numbers indicate statistical increase (dark brown) or statistical decrease (red) compared to prior year . 10/24/2011
81% 80%
2010 2011
4
• Overall satisfaction decreased by 1%, but this is not a statistically meaningful change.
FACILITY RATINGS
10/24/2011
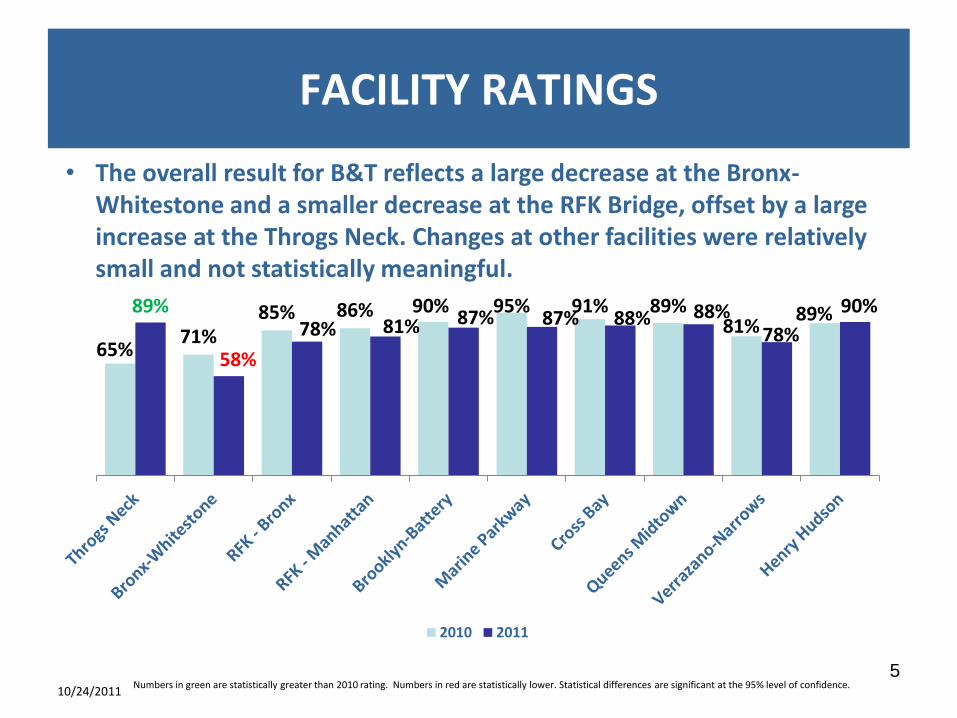
• The overall result for B&T reflects a large decrease at the Bronx-Whitestone and a smaller decrease at the RFK Bridge, offset by a large increase at the Throgs Neck. Changes at other facilities were relatively small and not statistically meaningful.
5 Numbers in green are statistically greater than 2010 rating. Numbers in red are statistically lower. Statistical differences are significant at the 95% level of confidence.
65% 71%
85% 86% 90% 95% 91% 89% 81%
89% 89%
58%
78% 81% 87% 87% 88% 88% 78%
90%
2010 2011
SERVICE ATTRIBUTE RATINGS
10/24/2011 6
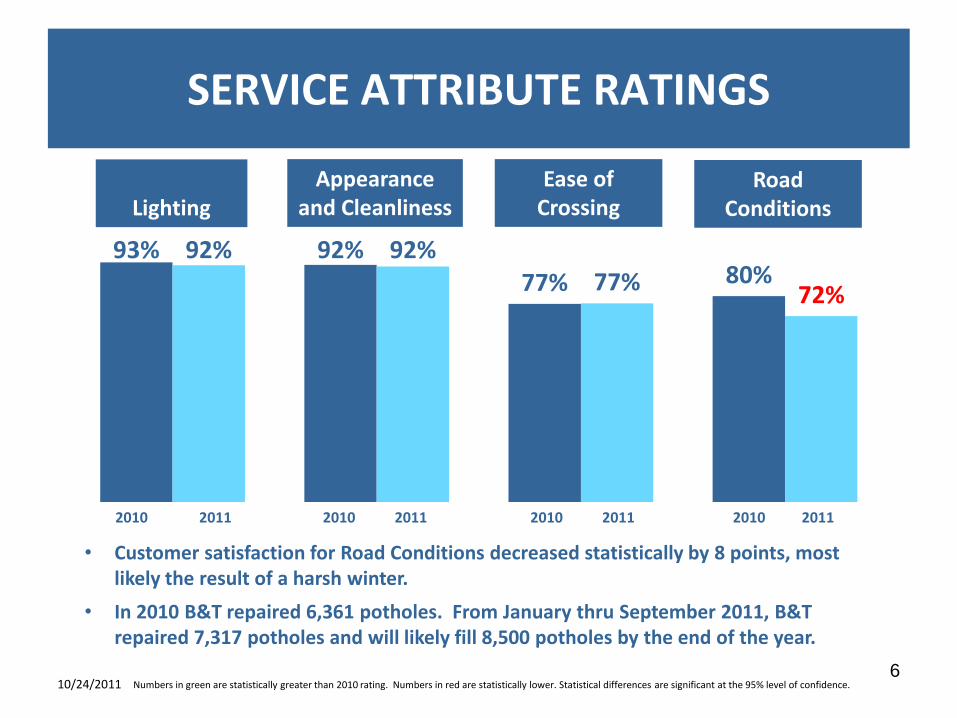
93% 92% 77% 80%
92% 92% 77% 72%
2010 2010 2010 2010 2011 2011 2011 2011
Lighting
Appearance and Cleanliness
Ease of Crossing
Road Conditions
• Customer satisfaction for Road Conditions decreased statistically by 8 points, most likely the result of a harsh winter.
• In 2010 B&T repaired 6,361 potholes. From January thru September 2011, B&T repaired 7,317 potholes and will likely fill 8,500 potholes by the end of the year.
Numbers in green are statistically greater than 2010 rating. Numbers in red are statistically lower. Statistical differences are significant at the 95% level of confidence.
OTHER SERVICE ATTRIBUTES
10/24/2011
7
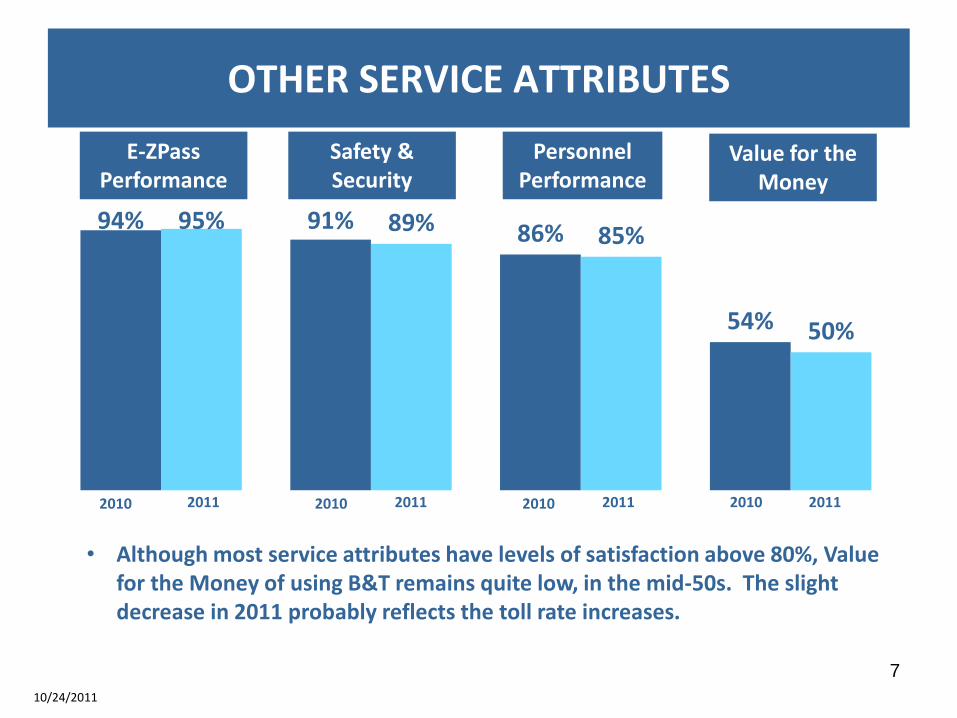
94% 91% 86%
54%
95% 89% 85%
50%
2010 2010 2010 2010 2011 2011 2011 2011
E-ZPass Performance
Safety & Security
Personnel Performance
Value for the Money
• Although most service attributes have levels of satisfaction above 80%, Value for the Money of using B&T remains quite low, in the mid-50s. The slight decrease in 2011 probably reflects the toll rate increases.
10/24/2011 8
AVAILABILITY OF INFORMATION
ABOUT BRIDGES & TUNNELS
Email Alerts
MTA
Website
Travel Time Information on MTA Website
E-ZPass Website
Overall Availability of Information
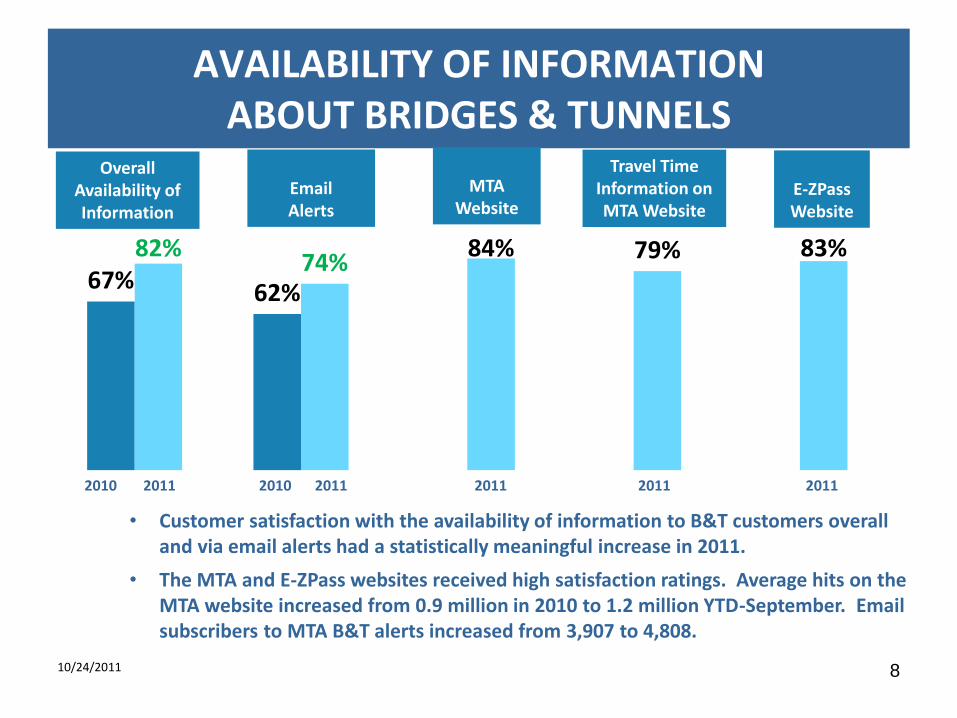
67% 62%
82% 74%
84% 79% 83%
2010 2011 2010 2011 2011 2011 2011
• Customer satisfaction with the availability of information to B&T customers overall and via email alerts had a statistically meaningful increase in 2011.
• The MTA and E-ZPass websites received high satisfaction ratings. Average hits on the MTA website increased from 0.9 million in 2010 to 1.2 million YTD-September. Email subscribers to MTA B&T alerts increased from 3,907 to 4,808.
CONVENIENCE OF TAG SWAP
3%
5%
20%
72%
Very inconvenient
Somewhat inconvenient
Somewhat convenient
Very convenient
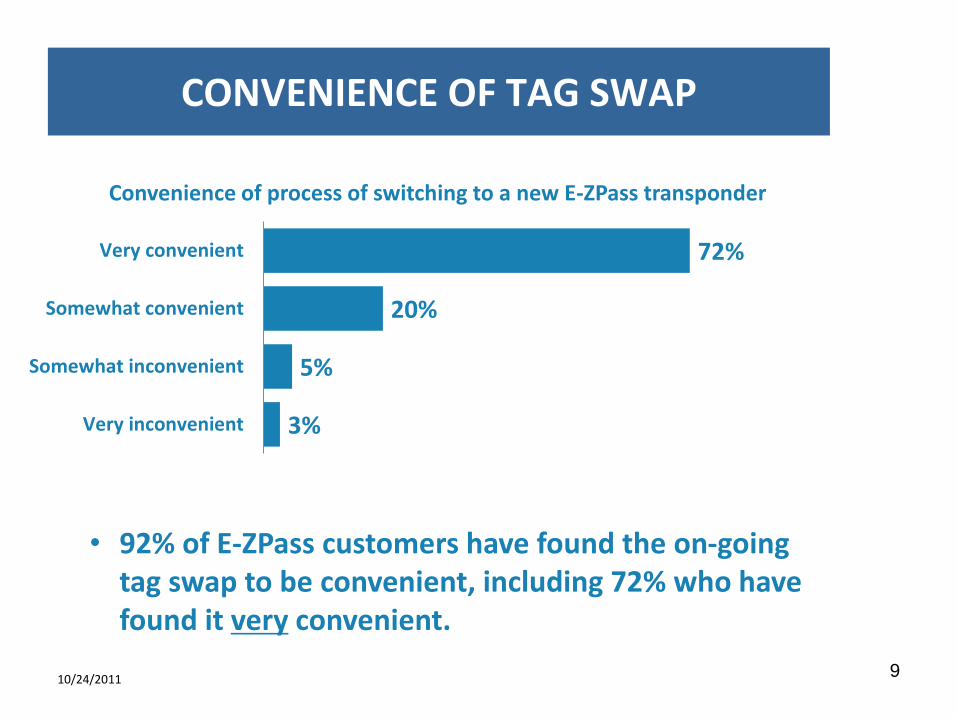
Convenience of process of switching to a new E-ZPass transponder
9
• 92% of E-ZPass customers have found the on-going tag swap to be convenient, including 72% who have found it very convenient.
10/24/2011
10
• Customer satisfaction remains consistent at 80% despite ongoing construction and the toll increase
• Customers are increasingly satisfied with the information they receive from e-mail alerts and the mta.info website
• On-going E-ZPass tag swap appears to be going well
SUMMARY
10/24/2011
• Methodology
• Questionnaire
• Full set of service attribute ratings
APPENDIX
10/24/2011 11
METHODOLOGY
10/24/2011 12
• Cash customers receive survey in lane – 42,625
• E-ZPass customers are directly mailed surveys – 14,588
• E-panelists, previous survey respondents, are sent a link – 4,402
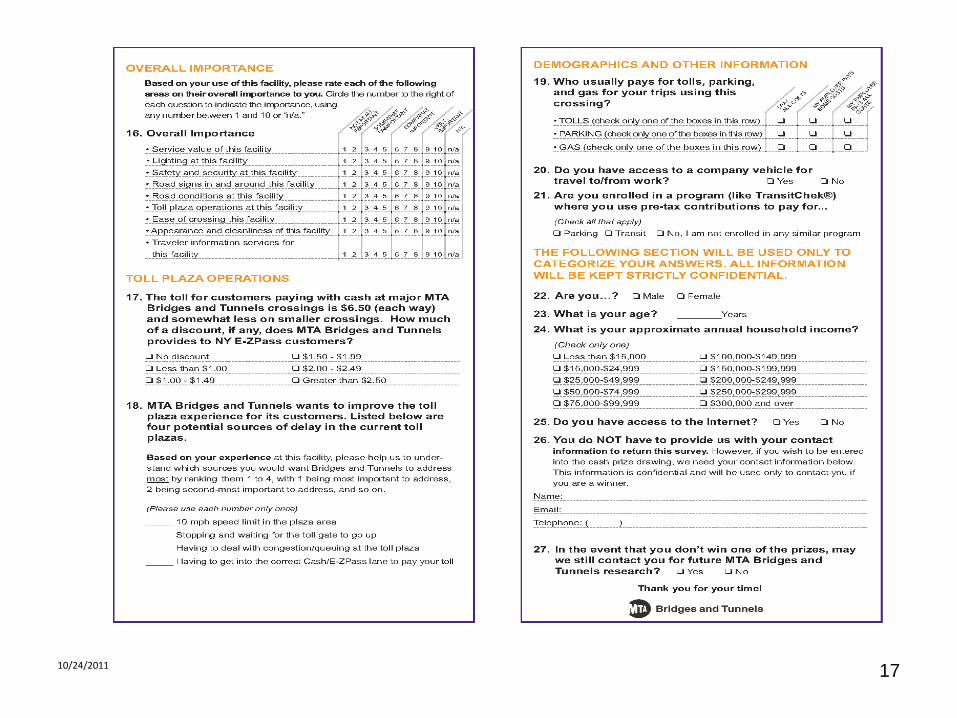
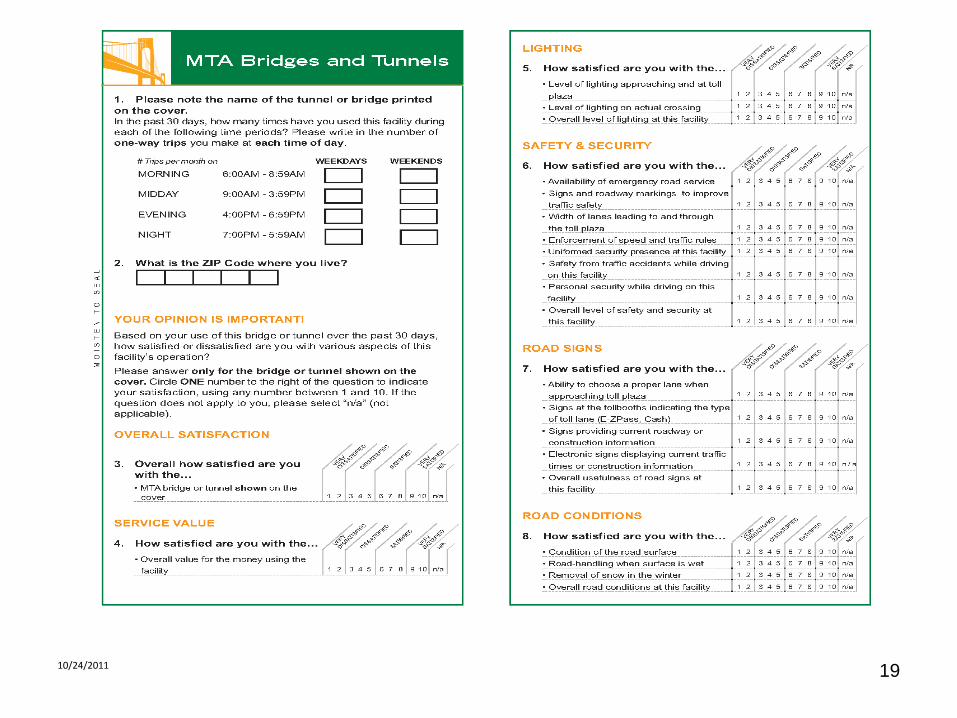
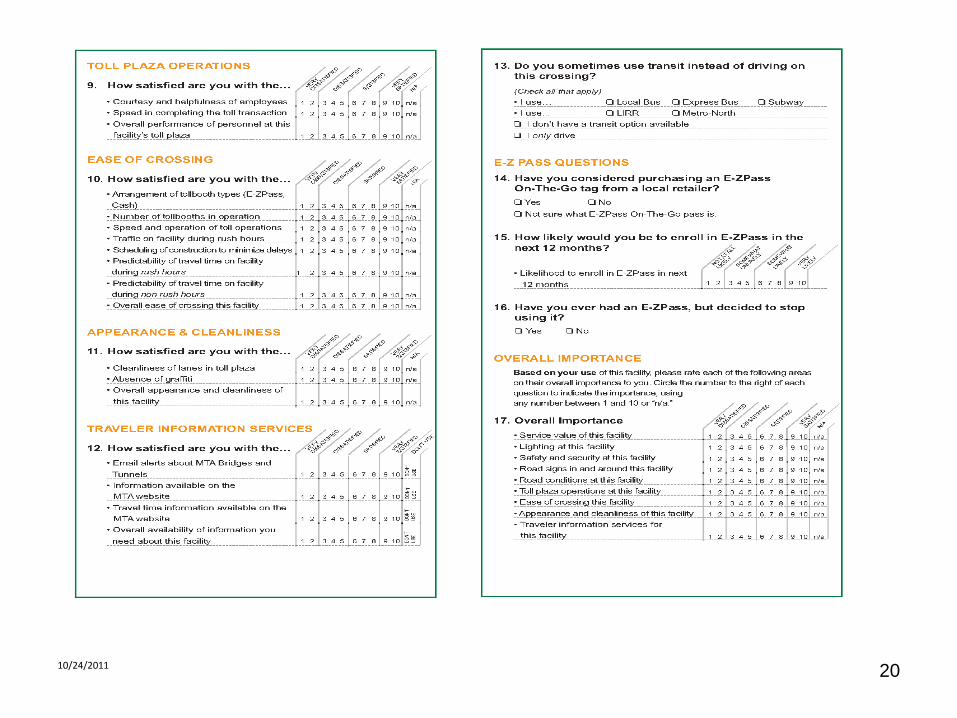
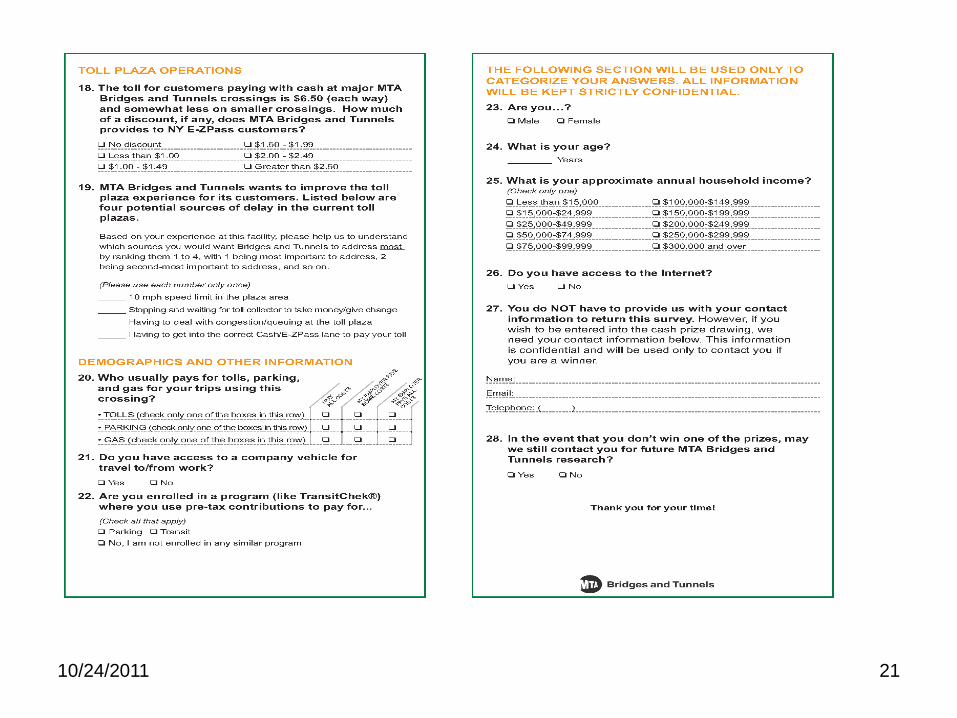
QUESTIONNAIRES
10/24/2011 13
10/24/2011 14
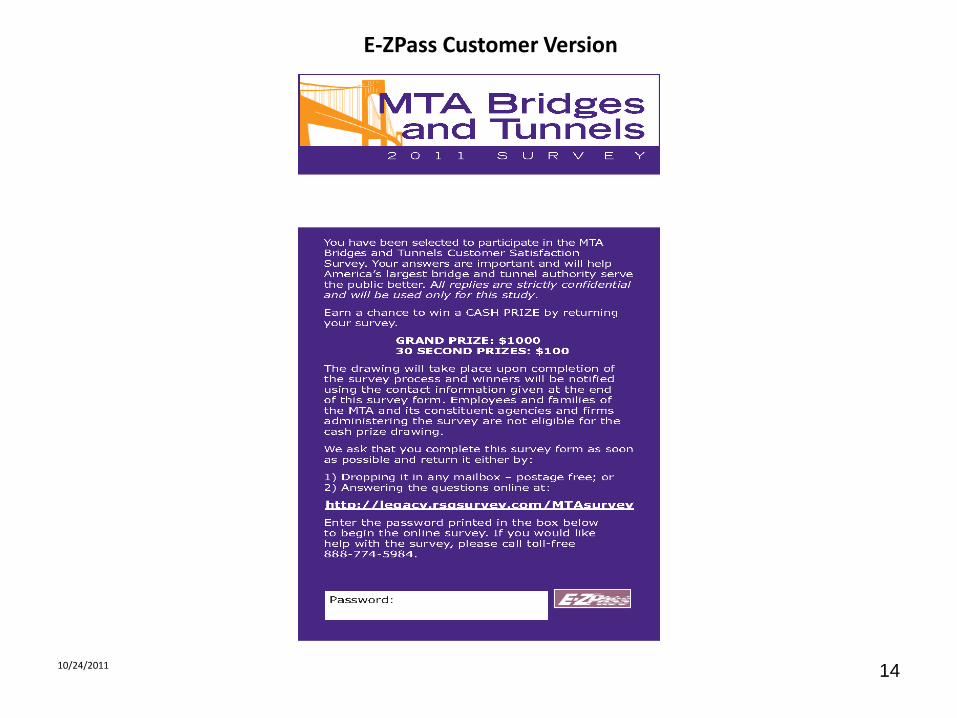
E-ZPass Customer Version
10/24/2011 15
10/24/2011 16
10/24/2011 17
10/24/2011 18
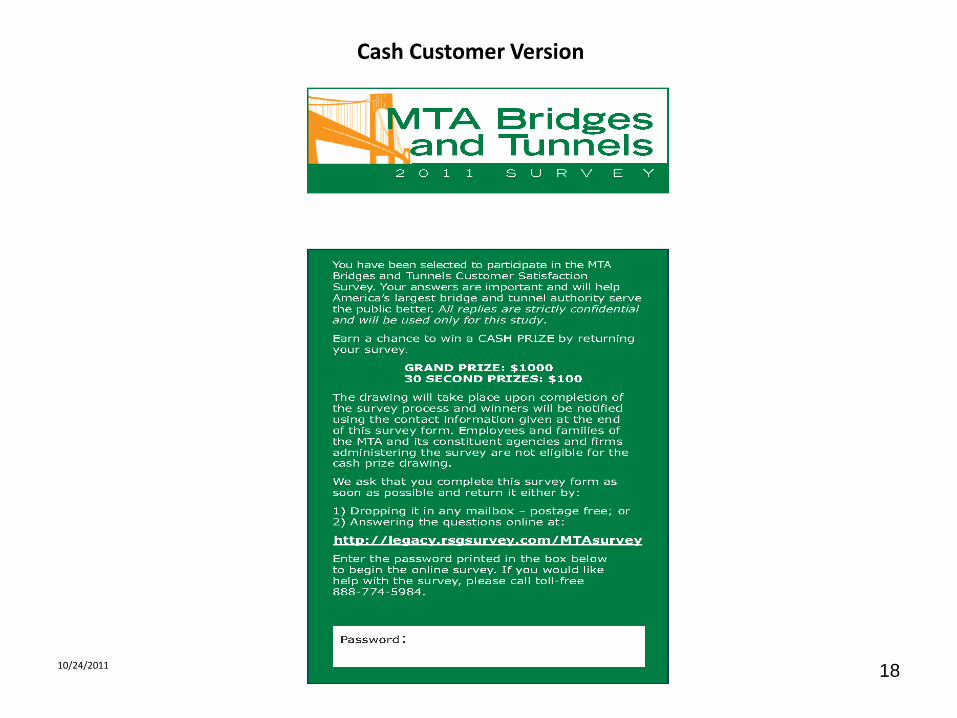
Cash Customer Version
10/24/2011 19
10/24/2011 20
10/24/2011 21

SERVICE ATTRIBUTE RATINGS
10/24/2011 22
2010 2011
Overall customer satisfaction 81% 80%
Availability of discount pricing options 57% 58%
Variety of payment methods available 81% 90%
Overall value for the money 54% 50%
Level of lighting approaching and at toll plaza 93% 92%
Level of lighting on actual crossing 92% 92%
Overall lighting 93% 92%
Availability of emergency road service 86% 85%
Signs and roadway markings to improve traffic safety 81% 80%
Width of lanes leading to and through the toll plaza 81% 77%
Enforcement of speed and traffic rules 86% 86%
Uniformed security presence at this facility 90% 88%
Safety from traffic accidents while driving on this facility 85% 83%
Personal security while driving on this facility 93% 91%
Overall level of safety and security at this facility 91% 89%
Ability to choose proper lane when approaching toll plaza 74% 73%
Signs at the tollbooths indicating the type of toll lane (E-ZPass, Cash) 86% 88%
Signs providing current roadway or construction information 74% 74%
Electronic signs displaying current traffic congestion or construction information 69% 72%
Overall usefulness of road signs 79% 80%
Condition of the road surface 71% 62%
Road-handling when surface is wet 81% 76%
Removal of snow in the winter 89% 85%
Overall road conditions 80% 72%
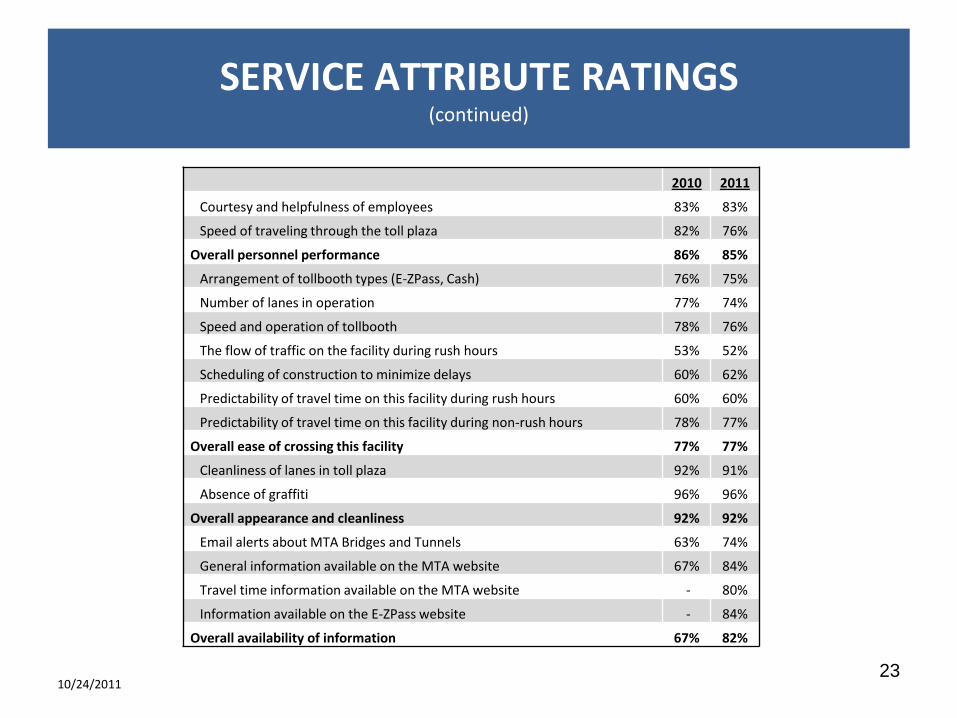
SERVICE ATTRIBUTE RATINGS (continued)
10/24/2011 23
2010 2011
Courtesy and helpfulness of employees 83% 83%
Speed of traveling through the toll plaza 82% 76%
Overall personnel performance 86% 85%
Arrangement of tollbooth types (E-ZPass, Cash) 76% 75%
Number of lanes in operation 77% 74%
Speed and operation of tollbooth 78% 76%
The flow of traffic on the facility during rush hours 53% 52%
Scheduling of construction to minimize delays 60% 62%
Predictability of travel time on this facility during rush hours 60% 60%
Predictability of travel time on this facility during non-rush hours 78% 77%
Overall ease of crossing this facility 77% 77%
Cleanliness of lanes in toll plaza 92% 91%
Absence of graffiti 96% 96%
Overall appearance and cleanliness 92% 92%
Email alerts about MTA Bridges and Tunnels 63% 74%
General information available on the MTA website 67% 84%
Travel time information available on the MTA website - 80%
Information available on the E-ZPass website - 84%
Overall availability of information 67% 82%
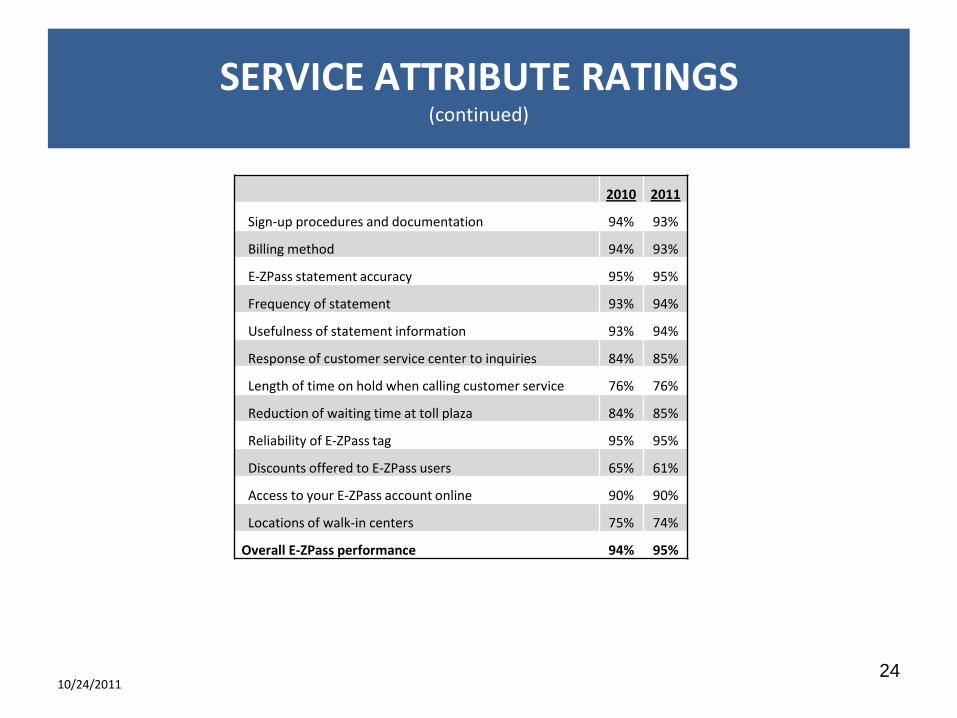
SERVICE ATTRIBUTE RATINGS (continued)
10/24/2011 24
2010 2011
Sign-up procedures and documentation 94% 93%
Billing method 94% 93%
E-ZPass statement accuracy 95% 95%
Frequency of statement 93% 94%
Usefulness of statement information 93% 94%
Response of customer service center to inquiries 84% 85%
Length of time on hold when calling customer service 76% 76%
Reduction of waiting time at toll plaza 84% 85%
Reliability of E-ZPass tag 95% 95%
Discounts offered to E-ZPass users 65% 61%
Access to your E-ZPass account online 90% 90%
Locations of walk-in centers 75% 74%
Overall E-ZPass performance 94% 95%