dr2.1: promise generic models (version 1) - … · this report provides the promise wp r2...
TRANSCRIPT
Copyright © PROMISE Consortium 2004-2008
DR2.1: PROMISE generic models (version 1) DELIVERABLE NO DR2.1: PROMISE generic models (version 1)
DATE 15 November 2005
WORK PACKAGE NO WP R2
VERSION NO. 3.0
ELECTRONIC FILE CODE dr. 2.1 promise generic models (version 1)~1.doc
CONTRACT NO 507100 PROMISE A Project of the 6th Framework Programme Information Society Technologies (IST)
ABSTRACT: This report provides the PROMISE WP R2 deliverable DR2.1: PROMISE generic models. The report contains generic product lifecycle models described with use case diagram and generic product information flow models described with data flow diagram (DFD). The PROMISE generic models have three viewpoints: Hardware, Software, and Business model.
STATUS OF DELIVERABLE
ACTION BY DATE (dd.mm.yyyy)
SUBMITTED (author(s)) Hong-Bae Jun (EPFL) 15.11.2005
VU (WP Leader) D. Kiritsis 15.11.2005
APPROVED (QIM) D. Kiritsis 15.11.2005
Edited by: Hong-Bae Jun, Jong-Ho Shin, and Young-SeoK Kim (EPFL) Odd Myklebust (SINTEF), Kary Främling (HUT)
Copyright © PROMISE Consortium 2004-2008 Page ii
@
Revision History
Date (dd.mm.yyyy)
Version Author Comments
29.09.2005 1.1 Myblebust odd
10.10.2005 1.4 Jong-ho Shin
13.10.2005 1.6 Hong-Bae Jun
15.10.2005 1.7 Hong-Bae Jun Modification of introduction: purpose of PROMISE generic models
17.10.2005 1.8 Hong-Bae Jun Modificaiton of state-of-the art part
24.10.2005 2.0 Hong-Bae Jun, Jong-ho Shin, Yeong-Seok Kim Adding integration models
27.10.2005 2.4 Hong-Bae Jun, Jong-ho Shin, Yeong-Seok Kim Adding integration models
2.11.2005 2.7 Hong-Bae Jun, Jong-ho Shin, Yeong-Seok Kim Editing
7.11.2005 2.8 Gregor Hackenbroich Review
9.11.2005 2.9 Dimitris Kiritsis Review
11.11.2005 3.0 Hong-Bae Jun, Jong-ho Shin, Yeong-Seok Kim Modification
Author(s)’ contact information Name Organisation E-mail Tel Fax Hong-Bae Jun EPFL [email protected] +41216937331 +41216933509 Jong-Ho Shin EPFL [email protected] +41216937331 +41216933509 Young-Seok Kim EPFL [email protected] +41216935303 +41216933509 Odd Myklebust SINTEF [email protected] +4773597120 Paul Folan CIMRU [email protected] +35391493132 +35391562894 James Brusey Cambridge [email protected] +441223765605 +441223765597 Ajith Parlikad Cambridge [email protected] +447903093980 +441223765597 Lutz Rabe BIBA [email protected] +494212185519 Altug Metin InMediasP [email protected] +493302559409 +493302559124 Rosanna Fornasiero ITIA-CNR [email protected] +390223699603 +39223699616 Kary Främling HUT kary.frä[email protected]
Mario neugebauer SAP [email protected] Zvonimir Mostarkic Cognidata [email protected] +49 160 99495782 Gerd Große Cognidata [email protected] +49 6101 6559901
Copyright © PROMISE Consortium 2004-2008 Page 1
@
Table of Contents PART I: INTRODUCTION ...........................................................................................................................................5
1 PURPOSE OF PROMISE GENERIC MODELS....................................................................................7
2 OBJECTIVES AND THE PROCESS OF PREPARING THE DELIVERABLE ................................9 2.1 OBJECTIVES OF WORK-PACKAGE R2..............................................................................................................9 2.2 DERIVED OBJECTIVES OF DELIVERABLE, DR2.1, BASED ON THE TASK DESCRIPTION AND IDENTIFIED
CHALLENGES .................................................................................................................................................9 2.3 OVERALL FRAMEWORK FOR PREPARING THE DELIVERABLE DR2.1...............................................................9
3 INVOLVING PARTNERS IN WP R2 ...................................................................................................13
4 ORGANIZATION OF THIS REPORT .................................................................................................15
PART II: STATE-OF-THE-ART ................................................................................................................................17
5 INTRODUCTION TO THE STATE-OF-THE-ART CHAPTERS .....................................................19 5.1 INTRODUCTION............................................................................................................................................19 5.2 CONTRIBUTION AREA OF EACH PARTNER.....................................................................................................21
6 PRODUCT LIFECYCLE MODELLING METHODOLOGIES.........................................................23 6.1 ENTERPRISE MODELLING METHODOLOGIES .................................................................................................23
6.1.1 IDEF ......................................................................................................................................................23 6.1.2 Integrated Enterprise Modeling (IEM) ..................................................................................................24 6.1.3 CIMOSA.................................................................................................................................................24 6.1.4 Purdue Enterprise Reference Architecture (PERA)...............................................................................24 6.1.5 ARIS .......................................................................................................................................................24 6.1.6 GERAM..................................................................................................................................................24 6.1.7 UEML ....................................................................................................................................................25
6.2 PLM RELATED MODELLING WORKS.............................................................................................................25 6.2.1 High-level PLM definition .....................................................................................................................25 6.2.2 New business model in virtual enterprise ..............................................................................................25 6.2.3 IBM research project .............................................................................................................................25 6.2.4 Conceptual lifecycle modeling framework with IDEF (Tipnis 1995) ....................................................25 6.2.5 Product model of ISO 10303 (STEP).....................................................................................................27
6.3 REVIEWS OF COMMERCIAL PLM SYSTEMS ..................................................................................................29 7 PREVIOUS INFORMATION FLOW MODELLING METHODOLOGIES ....................................31
7.1 UML ...........................................................................................................................................................31 7.1.1 Sequence diagrams ................................................................................................................................31 7.1.2 Swimlane charts.....................................................................................................................................33 7.1.3 State chart diagrams..............................................................................................................................34
7.2 IDEF1 .........................................................................................................................................................37 7.2.1 A brief history ........................................................................................................................................37 7.2.2 Overview of IDEF1................................................................................................................................38 7.2.3 IDEF1 Principles...................................................................................................................................38 7.2.4 IDEF1 Concepts ....................................................................................................................................38 7.2.5 Developing an IDEF1 model .................................................................................................................39 7.2.6 Strengths of IDEF1 ................................................................................................................................40
7.3 IDEF1X.......................................................................................................................................................40 7.3.1 Overview................................................................................................................................................40 7.3.2 IDEF1X Concepts ..................................................................................................................................40 7.3.3 Syntax and Semantics of IDEF1X ..........................................................................................................40 7.3.4 Strengths of IDEF1X..............................................................................................................................43
7.4 EVENT PROCESS CHAIN (EPC) DIAGRAMS ..................................................................................................44 7.5 OBJECT-PROCESS METHODOLOGY ..............................................................................................................45
Copyright © PROMISE Consortium 2004-2008 Page 2
@
7.5.1 Introduction of OPM..............................................................................................................................45 7.5.2 Basic component of OPM ......................................................................................................................46 7.5.3 Multi-level modelling.............................................................................................................................47 7.5.4 Example .................................................................................................................................................47
PART III: DEFINITION OF GENERIC PRODUCT LIFECYCLE MODEL..........................................................49
8 INTRODUCTION TO DEFINITION OF GENERIC PRODUCT LIFECYCLE MODEL..............51 8.1 THE PURPOSE OF GENERIC PRODUCT LIFECYCLE MODEL..............................................................................51 8.2 CONTRIBUTION AREA OF EACH PARTNER IN PART III ..................................................................................51 8.3 ORGANIZATION OF PART III ........................................................................................................................51
9 SELECTED MODELLING METHOD .................................................................................................52 9.1 DESCRIPTION OF MODELLING TEMPLATE.....................................................................................................52 9.2 GRANULARITY OF MODELING......................................................................................................................55 9.3 MODELING PROCEDURE...............................................................................................................................55
10 GENERIC PRODUCT LIFECYCLE MODEL.....................................................................................58 10.1 INTEGRATED MODEL....................................................................................................................................58
10.1.1 Overall model....................................................................................................................................58 10.1.2 BOL model ........................................................................................................................................61 10.1.3 MOL model .......................................................................................................................................64 10.1.4 EOL model ........................................................................................................................................67
10.2 BUSINESS MODEL ........................................................................................................................................70 10.2.1 Overall model....................................................................................................................................70 10.2.2 BOL Model........................................................................................................................................72 10.2.3 MOL Model .......................................................................................................................................73 10.2.4 EOL Model........................................................................................................................................75
10.3 HARDWARE MODEL .....................................................................................................................................77 10.3.1 PEID .................................................................................................................................................77
10.4 SOFTWARE MODEL ......................................................................................................................................85 10.4.1 PDKM/Field DB ...............................................................................................................................85 10.4.2 Decision making/supporting .............................................................................................................93 10.4.3 Data transformation........................................................................................................................118 10.4.4 Middleware .....................................................................................................................................129 10.4.5 Embedded software .........................................................................................................................132
PART IV: DEFINITION OF GENERIC PRODUCT INFORMATION FLOW MODELS ..................................140
11 INTRODUCTION TO GENERIC PRODUCT INFORMATION FLOW MODELS .....................142 11.1 THE PURPOSE OF GENERIC PRODUCT INFORMATION FLOW MODELS...........................................................142 11.2 CONTRIBUTION AREA OF EACH PARTNER IN PART IV ................................................................................142 11.3 ORGANIZATION OF THIS PART....................................................................................................................143
12 SELECTED MODELLING METHOD ...............................................................................................144 12.1 OVERALL FRAMEWORK FOR MODELLING GENERIC PRODUCT INFORMATION FLOW MODEL .......................144 12.2 DESCRIPTION OF MODELLING TEMPLATE...................................................................................................144 12.3 GRANULARITY OF MODELING....................................................................................................................145 12.4 MODELING PROCEDURE.............................................................................................................................145
13 GENERIC PRODUCT INFORMATION FLOW MODEL ...............................................................148 13.1 INTEGRATED MODEL..................................................................................................................................148
13.1.1 Overall model..................................................................................................................................148 13.1.2 BOL Model......................................................................................................................................149 13.1.3 MOL Model .....................................................................................................................................150 13.1.4 EOL Model......................................................................................................................................152
13.2 BUSINESS MODEL ......................................................................................................................................154 13.2.1 BOL Model......................................................................................................................................156 13.2.2 MOL Model .....................................................................................................................................157 13.2.3 EOL Model......................................................................................................................................159
13.3 HARDWARE MODEL ...................................................................................................................................161
Copyright © PROMISE Consortium 2004-2008 Page 3
@
13.3.1 PEID ...............................................................................................................................................161 13.4 SOFTWARE MODEL ....................................................................................................................................167
13.4.1 PDKM/Field DB .............................................................................................................................167 13.4.2 Decision making/supporting ...........................................................................................................177 13.4.3 Data transformation........................................................................................................................183 13.4.4 Middleware .....................................................................................................................................190 13.4.5 Embedded software .........................................................................................................................198
PART V: CONCLUDING REMARKS ....................................................................................................................205
14 CONCLUDING REMARKS TO THE WORK-PACKAGE R2, DELIVERABLE DR2.1 .............207
REFERENCES AND APPENDIX...........................................................................................................................209 A.1 Agile PLM............................................................................................................................................213 A.2 ARENA PLM........................................................................................................................................214 A.3 MySAP PLM ........................................................................................................................................215 A.3.1 Overview..............................................................................................................................................215 A.3.2 Key capabilities of mySAP PLM ..........................................................................................................215 A.3.3 Lifecycle Data Management with mySAP PLM ...................................................................................216 A.3.3.1 Product Structure Management ......................................................................................................217 A.3.3.2 Recipe Management ........................................................................................................................218 A.3.3.3 Change and Configuration Management ........................................................................................218 A.3.3.4 Enterprise Asset Management.........................................................................................................219 A.3.4 Life Cycle Collaboration......................................................................................................................219 A.4 UGS TeamCenter.................................................................................................................................220 A.5 IBM ......................................................................................................................................................222 A.5.1 CATIA V5.............................................................................................................................................222 A.5.2 ENOVIA ...............................................................................................................................................223 A.5.3 Smarteam .............................................................................................................................................224 A.6 HP Information Lifecycle Management (text collected and edited from web pages) ..........................224 A.6.1 Supporting an intelligent, efficient Adaptive Enterprise......................................................................224 A.6.2 ILM solutions from HP ........................................................................................................................225 A.6.3 A view of ILM.......................................................................................................................................225 A.6.4 Continuous availability and continuous protection over the data lifespan..........................................225 A.6.5 Features & benefits..............................................................................................................................226 A.6.6 Lifecycle information ...........................................................................................................................227 B.1 GERAM................................................................................................................................................229 B.1.1 GERA - Generalised Enterprise Reference Architecture.....................................................................230 B.1.2 Human oriented concepts ....................................................................................................................230 B.1.3 Process oriented concepts....................................................................................................................230 B.1.4 Life-cycle and Life-cycle activities.......................................................................................................231 B.1.5 Life history ...........................................................................................................................................232 B.1.6 Entity types in Enterprise Integration..................................................................................................232 B.1.7 Technology oriented concepts..............................................................................................................233

Copyright © PROMISE Consortium 2004-2008 Page 4
@

Copyright © PROMISE Consortium 2004-2008 Page 5
@
PART I: INTRODUCTION

Copyright © PROMISE Consortium 2004-2008 Page 6
@
Copyright © PROMISE Consortium 2004-2008 Page 7
@
1 Purpose of PROMISE generic models A generic PLM model is useful in order to build a foundation for building the specifications for a comprehensive PLM solution. The purpose of such a model is to provide a path to an appropriate framework in which the system architecture and structure can be represented as well as evaluated. Lifecycle models are used to identify improvements based on the alternatives of materials, processing, and design configurations (Tipnis, 1995).
A generic model can be characterised by two properties:
1) They describe a whole class of systems 2) They only describe what is necessary
These two properties describe the purpose of a generic PLM model in PROMISE. The model should be applicable to a number of systems dealing with information flow between different lifecycles of a product. Furthermore, the model should reflect only the necessary attributes of each system without going into details. A great benefit of having a generic model is that they can be used to constrain the design of a given system. It means that they enable to generate the design of a system. In other words: The ideal case is that if once the PROMISE generic PLM model is defined, any system design in the area of “Product lifecycle management and information tracking using smart embedded systems” can de derived out of it. Another benefit of the generic model would be that it can be used for evaluation of systems. Since the model is a bundle of generic statement of principles, an existing system could be evaluated based on the principles. For instance, the performance of an existing commercial PDM system could be evaluated regarding feedback of field data into the design phase. Furthermore, the generic PLM model would contribute to common understanding in terms of speaking the same language. There are many concepts and practices in the field of PLM which lead to misunderstandings. A generic model can eliminate them. Our imagination for the concept of the generic PLM model consists of phase-specific object models. These models describe the information flow between different lifecycles, e.g. design, production, use/maintenance and disposal. The definition of the model should be based on an existing model. These models should be extended by PROMISE specific aspects. The PROMISE generic models enable the development of each of the phases of the generalized product lifecycle; that is, the development of the phases of BOL, MOL, and EOL. Current best practice has tended to treat each of these individual areas in isolation, with the consequent result that solutions have been developed in each area, but without accommodation for the other sectors. Product Lifecycle Management (PLM) attempts to link these best practices together, and to analyze the consequences of one phase upon another, with regard to their information and physical material flows. For the success in PLM, the following should be supported.
(1) Management of whole product lifecycle activities, (2) Management of product related data and resources, (3) Collaboration between customers, partners, and suppliers, and (4) Enterprise’s ability to analyze challenges and bottlenecks, and make decisions on them.
They can be done based on a complete understanding and sharing of PLM concept. For this purpose, the PROMISE generic model is required. In the closed-loop PLM such as PROMISE, the generic model is very important because it is a basic sketch for describing the product
Copyright © PROMISE Consortium 2004-2008 Page 8
@
lifecycle model that is a prerequisite to achieve visibility of the lifecycle information. In addition, the PROMISE generic model is required for the following reasons.
(1) To have consensus among all partners, (2) To disseminate the concept of PROMISE PLM system outside, (3) To have common backgrounds of software among partners,
To facilitate them, in this workpackage, we choose two modelling methods: use case diagram and data flow diagram. The use case diagram is used to capture the functional aspects of a system, in particular the business processes carried out in the system. DFD is also used to describe the data flow between two processes or objects. Use case diagram and DFD are well-known modeling methods in system and software engineering domain. Therefore, generic PLM model made by these modeling methods can give software development common backgrounds. There exists the connectivity between two modeling methods. The results of use case modeling can be used as inputs for data flow diagrams. We can extract suitable entities, procedures, and their relations for describing information flows from use case diagram and use case description. The simplicity of two modeling methods makes them especially suitable for information interchange between people with different backgrounds working for the same project. It will give us having consensus among all partners. Furtheremore, it can allow to disseminate the concept of PROMISE PLM.
Copyright © PROMISE Consortium 2004-2008 Page 9
@
2 Objectives and the process of preparing the deliverable
2.1 Objectives of work-package R2 The objective of this wok-package is to develop the first version of product generic lifecycle and information flow models for PROMISE PLM system.
2.2 Derived objectives of deliverable, DR2.1, based on the task description and identified challenges
Task descriptions in DoW are as follows: 1. TR2.1-Definition of generic product lifecycle models: The goal is to develop generic
product lifecycle models applicable to the investigated application sectors. 2. TR2.2-Definition of generic product information flow models: The goal is to develop
generic product information flow models applicable to the investigated application sectors.
During this work, we could define not only overall lifecycle model but also BOL, MOL, and EOL product lifecycle models. These models will be the basis for the PROMISE system architecture and the development of the required PROMISE tools and software components.
2.3 Overall framework for preparing the deliverable DR2.1 This deliverable has two main parts: One is for the description of generic product lifecycle models. The other is for the description of generic product information flow models. For each part, there are state-of-the art and model descriptions. For the generic product lifecycle model, we use the use case description method. For the generic product information flow model, we use the data flow diagram (DFD). Based on some generic PLM system architecture which is described in DR1.1, we designed the generic models with the following components. For each component, we design overall model, BOL, MOL, and EOL model, respectively. Finally, we propose an integrated model that covers all components over the whole product lifecycle. We will also propose the integrated BOL, MOL, and EOL model, respectively.
1. Integrated model 2. Business model 3. Hardware
A. PEID 4. Software
A. PDKM/Field DB B. Decision making/supporting C. Data transformation D. Middleware E. Embedded software
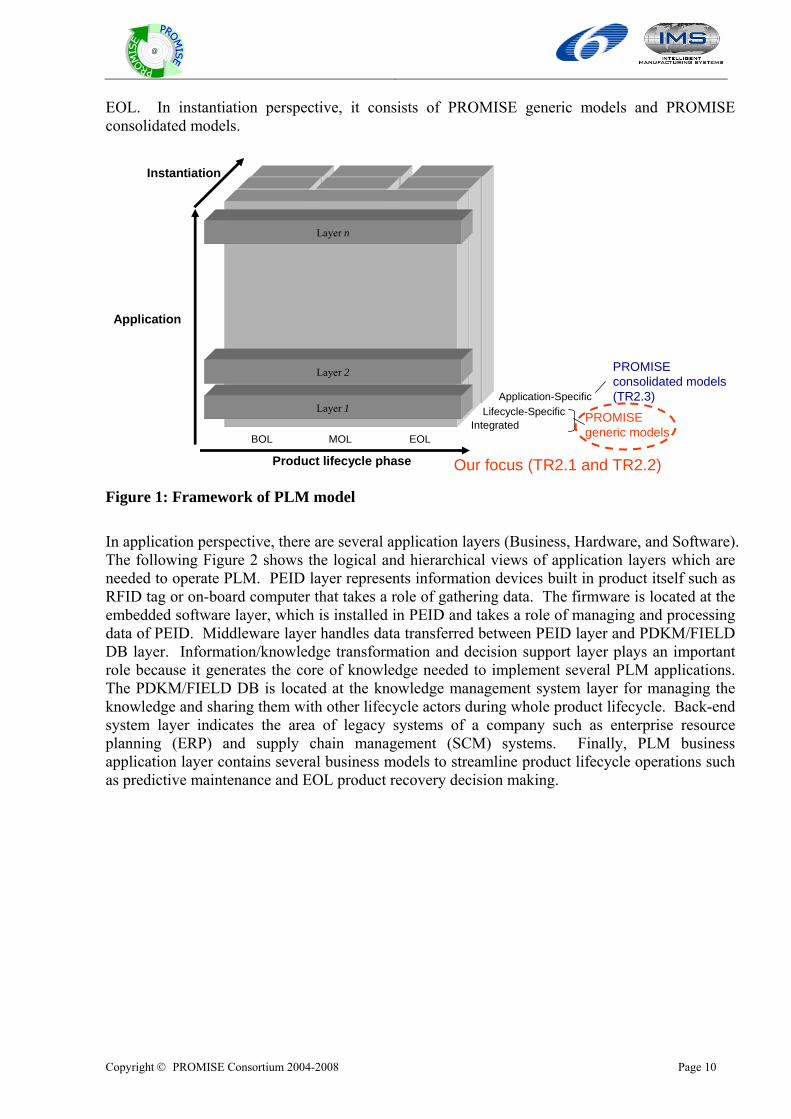
PROMISE PLM model has three perspectives as shown in Figure 1: Application, Instantiation, and product lifecycle perspective. In product lifecycle perspective, it consists of BOL, MOL, and
Copyright © PROMISE Consortium 2004-2008 Page 10
@
EOL. In instantiation perspective, it consists of PROMISE generic models and PROMISE consolidated models.
Product lifecycle phase
Application
Instantiation
BOL MOL EOLIntegrated
Lifecycle-SpecificApplication-Specific
PROMISEgeneric models
PROMISEconsolidated models(TR2.3)
Layer n
Layer 2
Layer 1
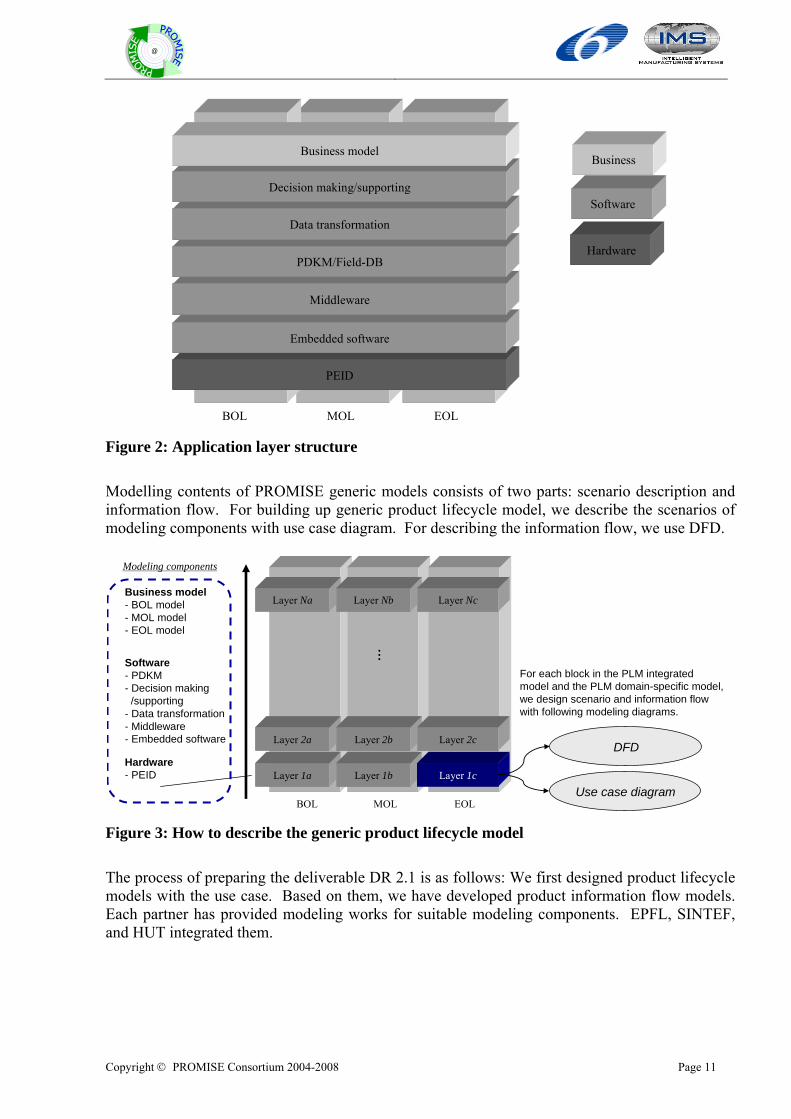
Our focus (TR2.1 and TR2.2) Figure 1: Framework of PLM model In application perspective, there are several application layers (Business, Hardware, and Software). The following Figure 2 shows the logical and hierarchical views of application layers which are needed to operate PLM. PEID layer represents information devices built in product itself such as RFID tag or on-board computer that takes a role of gathering data. The firmware is located at the embedded software layer, which is installed in PEID and takes a role of managing and processing data of PEID. Middleware layer handles data transferred between PEID layer and PDKM/FIELD DB layer. Information/knowledge transformation and decision support layer plays an important role because it generates the core of knowledge needed to implement several PLM applications. The PDKM/FIELD DB is located at the knowledge management system layer for managing the knowledge and sharing them with other lifecycle actors during whole product lifecycle. Back-end system layer indicates the area of legacy systems of a company such as enterprise resource planning (ERP) and supply chain management (SCM) systems. Finally, PLM business application layer contains several business models to streamline product lifecycle operations such as predictive maintenance and EOL product recovery decision making.
Copyright © PROMISE Consortium 2004-2008 Page 11
@
Hardware
PEID
Embedded software
Middleware
PDKM/Field-DB
BOL MOL EOL
Business
Software
Data transformation
Decision making/supporting
Business model
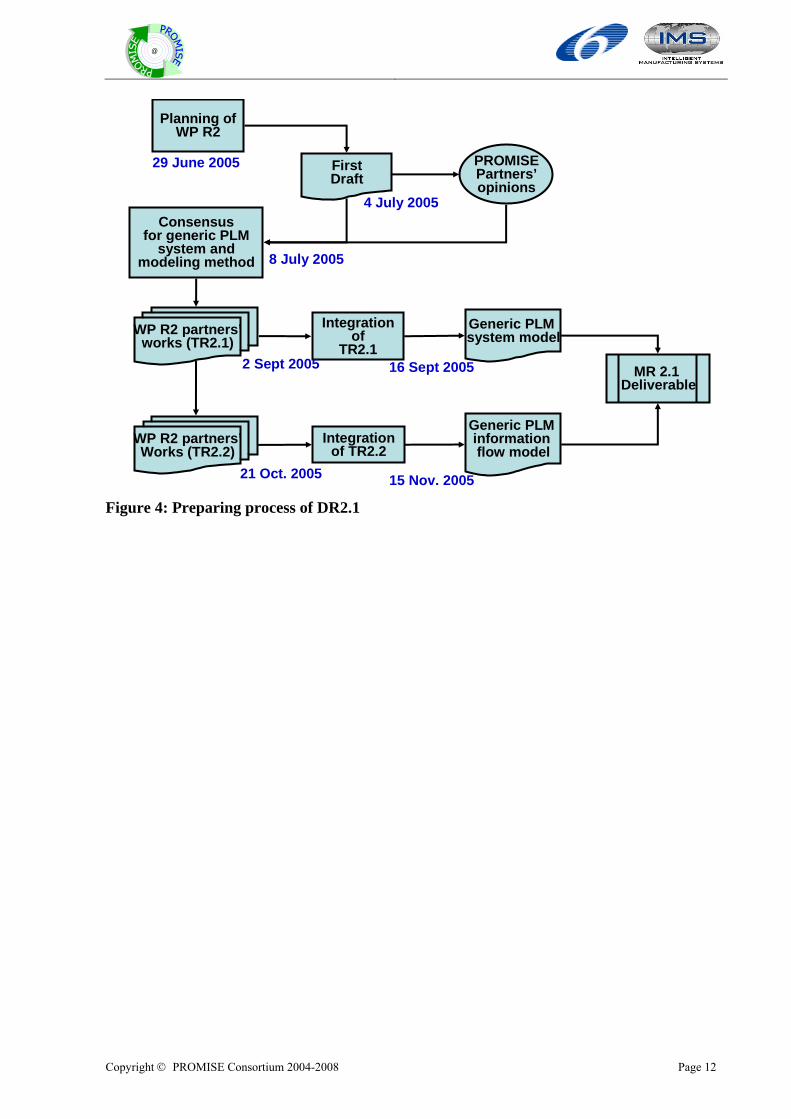
Figure 2: Application layer structure Modelling contents of PROMISE generic models consists of two parts: scenario description and information flow. For building up generic product lifecycle model, we describe the scenarios of modeling components with use case diagram. For describing the information flow, we use DFD.
For each block in the PLM integrated model and the PLM domain-specific model, we design scenario and information flowwith following modeling diagrams.
Use case diagram
Business model- BOL model- MOL model- EOL model
Software- PDKM- Decision making
/supporting- Data transformation- Middleware- Embedded software
Hardware- PEID
DFD
Modeling components
Layer 2a
…
BOL MOL EOL
Layer 2b Layer 2c
Layer Na Layer Nb Layer Nc
Layer 1a Layer 1b Layer 1c
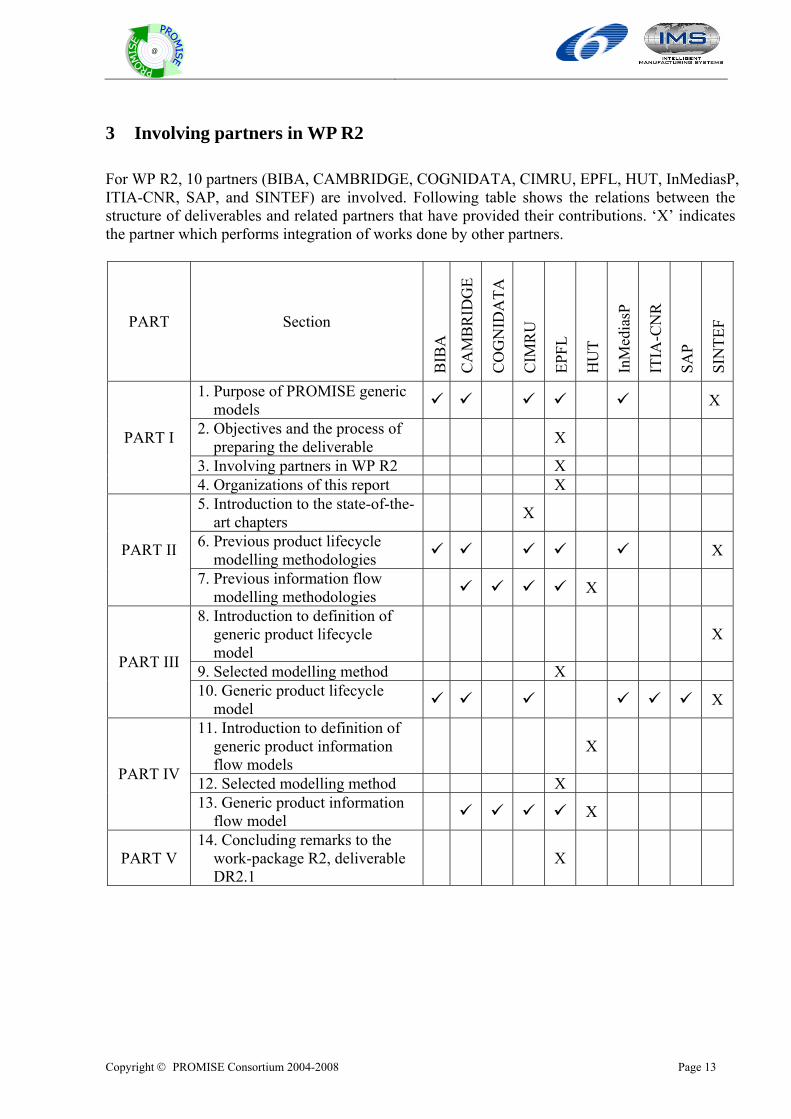
Figure 3: How to describe the generic product lifecycle model The process of preparing the deliverable DR 2.1 is as follows: We first designed product lifecycle models with the use case. Based on them, we have developed product information flow models. Each partner has provided modeling works for suitable modeling components. EPFL, SINTEF, and HUT integrated them.
Copyright © PROMISE Consortium 2004-2008 Page 12
@
Generic PLM system model
Integrationof TR2.2
Generic PLM information flow model
Planning ofWP R2
Consensusfor generic PLM
system and modeling method
Integration of
TR2.1
FirstDraft
WP R2 partners’works (TR2.1)
WP R2 partners’Works (TR2.2)
PROMISEPartners’opinions
MR 2.1 Deliverable
29 June 2005
4 July 2005
8 July 2005
2 Sept 2005 16 Sept 2005
21 Oct. 2005 15 Nov. 2005 Figure 4: Preparing process of DR2.1
Copyright © PROMISE Consortium 2004-2008 Page 13
@
3 Involving partners in WP R2 For WP R2, 10 partners (BIBA, CAMBRIDGE, COGNIDATA, CIMRU, EPFL, HUT, InMediasP, ITIA-CNR, SAP, and SINTEF) are involved. Following table shows the relations between the structure of deliverables and related partners that have provided their contributions. ‘X’ indicates the partner which performs integration of works done by other partners.
PART Section
BIB
A
CA
MB
RID
GE
CO
GN
IDA
TA
CIM
RU
EPFL
HU
T
InM
edia
sP
ITIA
-CN
R
SAP
SIN
TEF
1. Purpose of PROMISE generic models X
2. Objectives and the process of preparing the deliverable X
3. Involving partners in WP R2 X
PART I
4. Organizations of this report X 5. Introduction to the state-of-the-
art chapters X
6. Previous product lifecycle modelling methodologies X PART II
7. Previous information flow modelling methodologies X
8. Introduction to definition of generic product lifecycle model
X
9. Selected modelling method X PART III
10. Generic product lifecycle model X
11. Introduction to definition of generic product information flow models
X
12. Selected modelling method X PART IV
13. Generic product information flow model X
PART V 14. Concluding remarks to the
work-package R2, deliverable DR2.1
X

Copyright © PROMISE Consortium 2004-2008 Page 14
@
Copyright © PROMISE Consortium 2004-2008 Page 15
@
4 Organization of this report This report consists of five parts. The first part defines the purpose of PROMISE generic models and introduces general objectives of the deliverable. Part 2 describes state-of-the-art of product lifecycle model. In this part, previous product lifecycle modelling methodologies have been introduced. Then, part 3 and part 4 define generic product lifecycle model of PROMISE and generic product information flow model for PROMISE. These parts are divided into three sections: definition, selected method, and model. At first, the definition of model and its purpose are explained in the definition section. Then, among various research works the selected modeling methods and their modelling templates to represent PROMISE generic models are described. Using this template generic model of PROMISE are illustrated and described in the last section. At the end, the last Part concludes this deliverable.

Copyright © PROMISE Consortium 2004-2008 Page 16
@

Copyright © PROMISE Consortium 2004-2008 Page 17
@
PART II: STATE-OF-THE-ART

Copyright © PROMISE Consortium 2004-2008 Page 18
@
Copyright © PROMISE Consortium 2004-2008 Page 19
@
5 Introduction to the state-of-the-art chapters
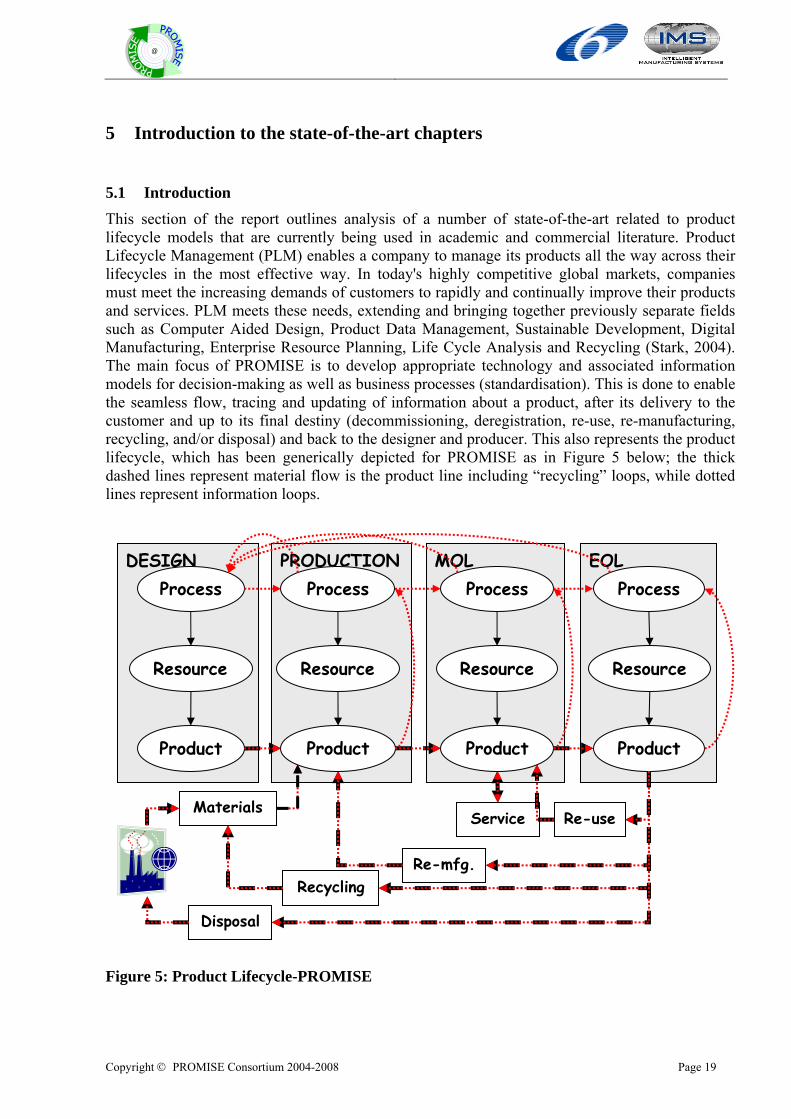
5.1 Introduction This section of the report outlines analysis of a number of state-of-the-art related to product lifecycle models that are currently being used in academic and commercial literature. Product Lifecycle Management (PLM) enables a company to manage its products all the way across their lifecycles in the most effective way. In today's highly competitive global markets, companies must meet the increasing demands of customers to rapidly and continually improve their products and services. PLM meets these needs, extending and bringing together previously separate fields such as Computer Aided Design, Product Data Management, Sustainable Development, Digital Manufacturing, Enterprise Resource Planning, Life Cycle Analysis and Recycling (Stark, 2004). The main focus of PROMISE is to develop appropriate technology and associated information models for decision-making as well as business processes (standardisation). This is done to enable the seamless flow, tracing and updating of information about a product, after its delivery to the customer and up to its final destiny (decommissioning, deregistration, re-use, re-manufacturing, recycling, and/or disposal) and back to the designer and producer. This also represents the product lifecycle, which has been generically depicted for PROMISE as in Figure 5 below; the thick dashed lines represent material flow is the product line including “recycling” loops, while dotted lines represent information loops.
Figure 5: Product Lifecycle-PROMISE
MOL Process
Resource
Product
DESIGN Process
Resource
Product
PRODUCTION Process
Resource
Product
EOL Process
Resource
Product
Materials
Disposal
Recycling Re-mfg.
Service Re-use
Copyright © PROMISE Consortium 2004-2008 Page 20
@
This PROMISE product lifecycle model, however, represents only the pictorial nature of PROMISE in a highly generic manner; the research carried out here is required to expand upon this model further. The dream of Product Lifecycle Management (PLM) is to seamlessly integrate and make available all of the information produced throughout all phases of a product's life cycle to everyone in an organization, along with key suppliers and customers (Sudarasan et al. 2005). To enable this dream, the integration and development of currently fragmented information, both internally and external to the organisation, must be undertaken in order that a consistent and coherent PLM model may be developed and successfully utilised; issues such as establishing data standards and designing corporation-wide integration architectures need to be addressed so that formerly fragmented information can be served up to individuals in a format they can use. Currently, “pockets of automation” exists (Iyer et al. 2005): that is, rapid developments in isolated areas has resulted in the maturing of locations of excellence that are not currently compatible with each other, but is now being tackled by PLM. Iyer et al. (2005), for example, specify the area of design: “Traditional Computer Aided Design (CAD) software has undergone rapid transformation and has evolved into an industry commodity. Technological progress enabled CAD software to incorporate engineering know-how into the design process and develop Product Data Management (PDM) systems. CAD models were further integrated forward in the design cycle into analysis and manufacturing to develop Computer Aided Engineering (CAE) tools. Rapid development in each of these areas resulted in a lot of ‘pockets’ of automation. Currently, all of these ‘pockets’ are being integrated by Product Lifecycle Management (PLM) systems thereby producing a completely digital design through manufacturing solution” (Iyer et al. 2005). In the PROMISE model, it is clear that “pockets of excellence” exist at each of the three phases BOL, MOL, and EOL; and that these are currently only partially integrated, whilst other areas aren’t integrated at all. The key is to examine previous initiatives and other state-of-the art entities to determine methodologies to link these three phases together, in order to provide more detailed product lifecycle maps for the successful development of PROMISE objectives. The following section follows this approach by outlining other product lifecycle models and management solutions that have been adopted in the literature and by well-known vendors. An analysis of these approaches enables a considered examination of the generic PROMISE product lifecycle (Figure 5), and allows for the specification and development of more precise and detailed maps of material and information flows in BOL, MOL, and EOL.
Copyright © PROMISE Consortium 2004-2008 Page 21
@
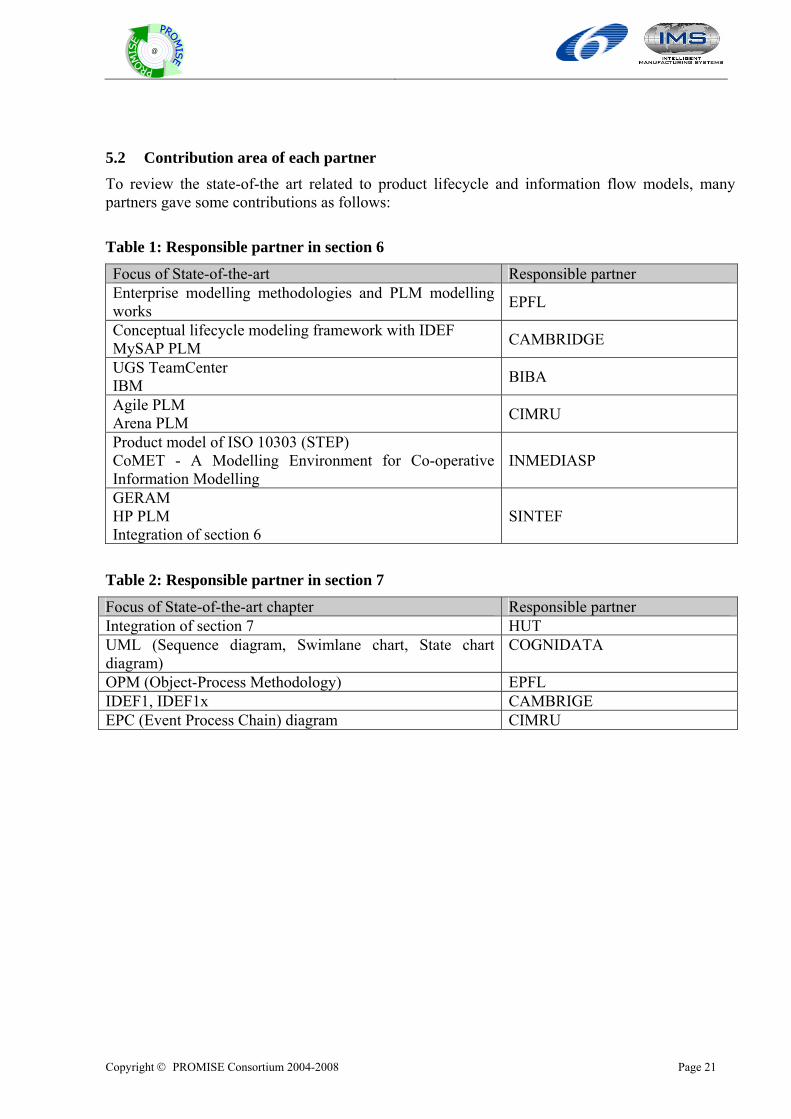
5.2 Contribution area of each partner To review the state-of-the art related to product lifecycle and information flow models, many partners gave some contributions as follows:
Table 1: Responsible partner in section 6
Focus of State-of-the-art Responsible partner Enterprise modelling methodologies and PLM modelling works EPFL
Conceptual lifecycle modeling framework with IDEF MySAP PLM CAMBRIDGE
UGS TeamCenter IBM BIBA
Agile PLM Arena PLM CIMRU
Product model of ISO 10303 (STEP) CoMET - A Modelling Environment for Co-operative Information Modelling
INMEDIASP
GERAM HP PLM Integration of section 6
SINTEF
Table 2: Responsible partner in section 7
Focus of State-of-the-art chapter Responsible partner Integration of section 7 HUT UML (Sequence diagram, Swimlane chart, State chart diagram)
COGNIDATA
OPM (Object-Process Methodology) EPFL IDEF1, IDEF1x CAMBRIGE EPC (Event Process Chain) diagram CIMRU

Copyright © PROMISE Consortium 2004-2008 Page 22
@
Copyright © PROMISE Consortium 2004-2008 Page 23
@
6 Product lifecycle modelling methodologies There have been many modelling works that can be classified into two categories: enterprise modelling methods and PLM related modelling, as shown in Table 3.
Table 3: Modelling methods
Classification Previous research
Enterprise modeling
• IDEF (Integrated computer aided manufacturing DEFinitions methodology) (Mayer 1994)
• IEM (Integrated Enterprise Modeling) (Vernadat 1996),
• PERA (Purdue Enterprise Reference Architecture) (Vernadat 1996),
• CIMOSA (Open System Architecture for CIM) (Bruno and Agarwal 1997),
• ARIS (Architecture for integrated Information System) (Scheer 1998a, 1998b),
• GERAM (Generalized Enterprise Reference Architecture and Methodology) (Vernadat 1996)
• UEML (Unified Enterprise Modeling Language) (Vernadat 2002)
PLM Related
modeling
• High-level PLM definition (CIMdata 2002)
• New business model in virtual enterprise (PLM) (Ming and Lu 2003)
• IBM Research project (Morris et al. 2004)
• Conceptual lifecycle modeling framework with IDEF (Tipnis 1995)
• Product model of ISO 10303 (STEP)
More details for each one at the above identified methods are gvien below:
6.1 Enterprise modelling methodologies
6.1.1 IDEF IDEF was developed as part of the US Air Force ICAM (Integrated Computer Aided Manufacturing) program in the early 1980s. It was an attempt to extend the SADT method to model CIM enterprises. Since then, it has become the most well-known and widely used method worldwide for enterprise modeling because of its simplicity (Vernadat 1996). IDEF methodology consists of several modeling methods as follows: ① IDEFø Function Modeling Method ② IDEF1 Information Modeling Method ③ IDEF1X Data Modeling Method ④ IDEF3 Process Description Capture Method
Copyright © PROMISE Consortium 2004-2008 Page 24
@
⑤ IDEF4 Object-Orient Design Method ⑥ IDEF5 Ontology Description Capture Method ⑦ IDEF9 Business Constraint Discovery Capture Method
6.1.2 Integrated Enterprise Modeling (IEM) Integrated Enterprise Modeling (IEM) approach is being developed by the Fraunhofer Institute in Berlin. It is based on SADT/IDEF0 from which it borrows the activity box concept. It strongly promotes an object-oriented approach for the definition of the input, control, output, and mechanism (ICOM), and interface of the activity box. It can be applied to system requirements definition and design specification but does not provide an implementation description model (Vernadat 2002).
6.1.3 CIMOSA CIMOSA, European Open Systems Architecture for CIM, has been developed by the AMICE Consortium as a series of ESPRIT Projects jointly financed by the European Commission and project partners grouping CIM suppliers, larger users, and academia from 1986 until 1994. The CIMOSA provides a framework based on the system life cycle concept together with a modeling language and definitions of a methodology and supporting technology. The CIMOSA provides a rich set of constructs to model functional aspects of an enterprise at different level.
6.1.4 Purdue Enterprise Reference Architecture (PERA) Purdue Enterprise Reference Architecture (PERA) was developed by Purdue University. It is first of all a complete methodology. It is supported by very simple graphical formalisms and easy-to-understand textual manuals. It has been created to cover the full enterprise life cycle from inception and mission definition down to its operational level and final plant obsolescence (Vernadat 1996).
6.1.5 ARIS ARIS stands for Architecture for integrated Information Systems, which was developed by Prof. Scheer. Its overall structure is very similar to CIMOSA, but instead of focusing on computer-integrated manufacturing systems, it deals with more traditional business-oriented issues of enterprises. It focuses on software engineering and organizational aspects of integrated enterprise system design. It has four views and three modelling levels. The three modelling levels are those of CIMOSA. The four views are as follows: function view, data view, organization view, and control view (Vernadat 1996).
6.1.6 GERAM GERAM, a ‘Framework for Enterprise Engineering and Enterprise Integration’ is developed by “Generalised Enterprise Reference Architecture” group and the IFAC/IFIP Task. This work started in 1990 and became an ISO standard, ISO 15704 in 2000. GERAM is built on the methods for enterprise modelling developed in CIMOSA, GRAI (GRAI Laboratory) and PERA (Purdue University) methodologies. But there have also been many other contributors to the standard.
GERAM is not a method; it defines a tool-kit of concepts for designing and maintaining enterprises during their entire life. GERAM is meant to organise existing enterprise integration knowledge. GERAM provides a description of all the elements recommended in enterprise engineering and enterprise integration. It does not impose any particular set of tools or methods but defines the criteria to be met. For more detail, please refer to Appendix B.
Copyright © PROMISE Consortium 2004-2008 Page 25
@
6.1.7 UEML Unified Enterprise Modelling Language is Semantic Network Project IST–2001–34229 finance by European Union (EU), started on March 1st 2002. UEML aim is to create working group that will involve in 6 Frame Program to develop core UEML.UEML provides a common language suitable for enterprise-modelling needs that could be accepted technically and politically as a universal end-user language. Therefore UEML could provide business users with a standard user interface on most of the tools for enterprise modelling, analysis, and simulation. Another goal of UEML is to provide a neutral language for universal model exchange among these tools as well as among business users
6.2 PLM related modelling works
6.2.1 High-level PLM definition CIMdata (2002) addressed a high-level PLM definition, describing its core components, and clarifying what is and is not included in a PLM business approach. CIMdata mentioned three core concepts of PLM: 1) Universal, secure, managed access and use of product definition information; 2) Maintaining the integrity of that product definition and related information throughout the life of the product or plant; 3) Managing and maintaining business processes used to create, manage, disseminate, share and use the information.
6.2.2 New business model in virtual enterprise Ming and Lu (2003) proposed the new business model in virtual enterprise in order to tackle issues of product development in the scope of PLM. The architecture of this new model is developed based on the framework and the application of web service and process management for collaboration product service in virtual enterprise. They proposed the framework of product lifecycle process management for collaborative product services. The framework consists of industry specific product lifecycle process template, product lifecycle process application, abstract process lifecycle management, supporting process technology, supporting standards, and enabling infrastructure.
6.2.3 IBM research project Morris et al. (2004) described, in detail, a case study and solution of an IBM research project (called Hedwig) to investigate creating robust solutions for PLM. They focused on several research issues, including information federation, data mapping, synchronization, and web services connections. They described a working system that allows access to several heterogeneous PDM systems that are used in the automotive and aerospace industries.
6.2.4 Conceptual lifecycle modeling framework with IDEF (Tipnis 1995) Tipnis (1995) proposes a framework for modelling a product lifecycle that uses Activity Modelling methodology. The objective of the model that is developed here is to investigate and quantify the environmental, economic and social “effects” of a product from its conception, production through to usage, maintenance, and disposal. Traditionally, product lifecycle models consisted of three separate, but interconnected models.
(a) Product & Process models. This model represents the energy and material transformation in a product and associated processes as the product is manufactured (a series of steps where raw material is transformed into finished end product), usage (where the product performance gradually degrades due to wear and part failures), and consequently disposed.
(b) Systems models. Here, everything that is composed of two or more indivisible components depending in the level of abstraction and point of view of the observer is considered a
Copyright © PROMISE Consortium 2004-2008 Page 26
@
system. The task of lifecycle modelling is to construct an appropriate framework in which the system architecture (hierarchy) and structure (connections) can be first represented and then evaluated consistently and rigorously.
(c) Physical models. Physical models are mathematical representation of the physical processes within processing units that perform material and/or energy transformation.
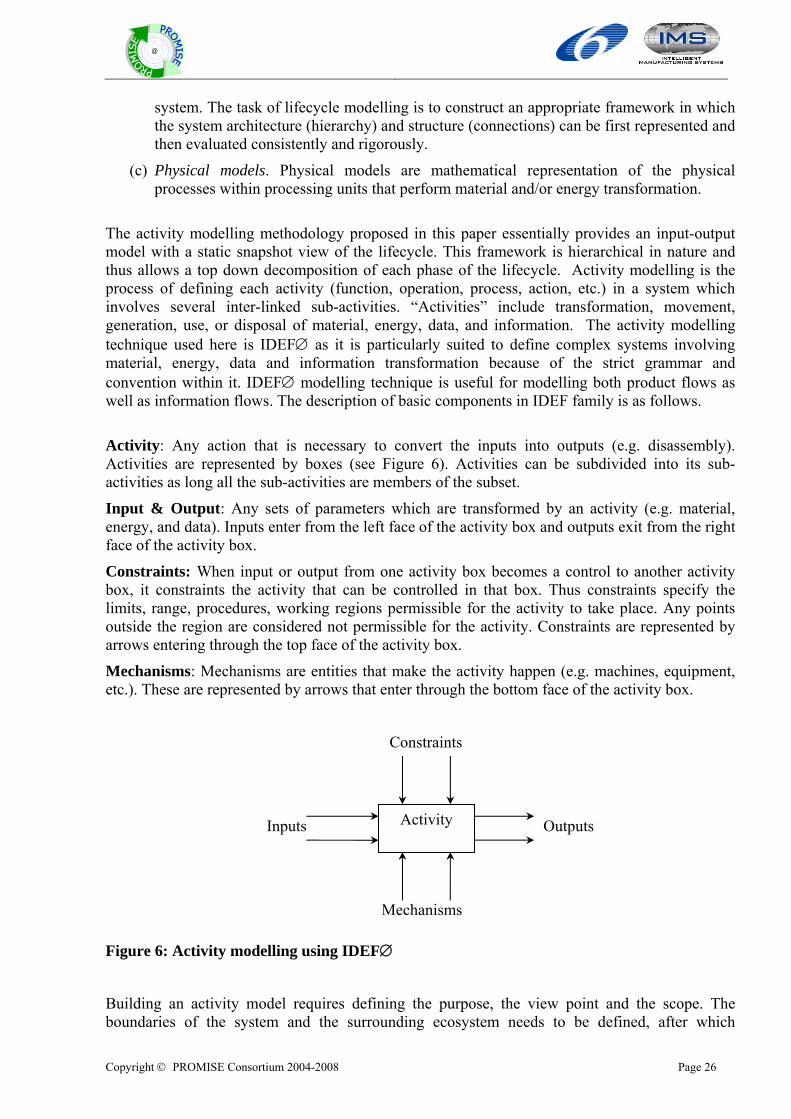
The activity modelling methodology proposed in this paper essentially provides an input-output model with a static snapshot view of the lifecycle. This framework is hierarchical in nature and thus allows a top down decomposition of each phase of the lifecycle. Activity modelling is the process of defining each activity (function, operation, process, action, etc.) in a system which involves several inter-linked sub-activities. “Activities” include transformation, movement, generation, use, or disposal of material, energy, data, and information. The activity modelling technique used here is IDEF∅ as it is particularly suited to define complex systems involving material, energy, data and information transformation because of the strict grammar and convention within it. IDEF∅ modelling technique is useful for modelling both product flows as well as information flows. The description of basic components in IDEF family is as follows. Activity: Any action that is necessary to convert the inputs into outputs (e.g. disassembly). Activities are represented by boxes (see Figure 6). Activities can be subdivided into its sub-activities as long all the sub-activities are members of the subset.
Input & Output: Any sets of parameters which are transformed by an activity (e.g. material, energy, and data). Inputs enter from the left face of the activity box and outputs exit from the right face of the activity box.
Constraints: When input or output from one activity box becomes a control to another activity box, it constraints the activity that can be controlled in that box. Thus constraints specify the limits, range, procedures, working regions permissible for the activity to take place. Any points outside the region are considered not permissible for the activity. Constraints are represented by arrows entering through the top face of the activity box.
Mechanisms: Mechanisms are entities that make the activity happen (e.g. machines, equipment, etc.). These are represented by arrows that enter through the bottom face of the activity box.
Figure 6: Activity modelling using IDEF∅
Building an activity model requires defining the purpose, the view point and the scope. The boundaries of the system and the surrounding ecosystem needs to be defined, after which
Activity Inputs Outputs
Constraints
Mechanisms
Copyright © PROMISE Consortium 2004-2008 Page 27
@
activities have to be modelled in a top-down fashion starting from the highest level activity and breaking down that activity into sub-activities and sub-systems.
Activity model is best built for a specific system; generic models can then be formed from a few specific cases, if necessary. Specific data would then be needed for validating the model.
The capability of activity-modeling technique to represent all sorts of activities: material, energy, data, manual, and automated transportations, storage, transformations, etc. make it a viable candidate for an umbrella under which comparative, dynamic, simulation, and other physical models can be defined. Ease of use and availability of graphics software makes these models readily integrable and upgraded.
6.2.5 Product model of ISO 10303 (STEP) The STEP (ISO 10303) Product Data Representation and Exchange standardization initiative covers computer-interpretable representation of product data, and its exchange. The objective of ISO 10303 is to provide a means of describing product data throughout the life cycle of a product that is independent from any particular computer system. The nature of this description makes it suitable not only for neutral file exchange, but also as a basis for implementing product databases and for archiving data. In practice, the standard is implemented within computer software associated with particular engineering applications and so its use and function will be transparent to a user. The descriptions are information models that capture the semantics of an industrial requirement and provide standardized structures within which data values can be understood by a computer implementation. STEP is a synonym for all of the aspects of the international project that is developing the technology of product data representation, the methodology for creating the standards for information models and the standards themselves. Some authors use STEP as an acronym for STandard for the Exchange of Product data but the purpose of the standard is to provide information models for the representation of product data. The exchange of data is one of the uses for a standardized representation, but it is not the only use. ISO 10303 is a collection of inter-related documents which form a multi-part standard. The parts are grouped into the following sections:
• Description methods (Parts 1-19) • Implementation methods (Parts 20-29) • Conformance testing methodology and framework (Parts 30 -39) • Integrated generic resources (Parts 40-49) • Integrated application resources (Parts 100 - 199) • Application protocols (Parts 200 - 299) • Abstract test suites (Parts 300 - 399) • Application interpreted constructs (Parts 500 - 599) • Application Modules (Parts 1000 - )
The description methods provide the specifications of the languages that are used for creating the standards. Implementation methods support the development of software implementations of the standards. Conformance testing methodology and framework documents specify how an implementation of ISO 10303 should be tested for conformance to the Standard. Integrated generic resources, as a group, provide a single information model for a manufactured product. Integrated application resources are specializations of the Integrated Generic Resources for some general engineering requirements. Application Protocols specify the requirements for data for a specific engineering application in a standardized representation derived from the Integrated Generic Resources. Application Protocols are implemented for use with the relevant engineering application software. Abstract Test Suites describe the tests to be used to determine if an implementation conforms to the related Application Protocol. Each Application Protocol has an
Copyright © PROMISE Consortium 2004-2008 Page 28
@
associated Abstract Test Suite with the number 3xx, where xx represents the second and third digits in the number of the Application Protocol. For example, ISO 10303-207 has an associated Abstract Test Suite with the number ISO 10303-307. Application Interpreted Constructs (AIC) are sections of data models that describe concepts that are common to more than one Application Protocol. These parts are therefore intended for use by developers of new data models for the ISO 10303. Application Modules are small information models that are intended to be reusable in the development of future Application Protocols (AP). These parts are therefore intended only for use by developers of data models. The first Application Modules are representations of some aspects of CAD model data.
6.2.5.1 Geometry Data Exchange The part of STEP that is currently most widely used is one of the initial application protocols, ISO 10303-0203, usually known as AP203 (‘Configuration-controlled design of mechanical parts and assemblies’). This is concerned with the transfer of product shape models, assembly structure, and configuration control information (e.g., part versioning, release status, authorisation data etc.)
6.2.5.2 Product Lifecycle Management in ISO 10303 Until recently STEP has had its main focus on the design part of a product's life cycle. With the approval of PLCS (Product Life Cycle Support), STEP is now broadening its scope significantly, to cover the In-Life/After Market/Product Support part of the life cycle and also Requirements. The resulting document is called AP239. What is PLCS?
• PLCS is a joint industry and government initiative to accelerate development of new standards for product support information
• PLCS is an international project to produce an improved ISO standard within 4 years; commenced November 1999
• PLCS will ensure support information is aligned to the evolving product definition over the entire life cycle
• PLCS extends ISO 10303 STEP The intention of AP239 is to provide a comprehensive capability for representing information about a set of products that need to be supported, together with the work required to sustain those products in an operational condition. The products concerned may evolve over their entire life cycle, from concept to disposal. The initial version of the standard handles certain core life cycle activities, including the following:
• work done and resources used • product usage • product location, states and properties • resource location, states and properties
The business context for AP239 is the need to represent and propagate the data needed to maintain a complex evolving product over an in-service lifetime that may be measured in decades. The AP is most suitable for use with complex products having long lives and demanding support environments, although it could also be used with simpler products. Many types of data are needed, including product documentation, maintenance schedules, tools, test equipment, support facilities, storage requirements, training, software, spare parts, consumables and transportation. Perhaps one of the most important requirements is the need to capture feedback from operational use (for example, concerning faults, failure modes and diagnostic data) so that it may be acted on
Copyright © PROMISE Consortium 2004-2008 Page 29
@
in making the product more effective. The aim is interoperability across enterprises and systems through the use of
• standardised semantics for product support • an integrated suite of data models for data exchange or information sharing • utilisation of STEP standard resources and methodology plus XML/XSTL.
AP239 is intended to capture all aspects of the product life cycle, and is oriented for the exchange of information via the internet. In common with all STEP APs it distinguishes between the semantics of the data and its manner of representation. Information need only be acquired once in the product life cycle, but may be used many times. Some of the key areas addressed by AP239 are
• Product Description: the definition of product requirements and configurations, including relationships between parts and assemblies, in multiple evolving product structures (as-designed, as-built and as-maintained)
• Work Management: the request, definition, justification, approval, scheduling and feedback capture for product life cycle activities and their related resources
• Property, State and Behaviour: the representation of feedback on product properties, operating states, behaviour and usage
• Support Solution and Environment: the definition of the support required for a given set of products in a specified environment, and of support opportunity, facilities, personnel and organisations
• Risk assessment and risk management: the representation of risk related data associated with the product life cycle.
6.3 Reviews of commercial PLM systems
The reviews of commercial PLM systems are described in Appendix A.

Copyright © PROMISE Consortium 2004-2008 Page 30
@
Copyright © PROMISE Consortium 2004-2008 Page 31
@
7 Previous information flow modelling methodologies Information flow models are used to describe what information is exchanged between what entities without taking into consideration how it is done. This signifies that information flow diagrams do not define a control structure that would define e.g. the order in which operations are performed nor what information exchange protocol is being used. Instead, information flow models characterize how information flows throughout an application by describing the kinds of processing that take place and how data flows between these stages. This model is valuable because it provides a basis for distinguishing between data dependencies, control dependencies and artificially imposed implementation dependencies. In an information flow model, each processing stage is described as one of the following stage classes (Loshin, 2003).
1. Data Supply - where data suppliers forward information into the system.
2. Data Acquisition - the stage that accepts data from external suppliers and injects it into the system.
3. Data Creation - internal to the system, data may be generated and then forwarded to another processing stage.
4. Data Processing - any stage that accepts input and generates output (as well as generating side effects).
5. Data Packaging - any point at which information is collated aggregated and summarized for reporting purposes.
6. Decision Making - the point where human interaction is required.
7. Decision Implementation - the stage where the decision made at a decision-making stage is executed, which may affect other processing stages or a data delivery stage.
8. Data Delivery - the point where packaged information is delivered to a known data consumer.
9. Data Consumption - as the data consumer is the ultimate user of processed information, the consumption stage is the exit stage of the system.
Data moves between stages through directed information channels - pipelines indicating the flow of information from one processing stage to another and the direction in which data flows. An information flow model is represented by the combination of the processing stages connected by directed information channels. Once the flow model has been constructed, names are assigned to each of the stages and channels. In practice, many different kinds of information flow models exist. In this section we will give an overview of some of the most significant ones, i.e. UML- and IDEF-based models as well as Event Process Chain (EPC) diagrams.
7.1 UML
7.1.1 Sequence diagrams Sequence diagrams describe inter-object behaviour, i.e. the way how single objects interact through message passing in order to fulfill a task. They are also called interaction diagrams.
Copyright © PROMISE Consortium 2004-2008 Page 32
@
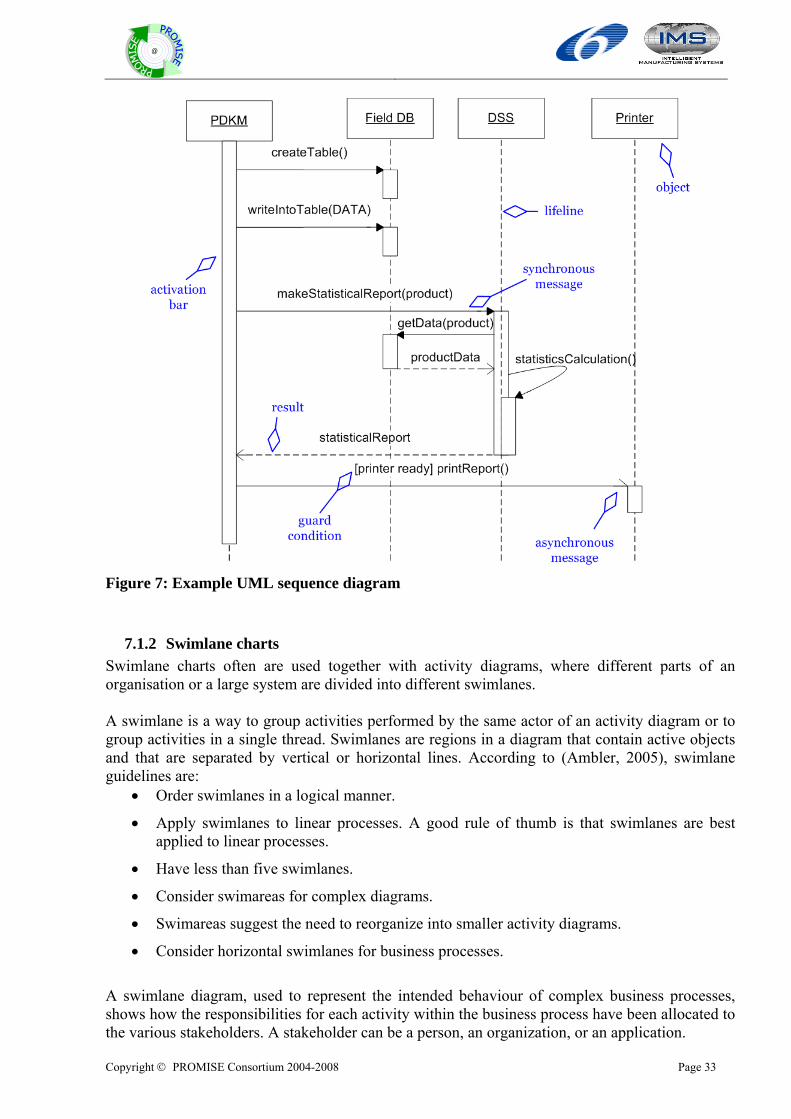
• A sequence diagram is mainly used for modelling a scenario, so that the flow of a use case or an operation is shown. It is possible to extend them to describe entire algorithms (there are symbols for distinguishing between cases and repetition), but diagrams often lose their clarity if used in that way.
• The vertical dimension of a sequence diagram represents the time line, the horizontal dimension the objects participating in a scenario. They are shown as dotted lifelines that start with an object symbol.
• Activation bars are marking areas where an object takes over the control and one of its operations is carried out.
• Active objects have an activation bar and an object symbol with bold margins.
• Messages between the objects are shown as arrows between the lifelines. These arrows are labelled with names and arguments of the message. Different arrowheads stand for synchronous (function calls) and asynchronous (signal) messages. A dotted line arrow visualizes the return of values. Messages that create an object are pointing directly to its symbol. If an object is deleted, its lifeline ends with an X.
• A guard condition shows up when a message is sent. The “guarded” message is sent only if the condition in angular brackets is true. In order to note repetitions, the messages that shall be repeated are framed in a rectangle. Above the rectangle’s margin there is a note about the repetition.
The following figure is an example for a sequence diagram. The diamond symbol does not belong to the diagram and are for explanation purposes only.
Copyright © PROMISE Consortium 2004-2008 Page 33
@
Figure 7: Example UML sequence diagram
7.1.2 Swimlane charts Swimlane charts often are used together with activity diagrams, where different parts of an organisation or a large system are divided into different swimlanes. A swimlane is a way to group activities performed by the same actor of an activity diagram or to group activities in a single thread. Swimlanes are regions in a diagram that contain active objects and that are separated by vertical or horizontal lines. According to (Ambler, 2005), swimlane guidelines are:
• Order swimlanes in a logical manner.
• Apply swimlanes to linear processes. A good rule of thumb is that swimlanes are best applied to linear processes.
• Have less than five swimlanes.
• Consider swimareas for complex diagrams.
• Swimareas suggest the need to reorganize into smaller activity diagrams.
• Consider horizontal swimlanes for business processes.
A swimlane diagram, used to represent the intended behaviour of complex business processes, shows how the responsibilities for each activity within the business process have been allocated to the various stakeholders. A stakeholder can be a person, an organization, or an application.
Copyright © PROMISE Consortium 2004-2008 Page 34
@
One of the primary benefits of a swimlane analysis is that it forces the modellers to use a deeper level of detail in which they must explicitly state the expected behaviour; it can be used to expose and discuss the business rules driving the process. Every time control passes from one stakeholder to the next, it is necessary to ask why this transfer of responsibility is required. Business rules lurk behind every decision point, and each decision needs to be analyzed to understand its business significance and the rationale behind the various actions it controls. The swimlane approach can be valuable in exposing business rules that can be modified or eliminated because they are no longer essential to the reengineered business process. In addition, new business rules may be introduced to ensure that the desired behaviour occurs.
7.1.3 State chart diagrams State chart diagrams describe intra-object behaviour, i.e. the possible consequences of states that an object of a class can go through
• during its life, from its creation till its destruction, or
• during the execution of an operation.
State chart diagrams are based on general finite automatons. • A state chart diagram is a graph whose nodes are corresponding to the states that the
objects can go through; the directed edges are the possible state transitions. Generally, state transitions are started by events.
• A state represents a situation in which the modelled object reacts in a specific way on particular external events. Objects are staying in a state until an event triggers off a state transition. A state symbol (rectangle with rounded corners) can be divided into two parts. A state can have its name in the upper part (principally unlabeled states are different). The lower part can hold information about activities and inner transitions.
States can belong to continuing activities. • Activities are executed as long as the object is in the state linked with that activity. An
activity is shown up with prefix “do/” within the state symbol.
Transitions can be associated with actions. • Actions are atomic activities that are executed within a state transition and theoretically do
not take any time.
• A transition is triggered by an event and does not take any time. A transition is modelled by a labelled arrow which connects a state with its following state. The label holds following information:
o The triggering event that can be specified by arguments. As soon as the event occurs and the appropriate condition is true, the transition takes place. An enduring activity of the state is disrupted. If the event has no label, then the transition takes place when the activity is finished. If an event occurs that has no transition, the event is ignored and it is lost.
o An optional guard condition that monitors the transition. If an event occurs and the condition is not true, then the transition does not take place. The event is lost.
o Actions that are executed during transition. A special case is sending of a message; if has its own syntax. If several actions are specified, they are executed in listed order.
• Internal transitions are also triggered by events, but they do not leave their actual state. Their specification stands at the lower part of a state symbol in form of event/action.
Copyright © PROMISE Consortium 2004-2008 Page 35
@
Instead of real events it is also possible that there are the two pseudo-events entry and exit. Their actions are executed, when the object is entering or leaving the state.
UML distinguishes between the following kinds of events: • SignalEvent: A signal is received by another event. The name of the event specifies the
signal.
• CallEvent: A message is received in sense of a function call. The notation is the same as for SignalEvent, the name of the event specifies the operation.
• ChangeEvent: A special condition becomes true. Such an event has the form when(logical expression), it occurs when the logical expression turns from false to true. That event can occur another time, if beforehand the logical expression changed to false.
• TimeEvent: A given time span passed since a special event. Format: after(constant time span, optional referred event). If a referred event is missing, the time span refers to the moment when the actual state was entered.
• Pseudo-states are technical helping states:
o The initial state marks the beginning of a state chart diagram and does not have any incoming transitions. The only leaving transition is triggered directly when the system reaches the initial state.
o History states are used as jump-back addresses in OR-refined states (see below)
o In order to build complex transitions from several single segment-transitions, there are static brunch points, dynamic decision points and synchronization bars. Static branch and dynamic decision points are used in sequential systems, synchronization bars at transitions from sequential to parallel systems (at a fork, respectively join).
o Synch-states manage the synchronization of transitions in a AND-refined state (see below)
• Final state marks the end of the process. It has no outgoing transitions and it corresponds to the destruction point of the object.
In UML there are two kinds of refinement of state chart diagrams, AND-refinement and OR-refinement.
• OR-refinement divides a complex state (composite state, super-state) into sub-states, so that the object is always in exactly one of the sub-states when it reaches the composite state (mutually exclusive disjoint sub-states). There are two variants of it:
o A separated state chart diagram that refines the composite state. Inside of the composite state symbol stands include/ followed by the name of the refinement.
o The refinement is given directly inside of the enlarged super-state symbol.
• AND-refinement means that the state is taken apart to parallel, simultaneously active sub-states (concurrent sub-states). The AND-refinement is shown inside an own region of the state symbol that is separated with dotted lines in horizontal concurrent regions. Each region represents the concurrent sub-state that generally holds a OR-refinement of the sub-state. Transitions in different sub-states are independent.
• An AND-refinement of a state is exited by two mechanisms:
o When each concurrent sub-state is ready to exit the composite state, i.e. in all sub-states the final state is reached, then the composite state is exited over the one and only existing unmarked transition.
Copyright © PROMISE Consortium 2004-2008 Page 36
@
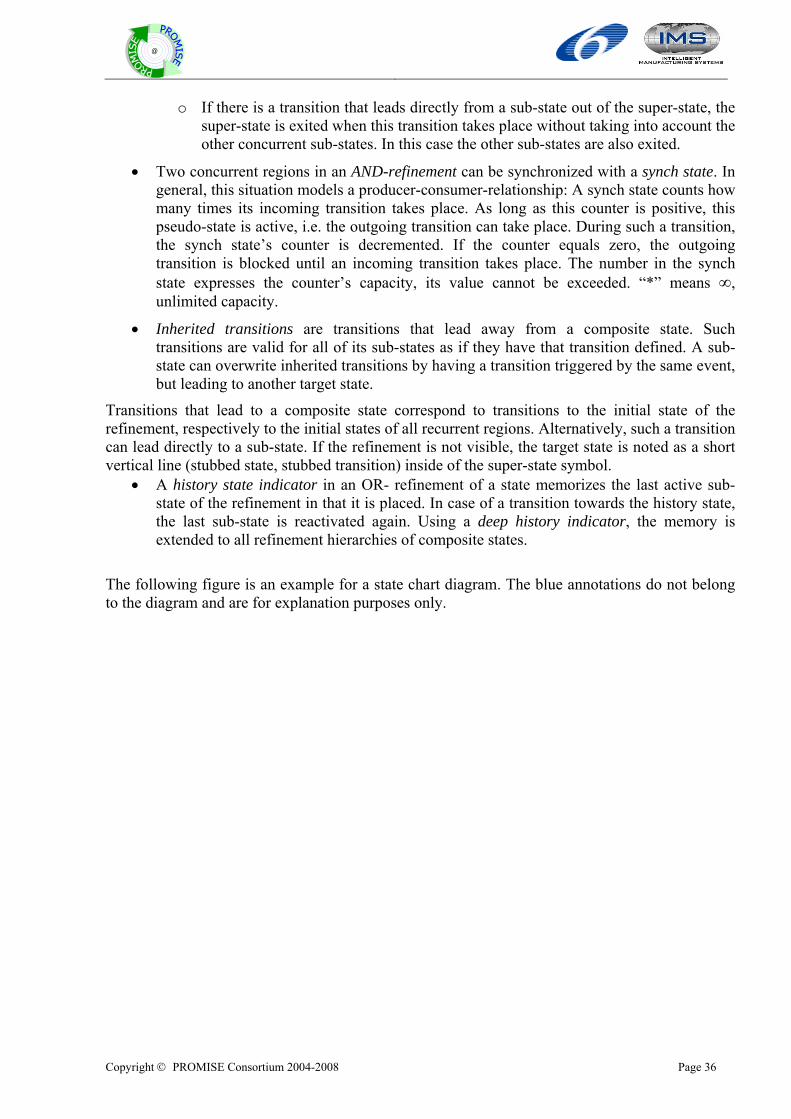
o If there is a transition that leads directly from a sub-state out of the super-state, the super-state is exited when this transition takes place without taking into account the other concurrent sub-states. In this case the other sub-states are also exited.
• Two concurrent regions in an AND-refinement can be synchronized with a synch state. In general, this situation models a producer-consumer-relationship: A synch state counts how many times its incoming transition takes place. As long as this counter is positive, this pseudo-state is active, i.e. the outgoing transition can take place. During such a transition, the synch state’s counter is decremented. If the counter equals zero, the outgoing transition is blocked until an incoming transition takes place. The number in the synch state expresses the counter’s capacity, its value cannot be exceeded. “*” means ∞, unlimited capacity.
• Inherited transitions are transitions that lead away from a composite state. Such transitions are valid for all of its sub-states as if they have that transition defined. A sub-state can overwrite inherited transitions by having a transition triggered by the same event, but leading to another target state.
Transitions that lead to a composite state correspond to transitions to the initial state of the refinement, respectively to the initial states of all recurrent regions. Alternatively, such a transition can lead directly to a sub-state. If the refinement is not visible, the target state is noted as a short vertical line (stubbed state, stubbed transition) inside of the super-state symbol.
• A history state indicator in an OR- refinement of a state memorizes the last active sub-state of the refinement in that it is placed. In case of a transition towards the history state, the last sub-state is reactivated again. Using a deep history indicator, the memory is extended to all refinement hierarchies of composite states.
The following figure is an example for a state chart diagram. The blue annotations do not belong to the diagram and are for explanation purposes only.
Copyright © PROMISE Consortium 2004-2008 Page 37
@
Figure 8: Example UML state chart diagram
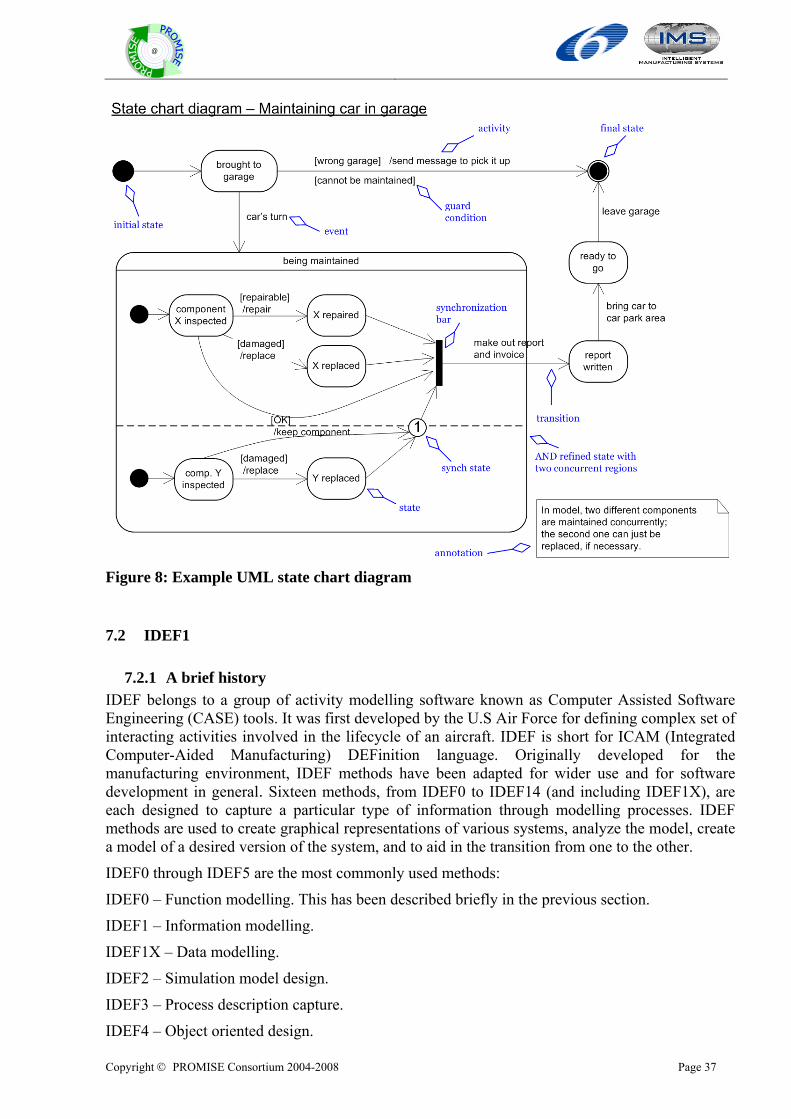
7.2 IDEF1
7.2.1 A brief history IDEF belongs to a group of activity modelling software known as Computer Assisted Software Engineering (CASE) tools. It was first developed by the U.S Air Force for defining complex set of interacting activities involved in the lifecycle of an aircraft. IDEF is short for ICAM (Integrated Computer-Aided Manufacturing) DEFinition language. Originally developed for the manufacturing environment, IDEF methods have been adapted for wider use and for software development in general. Sixteen methods, from IDEF0 to IDEF14 (and including IDEF1X), are each designed to capture a particular type of information through modelling processes. IDEF methods are used to create graphical representations of various systems, analyze the model, create a model of a desired version of the system, and to aid in the transition from one to the other.
IDEF0 through IDEF5 are the most commonly used methods:
IDEF0 – Function modelling. This has been described briefly in the previous section.
IDEF1 – Information modelling.
IDEF1X – Data modelling.
IDEF2 – Simulation model design.
IDEF3 – Process description capture.
IDEF4 – Object oriented design.
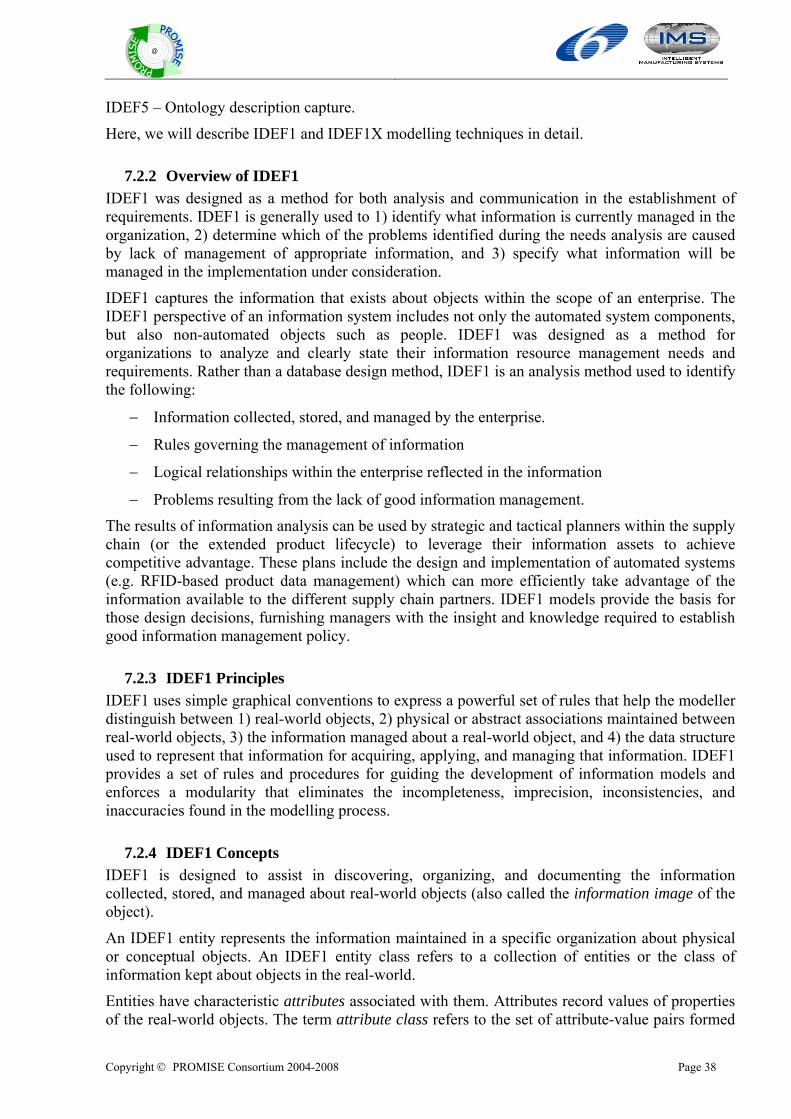
Copyright © PROMISE Consortium 2004-2008 Page 38
@
IDEF5 – Ontology description capture.
Here, we will describe IDEF1 and IDEF1X modelling techniques in detail.
7.2.2 Overview of IDEF1 IDEF1 was designed as a method for both analysis and communication in the establishment of requirements. IDEF1 is generally used to 1) identify what information is currently managed in the organization, 2) determine which of the problems identified during the needs analysis are caused by lack of management of appropriate information, and 3) specify what information will be managed in the implementation under consideration.
IDEF1 captures the information that exists about objects within the scope of an enterprise. The IDEF1 perspective of an information system includes not only the automated system components, but also non-automated objects such as people. IDEF1 was designed as a method for organizations to analyze and clearly state their information resource management needs and requirements. Rather than a database design method, IDEF1 is an analysis method used to identify the following:
− Information collected, stored, and managed by the enterprise.
− Rules governing the management of information
− Logical relationships within the enterprise reflected in the information
− Problems resulting from the lack of good information management.
The results of information analysis can be used by strategic and tactical planners within the supply chain (or the extended product lifecycle) to leverage their information assets to achieve competitive advantage. These plans include the design and implementation of automated systems (e.g. RFID-based product data management) which can more efficiently take advantage of the information available to the different supply chain partners. IDEF1 models provide the basis for those design decisions, furnishing managers with the insight and knowledge required to establish good information management policy.
7.2.3 IDEF1 Principles IDEF1 uses simple graphical conventions to express a powerful set of rules that help the modeller distinguish between 1) real-world objects, 2) physical or abstract associations maintained between real-world objects, 3) the information managed about a real-world object, and 4) the data structure used to represent that information for acquiring, applying, and managing that information. IDEF1 provides a set of rules and procedures for guiding the development of information models and enforces a modularity that eliminates the incompleteness, imprecision, inconsistencies, and inaccuracies found in the modelling process.
7.2.4 IDEF1 Concepts IDEF1 is designed to assist in discovering, organizing, and documenting the information collected, stored, and managed about real-world objects (also called the information image of the object).
An IDEF1 entity represents the information maintained in a specific organization about physical or conceptual objects. An IDEF1 entity class refers to a collection of entities or the class of information kept about objects in the real-world.
Entities have characteristic attributes associated with them. Attributes record values of properties of the real-world objects. The term attribute class refers to the set of attribute-value pairs formed
Copyright © PROMISE Consortium 2004-2008 Page 39
@
by grouping the name of the attribute and the values of that attribute for individual entity class members (entities). A collection of one or more attribute classes which distinguishes one member of an entity class from another is called a key class.
A relation in IDEF1 is an association between two individual information images. The existence of a relation is discovered or verified by noting that the attribute classes of one entity class contain the attribute classes of the key class of the referenced entity class member. A relation class can be thought of as the template for associations that exist between entity classes. An example of a relation in IDEF1 is the label "works for" on the link between the information entity called "Employee" and the information entity called "Department." If no information is kept about an association between two or more objects in the real-world, then, from an IDEF1 point of view, no relation exists. Relation classes are represented by links between the entity class boxes on an IDEF1 diagram. The diamonds on the end of the links and the half diamonds in the middle of the links encode additional information about the relation class (i.e., cardinality and dependency). The figure below illustrates the manner in which IDEF1 diagrams are drawn.
Figure 9: IDEF1 Diagram
7.2.5 Developing an IDEF1 model The development process of the information modelling technique is composed of five phases. Each of these phases is described below:
1) Phase Zero – Phase Zero is the context-setting phase. During this phase, the scope of the model is defined and its objectives are stated.
2) Phase One – The objective of Phase One is to define the Entity Classes which are readily apparent at this stage of the model development.
3) Phase Two – The objective of Phase Two is to define the Relation Classes which exist between the entity classes of which the model is comprised at this level.
4) Phase Three – The objective of this phase is to identify the Key Classes for each Entity Class of which the model is comprised at this time and to define each Attribute Class which is used in a Key Class.
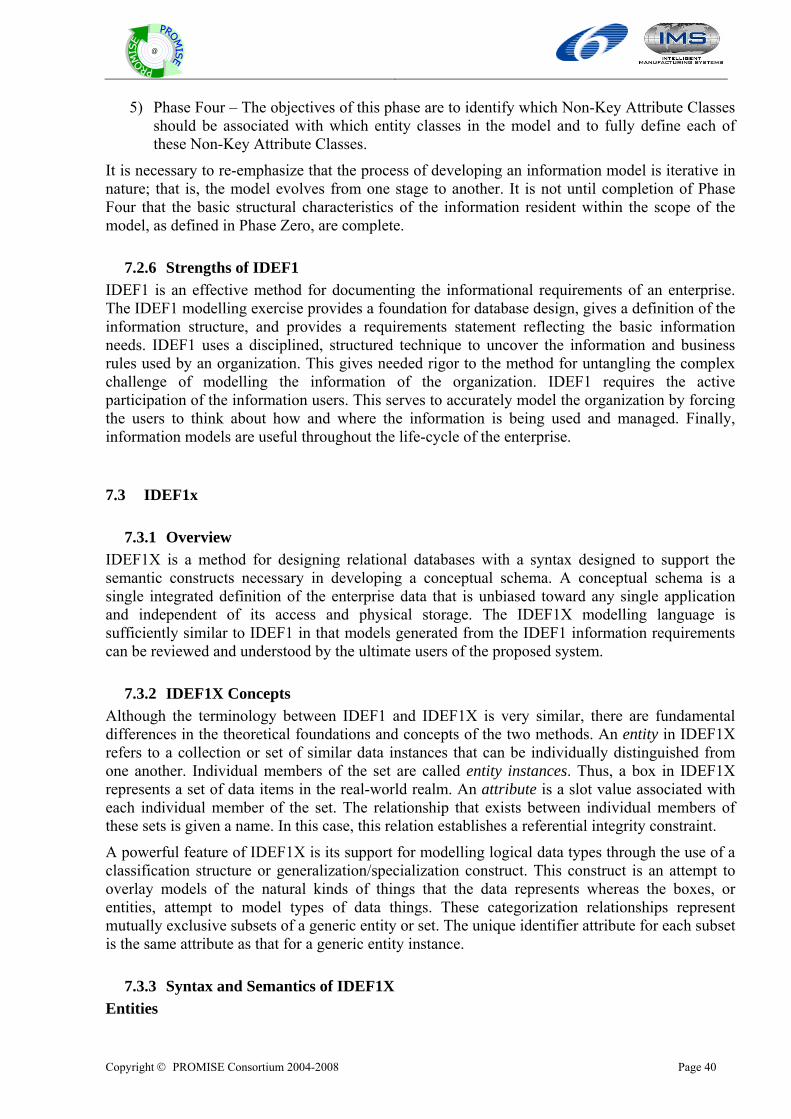
Copyright © PROMISE Consortium 2004-2008 Page 40
@
5) Phase Four – The objectives of this phase are to identify which Non-Key Attribute Classes should be associated with which entity classes in the model and to fully define each of these Non-Key Attribute Classes.
It is necessary to re-emphasize that the process of developing an information model is iterative in nature; that is, the model evolves from one stage to another. It is not until completion of Phase Four that the basic structural characteristics of the information resident within the scope of the model, as defined in Phase Zero, are complete.
7.2.6 Strengths of IDEF1 IDEF1 is an effective method for documenting the informational requirements of an enterprise. The IDEF1 modelling exercise provides a foundation for database design, gives a definition of the information structure, and provides a requirements statement reflecting the basic information needs. IDEF1 uses a disciplined, structured technique to uncover the information and business rules used by an organization. This gives needed rigor to the method for untangling the complex challenge of modelling the information of the organization. IDEF1 requires the active participation of the information users. This serves to accurately model the organization by forcing the users to think about how and where the information is being used and managed. Finally, information models are useful throughout the life-cycle of the enterprise.
7.3 IDEF1x
7.3.1 Overview IDEF1X is a method for designing relational databases with a syntax designed to support the semantic constructs necessary in developing a conceptual schema. A conceptual schema is a single integrated definition of the enterprise data that is unbiased toward any single application and independent of its access and physical storage. The IDEF1X modelling language is sufficiently similar to IDEF1 in that models generated from the IDEF1 information requirements can be reviewed and understood by the ultimate users of the proposed system.
7.3.2 IDEF1X Concepts Although the terminology between IDEF1 and IDEF1X is very similar, there are fundamental differences in the theoretical foundations and concepts of the two methods. An entity in IDEF1X refers to a collection or set of similar data instances that can be individually distinguished from one another. Individual members of the set are called entity instances. Thus, a box in IDEF1X represents a set of data items in the real-world realm. An attribute is a slot value associated with each individual member of the set. The relationship that exists between individual members of these sets is given a name. In this case, this relation establishes a referential integrity constraint.
A powerful feature of IDEF1X is its support for modelling logical data types through the use of a classification structure or generalization/specialization construct. This construct is an attempt to overlay models of the natural kinds of things that the data represents whereas the boxes, or entities, attempt to model types of data things. These categorization relationships represent mutually exclusive subsets of a generic entity or set. The unique identifier attribute for each subset is the same attribute as that for a generic entity instance.
7.3.3 Syntax and Semantics of IDEF1X Entities
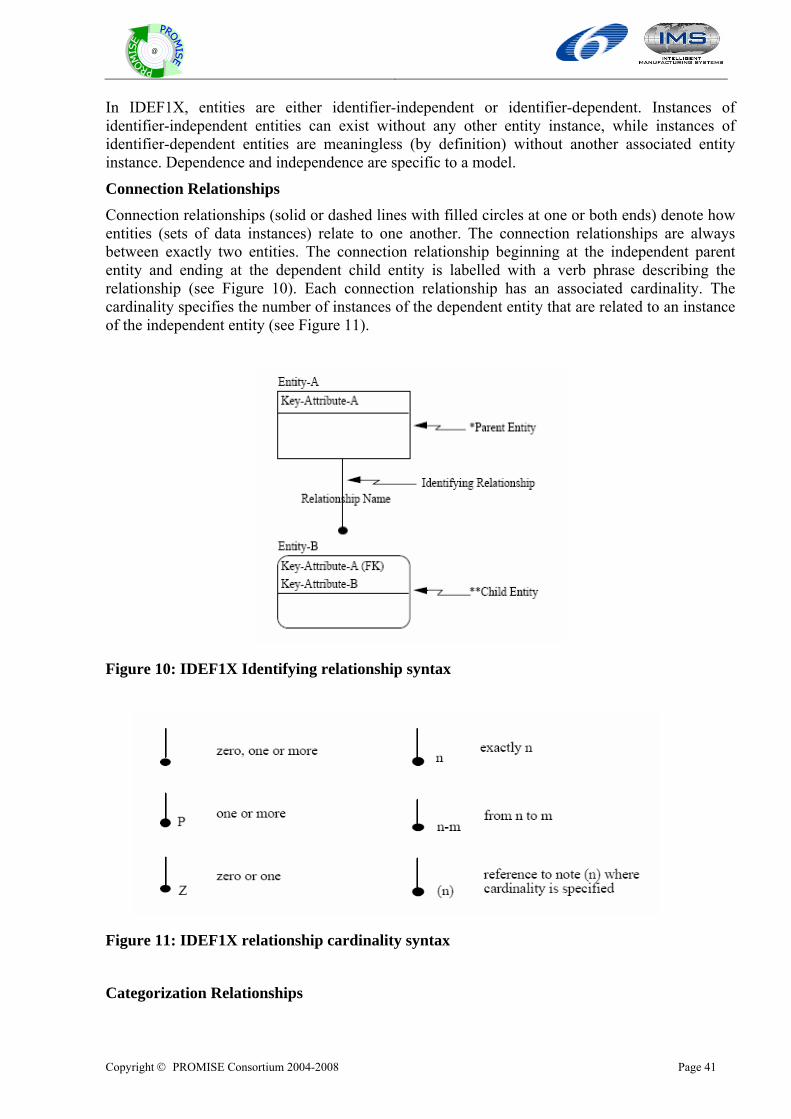
Copyright © PROMISE Consortium 2004-2008 Page 41
@
In IDEF1X, entities are either identifier-independent or identifier-dependent. Instances of identifier-independent entities can exist without any other entity instance, while instances of identifier-dependent entities are meaningless (by definition) without another associated entity instance. Dependence and independence are specific to a model.
Connection Relationships Connection relationships (solid or dashed lines with filled circles at one or both ends) denote how entities (sets of data instances) relate to one another. The connection relationships are always between exactly two entities. The connection relationship beginning at the independent parent entity and ending at the dependent child entity is labelled with a verb phrase describing the relationship (see Figure 10). Each connection relationship has an associated cardinality. The cardinality specifies the number of instances of the dependent entity that are related to an instance of the independent entity (see Figure 11).
Figure 10: IDEF1X Identifying relationship syntax
Figure 11: IDEF1X relationship cardinality syntax
Categorization Relationships
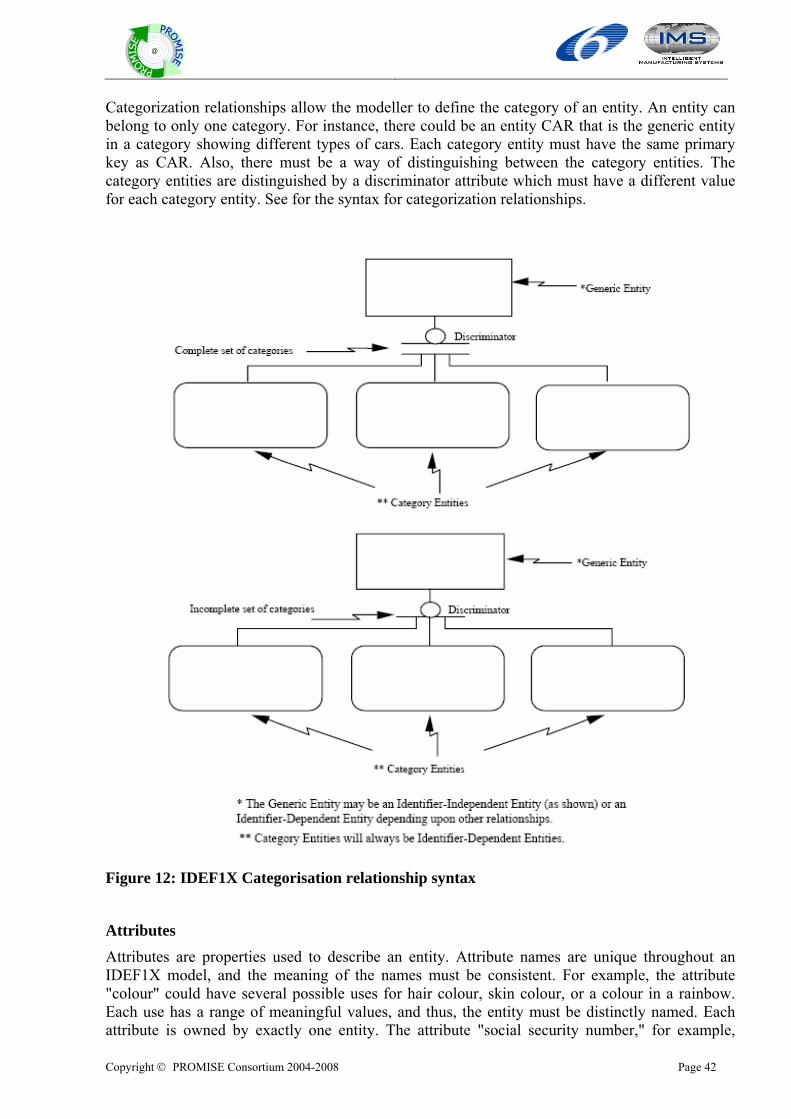
Copyright © PROMISE Consortium 2004-2008 Page 42
@
Categorization relationships allow the modeller to define the category of an entity. An entity can belong to only one category. For instance, there could be an entity CAR that is the generic entity in a category showing different types of cars. Each category entity must have the same primary key as CAR. Also, there must be a way of distinguishing between the category entities. The category entities are distinguished by a discriminator attribute which must have a different value for each category entity. See for the syntax for categorization relationships.
Figure 12: IDEF1X Categorisation relationship syntax
Attributes Attributes are properties used to describe an entity. Attribute names are unique throughout an IDEF1X model, and the meaning of the names must be consistent. For example, the attribute "colour" could have several possible uses for hair colour, skin colour, or a colour in a rainbow. Each use has a range of meaningful values, and thus, the entity must be distinctly named. Each attribute is owned by exactly one entity. The attribute "social security number," for example,
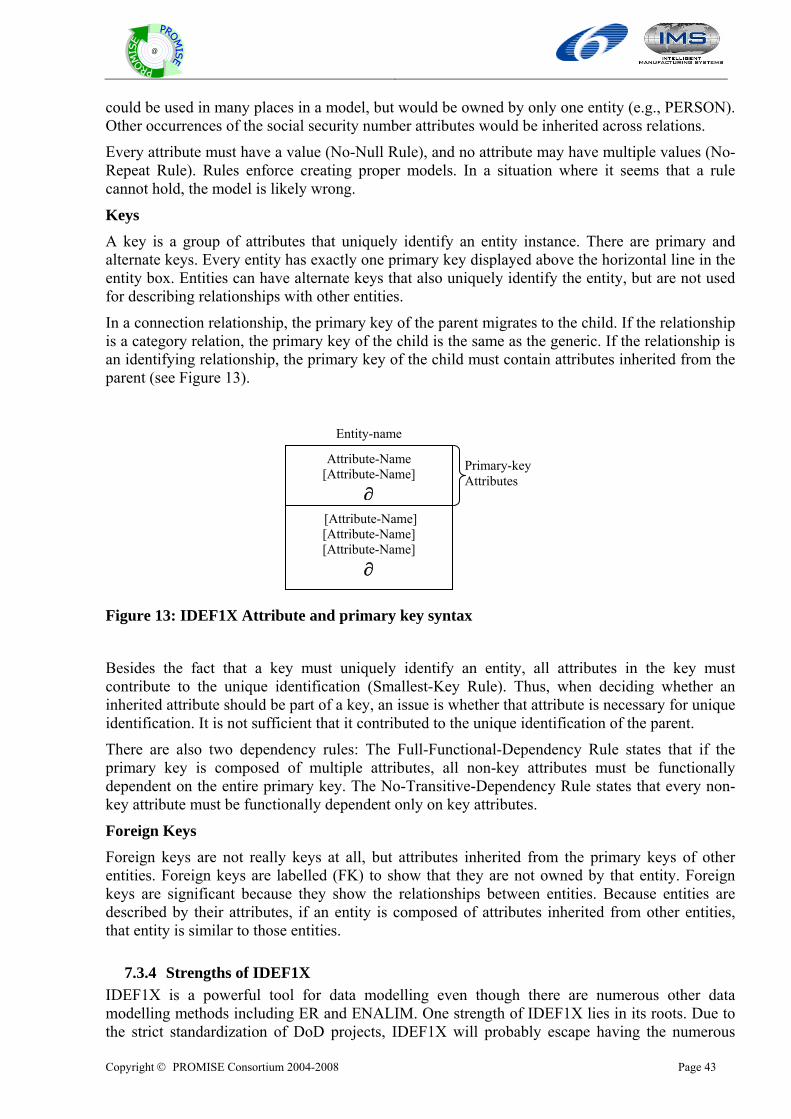
Copyright © PROMISE Consortium 2004-2008 Page 43
@
could be used in many places in a model, but would be owned by only one entity (e.g., PERSON). Other occurrences of the social security number attributes would be inherited across relations.
Every attribute must have a value (No-Null Rule), and no attribute may have multiple values (No-Repeat Rule). Rules enforce creating proper models. In a situation where it seems that a rule cannot hold, the model is likely wrong.
Keys A key is a group of attributes that uniquely identify an entity instance. There are primary and alternate keys. Every entity has exactly one primary key displayed above the horizontal line in the entity box. Entities can have alternate keys that also uniquely identify the entity, but are not used for describing relationships with other entities.
In a connection relationship, the primary key of the parent migrates to the child. If the relationship is a category relation, the primary key of the child is the same as the generic. If the relationship is an identifying relationship, the primary key of the child must contain attributes inherited from the parent (see Figure 13).
Figure 13: IDEF1X Attribute and primary key syntax
Besides the fact that a key must uniquely identify an entity, all attributes in the key must contribute to the unique identification (Smallest-Key Rule). Thus, when deciding whether an inherited attribute should be part of a key, an issue is whether that attribute is necessary for unique identification. It is not sufficient that it contributed to the unique identification of the parent.
There are also two dependency rules: The Full-Functional-Dependency Rule states that if the primary key is composed of multiple attributes, all non-key attributes must be functionally dependent on the entire primary key. The No-Transitive-Dependency Rule states that every non-key attribute must be functionally dependent only on key attributes.
Foreign Keys Foreign keys are not really keys at all, but attributes inherited from the primary keys of other entities. Foreign keys are labelled (FK) to show that they are not owned by that entity. Foreign keys are significant because they show the relationships between entities. Because entities are described by their attributes, if an entity is composed of attributes inherited from other entities, that entity is similar to those entities.
7.3.4 Strengths of IDEF1X IDEF1X is a powerful tool for data modelling even though there are numerous other data modelling methods including ER and ENALIM. One strength of IDEF1X lies in its roots. Due to the strict standardization of DoD projects, IDEF1X will probably escape having the numerous
Attribute-Name [Attribute-Name]
∂ [Attribute-Name] [Attribute-Name] [Attribute-Name]
∂
Entity-name
Primary-key Attributes
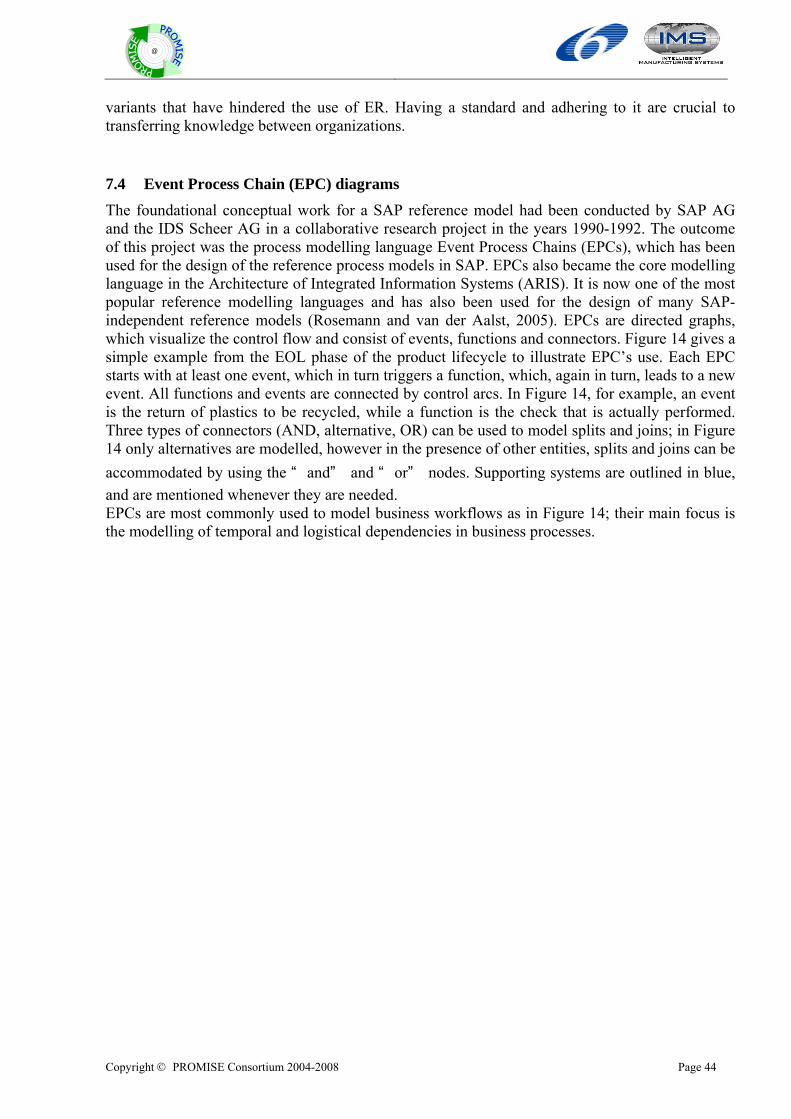
Copyright © PROMISE Consortium 2004-2008 Page 44
@
variants that have hindered the use of ER. Having a standard and adhering to it are crucial to transferring knowledge between organizations.
7.4 Event Process Chain (EPC) diagrams The foundational conceptual work for a SAP reference model had been conducted by SAP AG and the IDS Scheer AG in a collaborative research project in the years 1990-1992. The outcome of this project was the process modelling language Event Process Chains (EPCs), which has been used for the design of the reference process models in SAP. EPCs also became the core modelling language in the Architecture of Integrated Information Systems (ARIS). It is now one of the most popular reference modelling languages and has also been used for the design of many SAP-independent reference models (Rosemann and van der Aalst, 2005). EPCs are directed graphs, which visualize the control flow and consist of events, functions and connectors. Figure 14 gives a simple example from the EOL phase of the product lifecycle to illustrate EPC’s use. Each EPC starts with at least one event, which in turn triggers a function, which, again in turn, leads to a new event. All functions and events are connected by control arcs. In Figure 14, for example, an event is the return of plastics to be recycled, while a function is the check that is actually performed. Three types of connectors (AND, alternative, OR) can be used to model splits and joins; in Figure 14 only alternatives are modelled, however in the presence of other entities, splits and joins can be accommodated by using the “ and” and “ or” nodes. Supporting systems are outlined in blue, and are mentioned whenever they are needed. EPCs are most commonly used to model business workflows as in Figure 14; their main focus is the modelling of temporal and logistical dependencies in business processes.
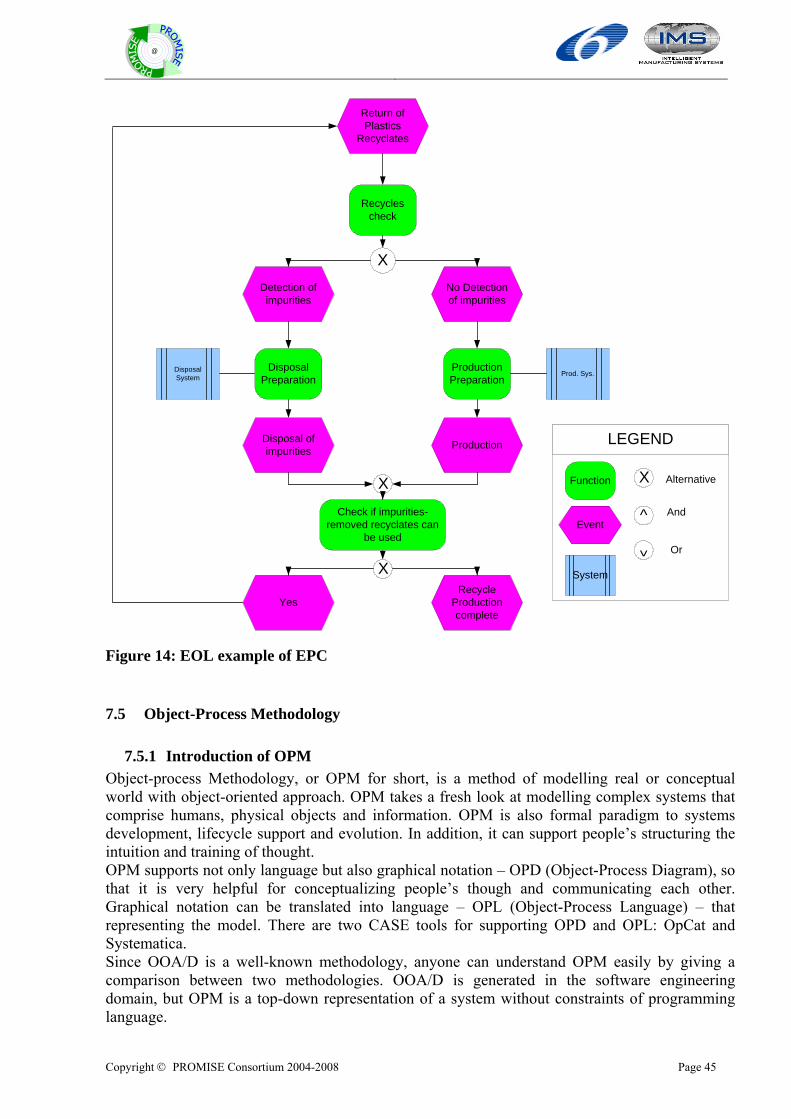
Copyright © PROMISE Consortium 2004-2008 Page 45
@
Return ofPlastics
Recyclates
Recyclescheck
Detection ofimpurities
No Detectionof impurities
ProductionPreparation
DisposalPreparation
Prod. Sys.
Production
DisposalSystem
Disposal ofimpurities
Check if impurities-removed recyclates can
be used
YesRecycle
Productioncomplete
X
X
X
LEGEND
Function
Event
System
X Alternative
^ And
^Or
Figure 14: EOL example of EPC
7.5 Object-Process Methodology
7.5.1 Introduction of OPM Object-process Methodology, or OPM for short, is a method of modelling real or conceptual world with object-oriented approach. OPM takes a fresh look at modelling complex systems that comprise humans, physical objects and information. OPM is also formal paradigm to systems development, lifecycle support and evolution. In addition, it can support people’s structuring the intuition and training of thought. OPM supports not only language but also graphical notation – OPD (Object-Process Diagram), so that it is very helpful for conceptualizing people’s though and communicating each other. Graphical notation can be translated into language – OPL (Object-Process Language) – that representing the model. There are two CASE tools for supporting OPD and OPL: OpCat and Systematica. Since OOA/D is a well-known methodology, anyone can understand OPM easily by giving a comparison between two methodologies. OOA/D is generated in the software engineering domain, but OPM is a top-down representation of a system without constraints of programming language.
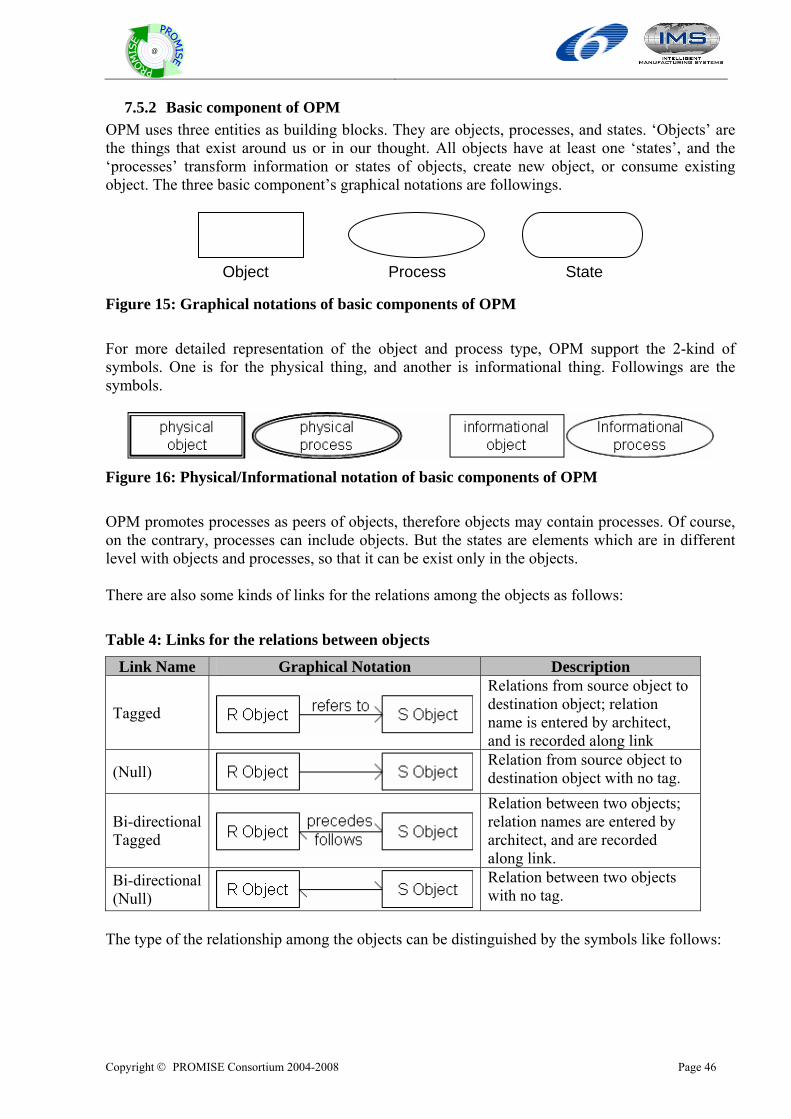
Copyright © PROMISE Consortium 2004-2008 Page 46
@
7.5.2 Basic component of OPM OPM uses three entities as building blocks. They are objects, processes, and states. ‘Objects’ are the things that exist around us or in our thought. All objects have at least one ‘states’, and the ‘processes’ transform information or states of objects, create new object, or consume existing object. The three basic component’s graphical notations are followings.
Figure 15: Graphical notations of basic components of OPM For more detailed representation of the object and process type, OPM support the 2-kind of symbols. One is for the physical thing, and another is informational thing. Followings are the symbols.
Figure 16: Physical/Informational notation of basic components of OPM OPM promotes processes as peers of objects, therefore objects may contain processes. Of course, on the contrary, processes can include objects. But the states are elements which are in different level with objects and processes, so that it can be exist only in the objects. There are also some kinds of links for the relations among the objects as follows:
Table 4: Links for the relations between objects
Link Name Graphical Notation Description
Tagged
Relations from source object to destination object; relation name is entered by architect, and is recorded along link
(Null) Relation from source object to destination object with no tag.
Bi-directional Tagged
Relation between two objects; relation names are entered by architect, and are recorded along link.
Bi-directional (Null)
Relation between two objects with no tag.
The type of the relationship among the objects can be distinguished by the symbols like follows:
Object Process State
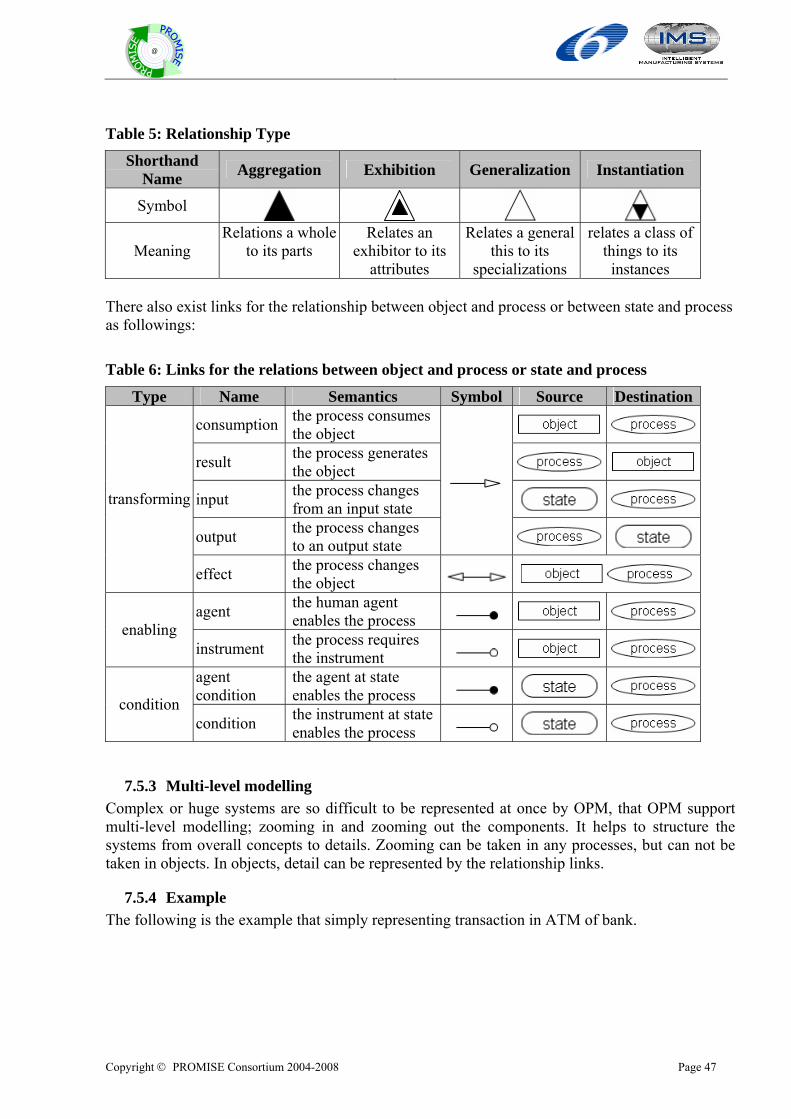
Copyright © PROMISE Consortium 2004-2008 Page 47
@
Table 5: Relationship Type
Shorthand Name Aggregation Exhibition Generalization Instantiation
Symbol
Meaning Relations a whole
to its parts Relates an
exhibitor to its attributes
Relates a general this to its
specializations
relates a class of things to its
instances There also exist links for the relationship between object and process or between state and process as followings:
Table 6: Links for the relations between object and process or state and process
Type Name Semantics Symbol Source Destination
consumption the process consumes the object
result the process generates the object
input the process changes from an input state
output the process changes to an output state
transforming
effect the process changes the object
agent the human agent enables the process
enabling instrument the process requires
the instrument agent condition
the agent at state enables the process
condition condition the instrument at state
enables the process
7.5.3 Multi-level modelling Complex or huge systems are so difficult to be represented at once by OPM, that OPM support multi-level modelling; zooming in and zooming out the components. It helps to structure the systems from overall concepts to details. Zooming can be taken in any processes, but can not be taken in objects. In objects, detail can be represented by the relationship links.
7.5.4 Example The following is the example that simply representing transaction in ATM of bank.
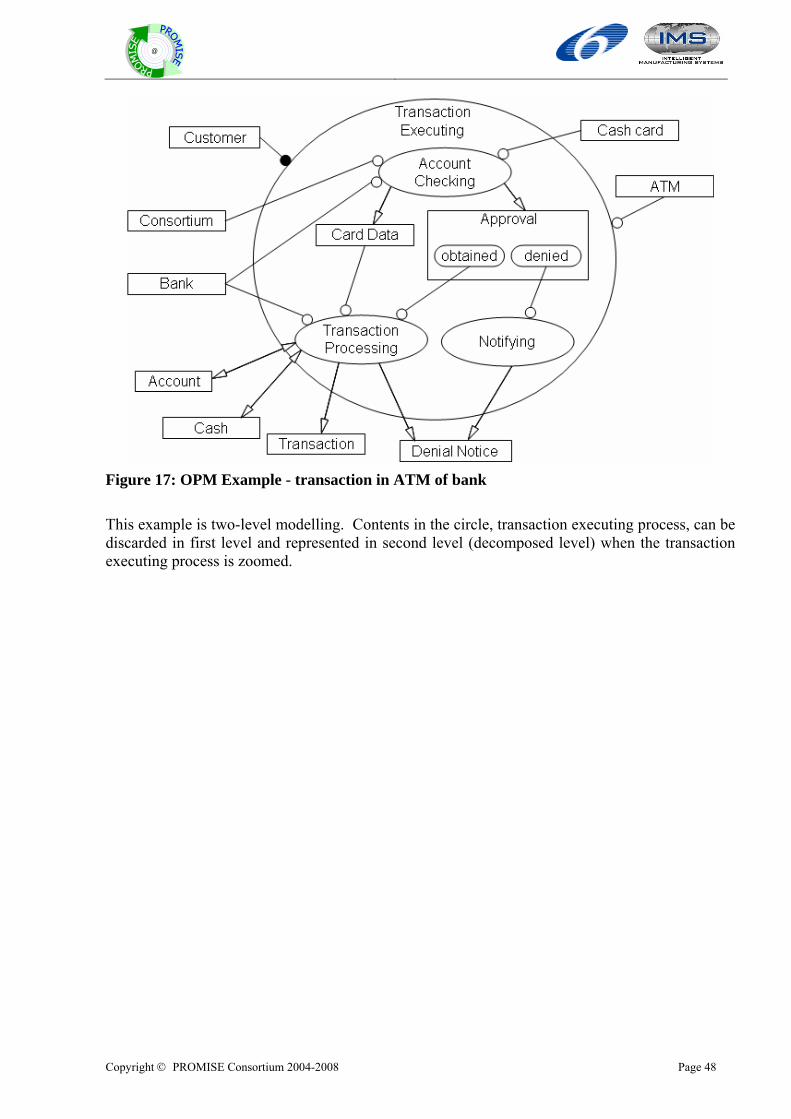
Copyright © PROMISE Consortium 2004-2008 Page 48
@
Figure 17: OPM Example - transaction in ATM of bank This example is two-level modelling. Contents in the circle, transaction executing process, can be discarded in first level and represented in second level (decomposed level) when the transaction executing process is zoomed.
Copyright © PROMISE Consortium 2004-2008 Page 49
@
PART III: Definition of generic product lifecycle model

Copyright © PROMISE Consortium 2004-2008 Page 50
@
Copyright © PROMISE Consortium 2004-2008 Page 51
@
8 Introduction to definition of generic product lifecycle model
8.1 The purpose of generic product lifecycle model For understanding the behaviors of a system, we should know the scenarios of a system. In other words, we should know what are the main components of the system and how to cooperate them each other. It will help us understand operational aspects of a system more clearly. The generic product lifecycle model has two main parts: generic product lifecycle model and lifecycle-specific model.
8.2 Contribution area of each partner in Part III Table 7 shows the involved partners and their contributions in this part. Each partner has provided product lifecycle models for responsible area as described in the below table and EPFL has integrated their works.
Table 7: Responsible partners at PART III
Contribution area Responsible partner Integration of section 10 10.4.5 Embedded software
SINTEF
8. Introduction to definition of generic product lifecycle model 9. Selected modelling method 10.1 Integrated model
EPFL
10.2 Business model CAMBRIDGE 10.3 Hardware BIBA 10.4.3 Data transformation CIMRU 10.4.1 PDKM/FIELD DB INMEDIASP 10.4.2 Decision making/supporting ITIA 10.4.4 Middleware SAP
8.3 Organization of Part III This part is organized as follows. In the next section, we will describe a selected modelling method, i.e. use case diagram. In section 10, we will introduce the product lifecycle models. For this, we describe use case diagrams of each modelling component. In addition, we also propose the integrated modelling method.
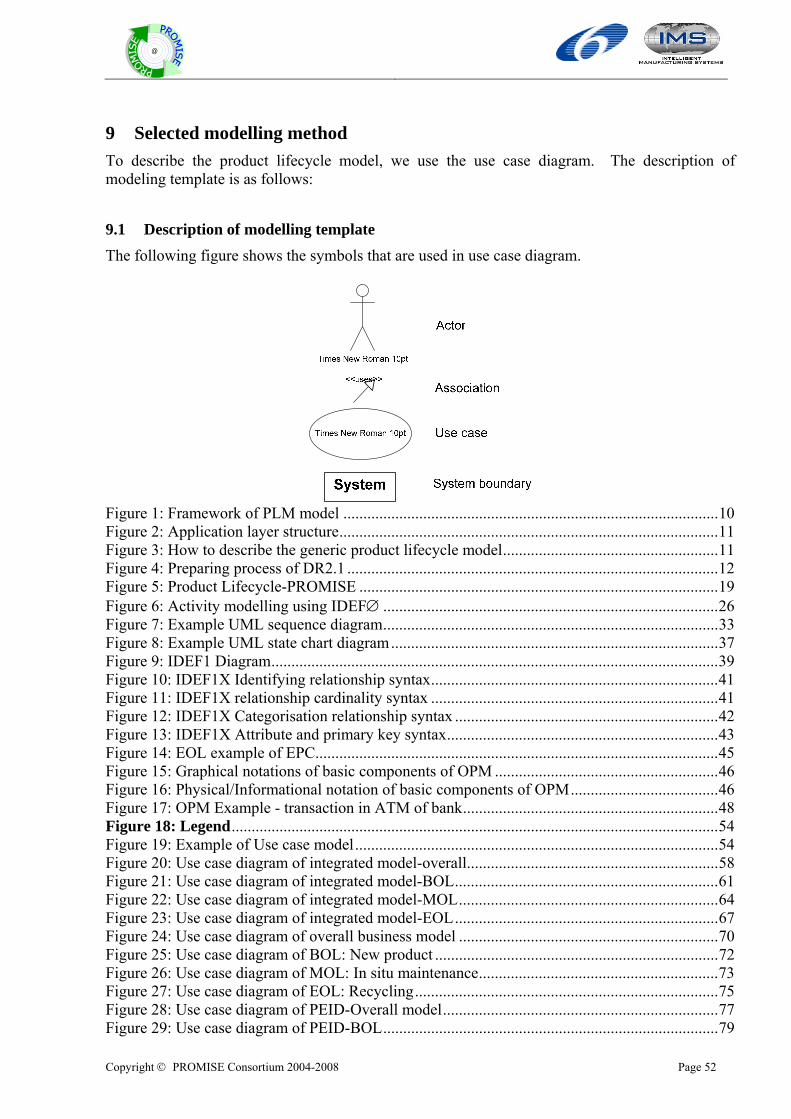
Copyright © PROMISE Consortium 2004-2008 Page 52
@
9 Selected modelling method To describe the product lifecycle model, we use the use case diagram. The description of modeling template is as follows:
9.1 Description of modelling template The following figure shows the symbols that are used in use case diagram.
Figure 1: Framework of PLM model ..............................................................................................10 Figure 2: Application layer structure...............................................................................................11 Figure 3: How to describe the generic product lifecycle model......................................................11 Figure 4: Preparing process of DR2.1 .............................................................................................12 Figure 5: Product Lifecycle-PROMISE ..........................................................................................19 Figure 6: Activity modelling using IDEF∅ ....................................................................................26 Figure 7: Example UML sequence diagram....................................................................................33 Figure 8: Example UML state chart diagram..................................................................................37 Figure 9: IDEF1 Diagram................................................................................................................39 Figure 10: IDEF1X Identifying relationship syntax........................................................................41 Figure 11: IDEF1X relationship cardinality syntax ........................................................................41 Figure 12: IDEF1X Categorisation relationship syntax ..................................................................42 Figure 13: IDEF1X Attribute and primary key syntax....................................................................43 Figure 14: EOL example of EPC.....................................................................................................45 Figure 15: Graphical notations of basic components of OPM ........................................................46 Figure 16: Physical/Informational notation of basic components of OPM.....................................46 Figure 17: OPM Example - transaction in ATM of bank................................................................48 Figure 18: Legend..........................................................................................................................54 Figure 19: Example of Use case model...........................................................................................54 Figure 20: Use case diagram of integrated model-overall...............................................................58 Figure 21: Use case diagram of integrated model-BOL..................................................................61 Figure 22: Use case diagram of integrated model-MOL.................................................................64 Figure 23: Use case diagram of integrated model-EOL..................................................................67 Figure 24: Use case diagram of overall business model .................................................................70 Figure 25: Use case diagram of BOL: New product .......................................................................72 Figure 26: Use case diagram of MOL: In situ maintenance............................................................73 Figure 27: Use case diagram of EOL: Recycling............................................................................75 Figure 28: Use case diagram of PEID-Overall model.....................................................................77 Figure 29: Use case diagram of PEID-BOL....................................................................................79
Copyright © PROMISE Consortium 2004-2008 Page 53
@
Figure 30: Use case diagram of PEID-MOL...................................................................................81 Figure 31: Use case diagram of PEID-EOL....................................................................................83 Figure 32: PDKM/Field DB-Overall model....................................................................................85 Figure 33: PDKM/Field DB-BOL...................................................................................................87 Figure 34: PDKM/Field DB MOL ..................................................................................................89 Figure 35: PDKM/Field DB-EOL...................................................................................................91 Figure 36: Use case diagram of DSS - Overall ...............................................................................93 Figure 37: Use case diagram of DSS - BOL ...................................................................................99 Figure 38: Use case diagram of DSS - MOL ................................................................................106 Figure 39: Use case diagram of DSS - EOL..................................................................................112 Figure 40: Use case diagram of Data Transformation - Overall ...................................................118 Figure 41: Use case diagram of Data Transformation - BOL .......................................................120 Figure 42: Use case diagram of Data Transformation - MOL ......................................................123 Figure 43: Use case diagram of Data Transformation - EOL .......................................................126 Figure 44: Use case diagram of Middleware - overall ..................................................................129 Figure 45: Use case diagram of Embedded Software System-Overall model ..............................132 Figure 46: Use case diagram of Embedded Software Systems-BOL............................................134 Figure 47: Use case diagram of Embedded Software Systems-MOL...........................................135 Figure 48: Use case diagram of Embedded Software System-EOL..............................................138 Figure 49: Legend .........................................................................................................................144 Figure 50: Example of Information flow model............................................................................144 Figure 51: Context diagram...........................................................................................................145 Figure 52: Level 1 DFD ................................................................................................................145 Figure 53: DFD context diagram of Integrated Model..................................................................148 Figure 54: DFD context diagram of Integrated Model-BOL ........................................................149 Figure 55: DFD context diagram of Integrated Model-MOL .......................................................151 Figure 56: DFD context diagram of Integrated Model-EOL.........................................................152 Figure 57: DFD context diagram of Overall Business Model.......................................................154 Figure 58: DFD context diagram of Business Model BOL...........................................................156 Figure 59: DFD context diagram of Business Model MOL..........................................................157 Figure 60: context diagram of Business Model EOL....................................................................159 Figure 61: DFD context diagram of PEID-Overall .......................................................................161 Figure 62: DFD context diagram of PEID-BOL ...........................................................................164 Figure 63: DFD context diagram of PEID-MOL ..........................................................................165 Figure 64: DFD context diagram of PEID-EOL ...........................................................................166 Figure 65: DFD context diagram of PDKM/Field DB-Overall.....................................................167 Figure 66: DFD context diagram of PDKM/Field DB-BOL.........................................................168 Figure 67: DFD level 1 diagram of PDKM/Field DB-BOL..........................................................169 Figure 68: DFD context diagram of PDKM/Field DB-MOL........................................................170 Figure 69: DFD level 1 diagram of PDKM/Field DB-MOL.........................................................171 Figure 70: DFD context diagram of PDKM/Field DB-EOL.........................................................173 Figure 71: DFD level 1 diagram of PDKM/Field DB-EOL..........................................................174 Figure 72: DFD context diagram of Decision making/supporting................................................177 Figure 73: BOL Model - DFD level 1 ...........................................................................................178 Figure 74: MOL Model - DFD level 1 ..........................................................................................179 Figure 75: EOL Model - DFD level 1 ...........................................................................................181 Figure 76: DFD context diagram of Data transformation .............................................................183 Figure 77: DFD level 1 diagram of Data transformation - BOL...................................................184 Figure 78: DFD level 1 diagram of Data transformation – MOL .................................................186 Figure 79: DFD level 1 diagram of Data transformation – EOL ..................................................188 Figure 80: DFD context diagram of Middleware-Overall.............................................................190
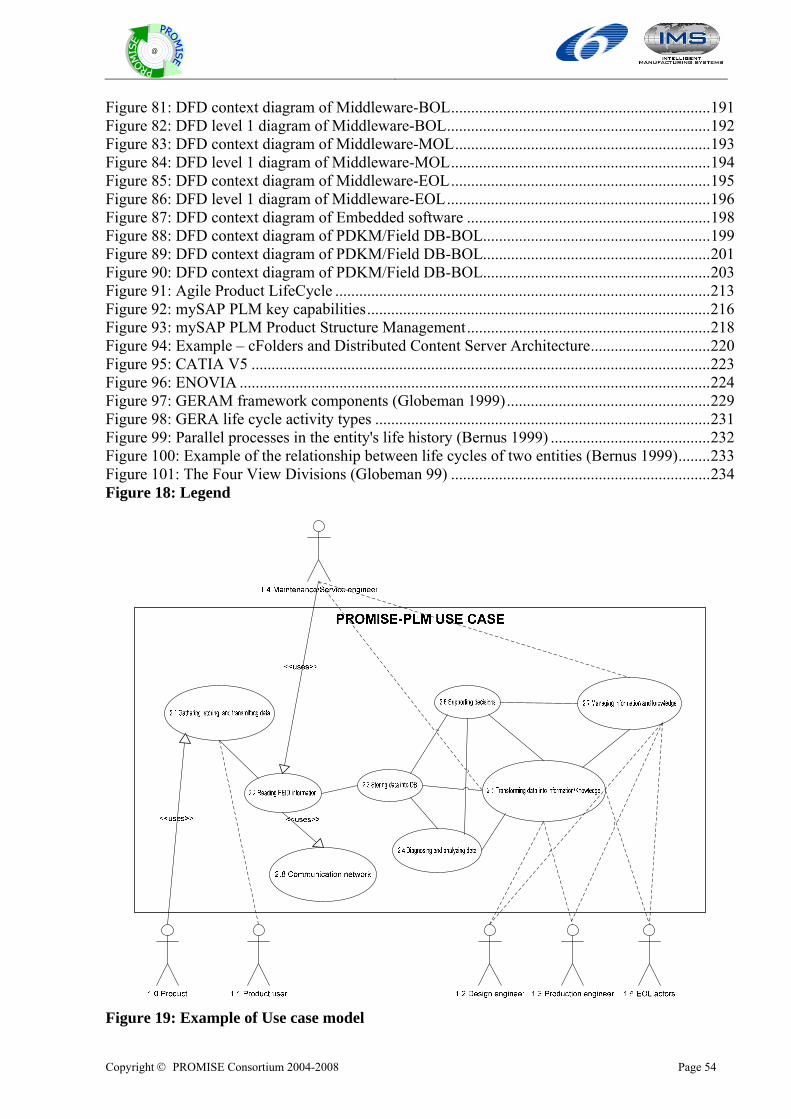
Copyright © PROMISE Consortium 2004-2008 Page 54
@
Figure 81: DFD context diagram of Middleware-BOL.................................................................191 Figure 82: DFD level 1 diagram of Middleware-BOL..................................................................192 Figure 83: DFD context diagram of Middleware-MOL................................................................193 Figure 84: DFD level 1 diagram of Middleware-MOL.................................................................194 Figure 85: DFD context diagram of Middleware-EOL.................................................................195 Figure 86: DFD level 1 diagram of Middleware-EOL..................................................................196 Figure 87: DFD context diagram of Embedded software .............................................................198 Figure 88: DFD context diagram of PDKM/Field DB-BOL.........................................................199 Figure 89: DFD context diagram of PDKM/Field DB-BOL.........................................................201 Figure 90: DFD context diagram of PDKM/Field DB-BOL.........................................................203 Figure 91: Agile Product LifeCycle ..............................................................................................213 Figure 92: mySAP PLM key capabilities......................................................................................216 Figure 93: mySAP PLM Product Structure Management.............................................................218 Figure 94: Example – cFolders and Distributed Content Server Architecture..............................220 Figure 95: CATIA V5 ...................................................................................................................223 Figure 96: ENOVIA ......................................................................................................................224 Figure 97: GERAM framework components (Globeman 1999)...................................................229 Figure 98: GERA life cycle activity types ....................................................................................231 Figure 99: Parallel processes in the entity's life history (Bernus 1999) ........................................232 Figure 100: Example of the relationship between life cycles of two entities (Bernus 1999)........233 Figure 101: The Four View Divisions (Globeman 99) .................................................................234 Figure 18: Legend
Figure 19: Example of Use case model
Copyright © PROMISE Consortium 2004-2008 Page 55
@
Use case diagram shows the relationships among actors and use cases within a system (here component). Therefore, use case diagram is used to identify the primary elements and processes that form the system. The primary elements are termed as "actors" and the processes are called "use cases." The use case diagram shows which actors interact with each use case. For example, the generic product lifecycle model of PROMISE can be described as Figure 19 with use case diagram. The main elements of use case diagram are use cases, actors, associations, and system boundary boxes.
− A use case describes a sequence of actions that provide something of measurable value to an actor and is drawn as a horizontal ellipse.
e.g. gathering, storing and transmission data; Managing information and knowledge − An actor is a person, organization, or external system that plays a role in one or more
interactions with your system. Actors are drawn as stick figures. e.g. Product, EOL actors
− Associations between actors and use cases are indicated in use case diagrams by lines. An association exists whenever an actor is involved with an interaction described by a use case. • An association between an actor and a use case • An association between two use cases • A generalization between two actors • A generalization between two use cases
− The system boundary box is a rectangle around the use cases and as the name suggests it indicates the scope of your system. The use cases inside the rectangle represent the functionality that you intend to implement.
9.2 Granularity of modeling In this report, we will design the use case diagram with the description level of one step top-down from each modeling component.
9.3 Modeling procedure The procedure for producing a use case diagram is as follows.
1. At first, the system boundary should be defined. The system boundary includes the functions which will be implemented in the PROMISE project. A system boundary defines the scope of what a system will be. The system boundary is shown as a rectangle spanning all the use cases in the system.
2. Then, actors which will interact with system should be defined. An actor in a use case diagram interacts with a use case. The following is the guideline for describing actors. − Draw actors to the outside of a use case diagram − Name actors with singular, business-relevant nouns − Associate each actor with one or more use cases − Actors model roles, not positions − Actors don’t interact with one another
3. Next, according to actors and system, use case will be defined. As the first step in identifying use cases, the discrete business functions should be listed. Each of these business functions can be classified as a potential use case. Some specific points of use case are as follows. − Use case names begin with a strong verb − Name use cases using domain terminology
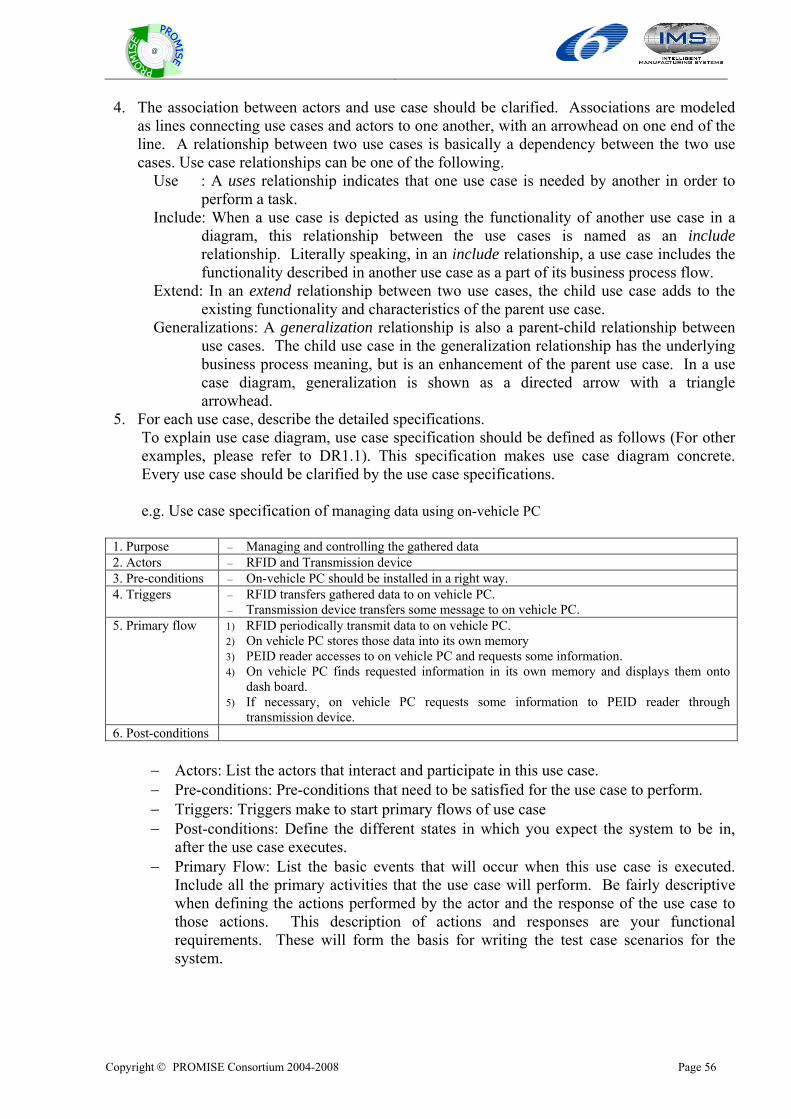
Copyright © PROMISE Consortium 2004-2008 Page 56
@
4. The association between actors and use case should be clarified. Associations are modeled as lines connecting use cases and actors to one another, with an arrowhead on one end of the line. A relationship between two use cases is basically a dependency between the two use cases. Use case relationships can be one of the following.
Use : A uses relationship indicates that one use case is needed by another in order to perform a task.
Include: When a use case is depicted as using the functionality of another use case in a diagram, this relationship between the use cases is named as an include relationship. Literally speaking, in an include relationship, a use case includes the functionality described in another use case as a part of its business process flow.
Extend: In an extend relationship between two use cases, the child use case adds to the existing functionality and characteristics of the parent use case.
Generalizations: A generalization relationship is also a parent-child relationship between use cases. The child use case in the generalization relationship has the underlying business process meaning, but is an enhancement of the parent use case. In a use case diagram, generalization is shown as a directed arrow with a triangle arrowhead.
5. For each use case, describe the detailed specifications. To explain use case diagram, use case specification should be defined as follows (For other
examples, please refer to DR1.1). This specification makes use case diagram concrete. Every use case should be clarified by the use case specifications.
e.g. Use case specification of managing data using on-vehicle PC
1. Purpose – Managing and controlling the gathered data 2. Actors – RFID and Transmission device 3. Pre-conditions – On-vehicle PC should be installed in a right way. 4. Triggers – RFID transfers gathered data to on vehicle PC.
– Transmission device transfers some message to on vehicle PC. 5. Primary flow 1) RFID periodically transmit data to on vehicle PC.
2) On vehicle PC stores those data into its own memory 3) PEID reader accesses to on vehicle PC and requests some information. 4) On vehicle PC finds requested information in its own memory and displays them onto
dash board. 5) If necessary, on vehicle PC requests some information to PEID reader through
transmission device. 6. Post-conditions
− Actors: List the actors that interact and participate in this use case. − Pre-conditions: Pre-conditions that need to be satisfied for the use case to perform. − Triggers: Triggers make to start primary flows of use case − Post-conditions: Define the different states in which you expect the system to be in,
after the use case executes. − Primary Flow: List the basic events that will occur when this use case is executed.
Include all the primary activities that the use case will perform. Be fairly descriptive when defining the actions performed by the actor and the response of the use case to those actions. This description of actions and responses are your functional requirements. These will form the basis for writing the test case scenarios for the system.

Copyright © PROMISE Consortium 2004-2008 Page 57
@
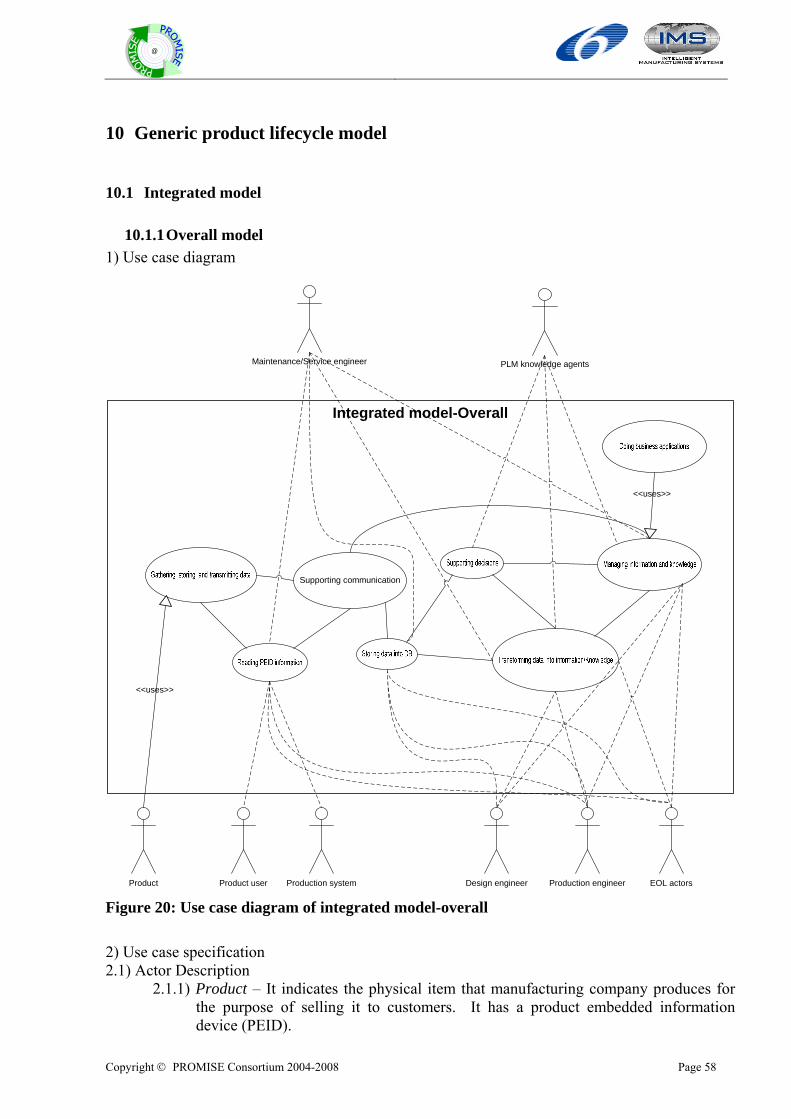
Copyright © PROMISE Consortium 2004-2008 Page 58
@
10 Generic product lifecycle model
10.1 Integrated model
10.1.1 Overall model 1) Use case diagram
Design engineer
Integrated model-Overall
Product userProduct
Maintenance/Service engineer
Production engineer EOL actors
<<uses>>
Supporting communication
<<uses>>
PLM knowledge agents
Production system Figure 20: Use case diagram of integrated model-overall 2) Use case specification 2.1) Actor Description
2.1.1) Product – It indicates the physical item that manufacturing company produces for the purpose of selling it to customers. It has a product embedded information device (PEID).
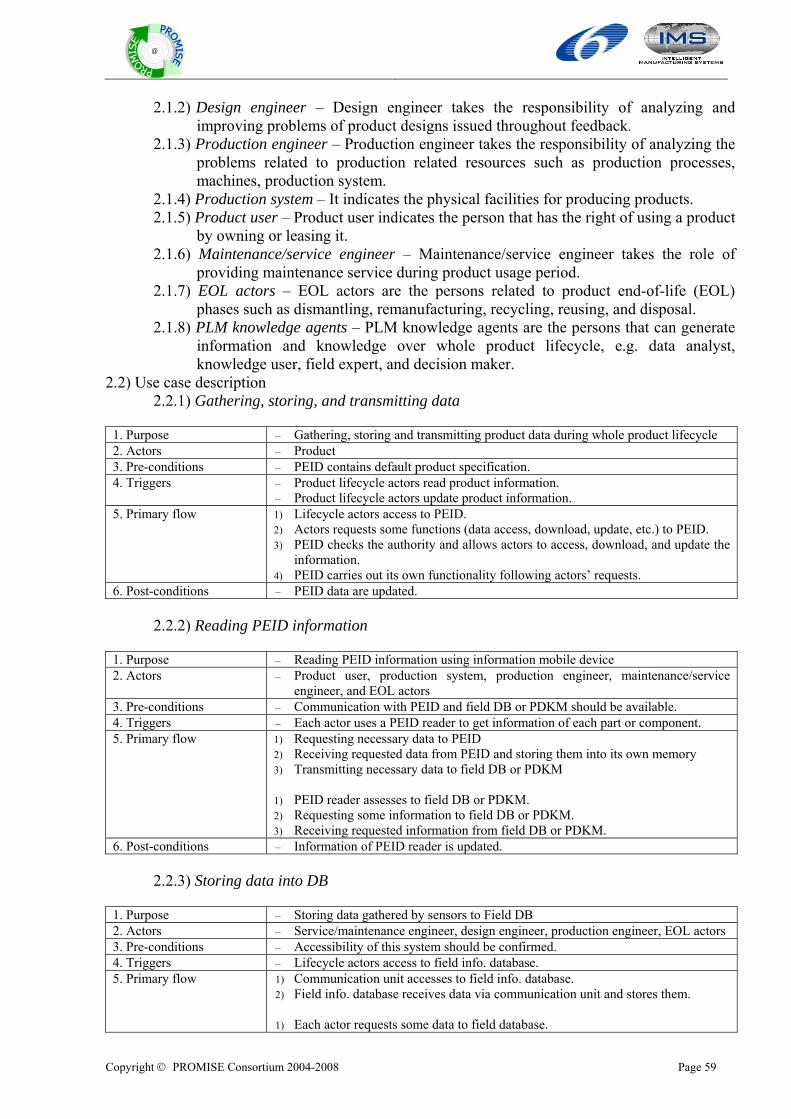
Copyright © PROMISE Consortium 2004-2008 Page 59
@
2.1.2) Design engineer – Design engineer takes the responsibility of analyzing and improving problems of product designs issued throughout feedback.
2.1.3) Production engineer – Production engineer takes the responsibility of analyzing the problems related to production related resources such as production processes, machines, production system.
2.1.4) Production system – It indicates the physical facilities for producing products. 2.1.5) Product user – Product user indicates the person that has the right of using a product
by owning or leasing it. 2.1.6) Maintenance/service engineer – Maintenance/service engineer takes the role of
providing maintenance service during product usage period. 2.1.7) EOL actors – EOL actors are the persons related to product end-of-life (EOL)
phases such as dismantling, remanufacturing, recycling, reusing, and disposal. 2.1.8) PLM knowledge agents – PLM knowledge agents are the persons that can generate
information and knowledge over whole product lifecycle, e.g. data analyst, knowledge user, field expert, and decision maker.
2.2) Use case description 2.2.1) Gathering, storing, and transmitting data
1. Purpose – Gathering, storing and transmitting product data during whole product lifecycle 2. Actors – Product 3. Pre-conditions – PEID contains default product specification. 4. Triggers – Product lifecycle actors read product information.
– Product lifecycle actors update product information. 5. Primary flow 1) Lifecycle actors access to PEID.
2) Actors requests some functions (data access, download, update, etc.) to PEID. 3) PEID checks the authority and allows actors to access, download, and update the
information. 4) PEID carries out its own functionality following actors’ requests.
6. Post-conditions – PEID data are updated.
2.2.2) Reading PEID information
1. Purpose – Reading PEID information using information mobile device 2. Actors – Product user, production system, production engineer, maintenance/service
engineer, and EOL actors 3. Pre-conditions – Communication with PEID and field DB or PDKM should be available. 4. Triggers – Each actor uses a PEID reader to get information of each part or component. 5. Primary flow 1) Requesting necessary data to PEID
2) Receiving requested data from PEID and storing them into its own memory 3) Transmitting necessary data to field DB or PDKM
1) PEID reader assesses to field DB or PDKM. 2) Requesting some information to field DB or PDKM. 3) Receiving requested information from field DB or PDKM.
6. Post-conditions – Information of PEID reader is updated.
2.2.3) Storing data into DB
1. Purpose – Storing data gathered by sensors to Field DB 2. Actors – Service/maintenance engineer, design engineer, production engineer, EOL actors 3. Pre-conditions – Accessibility of this system should be confirmed. 4. Triggers – Lifecycle actors access to field info. database. 5. Primary flow 1) Communication unit accesses to field info. database.
2) Field info. database receives data via communication unit and stores them. 1) Each actor requests some data to field database.
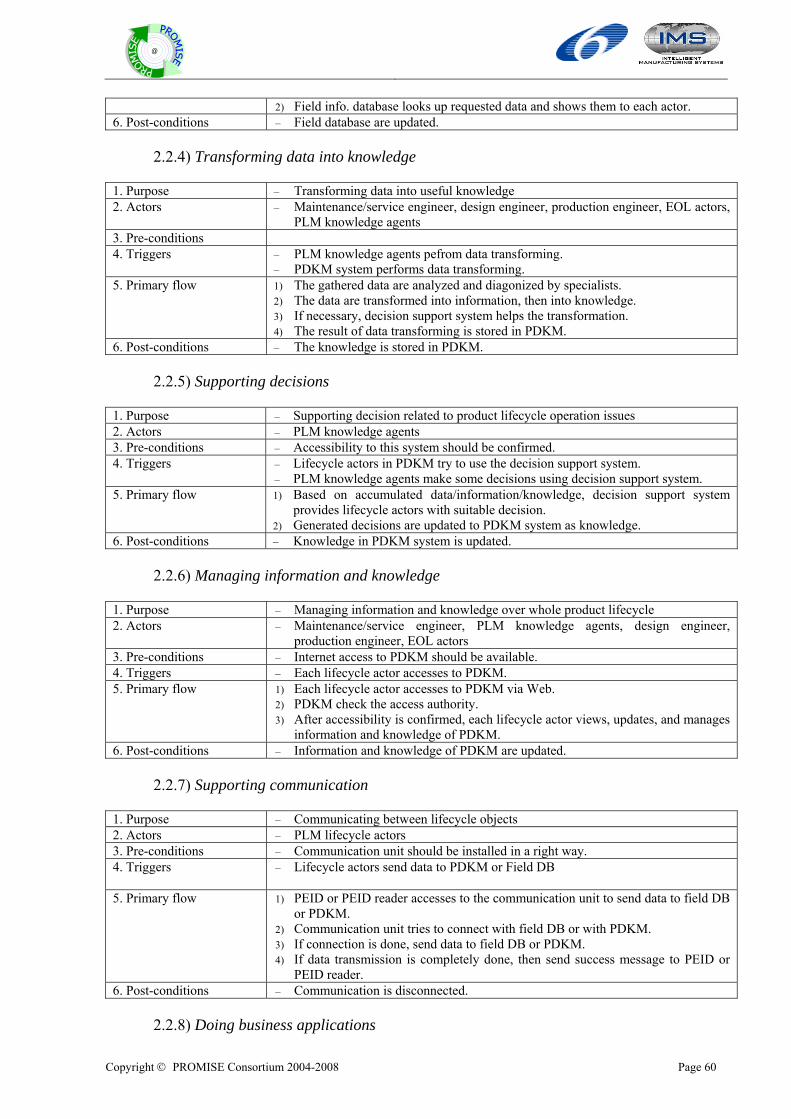
Copyright © PROMISE Consortium 2004-2008 Page 60
@
2) Field info. database looks up requested data and shows them to each actor. 6. Post-conditions – Field database are updated.
2.2.4) Transforming data into knowledge
1. Purpose – Transforming data into useful knowledge 2. Actors – Maintenance/service engineer, design engineer, production engineer, EOL actors,
PLM knowledge agents 3. Pre-conditions 4. Triggers – PLM knowledge agents pefrom data transforming.
– PDKM system performs data transforming. 5. Primary flow 1) The gathered data are analyzed and diagonized by specialists.
2) The data are transformed into information, then into knowledge. 3) If necessary, decision support system helps the transformation. 4) The result of data transforming is stored in PDKM.
6. Post-conditions – The knowledge is stored in PDKM.
2.2.5) Supporting decisions
1. Purpose – Supporting decision related to product lifecycle operation issues 2. Actors – PLM knowledge agents 3. Pre-conditions – Accessibility to this system should be confirmed. 4. Triggers – Lifecycle actors in PDKM try to use the decision support system.
– PLM knowledge agents make some decisions using decision support system. 5. Primary flow 1) Based on accumulated data/information/knowledge, decision support system
provides lifecycle actors with suitable decision. 2) Generated decisions are updated to PDKM system as knowledge.
6. Post-conditions – Knowledge in PDKM system is updated.
2.2.6) Managing information and knowledge
1. Purpose – Managing information and knowledge over whole product lifecycle 2. Actors – Maintenance/service engineer, PLM knowledge agents, design engineer,
production engineer, EOL actors 3. Pre-conditions – Internet access to PDKM should be available. 4. Triggers – Each lifecycle actor accesses to PDKM. 5. Primary flow 1) Each lifecycle actor accesses to PDKM via Web.
2) PDKM check the access authority. 3) After accessibility is confirmed, each lifecycle actor views, updates, and manages
information and knowledge of PDKM. 6. Post-conditions – Information and knowledge of PDKM are updated.
2.2.7) Supporting communication
1. Purpose – Communicating between lifecycle objects 2. Actors – PLM lifecycle actors 3. Pre-conditions – Communication unit should be installed in a right way. 4. Triggers – Lifecycle actors send data to PDKM or Field DB
5. Primary flow 1) PEID or PEID reader accesses to the communication unit to send data to field DB
or PDKM. 2) Communication unit tries to connect with field DB or with PDKM. 3) If connection is done, send data to field DB or PDKM. 4) If data transmission is completely done, then send success message to PEID or
PEID reader. 6. Post-conditions – Communication is disconnected.
2.2.8) Doing business applications
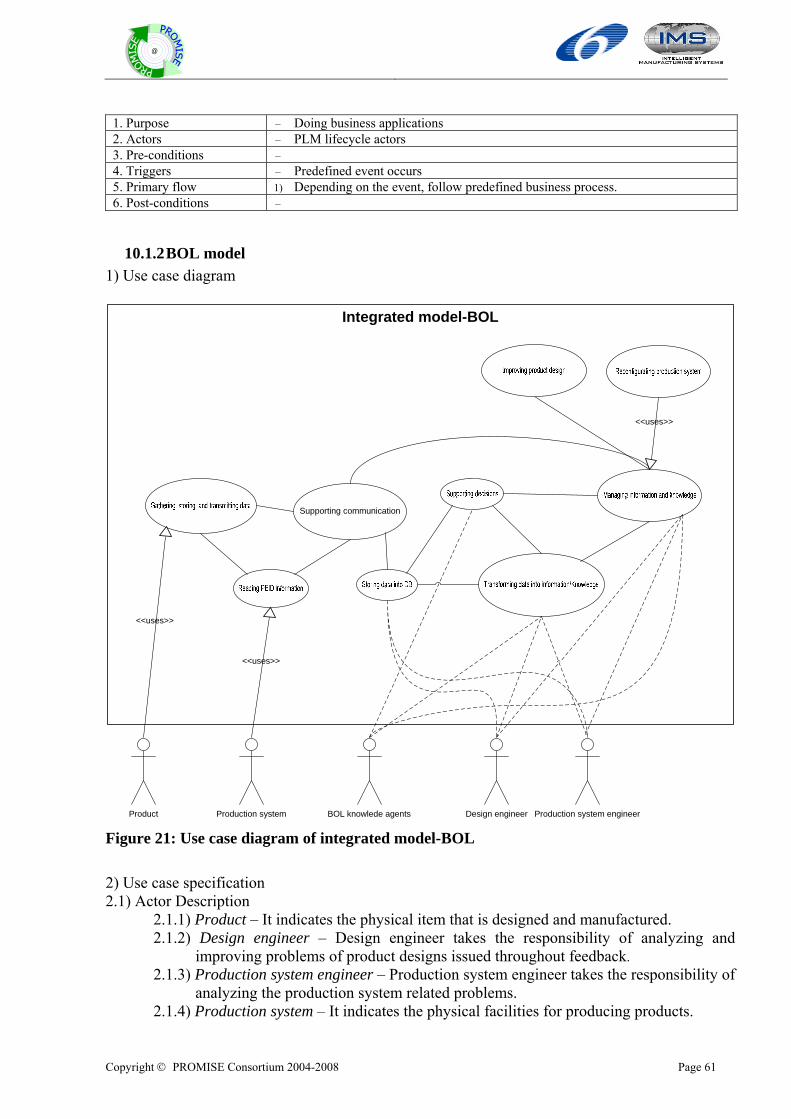
Copyright © PROMISE Consortium 2004-2008 Page 61
@
1. Purpose – Doing business applications 2. Actors – PLM lifecycle actors 3. Pre-conditions – 4. Triggers – Predefined event occurs 5. Primary flow 1) Depending on the event, follow predefined business process. 6. Post-conditions –
10.1.2 BOL model 1) Use case diagram
Design engineer
Integrated model-BOL
Product Production system engineer
<<uses>>
Supporting communication
<<uses>>
BOL knowlede agentsProduction system
<<uses>>
Figure 21: Use case diagram of integrated model-BOL 2) Use case specification 2.1) Actor Description 2.1.1) Product – It indicates the physical item that is designed and manufactured.
2.1.2) Design engineer – Design engineer takes the responsibility of analyzing and improving problems of product designs issued throughout feedback.
2.1.3) Production system engineer – Production system engineer takes the responsibility of analyzing the production system related problems.
2.1.4) Production system – It indicates the physical facilities for producing products.
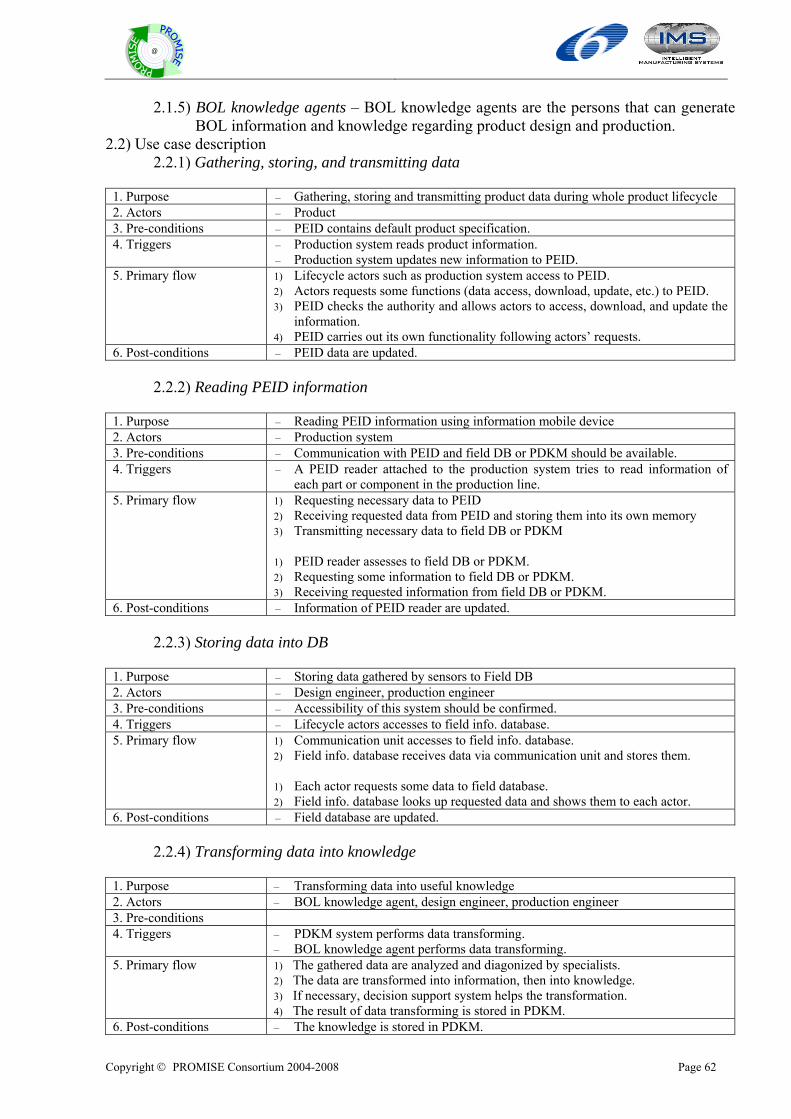
Copyright © PROMISE Consortium 2004-2008 Page 62
@
2.1.5) BOL knowledge agents – BOL knowledge agents are the persons that can generate BOL information and knowledge regarding product design and production.
2.2) Use case description 2.2.1) Gathering, storing, and transmitting data
1. Purpose – Gathering, storing and transmitting product data during whole product lifecycle 2. Actors – Product 3. Pre-conditions – PEID contains default product specification. 4. Triggers – Production system reads product information.
– Production system updates new information to PEID. 5. Primary flow 1) Lifecycle actors such as production system access to PEID.
2) Actors requests some functions (data access, download, update, etc.) to PEID. 3) PEID checks the authority and allows actors to access, download, and update the
information. 4) PEID carries out its own functionality following actors’ requests.
6. Post-conditions – PEID data are updated.
2.2.2) Reading PEID information
1. Purpose – Reading PEID information using information mobile device 2. Actors – Production system 3. Pre-conditions – Communication with PEID and field DB or PDKM should be available. 4. Triggers – A PEID reader attached to the production system tries to read information of
each part or component in the production line. 5. Primary flow 1) Requesting necessary data to PEID
2) Receiving requested data from PEID and storing them into its own memory 3) Transmitting necessary data to field DB or PDKM 1) PEID reader assesses to field DB or PDKM. 2) Requesting some information to field DB or PDKM. 3) Receiving requested information from field DB or PDKM.
6. Post-conditions – Information of PEID reader are updated.
2.2.3) Storing data into DB
1. Purpose – Storing data gathered by sensors to Field DB 2. Actors – Design engineer, production engineer 3. Pre-conditions – Accessibility of this system should be confirmed. 4. Triggers – Lifecycle actors accesses to field info. database. 5. Primary flow 1) Communication unit accesses to field info. database.
2) Field info. database receives data via communication unit and stores them. 1) Each actor requests some data to field database. 2) Field info. database looks up requested data and shows them to each actor.
6. Post-conditions – Field database are updated.
2.2.4) Transforming data into knowledge
1. Purpose – Transforming data into useful knowledge 2. Actors – BOL knowledge agent, design engineer, production engineer 3. Pre-conditions 4. Triggers – PDKM system performs data transforming.
– BOL knowledge agent performs data transforming. 5. Primary flow 1) The gathered data are analyzed and diagonized by specialists.
2) The data are transformed into information, then into knowledge. 3) If necessary, decision support system helps the transformation. 4) The result of data transforming is stored in PDKM.
6. Post-conditions – The knowledge is stored in PDKM.
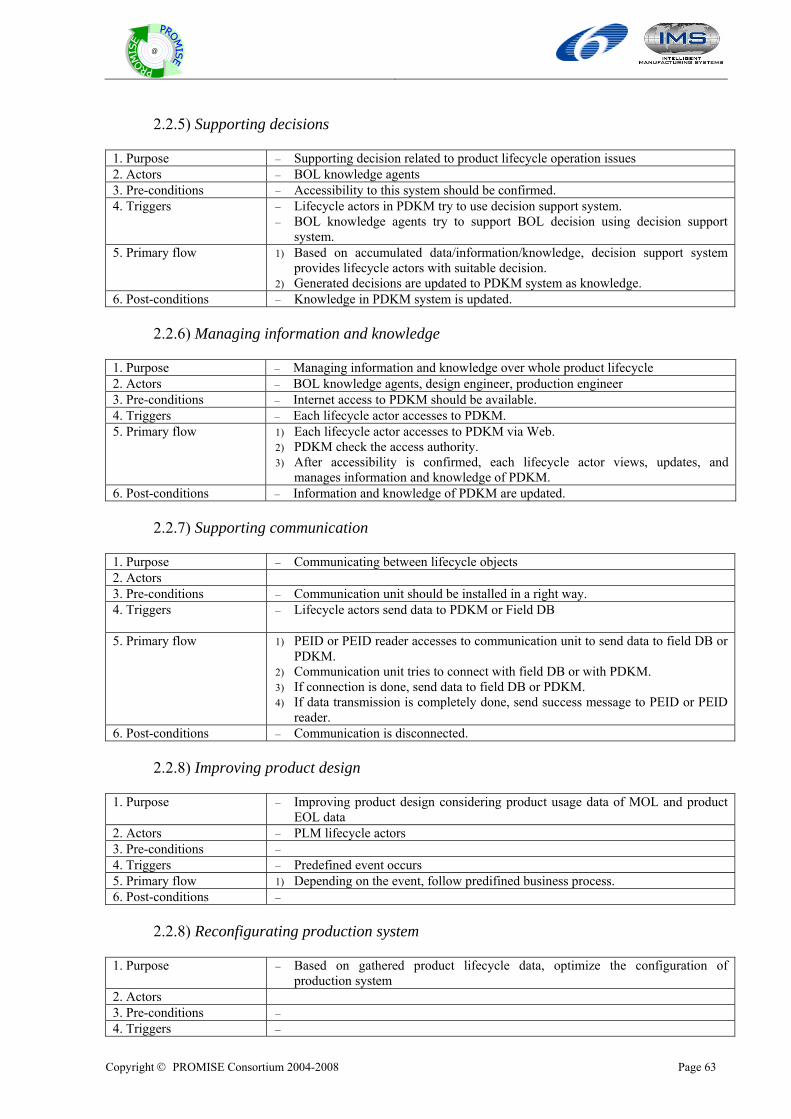
Copyright © PROMISE Consortium 2004-2008 Page 63
@
2.2.5) Supporting decisions
1. Purpose – Supporting decision related to product lifecycle operation issues 2. Actors – BOL knowledge agents 3. Pre-conditions – Accessibility to this system should be confirmed. 4. Triggers – Lifecycle actors in PDKM try to use decision support system.
– BOL knowledge agents try to support BOL decision using decision support system.
5. Primary flow 1) Based on accumulated data/information/knowledge, decision support system provides lifecycle actors with suitable decision.
2) Generated decisions are updated to PDKM system as knowledge. 6. Post-conditions – Knowledge in PDKM system is updated.
2.2.6) Managing information and knowledge
1. Purpose – Managing information and knowledge over whole product lifecycle 2. Actors – BOL knowledge agents, design engineer, production engineer 3. Pre-conditions – Internet access to PDKM should be available. 4. Triggers – Each lifecycle actor accesses to PDKM. 5. Primary flow 1) Each lifecycle actor accesses to PDKM via Web.
2) PDKM check the access authority. 3) After accessibility is confirmed, each lifecycle actor views, updates, and
manages information and knowledge of PDKM. 6. Post-conditions – Information and knowledge of PDKM are updated.
2.2.7) Supporting communication
1. Purpose – Communicating between lifecycle objects 2. Actors 3. Pre-conditions – Communication unit should be installed in a right way. 4. Triggers – Lifecycle actors send data to PDKM or Field DB
5. Primary flow 1) PEID or PEID reader accesses to communication unit to send data to field DB or
PDKM. 2) Communication unit tries to connect with field DB or with PDKM. 3) If connection is done, send data to field DB or PDKM. 4) If data transmission is completely done, send success message to PEID or PEID
reader. 6. Post-conditions – Communication is disconnected.
2.2.8) Improving product design
1. Purpose – Improving product design considering product usage data of MOL and product
EOL data 2. Actors – PLM lifecycle actors 3. Pre-conditions – 4. Triggers – Predefined event occurs 5. Primary flow 1) Depending on the event, follow predifined business process. 6. Post-conditions –
2.2.8) Reconfigurating production system
1. Purpose – Based on gathered product lifecycle data, optimize the configuration of
production system 2. Actors 3. Pre-conditions – 4. Triggers –
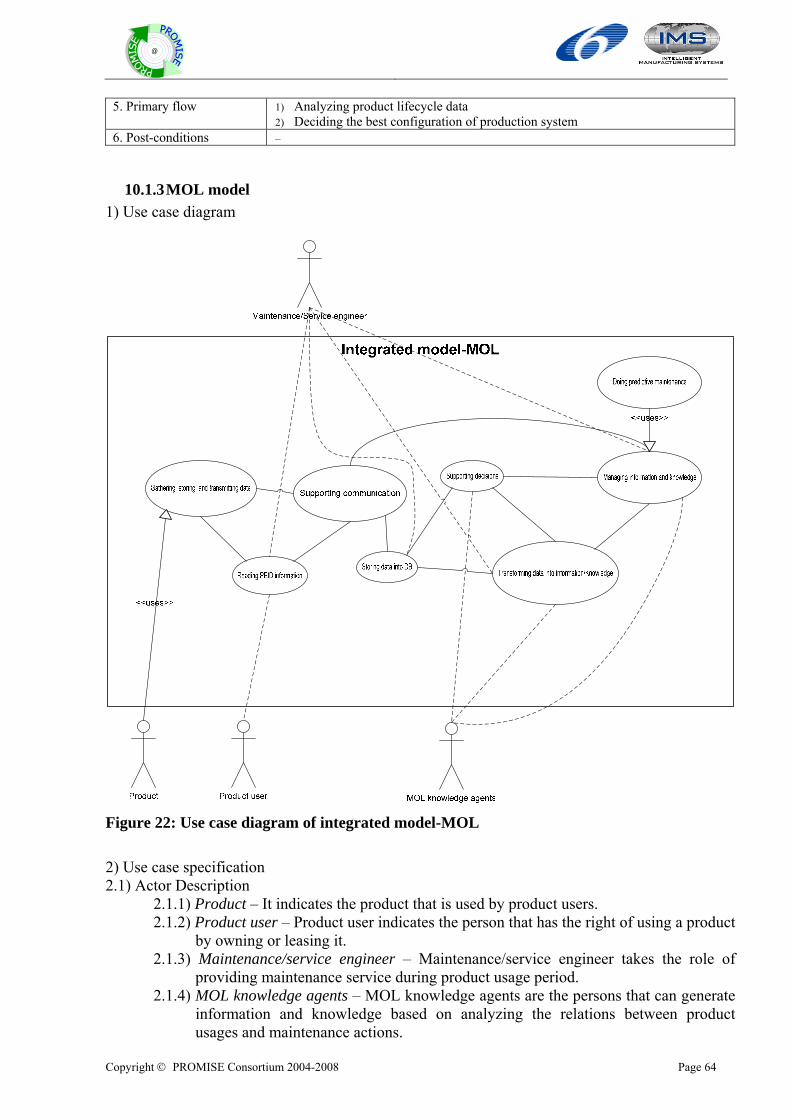
Copyright © PROMISE Consortium 2004-2008 Page 64
@
5. Primary flow 1) Analyzing product lifecycle data 2) Deciding the best configuration of production system
6. Post-conditions –
10.1.3 MOL model 1) Use case diagram
Figure 22: Use case diagram of integrated model-MOL 2) Use case specification 2.1) Actor Description 2.1.1) Product – It indicates the product that is used by product users.
2.1.2) Product user – Product user indicates the person that has the right of using a product by owning or leasing it.
2.1.3) Maintenance/service engineer – Maintenance/service engineer takes the role of providing maintenance service during product usage period.
2.1.4) MOL knowledge agents – MOL knowledge agents are the persons that can generate information and knowledge based on analyzing the relations between product usages and maintenance actions.
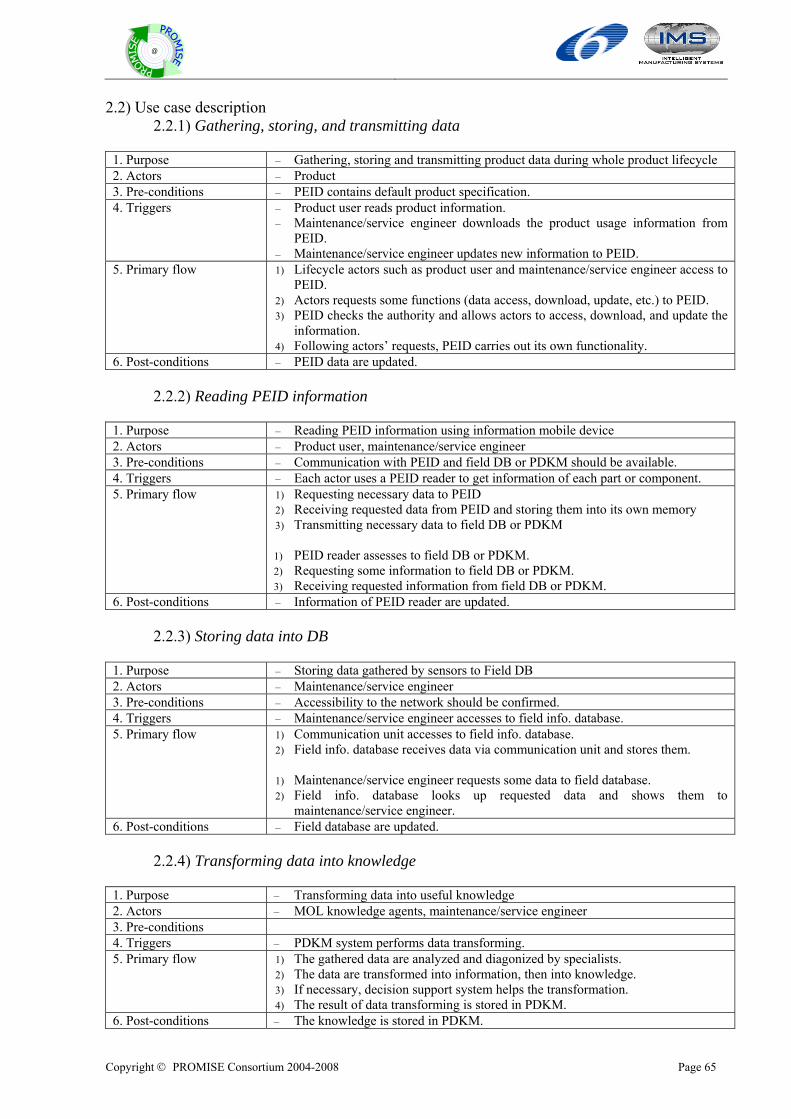
Copyright © PROMISE Consortium 2004-2008 Page 65
@
2.2) Use case description 2.2.1) Gathering, storing, and transmitting data
1. Purpose – Gathering, storing and transmitting product data during whole product lifecycle 2. Actors – Product 3. Pre-conditions – PEID contains default product specification. 4. Triggers – Product user reads product information.
– Maintenance/service engineer downloads the product usage information from PEID.
– Maintenance/service engineer updates new information to PEID. 5. Primary flow 1) Lifecycle actors such as product user and maintenance/service engineer access to
PEID. 2) Actors requests some functions (data access, download, update, etc.) to PEID. 3) PEID checks the authority and allows actors to access, download, and update the
information. 4) Following actors’ requests, PEID carries out its own functionality.
6. Post-conditions – PEID data are updated.
2.2.2) Reading PEID information
1. Purpose – Reading PEID information using information mobile device 2. Actors – Product user, maintenance/service engineer 3. Pre-conditions – Communication with PEID and field DB or PDKM should be available. 4. Triggers – Each actor uses a PEID reader to get information of each part or component. 5. Primary flow 1) Requesting necessary data to PEID
2) Receiving requested data from PEID and storing them into its own memory 3) Transmitting necessary data to field DB or PDKM 1) PEID reader assesses to field DB or PDKM. 2) Requesting some information to field DB or PDKM. 3) Receiving requested information from field DB or PDKM.
6. Post-conditions – Information of PEID reader are updated.
2.2.3) Storing data into DB
1. Purpose – Storing data gathered by sensors to Field DB 2. Actors – Maintenance/service engineer 3. Pre-conditions – Accessibility to the network should be confirmed. 4. Triggers – Maintenance/service engineer accesses to field info. database. 5. Primary flow 1) Communication unit accesses to field info. database.
2) Field info. database receives data via communication unit and stores them. 1) Maintenance/service engineer requests some data to field database. 2) Field info. database looks up requested data and shows them to
maintenance/service engineer. 6. Post-conditions – Field database are updated.
2.2.4) Transforming data into knowledge
1. Purpose – Transforming data into useful knowledge 2. Actors – MOL knowledge agents, maintenance/service engineer 3. Pre-conditions 4. Triggers – PDKM system performs data transforming. 5. Primary flow 1) The gathered data are analyzed and diagonized by specialists.
2) The data are transformed into information, then into knowledge. 3) If necessary, decision support system helps the transformation. 4) The result of data transforming is stored in PDKM.
6. Post-conditions – The knowledge is stored in PDKM.
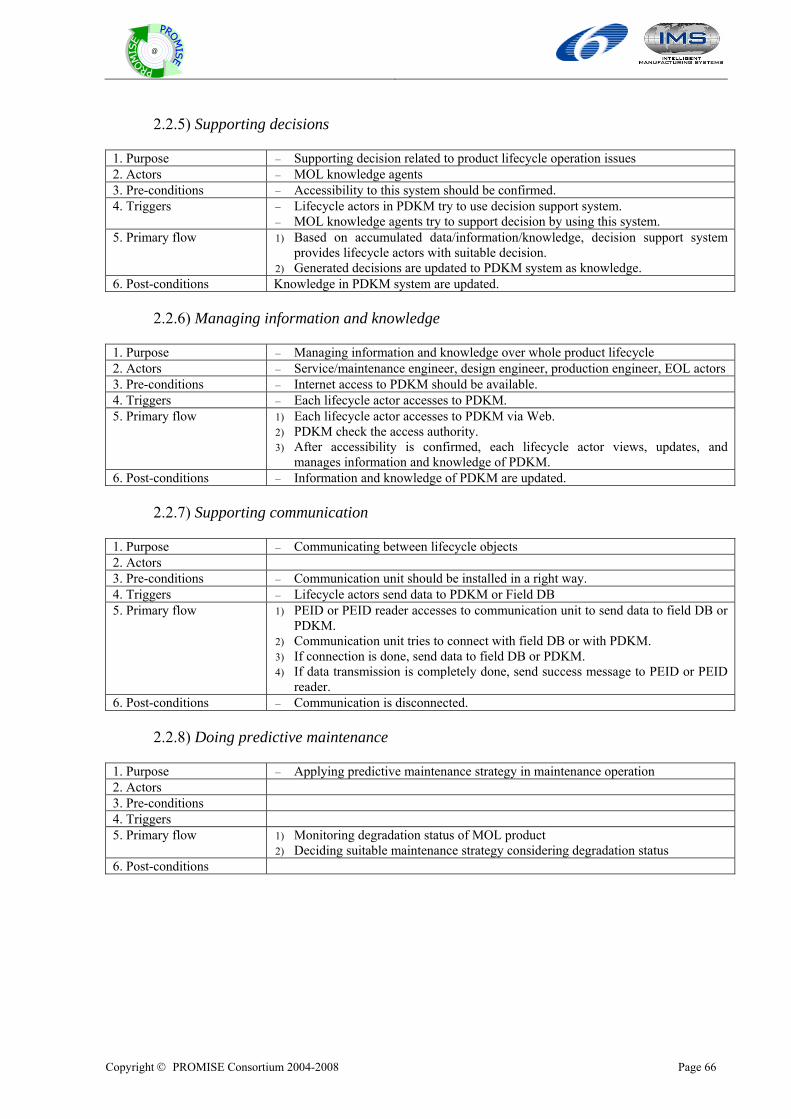
Copyright © PROMISE Consortium 2004-2008 Page 66
@
2.2.5) Supporting decisions
1. Purpose – Supporting decision related to product lifecycle operation issues 2. Actors – MOL knowledge agents 3. Pre-conditions – Accessibility to this system should be confirmed. 4. Triggers – Lifecycle actors in PDKM try to use decision support system.
– MOL knowledge agents try to support decision by using this system. 5. Primary flow 1) Based on accumulated data/information/knowledge, decision support system
provides lifecycle actors with suitable decision. 2) Generated decisions are updated to PDKM system as knowledge.
6. Post-conditions Knowledge in PDKM system are updated.
2.2.6) Managing information and knowledge
1. Purpose – Managing information and knowledge over whole product lifecycle 2. Actors – Service/maintenance engineer, design engineer, production engineer, EOL actors 3. Pre-conditions – Internet access to PDKM should be available. 4. Triggers – Each lifecycle actor accesses to PDKM. 5. Primary flow 1) Each lifecycle actor accesses to PDKM via Web.
2) PDKM check the access authority. 3) After accessibility is confirmed, each lifecycle actor views, updates, and
manages information and knowledge of PDKM. 6. Post-conditions – Information and knowledge of PDKM are updated.
2.2.7) Supporting communication
1. Purpose – Communicating between lifecycle objects 2. Actors 3. Pre-conditions – Communication unit should be installed in a right way. 4. Triggers – Lifecycle actors send data to PDKM or Field DB 5. Primary flow 1) PEID or PEID reader accesses to communication unit to send data to field DB or
PDKM. 2) Communication unit tries to connect with field DB or with PDKM. 3) If connection is done, send data to field DB or PDKM. 4) If data transmission is completely done, send success message to PEID or PEID
reader. 6. Post-conditions – Communication is disconnected.
2.2.8) Doing predictive maintenance
1. Purpose – Applying predictive maintenance strategy in maintenance operation 2. Actors 3. Pre-conditions 4. Triggers 5. Primary flow 1) Monitoring degradation status of MOL product
2) Deciding suitable maintenance strategy considering degradation status 6. Post-conditions
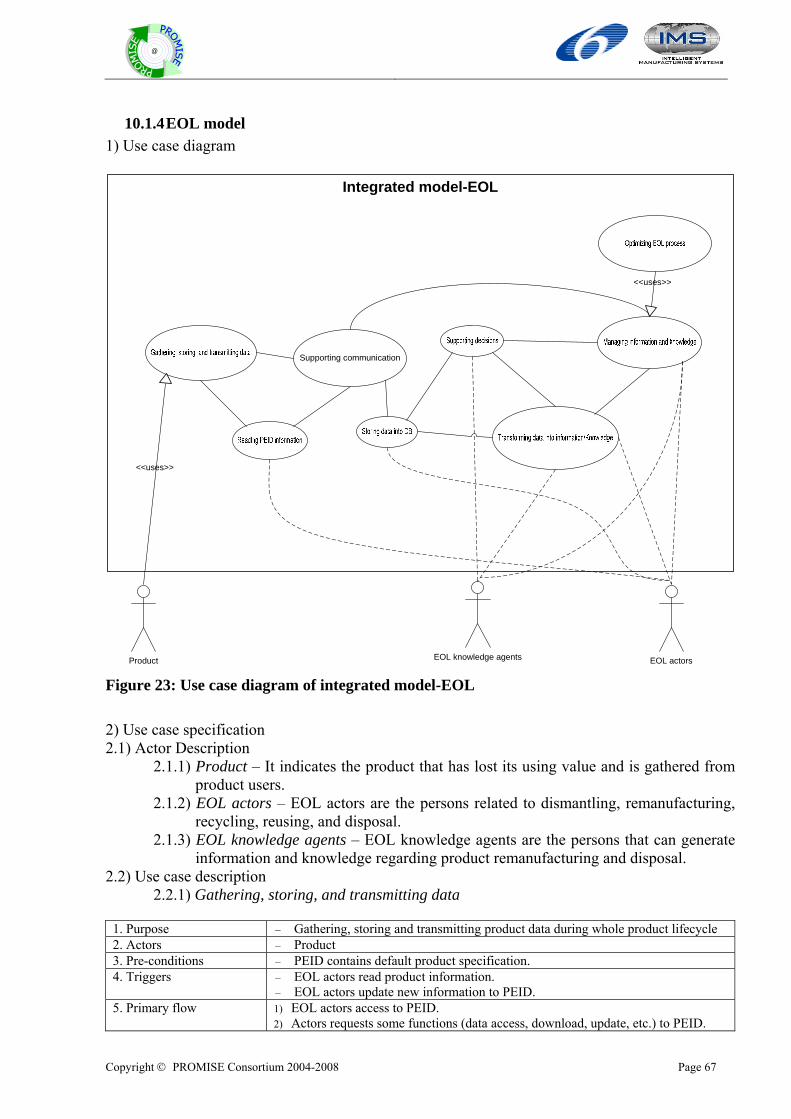
Copyright © PROMISE Consortium 2004-2008 Page 67
@
10.1.4 EOL model 1) Use case diagram
Integrated model-EOL
Product EOL actors
<<uses>>
Supporting communication
<<uses>>
EOL knowledge agents Figure 23: Use case diagram of integrated model-EOL 2) Use case specification 2.1) Actor Description
2.1.1) Product – It indicates the product that has lost its using value and is gathered from product users.
2.1.2) EOL actors – EOL actors are the persons related to dismantling, remanufacturing, recycling, reusing, and disposal.
2.1.3) EOL knowledge agents – EOL knowledge agents are the persons that can generate information and knowledge regarding product remanufacturing and disposal.
2.2) Use case description 2.2.1) Gathering, storing, and transmitting data
1. Purpose – Gathering, storing and transmitting product data during whole product lifecycle 2. Actors – Product 3. Pre-conditions – PEID contains default product specification. 4. Triggers – EOL actors read product information.
– EOL actors update new information to PEID. 5. Primary flow 1) EOL actors access to PEID.
2) Actors requests some functions (data access, download, update, etc.) to PEID.
Copyright © PROMISE Consortium 2004-2008 Page 68
@
3) PEID checks the authority and allows actors to access and download and update the information.
4) Following actors’ requests, PEID carries out its own functionality. 6. Post-conditions – PEID data are updated.
2.2.2) Reading PEID information
1. Purpose – Reading PEID information using information mobile device 2. Actors – EOL actors 3. Pre-conditions – Communication with PEID and field DB or PDKM should be available. 4. Triggers – EOL actors use a PEID reader to get information of each part or component. 5. Primary flow 1) Requesting necessary data to PEID
2) Receiving requested data from PEID and storing them into its own memory 3) Transmitting necessary data to field DB or PDKM 1) PEID reader assesses to field DB or PDKM. 2) Requesting some information to field DB or PDKM. 3) Receiving requested information from field DB or PDKM.
6. Post-conditions – Information of PEID reader are updated.
2.2.3) Storing data into DB
1. Purpose – Storing data gathered by sensors to Field DB 2. Actors – EOL actors 3. Pre-conditions – Accessibility of this system should be confirmed. 4. Triggers – Lifecycle actors accesses to field info. database. 5. Primary flow 1) Communication unit accesses to field info. database.
2) Field info. database receives data via communication unit and stores them. 1) Each actor requests some data to field database. 2) Field info. database looks up requested data and shows them to each actor.
6. Post-conditions – Field database are updated.
2.2.4) Transforming data into knowledge
1. Purpose – Transforming data into useful knowledge 2. Actors – EOL knowledge agents, EOL actors 3. Pre-conditions 4. Triggers – PDKM system performs data transforming. 5. Primary flow 1) The gathered data are analyzed and diagonized by specialists.
2) The data are transformed into information, then into knowledge. 3) If necessary, decision support system helps the transformation. 4) The result of data transforming is stored in PDKM.
6. Post-conditions – The knowledge is stored in PDKM.
2.2.5) Supporting decisions
1. Purpose – Supporting decision related to product lifecycle operation issues 2. Actors – EOL knowledge agents 3. Pre-conditions – Accessibility to this system should be confirmed. 4. Triggers – Lifecycle actors in PDKM try to use decision support system.
– EOL knowledge agents try to support decision using decision support system 5. Primary flow 1) Based on accumulated data/information/knowledge, decision support system
provides lifecycle actors with suitable decision. 2) Generated decisions are updated to PDKM system as knowledge.
6. Post-conditions – Knowledge in PDKM system is updated.
2.2.6) Managing information and knowledge
Copyright © PROMISE Consortium 2004-2008 Page 69
@
1. Purpose – Managing information and knowledge over whole product lifecycle 2. Actors – EOL Knowledge agents, EOL actors 3. Pre-conditions – Internet access to PDKM should be available. 4. Triggers – Each lifecycle actor accesses to PDKM. 5. Primary flow 1) Each lifecycle actor accesses to PDKM via Web.
2) PDKM check the access authority. 3) After accessibility is confirmed, each lifecycle actor views, updates, and
manages information and knowledge of PDKM. 6. Post-conditions – Information and knowledge of PDKM are updated.
2.2.7) Supporting communication
1. Purpose – Communicating between lifecycle objects 2. Actors 3. Pre-conditions – Communication unit should be installed in a right way. 4. Triggers – Lifecycle actors send data to PDKM or Field DB 5. Primary flow 1) PEID or PEID reader accesses to communication unit to send data to field DB or
PDKM. 2) Communication unit tries to connect with field DB or with PDKM. 3) If connection is done, send data to field DB or PDKM. 4) If data transmission is completely done, send success message to PEID or PEID
reader. 6. Post-conditions – Communication is disconnected.
2.2.8) Optimizing EOL process
1. Purpose – Optimizing EOL process through efficient EOL operations 2. Actors 3. Pre-conditions – EOL process should be defined. 4. Triggers 5. Primary flow 1) Evaluating the values of EOL products
2) Deciding the classification of EOL products for remanufacturing 6. Post-conditions
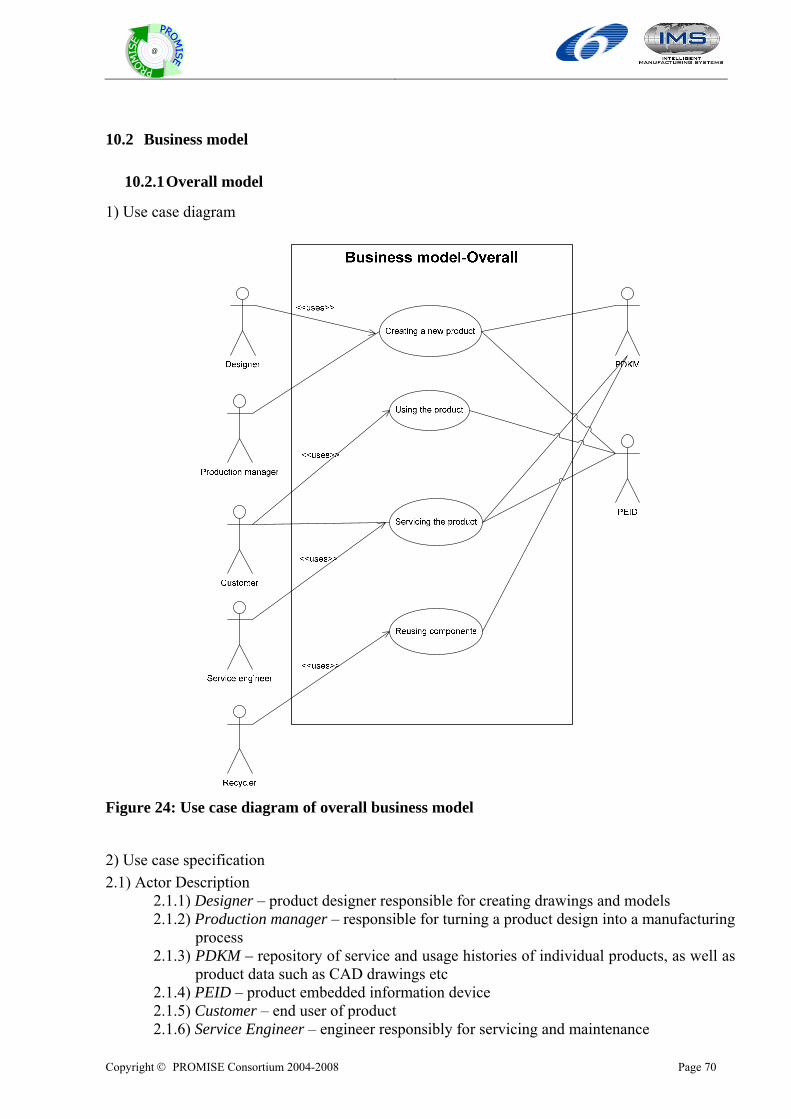
Copyright © PROMISE Consortium 2004-2008 Page 70
@
10.2 Business model
10.2.1 Overall model
1) Use case diagram
Figure 24: Use case diagram of overall business model
2) Use case specification 2.1) Actor Description 2.1.1) Designer – product designer responsible for creating drawings and models
2.1.2) Production manager – responsible for turning a product design into a manufacturing process
2.1.3) PDKM – repository of service and usage histories of individual products, as well as product data such as CAD drawings etc
2.1.4) PEID – product embedded information device 2.1.5) Customer – end user of product 2.1.6) Service Engineer – engineer responsibly for servicing and maintenance
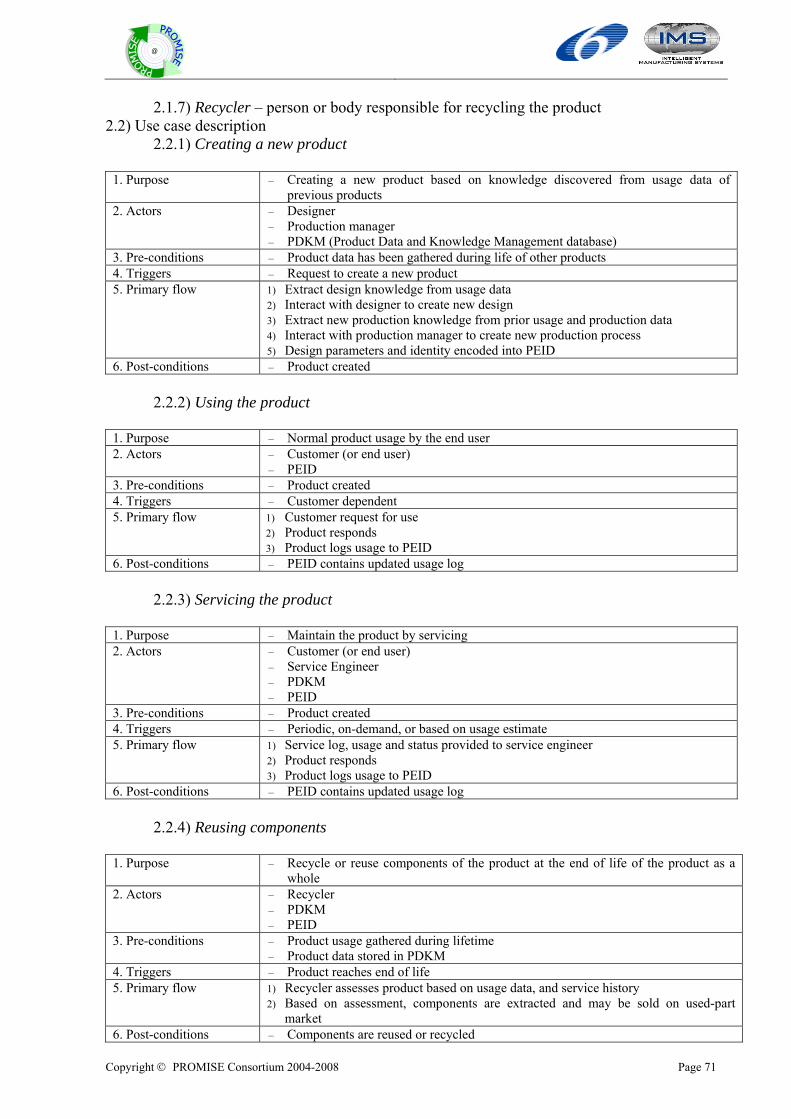
Copyright © PROMISE Consortium 2004-2008 Page 71
@
2.1.7) Recycler – person or body responsible for recycling the product 2.2) Use case description 2.2.1) Creating a new product
1. Purpose – Creating a new product based on knowledge discovered from usage data of previous products
2. Actors – Designer – Production manager – PDKM (Product Data and Knowledge Management database)
3. Pre-conditions – Product data has been gathered during life of other products 4. Triggers – Request to create a new product 5. Primary flow 1) Extract design knowledge from usage data
2) Interact with designer to create new design 3) Extract new production knowledge from prior usage and production data 4) Interact with production manager to create new production process 5) Design parameters and identity encoded into PEID
6. Post-conditions – Product created 2.2.2) Using the product
1. Purpose – Normal product usage by the end user 2. Actors – Customer (or end user)
– PEID 3. Pre-conditions – Product created 4. Triggers – Customer dependent 5. Primary flow 1) Customer request for use
2) Product responds 3) Product logs usage to PEID
6. Post-conditions – PEID contains updated usage log 2.2.3) Servicing the product
1. Purpose – Maintain the product by servicing 2. Actors – Customer (or end user)
– Service Engineer – PDKM – PEID
3. Pre-conditions – Product created 4. Triggers – Periodic, on-demand, or based on usage estimate 5. Primary flow 1) Service log, usage and status provided to service engineer
2) Product responds 3) Product logs usage to PEID
6. Post-conditions – PEID contains updated usage log 2.2.4) Reusing components
1. Purpose – Recycle or reuse components of the product at the end of life of the product as a whole
2. Actors – Recycler – PDKM – PEID
3. Pre-conditions – Product usage gathered during lifetime – Product data stored in PDKM
4. Triggers – Product reaches end of life 5. Primary flow 1) Recycler assesses product based on usage data, and service history
2) Based on assessment, components are extracted and may be sold on used-part market
6. Post-conditions – Components are reused or recycled
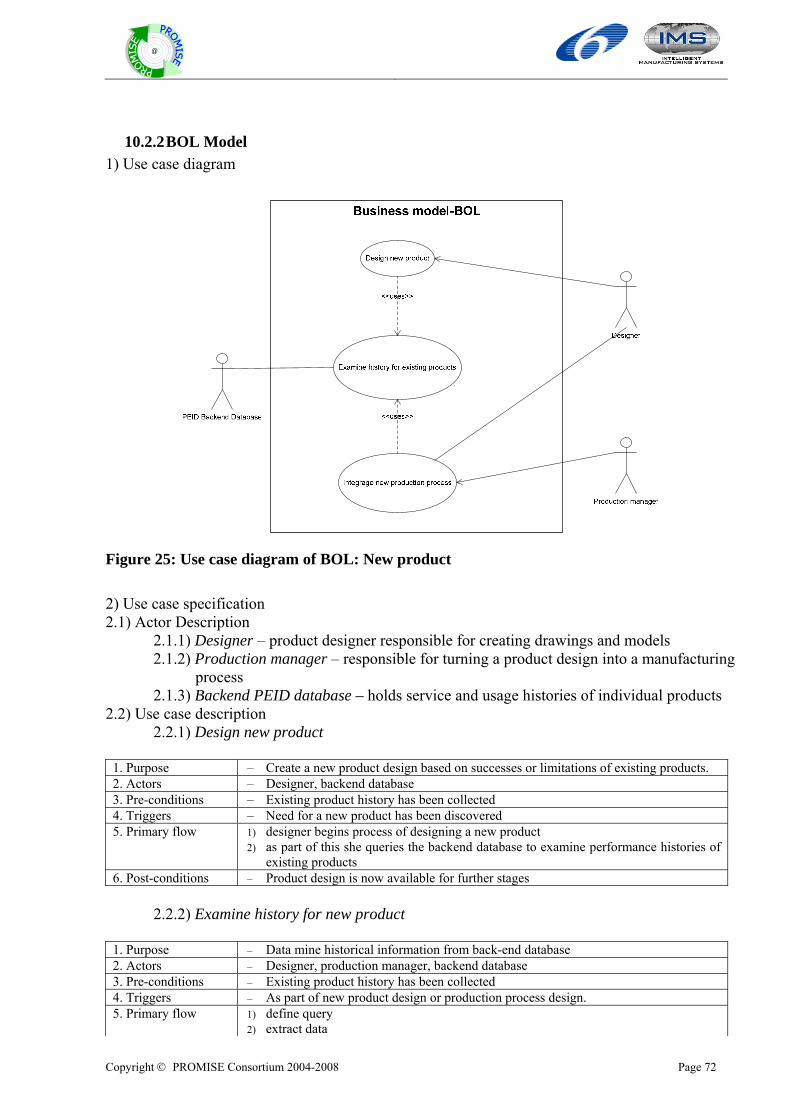
Copyright © PROMISE Consortium 2004-2008 Page 72
@
10.2.2 BOL Model 1) Use case diagram
Figure 25: Use case diagram of BOL: New product 2) Use case specification 2.1) Actor Description 2.1.1) Designer – product designer responsible for creating drawings and models
2.1.2) Production manager – responsible for turning a product design into a manufacturing process
2.1.3) Backend PEID database – holds service and usage histories of individual products 2.2) Use case description 2.2.1) Design new product
1. Purpose – Create a new product design based on successes or limitations of existing products. 2. Actors – Designer, backend database 3. Pre-conditions – Existing product history has been collected 4. Triggers – Need for a new product has been discovered 5. Primary flow 1) designer begins process of designing a new product
2) as part of this she queries the backend database to examine performance histories of existing products
6. Post-conditions – Product design is now available for further stages 2.2.2) Examine history for new product
1. Purpose – Data mine historical information from back-end database 2. Actors – Designer, production manager, backend database 3. Pre-conditions – Existing product history has been collected 4. Triggers – As part of new product design or production process design. 5. Primary flow 1) define query
2) extract data
Copyright © PROMISE Consortium 2004-2008 Page 73
@
6. Post-conditions – Product design is now available for further stages 2.2.3) Integrate new production process
1. Purpose – Alter existing or generate a new manufacturing process 2. Actors – Designer, production manager, backend database 3. Pre-conditions – Product has been designed 4. Triggers – New product design complete 5. Primary flow 1) Production manager (or team) designs a new production process
2) as part of this, they examine existing product history to help make design decisions 6. Post-conditions – New production process implemented
10.2.3 MOL Model 1) Use case diagram
View history
Service product
Approve repair
Product/PEID
Service Engineer
Customer
Backend system
Assess condition
Update historyNormal use
<<uses>>
<<uses>>
<<extends>>
Business model-MOL
Figure 26: Use case diagram of MOL: In situ maintenance 2) Use case specification 2.1) Actor Description 2.1.1) Service engineer – person or team responsible for servicing product 2.1.2) Product / PEID – combination of the product and the PEID 2.1.3) Back End – database or system typically associated with OEM 2.1.4) Customer – user of product 2.2) Use case description 2.2.1) Assess condition
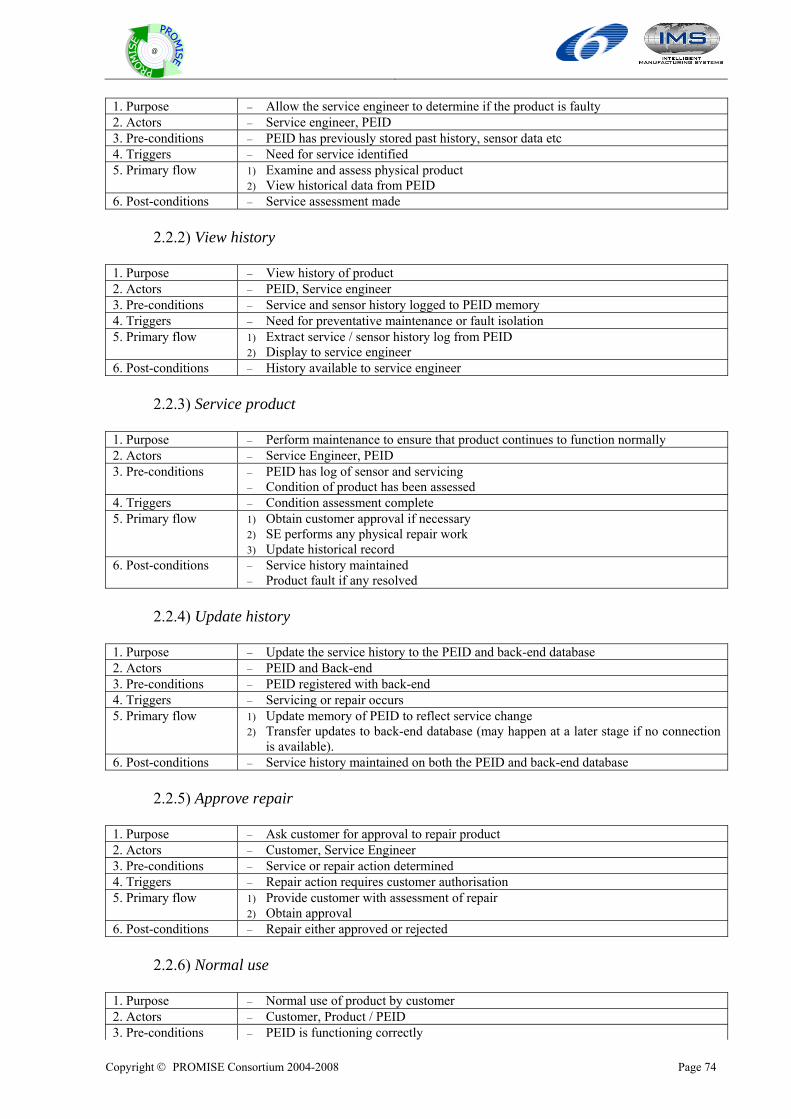
Copyright © PROMISE Consortium 2004-2008 Page 74
@
1. Purpose – Allow the service engineer to determine if the product is faulty 2. Actors – Service engineer, PEID 3. Pre-conditions – PEID has previously stored past history, sensor data etc 4. Triggers – Need for service identified 5. Primary flow 1) Examine and assess physical product
2) View historical data from PEID 6. Post-conditions – Service assessment made
2.2.2) View history
1. Purpose – View history of product 2. Actors – PEID, Service engineer 3. Pre-conditions – Service and sensor history logged to PEID memory 4. Triggers – Need for preventative maintenance or fault isolation 5. Primary flow 1) Extract service / sensor history log from PEID
2) Display to service engineer 6. Post-conditions – History available to service engineer
2.2.3) Service product
1. Purpose – Perform maintenance to ensure that product continues to function normally 2. Actors – Service Engineer, PEID 3. Pre-conditions – PEID has log of sensor and servicing
– Condition of product has been assessed 4. Triggers – Condition assessment complete 5. Primary flow 1) Obtain customer approval if necessary
2) SE performs any physical repair work 3) Update historical record
6. Post-conditions – Service history maintained – Product fault if any resolved
2.2.4) Update history
1. Purpose – Update the service history to the PEID and back-end database 2. Actors – PEID and Back-end 3. Pre-conditions – PEID registered with back-end 4. Triggers – Servicing or repair occurs 5. Primary flow 1) Update memory of PEID to reflect service change
2) Transfer updates to back-end database (may happen at a later stage if no connection is available).
6. Post-conditions – Service history maintained on both the PEID and back-end database 2.2.5) Approve repair
1. Purpose – Ask customer for approval to repair product 2. Actors – Customer, Service Engineer 3. Pre-conditions – Service or repair action determined 4. Triggers – Repair action requires customer authorisation 5. Primary flow 1) Provide customer with assessment of repair
2) Obtain approval 6. Post-conditions – Repair either approved or rejected
2.2.6) Normal use
1. Purpose – Normal use of product by customer 2. Actors – Customer, Product / PEID 3. Pre-conditions – PEID is functioning correctly
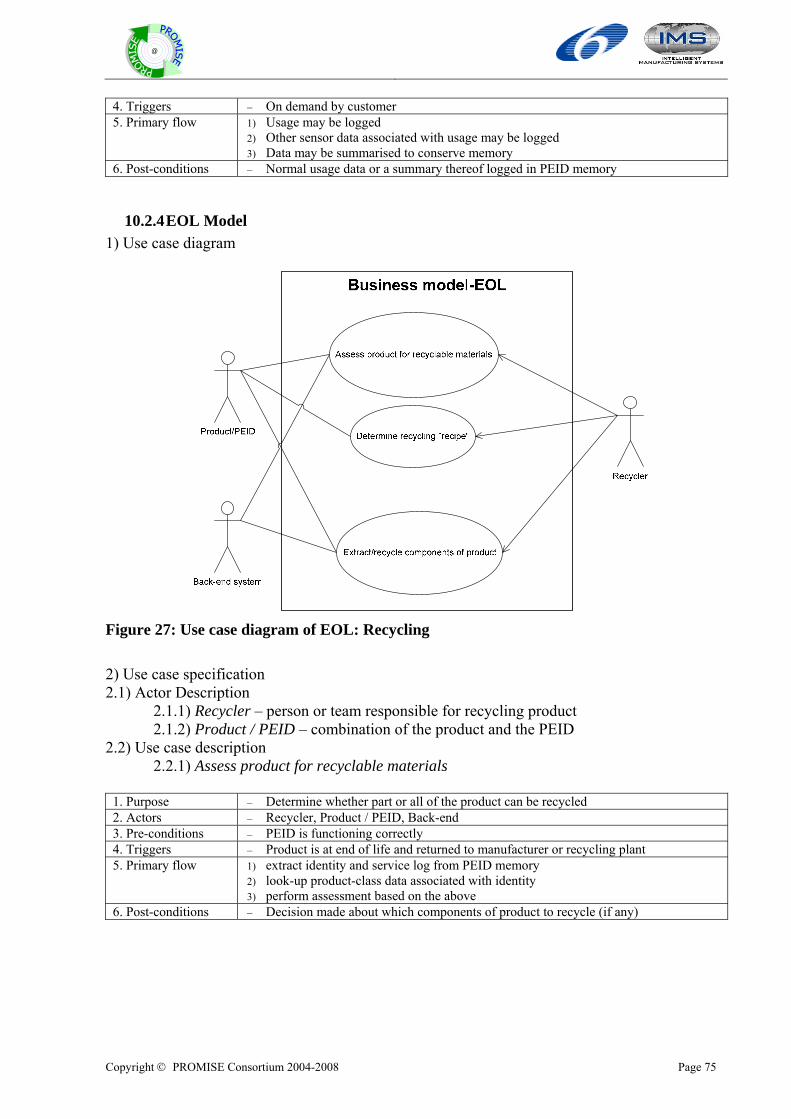
Copyright © PROMISE Consortium 2004-2008 Page 75
@
4. Triggers – On demand by customer 5. Primary flow 1) Usage may be logged
2) Other sensor data associated with usage may be logged 3) Data may be summarised to conserve memory
6. Post-conditions – Normal usage data or a summary thereof logged in PEID memory
10.2.4 EOL Model 1) Use case diagram
Figure 27: Use case diagram of EOL: Recycling 2) Use case specification 2.1) Actor Description 2.1.1) Recycler – person or team responsible for recycling product 2.1.2) Product / PEID – combination of the product and the PEID 2.2) Use case description 2.2.1) Assess product for recyclable materials
1. Purpose – Determine whether part or all of the product can be recycled 2. Actors – Recycler, Product / PEID, Back-end 3. Pre-conditions – PEID is functioning correctly 4. Triggers – Product is at end of life and returned to manufacturer or recycling plant 5. Primary flow 1) extract identity and service log from PEID memory
2) look-up product-class data associated with identity 3) perform assessment based on the above
6. Post-conditions – Decision made about which components of product to recycle (if any)
Copyright © PROMISE Consortium 2004-2008 Page 76
@
2.2.2) Determine recycling “recipe”
1. Purpose – Determine a process by which to recycle components of product 2. Actors – Recycler, PEID 3. Pre-conditions 4. Triggers – Recycling assessment complete 5. Primary flow 1) based on product-class information and recycling assessment, determine a sequence
of processing steps to perform this recycling (i.e. develop a plan or recipe) 2) schedule resources to perform the recycling
6. Post-conditions – Recipe generated 2.2.3) Extract / recycle components of a product
1. Purpose – Execute the recycling recipe 2. Actors – Product, Recycler, Back-end 3. Pre-conditions 4. Triggers – Recycling recipe generated 5. Primary flow 1) execute recipe / plan
2) update Back-end database to report product successfully recycled 6. Post-conditions – Product recycled
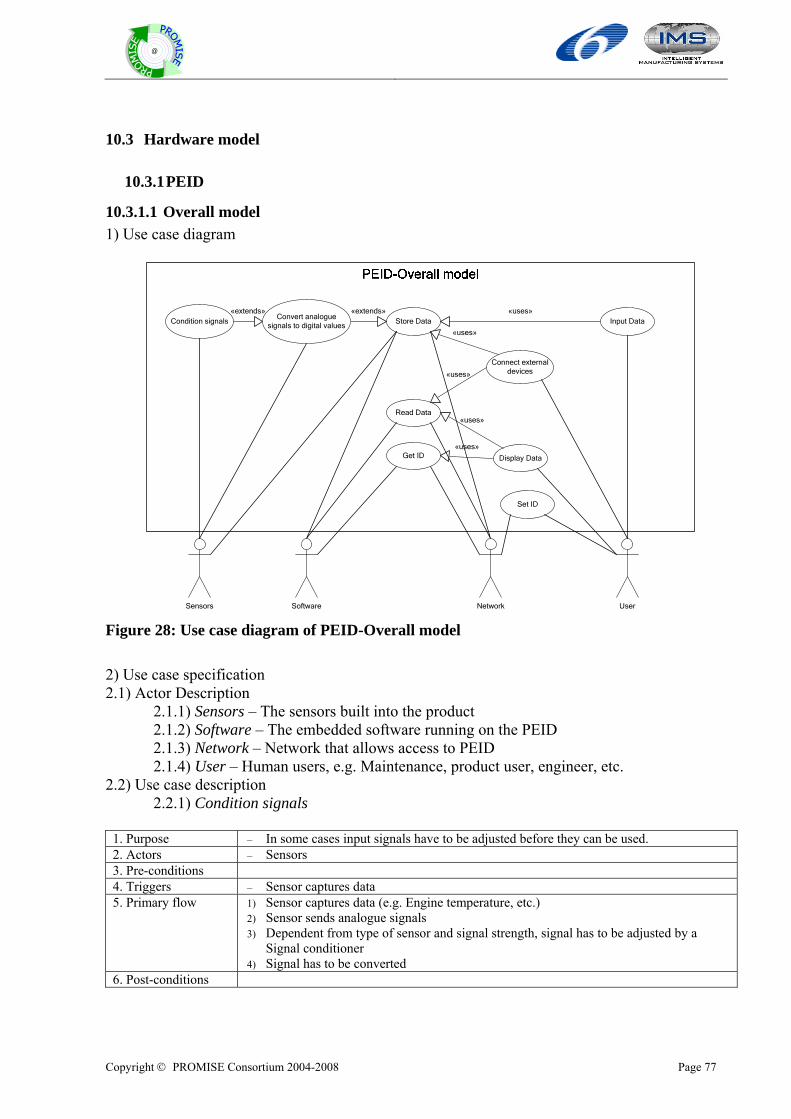
Copyright © PROMISE Consortium 2004-2008 Page 77
@
10.3 Hardware model
10.3.1 PEID
10.3.1.1 Overall model 1) Use case diagram
Get ID
Store Data
Read Data
Display Data
Input DataCondition signals«extends» «extends»
Sensors Software UserNetwork
«uses»
«uses»
«uses»
Connect externaldevices
«uses»
«uses»
Convert analoguesignals to digital values
Set ID
Figure 28: Use case diagram of PEID-Overall model 2) Use case specification 2.1) Actor Description
2.1.1) Sensors – The sensors built into the product 2.1.2) Software – The embedded software running on the PEID
2.1.3) Network – Network that allows access to PEID 2.1.4) User – Human users, e.g. Maintenance, product user, engineer, etc. 2.2) Use case description
2.2.1) Condition signals
1. Purpose – In some cases input signals have to be adjusted before they can be used. 2. Actors – Sensors 3. Pre-conditions 4. Triggers – Sensor captures data 5. Primary flow 1) Sensor captures data (e.g. Engine temperature, etc.)
2) Sensor sends analogue signals 3) Dependent from type of sensor and signal strength, signal has to be adjusted by a
Signal conditioner 4) Signal has to be converted
6. Post-conditions
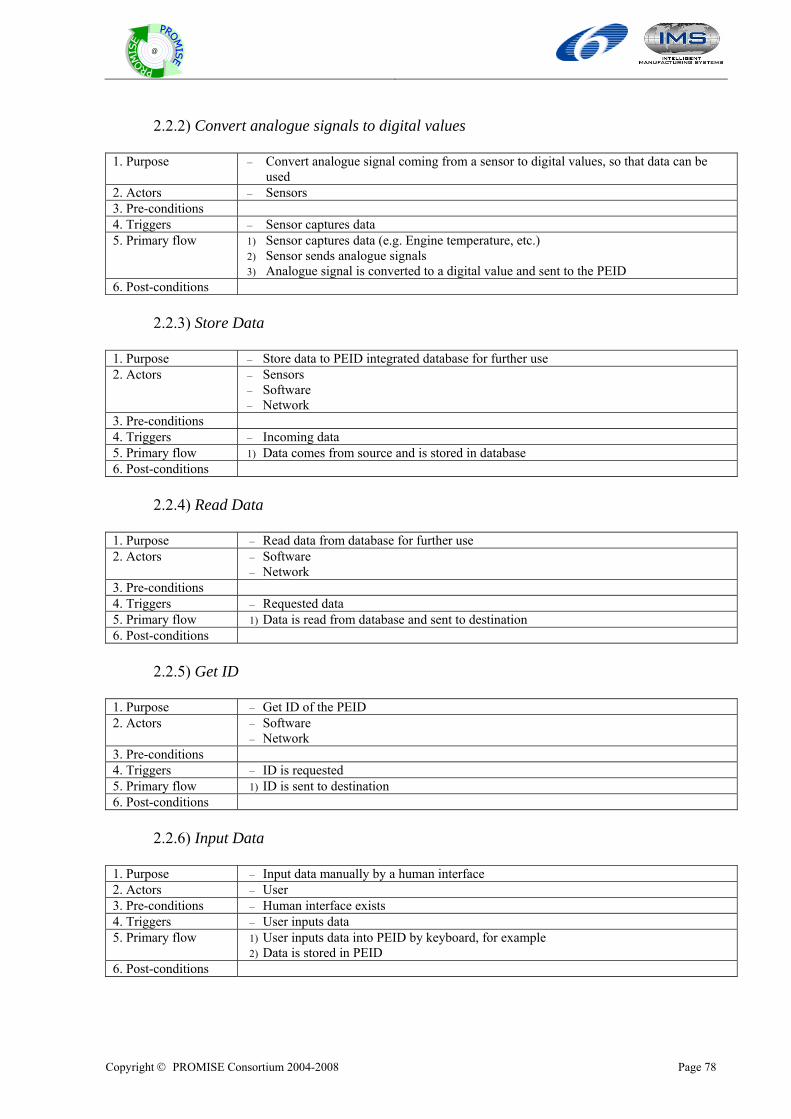
Copyright © PROMISE Consortium 2004-2008 Page 78
@
2.2.2) Convert analogue signals to digital values
1. Purpose – Convert analogue signal coming from a sensor to digital values, so that data can be used
2. Actors – Sensors 3. Pre-conditions 4. Triggers – Sensor captures data 5. Primary flow 1) Sensor captures data (e.g. Engine temperature, etc.)
2) Sensor sends analogue signals 3) Analogue signal is converted to a digital value and sent to the PEID
6. Post-conditions
2.2.3) Store Data
1. Purpose – Store data to PEID integrated database for further use 2. Actors – Sensors
– Software – Network
3. Pre-conditions 4. Triggers – Incoming data 5. Primary flow 1) Data comes from source and is stored in database 6. Post-conditions
2.2.4) Read Data
1. Purpose – Read data from database for further use 2. Actors – Software
– Network 3. Pre-conditions 4. Triggers – Requested data 5. Primary flow 1) Data is read from database and sent to destination 6. Post-conditions
2.2.5) Get ID
1. Purpose – Get ID of the PEID 2. Actors – Software
– Network 3. Pre-conditions 4. Triggers – ID is requested 5. Primary flow 1) ID is sent to destination 6. Post-conditions
2.2.6) Input Data
1. Purpose – Input data manually by a human interface 2. Actors – User 3. Pre-conditions – Human interface exists 4. Triggers – User inputs data 5. Primary flow 1) User inputs data into PEID by keyboard, for example
2) Data is stored in PEID 6. Post-conditions
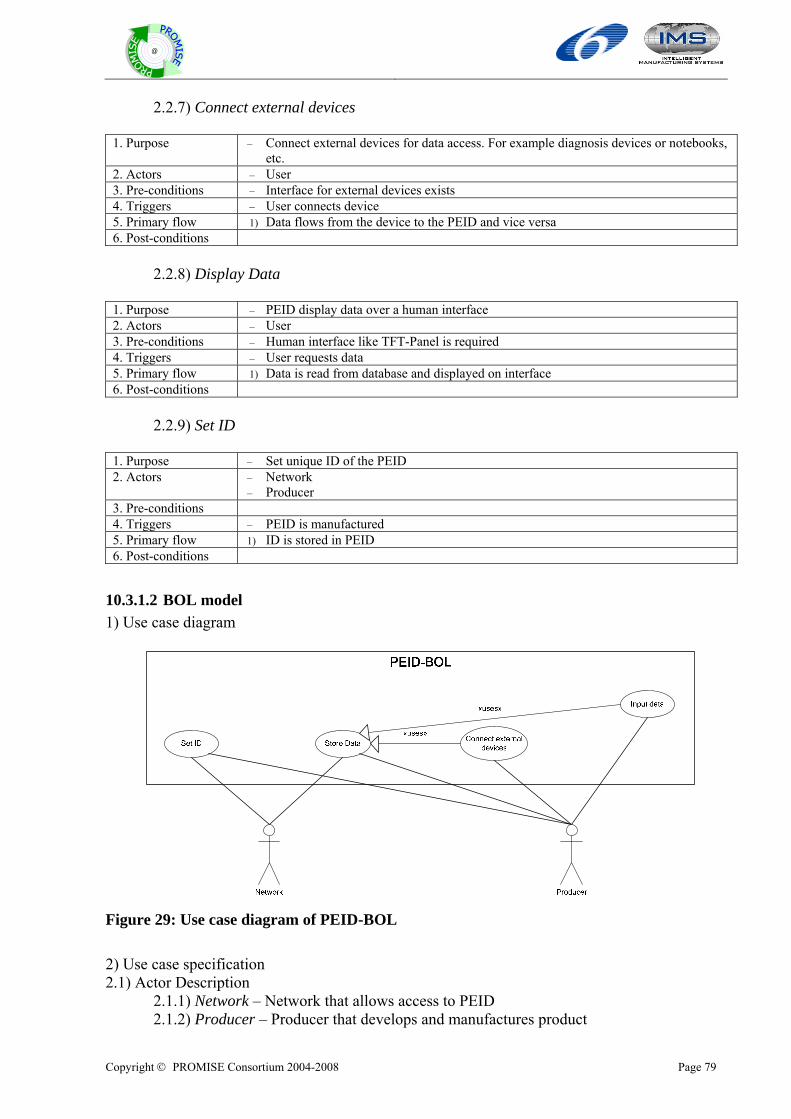
Copyright © PROMISE Consortium 2004-2008 Page 79
@
2.2.7) Connect external devices
1. Purpose – Connect external devices for data access. For example diagnosis devices or notebooks, etc.
2. Actors – User 3. Pre-conditions – Interface for external devices exists 4. Triggers – User connects device 5. Primary flow 1) Data flows from the device to the PEID and vice versa 6. Post-conditions
2.2.8) Display Data
1. Purpose – PEID display data over a human interface 2. Actors – User 3. Pre-conditions – Human interface like TFT-Panel is required 4. Triggers – User requests data 5. Primary flow 1) Data is read from database and displayed on interface 6. Post-conditions
2.2.9) Set ID
1. Purpose – Set unique ID of the PEID 2. Actors – Network
– Producer 3. Pre-conditions 4. Triggers – PEID is manufactured 5. Primary flow 1) ID is stored in PEID 6. Post-conditions
10.3.1.2 BOL model 1) Use case diagram
Figure 29: Use case diagram of PEID-BOL 2) Use case specification 2.1) Actor Description
2.1.1) Network – Network that allows access to PEID 2.1.2) Producer – Producer that develops and manufactures product
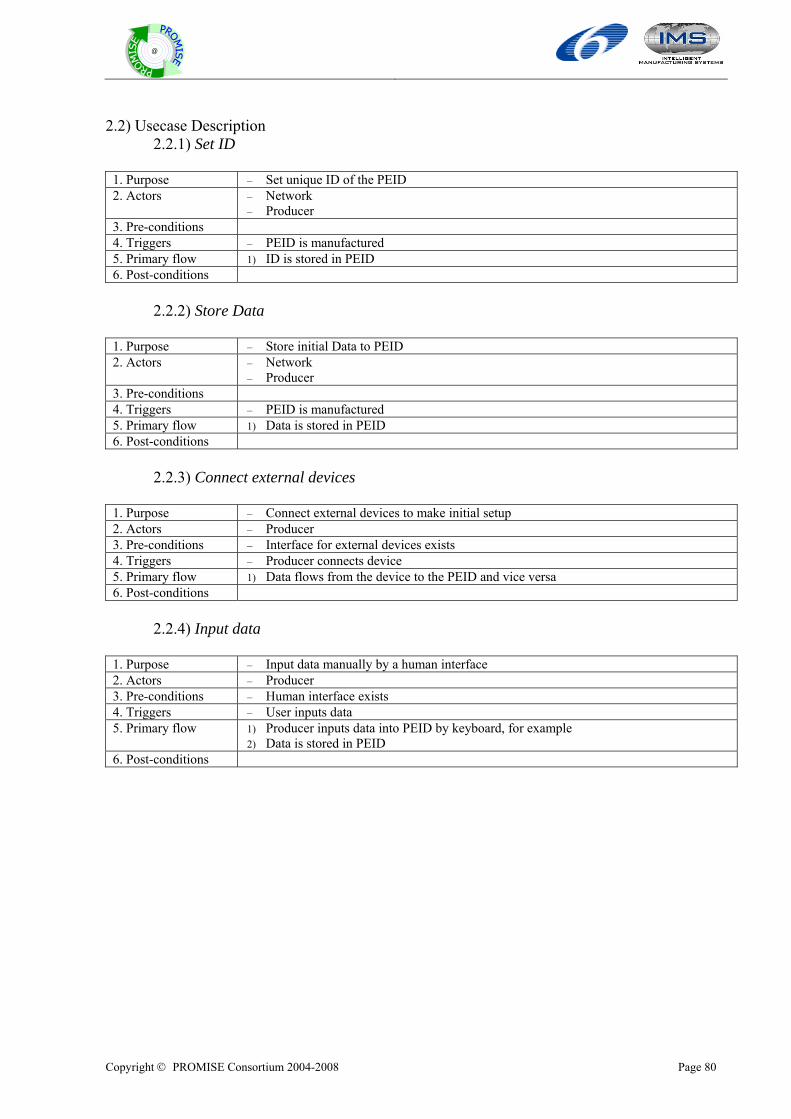
Copyright © PROMISE Consortium 2004-2008 Page 80
@
2.2) Usecase Description
2.2.1) Set ID
1. Purpose – Set unique ID of the PEID 2. Actors – Network
– Producer 3. Pre-conditions 4. Triggers – PEID is manufactured 5. Primary flow 1) ID is stored in PEID 6. Post-conditions
2.2.2) Store Data
1. Purpose – Store initial Data to PEID 2. Actors – Network
– Producer 3. Pre-conditions 4. Triggers – PEID is manufactured 5. Primary flow 1) Data is stored in PEID 6. Post-conditions
2.2.3) Connect external devices
1. Purpose – Connect external devices to make initial setup 2. Actors – Producer 3. Pre-conditions – Interface for external devices exists 4. Triggers – Producer connects device 5. Primary flow 1) Data flows from the device to the PEID and vice versa 6. Post-conditions
2.2.4) Input data
1. Purpose – Input data manually by a human interface 2. Actors – Producer 3. Pre-conditions – Human interface exists 4. Triggers – User inputs data 5. Primary flow 1) Producer inputs data into PEID by keyboard, for example
2) Data is stored in PEID 6. Post-conditions
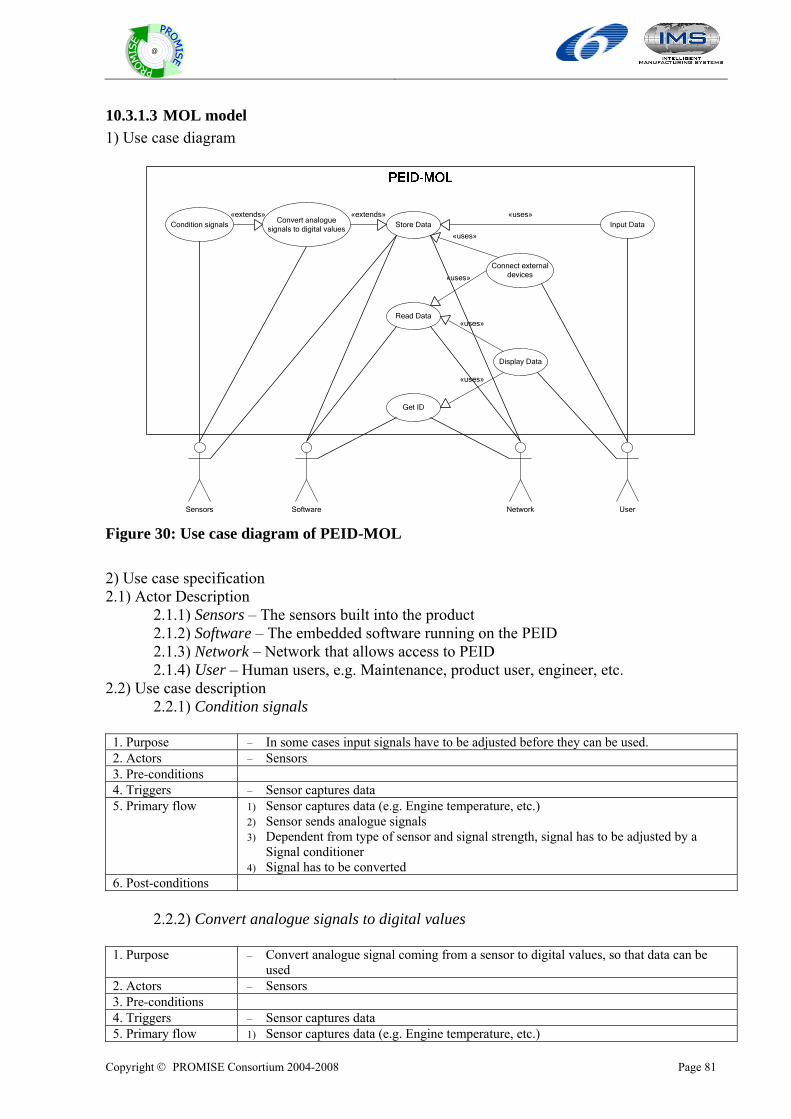
Copyright © PROMISE Consortium 2004-2008 Page 81
@
10.3.1.3 MOL model 1) Use case diagram
Get ID
Store Data
Read Data
Display Data
Input DataCondition signals«extends» «extends»
Sensors Software UserNetwork
«uses»
«uses»
«uses»
Connect externaldevices
«uses»
«uses»
Convert analoguesignals to digital values
Figure 30: Use case diagram of PEID-MOL 2) Use case specification 2.1) Actor Description
2.1.1) Sensors – The sensors built into the product 2.1.2) Software – The embedded software running on the PEID 2.1.3) Network – Network that allows access to PEID 2.1.4) User – Human users, e.g. Maintenance, product user, engineer, etc.
2.2) Use case description 2.2.1) Condition signals
1. Purpose – In some cases input signals have to be adjusted before they can be used. 2. Actors – Sensors 3. Pre-conditions 4. Triggers – Sensor captures data 5. Primary flow 1) Sensor captures data (e.g. Engine temperature, etc.)
2) Sensor sends analogue signals 3) Dependent from type of sensor and signal strength, signal has to be adjusted by a
Signal conditioner 4) Signal has to be converted
6. Post-conditions 2.2.2) Convert analogue signals to digital values
1. Purpose – Convert analogue signal coming from a sensor to digital values, so that data can be used
2. Actors – Sensors 3. Pre-conditions 4. Triggers – Sensor captures data 5. Primary flow 1) Sensor captures data (e.g. Engine temperature, etc.)
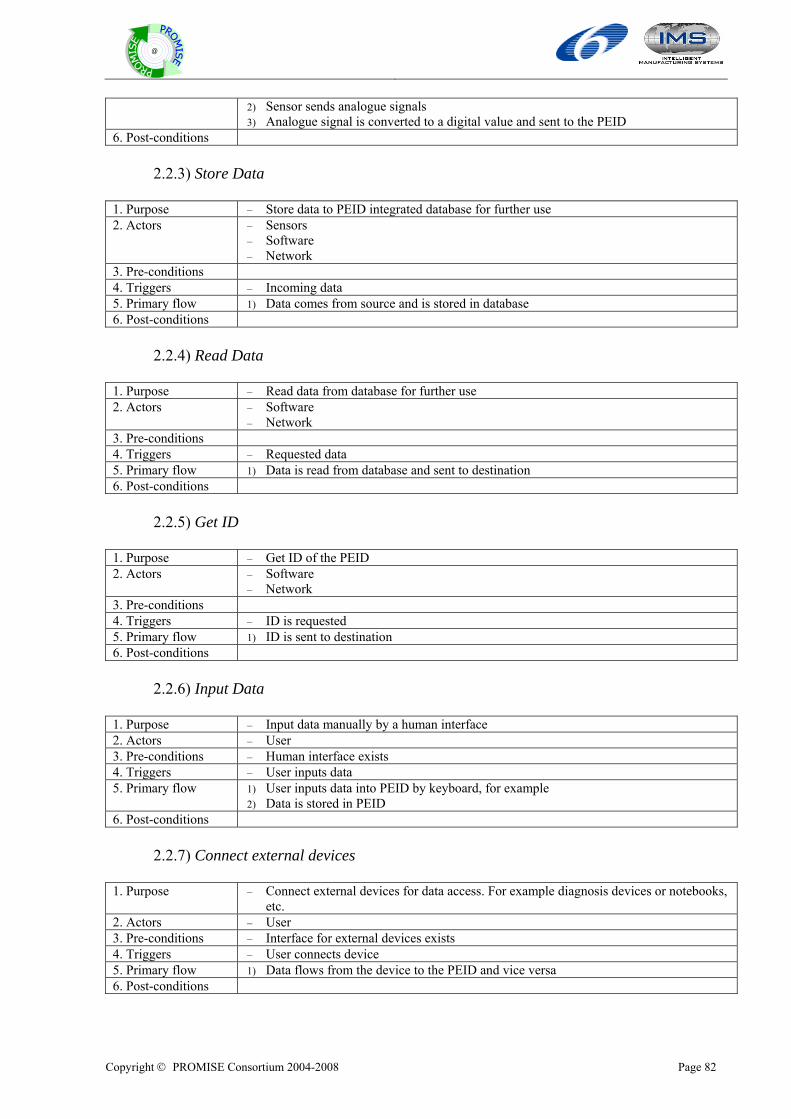
Copyright © PROMISE Consortium 2004-2008 Page 82
@
2) Sensor sends analogue signals 3) Analogue signal is converted to a digital value and sent to the PEID
6. Post-conditions 2.2.3) Store Data
1. Purpose – Store data to PEID integrated database for further use 2. Actors – Sensors
– Software – Network
3. Pre-conditions 4. Triggers – Incoming data 5. Primary flow 1) Data comes from source and is stored in database 6. Post-conditions
2.2.4) Read Data
1. Purpose – Read data from database for further use 2. Actors – Software
– Network 3. Pre-conditions 4. Triggers – Requested data 5. Primary flow 1) Data is read from database and sent to destination 6. Post-conditions
2.2.5) Get ID
1. Purpose – Get ID of the PEID 2. Actors – Software
– Network 3. Pre-conditions 4. Triggers – ID is requested 5. Primary flow 1) ID is sent to destination 6. Post-conditions
2.2.6) Input Data
1. Purpose – Input data manually by a human interface 2. Actors – User 3. Pre-conditions – Human interface exists 4. Triggers – User inputs data 5. Primary flow 1) User inputs data into PEID by keyboard, for example
2) Data is stored in PEID 6. Post-conditions
2.2.7) Connect external devices
1. Purpose – Connect external devices for data access. For example diagnosis devices or notebooks, etc.
2. Actors – User 3. Pre-conditions – Interface for external devices exists 4. Triggers – User connects device 5. Primary flow 1) Data flows from the device to the PEID and vice versa 6. Post-conditions
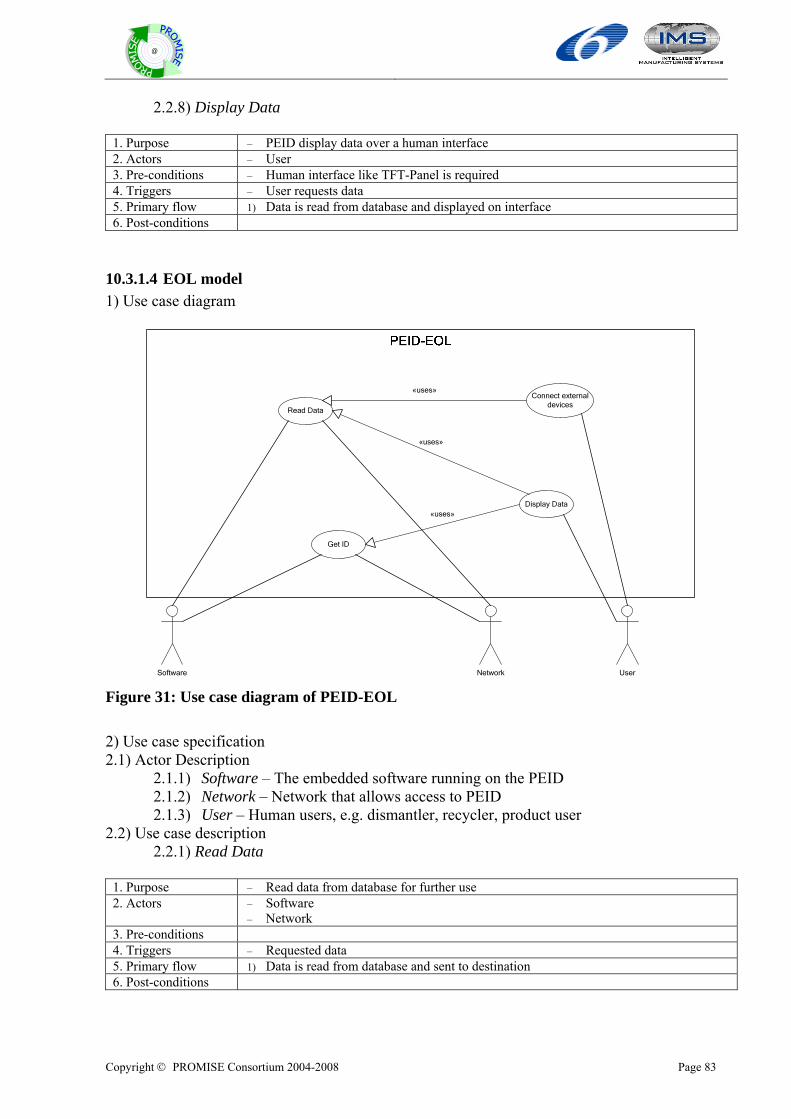
Copyright © PROMISE Consortium 2004-2008 Page 83
@
2.2.8) Display Data
1. Purpose – PEID display data over a human interface 2. Actors – User 3. Pre-conditions – Human interface like TFT-Panel is required 4. Triggers – User requests data 5. Primary flow 1) Data is read from database and displayed on interface 6. Post-conditions
10.3.1.4 EOL model 1) Use case diagram
Get ID
Read Data
Display Data
Software UserNetwork
«uses»
«uses»
Connect externaldevices
«uses»
Figure 31: Use case diagram of PEID-EOL 2) Use case specification 2.1) Actor Description
2.1.1) Software – The embedded software running on the PEID 2.1.2) Network – Network that allows access to PEID 2.1.3) User – Human users, e.g. dismantler, recycler, product user
2.2) Use case description 2.2.1) Read Data
1. Purpose – Read data from database for further use 2. Actors – Software
– Network 3. Pre-conditions 4. Triggers – Requested data 5. Primary flow 1) Data is read from database and sent to destination 6. Post-conditions
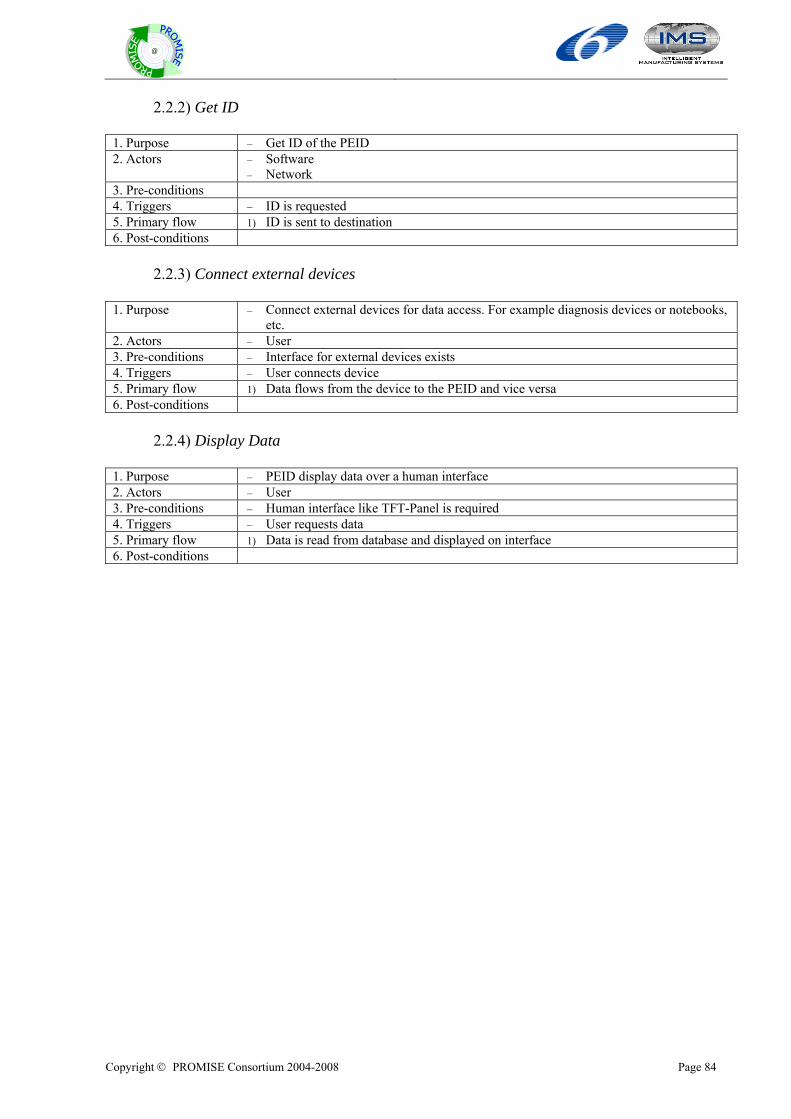
Copyright © PROMISE Consortium 2004-2008 Page 84
@
2.2.2) Get ID
1. Purpose – Get ID of the PEID 2. Actors – Software
– Network 3. Pre-conditions 4. Triggers – ID is requested 5. Primary flow 1) ID is sent to destination 6. Post-conditions
2.2.3) Connect external devices
1. Purpose – Connect external devices for data access. For example diagnosis devices or notebooks, etc.
2. Actors – User 3. Pre-conditions – Interface for external devices exists 4. Triggers – User connects device 5. Primary flow 1) Data flows from the device to the PEID and vice versa 6. Post-conditions
2.2.4) Display Data
1. Purpose – PEID display data over a human interface 2. Actors – User 3. Pre-conditions – Human interface like TFT-Panel is required 4. Triggers – User requests data 5. Primary flow 1) Data is read from database and displayed on interface 6. Post-conditions
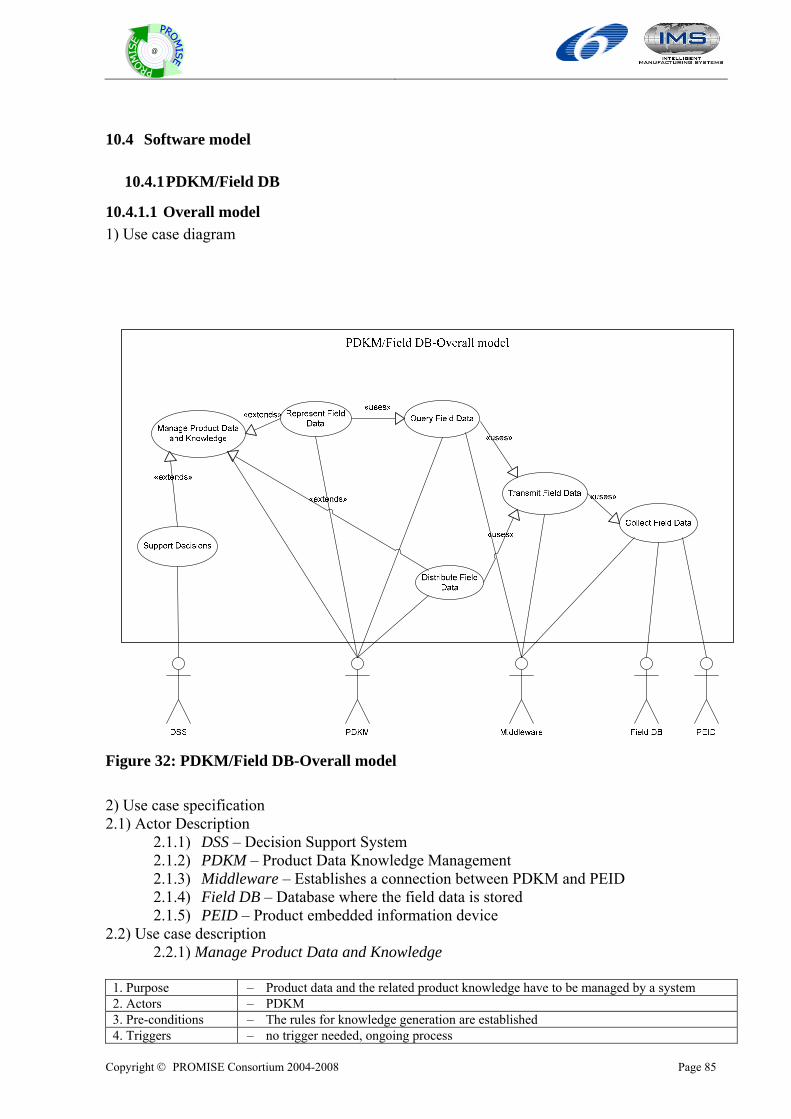
Copyright © PROMISE Consortium 2004-2008 Page 85
@
10.4 Software model
10.4.1 PDKM/Field DB
10.4.1.1 Overall model 1) Use case diagram
Figure 32: PDKM/Field DB-Overall model 2) Use case specification 2.1) Actor Description
2.1.1) DSS – Decision Support System 2.1.2) PDKM – Product Data Knowledge Management 2.1.3) Middleware – Establishes a connection between PDKM and PEID 2.1.4) Field DB – Database where the field data is stored 2.1.5) PEID – Product embedded information device
2.2) Use case description 2.2.1) Manage Product Data and Knowledge
1. Purpose – Product data and the related product knowledge have to be managed by a system 2. Actors – PDKM 3. Pre-conditions – The rules for knowledge generation are established 4. Triggers – no trigger needed, ongoing process
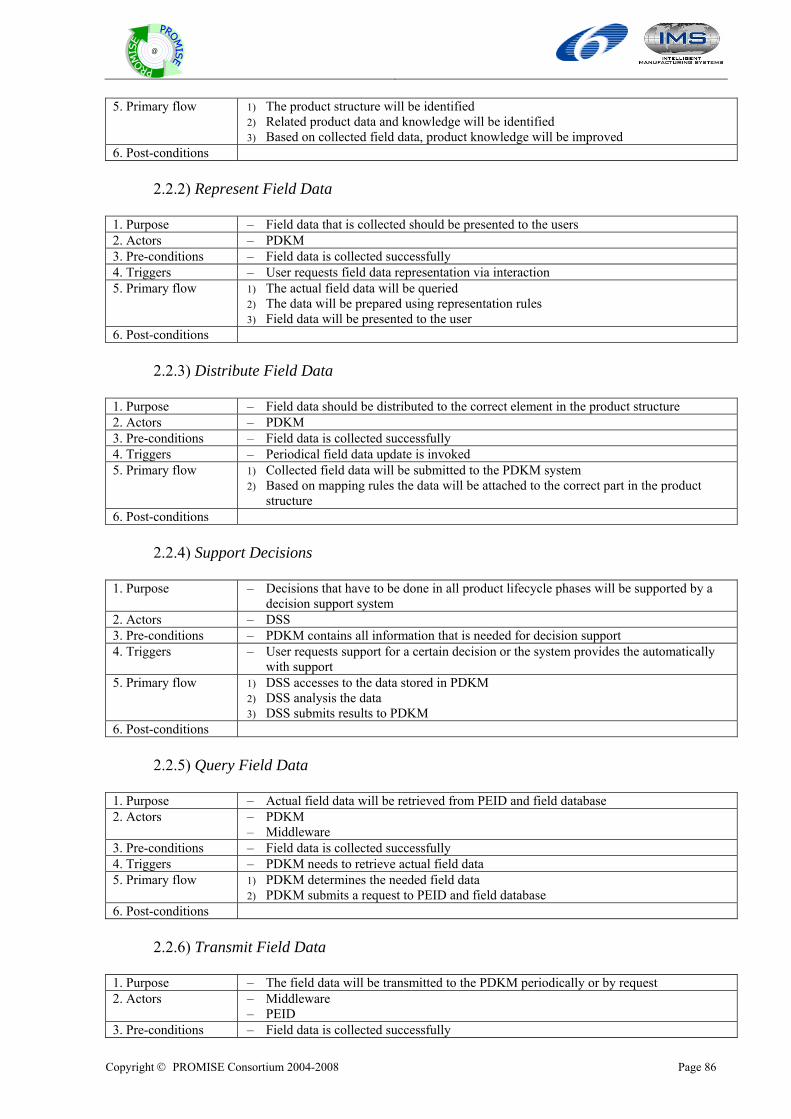
Copyright © PROMISE Consortium 2004-2008 Page 86
@
5. Primary flow 1) The product structure will be identified 2) Related product data and knowledge will be identified 3) Based on collected field data, product knowledge will be improved
6. Post-conditions 2.2.2) Represent Field Data
1. Purpose – Field data that is collected should be presented to the users 2. Actors – PDKM 3. Pre-conditions – Field data is collected successfully 4. Triggers – User requests field data representation via interaction 5. Primary flow 1) The actual field data will be queried
2) The data will be prepared using representation rules 3) Field data will be presented to the user
6. Post-conditions 2.2.3) Distribute Field Data
1. Purpose – Field data should be distributed to the correct element in the product structure 2. Actors – PDKM 3. Pre-conditions – Field data is collected successfully 4. Triggers – Periodical field data update is invoked 5. Primary flow 1) Collected field data will be submitted to the PDKM system
2) Based on mapping rules the data will be attached to the correct part in the product structure
6. Post-conditions 2.2.4) Support Decisions
1. Purpose – Decisions that have to be done in all product lifecycle phases will be supported by a decision support system
2. Actors – DSS 3. Pre-conditions – PDKM contains all information that is needed for decision support 4. Triggers – User requests support for a certain decision or the system provides the automatically
with support 5. Primary flow 1) DSS accesses to the data stored in PDKM
2) DSS analysis the data 3) DSS submits results to PDKM
6. Post-conditions 2.2.5) Query Field Data
1. Purpose – Actual field data will be retrieved from PEID and field database 2. Actors – PDKM
– Middleware 3. Pre-conditions – Field data is collected successfully 4. Triggers – PDKM needs to retrieve actual field data 5. Primary flow 1) PDKM determines the needed field data
2) PDKM submits a request to PEID and field database 6. Post-conditions
2.2.6) Transmit Field Data
1. Purpose – The field data will be transmitted to the PDKM periodically or by request 2. Actors – Middleware
– PEID 3. Pre-conditions – Field data is collected successfully
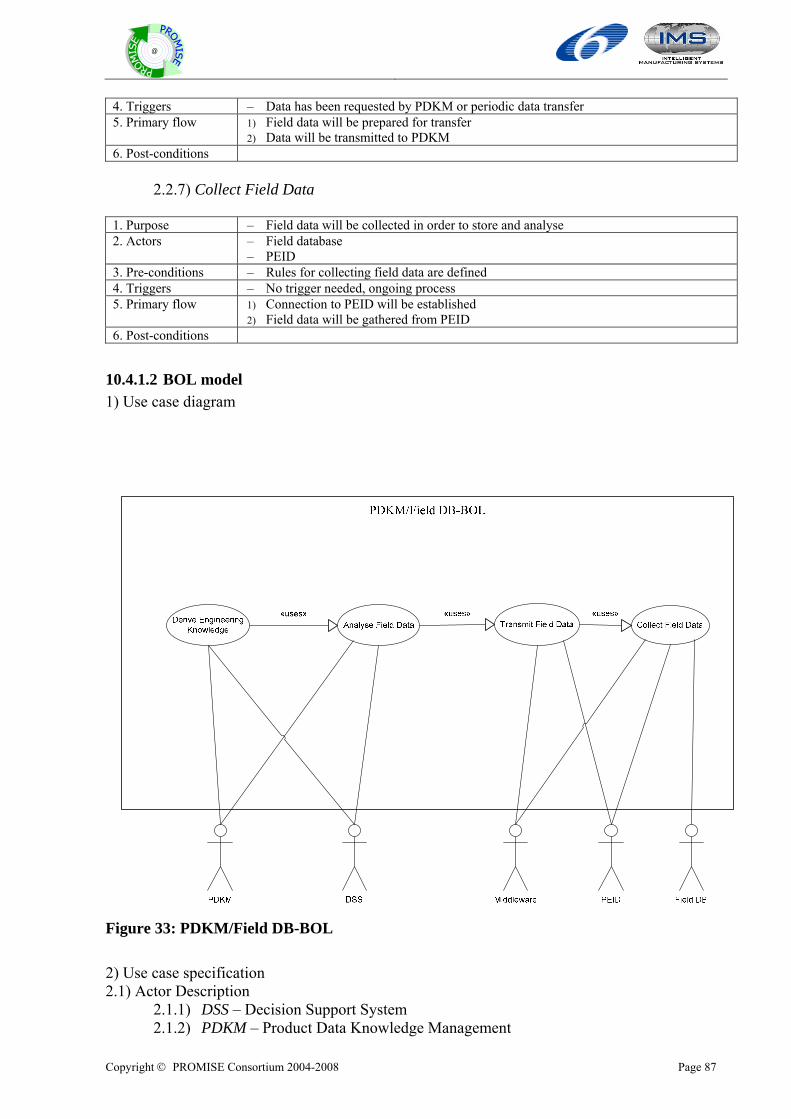
Copyright © PROMISE Consortium 2004-2008 Page 87
@
4. Triggers – Data has been requested by PDKM or periodic data transfer 5. Primary flow 1) Field data will be prepared for transfer
2) Data will be transmitted to PDKM 6. Post-conditions
2.2.7) Collect Field Data
1. Purpose – Field data will be collected in order to store and analyse 2. Actors – Field database
– PEID 3. Pre-conditions – Rules for collecting field data are defined 4. Triggers – No trigger needed, ongoing process 5. Primary flow 1) Connection to PEID will be established
2) Field data will be gathered from PEID 6. Post-conditions
10.4.1.2 BOL model 1) Use case diagram
Figure 33: PDKM/Field DB-BOL
2) Use case specification 2.1) Actor Description
2.1.1) DSS – Decision Support System 2.1.2) PDKM – Product Data Knowledge Management
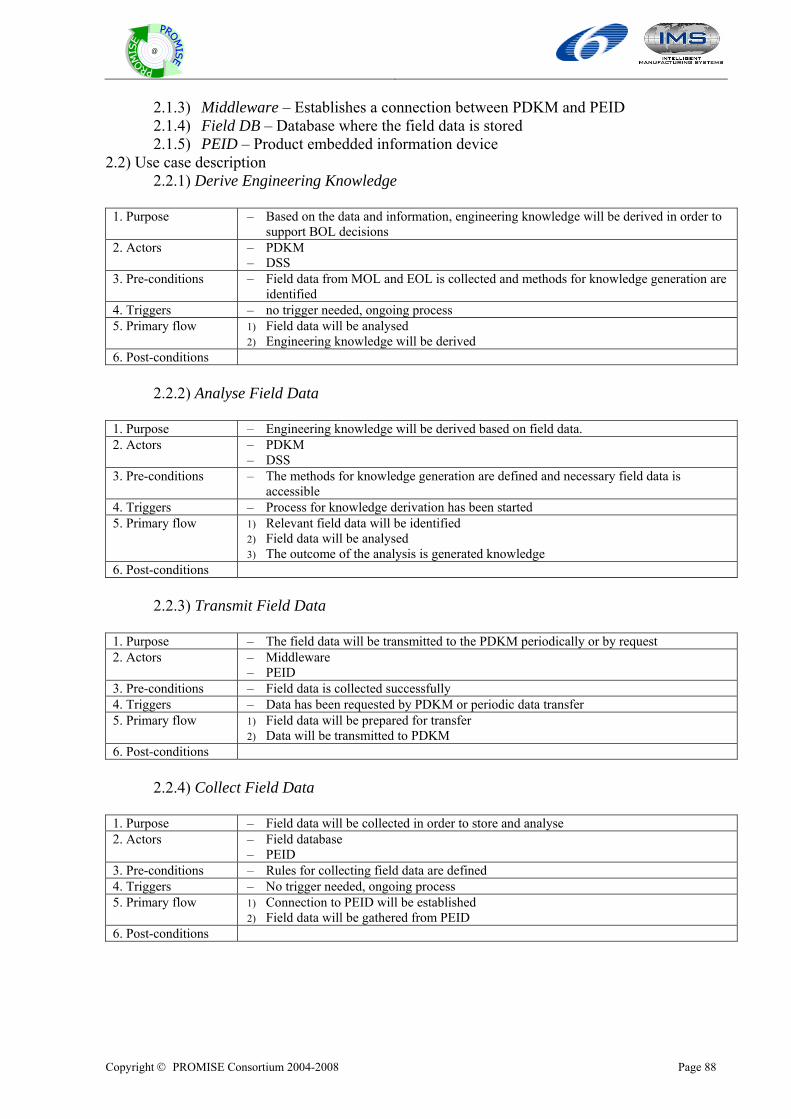
Copyright © PROMISE Consortium 2004-2008 Page 88
@
2.1.3) Middleware – Establishes a connection between PDKM and PEID 2.1.4) Field DB – Database where the field data is stored 2.1.5) PEID – Product embedded information device
2.2) Use case description 2.2.1) Derive Engineering Knowledge
1. Purpose – Based on the data and information, engineering knowledge will be derived in order to support BOL decisions
2. Actors – PDKM – DSS
3. Pre-conditions – Field data from MOL and EOL is collected and methods for knowledge generation are identified
4. Triggers – no trigger needed, ongoing process 5. Primary flow 1) Field data will be analysed
2) Engineering knowledge will be derived 6. Post-conditions
2.2.2) Analyse Field Data
1. Purpose – Engineering knowledge will be derived based on field data. 2. Actors – PDKM
– DSS 3. Pre-conditions – The methods for knowledge generation are defined and necessary field data is
accessible 4. Triggers – Process for knowledge derivation has been started 5. Primary flow 1) Relevant field data will be identified
2) Field data will be analysed 3) The outcome of the analysis is generated knowledge
6. Post-conditions 2.2.3) Transmit Field Data
1. Purpose – The field data will be transmitted to the PDKM periodically or by request 2. Actors – Middleware
– PEID 3. Pre-conditions – Field data is collected successfully 4. Triggers – Data has been requested by PDKM or periodic data transfer 5. Primary flow 1) Field data will be prepared for transfer
2) Data will be transmitted to PDKM 6. Post-conditions
2.2.4) Collect Field Data
1. Purpose – Field data will be collected in order to store and analyse 2. Actors – Field database
– PEID 3. Pre-conditions – Rules for collecting field data are defined 4. Triggers – No trigger needed, ongoing process 5. Primary flow 1) Connection to PEID will be established
2) Field data will be gathered from PEID 6. Post-conditions
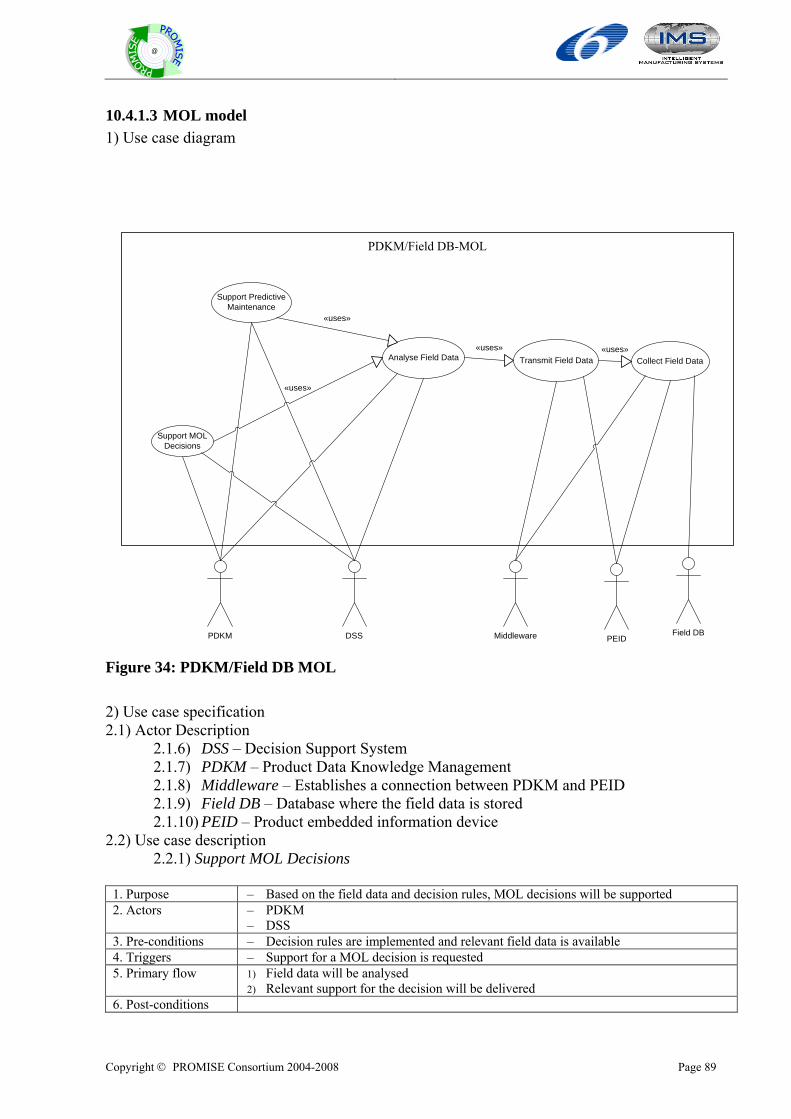
Copyright © PROMISE Consortium 2004-2008 Page 89
@
10.4.1.3 MOL model 1) Use case diagram
PDKM/Field DB-MOL
PDKM
Analyse Field Data Transmit Field Data Collect Field Data
Support MOLDecisions
«uses»
«uses»
DSS Field DBPEIDMiddleware
«uses»
Support PredictiveMaintenance
«uses»
Figure 34: PDKM/Field DB MOL
2) Use case specification 2.1) Actor Description
2.1.6) DSS – Decision Support System 2.1.7) PDKM – Product Data Knowledge Management 2.1.8) Middleware – Establishes a connection between PDKM and PEID 2.1.9) Field DB – Database where the field data is stored 2.1.10) PEID – Product embedded information device
2.2) Use case description 2.2.1) Support MOL Decisions
1. Purpose – Based on the field data and decision rules, MOL decisions will be supported 2. Actors – PDKM
– DSS 3. Pre-conditions – Decision rules are implemented and relevant field data is available 4. Triggers – Support for a MOL decision is requested 5. Primary flow 1) Field data will be analysed
2) Relevant support for the decision will be delivered 6. Post-conditions
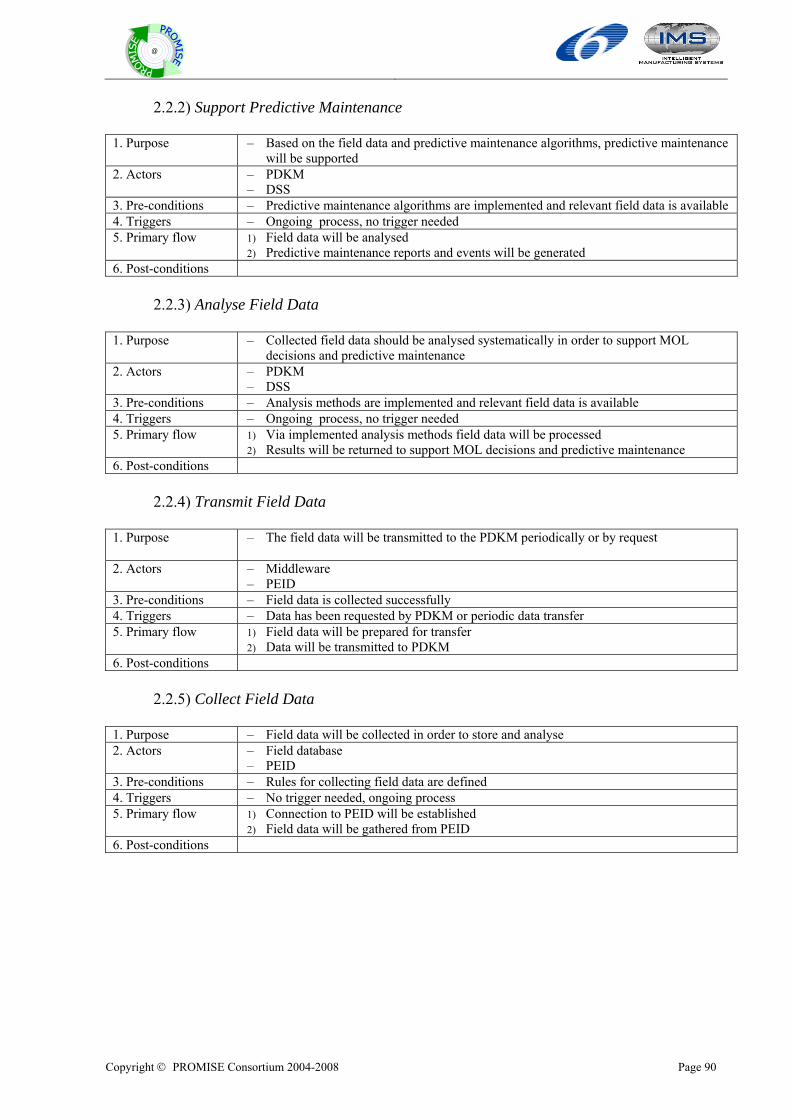
Copyright © PROMISE Consortium 2004-2008 Page 90
@
2.2.2) Support Predictive Maintenance
1. Purpose – Based on the field data and predictive maintenance algorithms, predictive maintenance will be supported
2. Actors – PDKM – DSS
3. Pre-conditions – Predictive maintenance algorithms are implemented and relevant field data is available 4. Triggers – Ongoing process, no trigger needed 5. Primary flow 1) Field data will be analysed
2) Predictive maintenance reports and events will be generated 6. Post-conditions
2.2.3) Analyse Field Data
1. Purpose – Collected field data should be analysed systematically in order to support MOL decisions and predictive maintenance
2. Actors – PDKM – DSS
3. Pre-conditions – Analysis methods are implemented and relevant field data is available 4. Triggers – Ongoing process, no trigger needed 5. Primary flow 1) Via implemented analysis methods field data will be processed
2) Results will be returned to support MOL decisions and predictive maintenance 6. Post-conditions
2.2.4) Transmit Field Data
1. Purpose
– The field data will be transmitted to the PDKM periodically or by request
2. Actors – Middleware – PEID
3. Pre-conditions – Field data is collected successfully 4. Triggers – Data has been requested by PDKM or periodic data transfer 5. Primary flow 1) Field data will be prepared for transfer
2) Data will be transmitted to PDKM 6. Post-conditions
2.2.5) Collect Field Data
1. Purpose – Field data will be collected in order to store and analyse 2. Actors – Field database
– PEID 3. Pre-conditions – Rules for collecting field data are defined 4. Triggers – No trigger needed, ongoing process 5. Primary flow 1) Connection to PEID will be established
2) Field data will be gathered from PEID 6. Post-conditions
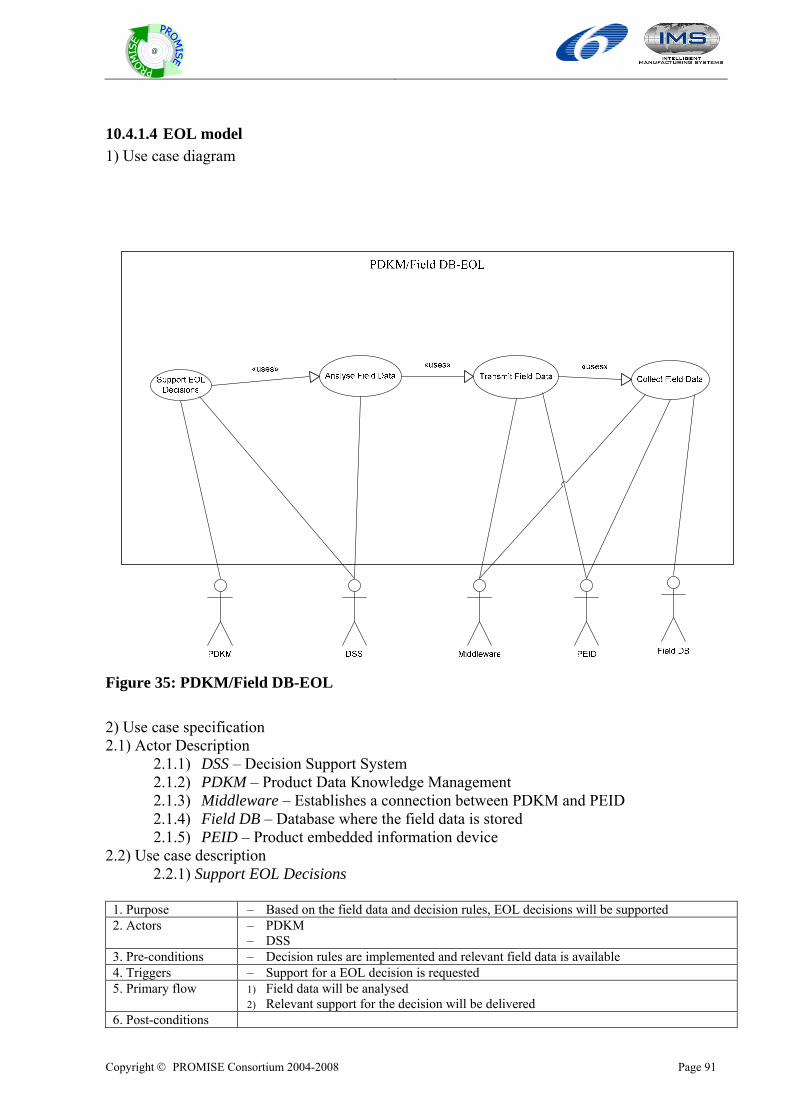
Copyright © PROMISE Consortium 2004-2008 Page 91
@
10.4.1.4 EOL model 1) Use case diagram
Figure 35: PDKM/Field DB-EOL
2) Use case specification 2.1) Actor Description
2.1.1) DSS – Decision Support System 2.1.2) PDKM – Product Data Knowledge Management 2.1.3) Middleware – Establishes a connection between PDKM and PEID 2.1.4) Field DB – Database where the field data is stored 2.1.5) PEID – Product embedded information device
2.2) Use case description 2.2.1) Support EOL Decisions
1. Purpose – Based on the field data and decision rules, EOL decisions will be supported 2. Actors – PDKM
– DSS 3. Pre-conditions – Decision rules are implemented and relevant field data is available 4. Triggers – Support for a EOL decision is requested 5. Primary flow 1) Field data will be analysed
2) Relevant support for the decision will be delivered 6. Post-conditions
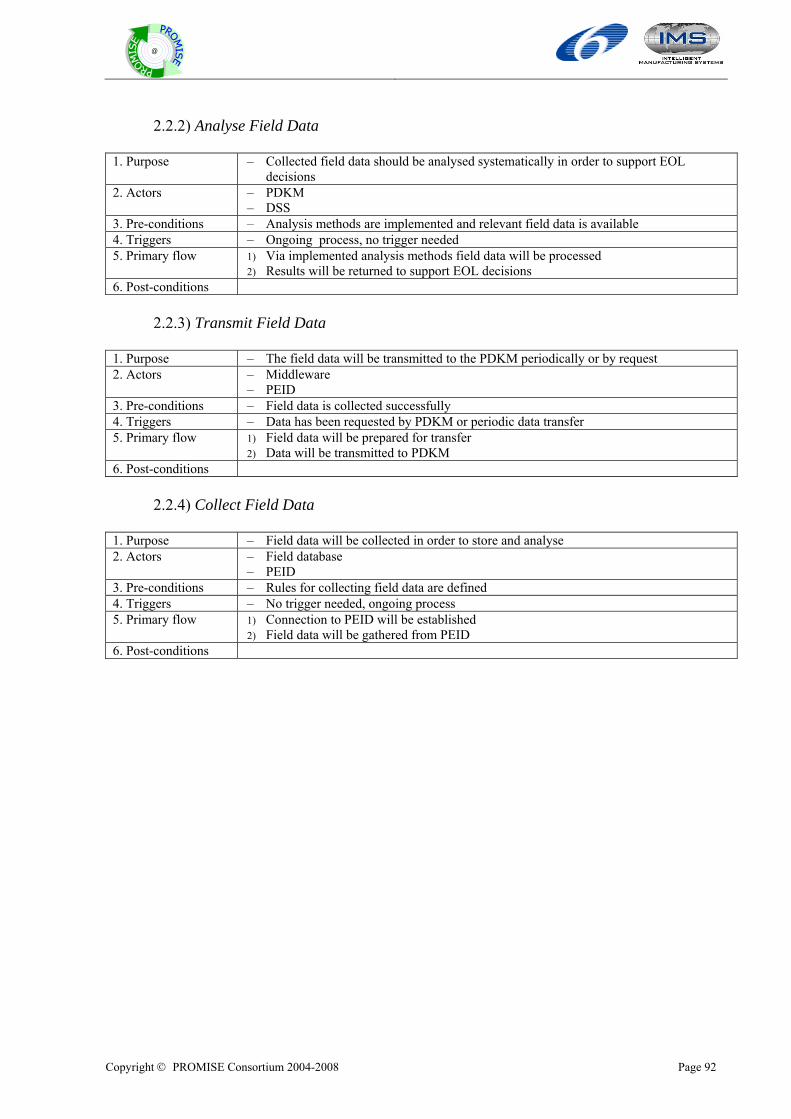
Copyright © PROMISE Consortium 2004-2008 Page 92
@
2.2.2) Analyse Field Data
1. Purpose – Collected field data should be analysed systematically in order to support EOL decisions
2. Actors – PDKM – DSS
3. Pre-conditions – Analysis methods are implemented and relevant field data is available 4. Triggers – Ongoing process, no trigger needed 5. Primary flow 1) Via implemented analysis methods field data will be processed
2) Results will be returned to support EOL decisions 6. Post-conditions
2.2.3) Transmit Field Data
1. Purpose – The field data will be transmitted to the PDKM periodically or by request 2. Actors – Middleware
– PEID 3. Pre-conditions – Field data is collected successfully 4. Triggers – Data has been requested by PDKM or periodic data transfer 5. Primary flow 1) Field data will be prepared for transfer
2) Data will be transmitted to PDKM 6. Post-conditions
2.2.4) Collect Field Data
1. Purpose – Field data will be collected in order to store and analyse 2. Actors – Field database
– PEID 3. Pre-conditions – Rules for collecting field data are defined 4. Triggers – No trigger needed, ongoing process 5. Primary flow 1) Connection to PEID will be established
2) Field data will be gathered from PEID 6. Post-conditions
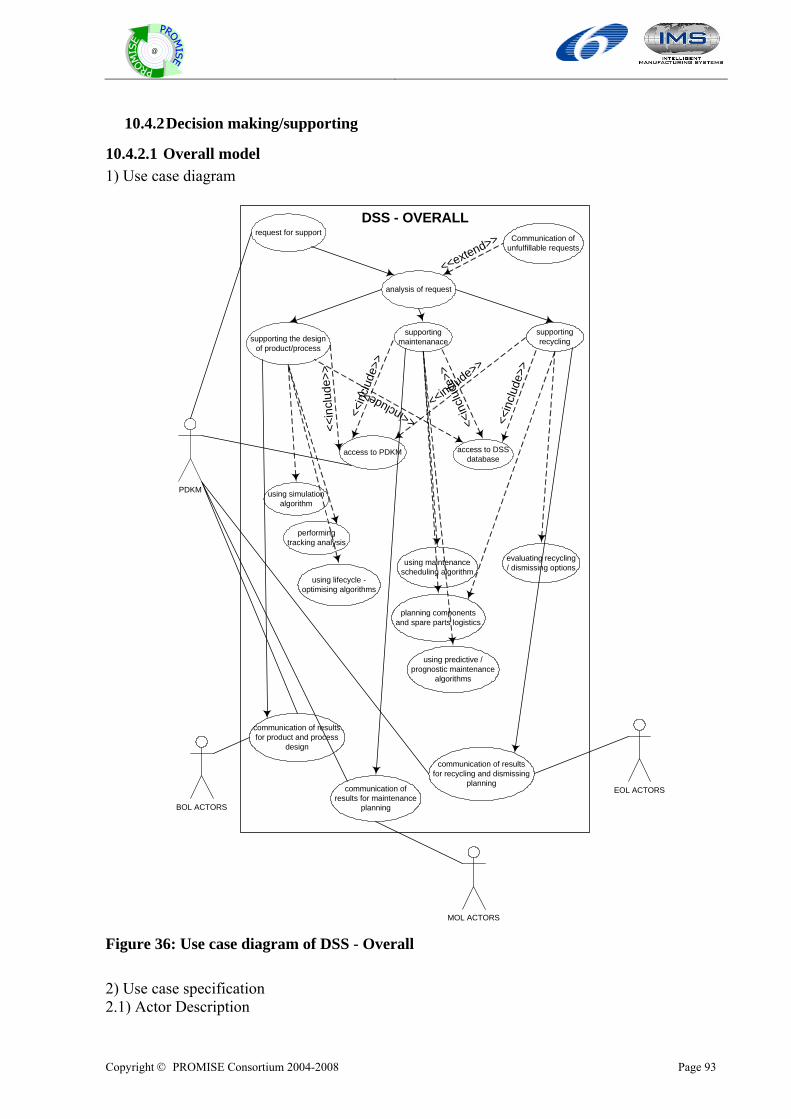
Copyright © PROMISE Consortium 2004-2008 Page 93
@
10.4.2 Decision making/supporting
10.4.2.1 Overall model 1) Use case diagram
DSS - OVERALL
PDKM
BOL ACTORS
MOL ACTORS
analysis of request
access to PDKM
evaluating recycling/ dismissing options
communication ofresults for maintenance
planning
Communication ofunfulfillable requests
supporting the designof product/process
using maintenancescheduling algorithm
request for support
<<extend>>
<<in
clude
>>
<<in
clud
e>>
access to DSSdatabase
communication of resultsfor product and process
design
using predictive /prognostic maintenance
algorithms
supportingmaintenanace
using simulationalgorithm
<<include>>
planning componentsand spare parts logistics
supportingrecycling
<<include>>
<<in
clude
>>
<<in
clud
e>>
using lifecycle -optimising algorithms
performingtracking analysis
communication of resultsfor recycling and dismissing
planningEOL ACTORS
Figure 36: Use case diagram of DSS - Overall 2) Use case specification 2.1) Actor Description
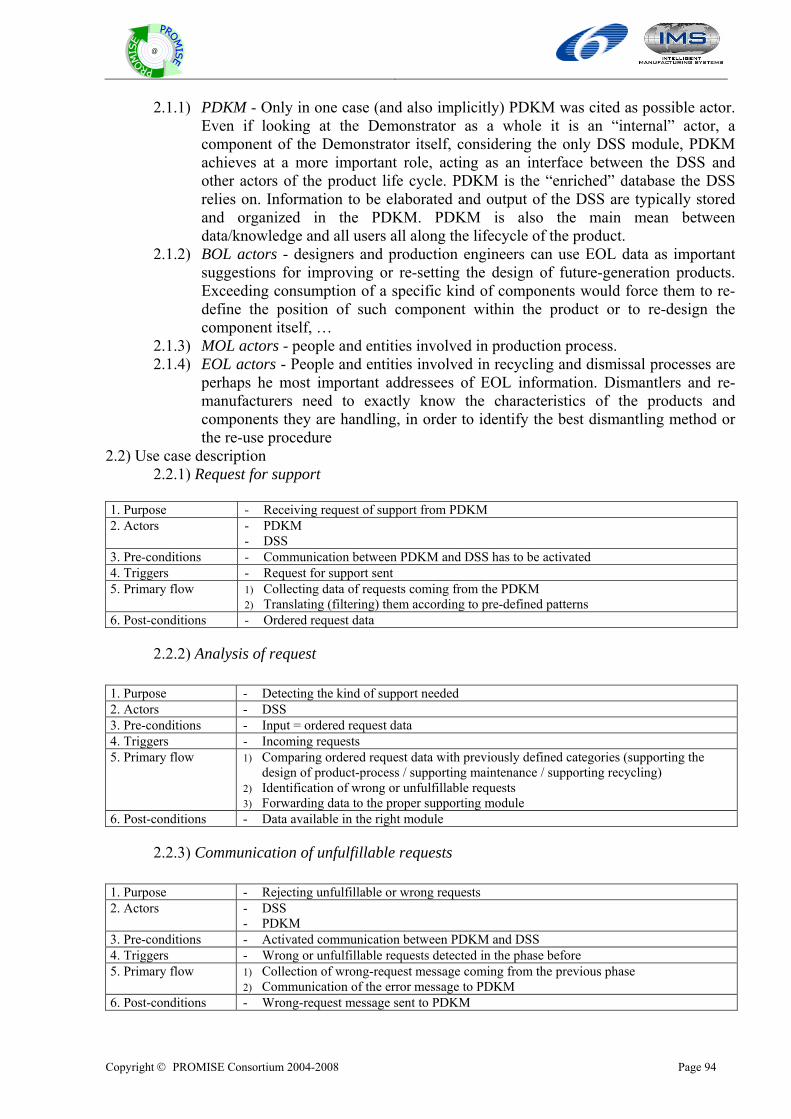
Copyright © PROMISE Consortium 2004-2008 Page 94
@
2.1.1) PDKM - Only in one case (and also implicitly) PDKM was cited as possible actor. Even if looking at the Demonstrator as a whole it is an “internal” actor, a component of the Demonstrator itself, considering the only DSS module, PDKM achieves at a more important role, acting as an interface between the DSS and other actors of the product life cycle. PDKM is the “enriched” database the DSS relies on. Information to be elaborated and output of the DSS are typically stored and organized in the PDKM. PDKM is also the main mean between data/knowledge and all users all along the lifecycle of the product.
2.1.2) BOL actors - designers and production engineers can use EOL data as important suggestions for improving or re-setting the design of future-generation products. Exceeding consumption of a specific kind of components would force them to re-define the position of such component within the product or to re-design the component itself, …
2.1.3) MOL actors - people and entities involved in production process. 2.1.4) EOL actors - People and entities involved in recycling and dismissal processes are
perhaps he most important addressees of EOL information. Dismantlers and re-manufacturers need to exactly know the characteristics of the products and components they are handling, in order to identify the best dismantling method or the re-use procedure
2.2) Use case description 2.2.1) Request for support
1. Purpose - Receiving request of support from PDKM 2. Actors - PDKM
- DSS 3. Pre-conditions - Communication between PDKM and DSS has to be activated 4. Triggers - Request for support sent 5. Primary flow 1) Collecting data of requests coming from the PDKM
2) Translating (filtering) them according to pre-defined patterns 6. Post-conditions - Ordered request data
2.2.2) Analysis of request 1. Purpose - Detecting the kind of support needed 2. Actors - DSS 3. Pre-conditions - Input = ordered request data 4. Triggers - Incoming requests 5. Primary flow 1) Comparing ordered request data with previously defined categories (supporting the
design of product-process / supporting maintenance / supporting recycling) 2) Identification of wrong or unfulfillable requests 3) Forwarding data to the proper supporting module
6. Post-conditions - Data available in the right module
2.2.3) Communication of unfulfillable requests 1. Purpose - Rejecting unfulfillable or wrong requests 2. Actors - DSS
- PDKM 3. Pre-conditions - Activated communication between PDKM and DSS 4. Triggers - Wrong or unfulfillable requests detected in the phase before 5. Primary flow 1) Collection of wrong-request message coming from the previous phase
2) Communication of the error message to PDKM 6. Post-conditions - Wrong-request message sent to PDKM
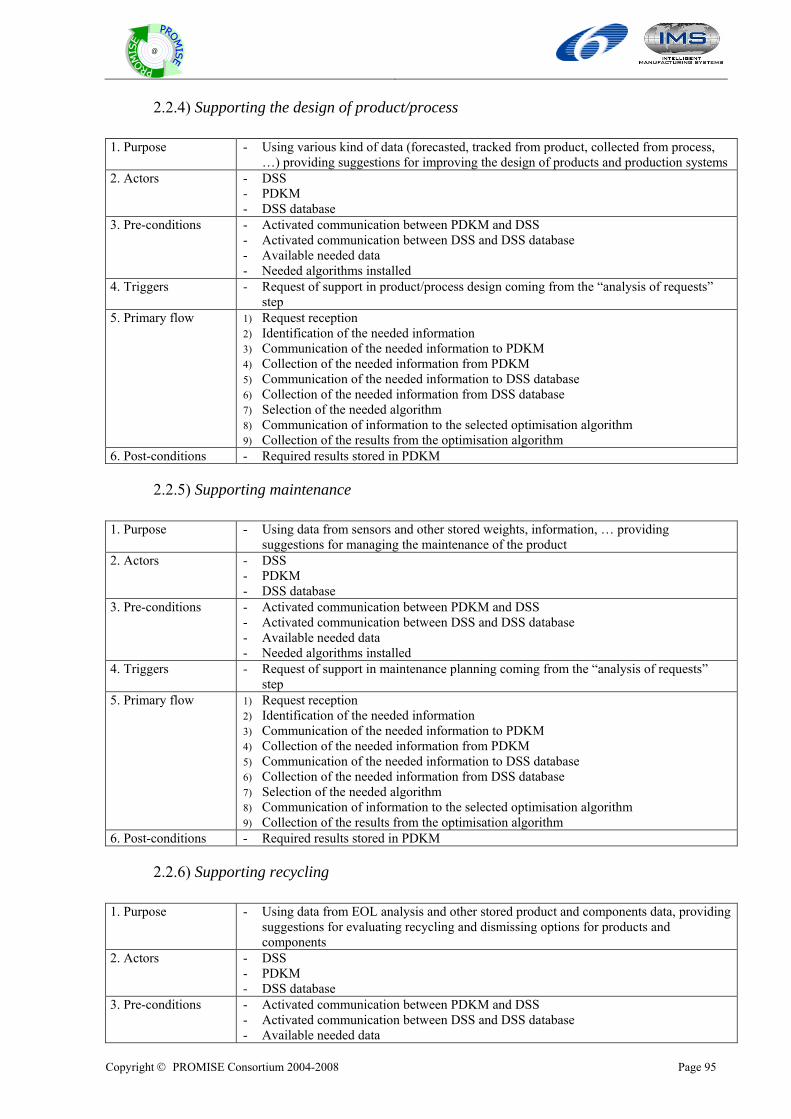
Copyright © PROMISE Consortium 2004-2008 Page 95
@
2.2.4) Supporting the design of product/process 1. Purpose - Using various kind of data (forecasted, tracked from product, collected from process,
…) providing suggestions for improving the design of products and production systems 2. Actors - DSS
- PDKM - DSS database
3. Pre-conditions - Activated communication between PDKM and DSS - Activated communication between DSS and DSS database - Available needed data - Needed algorithms installed
4. Triggers - Request of support in product/process design coming from the “analysis of requests” step
5. Primary flow 1) Request reception 2) Identification of the needed information 3) Communication of the needed information to PDKM 4) Collection of the needed information from PDKM 5) Communication of the needed information to DSS database 6) Collection of the needed information from DSS database 7) Selection of the needed algorithm 8) Communication of information to the selected optimisation algorithm 9) Collection of the results from the optimisation algorithm
6. Post-conditions - Required results stored in PDKM
2.2.5) Supporting maintenance 1. Purpose - Using data from sensors and other stored weights, information, … providing
suggestions for managing the maintenance of the product 2. Actors - DSS
- PDKM - DSS database
3. Pre-conditions - Activated communication between PDKM and DSS - Activated communication between DSS and DSS database - Available needed data - Needed algorithms installed
4. Triggers - Request of support in maintenance planning coming from the “analysis of requests” step
5. Primary flow 1) Request reception 2) Identification of the needed information 3) Communication of the needed information to PDKM 4) Collection of the needed information from PDKM 5) Communication of the needed information to DSS database 6) Collection of the needed information from DSS database 7) Selection of the needed algorithm 8) Communication of information to the selected optimisation algorithm 9) Collection of the results from the optimisation algorithm
6. Post-conditions - Required results stored in PDKM
2.2.6) Supporting recycling 1. Purpose - Using data from EOL analysis and other stored product and components data, providing
suggestions for evaluating recycling and dismissing options for products and components
2. Actors - DSS - PDKM - DSS database
3. Pre-conditions - Activated communication between PDKM and DSS - Activated communication between DSS and DSS database - Available needed data
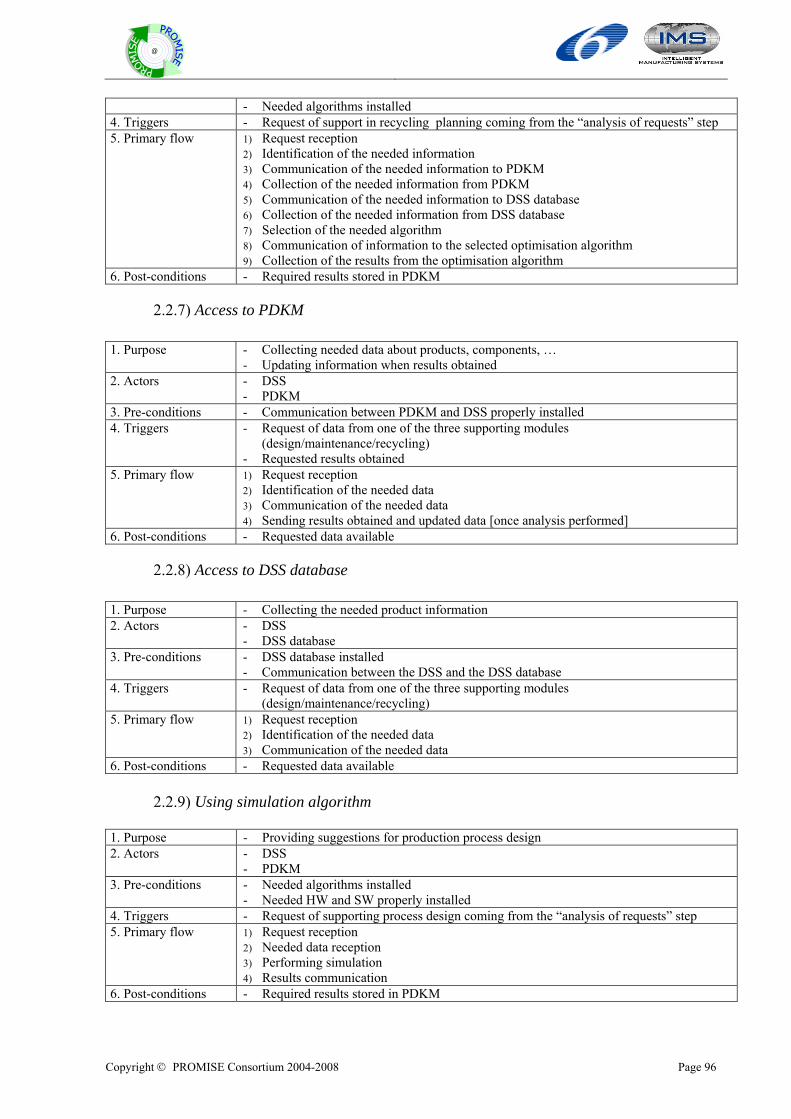
Copyright © PROMISE Consortium 2004-2008 Page 96
@
- Needed algorithms installed 4. Triggers - Request of support in recycling planning coming from the “analysis of requests” step 5. Primary flow 1) Request reception
2) Identification of the needed information 3) Communication of the needed information to PDKM 4) Collection of the needed information from PDKM 5) Communication of the needed information to DSS database 6) Collection of the needed information from DSS database 7) Selection of the needed algorithm 8) Communication of information to the selected optimisation algorithm 9) Collection of the results from the optimisation algorithm
6. Post-conditions - Required results stored in PDKM
2.2.7) Access to PDKM 1. Purpose - Collecting needed data about products, components, …
- Updating information when results obtained 2. Actors - DSS
- PDKM 3. Pre-conditions - Communication between PDKM and DSS properly installed 4. Triggers - Request of data from one of the three supporting modules
(design/maintenance/recycling) - Requested results obtained
5. Primary flow 1) Request reception 2) Identification of the needed data 3) Communication of the needed data 4) Sending results obtained and updated data [once analysis performed]
6. Post-conditions - Requested data available
2.2.8) Access to DSS database 1. Purpose - Collecting the needed product information 2. Actors - DSS
- DSS database 3. Pre-conditions - DSS database installed
- Communication between the DSS and the DSS database 4. Triggers - Request of data from one of the three supporting modules
(design/maintenance/recycling) 5. Primary flow 1) Request reception
2) Identification of the needed data 3) Communication of the needed data
6. Post-conditions - Requested data available 2.2.9) Using simulation algorithm
1. Purpose - Providing suggestions for production process design 2. Actors - DSS
- PDKM 3. Pre-conditions - Needed algorithms installed
- Needed HW and SW properly installed 4. Triggers - Request of supporting process design coming from the “analysis of requests” step 5. Primary flow 1) Request reception
2) Needed data reception 3) Performing simulation 4) Results communication
6. Post-conditions - Required results stored in PDKM
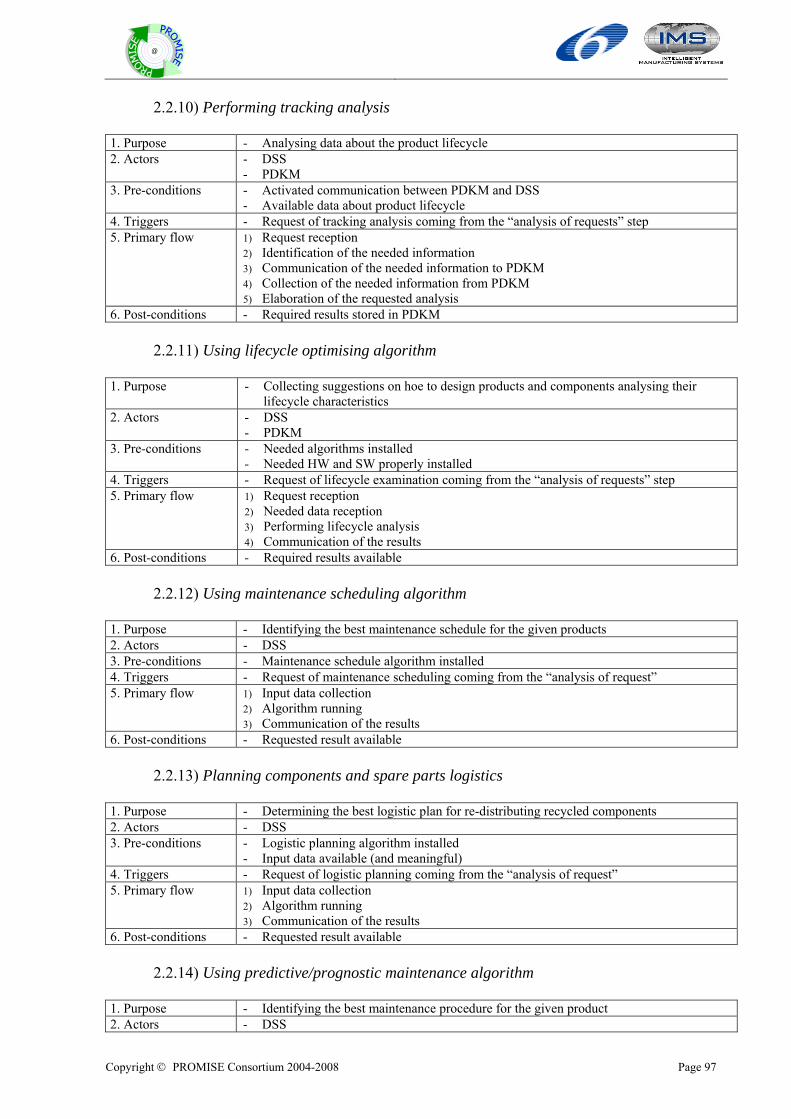
Copyright © PROMISE Consortium 2004-2008 Page 97
@
2.2.10) Performing tracking analysis
1. Purpose - Analysing data about the product lifecycle 2. Actors - DSS
- PDKM 3. Pre-conditions - Activated communication between PDKM and DSS
- Available data about product lifecycle 4. Triggers - Request of tracking analysis coming from the “analysis of requests” step 5. Primary flow 1) Request reception
2) Identification of the needed information 3) Communication of the needed information to PDKM 4) Collection of the needed information from PDKM 5) Elaboration of the requested analysis
6. Post-conditions - Required results stored in PDKM 2.2.11) Using lifecycle optimising algorithm
1. Purpose - Collecting suggestions on hoe to design products and components analysing their lifecycle characteristics
2. Actors - DSS - PDKM
3. Pre-conditions - Needed algorithms installed - Needed HW and SW properly installed
4. Triggers - Request of lifecycle examination coming from the “analysis of requests” step 5. Primary flow 1) Request reception
2) Needed data reception 3) Performing lifecycle analysis 4) Communication of the results
6. Post-conditions - Required results available 2.2.12) Using maintenance scheduling algorithm
1. Purpose - Identifying the best maintenance schedule for the given products 2. Actors - DSS 3. Pre-conditions - Maintenance schedule algorithm installed 4. Triggers - Request of maintenance scheduling coming from the “analysis of request” 5. Primary flow 1) Input data collection
2) Algorithm running 3) Communication of the results
6. Post-conditions - Requested result available 2.2.13) Planning components and spare parts logistics
1. Purpose - Determining the best logistic plan for re-distributing recycled components 2. Actors - DSS 3. Pre-conditions - Logistic planning algorithm installed
- Input data available (and meaningful) 4. Triggers - Request of logistic planning coming from the “analysis of request” 5. Primary flow 1) Input data collection
2) Algorithm running 3) Communication of the results
6. Post-conditions - Requested result available 2.2.14) Using predictive/prognostic maintenance algorithm
1. Purpose - Identifying the best maintenance procedure for the given product 2. Actors - DSS
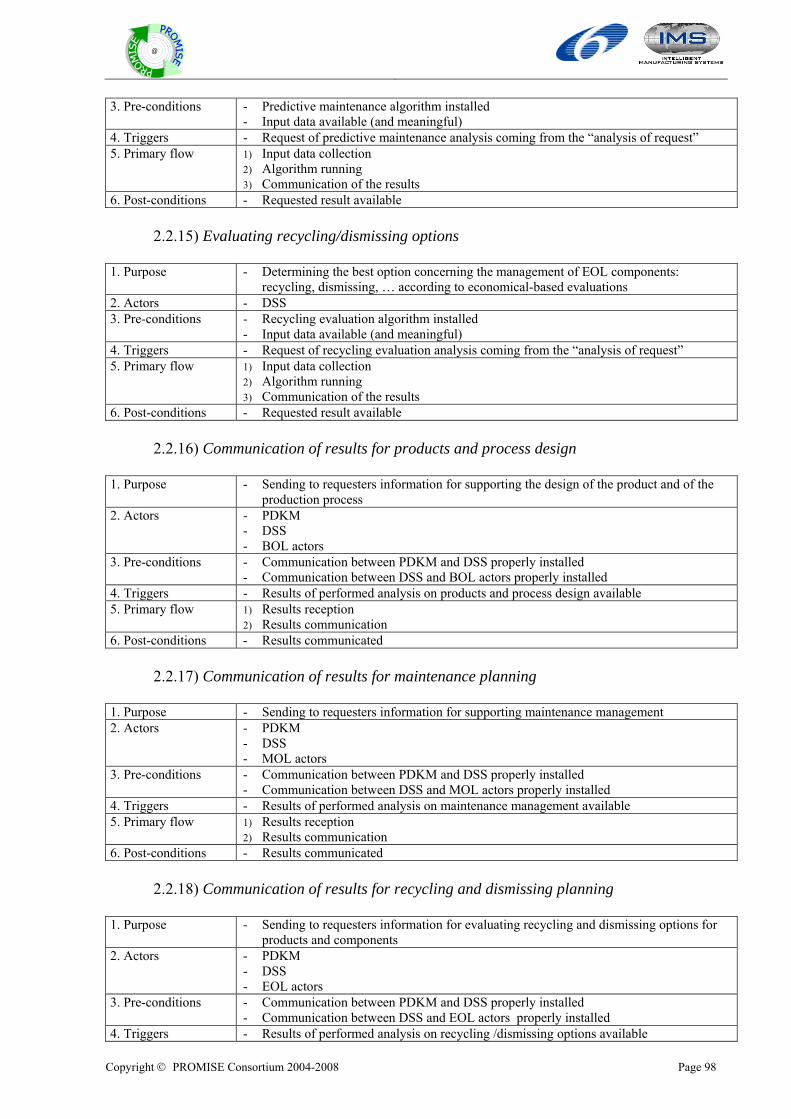
Copyright © PROMISE Consortium 2004-2008 Page 98
@
3. Pre-conditions - Predictive maintenance algorithm installed - Input data available (and meaningful)
4. Triggers - Request of predictive maintenance analysis coming from the “analysis of request” 5. Primary flow 1) Input data collection
2) Algorithm running 3) Communication of the results
6. Post-conditions - Requested result available 2.2.15) Evaluating recycling/dismissing options
1. Purpose - Determining the best option concerning the management of EOL components: recycling, dismissing, … according to economical-based evaluations
2. Actors - DSS 3. Pre-conditions - Recycling evaluation algorithm installed
- Input data available (and meaningful) 4. Triggers - Request of recycling evaluation analysis coming from the “analysis of request” 5. Primary flow 1) Input data collection
2) Algorithm running 3) Communication of the results
6. Post-conditions - Requested result available 2.2.16) Communication of results for products and process design
1. Purpose - Sending to requesters information for supporting the design of the product and of the production process
2. Actors - PDKM - DSS - BOL actors
3. Pre-conditions - Communication between PDKM and DSS properly installed - Communication between DSS and BOL actors properly installed
4. Triggers - Results of performed analysis on products and process design available 5. Primary flow 1) Results reception
2) Results communication 6. Post-conditions - Results communicated
2.2.17) Communication of results for maintenance planning
1. Purpose - Sending to requesters information for supporting maintenance management 2. Actors - PDKM
- DSS - MOL actors
3. Pre-conditions - Communication between PDKM and DSS properly installed - Communication between DSS and MOL actors properly installed
4. Triggers - Results of performed analysis on maintenance management available 5. Primary flow 1) Results reception
2) Results communication 6. Post-conditions - Results communicated
2.2.18) Communication of results for recycling and dismissing planning
1. Purpose - Sending to requesters information for evaluating recycling and dismissing options for products and components
2. Actors - PDKM - DSS - EOL actors
3. Pre-conditions - Communication between PDKM and DSS properly installed - Communication between DSS and EOL actors properly installed
4. Triggers - Results of performed analysis on recycling /dismissing options available
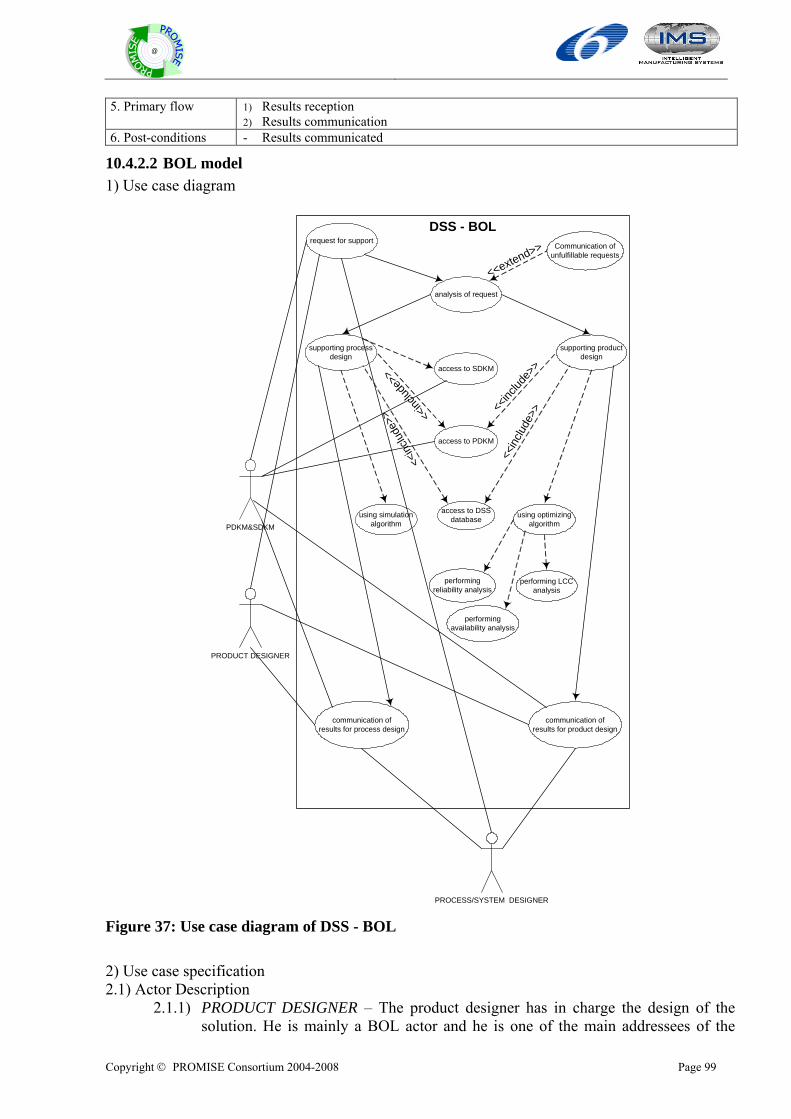
Copyright © PROMISE Consortium 2004-2008 Page 99
@
5. Primary flow 1) Results reception 2) Results communication
6. Post-conditions - Results communicated
10.4.2.2 BOL model 1) Use case diagram
DSS - BOL
PDKM&SDKM
PRODUCT DESIGNER
PROCESS/SYSTEM DESIGNER
analysis of request
access to PDKM
communication ofresults for product design
using optimizingalgorithm
Communication ofunfulfillable requests
supporting processdesign
performing LCCanalysis
request for support
<<extend>>
<<inc
lude>
>
<<inc
lude>
>
access to DSSdatabase
communication ofresults for process design
performingreliability analysis
supporting productdesign
access to SDKM
using simulationalgorithm
<<inc
lude
>>
<<in
clude
>>
performingavailability analysis
Figure 37: Use case diagram of DSS - BOL
2) Use case specification 2.1) Actor Description
2.1.1) PRODUCT DESIGNER – The product designer has in charge the design of the solution. He is mainly a BOL actor and he is one of the main addressees of the
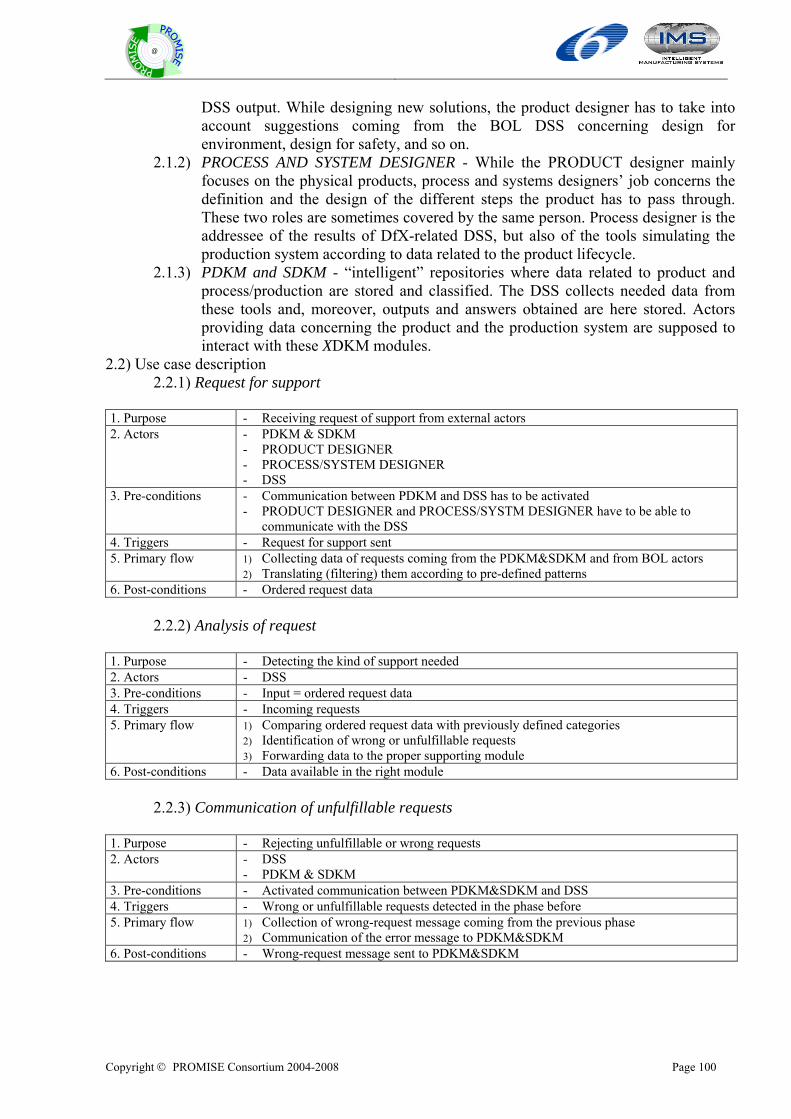
Copyright © PROMISE Consortium 2004-2008 Page 100
@
DSS output. While designing new solutions, the product designer has to take into account suggestions coming from the BOL DSS concerning design for environment, design for safety, and so on.
2.1.2) PROCESS AND SYSTEM DESIGNER - While the PRODUCT designer mainly focuses on the physical products, process and systems designers’ job concerns the definition and the design of the different steps the product has to pass through. These two roles are sometimes covered by the same person. Process designer is the addressee of the results of DfX-related DSS, but also of the tools simulating the production system according to data related to the product lifecycle.
2.1.3) PDKM and SDKM - “intelligent” repositories where data related to product and process/production are stored and classified. The DSS collects needed data from these tools and, moreover, outputs and answers obtained are here stored. Actors providing data concerning the product and the production system are supposed to interact with these XDKM modules.
2.2) Use case description 2.2.1) Request for support
1. Purpose - Receiving request of support from external actors 2. Actors - PDKM & SDKM
- PRODUCT DESIGNER - PROCESS/SYSTEM DESIGNER - DSS
3. Pre-conditions - Communication between PDKM and DSS has to be activated - PRODUCT DESIGNER and PROCESS/SYSTM DESIGNER have to be able to
communicate with the DSS 4. Triggers - Request for support sent 5. Primary flow 1) Collecting data of requests coming from the PDKM&SDKM and from BOL actors
2) Translating (filtering) them according to pre-defined patterns 6. Post-conditions - Ordered request data
2.2.2) Analysis of request
1. Purpose - Detecting the kind of support needed 2. Actors - DSS 3. Pre-conditions - Input = ordered request data 4. Triggers - Incoming requests 5. Primary flow 1) Comparing ordered request data with previously defined categories
2) Identification of wrong or unfulfillable requests 3) Forwarding data to the proper supporting module
6. Post-conditions - Data available in the right module 2.2.3) Communication of unfulfillable requests
1. Purpose - Rejecting unfulfillable or wrong requests 2. Actors - DSS
- PDKM & SDKM 3. Pre-conditions - Activated communication between PDKM&SDKM and DSS 4. Triggers - Wrong or unfulfillable requests detected in the phase before 5. Primary flow 1) Collection of wrong-request message coming from the previous phase
2) Communication of the error message to PDKM&SDKM 6. Post-conditions - Wrong-request message sent to PDKM&SDKM
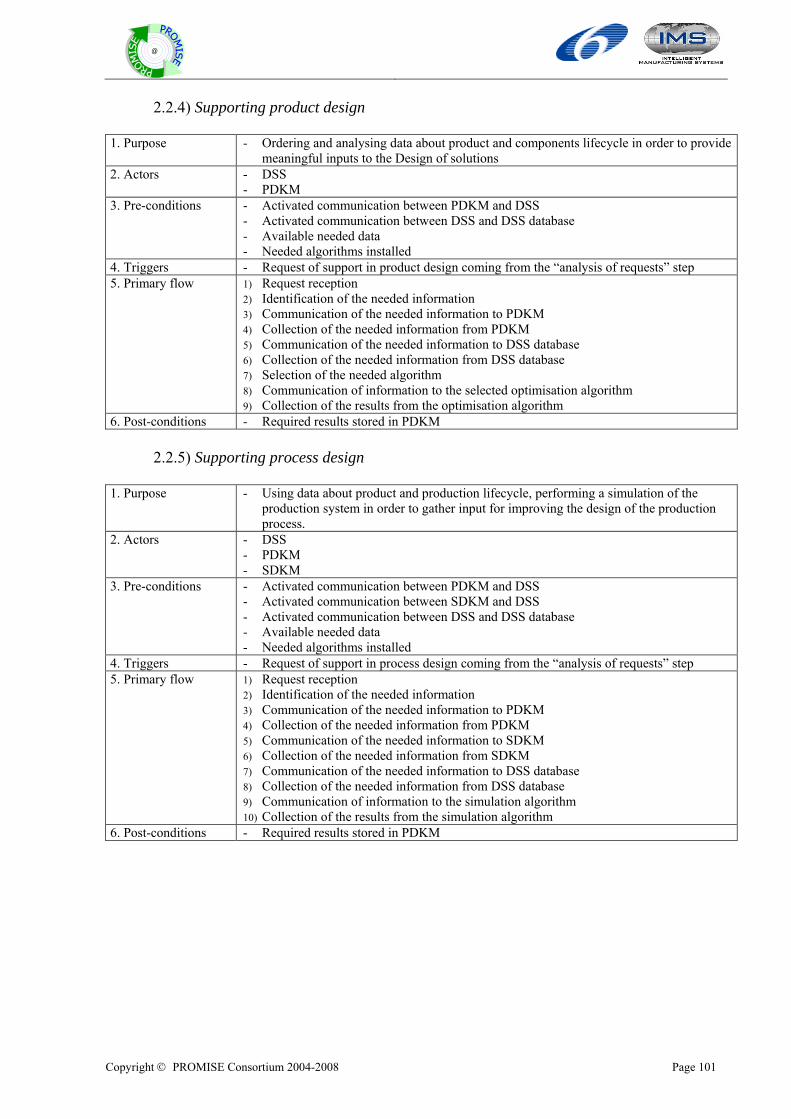
Copyright © PROMISE Consortium 2004-2008 Page 101
@
2.2.4) Supporting product design
1. Purpose - Ordering and analysing data about product and components lifecycle in order to provide meaningful inputs to the Design of solutions
2. Actors - DSS - PDKM
3. Pre-conditions - Activated communication between PDKM and DSS - Activated communication between DSS and DSS database - Available needed data - Needed algorithms installed
4. Triggers - Request of support in product design coming from the “analysis of requests” step 5. Primary flow 1) Request reception
2) Identification of the needed information 3) Communication of the needed information to PDKM 4) Collection of the needed information from PDKM 5) Communication of the needed information to DSS database 6) Collection of the needed information from DSS database 7) Selection of the needed algorithm 8) Communication of information to the selected optimisation algorithm 9) Collection of the results from the optimisation algorithm
6. Post-conditions - Required results stored in PDKM 2.2.5) Supporting process design
1. Purpose - Using data about product and production lifecycle, performing a simulation of the production system in order to gather input for improving the design of the production process.
2. Actors - DSS - PDKM - SDKM
3. Pre-conditions - Activated communication between PDKM and DSS - Activated communication between SDKM and DSS - Activated communication between DSS and DSS database - Available needed data - Needed algorithms installed
4. Triggers - Request of support in process design coming from the “analysis of requests” step 5. Primary flow 1) Request reception
2) Identification of the needed information 3) Communication of the needed information to PDKM 4) Collection of the needed information from PDKM 5) Communication of the needed information to SDKM 6) Collection of the needed information from SDKM 7) Communication of the needed information to DSS database 8) Collection of the needed information from DSS database 9) Communication of information to the simulation algorithm 10) Collection of the results from the simulation algorithm
6. Post-conditions - Required results stored in PDKM
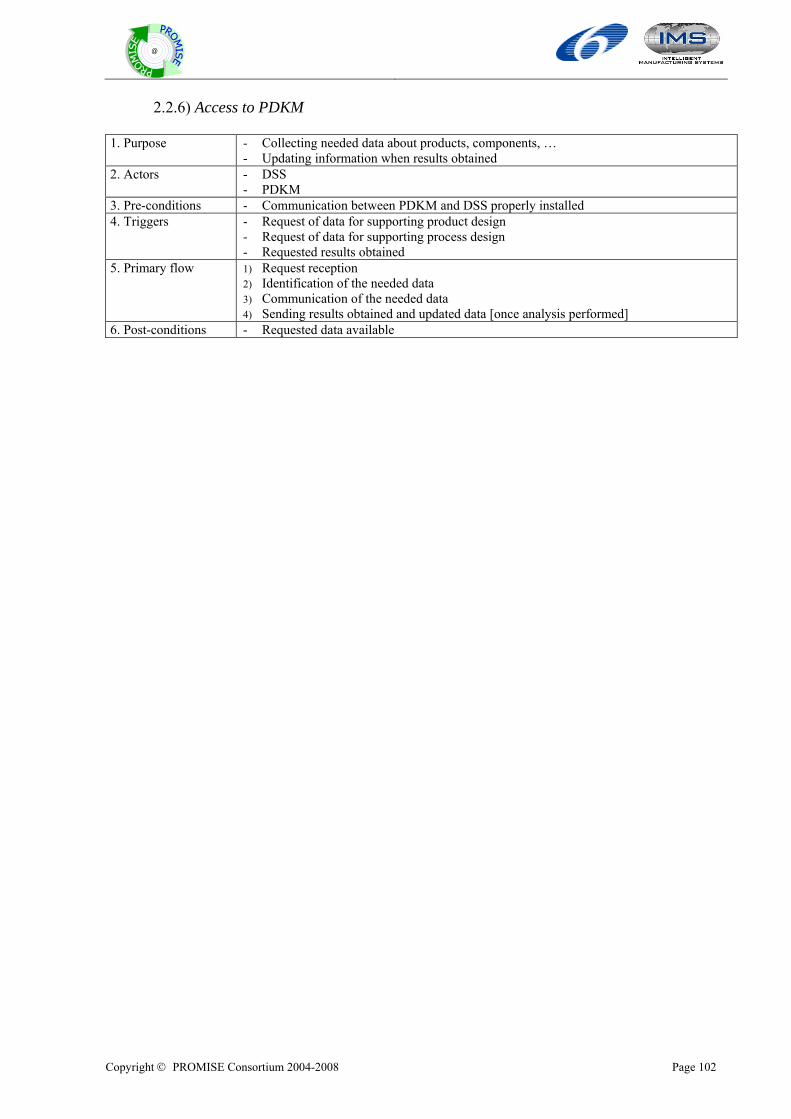
Copyright © PROMISE Consortium 2004-2008 Page 102
@
2.2.6) Access to PDKM
1. Purpose - Collecting needed data about products, components, … - Updating information when results obtained
2. Actors - DSS - PDKM
3. Pre-conditions - Communication between PDKM and DSS properly installed 4. Triggers - Request of data for supporting product design
- Request of data for supporting process design - Requested results obtained
5. Primary flow 1) Request reception 2) Identification of the needed data 3) Communication of the needed data 4) Sending results obtained and updated data [once analysis performed]
6. Post-conditions - Requested data available

Copyright © PROMISE Consortium 2004-2008 Page 103
@
2.2.7) Access to SDKM
1. Purpose - Collecting needed data about process and production systems - Updating information when results obtained
2. Actors - DSS - SDKM
3. Pre-conditions - Communication between SDKM and DSS properly installed 4. Triggers - Request of data for supporting process design
- Requested results obtained 5. Primary flow 1) Request reception
2) Identification of the needed data 3) Communication of the data 4) Sending results obtained and updated data [once analysis performed]
6. Post-conditions - Requested data available 2.2.8) Access to DSS database
1. Purpose - Collecting the needed product information 2. Actors - DSS
- DSS database 3. Pre-conditions - DSS database installed
- Communication between the DSS and the DSS database 4. Triggers - Request of product data for supporting product design
- Request of product data for supporting process design 5. Primary flow 1) Request reception
2) Identification of the needed data 3) Communication of the needed data
6. Post-conditions - Requested data available 2.2.9) Using optimising algorithms
1. Purpose - Identifying the needed algorithm to be run and sending needed data 2. Actors - DSS
- PDKM 3. Pre-conditions - Needed algorithms installed
- Needed HW and SW properly installed 4. Triggers - Request of supporting product design coming from the “analysis of requests” step 5. Primary flow 1) Request reception
2) Identification of the needed tools/algorithms 3) Communication of the needed information to the algorithm 4) Collection of the results
6. Post-conditions - Required results stored in PDKM 2.2.10) Performing LCC analysis
1. Purpose - Providing suggestions for improving product design considering LCC 2. Actors - DSS
- PDKM 3. Pre-conditions - Needed algorithm installed
- Needed data available - Needed HW and SW properly installed
4. Triggers - Request of LCC analysis coming from the “analysis of requests” step 5. Primary flow 1) Request reception
2) Needed data reception 3) Elaboration of LCC analysis 4) Communication of results
6. Post-conditions - Required results stored in PDKM
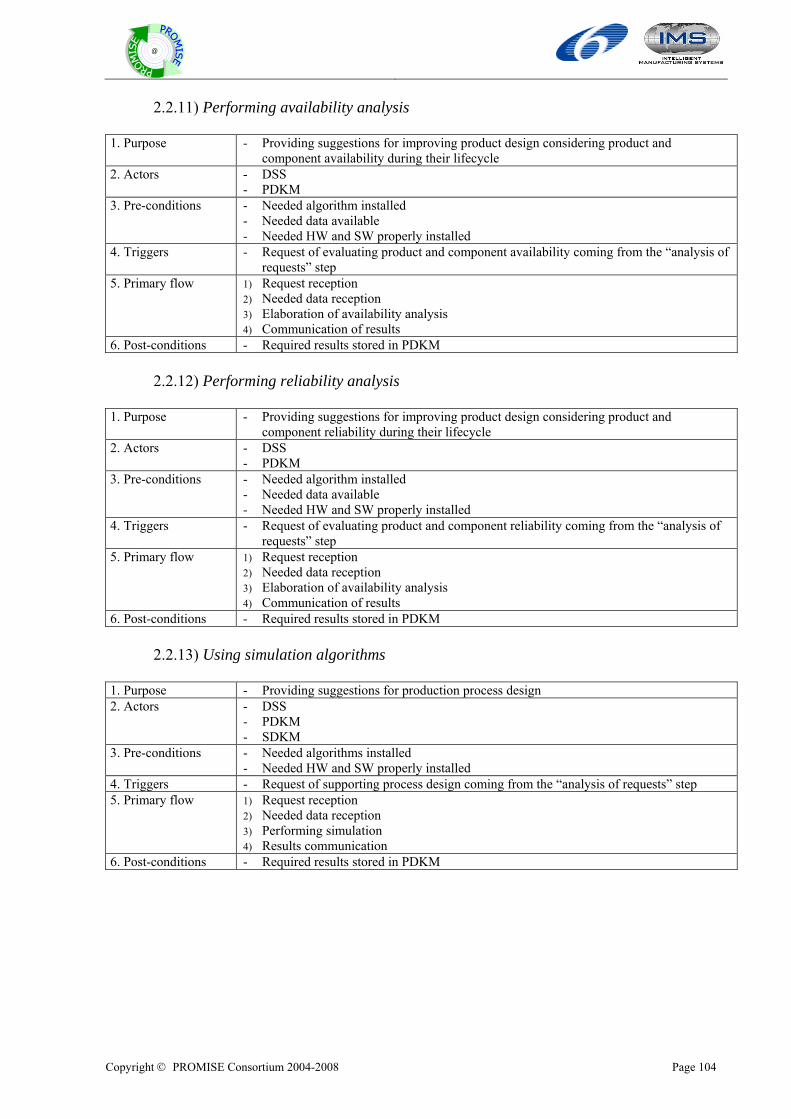
Copyright © PROMISE Consortium 2004-2008 Page 104
@
2.2.11) Performing availability analysis
1. Purpose - Providing suggestions for improving product design considering product and component availability during their lifecycle
2. Actors - DSS - PDKM
3. Pre-conditions - Needed algorithm installed - Needed data available - Needed HW and SW properly installed
4. Triggers - Request of evaluating product and component availability coming from the “analysis of requests” step
5. Primary flow 1) Request reception 2) Needed data reception 3) Elaboration of availability analysis 4) Communication of results
6. Post-conditions - Required results stored in PDKM 2.2.12) Performing reliability analysis
1. Purpose - Providing suggestions for improving product design considering product and component reliability during their lifecycle
2. Actors - DSS - PDKM
3. Pre-conditions - Needed algorithm installed - Needed data available - Needed HW and SW properly installed
4. Triggers - Request of evaluating product and component reliability coming from the “analysis of requests” step
5. Primary flow 1) Request reception 2) Needed data reception 3) Elaboration of availability analysis 4) Communication of results
6. Post-conditions - Required results stored in PDKM 2.2.13) Using simulation algorithms
1. Purpose - Providing suggestions for production process design 2. Actors - DSS
- PDKM - SDKM
3. Pre-conditions - Needed algorithms installed - Needed HW and SW properly installed
4. Triggers - Request of supporting process design coming from the “analysis of requests” step 5. Primary flow 1) Request reception
2) Needed data reception 3) Performing simulation 4) Results communication
6. Post-conditions - Required results stored in PDKM
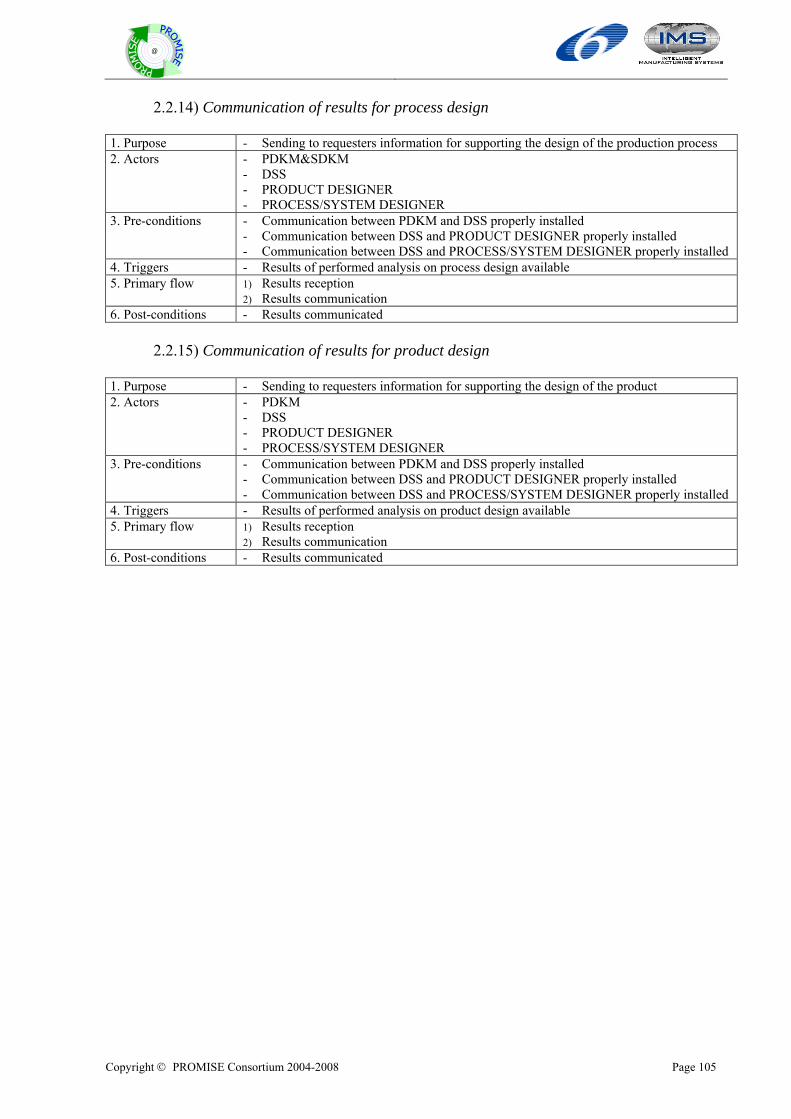
Copyright © PROMISE Consortium 2004-2008 Page 105
@
2.2.14) Communication of results for process design
1. Purpose - Sending to requesters information for supporting the design of the production process 2. Actors - PDKM&SDKM
- DSS - PRODUCT DESIGNER - PROCESS/SYSTEM DESIGNER
3. Pre-conditions - Communication between PDKM and DSS properly installed - Communication between DSS and PRODUCT DESIGNER properly installed - Communication between DSS and PROCESS/SYSTEM DESIGNER properly installed
4. Triggers - Results of performed analysis on process design available 5. Primary flow 1) Results reception
2) Results communication 6. Post-conditions - Results communicated
2.2.15) Communication of results for product design
1. Purpose - Sending to requesters information for supporting the design of the product 2. Actors - PDKM
- DSS - PRODUCT DESIGNER - PROCESS/SYSTEM DESIGNER
3. Pre-conditions - Communication between PDKM and DSS properly installed - Communication between DSS and PRODUCT DESIGNER properly installed - Communication between DSS and PROCESS/SYSTEM DESIGNER properly installed
4. Triggers - Results of performed analysis on product design available 5. Primary flow 1) Results reception
2) Results communication 6. Post-conditions - Results communicated
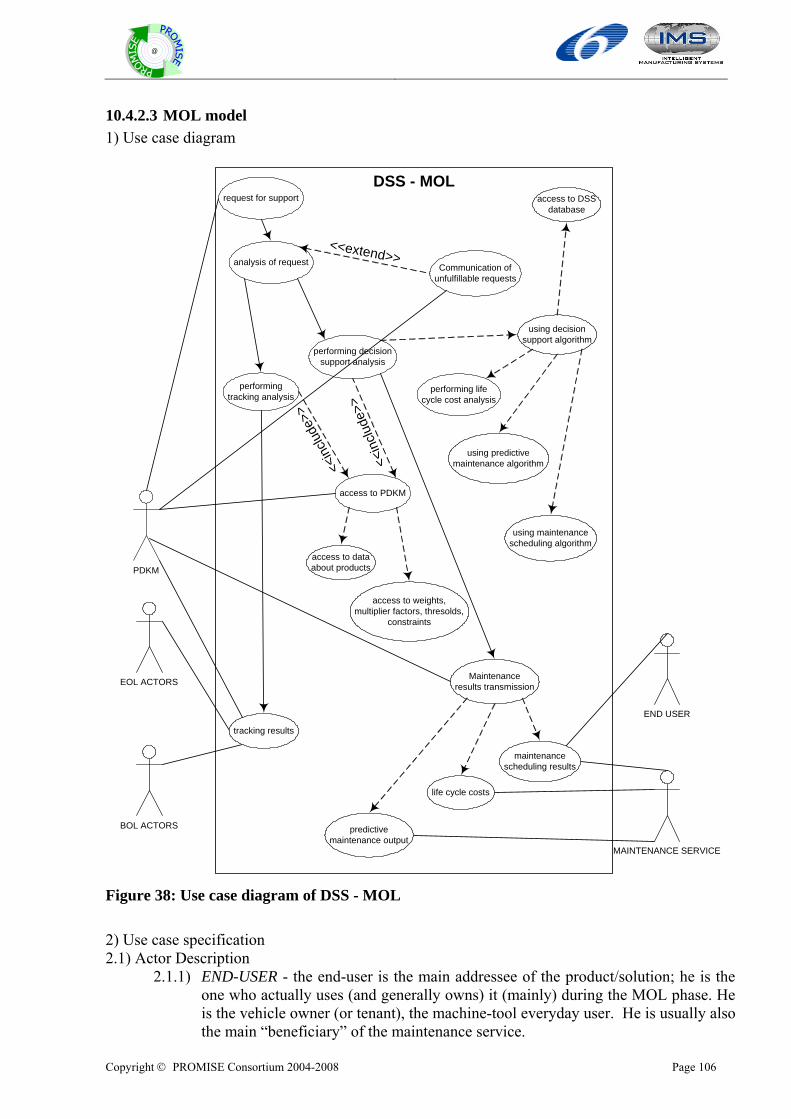
Copyright © PROMISE Consortium 2004-2008 Page 106
@
10.4.2.3 MOL model 1) Use case diagram
DSS - MOL
END USER
PDKM
MAINTENANCE SERVICE
BOL ACTORS
EOL ACTORS
analysis of request
access to PDKM
Maintenanceresults transmission
using decisionsupport algorithm
Communication ofunfulfillable requests
performingtracking analysis
performing decisionsupport analysis
using predictivemaintenance algorithm
using maintenancescheduling algorithm
performing lifecycle cost analysis
access to dataabout products
access to weights,multiplier factors, thresolds,
constraints
request for support
<<extend>>
<<in
clude
>><<
inclu
de>>
access to DSSdatabase
tracking results
maintenancescheduling results
life cycle costs
predictivemaintenance output
Figure 38: Use case diagram of DSS - MOL 2) Use case specification 2.1) Actor Description
2.1.1) END-USER - the end-user is the main addressee of the product/solution; he is the one who actually uses (and generally owns) it (mainly) during the MOL phase. He is the vehicle owner (or tenant), the machine-tool everyday user. He is usually also the main “beneficiary” of the maintenance service.
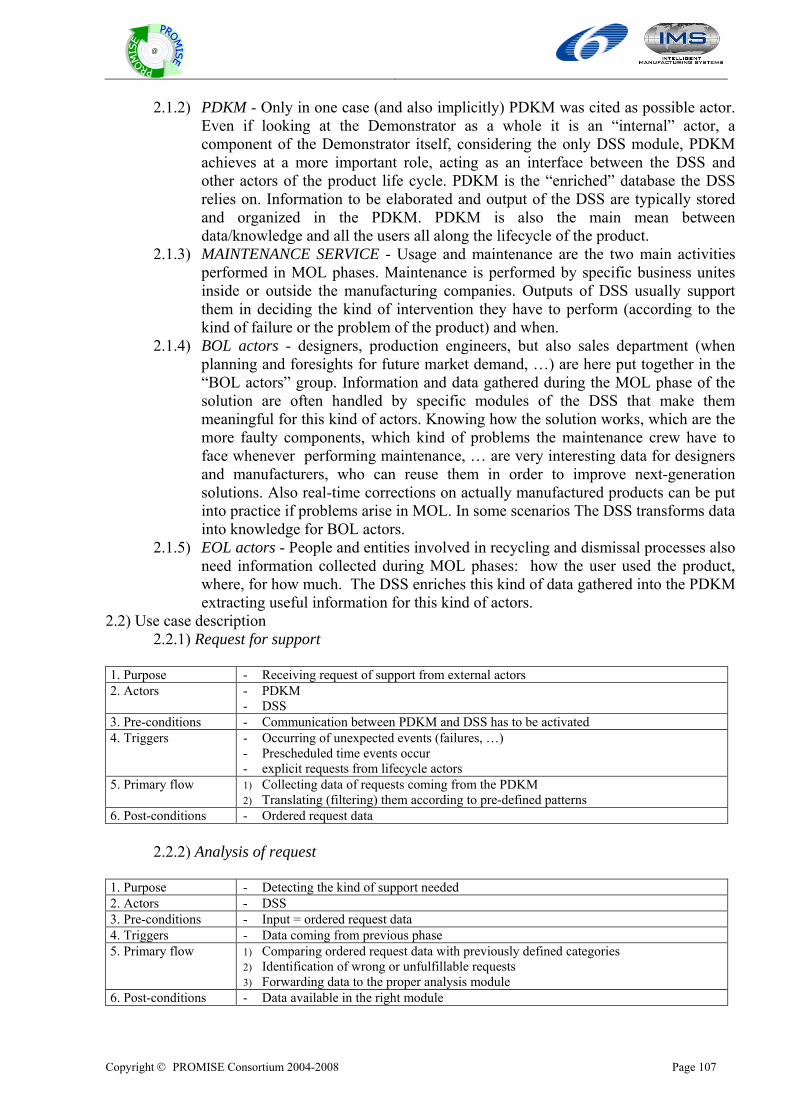
Copyright © PROMISE Consortium 2004-2008 Page 107
@
2.1.2) PDKM - Only in one case (and also implicitly) PDKM was cited as possible actor. Even if looking at the Demonstrator as a whole it is an “internal” actor, a component of the Demonstrator itself, considering the only DSS module, PDKM achieves at a more important role, acting as an interface between the DSS and other actors of the product life cycle. PDKM is the “enriched” database the DSS relies on. Information to be elaborated and output of the DSS are typically stored and organized in the PDKM. PDKM is also the main mean between data/knowledge and all the users all along the lifecycle of the product.
2.1.3) MAINTENANCE SERVICE - Usage and maintenance are the two main activities performed in MOL phases. Maintenance is performed by specific business unites inside or outside the manufacturing companies. Outputs of DSS usually support them in deciding the kind of intervention they have to perform (according to the kind of failure or the problem of the product) and when.
2.1.4) BOL actors - designers, production engineers, but also sales department (when planning and foresights for future market demand, …) are here put together in the “BOL actors” group. Information and data gathered during the MOL phase of the solution are often handled by specific modules of the DSS that make them meaningful for this kind of actors. Knowing how the solution works, which are the more faulty components, which kind of problems the maintenance crew have to face whenever performing maintenance, … are very interesting data for designers and manufacturers, who can reuse them in order to improve next-generation solutions. Also real-time corrections on actually manufactured products can be put into practice if problems arise in MOL. In some scenarios The DSS transforms data into knowledge for BOL actors.
2.1.5) EOL actors - People and entities involved in recycling and dismissal processes also need information collected during MOL phases: how the user used the product, where, for how much. The DSS enriches this kind of data gathered into the PDKM extracting useful information for this kind of actors.
2.2) Use case description 2.2.1) Request for support
1. Purpose - Receiving request of support from external actors 2. Actors - PDKM
- DSS 3. Pre-conditions - Communication between PDKM and DSS has to be activated 4. Triggers - Occurring of unexpected events (failures, …)
- Prescheduled time events occur - explicit requests from lifecycle actors
5. Primary flow 1) Collecting data of requests coming from the PDKM 2) Translating (filtering) them according to pre-defined patterns
6. Post-conditions - Ordered request data 2.2.2) Analysis of request
1. Purpose - Detecting the kind of support needed 2. Actors - DSS 3. Pre-conditions - Input = ordered request data 4. Triggers - Data coming from previous phase 5. Primary flow 1) Comparing ordered request data with previously defined categories
2) Identification of wrong or unfulfillable requests 3) Forwarding data to the proper analysis module
6. Post-conditions - Data available in the right module
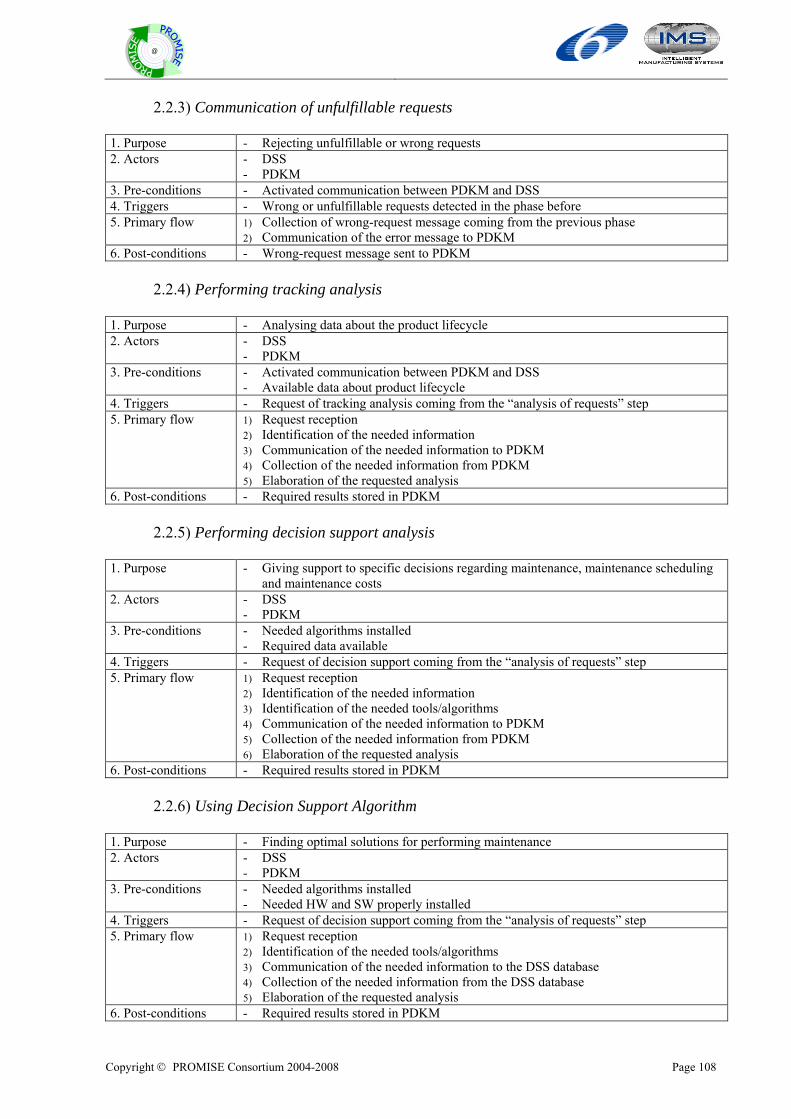
Copyright © PROMISE Consortium 2004-2008 Page 108
@
2.2.3) Communication of unfulfillable requests
1. Purpose - Rejecting unfulfillable or wrong requests 2. Actors - DSS
- PDKM 3. Pre-conditions - Activated communication between PDKM and DSS 4. Triggers - Wrong or unfulfillable requests detected in the phase before 5. Primary flow 1) Collection of wrong-request message coming from the previous phase
2) Communication of the error message to PDKM 6. Post-conditions - Wrong-request message sent to PDKM
2.2.4) Performing tracking analysis
1. Purpose - Analysing data about the product lifecycle 2. Actors - DSS
- PDKM 3. Pre-conditions - Activated communication between PDKM and DSS
- Available data about product lifecycle 4. Triggers - Request of tracking analysis coming from the “analysis of requests” step 5. Primary flow 1) Request reception
2) Identification of the needed information 3) Communication of the needed information to PDKM 4) Collection of the needed information from PDKM 5) Elaboration of the requested analysis
6. Post-conditions - Required results stored in PDKM 2.2.5) Performing decision support analysis
1. Purpose - Giving support to specific decisions regarding maintenance, maintenance scheduling and maintenance costs
2. Actors - DSS - PDKM
3. Pre-conditions - Needed algorithms installed - Required data available
4. Triggers - Request of decision support coming from the “analysis of requests” step 5. Primary flow 1) Request reception
2) Identification of the needed information 3) Identification of the needed tools/algorithms 4) Communication of the needed information to PDKM 5) Collection of the needed information from PDKM 6) Elaboration of the requested analysis
6. Post-conditions - Required results stored in PDKM 2.2.6) Using Decision Support Algorithm
1. Purpose - Finding optimal solutions for performing maintenance 2. Actors - DSS
- PDKM 3. Pre-conditions - Needed algorithms installed
- Needed HW and SW properly installed 4. Triggers - Request of decision support coming from the “analysis of requests” step 5. Primary flow 1) Request reception
2) Identification of the needed tools/algorithms 3) Communication of the needed information to the DSS database 4) Collection of the needed information from the DSS database 5) Elaboration of the requested analysis
6. Post-conditions - Required results stored in PDKM
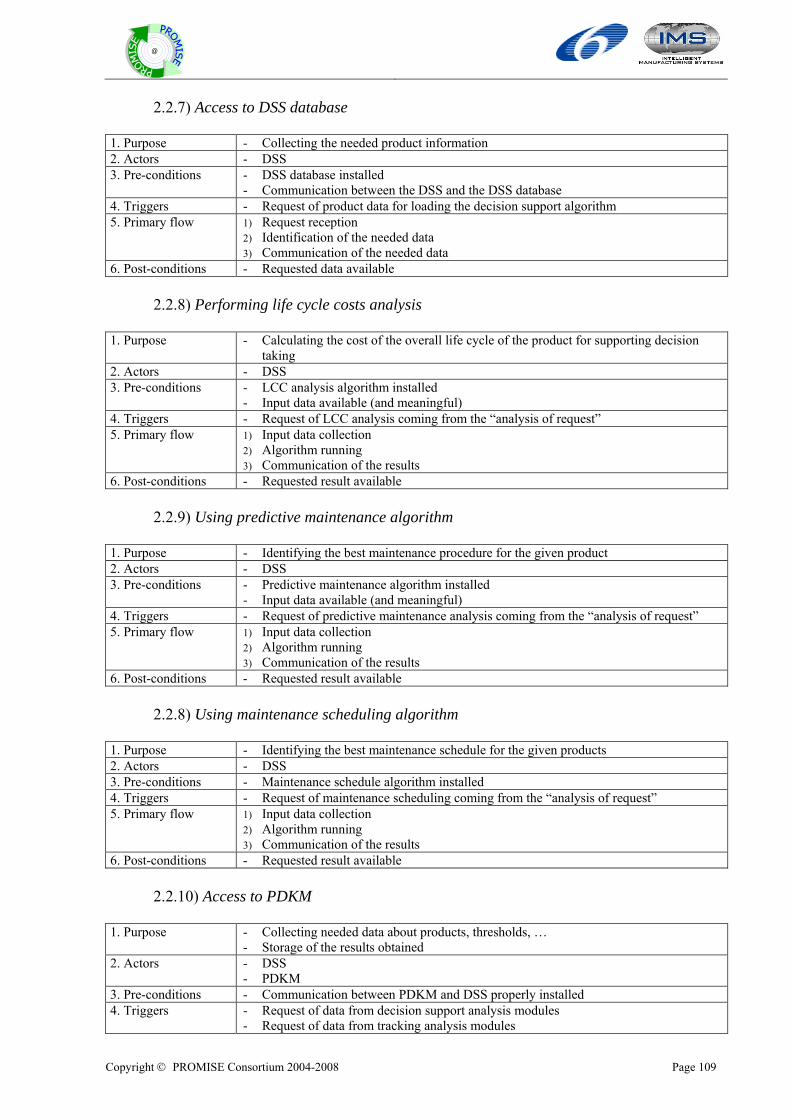
Copyright © PROMISE Consortium 2004-2008 Page 109
@
2.2.7) Access to DSS database
1. Purpose - Collecting the needed product information 2. Actors - DSS 3. Pre-conditions - DSS database installed
- Communication between the DSS and the DSS database 4. Triggers - Request of product data for loading the decision support algorithm 5. Primary flow 1) Request reception
2) Identification of the needed data 3) Communication of the needed data
6. Post-conditions - Requested data available 2.2.8) Performing life cycle costs analysis
1. Purpose - Calculating the cost of the overall life cycle of the product for supporting decision taking
2. Actors - DSS 3. Pre-conditions - LCC analysis algorithm installed
- Input data available (and meaningful) 4. Triggers - Request of LCC analysis coming from the “analysis of request” 5. Primary flow 1) Input data collection
2) Algorithm running 3) Communication of the results
6. Post-conditions - Requested result available 2.2.9) Using predictive maintenance algorithm
1. Purpose - Identifying the best maintenance procedure for the given product 2. Actors - DSS 3. Pre-conditions - Predictive maintenance algorithm installed
- Input data available (and meaningful) 4. Triggers - Request of predictive maintenance analysis coming from the “analysis of request” 5. Primary flow 1) Input data collection
2) Algorithm running 3) Communication of the results
6. Post-conditions - Requested result available 2.2.8) Using maintenance scheduling algorithm
1. Purpose - Identifying the best maintenance schedule for the given products 2. Actors - DSS 3. Pre-conditions - Maintenance schedule algorithm installed 4. Triggers - Request of maintenance scheduling coming from the “analysis of request” 5. Primary flow 1) Input data collection
2) Algorithm running 3) Communication of the results
6. Post-conditions - Requested result available 2.2.10) Access to PDKM
1. Purpose - Collecting needed data about products, thresholds, … - Storage of the results obtained
2. Actors - DSS - PDKM
3. Pre-conditions - Communication between PDKM and DSS properly installed 4. Triggers - Request of data from decision support analysis modules
- Request of data from tracking analysis modules
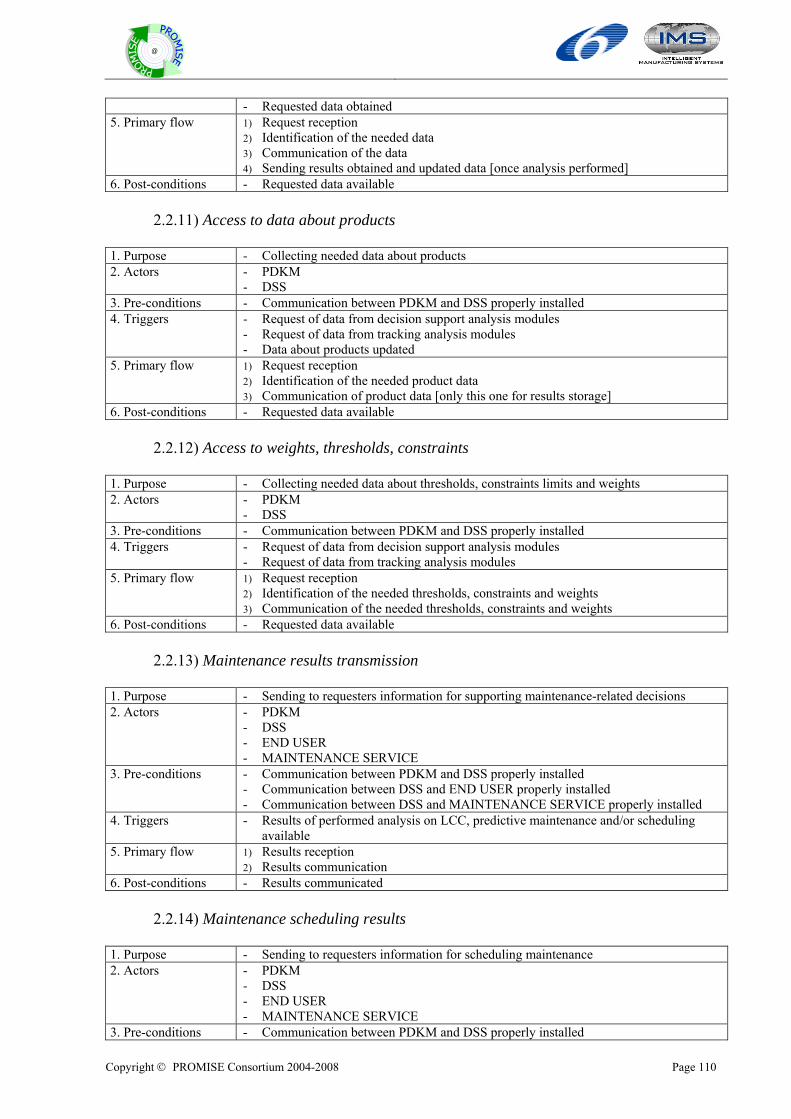
Copyright © PROMISE Consortium 2004-2008 Page 110
@
- Requested data obtained 5. Primary flow 1) Request reception
2) Identification of the needed data 3) Communication of the data 4) Sending results obtained and updated data [once analysis performed]
6. Post-conditions - Requested data available 2.2.11) Access to data about products
1. Purpose - Collecting needed data about products 2. Actors - PDKM
- DSS 3. Pre-conditions - Communication between PDKM and DSS properly installed 4. Triggers - Request of data from decision support analysis modules
- Request of data from tracking analysis modules - Data about products updated
5. Primary flow 1) Request reception 2) Identification of the needed product data 3) Communication of product data [only this one for results storage]
6. Post-conditions - Requested data available 2.2.12) Access to weights, thresholds, constraints
1. Purpose - Collecting needed data about thresholds, constraints limits and weights 2. Actors - PDKM
- DSS 3. Pre-conditions - Communication between PDKM and DSS properly installed 4. Triggers - Request of data from decision support analysis modules
- Request of data from tracking analysis modules 5. Primary flow 1) Request reception
2) Identification of the needed thresholds, constraints and weights 3) Communication of the needed thresholds, constraints and weights
6. Post-conditions - Requested data available 2.2.13) Maintenance results transmission
1. Purpose - Sending to requesters information for supporting maintenance-related decisions 2. Actors - PDKM
- DSS - END USER - MAINTENANCE SERVICE
3. Pre-conditions - Communication between PDKM and DSS properly installed - Communication between DSS and END USER properly installed - Communication between DSS and MAINTENANCE SERVICE properly installed
4. Triggers - Results of performed analysis on LCC, predictive maintenance and/or scheduling available
5. Primary flow 1) Results reception 2) Results communication
6. Post-conditions - Results communicated 2.2.14) Maintenance scheduling results
1. Purpose - Sending to requesters information for scheduling maintenance 2. Actors - PDKM
- DSS - END USER - MAINTENANCE SERVICE
3. Pre-conditions - Communication between PDKM and DSS properly installed
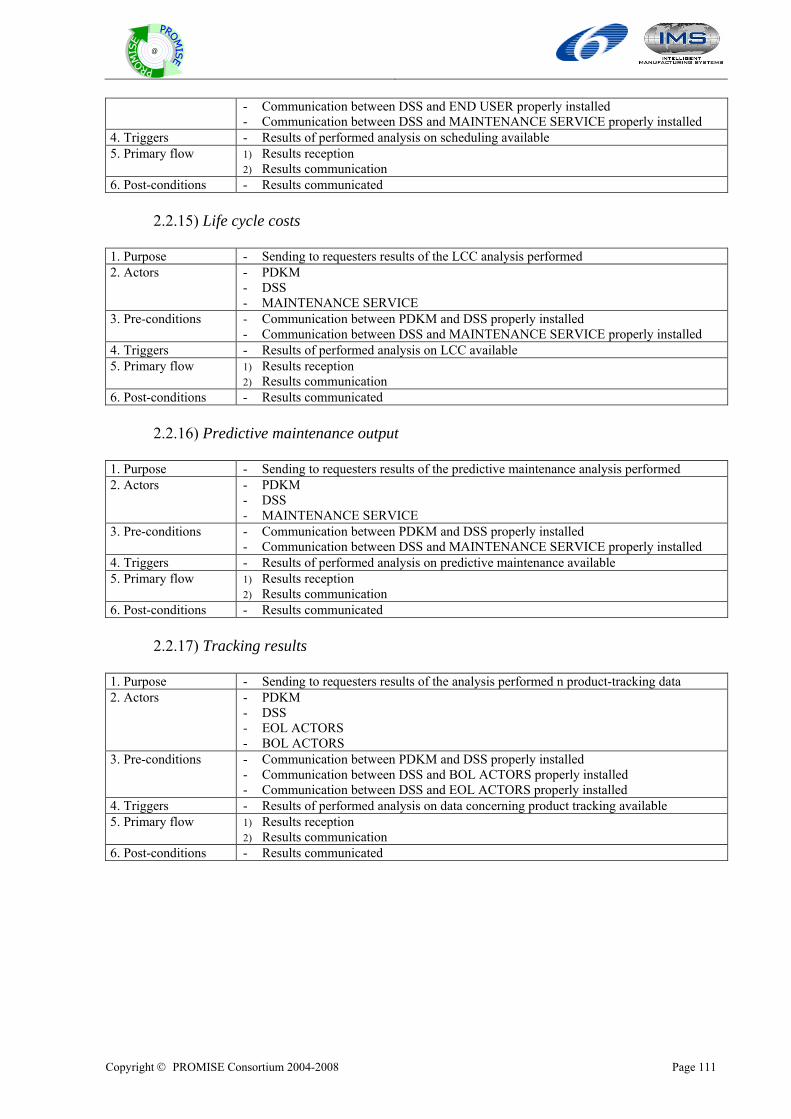
Copyright © PROMISE Consortium 2004-2008 Page 111
@
- Communication between DSS and END USER properly installed - Communication between DSS and MAINTENANCE SERVICE properly installed
4. Triggers - Results of performed analysis on scheduling available 5. Primary flow 1) Results reception
2) Results communication 6. Post-conditions - Results communicated
2.2.15) Life cycle costs
1. Purpose - Sending to requesters results of the LCC analysis performed 2. Actors - PDKM
- DSS - MAINTENANCE SERVICE
3. Pre-conditions - Communication between PDKM and DSS properly installed - Communication between DSS and MAINTENANCE SERVICE properly installed
4. Triggers - Results of performed analysis on LCC available 5. Primary flow 1) Results reception
2) Results communication 6. Post-conditions - Results communicated
2.2.16) Predictive maintenance output
1. Purpose - Sending to requesters results of the predictive maintenance analysis performed 2. Actors - PDKM
- DSS - MAINTENANCE SERVICE
3. Pre-conditions - Communication between PDKM and DSS properly installed - Communication between DSS and MAINTENANCE SERVICE properly installed
4. Triggers - Results of performed analysis on predictive maintenance available 5. Primary flow 1) Results reception
2) Results communication 6. Post-conditions - Results communicated
2.2.17) Tracking results
1. Purpose - Sending to requesters results of the analysis performed n product-tracking data 2. Actors - PDKM
- DSS - EOL ACTORS - BOL ACTORS
3. Pre-conditions - Communication between PDKM and DSS properly installed - Communication between DSS and BOL ACTORS properly installed - Communication between DSS and EOL ACTORS properly installed
4. Triggers - Results of performed analysis on data concerning product tracking available 5. Primary flow 1) Results reception
2) Results communication 6. Post-conditions - Results communicated
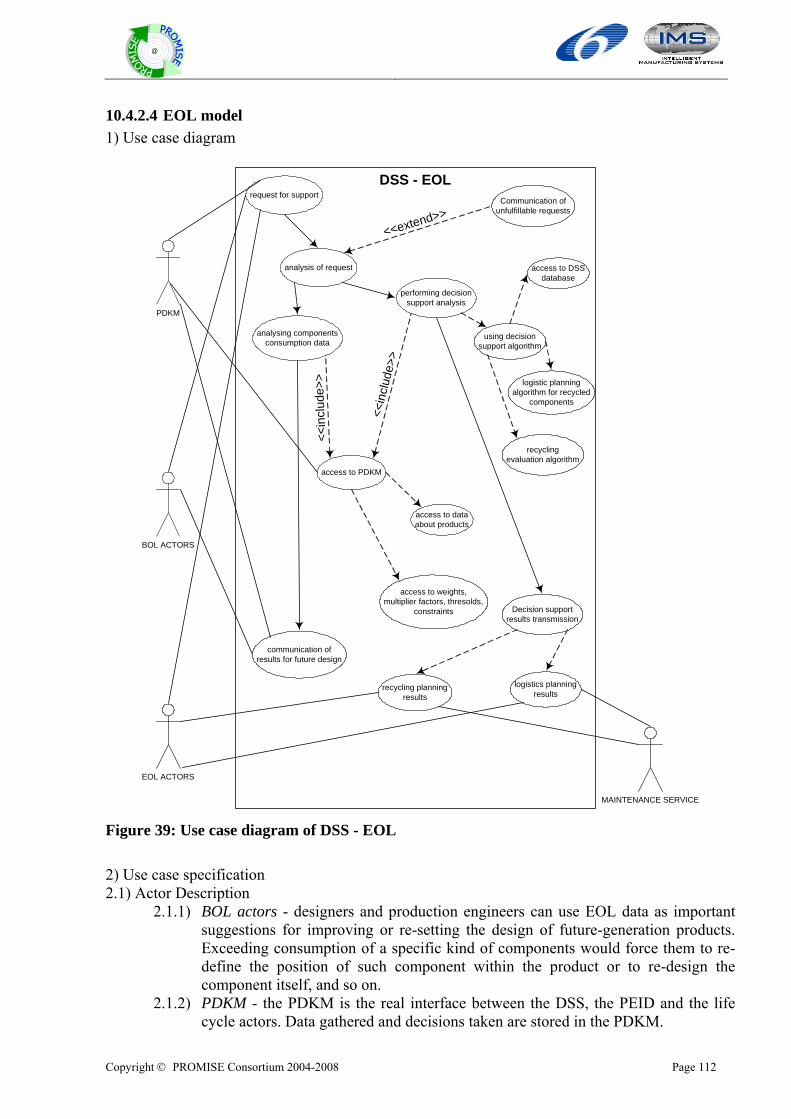
Copyright © PROMISE Consortium 2004-2008 Page 112
@
10.4.2.4 EOL model 1) Use case diagram
DSS - EOL
PDKM
MAINTENANCE SERVICE
BOL ACTORS
EOL ACTORS
analysis of request
access to PDKM
Decision supportresults transmission
using decisionsupport algorithm
Communication ofunfulfillable requests
analysing componentsconsumption data
recyclingevaluation algorithm
access to dataabout products
access to weights,multiplier factors, thresolds,
constraints
request for support
<<extend>>
<<in
clud
e>>
<<in
clud
e>>
access to DSSdatabase
communication ofresults for future design
logistics planningresults
recycling planningresults
logistic planningalgorithm for recycled
components
performing decisionsupport analysis
Figure 39: Use case diagram of DSS - EOL
2) Use case specification 2.1) Actor Description
2.1.1) BOL actors - designers and production engineers can use EOL data as important suggestions for improving or re-setting the design of future-generation products. Exceeding consumption of a specific kind of components would force them to re-define the position of such component within the product or to re-design the component itself, and so on.
2.1.2) PDKM - the PDKM is the real interface between the DSS, the PEID and the life cycle actors. Data gathered and decisions taken are stored in the PDKM.
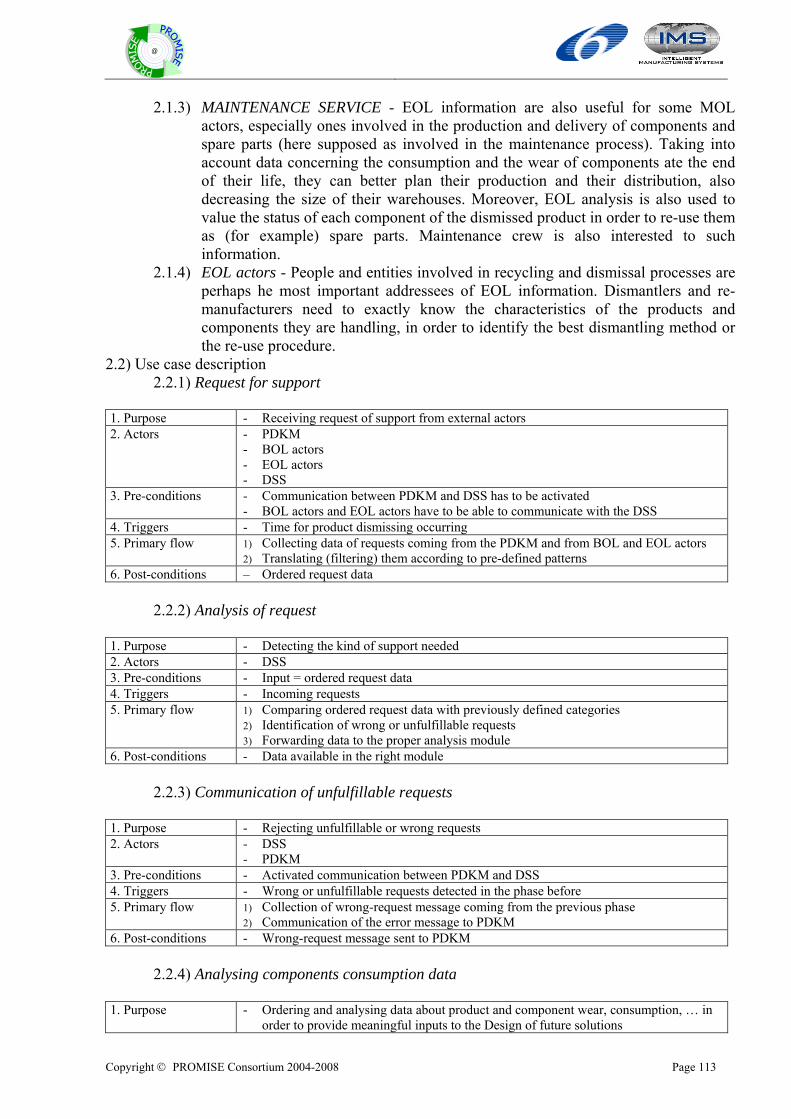
Copyright © PROMISE Consortium 2004-2008 Page 113
@
2.1.3) MAINTENANCE SERVICE - EOL information are also useful for some MOL actors, especially ones involved in the production and delivery of components and spare parts (here supposed as involved in the maintenance process). Taking into account data concerning the consumption and the wear of components ate the end of their life, they can better plan their production and their distribution, also decreasing the size of their warehouses. Moreover, EOL analysis is also used to value the status of each component of the dismissed product in order to re-use them as (for example) spare parts. Maintenance crew is also interested to such information.
2.1.4) EOL actors - People and entities involved in recycling and dismissal processes are perhaps he most important addressees of EOL information. Dismantlers and re-manufacturers need to exactly know the characteristics of the products and components they are handling, in order to identify the best dismantling method or the re-use procedure.
2.2) Use case description 2.2.1) Request for support
1. Purpose - Receiving request of support from external actors 2. Actors - PDKM
- BOL actors - EOL actors - DSS
3. Pre-conditions - Communication between PDKM and DSS has to be activated - BOL actors and EOL actors have to be able to communicate with the DSS
4. Triggers - Time for product dismissing occurring 5. Primary flow 1) Collecting data of requests coming from the PDKM and from BOL and EOL actors
2) Translating (filtering) them according to pre-defined patterns 6. Post-conditions – Ordered request data
2.2.2) Analysis of request
1. Purpose - Detecting the kind of support needed 2. Actors - DSS 3. Pre-conditions - Input = ordered request data 4. Triggers - Incoming requests 5. Primary flow 1) Comparing ordered request data with previously defined categories
2) Identification of wrong or unfulfillable requests 3) Forwarding data to the proper analysis module
6. Post-conditions - Data available in the right module 2.2.3) Communication of unfulfillable requests
1. Purpose - Rejecting unfulfillable or wrong requests 2. Actors - DSS
- PDKM 3. Pre-conditions - Activated communication between PDKM and DSS 4. Triggers - Wrong or unfulfillable requests detected in the phase before 5. Primary flow 1) Collection of wrong-request message coming from the previous phase
2) Communication of the error message to PDKM 6. Post-conditions - Wrong-request message sent to PDKM
2.2.4) Analysing components consumption data
1. Purpose - Ordering and analysing data about product and component wear, consumption, … in order to provide meaningful inputs to the Design of future solutions
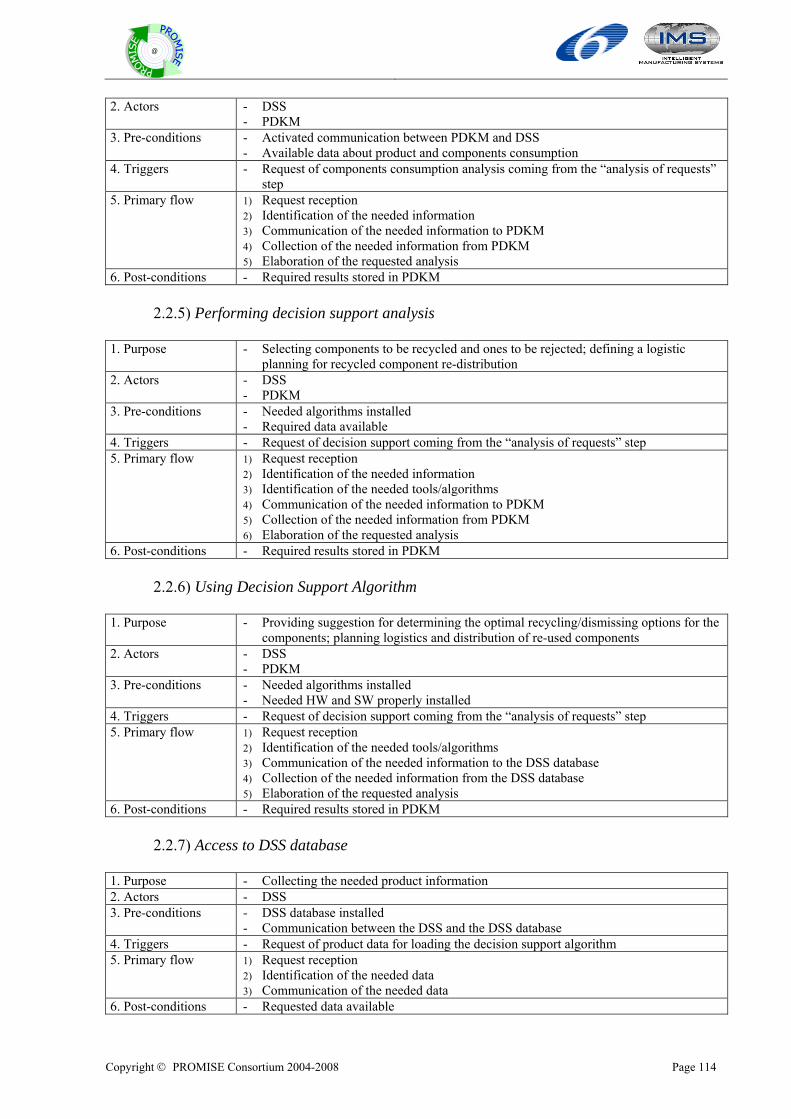
Copyright © PROMISE Consortium 2004-2008 Page 114
@
2. Actors - DSS - PDKM
3. Pre-conditions - Activated communication between PDKM and DSS - Available data about product and components consumption
4. Triggers - Request of components consumption analysis coming from the “analysis of requests” step
5. Primary flow 1) Request reception 2) Identification of the needed information 3) Communication of the needed information to PDKM 4) Collection of the needed information from PDKM 5) Elaboration of the requested analysis
6. Post-conditions - Required results stored in PDKM 2.2.5) Performing decision support analysis
1. Purpose - Selecting components to be recycled and ones to be rejected; defining a logistic planning for recycled component re-distribution
2. Actors - DSS - PDKM
3. Pre-conditions - Needed algorithms installed - Required data available
4. Triggers - Request of decision support coming from the “analysis of requests” step 5. Primary flow 1) Request reception
2) Identification of the needed information 3) Identification of the needed tools/algorithms 4) Communication of the needed information to PDKM 5) Collection of the needed information from PDKM 6) Elaboration of the requested analysis
6. Post-conditions - Required results stored in PDKM 2.2.6) Using Decision Support Algorithm
1. Purpose - Providing suggestion for determining the optimal recycling/dismissing options for the components; planning logistics and distribution of re-used components
2. Actors - DSS - PDKM
3. Pre-conditions - Needed algorithms installed - Needed HW and SW properly installed
4. Triggers - Request of decision support coming from the “analysis of requests” step 5. Primary flow 1) Request reception
2) Identification of the needed tools/algorithms 3) Communication of the needed information to the DSS database 4) Collection of the needed information from the DSS database 5) Elaboration of the requested analysis
6. Post-conditions - Required results stored in PDKM 2.2.7) Access to DSS database
1. Purpose - Collecting the needed product information 2. Actors - DSS 3. Pre-conditions - DSS database installed
- Communication between the DSS and the DSS database 4. Triggers - Request of product data for loading the decision support algorithm 5. Primary flow 1) Request reception
2) Identification of the needed data 3) Communication of the needed data
6. Post-conditions - Requested data available
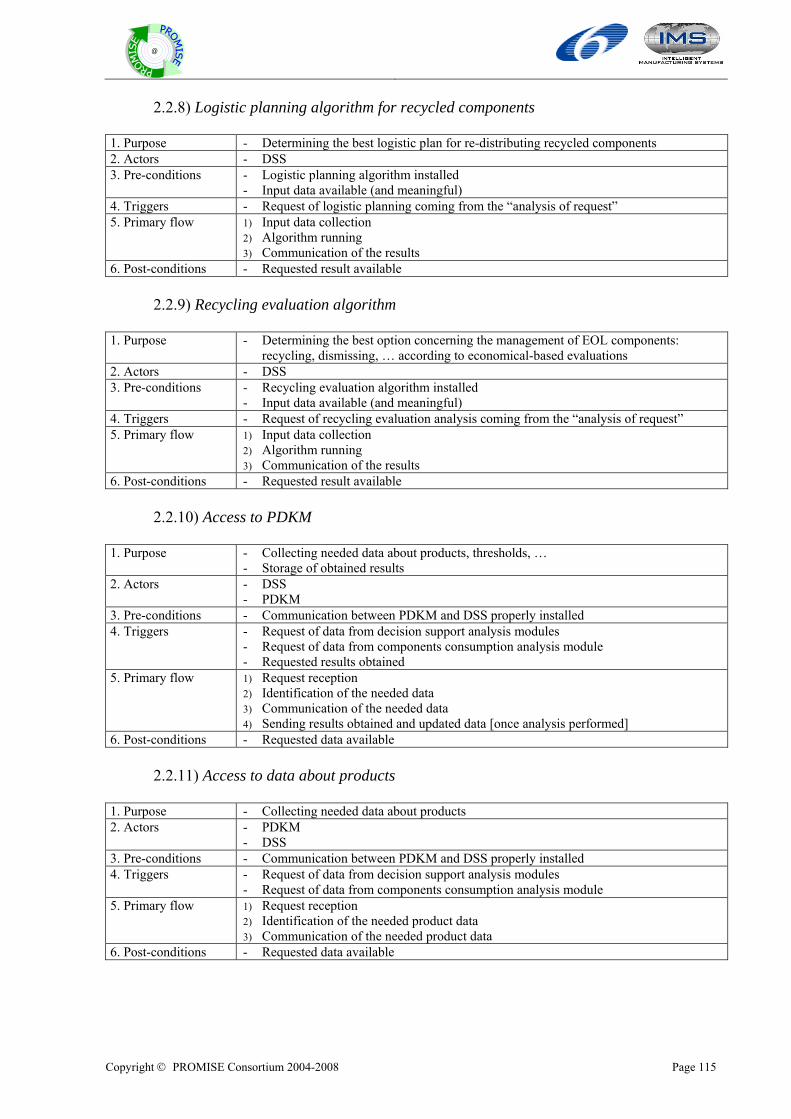
Copyright © PROMISE Consortium 2004-2008 Page 115
@
2.2.8) Logistic planning algorithm for recycled components
1. Purpose - Determining the best logistic plan for re-distributing recycled components 2. Actors - DSS 3. Pre-conditions - Logistic planning algorithm installed
- Input data available (and meaningful) 4. Triggers - Request of logistic planning coming from the “analysis of request” 5. Primary flow 1) Input data collection
2) Algorithm running 3) Communication of the results
6. Post-conditions - Requested result available 2.2.9) Recycling evaluation algorithm
1. Purpose - Determining the best option concerning the management of EOL components: recycling, dismissing, … according to economical-based evaluations
2. Actors - DSS 3. Pre-conditions - Recycling evaluation algorithm installed
- Input data available (and meaningful) 4. Triggers - Request of recycling evaluation analysis coming from the “analysis of request” 5. Primary flow 1) Input data collection
2) Algorithm running 3) Communication of the results
6. Post-conditions - Requested result available 2.2.10) Access to PDKM
1. Purpose - Collecting needed data about products, thresholds, … - Storage of obtained results
2. Actors - DSS - PDKM
3. Pre-conditions - Communication between PDKM and DSS properly installed 4. Triggers - Request of data from decision support analysis modules
- Request of data from components consumption analysis module - Requested results obtained
5. Primary flow 1) Request reception 2) Identification of the needed data 3) Communication of the needed data 4) Sending results obtained and updated data [once analysis performed]
6. Post-conditions - Requested data available 2.2.11) Access to data about products
1. Purpose - Collecting needed data about products 2. Actors - PDKM
- DSS 3. Pre-conditions - Communication between PDKM and DSS properly installed 4. Triggers - Request of data from decision support analysis modules
- Request of data from components consumption analysis module 5. Primary flow 1) Request reception
2) Identification of the needed product data 3) Communication of the needed product data
6. Post-conditions - Requested data available
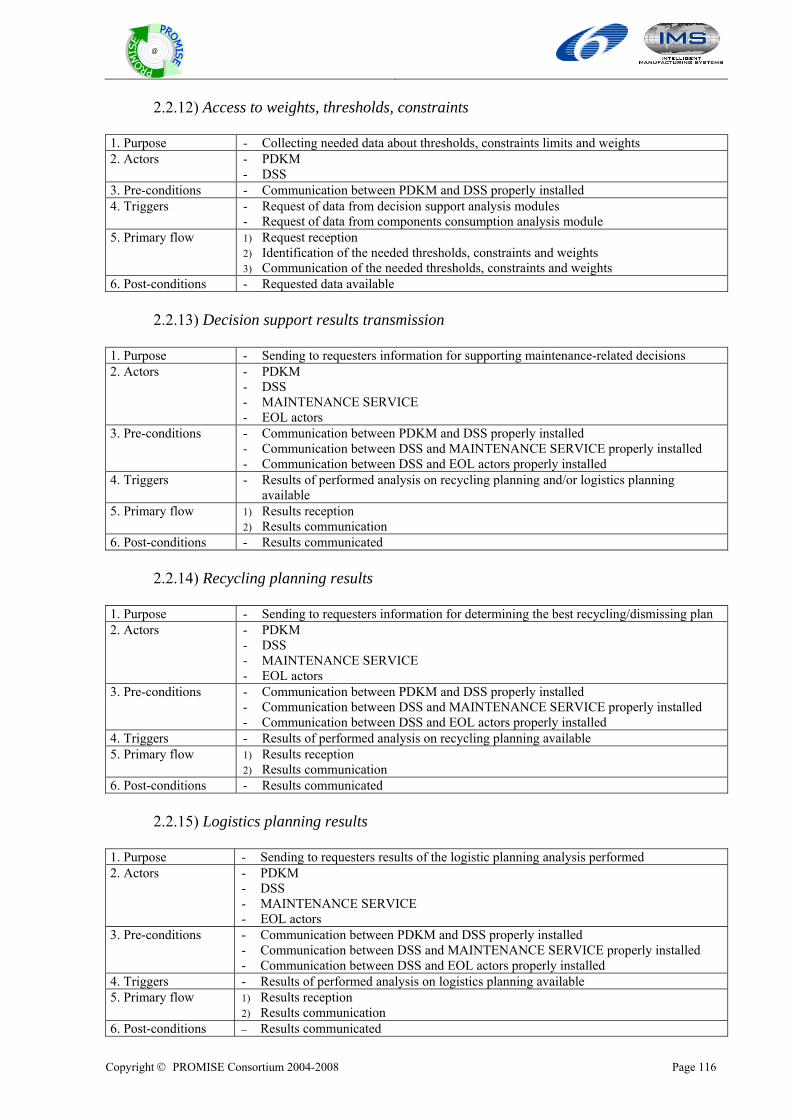
Copyright © PROMISE Consortium 2004-2008 Page 116
@
2.2.12) Access to weights, thresholds, constraints
1. Purpose - Collecting needed data about thresholds, constraints limits and weights 2. Actors - PDKM
- DSS 3. Pre-conditions - Communication between PDKM and DSS properly installed 4. Triggers - Request of data from decision support analysis modules
- Request of data from components consumption analysis module 5. Primary flow 1) Request reception
2) Identification of the needed thresholds, constraints and weights 3) Communication of the needed thresholds, constraints and weights
6. Post-conditions - Requested data available 2.2.13) Decision support results transmission
1. Purpose - Sending to requesters information for supporting maintenance-related decisions 2. Actors - PDKM
- DSS - MAINTENANCE SERVICE - EOL actors
3. Pre-conditions - Communication between PDKM and DSS properly installed - Communication between DSS and MAINTENANCE SERVICE properly installed - Communication between DSS and EOL actors properly installed
4. Triggers - Results of performed analysis on recycling planning and/or logistics planning available
5. Primary flow 1) Results reception 2) Results communication
6. Post-conditions - Results communicated 2.2.14) Recycling planning results
1. Purpose - Sending to requesters information for determining the best recycling/dismissing plan 2. Actors - PDKM
- DSS - MAINTENANCE SERVICE - EOL actors
3. Pre-conditions - Communication between PDKM and DSS properly installed - Communication between DSS and MAINTENANCE SERVICE properly installed - Communication between DSS and EOL actors properly installed
4. Triggers - Results of performed analysis on recycling planning available 5. Primary flow 1) Results reception
2) Results communication 6. Post-conditions - Results communicated
2.2.15) Logistics planning results
1. Purpose - Sending to requesters results of the logistic planning analysis performed 2. Actors - PDKM
- DSS - MAINTENANCE SERVICE - EOL actors
3. Pre-conditions - Communication between PDKM and DSS properly installed - Communication between DSS and MAINTENANCE SERVICE properly installed - Communication between DSS and EOL actors properly installed
4. Triggers - Results of performed analysis on logistics planning available 5. Primary flow 1) Results reception
2) Results communication 6. Post-conditions – Results communicated

Copyright © PROMISE Consortium 2004-2008 Page 117
@
2.2.16) Communication of results for future design
1. Purpose – Sending to requesters results of the components consumption analysis performed 2. Actors – PDKM
– DSS – BOL actors
3. Pre-conditions – Communication between PDKM and DSS properly installed – Communication between DSS and BOL actors properly installed
4. Triggers – Results of performed analysis on components consumption available 5. Primary flow 1) Results reception
2) Results communication 6. Post-conditions – Results communicated
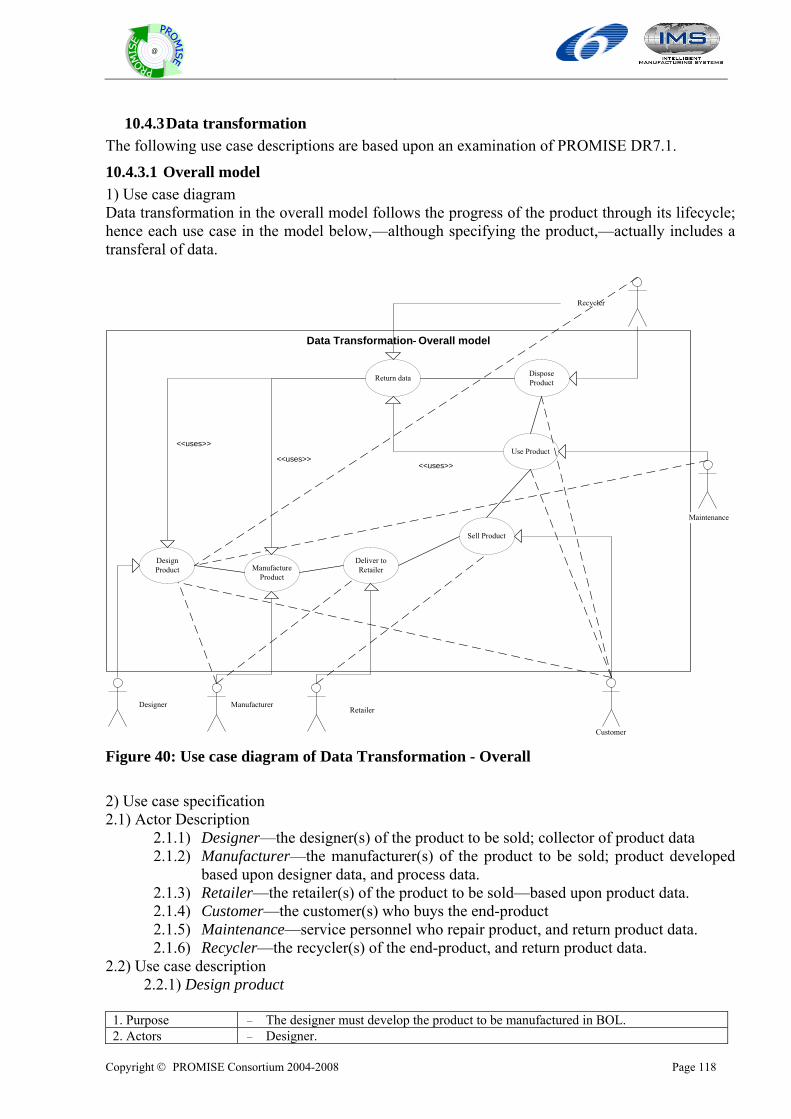
Copyright © PROMISE Consortium 2004-2008 Page 118
@
10.4.3 Data transformation The following use case descriptions are based upon an examination of PROMISE DR7.1.
10.4.3.1 Overall model 1) Use case diagram Data transformation in the overall model follows the progress of the product through its lifecycle; hence each use case in the model below,—although specifying the product,—actually includes a transferal of data.
<<uses>>
Data Transformation Overall model
Designer ManufacturerRetailer
Design Product Manufacture
Product
Deliver to Retailer
Sell Product
Use Product
Dispose ProductReturn data
Customer
Maintenance
Recycler
<<uses>>
<<uses>>
Figure 40: Use case diagram of Data Transformation - Overall 2) Use case specification 2.1) Actor Description
2.1.1) Designer—the designer(s) of the product to be sold; collector of product data 2.1.2) Manufacturer—the manufacturer(s) of the product to be sold; product developed
based upon designer data, and process data. 2.1.3) Retailer—the retailer(s) of the product to be sold—based upon product data. 2.1.4) Customer—the customer(s) who buys the end-product 2.1.5) Maintenance—service personnel who repair product, and return product data. 2.1.6) Recycler—the recycler(s) of the end-product, and return product data.
2.2) Use case description 2.2.1) Design product
1. Purpose – The designer must develop the product to be manufactured in BOL. 2. Actors – Designer.
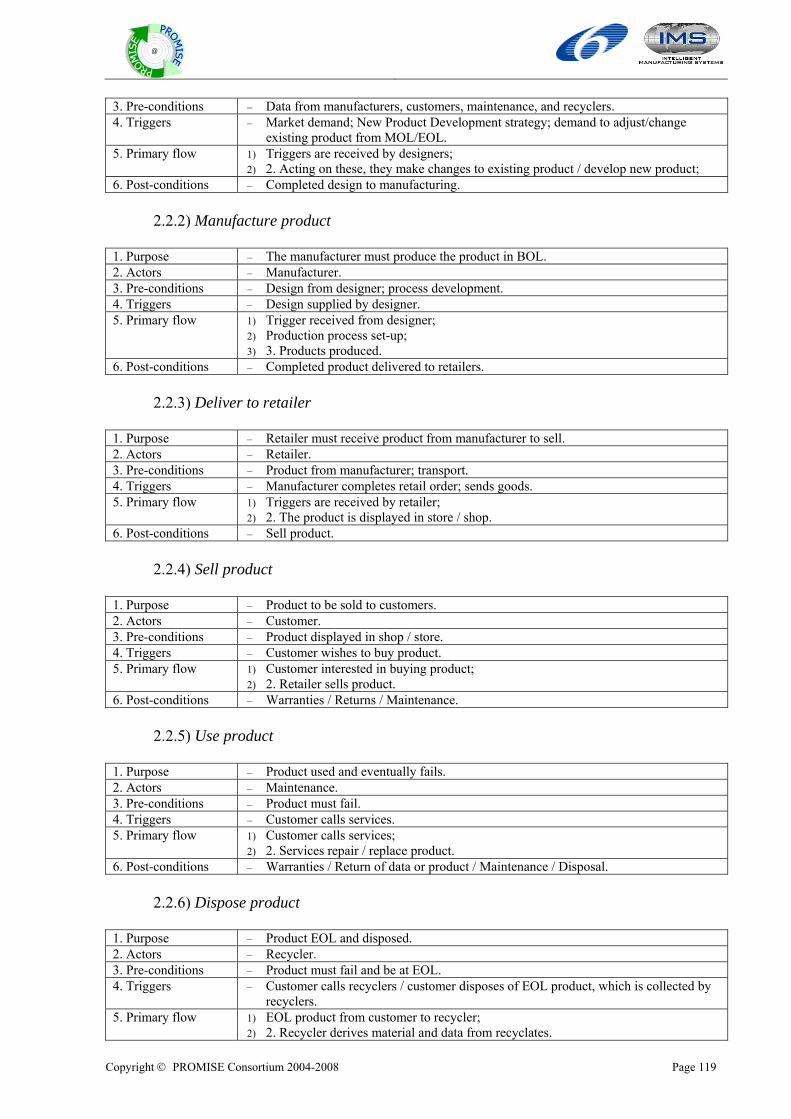
Copyright © PROMISE Consortium 2004-2008 Page 119
@
3. Pre-conditions – Data from manufacturers, customers, maintenance, and recyclers. 4. Triggers – Market demand; New Product Development strategy; demand to adjust/change
existing product from MOL/EOL. 5. Primary flow 1) Triggers are received by designers;
2) 2. Acting on these, they make changes to existing product / develop new product; 6. Post-conditions – Completed design to manufacturing.
2.2.2) Manufacture product
1. Purpose – The manufacturer must produce the product in BOL. 2. Actors – Manufacturer. 3. Pre-conditions – Design from designer; process development. 4. Triggers – Design supplied by designer. 5. Primary flow 1) Trigger received from designer;
2) Production process set-up; 3) 3. Products produced.
6. Post-conditions – Completed product delivered to retailers. 2.2.3) Deliver to retailer
1. Purpose – Retailer must receive product from manufacturer to sell. 2. Actors – Retailer. 3. Pre-conditions – Product from manufacturer; transport. 4. Triggers – Manufacturer completes retail order; sends goods. 5. Primary flow 1) Triggers are received by retailer;
2) 2. The product is displayed in store / shop. 6. Post-conditions – Sell product.
2.2.4) Sell product
1. Purpose – Product to be sold to customers. 2. Actors – Customer. 3. Pre-conditions – Product displayed in shop / store. 4. Triggers – Customer wishes to buy product. 5. Primary flow 1) Customer interested in buying product;
2) 2. Retailer sells product. 6. Post-conditions – Warranties / Returns / Maintenance.
2.2.5) Use product
1. Purpose – Product used and eventually fails. 2. Actors – Maintenance. 3. Pre-conditions – Product must fail. 4. Triggers – Customer calls services. 5. Primary flow 1) Customer calls services;
2) 2. Services repair / replace product. 6. Post-conditions – Warranties / Return of data or product / Maintenance / Disposal.
2.2.6) Dispose product
1. Purpose – Product EOL and disposed. 2. Actors – Recycler. 3. Pre-conditions – Product must fail and be at EOL. 4. Triggers – Customer calls recyclers / customer disposes of EOL product, which is collected by
recyclers. 5. Primary flow 1) EOL product from customer to recycler;
2) 2. Recycler derives material and data from recyclates.
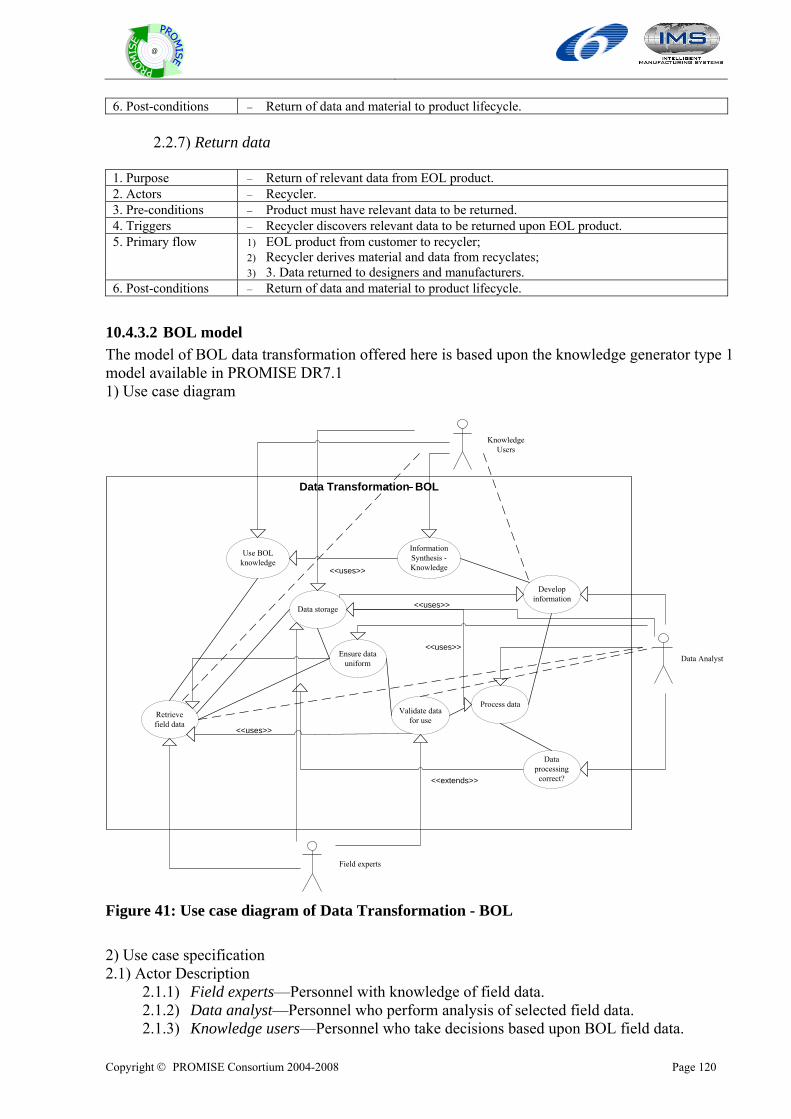
Copyright © PROMISE Consortium 2004-2008 Page 120
@
6. Post-conditions – Return of data and material to product lifecycle. 2.2.7) Return data
1. Purpose – Return of relevant data from EOL product. 2. Actors – Recycler. 3. Pre-conditions – Product must have relevant data to be returned. 4. Triggers – Recycler discovers relevant data to be returned upon EOL product. 5. Primary flow 1) EOL product from customer to recycler;
2) Recycler derives material and data from recyclates; 3) 3. Data returned to designers and manufacturers.
6. Post-conditions – Return of data and material to product lifecycle.
10.4.3.2 BOL model The model of BOL data transformation offered here is based upon the knowledge generator type 1 model available in PROMISE DR7.1 1) Use case diagram
<<uses>>
Data Transformation BOL
Field experts
Data Analyst
Knowledge Users
Retrieve field data
Ensure data uniform
Validate data for use
Process data
Data processing
correct?
Develop information
Information Synthesis -Knowledge
<<uses>>
<<extends>>
Use BOL knowledge
Data storage <<uses>>
<<uses>>
Figure 41: Use case diagram of Data Transformation - BOL 2) Use case specification 2.1) Actor Description
2.1.1) Field experts—Personnel with knowledge of field data. 2.1.2) Data analyst—Personnel who perform analysis of selected field data. 2.1.3) Knowledge users—Personnel who take decisions based upon BOL field data.
Copyright © PROMISE Consortium 2004-2008 Page 121
@
2.2) Use case description 2.2.1) Retrieve field data
1. Purpose – The field expert collects the BOL data that is being returned from the field—only
relevant data for the knowledge that is sought. 2. Actors – Field experts. 3. Pre-conditions – Data from manufacturers, customers, maintenance, and recyclers (see overall model). 4. Triggers – Market demand; Performance measurement; updating currently-held data etc. 5. Primary flow 1) Triggers are received by field experts;
2) 2. Triggers are subsequently acted upon in next use cases. 6. Post-conditions – Completed retrieval of data must be uniformized.
2.2.2) Data storage
1. Purpose – At each point in data collection and transformation, data must be stored. 2. Actors – Field experts; 8.3.2 Data analyst; 8.3.3 Knowledge users. 3. Pre-conditions – Data must first be made available. 4. Triggers – Collection / Transformation of data. 5. Primary flow 1) Triggers are received by actors ;
2) 2. Triggers are subsequently acted upon in next use cases and restored. 6. Post-conditions – Restorage.
2.2.3) Ensure data uniform
1. Purpose – Retrieved data from field must be checked for uniformity. 2. Actors – Data analyst. 3. Pre-conditions – Data must first be made available. 4. Triggers – Collection of data. 5. Primary flow 1) Triggers are received by data analyst either straight from field or from storage;
2) 2. Triggers are subsequently acted upon in next use cases and restored. 6. Post-conditions – Validation of data.
2.2.4) Validate data for use
1. Purpose – In order to use data for a certain purpose, the data must be validated for that purpose. 2. Actors – Field experts. 3. Pre-conditions – Data must first be made available and uniformized. 4. Triggers – Collection of data / Uniformity. 5. Primary flow 1) Triggers are received by field experts either straight from personnel or from storage;
2) 2. Triggers are subsequently acted upon in next use cases and restored. 6. Post-conditions – Processing of data / Ensuring processing correct.
2.2.5) Process data
1. Purpose – In order to develop information the data must be processed. 2. Actors – Data analyst. 3. Pre-conditions – Data must first be made available, uniformized and validated. 4. Triggers – Collection of data / Uniformity / Validation. 5. Primary flow 1) Triggers are received by data analysts either straight from personnel or from storage;
2) 2. Triggers are subsequently acted upon in next use cases and restored. 6. Post-conditions – Ensuring processing correct.
Copyright © PROMISE Consortium 2004-2008 Page 122
@
2.2.6) Data processing correct?
1. Purpose – In order to proceed with information development, the data must be processed correctly—this step checks this.
2. Actors – Data analyst. 3. Pre-conditions – Data must first be made available, uniformized, validated and processed. 4. Triggers – Collection of data / Uniformity / Validation / Processing. 5. Primary flow 1) Triggers are received by data analysts either straight from personnel or from storage;
2) 2. Triggers are subsequently acted upon in next use cases and restored. 6. Post-conditions – Develop information from processed and correct data.
2.2.7) Develop information
1. Purpose – In order to proceed with knowledge development, information must be developed from the processed data.
2. Actors – Data analyst. 3. Pre-conditions – Data must first be made available, uniformized, validated and processed. 4. Triggers – Collection of data / Uniformity / Validation / Processing. 5. Primary flow 1) Triggers are received by data analysts either straight from personnel or from storage;
2) 2. Triggers are subsequently acted upon in next use cases and restored. 6. Post-conditions – Information synthesis.
2.2.9) Information synthesis - knowledge
1. Purpose – The integration of numerous pieces of information creates knowledge. 2. Actors – Knowledge users. 3. Pre-conditions – Data must first be made available, uniformized, validated and processed. Information
must be developed. 4. Triggers – Collection of data / Uniformity / Validation / Processing. Development of
Information. 5. Primary flow 1) Triggers are received by knowledge users either straight from personnel or from
storage; 2) 2. Triggers are subsequently acted upon in next use cases and restored.
6. Post-conditions – Use of developed knowledge 2.2.10) Use of BOL knowledge
1. Purpose – The use the developed knowledge is put to. 2. Actors – Knowledge users. 3. Pre-conditions – Data must first be made available, uniformized, validated and processed. Information
must be developed and synthesised, creating knowledge. 4. Triggers – Collection of data / Uniformity / Validation / Processing. Development of
Information. Development of knowledge. 5. Primary flow 1) 1. Knowledge created and used to update field data, its retrieval or to update other
entities of the BOL system, or to impact upon MOL and EOL. 6. Post-conditions
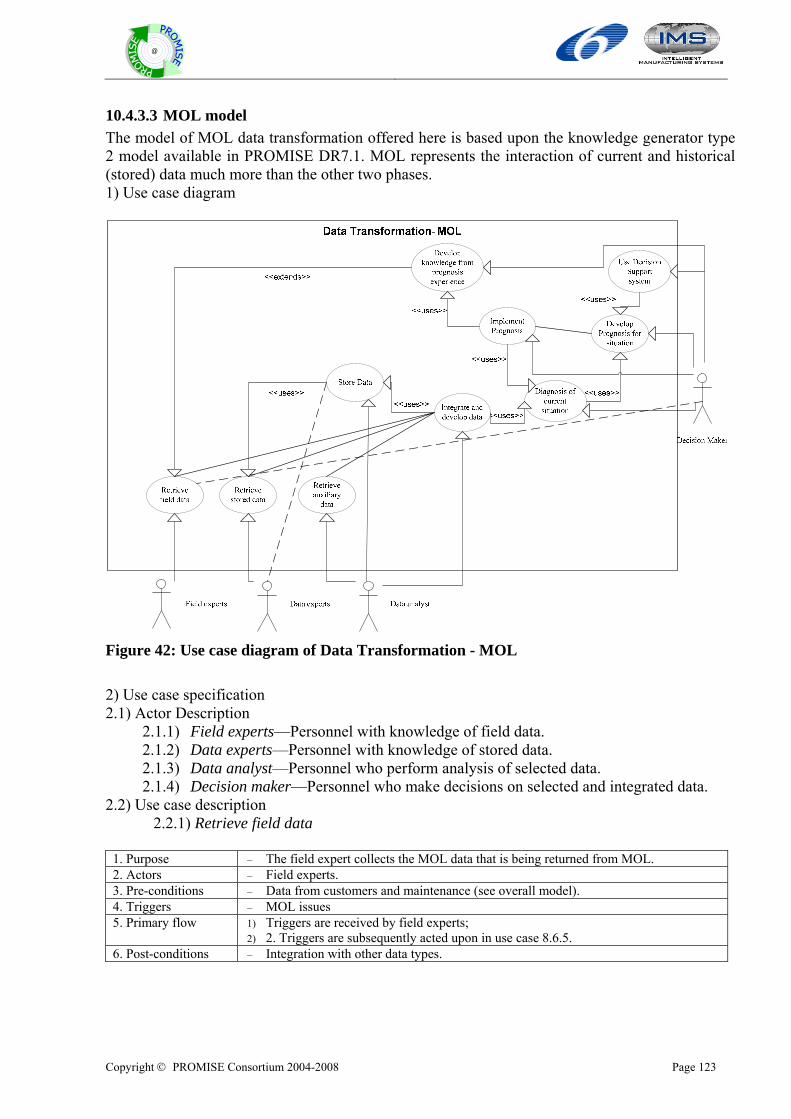
Copyright © PROMISE Consortium 2004-2008 Page 123
@
10.4.3.3 MOL model The model of MOL data transformation offered here is based upon the knowledge generator type 2 model available in PROMISE DR7.1. MOL represents the interaction of current and historical (stored) data much more than the other two phases. 1) Use case diagram
Figure 42: Use case diagram of Data Transformation - MOL 2) Use case specification 2.1) Actor Description
2.1.1) Field experts—Personnel with knowledge of field data. 2.1.2) Data experts—Personnel with knowledge of stored data. 2.1.3) Data analyst—Personnel who perform analysis of selected data. 2.1.4) Decision maker—Personnel who make decisions on selected and integrated data.
2.2) Use case description 2.2.1) Retrieve field data
1. Purpose – The field expert collects the MOL data that is being returned from MOL. 2. Actors – Field experts. 3. Pre-conditions – Data from customers and maintenance (see overall model). 4. Triggers – MOL issues 5. Primary flow 1) Triggers are received by field experts;
2) 2. Triggers are subsequently acted upon in use case 8.6.5. 6. Post-conditions – Integration with other data types.
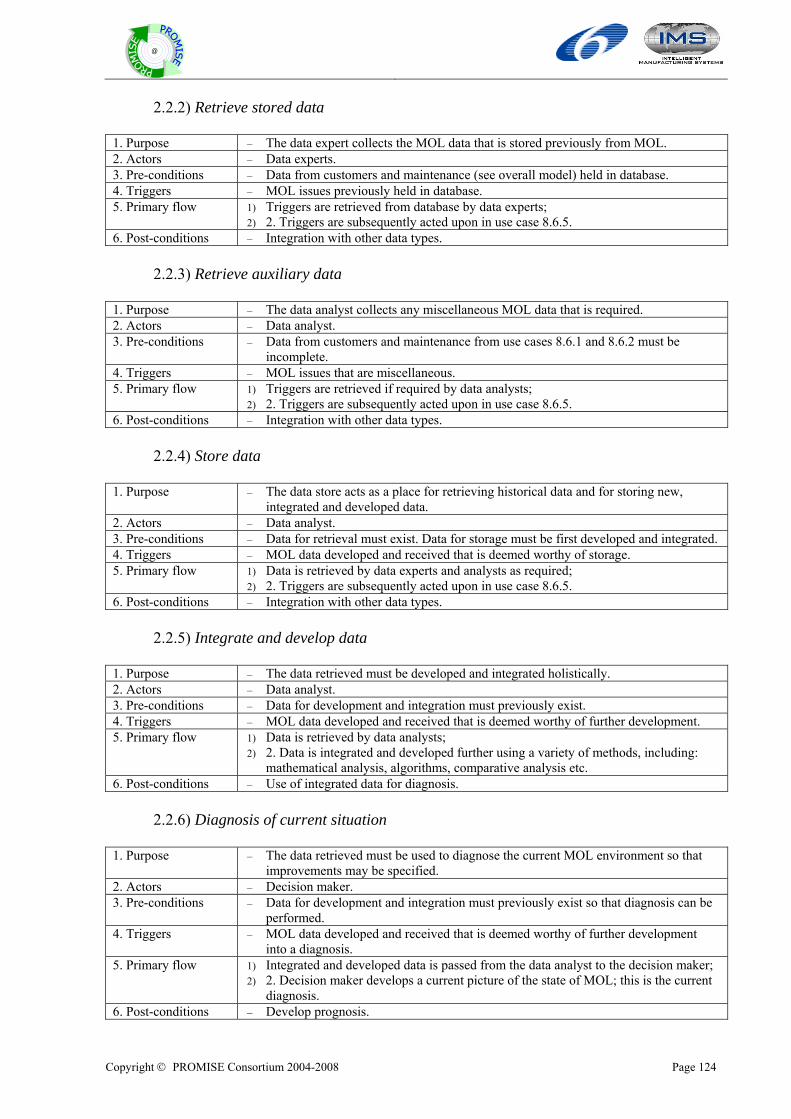
Copyright © PROMISE Consortium 2004-2008 Page 124
@
2.2.2) Retrieve stored data
1. Purpose – The data expert collects the MOL data that is stored previously from MOL. 2. Actors – Data experts. 3. Pre-conditions – Data from customers and maintenance (see overall model) held in database. 4. Triggers – MOL issues previously held in database. 5. Primary flow 1) Triggers are retrieved from database by data experts;
2) 2. Triggers are subsequently acted upon in use case 8.6.5. 6. Post-conditions – Integration with other data types.
2.2.3) Retrieve auxiliary data
1. Purpose – The data analyst collects any miscellaneous MOL data that is required. 2. Actors – Data analyst. 3. Pre-conditions – Data from customers and maintenance from use cases 8.6.1 and 8.6.2 must be
incomplete. 4. Triggers – MOL issues that are miscellaneous. 5. Primary flow 1) Triggers are retrieved if required by data analysts;
2) 2. Triggers are subsequently acted upon in use case 8.6.5. 6. Post-conditions – Integration with other data types.
2.2.4) Store data
1. Purpose – The data store acts as a place for retrieving historical data and for storing new,
integrated and developed data. 2. Actors – Data analyst. 3. Pre-conditions – Data for retrieval must exist. Data for storage must be first developed and integrated. 4. Triggers – MOL data developed and received that is deemed worthy of storage. 5. Primary flow 1) Data is retrieved by data experts and analysts as required;
2) 2. Triggers are subsequently acted upon in use case 8.6.5. 6. Post-conditions – Integration with other data types.
2.2.5) Integrate and develop data
1. Purpose – The data retrieved must be developed and integrated holistically. 2. Actors – Data analyst. 3. Pre-conditions – Data for development and integration must previously exist. 4. Triggers – MOL data developed and received that is deemed worthy of further development. 5. Primary flow 1) Data is retrieved by data analysts;
2) 2. Data is integrated and developed further using a variety of methods, including: mathematical analysis, algorithms, comparative analysis etc.
6. Post-conditions – Use of integrated data for diagnosis. 2.2.6) Diagnosis of current situation
1. Purpose – The data retrieved must be used to diagnose the current MOL environment so that
improvements may be specified. 2. Actors – Decision maker. 3. Pre-conditions – Data for development and integration must previously exist so that diagnosis can be
performed. 4. Triggers – MOL data developed and received that is deemed worthy of further development
into a diagnosis. 5. Primary flow 1) Integrated and developed data is passed from the data analyst to the decision maker;
2) 2. Decision maker develops a current picture of the state of MOL; this is the current diagnosis.
6. Post-conditions – Develop prognosis.
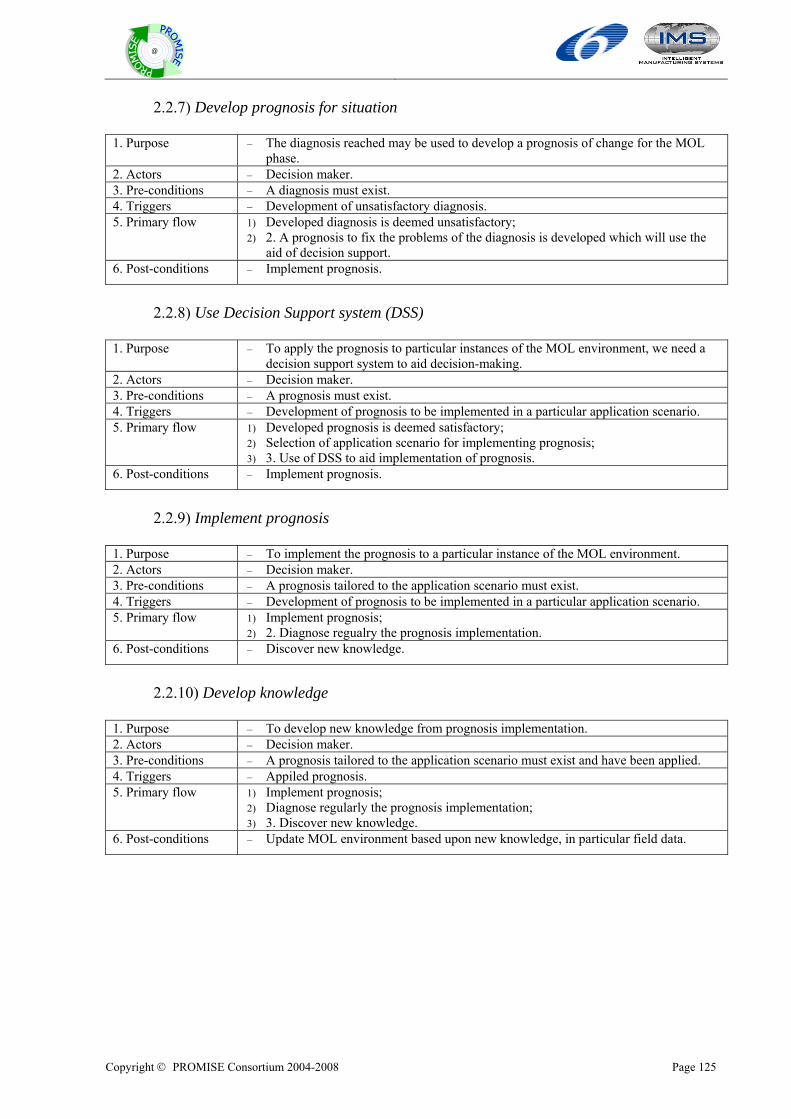
Copyright © PROMISE Consortium 2004-2008 Page 125
@
2.2.7) Develop prognosis for situation
1. Purpose – The diagnosis reached may be used to develop a prognosis of change for the MOL phase.
2. Actors – Decision maker. 3. Pre-conditions – A diagnosis must exist. 4. Triggers – Development of unsatisfactory diagnosis. 5. Primary flow 1) Developed diagnosis is deemed unsatisfactory;
2) 2. A prognosis to fix the problems of the diagnosis is developed which will use the aid of decision support.
6. Post-conditions – Implement prognosis.
2.2.8) Use Decision Support system (DSS)
1. Purpose – To apply the prognosis to particular instances of the MOL environment, we need a decision support system to aid decision-making.
2. Actors – Decision maker. 3. Pre-conditions – A prognosis must exist. 4. Triggers – Development of prognosis to be implemented in a particular application scenario. 5. Primary flow 1) Developed prognosis is deemed satisfactory;
2) Selection of application scenario for implementing prognosis; 3) 3. Use of DSS to aid implementation of prognosis.
6. Post-conditions – Implement prognosis.
2.2.9) Implement prognosis
1. Purpose – To implement the prognosis to a particular instance of the MOL environment. 2. Actors – Decision maker. 3. Pre-conditions – A prognosis tailored to the application scenario must exist. 4. Triggers – Development of prognosis to be implemented in a particular application scenario. 5. Primary flow 1) Implement prognosis;
2) 2. Diagnose regualry the prognosis implementation. 6. Post-conditions – Discover new knowledge.
2.2.10) Develop knowledge
1. Purpose – To develop new knowledge from prognosis implementation. 2. Actors – Decision maker. 3. Pre-conditions – A prognosis tailored to the application scenario must exist and have been applied. 4. Triggers – Appiled prognosis. 5. Primary flow 1) Implement prognosis;
2) Diagnose regularly the prognosis implementation; 3) 3. Discover new knowledge.
6. Post-conditions – Update MOL environment based upon new knowledge, in particular field data.
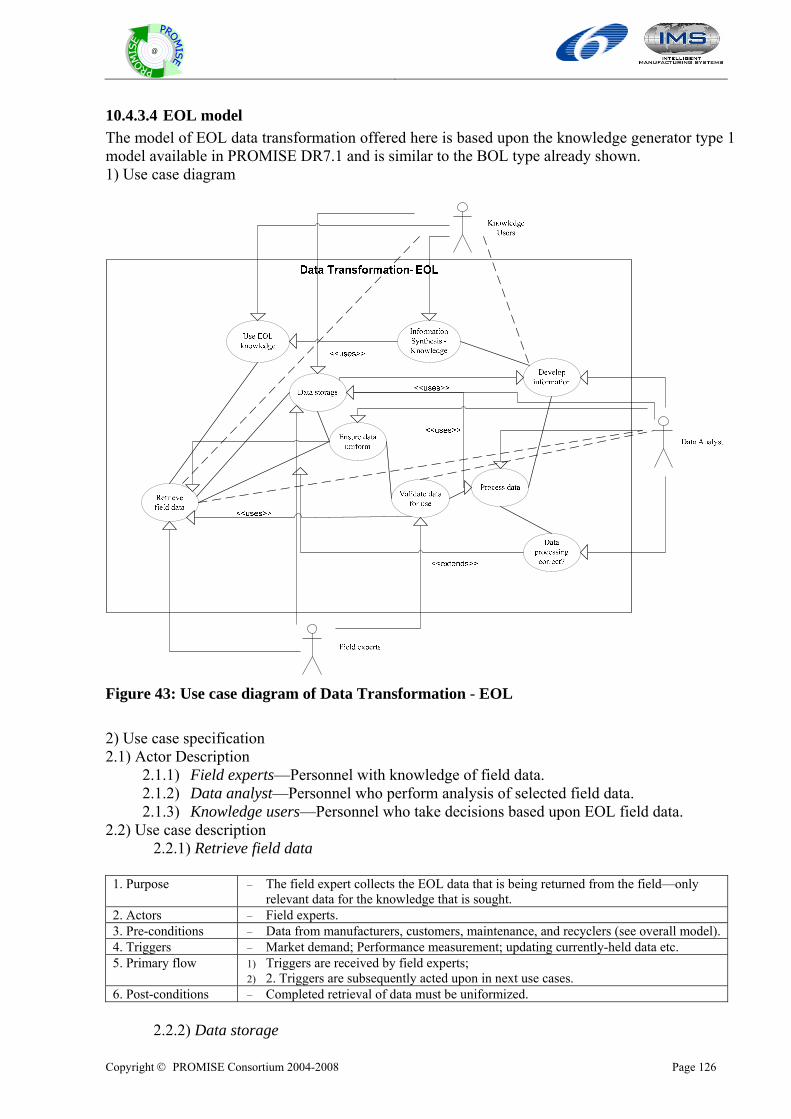
Copyright © PROMISE Consortium 2004-2008 Page 126
@
10.4.3.4 EOL model The model of EOL data transformation offered here is based upon the knowledge generator type 1 model available in PROMISE DR7.1 and is similar to the BOL type already shown. 1) Use case diagram
Figure 43: Use case diagram of Data Transformation - EOL 2) Use case specification 2.1) Actor Description
2.1.1) Field experts—Personnel with knowledge of field data. 2.1.2) Data analyst—Personnel who perform analysis of selected field data. 2.1.3) Knowledge users—Personnel who take decisions based upon EOL field data.
2.2) Use case description 2.2.1) Retrieve field data
1. Purpose – The field expert collects the EOL data that is being returned from the field—only relevant data for the knowledge that is sought.
2. Actors – Field experts. 3. Pre-conditions – Data from manufacturers, customers, maintenance, and recyclers (see overall model). 4. Triggers – Market demand; Performance measurement; updating currently-held data etc. 5. Primary flow 1) Triggers are received by field experts;
2) 2. Triggers are subsequently acted upon in next use cases. 6. Post-conditions – Completed retrieval of data must be uniformized.
2.2.2) Data storage
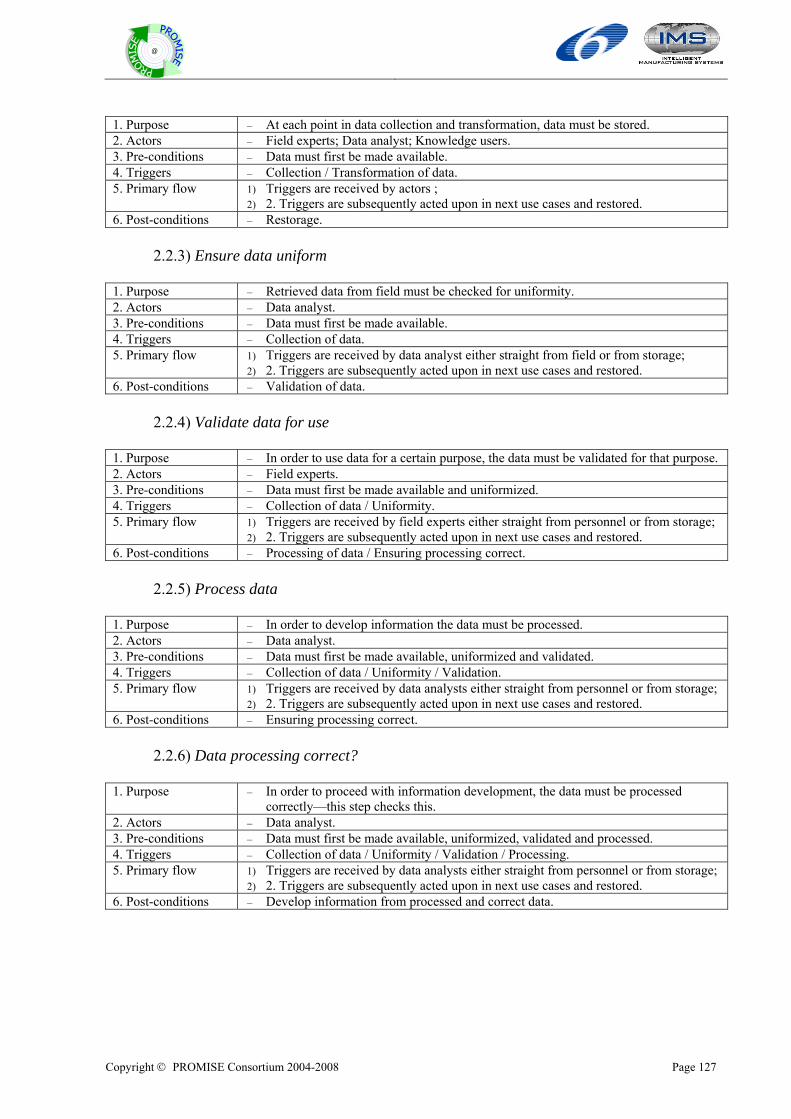
Copyright © PROMISE Consortium 2004-2008 Page 127
@
1. Purpose – At each point in data collection and transformation, data must be stored. 2. Actors – Field experts; Data analyst; Knowledge users. 3. Pre-conditions – Data must first be made available. 4. Triggers – Collection / Transformation of data. 5. Primary flow 1) Triggers are received by actors ;
2) 2. Triggers are subsequently acted upon in next use cases and restored. 6. Post-conditions – Restorage.
2.2.3) Ensure data uniform
1. Purpose – Retrieved data from field must be checked for uniformity. 2. Actors – Data analyst. 3. Pre-conditions – Data must first be made available. 4. Triggers – Collection of data. 5. Primary flow 1) Triggers are received by data analyst either straight from field or from storage;
2) 2. Triggers are subsequently acted upon in next use cases and restored. 6. Post-conditions – Validation of data.
2.2.4) Validate data for use
1. Purpose – In order to use data for a certain purpose, the data must be validated for that purpose. 2. Actors – Field experts. 3. Pre-conditions – Data must first be made available and uniformized. 4. Triggers – Collection of data / Uniformity. 5. Primary flow 1) Triggers are received by field experts either straight from personnel or from storage;
2) 2. Triggers are subsequently acted upon in next use cases and restored. 6. Post-conditions – Processing of data / Ensuring processing correct.
2.2.5) Process data
1. Purpose – In order to develop information the data must be processed. 2. Actors – Data analyst. 3. Pre-conditions – Data must first be made available, uniformized and validated. 4. Triggers – Collection of data / Uniformity / Validation. 5. Primary flow 1) Triggers are received by data analysts either straight from personnel or from storage;
2) 2. Triggers are subsequently acted upon in next use cases and restored. 6. Post-conditions – Ensuring processing correct.
2.2.6) Data processing correct?
1. Purpose – In order to proceed with information development, the data must be processed
correctly—this step checks this. 2. Actors – Data analyst. 3. Pre-conditions – Data must first be made available, uniformized, validated and processed. 4. Triggers – Collection of data / Uniformity / Validation / Processing. 5. Primary flow 1) Triggers are received by data analysts either straight from personnel or from storage;
2) 2. Triggers are subsequently acted upon in next use cases and restored. 6. Post-conditions – Develop information from processed and correct data.
Copyright © PROMISE Consortium 2004-2008 Page 128
@
2.2.7) Develop information
1. Purpose – In order to proceed with knowledge development, information must be developed from the processed data.
2. Actors – Data analyst. 3. Pre-conditions – Data must first be made available, uniformized, validated and processed. 4. Triggers – Collection of data / Uniformity / Validation / Processing. 5. Primary flow 1) Triggers are received by data analysts either straight from personnel or from storage;
2) 2. Triggers are subsequently acted upon in next use cases and restored. 6. Post-conditions – Information synthesis.
2.2.8) Information synthesis - knowlegde
1. Purpose – The integration of numerous pieces of information creates knowledge. 2. Actors – Knowledge users. 3. Pre-conditions – Data must first be made available, uniformized, validated and processed. Information
must be developed. 4. Triggers – Collection of data / Uniformity / Validation / Processing. Development of
Information. 5. Primary flow 1) Triggers are received by knowledge users either straight from personnel or from
storage; 2) 2. Triggers are subsequently acted upon in next use cases and restored.
6. Post-conditions – Use of developed knowledge 2.2.9) Use of EOL knowledge
1. Purpose – The use the developed knowledge is put to. 2. Actors – Knowledge users. 3. Pre-conditions – Data must first be made available, uniformized, validated and processed. Information
must be developed and synthesised, creating knowledge. 4. Triggers – Collection of data / Uniformity / Validation / Processing. Development of
Information. Development of knowledge. 5. Primary flow 1) 1. Knowledge created and used to update field data, its retrieval or to update other
entities of the BOL system, or to impact upon MOL and EOL. 6. Post-conditions
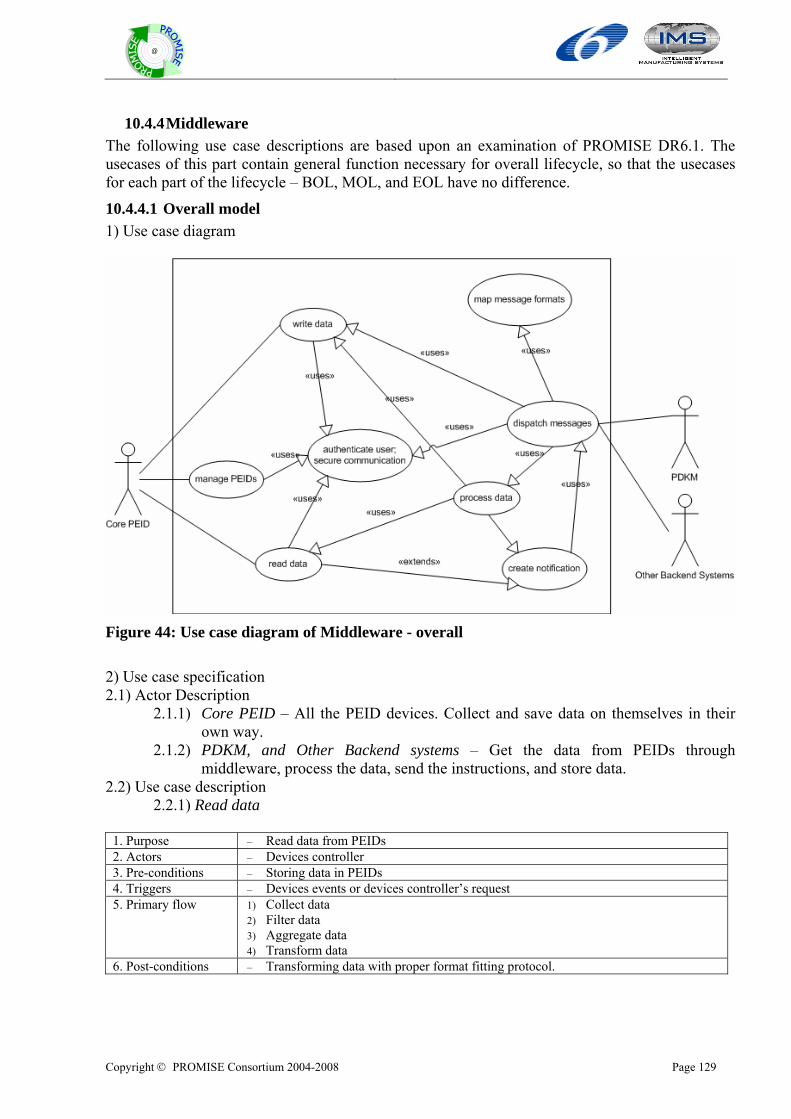
Copyright © PROMISE Consortium 2004-2008 Page 129
@
10.4.4 Middleware The following use case descriptions are based upon an examination of PROMISE DR6.1. The usecases of this part contain general function necessary for overall lifecycle, so that the usecases for each part of the lifecycle – BOL, MOL, and EOL have no difference.
10.4.4.1 Overall model 1) Use case diagram
Figure 44: Use case diagram of Middleware - overall 2) Use case specification 2.1) Actor Description
2.1.1) Core PEID – All the PEID devices. Collect and save data on themselves in their own way.
2.1.2) PDKM, and Other Backend systems – Get the data from PEIDs through middleware, process the data, send the instructions, and store data.
2.2) Use case description 2.2.1) Read data
1. Purpose – Read data from PEIDs 2. Actors – Devices controller 3. Pre-conditions – Storing data in PEIDs 4. Triggers – Devices events or devices controller’s request 5. Primary flow 1) Collect data
2) Filter data 3) Aggregate data 4) Transform data
6. Post-conditions – Transforming data with proper format fitting protocol.
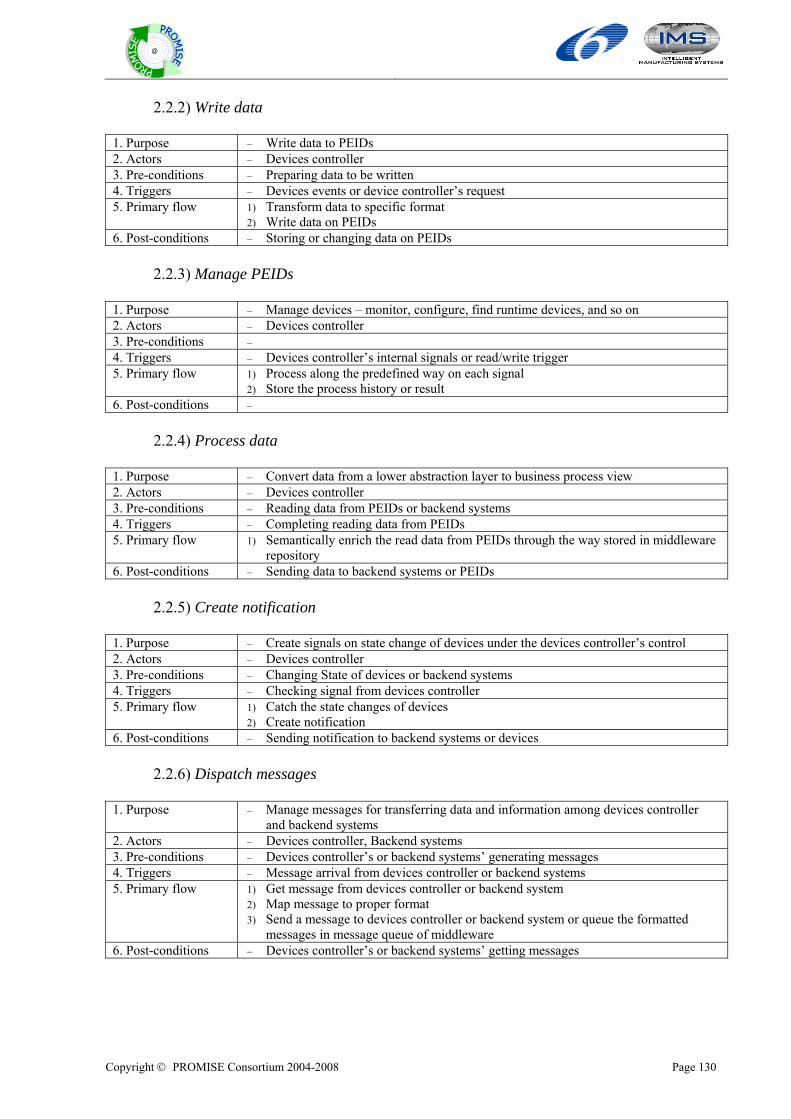
Copyright © PROMISE Consortium 2004-2008 Page 130
@
2.2.2) Write data
1. Purpose – Write data to PEIDs 2. Actors – Devices controller 3. Pre-conditions – Preparing data to be written 4. Triggers – Devices events or device controller’s request 5. Primary flow 1) Transform data to specific format
2) Write data on PEIDs 6. Post-conditions – Storing or changing data on PEIDs
2.2.3) Manage PEIDs
1. Purpose – Manage devices – monitor, configure, find runtime devices, and so on 2. Actors – Devices controller 3. Pre-conditions – 4. Triggers – Devices controller’s internal signals or read/write trigger 5. Primary flow 1) Process along the predefined way on each signal
2) Store the process history or result 6. Post-conditions –
2.2.4) Process data
1. Purpose – Convert data from a lower abstraction layer to business process view 2. Actors – Devices controller 3. Pre-conditions – Reading data from PEIDs or backend systems 4. Triggers – Completing reading data from PEIDs 5. Primary flow 1) Semantically enrich the read data from PEIDs through the way stored in middleware
repository 6. Post-conditions – Sending data to backend systems or PEIDs
2.2.5) Create notification
1. Purpose – Create signals on state change of devices under the devices controller’s control 2. Actors – Devices controller 3. Pre-conditions – Changing State of devices or backend systems 4. Triggers – Checking signal from devices controller 5. Primary flow 1) Catch the state changes of devices
2) Create notification 6. Post-conditions – Sending notification to backend systems or devices
2.2.6) Dispatch messages
1. Purpose – Manage messages for transferring data and information among devices controller and backend systems
2. Actors – Devices controller, Backend systems 3. Pre-conditions – Devices controller’s or backend systems’ generating messages 4. Triggers – Message arrival from devices controller or backend systems 5. Primary flow 1) Get message from devices controller or backend system
2) Map message to proper format 3) Send a message to devices controller or backend system or queue the formatted
messages in message queue of middleware 6. Post-conditions – Devices controller’s or backend systems’ getting messages
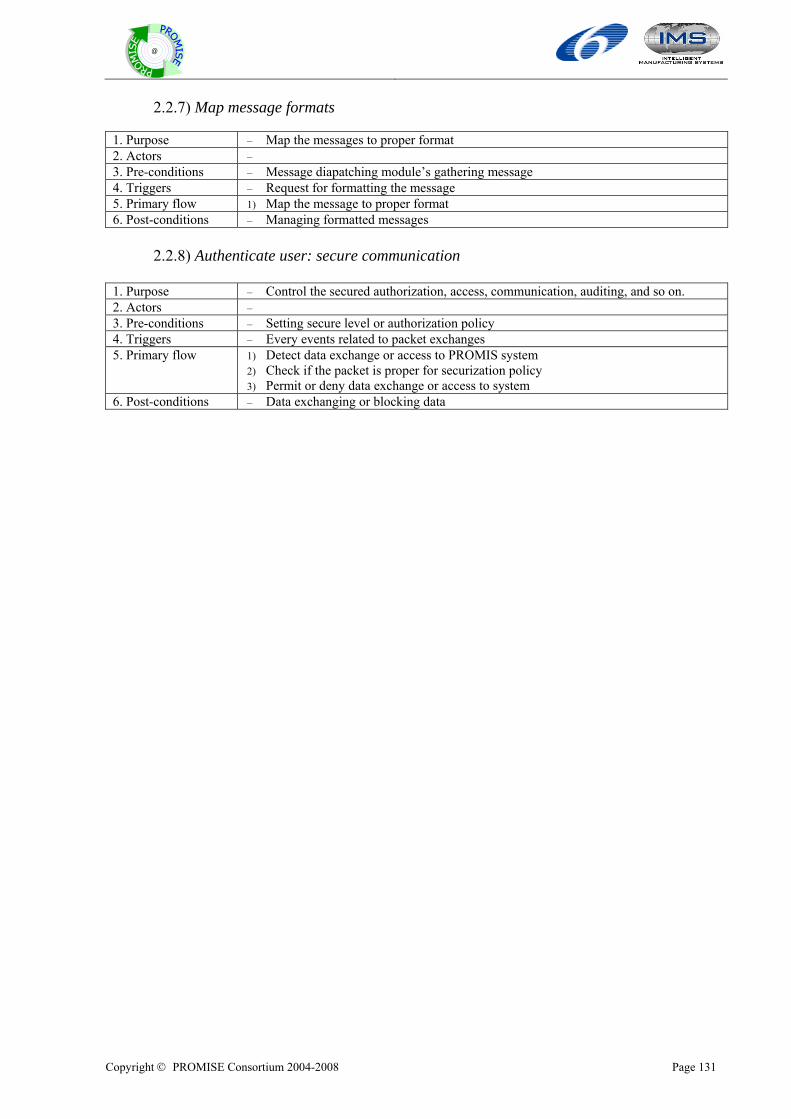
Copyright © PROMISE Consortium 2004-2008 Page 131
@
2.2.7) Map message formats
1. Purpose – Map the messages to proper format 2. Actors – 3. Pre-conditions – Message diapatching module’s gathering message 4. Triggers – Request for formatting the message 5. Primary flow 1) Map the message to proper format 6. Post-conditions – Managing formatted messages
2.2.8) Authenticate user: secure communication
1. Purpose – Control the secured authorization, access, communication, auditing, and so on. 2. Actors – 3. Pre-conditions – Setting secure level or authorization policy 4. Triggers – Every events related to packet exchanges 5. Primary flow 1) Detect data exchange or access to PROMIS system
2) Check if the packet is proper for securization policy 3) Permit or deny data exchange or access to system
6. Post-conditions – Data exchanging or blocking data
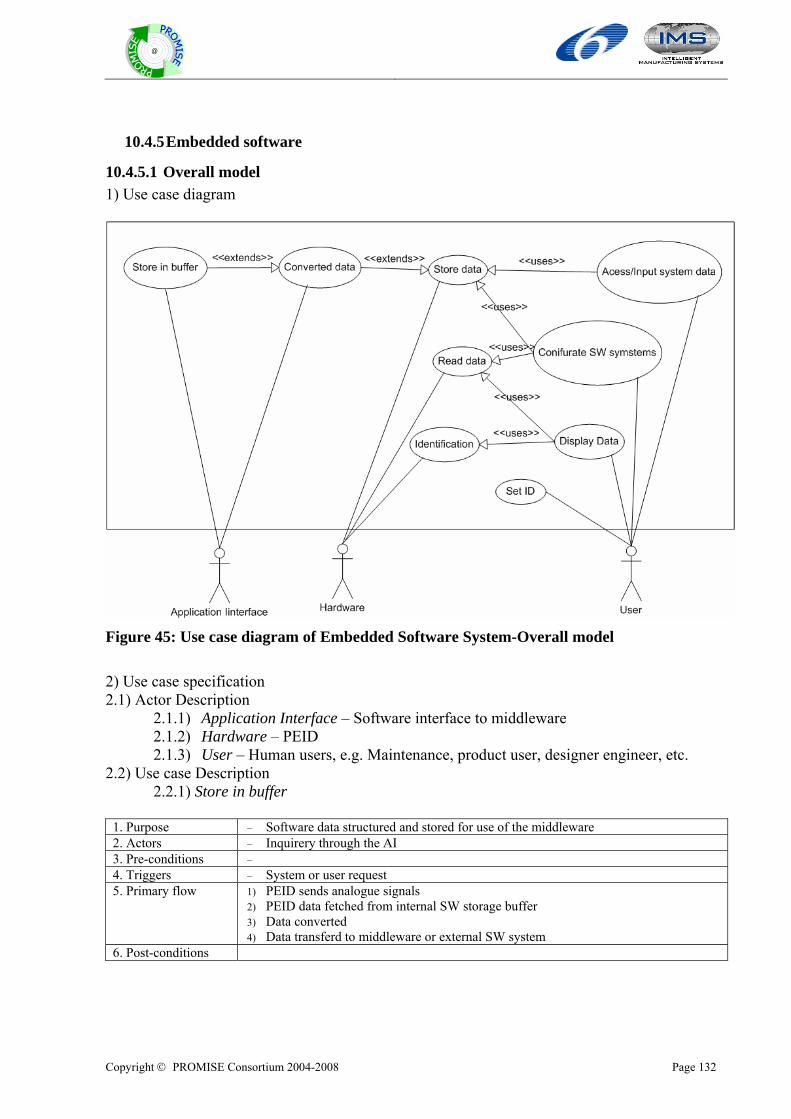
Copyright © PROMISE Consortium 2004-2008 Page 132
@
10.4.5 Embedded software
10.4.5.1 Overall model 1) Use case diagram
Figure 45: Use case diagram of Embedded Software System-Overall model 2) Use case specification 2.1) Actor Description
2.1.1) Application Interface – Software interface to middleware 2.1.2) Hardware – PEID 2.1.3) User – Human users, e.g. Maintenance, product user, designer engineer, etc.
2.2) Use case Description 2.2.1) Store in buffer
1. Purpose – Software data structured and stored for use of the middleware 2. Actors – Inquirery through the AI 3. Pre-conditions – 4. Triggers – System or user request 5. Primary flow 1) PEID sends analogue signals
2) PEID data fetched from internal SW storage buffer 3) Data converted 4) Data transferd to middleware or external SW system
6. Post-conditions
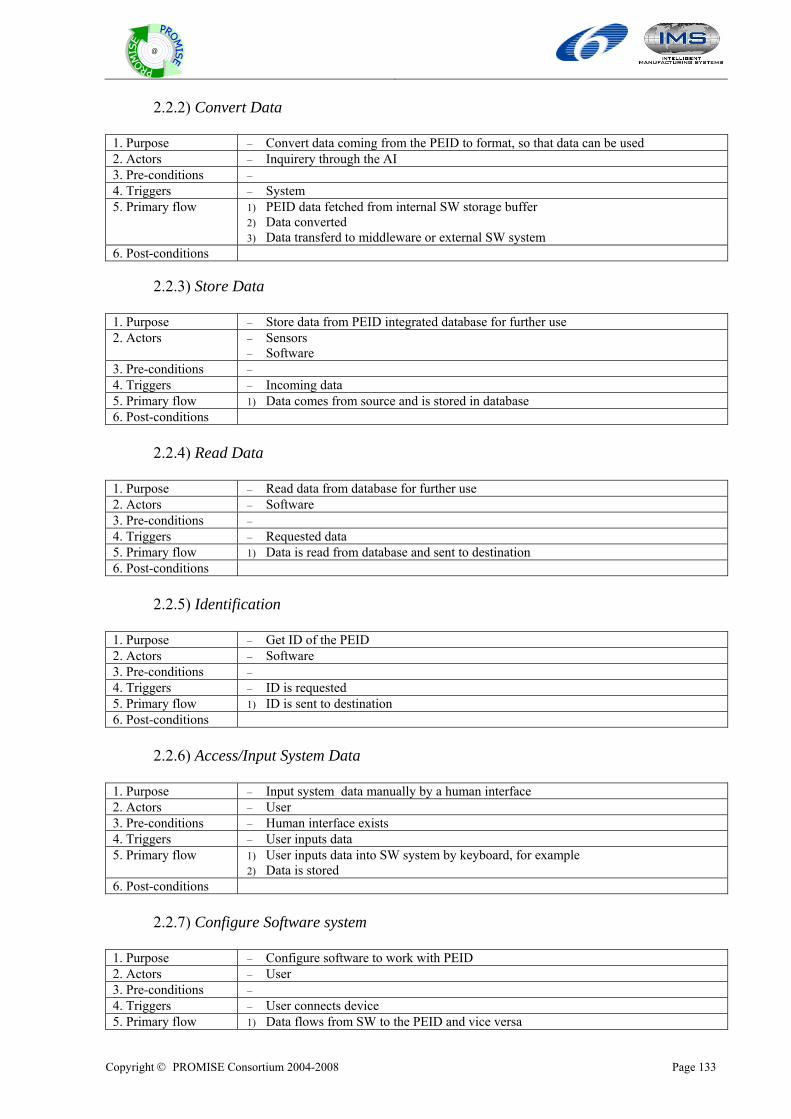
Copyright © PROMISE Consortium 2004-2008 Page 133
@
2.2.2) Convert Data
1. Purpose – Convert data coming from the PEID to format, so that data can be used 2. Actors – Inquirery through the AI 3. Pre-conditions – 4. Triggers – System 5. Primary flow 1) PEID data fetched from internal SW storage buffer
2) Data converted 3) Data transferd to middleware or external SW system
6. Post-conditions 2.2.3) Store Data
1. Purpose – Store data from PEID integrated database for further use 2. Actors – Sensors
– Software 3. Pre-conditions – 4. Triggers – Incoming data 5. Primary flow 1) Data comes from source and is stored in database 6. Post-conditions
2.2.4) Read Data
1. Purpose – Read data from database for further use 2. Actors – Software 3. Pre-conditions – 4. Triggers – Requested data 5. Primary flow 1) Data is read from database and sent to destination 6. Post-conditions
2.2.5) Identification
1. Purpose – Get ID of the PEID 2. Actors – Software 3. Pre-conditions – 4. Triggers – ID is requested 5. Primary flow 1) ID is sent to destination 6. Post-conditions
2.2.6) Access/Input System Data
1. Purpose – Input system data manually by a human interface 2. Actors – User 3. Pre-conditions – Human interface exists 4. Triggers – User inputs data 5. Primary flow 1) User inputs data into SW system by keyboard, for example
2) Data is stored 6. Post-conditions
2.2.7) Configure Software system
1. Purpose – Configure software to work with PEID 2. Actors – User 3. Pre-conditions – 4. Triggers – User connects device 5. Primary flow 1) Data flows from SW to the PEID and vice versa
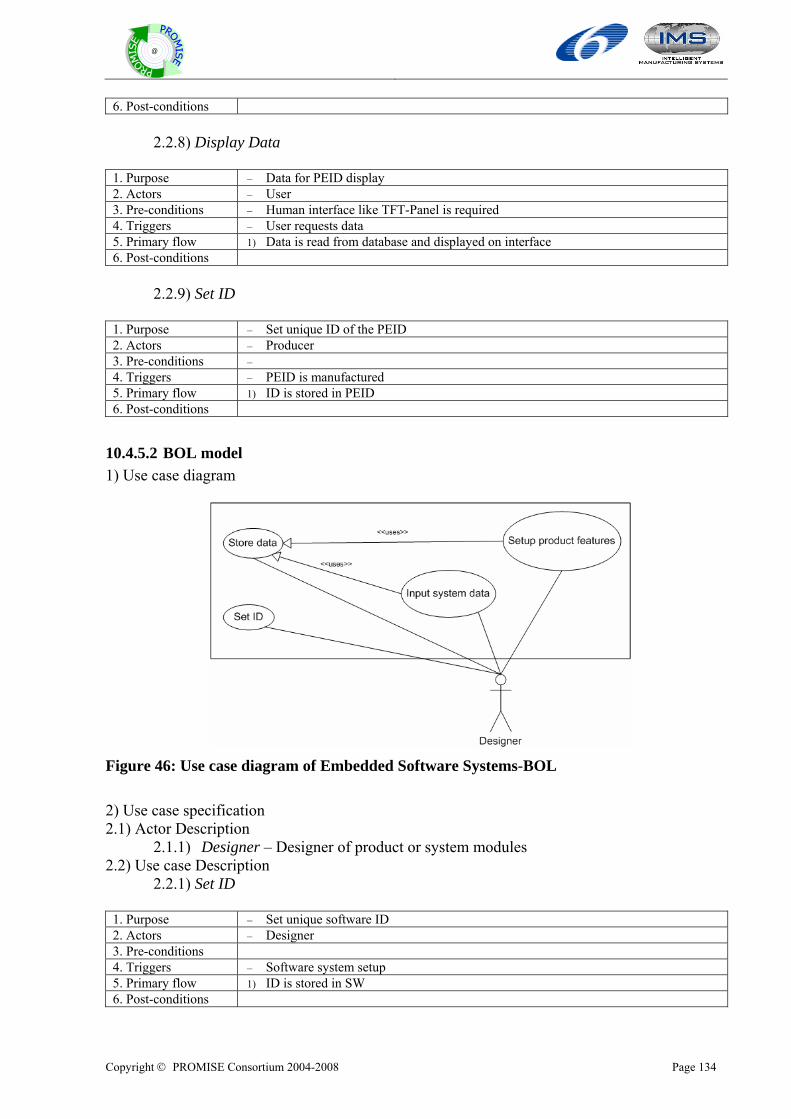
Copyright © PROMISE Consortium 2004-2008 Page 134
@
6. Post-conditions 2.2.8) Display Data
1. Purpose – Data for PEID display 2. Actors – User 3. Pre-conditions – Human interface like TFT-Panel is required 4. Triggers – User requests data 5. Primary flow 1) Data is read from database and displayed on interface 6. Post-conditions
2.2.9) Set ID
1. Purpose – Set unique ID of the PEID 2. Actors – Producer 3. Pre-conditions – 4. Triggers – PEID is manufactured 5. Primary flow 1) ID is stored in PEID 6. Post-conditions
10.4.5.2 BOL model 1) Use case diagram
Figure 46: Use case diagram of Embedded Software Systems-BOL 2) Use case specification 2.1) Actor Description
2.1.1) Designer – Designer of product or system modules 2.2) Use case Description
2.2.1) Set ID
1. Purpose – Set unique software ID 2. Actors – Designer 3. Pre-conditions 4. Triggers – Software system setup 5. Primary flow 1) ID is stored in SW 6. Post-conditions
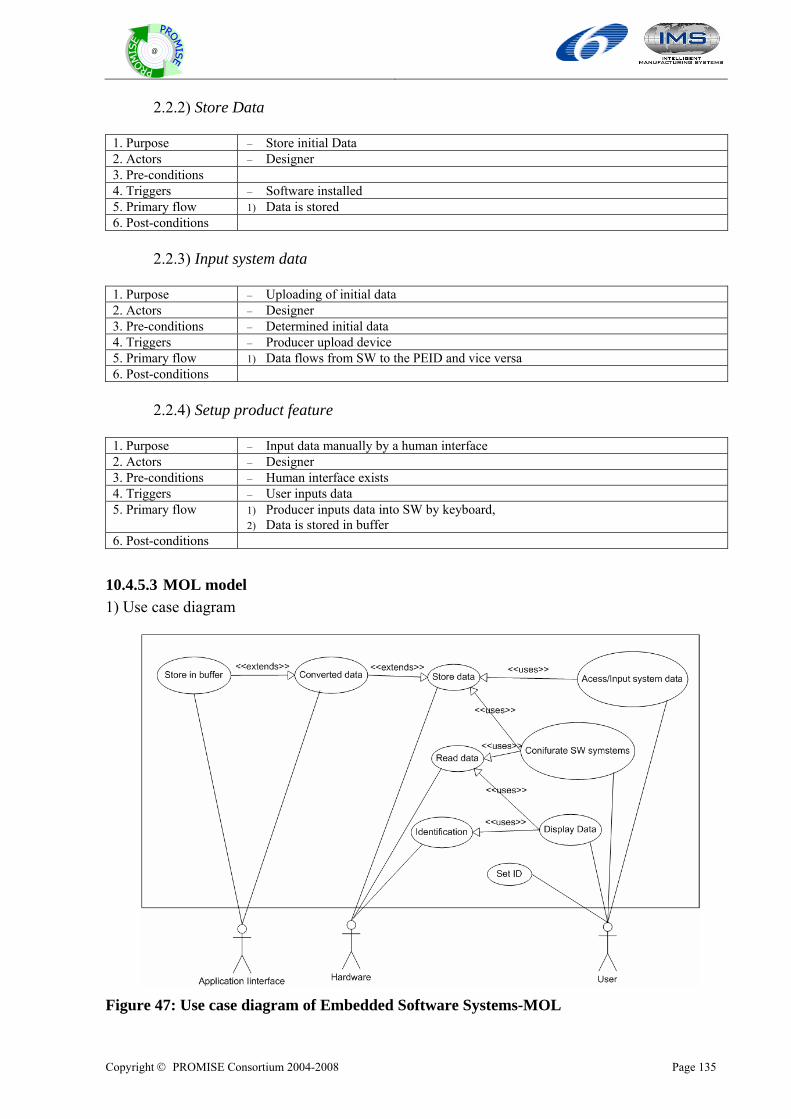
Copyright © PROMISE Consortium 2004-2008 Page 135
@
2.2.2) Store Data
1. Purpose – Store initial Data 2. Actors – Designer 3. Pre-conditions 4. Triggers – Software installed 5. Primary flow 1) Data is stored 6. Post-conditions
2.2.3) Input system data
1. Purpose – Uploading of initial data 2. Actors – Designer 3. Pre-conditions – Determined initial data 4. Triggers – Producer upload device 5. Primary flow 1) Data flows from SW to the PEID and vice versa 6. Post-conditions
2.2.4) Setup product feature
1. Purpose – Input data manually by a human interface 2. Actors – Designer 3. Pre-conditions – Human interface exists 4. Triggers – User inputs data 5. Primary flow 1) Producer inputs data into SW by keyboard,
2) Data is stored in buffer 6. Post-conditions
10.4.5.3 MOL model 1) Use case diagram
Figure 47: Use case diagram of Embedded Software Systems-MOL
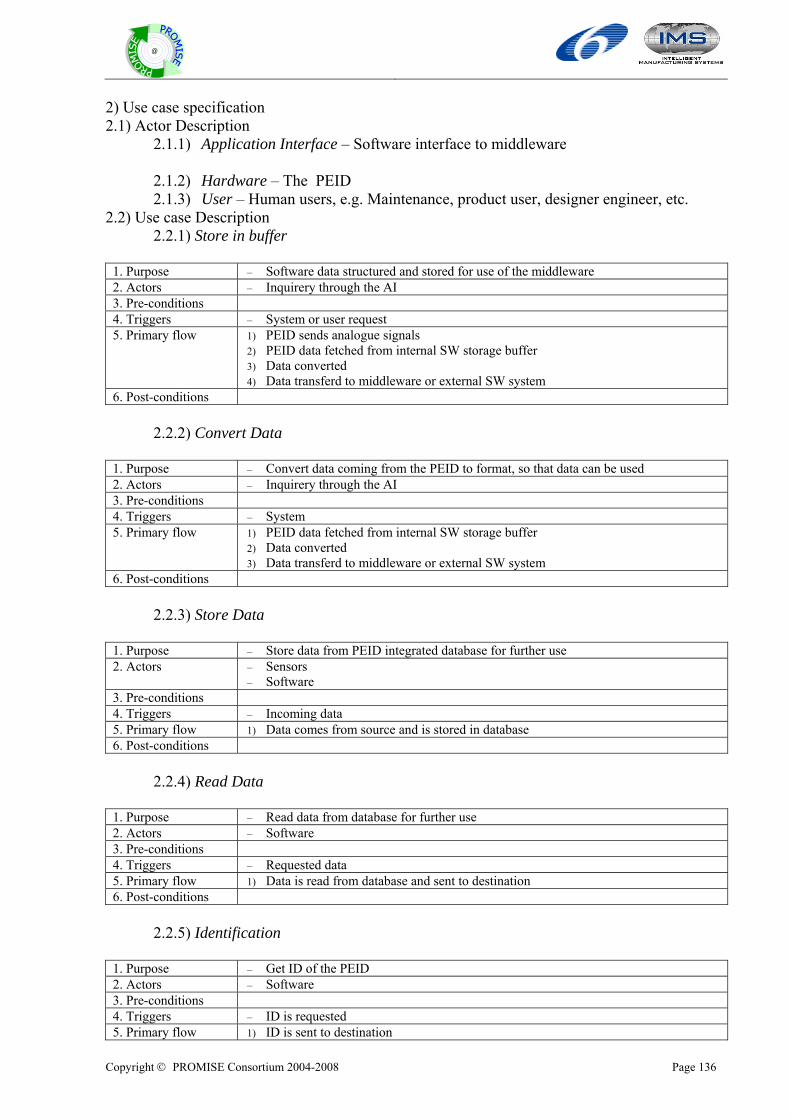
Copyright © PROMISE Consortium 2004-2008 Page 136
@
2) Use case specification 2.1) Actor Description
2.1.1) Application Interface – Software interface to middleware 2.1.2) Hardware – The PEID 2.1.3) User – Human users, e.g. Maintenance, product user, designer engineer, etc.
2.2) Use case Description 2.2.1) Store in buffer
1. Purpose – Software data structured and stored for use of the middleware 2. Actors – Inquirery through the AI 3. Pre-conditions 4. Triggers – System or user request 5. Primary flow 1) PEID sends analogue signals
2) PEID data fetched from internal SW storage buffer 3) Data converted 4) Data transferd to middleware or external SW system
6. Post-conditions
2.2.2) Convert Data
1. Purpose – Convert data coming from the PEID to format, so that data can be used 2. Actors – Inquirery through the AI 3. Pre-conditions 4. Triggers – System 5. Primary flow 1) PEID data fetched from internal SW storage buffer
2) Data converted 3) Data transferd to middleware or external SW system
6. Post-conditions
2.2.3) Store Data
1. Purpose – Store data from PEID integrated database for further use 2. Actors – Sensors
– Software 3. Pre-conditions 4. Triggers – Incoming data 5. Primary flow 1) Data comes from source and is stored in database 6. Post-conditions
2.2.4) Read Data
1. Purpose – Read data from database for further use 2. Actors – Software 3. Pre-conditions 4. Triggers – Requested data 5. Primary flow 1) Data is read from database and sent to destination 6. Post-conditions
2.2.5) Identification
1. Purpose – Get ID of the PEID 2. Actors – Software 3. Pre-conditions 4. Triggers – ID is requested 5. Primary flow 1) ID is sent to destination
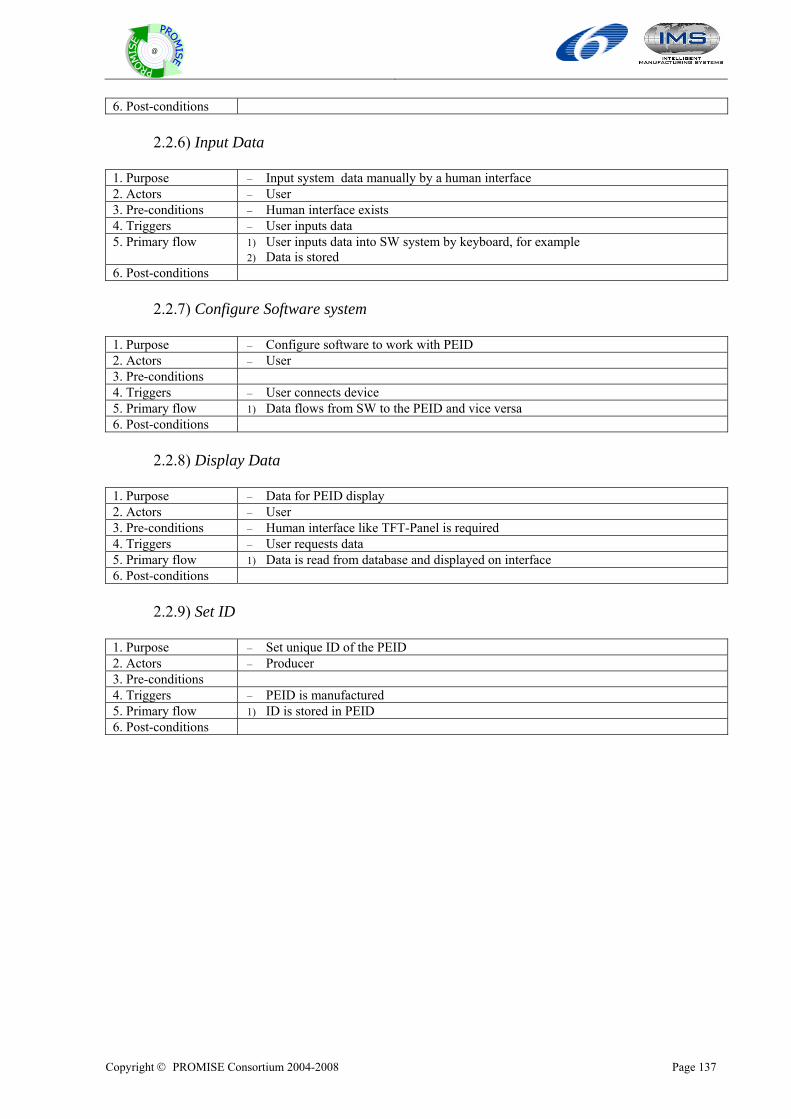
Copyright © PROMISE Consortium 2004-2008 Page 137
@
6. Post-conditions 2.2.6) Input Data
1. Purpose – Input system data manually by a human interface 2. Actors – User 3. Pre-conditions – Human interface exists 4. Triggers – User inputs data 5. Primary flow 1) User inputs data into SW system by keyboard, for example
2) Data is stored 6. Post-conditions
2.2.7) Configure Software system
1. Purpose – Configure software to work with PEID 2. Actors – User 3. Pre-conditions 4. Triggers – User connects device 5. Primary flow 1) Data flows from SW to the PEID and vice versa 6. Post-conditions
2.2.8) Display Data
1. Purpose – Data for PEID display 2. Actors – User 3. Pre-conditions – Human interface like TFT-Panel is required 4. Triggers – User requests data 5. Primary flow 1) Data is read from database and displayed on interface 6. Post-conditions
2.2.9) Set ID
1. Purpose – Set unique ID of the PEID 2. Actors – Producer 3. Pre-conditions 4. Triggers – PEID is manufactured 5. Primary flow 1) ID is stored in PEID 6. Post-conditions
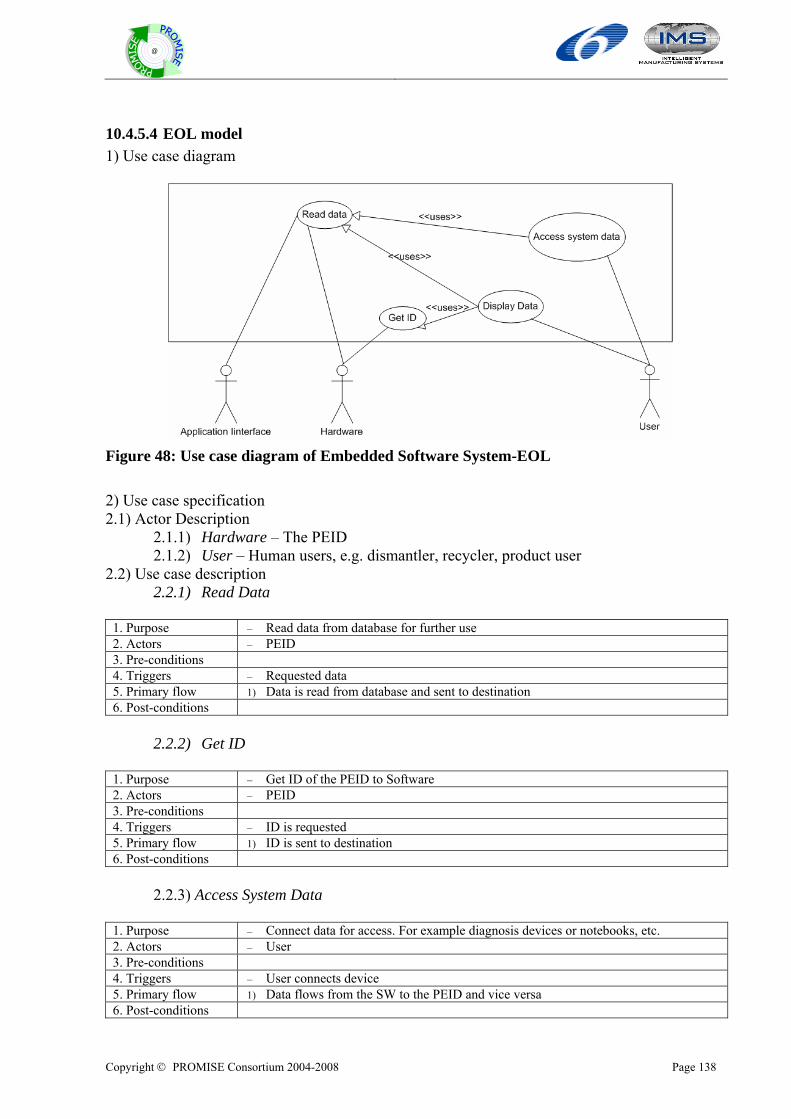
Copyright © PROMISE Consortium 2004-2008 Page 138
@
10.4.5.4 EOL model 1) Use case diagram
Figure 48: Use case diagram of Embedded Software System-EOL 2) Use case specification 2.1) Actor Description
2.1.1) Hardware – The PEID 2.1.2) User – Human users, e.g. dismantler, recycler, product user
2.2) Use case description 2.2.1) Read Data
1. Purpose – Read data from database for further use 2. Actors – PEID 3. Pre-conditions 4. Triggers – Requested data 5. Primary flow 1) Data is read from database and sent to destination 6. Post-conditions
2.2.2) Get ID
1. Purpose – Get ID of the PEID to Software 2. Actors – PEID 3. Pre-conditions 4. Triggers – ID is requested 5. Primary flow 1) ID is sent to destination 6. Post-conditions
2.2.3) Access System Data
1. Purpose – Connect data for access. For example diagnosis devices or notebooks, etc. 2. Actors – User 3. Pre-conditions 4. Triggers – User connects device 5. Primary flow 1) Data flows from the SW to the PEID and vice versa 6. Post-conditions

Copyright © PROMISE Consortium 2004-2008 Page 139
@
2.2.4) Display Data
1. Purpose – Data for PEID display 2. Actors – User 3. Pre-conditions – Human interface 4. Triggers – User requests data 5. Primary flow 1) Data is read from database and displayed on interface 6. Post-conditions
Copyright © PROMISE Consortium 2004-2008 Page 140
@
PART IV: Definition of generic product information flow models

Copyright © PROMISE Consortium 2004-2008 Page 141
@
Copyright © PROMISE Consortium 2004-2008 Page 142
@
11 Introduction to generic product information flow models Product information flows have for long followed the same paths as the products themselves, usually as paper documents or similar. As the number of companies that participate in manufacturing the product increases, it becomes increasingly difficult to manage product information in this way. Especially in the case of paper documents, they also tend to get lost during the middle of life phase of the product (usage). When replacing paper-base documents with electronic documentation that can be accessible over the Internet, it has become possible to completely dissociate the product information flow from the flow of the physical products. At the same time, the development of miniaturised computing devices has made it possible to integrate at least parts of the product information into the product itself so that it can never become lost. These changes in how product information is stored and accessed mean that product information can flow following completely different paths than the products themselves. This is why there is a need to define product information flow models that are supplementary to product lifecycle models.
11.1 The purpose of generic product information flow models The generic product information models presented in Part IV are to be used as a basis for the next phase of defining a suitable information system for managing the product lifecycle. The generic product information flow models presented here are therefore the highest levels in a top-down approach. At the same time other work packages in PROMISE perform bottom-up development from available technologies to potential solutions. The advantage of this parallel top-down and bottom-up approach is that it makes it easier to perform realistic functional analysis as the next stage of developing a generic product information management system.
11.2 Contribution area of each partner in Part IV Table 8 shows the responsibilities of the involved partners in WP R2 for different parts of Part IV.
Table 8: Responsible partner in Part IV
Contribution area Responsible partner Section 11 Parts of section 13
HUT
Parts of section 13 COGNI Section 12 Parts of section 13
EPFL
Parts of section 13 CAMBRIGE Parts of section13 CIMRU

Copyright © PROMISE Consortium 2004-2008 Page 143
@
Table 9 shows the responsibilities of the involved partners in WP R2 for different parts of section 13.
Table 9: Responsible partner in section 13
Contribution area Responsible partner Integration of section 13 13.3 Hardware model
HUT
13.4.1 PDKM/Field DB 13.4.4 Middleware
COGNI
13.1 Integrated model 13.4.5 Embedded software
EPFL
13.2 Business model CAMBRIGE 13.4.2 Decision support/making 13.4.3 Data transformation
CIMRU
11.3 Organization of this part After this introduction, the next section describes the selected information flow modelling method (Data Flow Diagram, DFD) is presented as well as the notation used in subsequent DFD diagrams. The DFD diagrams for business models, hardware and software are presented in section 13.
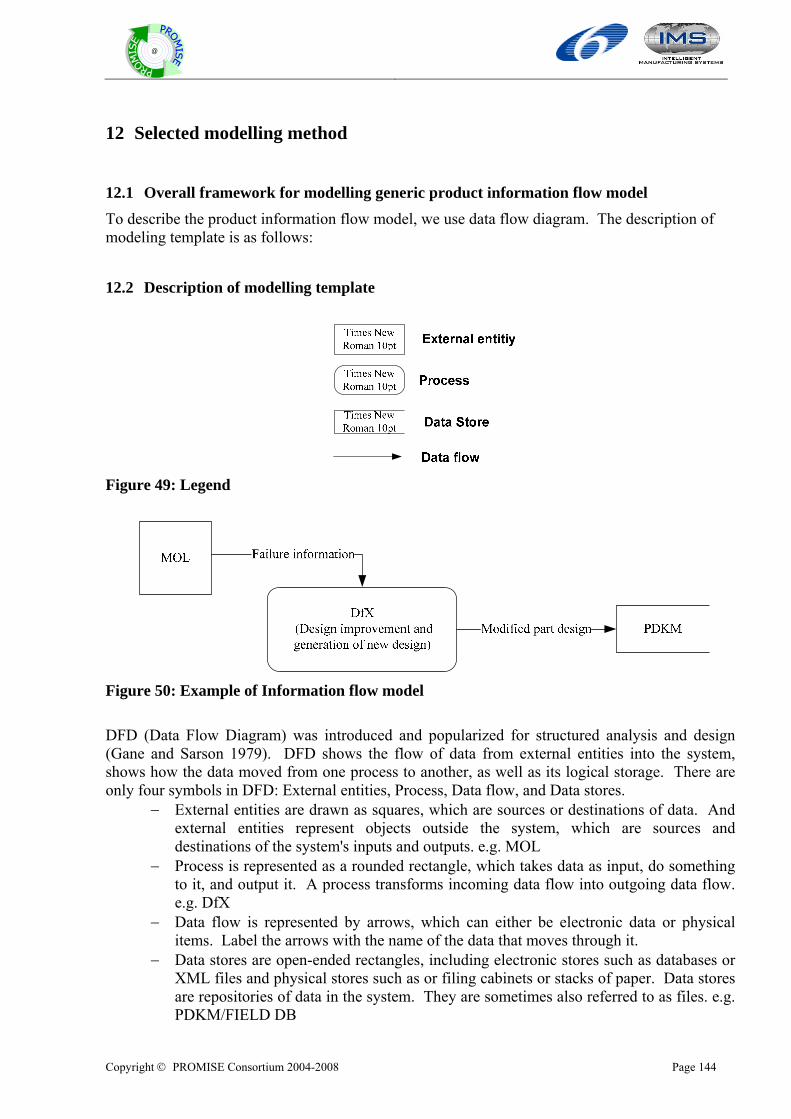
Copyright © PROMISE Consortium 2004-2008 Page 144
@
12 Selected modelling method
12.1 Overall framework for modelling generic product information flow model To describe the product information flow model, we use data flow diagram. The description of modeling template is as follows:
12.2 Description of modelling template
Figure 49: Legend
Figure 50: Example of Information flow model DFD (Data Flow Diagram) was introduced and popularized for structured analysis and design (Gane and Sarson 1979). DFD shows the flow of data from external entities into the system, shows how the data moved from one process to another, as well as its logical storage. There are only four symbols in DFD: External entities, Process, Data flow, and Data stores.
− External entities are drawn as squares, which are sources or destinations of data. And external entities represent objects outside the system, which are sources and destinations of the system's inputs and outputs. e.g. MOL
− Process is represented as a rounded rectangle, which takes data as input, do something to it, and output it. A process transforms incoming data flow into outgoing data flow. e.g. DfX
− Data flow is represented by arrows, which can either be electronic data or physical items. Label the arrows with the name of the data that moves through it.
− Data stores are open-ended rectangles, including electronic stores such as databases or XML files and physical stores such as or filing cabinets or stacks of paper. Data stores are repositories of data in the system. They are sometimes also referred to as files. e.g. PDKM/FIELD DB
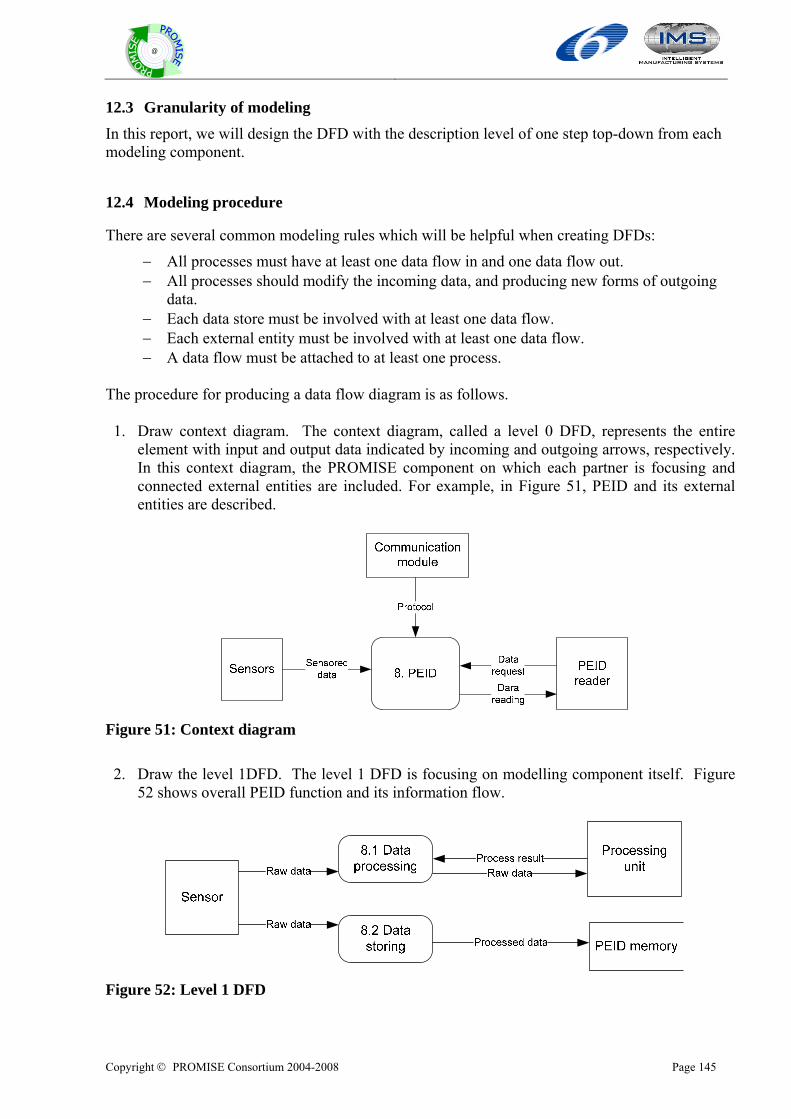
Copyright © PROMISE Consortium 2004-2008 Page 145
@
12.3 Granularity of modeling In this report, we will design the DFD with the description level of one step top-down from each modeling component.
12.4 Modeling procedure
There are several common modeling rules which will be helpful when creating DFDs: − All processes must have at least one data flow in and one data flow out. − All processes should modify the incoming data, and producing new forms of outgoing
data. − Each data store must be involved with at least one data flow. − Each external entity must be involved with at least one data flow. − A data flow must be attached to at least one process.
The procedure for producing a data flow diagram is as follows. 1. Draw context diagram. The context diagram, called a level 0 DFD, represents the entire
element with input and output data indicated by incoming and outgoing arrows, respectively. In this context diagram, the PROMISE component on which each partner is focusing and connected external entities are included. For example, in Figure 51, PEID and its external entities are described.
Figure 51: Context diagram 2. Draw the level 1DFD. The level 1 DFD is focusing on modelling component itself. Figure
52 shows overall PEID function and its information flow.
Figure 52: Level 1 DFD
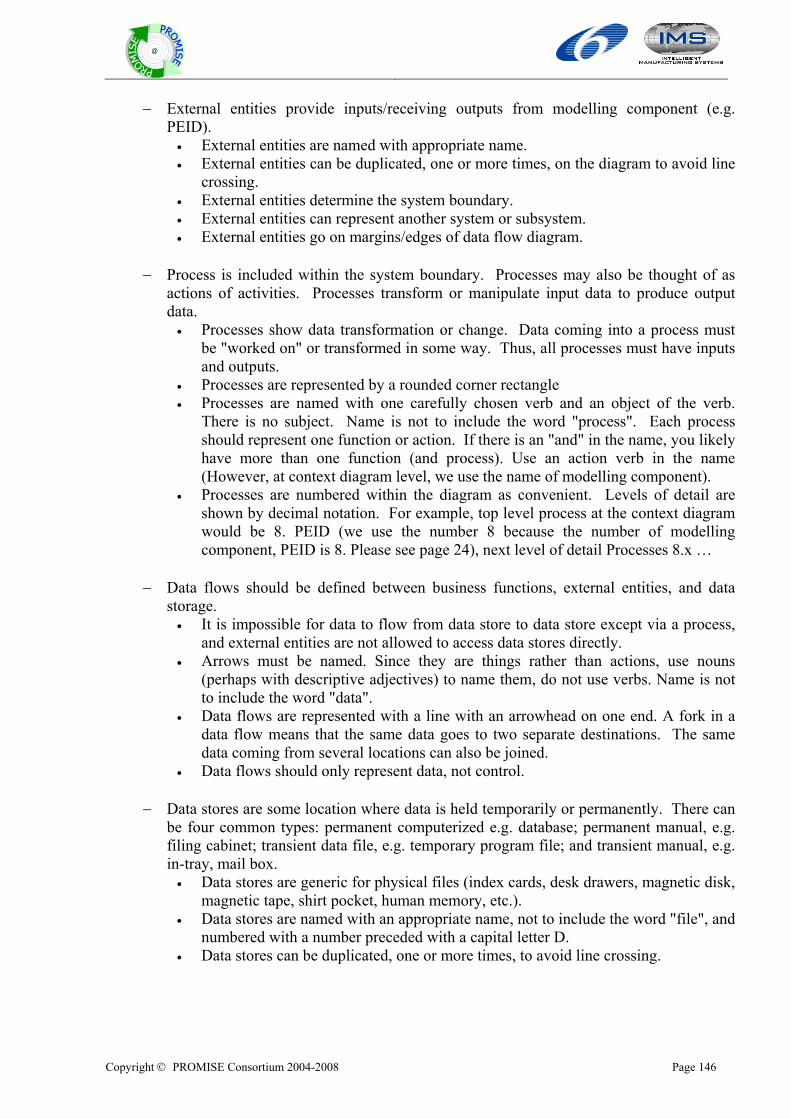
Copyright © PROMISE Consortium 2004-2008 Page 146
@
− External entities provide inputs/receiving outputs from modelling component (e.g. PEID). • External entities are named with appropriate name. • External entities can be duplicated, one or more times, on the diagram to avoid line
crossing. • External entities determine the system boundary. • External entities can represent another system or subsystem. • External entities go on margins/edges of data flow diagram.
− Process is included within the system boundary. Processes may also be thought of as
actions of activities. Processes transform or manipulate input data to produce output data. • Processes show data transformation or change. Data coming into a process must
be "worked on" or transformed in some way. Thus, all processes must have inputs and outputs.
• Processes are represented by a rounded corner rectangle • Processes are named with one carefully chosen verb and an object of the verb.
There is no subject. Name is not to include the word "process". Each process should represent one function or action. If there is an "and" in the name, you likely have more than one function (and process). Use an action verb in the name (However, at context diagram level, we use the name of modelling component).
• Processes are numbered within the diagram as convenient. Levels of detail are shown by decimal notation. For example, top level process at the context diagram would be 8. PEID (we use the number 8 because the number of modelling component, PEID is 8. Please see page 24), next level of detail Processes 8.x …
− Data flows should be defined between business functions, external entities, and data
storage. • It is impossible for data to flow from data store to data store except via a process,
and external entities are not allowed to access data stores directly. • Arrows must be named. Since they are things rather than actions, use nouns
(perhaps with descriptive adjectives) to name them, do not use verbs. Name is not to include the word "data".
• Data flows are represented with a line with an arrowhead on one end. A fork in a data flow means that the same data goes to two separate destinations. The same data coming from several locations can also be joined.
• Data flows should only represent data, not control.
− Data stores are some location where data is held temporarily or permanently. There can be four common types: permanent computerized e.g. database; permanent manual, e.g. filing cabinet; transient data file, e.g. temporary program file; and transient manual, e.g. in-tray, mail box. • Data stores are generic for physical files (index cards, desk drawers, magnetic disk,
magnetic tape, shirt pocket, human memory, etc.). • Data stores are named with an appropriate name, not to include the word "file", and
numbered with a number preceded with a capital letter D. • Data stores can be duplicated, one or more times, to avoid line crossing.

Copyright © PROMISE Consortium 2004-2008 Page 147
@
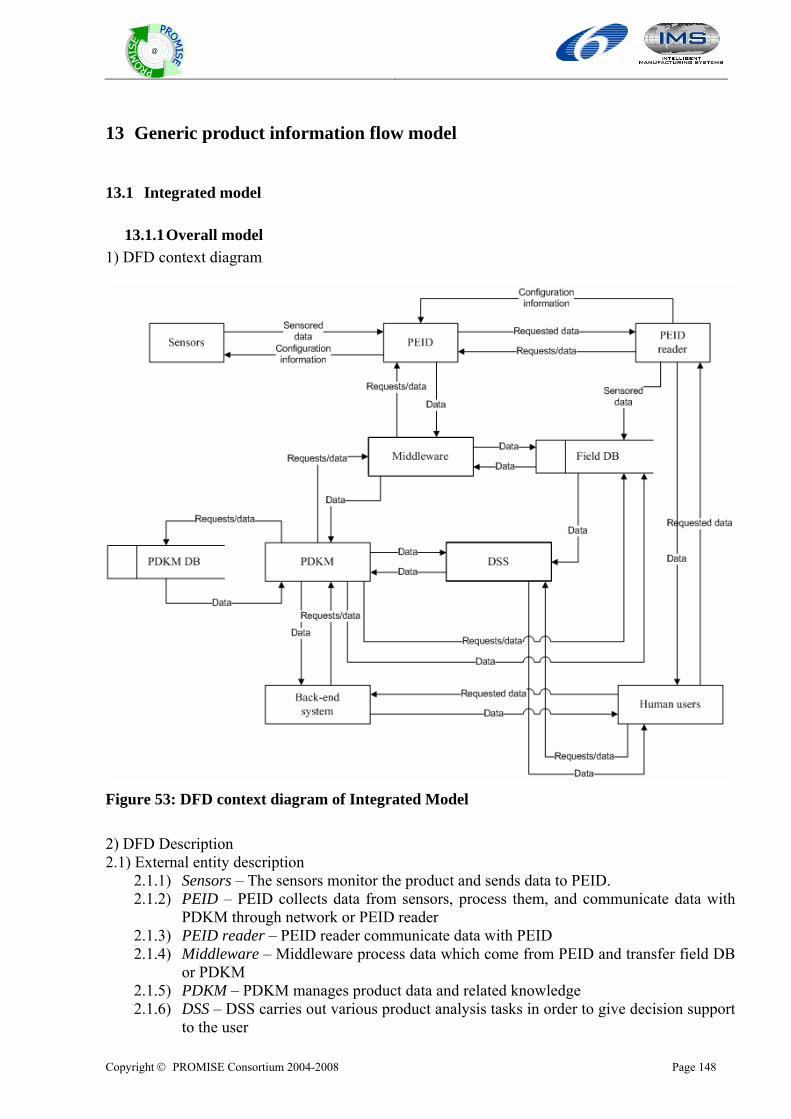
Copyright © PROMISE Consortium 2004-2008 Page 148
@
13 Generic product information flow model
13.1 Integrated model
13.1.1 Overall model 1) DFD context diagram
Figure 53: DFD context diagram of Integrated Model 2) DFD Description 2.1) External entity description
2.1.1) Sensors – The sensors monitor the product and sends data to PEID. 2.1.2) PEID – PEID collects data from sensors, process them, and communicate data with
PDKM through network or PEID reader 2.1.3) PEID reader – PEID reader communicate data with PEID 2.1.4) Middleware – Middleware process data which come from PEID and transfer field DB
or PDKM 2.1.5) PDKM – PDKM manages product data and related knowledge 2.1.6) DSS – DSS carries out various product analysis tasks in order to give decision support
to the user
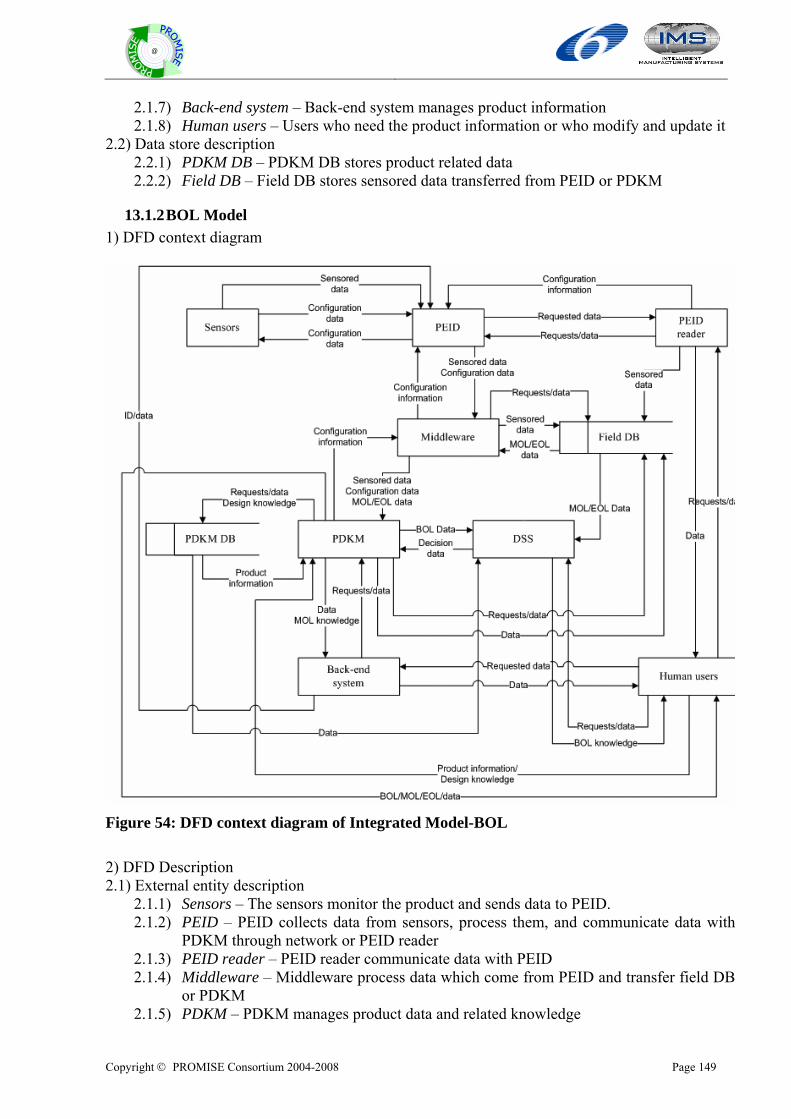
Copyright © PROMISE Consortium 2004-2008 Page 149
@
2.1.7) Back-end system – Back-end system manages product information 2.1.8) Human users – Users who need the product information or who modify and update it
2.2) Data store description 2.2.1) PDKM DB – PDKM DB stores product related data 2.2.2) Field DB – Field DB stores sensored data transferred from PEID or PDKM
13.1.2 BOL Model 1) DFD context diagram
Figure 54: DFD context diagram of Integrated Model-BOL 2) DFD Description 2.1) External entity description
2.1.1) Sensors – The sensors monitor the product and sends data to PEID. 2.1.2) PEID – PEID collects data from sensors, process them, and communicate data with
PDKM through network or PEID reader 2.1.3) PEID reader – PEID reader communicate data with PEID 2.1.4) Middleware – Middleware process data which come from PEID and transfer field DB
or PDKM 2.1.5) PDKM – PDKM manages product data and related knowledge
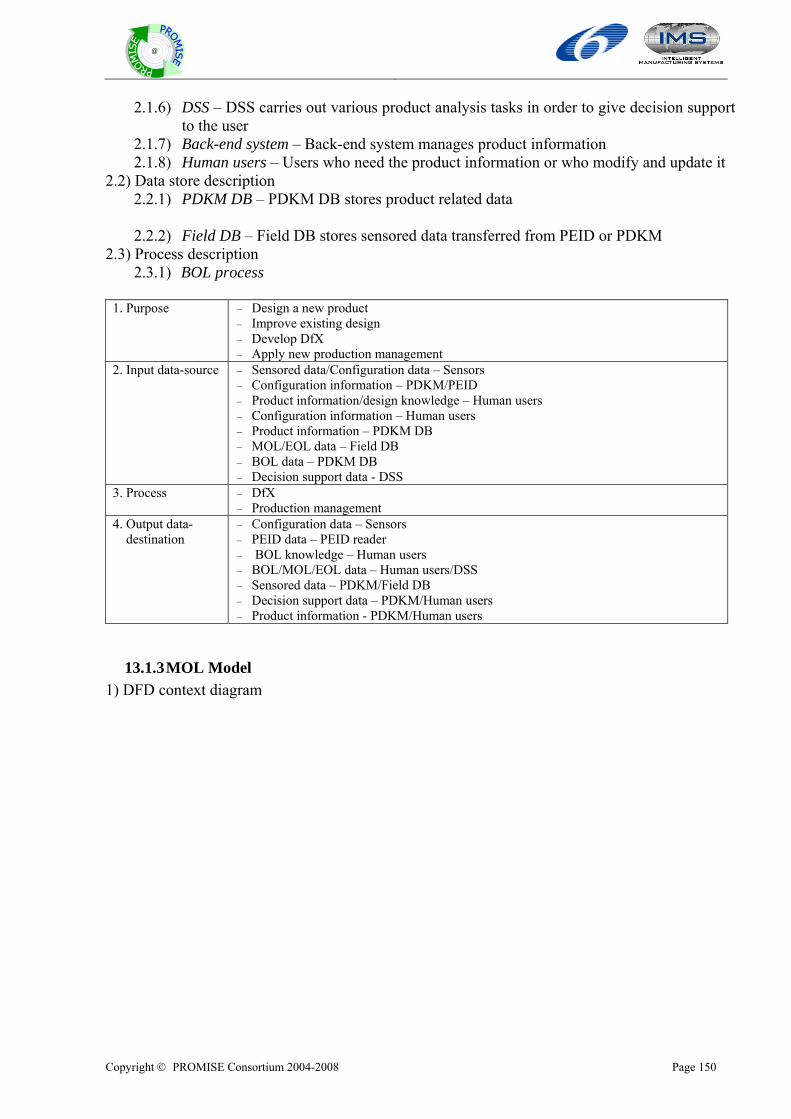
Copyright © PROMISE Consortium 2004-2008 Page 150
@
2.1.6) DSS – DSS carries out various product analysis tasks in order to give decision support to the user
2.1.7) Back-end system – Back-end system manages product information 2.1.8) Human users – Users who need the product information or who modify and update it
2.2) Data store description 2.2.1) PDKM DB – PDKM DB stores product related data 2.2.2) Field DB – Field DB stores sensored data transferred from PEID or PDKM
2.3) Process description 2.3.1) BOL process
1. Purpose – Design a new product – Improve existing design – Develop DfX – Apply new production management
2. Input data-source – Sensored data/Configuration data – Sensors – Configuration information – PDKM/PEID – Product information/design knowledge – Human users – Configuration information – Human users – Product information – PDKM DB – MOL/EOL data – Field DB – BOL data – PDKM DB – Decision support data - DSS
3. Process – DfX – Production management
4. Output data- destination
– Configuration data – Sensors – PEID data – PEID reader – BOL knowledge – Human users – BOL/MOL/EOL data – Human users/DSS – Sensored data – PDKM/Field DB – Decision support data – PDKM/Human users – Product information - PDKM/Human users
13.1.3 MOL Model 1) DFD context diagram
Copyright © PROMISE Consortium 2004-2008 Page 151
@
Figure 55: DFD context diagram of Integrated Model-MOL 2) DFD Description 2.1) External entity description
2.1.1) Sensors – The sensors monitor the product and sends data to PEID. 2.1.2) PEID – PEID collects data from sensors, process them, and communicate data with
PDKM through network or PEID reader 2.1.3) PEID reader – PEID reader communicate data with PEID 2.1.4) Middleware – Middleware process data which come from PEID and transfer field DB
or PDKM 2.1.5) PDKM – PDKM manages product data and related knowledge 2.1.6) DSS – DSS carries out various product analysis tasks in order to give decision support
to the user 2.1.7) Back-end system – Back-end system manages product information 2.1.8) Human users – Users who need the product information or who modify and update it
2.2) Data store description 2.2.1) PDKM DB – PDKM DB stores product related data 2.2.2) Field DB – Field DB stores sensored data transferred from PEID or PDKM
2.3) Process description 2.3.1) MOL process
1. Purpose – Improve maintenance process
– Support maintenance
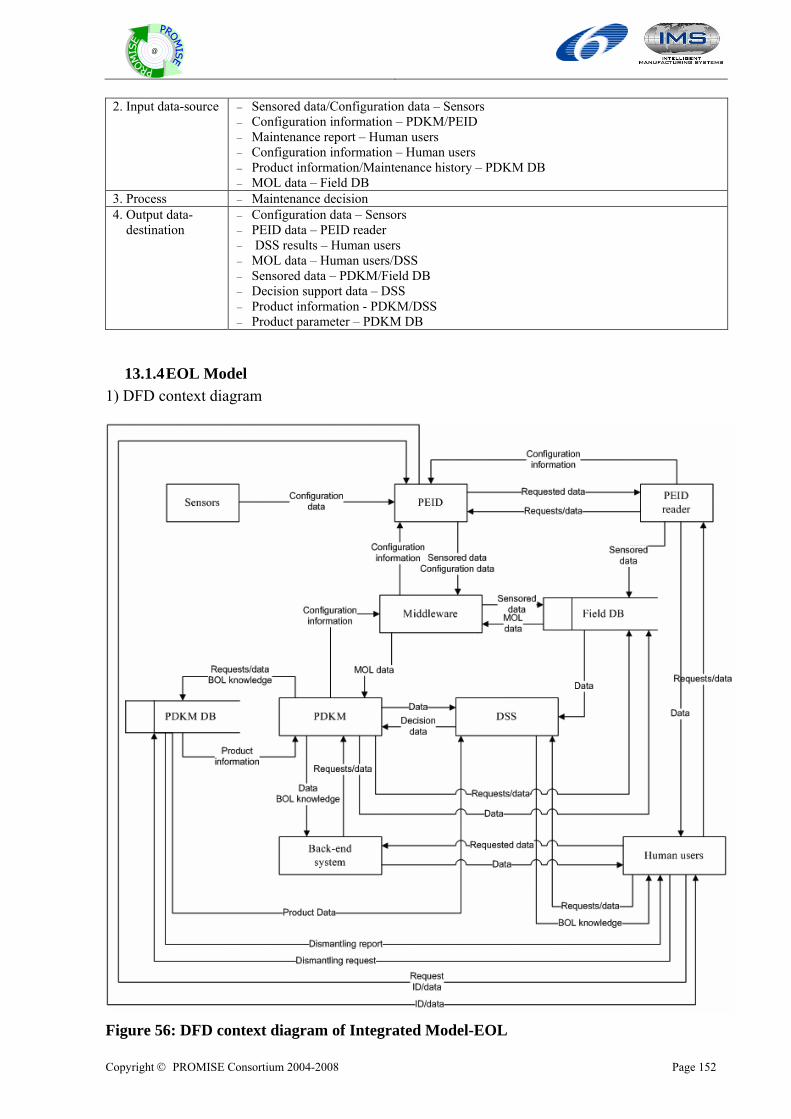
Copyright © PROMISE Consortium 2004-2008 Page 152
@
2. Input data-source – Sensored data/Configuration data – Sensors – Configuration information – PDKM/PEID – Maintenance report – Human users – Configuration information – Human users – Product information/Maintenance history – PDKM DB – MOL data – Field DB
3. Process – Maintenance decision 4. Output data- destination
– Configuration data – Sensors – PEID data – PEID reader – DSS results – Human users – MOL data – Human users/DSS – Sensored data – PDKM/Field DB – Decision support data – DSS – Product information - PDKM/DSS – Product parameter – PDKM DB
13.1.4 EOL Model 1) DFD context diagram
Figure 56: DFD context diagram of Integrated Model-EOL
Copyright © PROMISE Consortium 2004-2008 Page 153
@
2) DFD Description 2.1) External entity description
2.1.1) Sensors – The sensors monitor the product and sends data to PEID. 2.1.2) PEID – PEID collects data from sensors, process them, and communicate data with
PDKM through network or PEID reader 2.1.3) PEID reader – PEID reader communicate data with PEID 2.1.4) Middleware – Middleware process data which come from PEID and transfer field DB
or PDKM 2.1.5) PDKM – PDKM manages product data and related knowledge 2.1.6) DSS – DSS carries out various product analysis tasks in order to give decision support
to the user 2.1.7) Back-end system – Back-end system manages product information 2.1.8) Human users – Users who need the product information or who modify and update it
2.2) Data store description 2.2.1) PDKM DB – PDKM DB stores product related data 2.2.2) Field DB – Field DB stores sensored data transferred from PEID or PDKM
2.3) Process description 2.3.1) EOL process
1. Purpose – Assess EOL product – Decision EOL options – Support EOL process
2. Input data-source – Configuration data – Sensors – Product data – Human users – Product data/Maintenance history – PDKM DB – MOL data – Field DB – EOL knowledge – DSS – Dismantal report – Human users
3. Process – EOL decision – Provide product information
4. Output data- destination
– Configuration data – Sensors – PEID data – PEID reader – DSS results – Human users – MOL data – Human users/DSS – Decision support data – DSS – Product information - PDKM/DSS/Human users
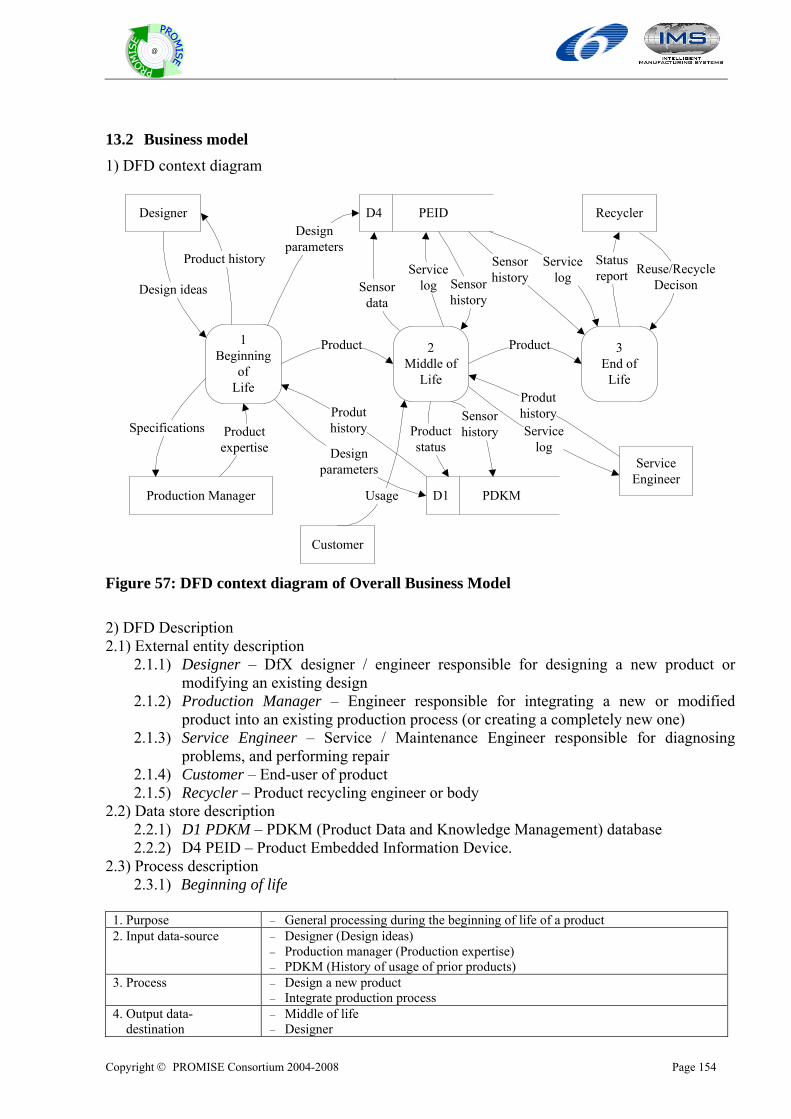
Copyright © PROMISE Consortium 2004-2008 Page 154
@
13.2 Business model 1) DFD context diagram
Designer
1Beginning
ofLife
D4 PEID
Production Manager
Customer
ServiceEngineer
Recycler
2Middle of
Life
3End of
Life
Product history
Design ideas
Designparameters
Sensordata
Servicelog Sensor
history
Sensorhistory
Servicelog
Statusreport Reuse/Recycle
Decison
ProductProduct
Specifications Productexpertise
Productstatus
D1 PDKM
Sensorhistory
Designparameters
Produthistory
Usage
Servicelog
Produthistory
Figure 57: DFD context diagram of Overall Business Model 2) DFD Description 2.1) External entity description
2.1.1) Designer – DfX designer / engineer responsible for designing a new product or modifying an existing design
2.1.2) Production Manager – Engineer responsible for integrating a new or modified product into an existing production process (or creating a completely new one)
2.1.3) Service Engineer – Service / Maintenance Engineer responsible for diagnosing problems, and performing repair
2.1.4) Customer – End-user of product 2.1.5) Recycler – Product recycling engineer or body
2.2) Data store description 2.2.1) D1 PDKM – PDKM (Product Data and Knowledge Management) database 2.2.2) D4 PEID – Product Embedded Information Device.
2.3) Process description 2.3.1) Beginning of life
1. Purpose – General processing during the beginning of life of a product 2. Input data-source – Designer (Design ideas)
– Production manager (Production expertise) – PDKM (History of usage of prior products)
3. Process – Design a new product – Integrate production process
4. Output data- destination
– Middle of life – Designer
Copyright © PROMISE Consortium 2004-2008 Page 155
@
– Production manager – PEID – PDKM
2.3.2) Middle of life
1. Purpose – General processing occurring during middle of life 2. Input data-source – Beginning of Life (Product)
– Customer (Usage) – PDKM (service history) – Service Engineer (service log) – PEID (sensor history)
3. Process – Normal usage – Service product
4. Output data- destination
– PDKM (sensor history, service log) – PEID (sensor date) – PDKM (product state) – End of life (product)
2.3.3) End of life
1. Purpose – General processing occurring during end of life 2. Input data-source – Middle of Life (Product)
– PDKM (service history) – Recycler (recycle decision) – PEID (sensor history, service log)
3. Process – Reuse / recycle assessment – Component extraction
4. Output data- destination
– Recycler (status report)
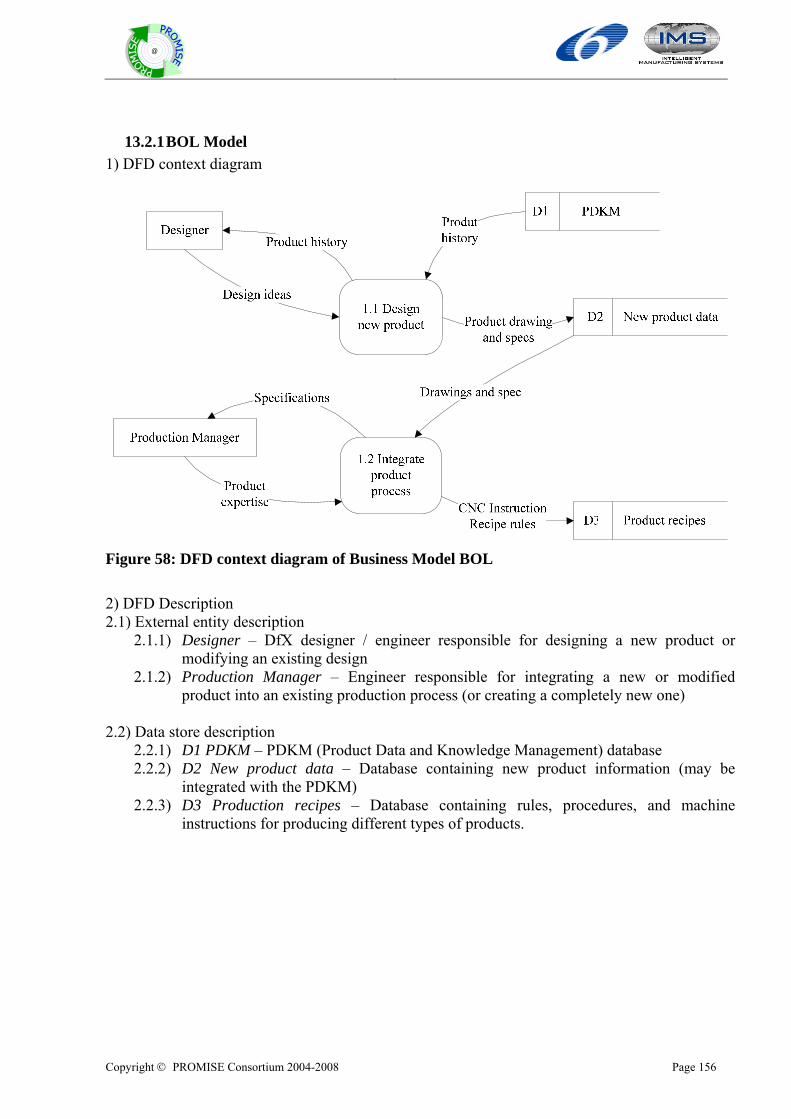
Copyright © PROMISE Consortium 2004-2008 Page 156
@
13.2.1 BOL Model 1) DFD context diagram
Figure 58: DFD context diagram of Business Model BOL 2) DFD Description 2.1) External entity description
2.1.1) Designer – DfX designer / engineer responsible for designing a new product or modifying an existing design
2.1.2) Production Manager – Engineer responsible for integrating a new or modified product into an existing production process (or creating a completely new one)
2.2) Data store description
2.2.1) D1 PDKM – PDKM (Product Data and Knowledge Management) database 2.2.2) D2 New product data – Database containing new product information (may be
integrated with the PDKM) 2.2.3) D3 Production recipes – Database containing rules, procedures, and machine
instructions for producing different types of products.
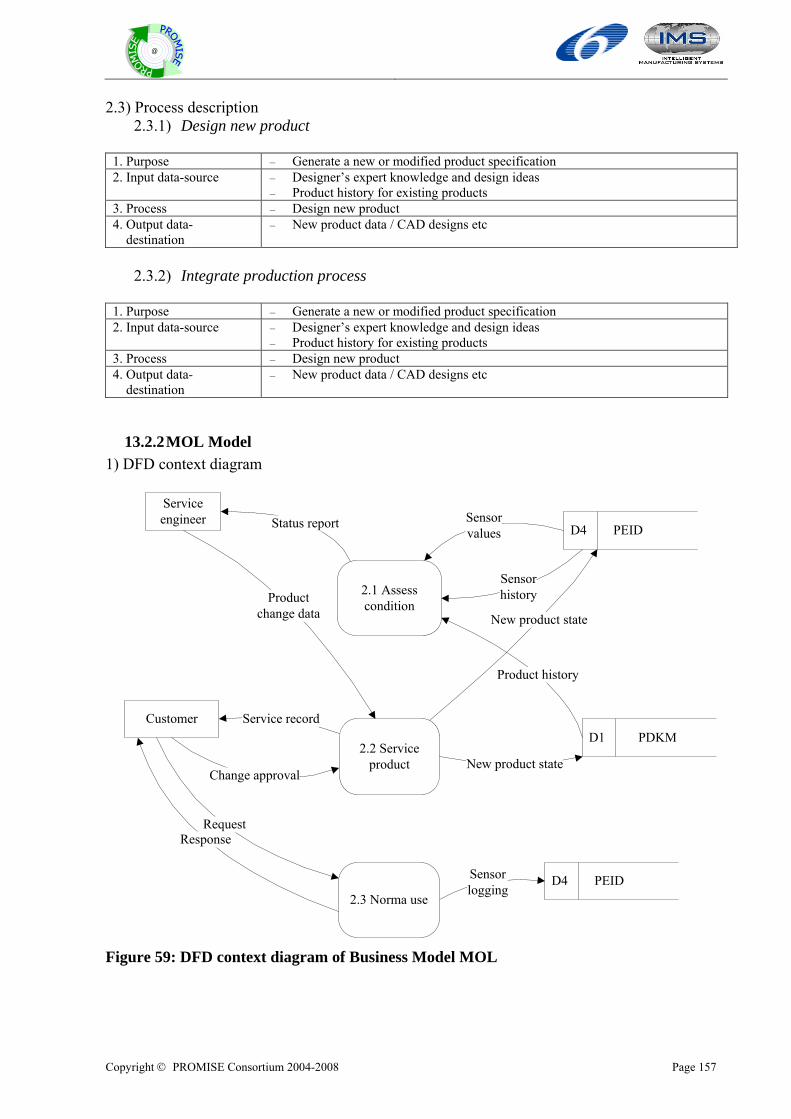
Copyright © PROMISE Consortium 2004-2008 Page 157
@
2.3) Process description 2.3.1) Design new product
1. Purpose – Generate a new or modified product specification 2. Input data-source – Designer’s expert knowledge and design ideas
– Product history for existing products 3. Process – Design new product 4. Output data- destination
– New product data / CAD designs etc
2.3.2) Integrate production process
1. Purpose – Generate a new or modified product specification 2. Input data-source – Designer’s expert knowledge and design ideas
– Product history for existing products 3. Process – Design new product 4. Output data- destination
– New product data / CAD designs etc
13.2.2 MOL Model 1) DFD context diagram
Service engineer
2.1 Assesscondition
Customer
2.2 Serviceproduct
Status report
Productchange data New product state
Service record
Change approval
Sensorlogging
D4 PEIDSensorvalues
Sensorhistory
2.3 Norma use
D1 PDKM
Request
New product state
Product history
Response
D4 PEID
Figure 59: DFD context diagram of Business Model MOL
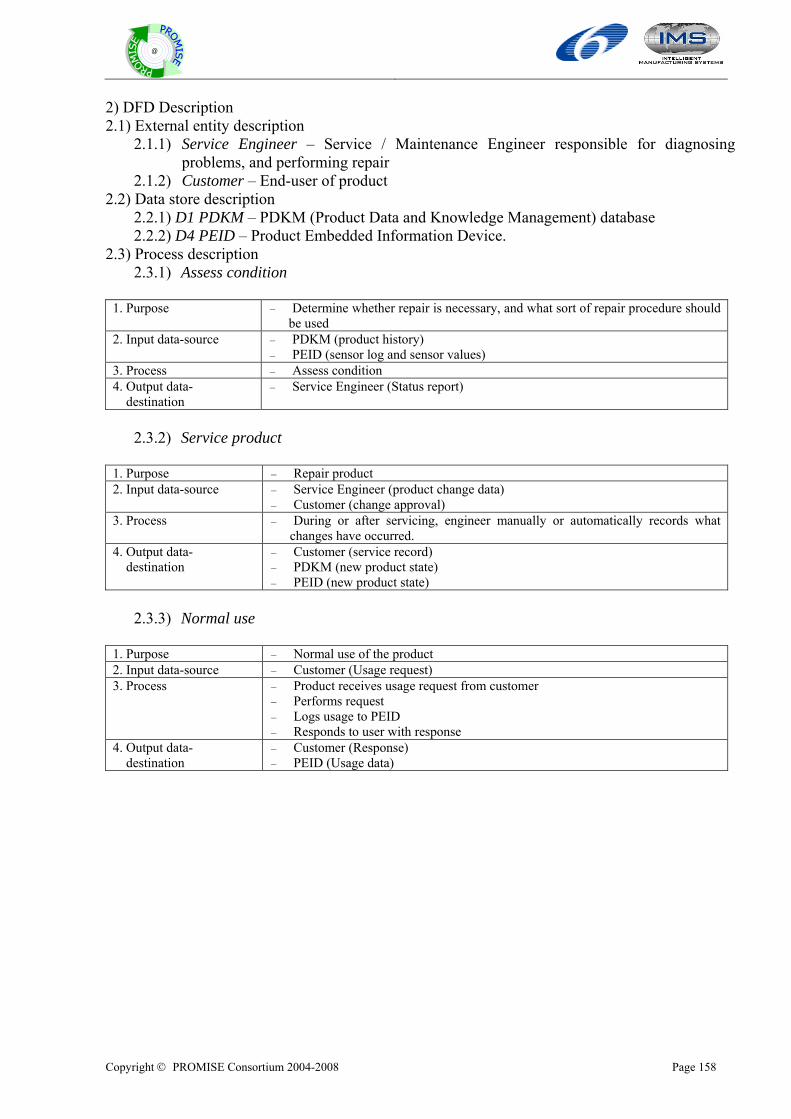
Copyright © PROMISE Consortium 2004-2008 Page 158
@
2) DFD Description 2.1) External entity description
2.1.1) Service Engineer – Service / Maintenance Engineer responsible for diagnosing problems, and performing repair
2.1.2) Customer – End-user of product 2.2) Data store description
2.2.1) D1 PDKM – PDKM (Product Data and Knowledge Management) database 2.2.2) D4 PEID – Product Embedded Information Device.
2.3) Process description 2.3.1) Assess condition
1. Purpose – Determine whether repair is necessary, and what sort of repair procedure should
be used 2. Input data-source – PDKM (product history)
– PEID (sensor log and sensor values) 3. Process – Assess condition 4. Output data- destination
– Service Engineer (Status report)
2.3.2) Service product
1. Purpose – Repair product 2. Input data-source – Service Engineer (product change data)
– Customer (change approval) 3. Process – During or after servicing, engineer manually or automatically records what
changes have occurred. 4. Output data- destination
– Customer (service record) – PDKM (new product state) – PEID (new product state)
2.3.3) Normal use
1. Purpose – Normal use of the product 2. Input data-source – Customer (Usage request) 3. Process – Product receives usage request from customer
– Performs request – Logs usage to PEID – Responds to user with response
4. Output data- destination
– Customer (Response) – PEID (Usage data)
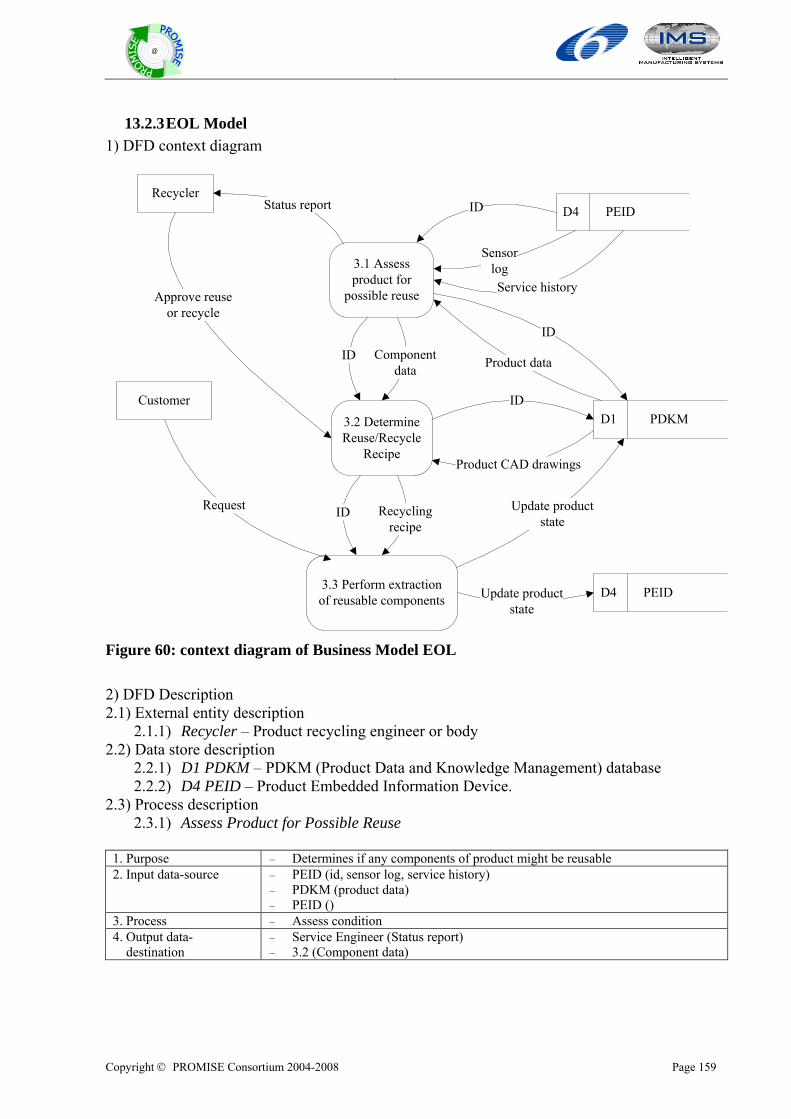
Copyright © PROMISE Consortium 2004-2008 Page 159
@
13.2.3 EOL Model 1) DFD context diagram
Recycler
3.1 Assessproduct for
possible reuse
Customer3.2 DetermineReuse/Recycle
Recipe
Status report
Approve reuseor recycle
Service history
ID Componentdata
Update productstate
D4 PEIDID
Sensorlog
3.3 Perform extractionof reusable components
D1 PDKM
Request
ID
Product data
Product CAD drawings
D4 PEID
ID Recyclingrecipe
Update productstate
ID
Figure 60: context diagram of Business Model EOL 2) DFD Description 2.1) External entity description
2.1.1) Recycler – Product recycling engineer or body 2.2) Data store description
2.2.1) D1 PDKM – PDKM (Product Data and Knowledge Management) database 2.2.2) D4 PEID – Product Embedded Information Device.
2.3) Process description 2.3.1) Assess Product for Possible Reuse
1. Purpose – Determines if any components of product might be reusable 2. Input data-source – PEID (id, sensor log, service history)
– PDKM (product data) – PEID ()
3. Process – Assess condition 4. Output data- destination
– Service Engineer (Status report) – 3.2 (Component data)
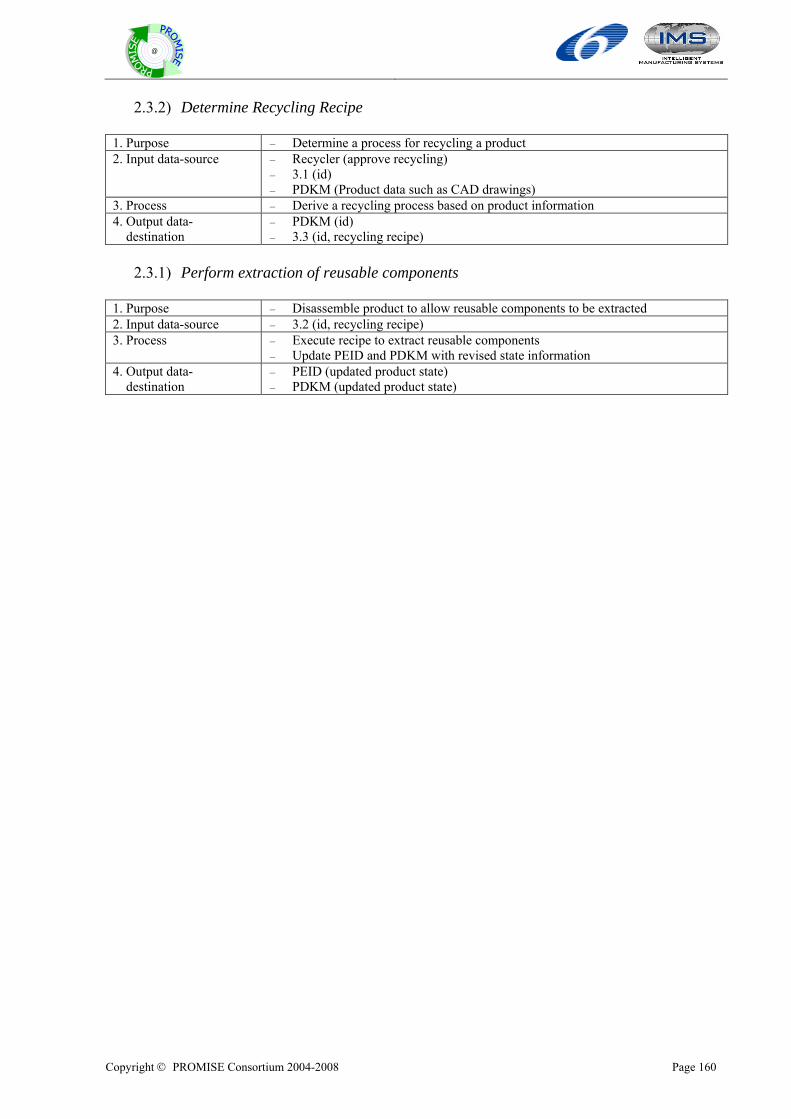
Copyright © PROMISE Consortium 2004-2008 Page 160
@
2.3.2) Determine Recycling Recipe
1. Purpose – Determine a process for recycling a product 2. Input data-source – Recycler (approve recycling)
– 3.1 (id) – PDKM (Product data such as CAD drawings)
3. Process – Derive a recycling process based on product information 4. Output data- destination
– PDKM (id) – 3.3 (id, recycling recipe)
2.3.1) Perform extraction of reusable components
1. Purpose – Disassemble product to allow reusable components to be extracted 2. Input data-source – 3.2 (id, recycling recipe) 3. Process – Execute recipe to extract reusable components
– Update PEID and PDKM with revised state information 4. Output data- destination
– PEID (updated product state) – PDKM (updated product state)
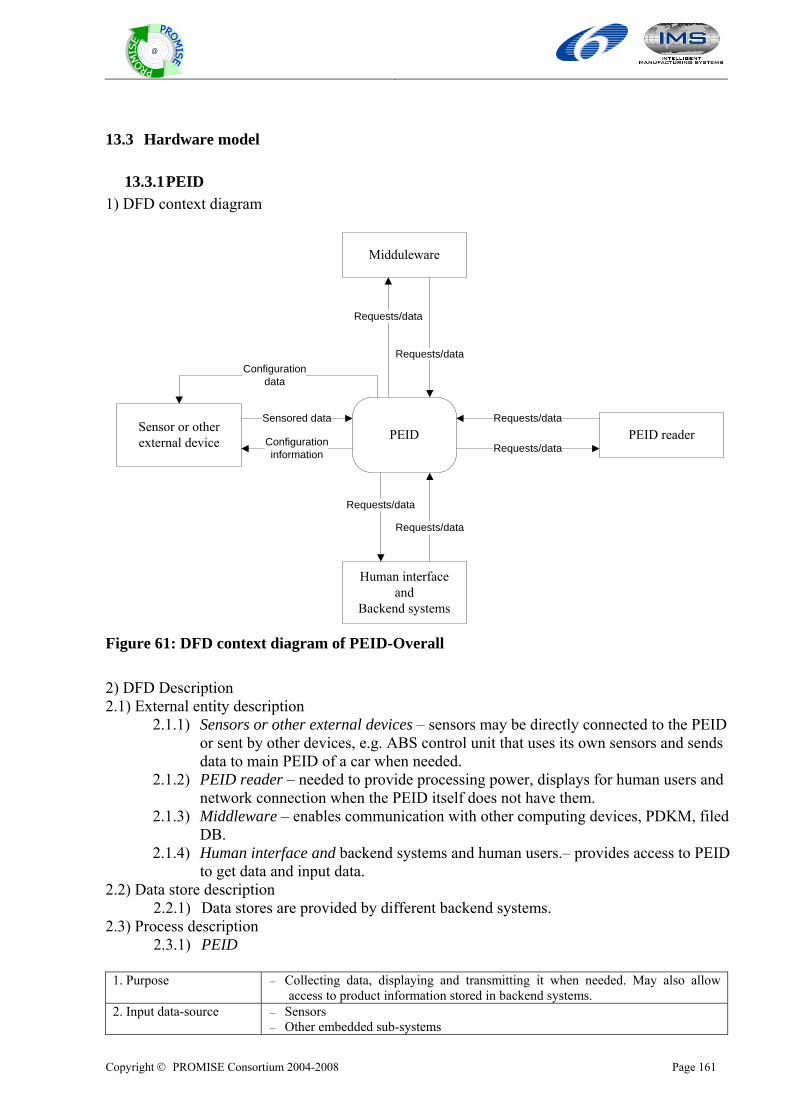
Copyright © PROMISE Consortium 2004-2008 Page 161
@
13.3 Hardware model
13.3.1 PEID 1) DFD context diagram
PEIDSensor or other external device PEID reader
Human interfaceand
Backend systems
Sensored data
Configurationinformation
Configurationdata
Requests/data
Requests/data
Requests/data
Requests/data
Midduleware
Requests/data
Requests/data
Figure 61: DFD context diagram of PEID-Overall 2) DFD Description 2.1) External entity description
2.1.1) Sensors or other external devices – sensors may be directly connected to the PEID or sent by other devices, e.g. ABS control unit that uses its own sensors and sends data to main PEID of a car when needed.
2.1.2) PEID reader – needed to provide processing power, displays for human users and network connection when the PEID itself does not have them.
2.1.3) Middleware – enables communication with other computing devices, PDKM, filed DB.
2.1.4) Human interface and backend systems and human users.– provides access to PEID to get data and input data.
2.2) Data store description 2.2.1) Data stores are provided by different backend systems.
2.3) Process description 2.3.1) PEID
1. Purpose – Collecting data, displaying and transmitting it when needed. May also allow access to product information stored in backend systems.
2. Input data-source – Sensors – Other embedded sub-systems
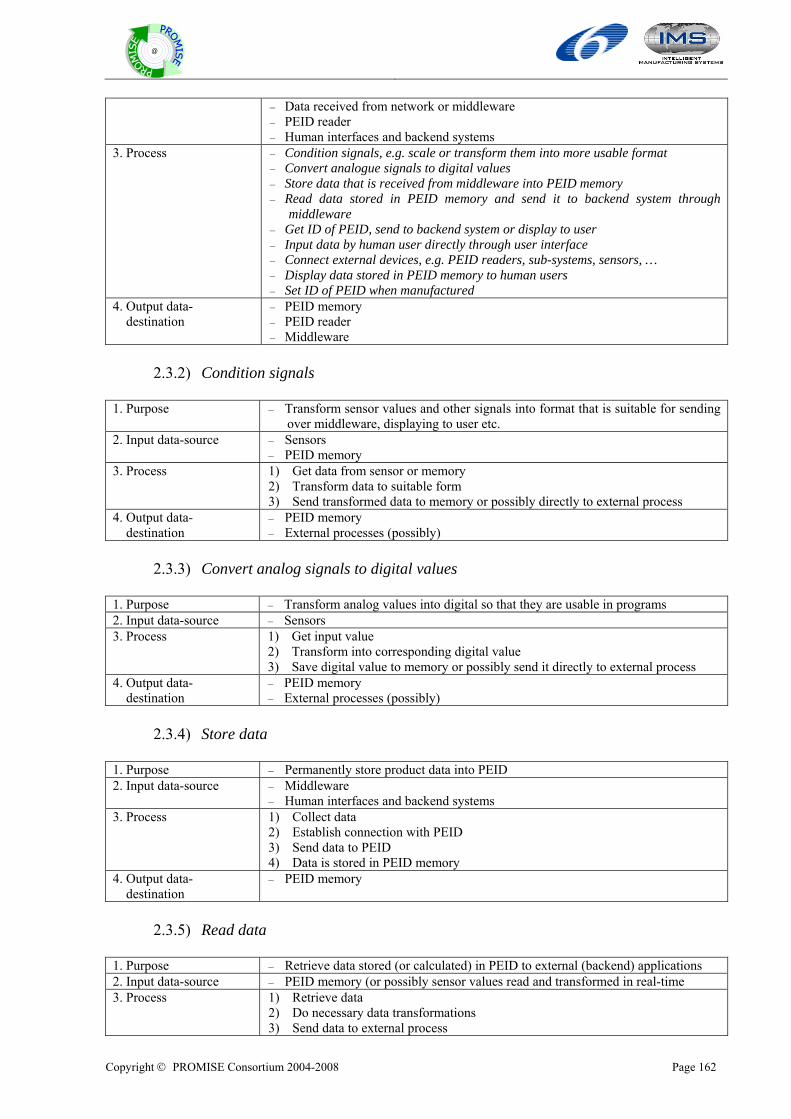
Copyright © PROMISE Consortium 2004-2008 Page 162
@
– Data received from network or middleware – PEID reader – Human interfaces and backend systems
3. Process – Condition signals, e.g. scale or transform them into more usable format – Convert analogue signals to digital values – Store data that is received from middleware into PEID memory – Read data stored in PEID memory and send it to backend system through
middleware – Get ID of PEID, send to backend system or display to user – Input data by human user directly through user interface – Connect external devices, e.g. PEID readers, sub-systems, sensors, … – Display data stored in PEID memory to human users – Set ID of PEID when manufactured
4. Output data- destination
– PEID memory – PEID reader – Middleware
2.3.2) Condition signals
1. Purpose – Transform sensor values and other signals into format that is suitable for sending over middleware, displaying to user etc.
2. Input data-source – Sensors – PEID memory
3. Process 1) Get data from sensor or memory 2) Transform data to suitable form 3) Send transformed data to memory or possibly directly to external process
4. Output data- destination
– PEID memory – External processes (possibly)
2.3.3) Convert analog signals to digital values
1. Purpose – Transform analog values into digital so that they are usable in programs 2. Input data-source – Sensors 3. Process 1) Get input value
2) Transform into corresponding digital value 3) Save digital value to memory or possibly send it directly to external process
4. Output data- destination
– PEID memory – External processes (possibly)
2.3.4) Store data
1. Purpose – Permanently store product data into PEID 2. Input data-source – Middleware
– Human interfaces and backend systems 3. Process 1) Collect data
2) Establish connection with PEID 3) Send data to PEID 4) Data is stored in PEID memory
4. Output data- destination
– PEID memory
2.3.5) Read data
1. Purpose – Retrieve data stored (or calculated) in PEID to external (backend) applications 2. Input data-source – PEID memory (or possibly sensor values read and transformed in real-time 3. Process 1) Retrieve data
2) Do necessary data transformations 3) Send data to external process
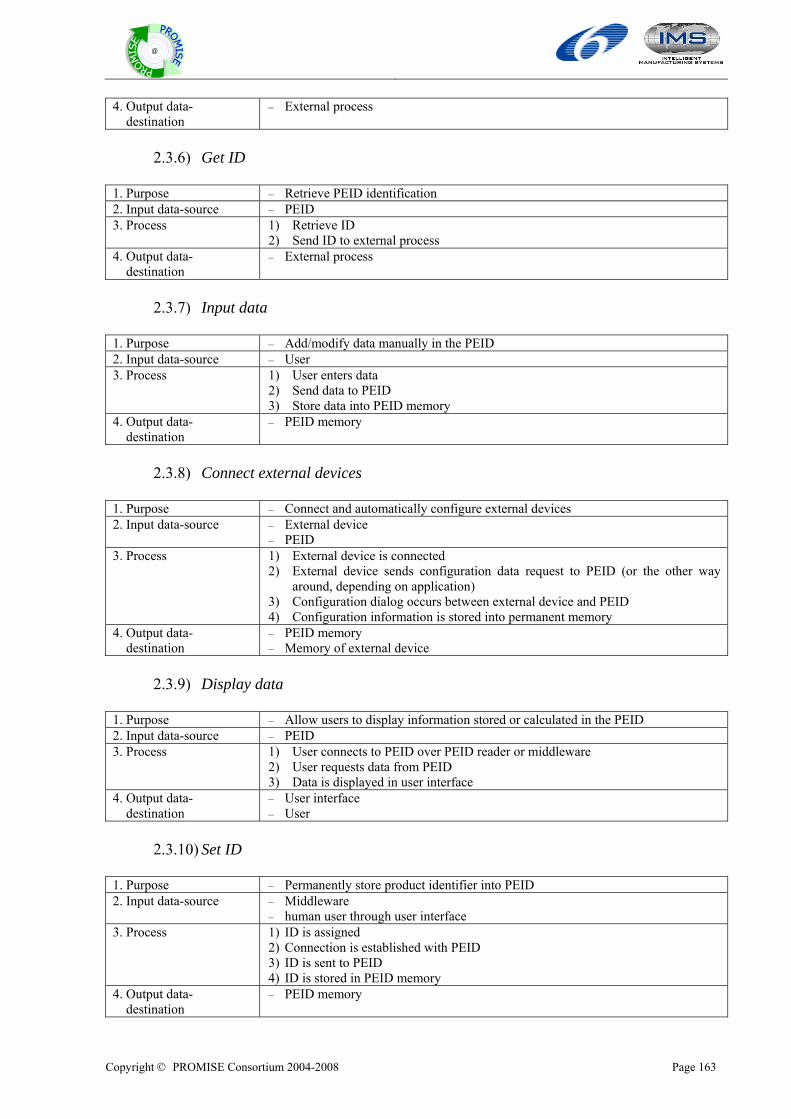
Copyright © PROMISE Consortium 2004-2008 Page 163
@
4. Output data- destination
– External process
2.3.6) Get ID
1. Purpose – Retrieve PEID identification 2. Input data-source – PEID 3. Process 1) Retrieve ID
2) Send ID to external process 4. Output data- destination
– External process
2.3.7) Input data
1. Purpose – Add/modify data manually in the PEID 2. Input data-source – User 3. Process 1) User enters data
2) Send data to PEID 3) Store data into PEID memory
4. Output data- destination
– PEID memory
2.3.8) Connect external devices
1. Purpose – Connect and automatically configure external devices 2. Input data-source – External device
– PEID 3. Process 1) External device is connected
2) External device sends configuration data request to PEID (or the other way around, depending on application)
3) Configuration dialog occurs between external device and PEID 4) Configuration information is stored into permanent memory
4. Output data- destination
– PEID memory – Memory of external device
2.3.9) Display data
1. Purpose – Allow users to display information stored or calculated in the PEID 2. Input data-source – PEID 3. Process 1) User connects to PEID over PEID reader or middleware
2) User requests data from PEID 3) Data is displayed in user interface
4. Output data- destination
– User interface – User
2.3.10) Set ID
1. Purpose – Permanently store product identifier into PEID 2. Input data-source – Middleware
– human user through user interface 3. Process 1) ID is assigned
2) Connection is established with PEID 3) ID is sent to PEID 4) ID is stored in PEID memory
4. Output data- destination
– PEID memory
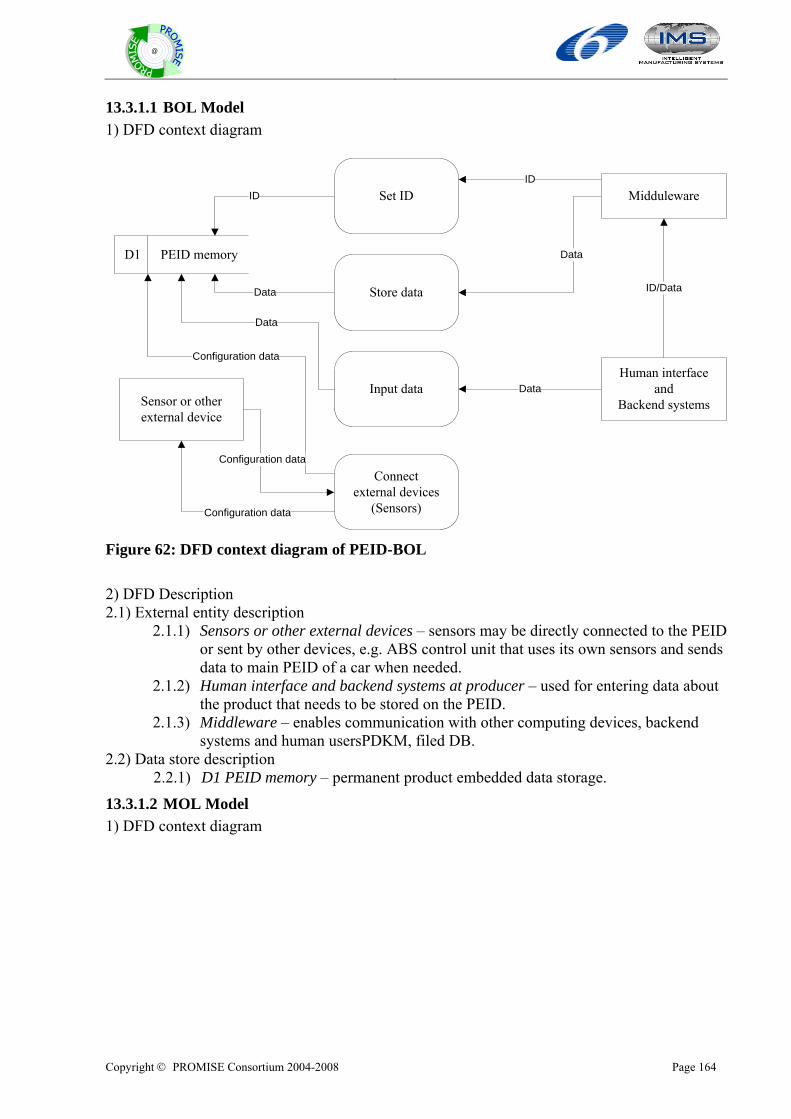
Copyright © PROMISE Consortium 2004-2008 Page 164
@
13.3.1.1 BOL Model 1) DFD context diagram
Set ID
Sensor or other external device
Human interfaceand
Backend systems
ID
Data
ID
Data
Midduleware
D1 PEID memory
Store data
Input data
Connect external devices
(Sensors)
Configuration data
Configuration data
Configuration data
Data
ID/Data
Data
Figure 62: DFD context diagram of PEID-BOL 2) DFD Description 2.1) External entity description
2.1.1) Sensors or other external devices – sensors may be directly connected to the PEID or sent by other devices, e.g. ABS control unit that uses its own sensors and sends data to main PEID of a car when needed.
2.1.2) Human interface and backend systems at producer – used for entering data about the product that needs to be stored on the PEID.
2.1.3) Middleware – enables communication with other computing devices, backend systems and human usersPDKM, filed DB.
2.2) Data store description 2.2.1) D1 PEID memory – permanent product embedded data storage.
13.3.1.2 MOL Model 1) DFD context diagram
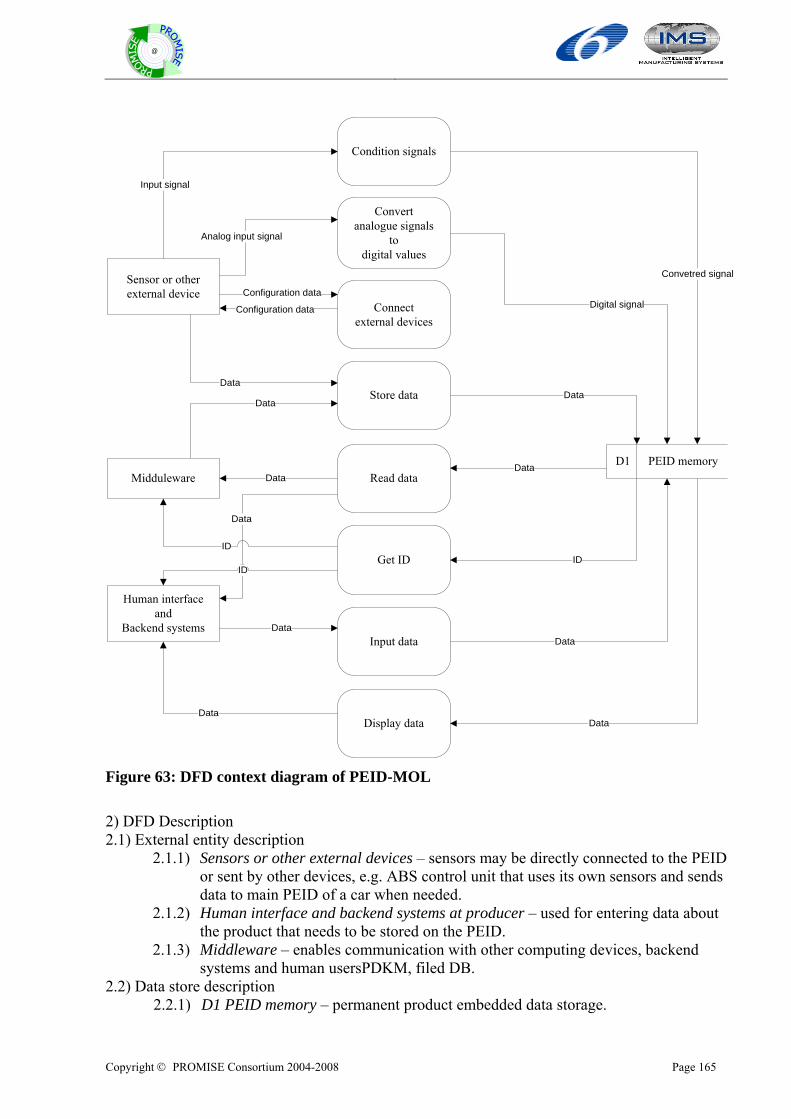
Copyright © PROMISE Consortium 2004-2008 Page 165
@
Condition signals
Sensor or other external device
Human interfaceand
Backend systems
Convetred signal
Data
ID
Data
Midduleware D1 PEID memory
Convert analogue signals
todigital values
Connect external devices
Store data
Digital signal
Input signal
Configuration data
Analog input signal
Data
Read data
Get ID
Input data
Display data
Configuration data
Data
ID
Data
Data
Data
Data
ID
Data
Data
Figure 63: DFD context diagram of PEID-MOL 2) DFD Description 2.1) External entity description
2.1.1) Sensors or other external devices – sensors may be directly connected to the PEID or sent by other devices, e.g. ABS control unit that uses its own sensors and sends data to main PEID of a car when needed.
2.1.2) Human interface and backend systems at producer – used for entering data about the product that needs to be stored on the PEID.
2.1.3) Middleware – enables communication with other computing devices, backend systems and human usersPDKM, filed DB.
2.2) Data store description 2.2.1) D1 PEID memory – permanent product embedded data storage.
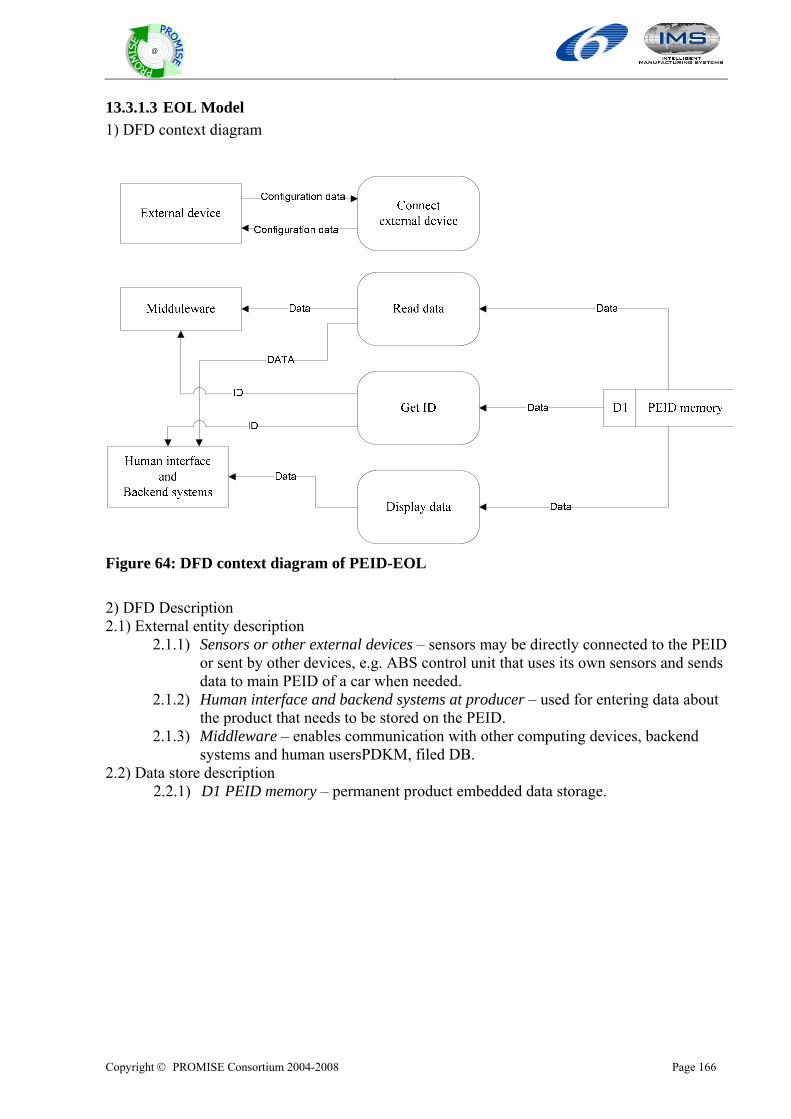
Copyright © PROMISE Consortium 2004-2008 Page 166
@
13.3.1.3 EOL Model 1) DFD context diagram
Figure 64: DFD context diagram of PEID-EOL 2) DFD Description 2.1) External entity description
2.1.1) Sensors or other external devices – sensors may be directly connected to the PEID or sent by other devices, e.g. ABS control unit that uses its own sensors and sends data to main PEID of a car when needed.
2.1.2) Human interface and backend systems at producer – used for entering data about the product that needs to be stored on the PEID.
2.1.3) Middleware – enables communication with other computing devices, backend systems and human usersPDKM, filed DB.
2.2) Data store description 2.2.1) D1 PEID memory – permanent product embedded data storage.
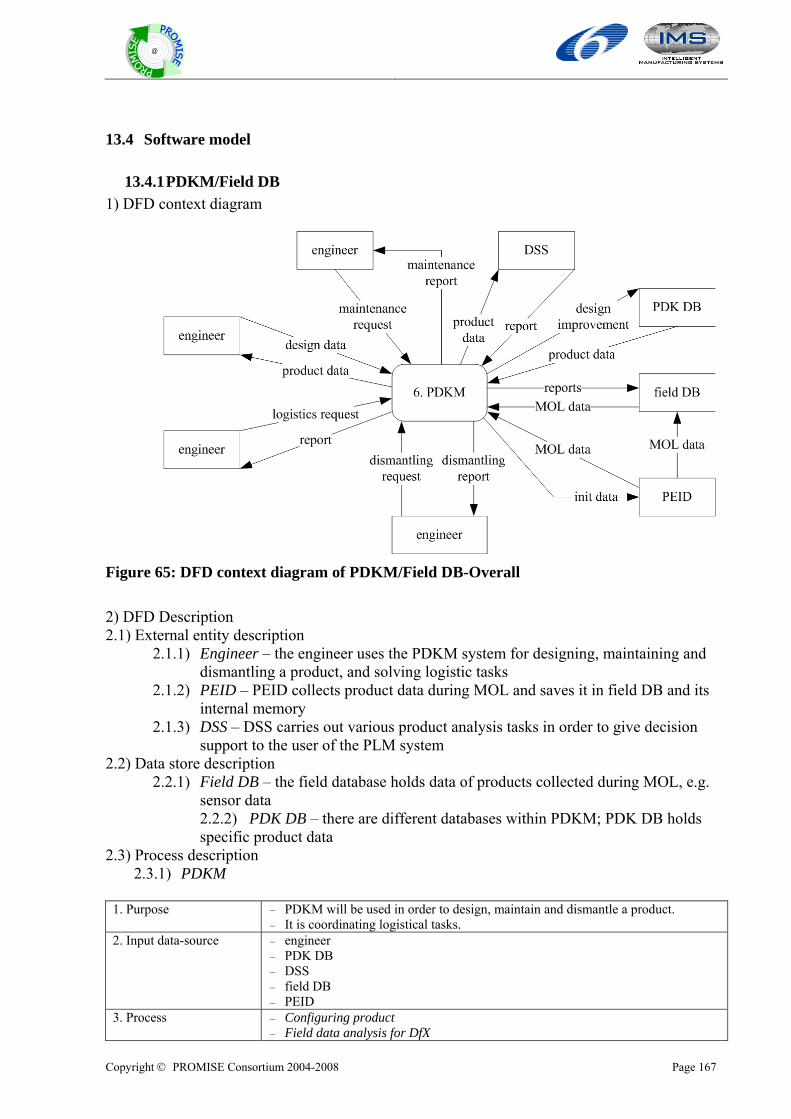
Copyright © PROMISE Consortium 2004-2008 Page 167
@
13.4 Software model
13.4.1 PDKM/Field DB 1) DFD context diagram
Figure 65: DFD context diagram of PDKM/Field DB-Overall 2) DFD Description 2.1) External entity description
2.1.1) Engineer – the engineer uses the PDKM system for designing, maintaining and dismantling a product, and solving logistic tasks
2.1.2) PEID – PEID collects product data during MOL and saves it in field DB and its internal memory
2.1.3) DSS – DSS carries out various product analysis tasks in order to give decision support to the user of the PLM system
2.2) Data store description 2.2.1) Field DB – the field database holds data of products collected during MOL, e.g.
sensor data 2.2.2) PDK DB – there are different databases within PDKM; PDK DB holds specific product data
2.3) Process description 2.3.1) PDKM
1. Purpose – PDKM will be used in order to design, maintain and dismantle a product.
– It is coordinating logistical tasks. 2. Input data-source – engineer
– PDK DB – DSS – field DB – PEID
3. Process – Configuring product – Field data analysis for DfX
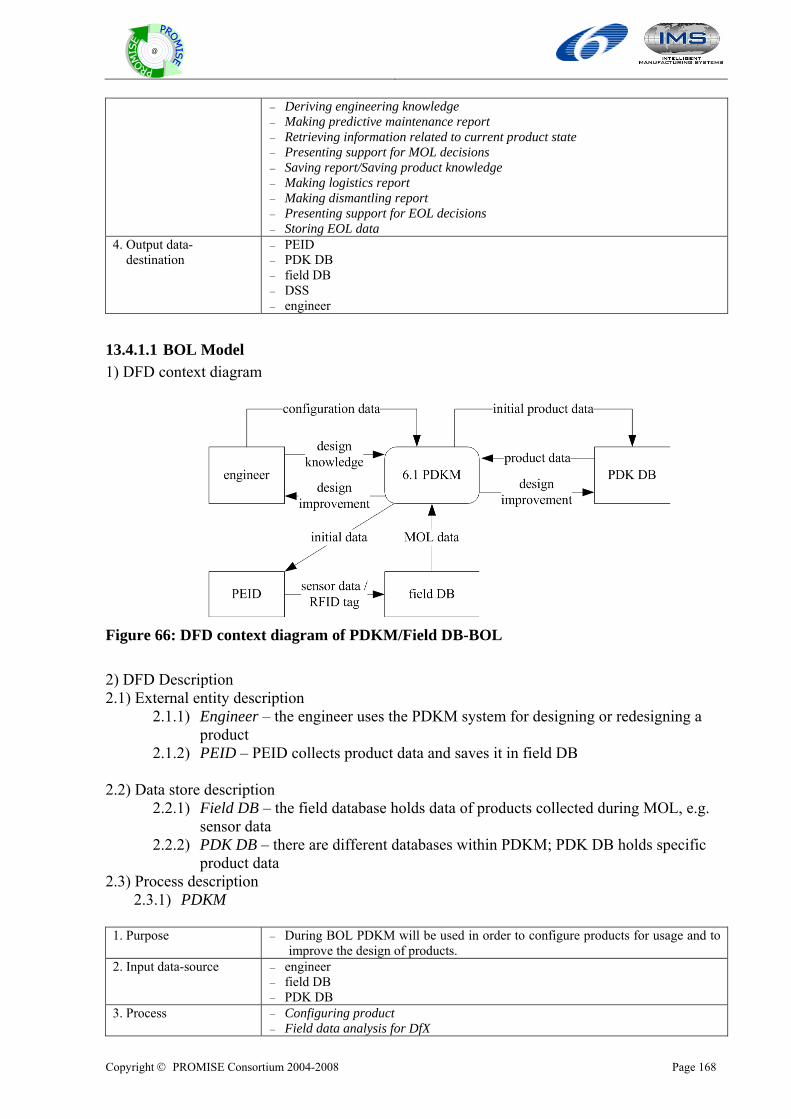
Copyright © PROMISE Consortium 2004-2008 Page 168
@
– Deriving engineering knowledge – Making predictive maintenance report – Retrieving information related to current product state – Presenting support for MOL decisions – Saving report/Saving product knowledge – Making logistics report – Making dismantling report – Presenting support for EOL decisions – Storing EOL data
4. Output data- destination
– PEID – PDK DB – field DB – DSS – engineer
13.4.1.1 BOL Model 1) DFD context diagram
Figure 66: DFD context diagram of PDKM/Field DB-BOL 2) DFD Description 2.1) External entity description
2.1.1) Engineer – the engineer uses the PDKM system for designing or redesigning a product
2.1.2) PEID – PEID collects product data and saves it in field DB 2.2) Data store description
2.2.1) Field DB – the field database holds data of products collected during MOL, e.g. sensor data
2.2.2) PDK DB – there are different databases within PDKM; PDK DB holds specific product data
2.3) Process description 2.3.1) PDKM
1. Purpose – During BOL PDKM will be used in order to configure products for usage and to
improve the design of products. 2. Input data-source – engineer
– field DB – PDK DB
3. Process – Configuring product – Field data analysis for DfX
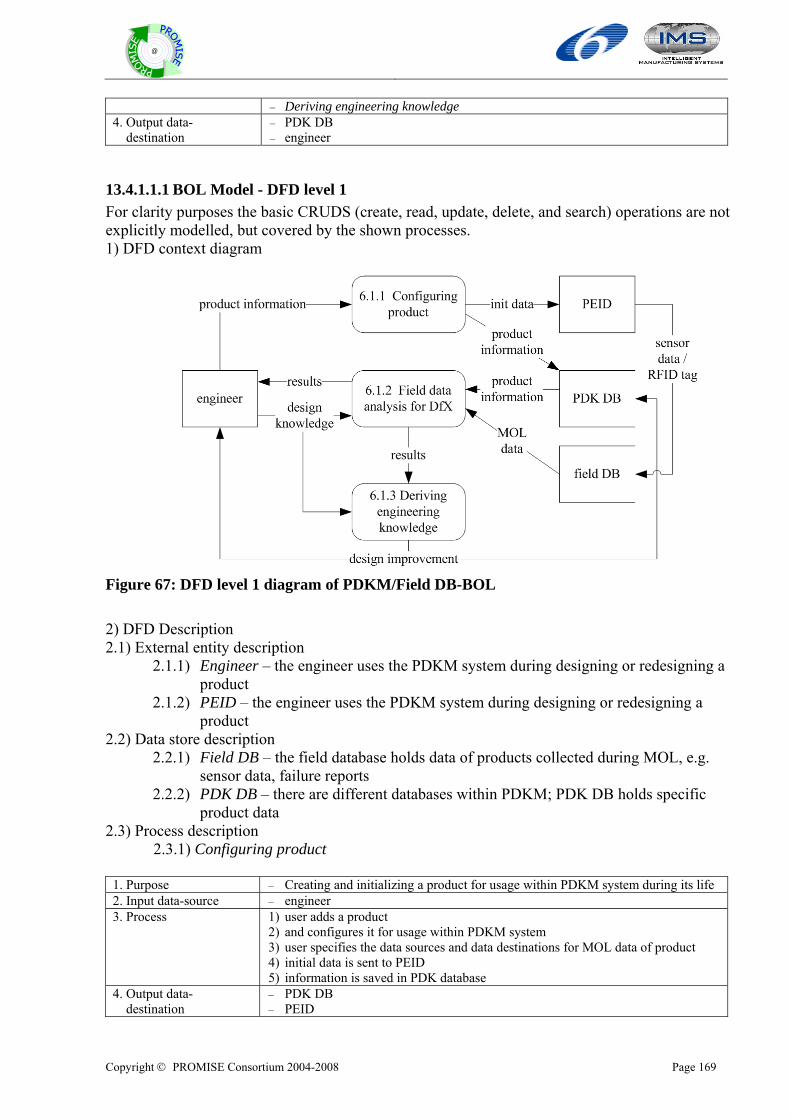
Copyright © PROMISE Consortium 2004-2008 Page 169
@
– Deriving engineering knowledge 4. Output data- destination
– PDK DB – engineer
13.4.1.1.1 BOL Model - DFD level 1 For clarity purposes the basic CRUDS (create, read, update, delete, and search) operations are not explicitly modelled, but covered by the shown processes. 1) DFD context diagram
Figure 67: DFD level 1 diagram of PDKM/Field DB-BOL 2) DFD Description 2.1) External entity description
2.1.1) Engineer – the engineer uses the PDKM system during designing or redesigning a product
2.1.2) PEID – the engineer uses the PDKM system during designing or redesigning a product
2.2) Data store description 2.2.1) Field DB – the field database holds data of products collected during MOL, e.g.
sensor data, failure reports 2.2.2) PDK DB – there are different databases within PDKM; PDK DB holds specific
product data 2.3) Process description 2.3.1) Configuring product
1. Purpose – Creating and initializing a product for usage within PDKM system during its life 2. Input data-source – engineer 3. Process 1) user adds a product
2) and configures it for usage within PDKM system 3) user specifies the data sources and data destinations for MOL data of product 4) initial data is sent to PEID 5) information is saved in PDK database
4. Output data- destination
– PDK DB – PEID
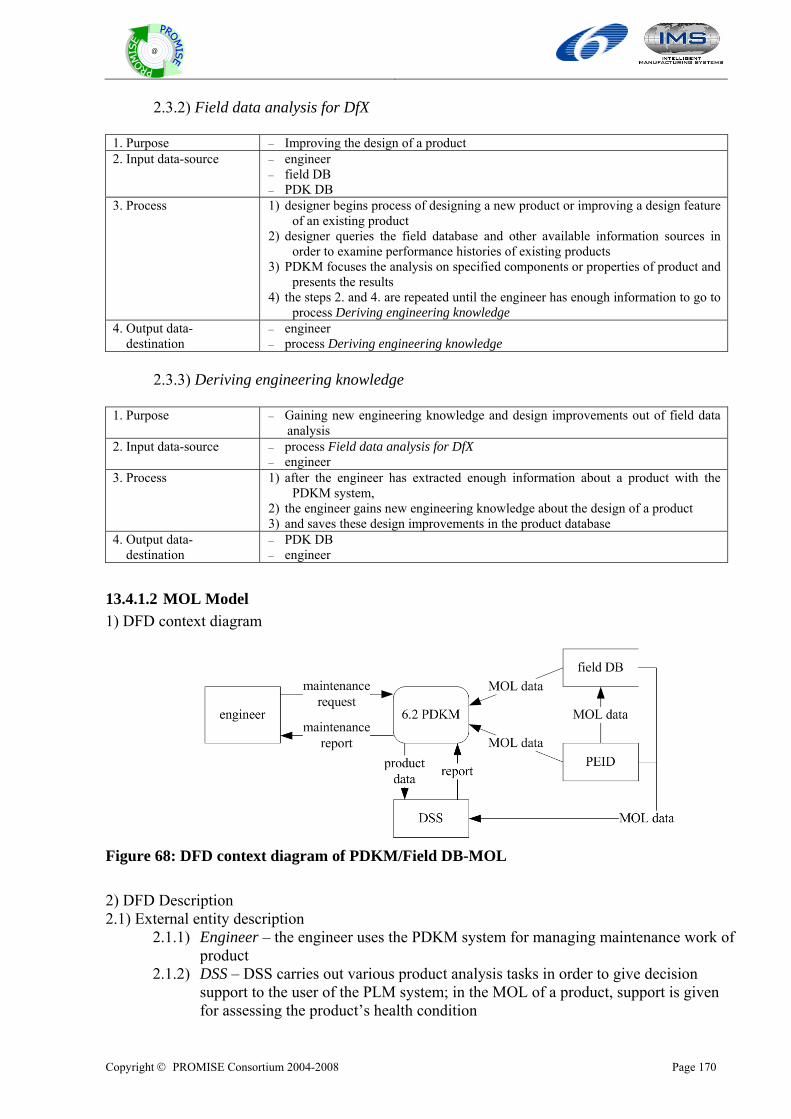
Copyright © PROMISE Consortium 2004-2008 Page 170
@
2.3.2) Field data analysis for DfX
1. Purpose – Improving the design of a product 2. Input data-source – engineer
– field DB – PDK DB
3. Process 1) designer begins process of designing a new product or improving a design feature of an existing product
2) designer queries the field database and other available information sources in order to examine performance histories of existing products
3) PDKM focuses the analysis on specified components or properties of product and presents the results
4) the steps 2. and 4. are repeated until the engineer has enough information to go to process Deriving engineering knowledge
4. Output data- destination
– engineer – process Deriving engineering knowledge
2.3.3) Deriving engineering knowledge
1. Purpose – Gaining new engineering knowledge and design improvements out of field data analysis
2. Input data-source – process Field data analysis for DfX – engineer
3. Process 1) after the engineer has extracted enough information about a product with the PDKM system,
2) the engineer gains new engineering knowledge about the design of a product 3) and saves these design improvements in the product database
4. Output data- destination
– PDK DB – engineer
13.4.1.2 MOL Model 1) DFD context diagram
Figure 68: DFD context diagram of PDKM/Field DB-MOL 2) DFD Description 2.1) External entity description
2.1.1) Engineer – the engineer uses the PDKM system for managing maintenance work of product
2.1.2) DSS – DSS carries out various product analysis tasks in order to give decision support to the user of the PLM system; in the MOL of a product, support is given for assessing the product’s health condition
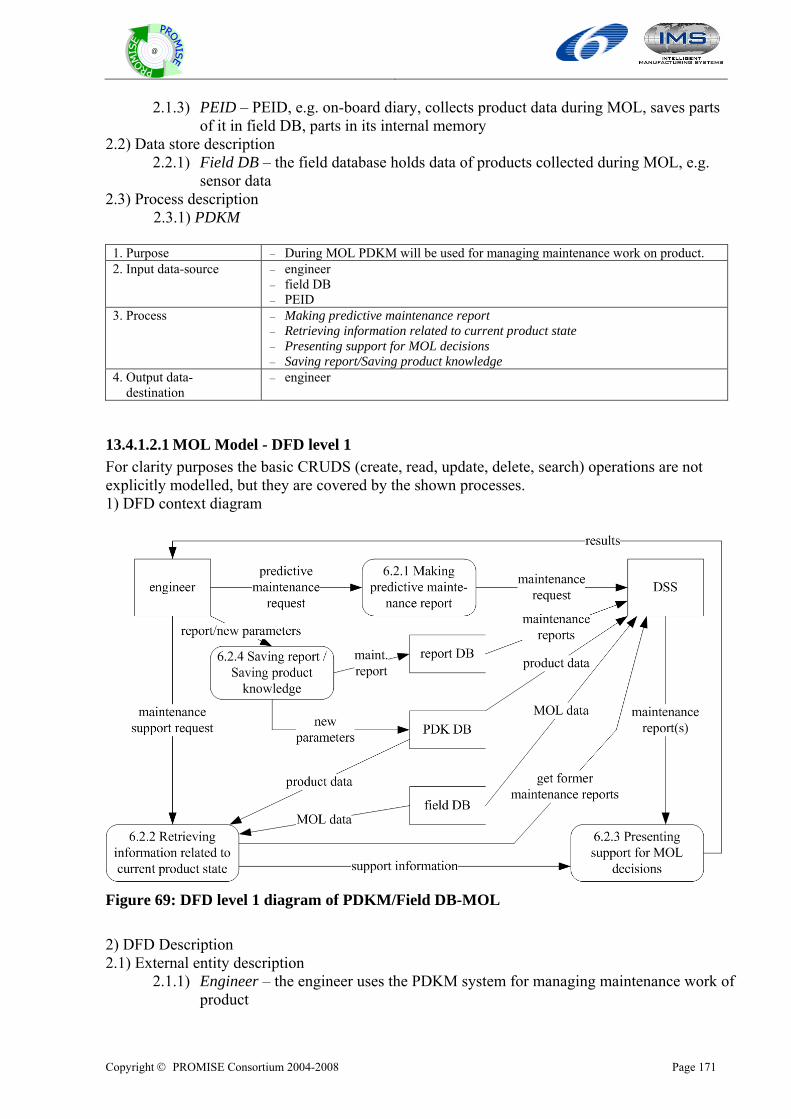
Copyright © PROMISE Consortium 2004-2008 Page 171
@
2.1.3) PEID – PEID, e.g. on-board diary, collects product data during MOL, saves parts of it in field DB, parts in its internal memory
2.2) Data store description 2.2.1) Field DB – the field database holds data of products collected during MOL, e.g.
sensor data 2.3) Process description 2.3.1) PDKM
1. Purpose – During MOL PDKM will be used for managing maintenance work on product. 2. Input data-source – engineer
– field DB – PEID
3. Process – Making predictive maintenance report – Retrieving information related to current product state – Presenting support for MOL decisions – Saving report/Saving product knowledge
4. Output data- destination
– engineer
13.4.1.2.1 MOL Model - DFD level 1 For clarity purposes the basic CRUDS (create, read, update, delete, search) operations are not explicitly modelled, but they are covered by the shown processes. 1) DFD context diagram
Figure 69: DFD level 1 diagram of PDKM/Field DB-MOL 2) DFD Description 2.1) External entity description
2.1.1) Engineer – the engineer uses the PDKM system for managing maintenance work of product
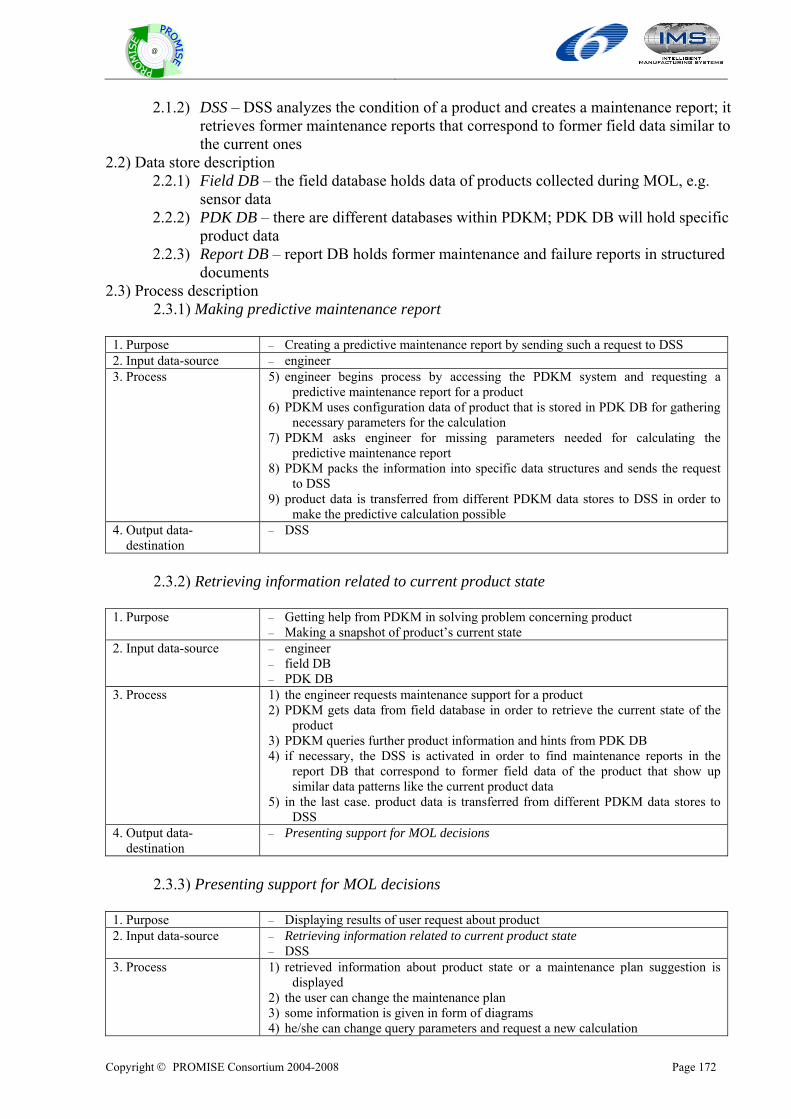
Copyright © PROMISE Consortium 2004-2008 Page 172
@
2.1.2) DSS – DSS analyzes the condition of a product and creates a maintenance report; it retrieves former maintenance reports that correspond to former field data similar to the current ones
2.2) Data store description 2.2.1) Field DB – the field database holds data of products collected during MOL, e.g.
sensor data 2.2.2) PDK DB – there are different databases within PDKM; PDK DB will hold specific
product data 2.2.3) Report DB – report DB holds former maintenance and failure reports in structured
documents 2.3) Process description 2.3.1) Making predictive maintenance report
1. Purpose – Creating a predictive maintenance report by sending such a request to DSS 2. Input data-source – engineer 3. Process 5) engineer begins process by accessing the PDKM system and requesting a
predictive maintenance report for a product 6) PDKM uses configuration data of product that is stored in PDK DB for gathering
necessary parameters for the calculation 7) PDKM asks engineer for missing parameters needed for calculating the
predictive maintenance report 8) PDKM packs the information into specific data structures and sends the request
to DSS 9) product data is transferred from different PDKM data stores to DSS in order to
make the predictive calculation possible 4. Output data- destination
– DSS
2.3.2) Retrieving information related to current product state
1. Purpose – Getting help from PDKM in solving problem concerning product – Making a snapshot of product’s current state
2. Input data-source – engineer – field DB – PDK DB
3. Process 1) the engineer requests maintenance support for a product 2) PDKM gets data from field database in order to retrieve the current state of the
product 3) PDKM queries further product information and hints from PDK DB 4) if necessary, the DSS is activated in order to find maintenance reports in the
report DB that correspond to former field data of the product that show up similar data patterns like the current product data
5) in the last case. product data is transferred from different PDKM data stores to DSS
4. Output data- destination
– Presenting support for MOL decisions
2.3.3) Presenting support for MOL decisions
1. Purpose – Displaying results of user request about product 2. Input data-source – Retrieving information related to current product state
– DSS 3. Process 1) retrieved information about product state or a maintenance plan suggestion is
displayed 2) the user can change the maintenance plan 3) some information is given in form of diagrams 4) he/she can change query parameters and request a new calculation
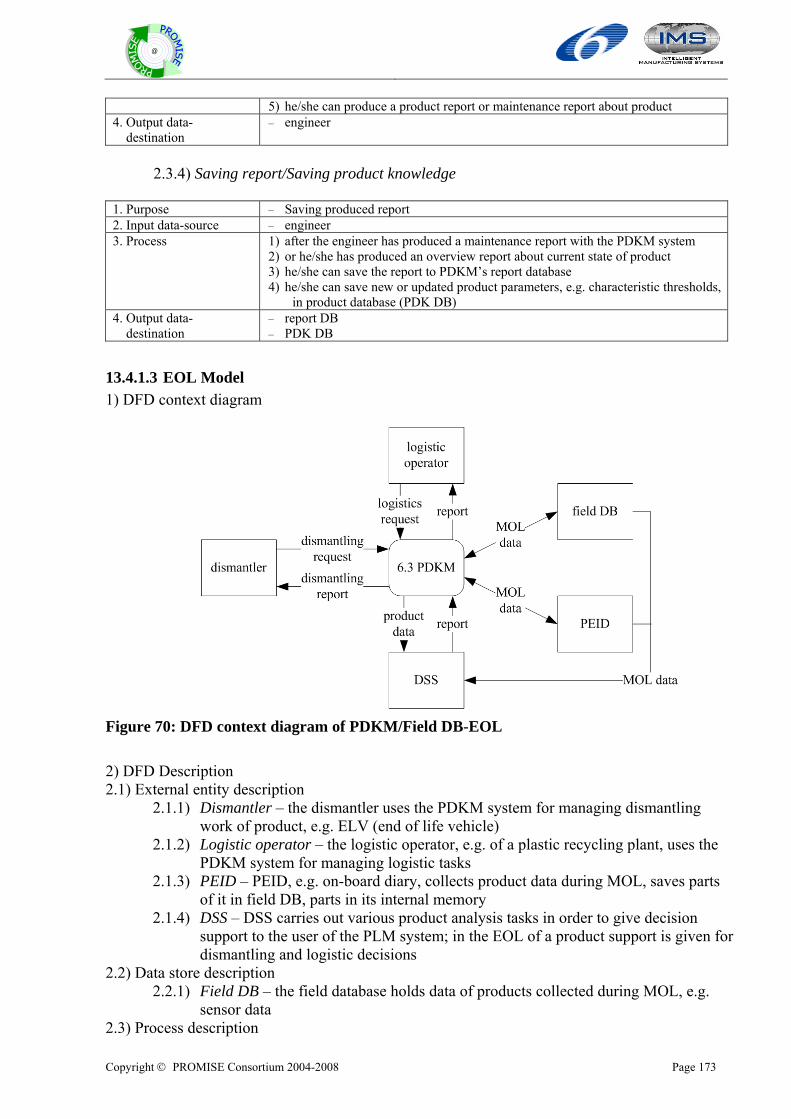
Copyright © PROMISE Consortium 2004-2008 Page 173
@
5) he/she can produce a product report or maintenance report about product 4. Output data- destination
– engineer
2.3.4) Saving report/Saving product knowledge
1. Purpose – Saving produced report 2. Input data-source – engineer 3. Process 1) after the engineer has produced a maintenance report with the PDKM system
2) or he/she has produced an overview report about current state of product 3) he/she can save the report to PDKM’s report database 4) he/she can save new or updated product parameters, e.g. characteristic thresholds,
in product database (PDK DB) 4. Output data- destination
– report DB – PDK DB
13.4.1.3 EOL Model 1) DFD context diagram
Figure 70: DFD context diagram of PDKM/Field DB-EOL 2) DFD Description 2.1) External entity description
2.1.1) Dismantler – the dismantler uses the PDKM system for managing dismantling work of product, e.g. ELV (end of life vehicle)
2.1.2) Logistic operator – the logistic operator, e.g. of a plastic recycling plant, uses the PDKM system for managing logistic tasks
2.1.3) PEID – PEID, e.g. on-board diary, collects product data during MOL, saves parts of it in field DB, parts in its internal memory
2.1.4) DSS – DSS carries out various product analysis tasks in order to give decision support to the user of the PLM system; in the EOL of a product support is given for dismantling and logistic decisions
2.2) Data store description 2.2.1) Field DB – the field database holds data of products collected during MOL, e.g.
sensor data 2.3) Process description
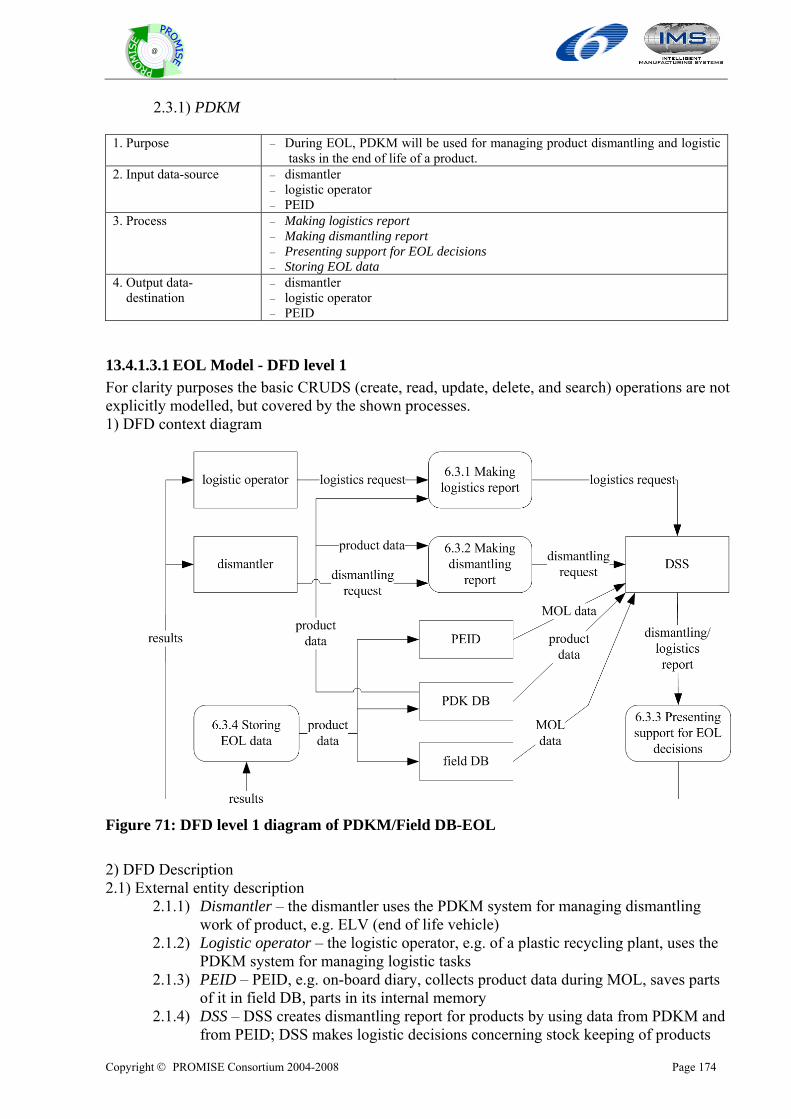
Copyright © PROMISE Consortium 2004-2008 Page 174
@
2.3.1) PDKM
1. Purpose – During EOL, PDKM will be used for managing product dismantling and logistic tasks in the end of life of a product.
2. Input data-source – dismantler – logistic operator – PEID
3. Process – Making logistics report – Making dismantling report – Presenting support for EOL decisions – Storing EOL data
4. Output data- destination
– dismantler – logistic operator – PEID
13.4.1.3.1 EOL Model - DFD level 1 For clarity purposes the basic CRUDS (create, read, update, delete, and search) operations are not explicitly modelled, but covered by the shown processes. 1) DFD context diagram
Figure 71: DFD level 1 diagram of PDKM/Field DB-EOL 2) DFD Description 2.1) External entity description
2.1.1) Dismantler – the dismantler uses the PDKM system for managing dismantling work of product, e.g. ELV (end of life vehicle)
2.1.2) Logistic operator – the logistic operator, e.g. of a plastic recycling plant, uses the PDKM system for managing logistic tasks
2.1.3) PEID – PEID, e.g. on-board diary, collects product data during MOL, saves parts of it in field DB, parts in its internal memory
2.1.4) DSS – DSS creates dismantling report for products by using data from PDKM and from PEID; DSS makes logistic decisions concerning stock keeping of products
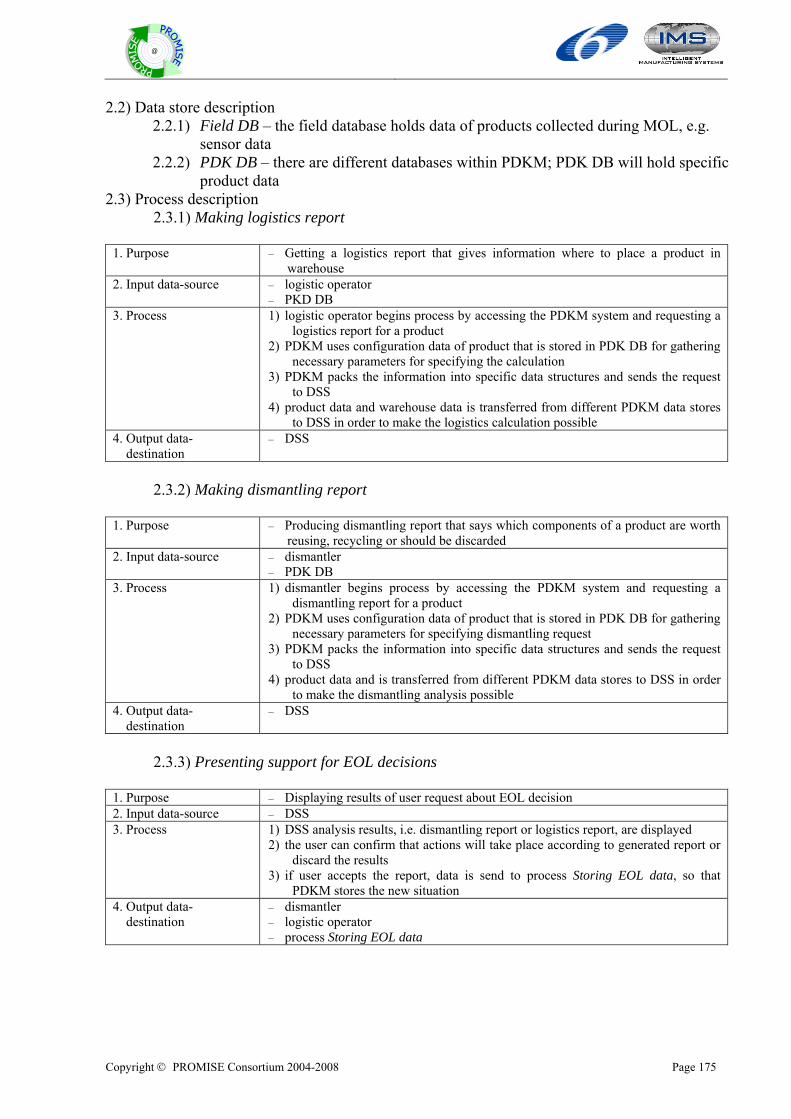
Copyright © PROMISE Consortium 2004-2008 Page 175
@
2.2) Data store description 2.2.1) Field DB – the field database holds data of products collected during MOL, e.g.
sensor data 2.2.2) PDK DB – there are different databases within PDKM; PDK DB will hold specific
product data 2.3) Process description 2.3.1) Making logistics report
1. Purpose – Getting a logistics report that gives information where to place a product in warehouse
2. Input data-source – logistic operator – PKD DB
3. Process 1) logistic operator begins process by accessing the PDKM system and requesting a logistics report for a product
2) PDKM uses configuration data of product that is stored in PDK DB for gathering necessary parameters for specifying the calculation
3) PDKM packs the information into specific data structures and sends the request to DSS
4) product data and warehouse data is transferred from different PDKM data stores to DSS in order to make the logistics calculation possible
4. Output data- destination
– DSS
2.3.2) Making dismantling report
1. Purpose – Producing dismantling report that says which components of a product are worth reusing, recycling or should be discarded
2. Input data-source – dismantler – PDK DB
3. Process 1) dismantler begins process by accessing the PDKM system and requesting a dismantling report for a product
2) PDKM uses configuration data of product that is stored in PDK DB for gathering necessary parameters for specifying dismantling request
3) PDKM packs the information into specific data structures and sends the request to DSS
4) product data and is transferred from different PDKM data stores to DSS in order to make the dismantling analysis possible
4. Output data- destination
– DSS
2.3.3) Presenting support for EOL decisions
1. Purpose – Displaying results of user request about EOL decision 2. Input data-source – DSS 3. Process 1) DSS analysis results, i.e. dismantling report or logistics report, are displayed
2) the user can confirm that actions will take place according to generated report or discard the results
3) if user accepts the report, data is send to process Storing EOL data, so that PDKM stores the new situation
4. Output data- destination
– dismantler – logistic operator – process Storing EOL data

Copyright © PROMISE Consortium 2004-2008 Page 176
@
2.3.4) Storing EOL data
1. Purpose – Storing EOL data of product in PDKM 2. Input data-source – process Presenting support for EOL decisions 3. Process 1) after logistic operator has confirmed to store product at specified warehouse
location 2) PDKM stores new warehouse state in its field DB 3) if a product is dismantled, the current state and destination of product’s
components is stored in field DB and PEID 4. Output data- destination
– PEID – field DB – PDK DB
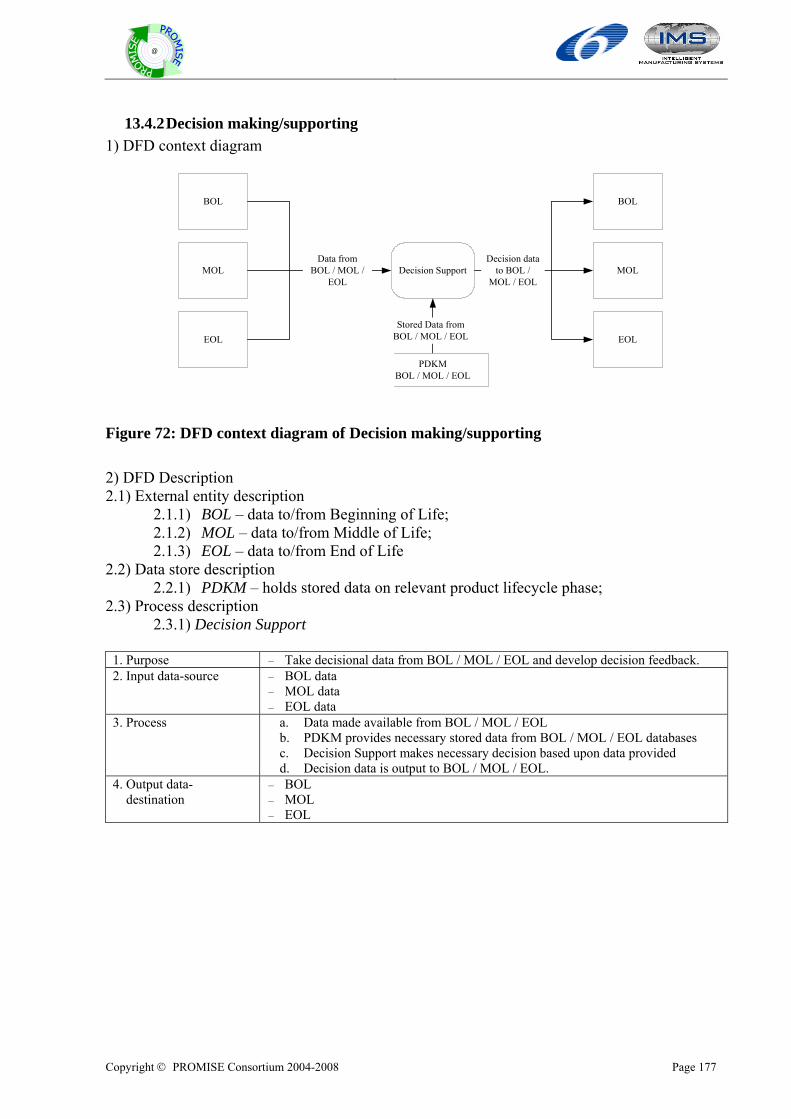
Copyright © PROMISE Consortium 2004-2008 Page 177
@
13.4.2 Decision making/supporting 1) DFD context diagram
BOL
Decision SupportMOL
EOL
Data fromBOL / MOL /
EOL
PDKMBOL / MOL / EOL
Stored Data fromBOL / MOL / EOL
BOL
MOL
EOL
Decision datato BOL /
MOL / EOL
Figure 72: DFD context diagram of Decision making/supporting 2) DFD Description 2.1) External entity description
2.1.1) BOL – data to/from Beginning of Life; 2.1.2) MOL – data to/from Middle of Life; 2.1.3) EOL – data to/from End of Life
2.2) Data store description 2.2.1) PDKM – holds stored data on relevant product lifecycle phase;
2.3) Process description 2.3.1) Decision Support
1. Purpose – Take decisional data from BOL / MOL / EOL and develop decision feedback. 2. Input data-source – BOL data
– MOL data – EOL data
3. Process a. Data made available from BOL / MOL / EOL b. PDKM provides necessary stored data from BOL / MOL / EOL databases c. Decision Support makes necessary decision based upon data provided d. Decision data is output to BOL / MOL / EOL.
4. Output data- destination
– BOL – MOL – EOL
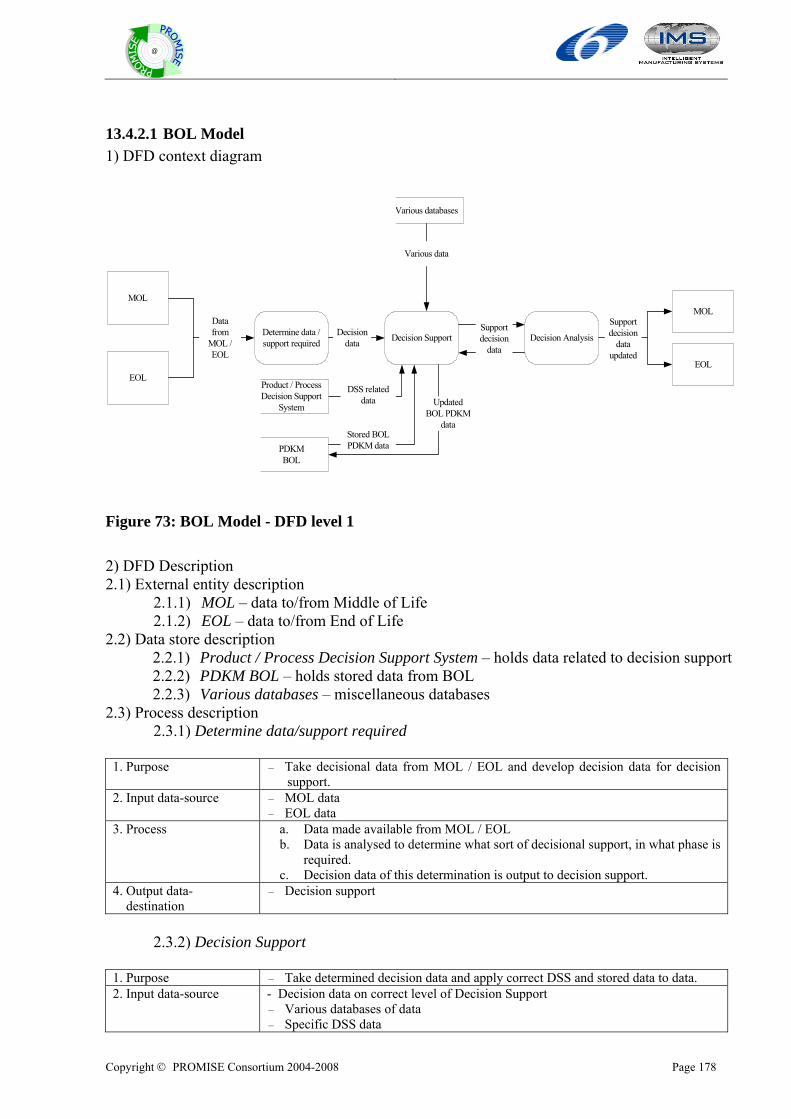
Copyright © PROMISE Consortium 2004-2008 Page 178
@
13.4.2.1 BOL Model 1) DFD context diagram
EOL
MOL
Determine data /support required Decision SupportDecision
data
Various databases
Various data
Decision AnalysisSupportdecision
data
MOL
EOL
Product / ProcessDecision Support
System
PDKMBOL
DSS relateddata
Datafrom
MOL /EOL
Supportdecision
dataupdated
Stored BOLPDKM data
UpdatedBOL PDKM
data
Figure 73: BOL Model - DFD level 1 2) DFD Description 2.1) External entity description
2.1.1) MOL – data to/from Middle of Life 2.1.2) EOL – data to/from End of Life
2.2) Data store description 2.2.1) Product / Process Decision Support System – holds data related to decision support 2.2.2) PDKM BOL – holds stored data from BOL 2.2.3) Various databases – miscellaneous databases
2.3) Process description 2.3.1) Determine data/support required
1. Purpose – Take decisional data from MOL / EOL and develop decision data for decision support.
2. Input data-source – MOL data – EOL data
3. Process a. Data made available from MOL / EOL b. Data is analysed to determine what sort of decisional support, in what phase is
required. c. Decision data of this determination is output to decision support.
4. Output data- destination
– Decision support
2.3.2) Decision Support
1. Purpose – Take determined decision data and apply correct DSS and stored data to data. 2. Input data-source - Decision data on correct level of Decision Support
– Various databases of data – Specific DSS data
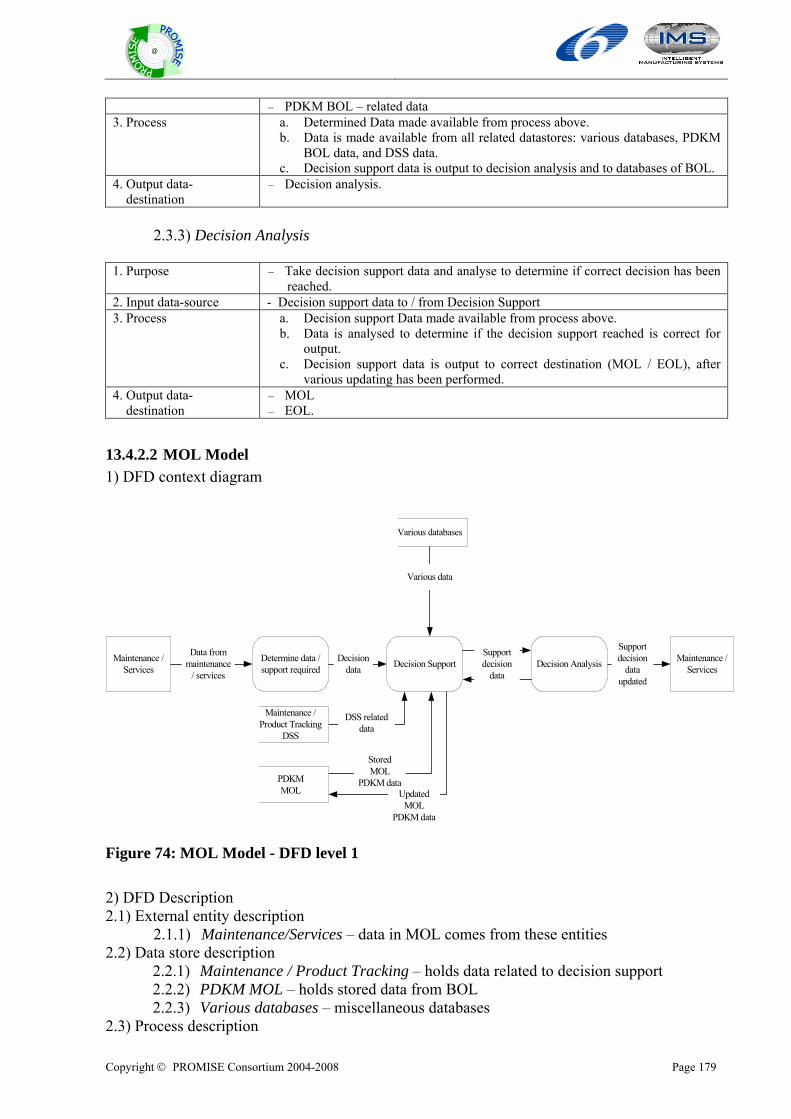
Copyright © PROMISE Consortium 2004-2008 Page 179
@
– PDKM BOL – related data 3. Process a. Determined Data made available from process above.
b. Data is made available from all related datastores: various databases, PDKM BOL data, and DSS data.
c. Decision support data is output to decision analysis and to databases of BOL. 4. Output data- destination
– Decision analysis.
2.3.3) Decision Analysis
1. Purpose – Take decision support data and analyse to determine if correct decision has been reached.
2. Input data-source - Decision support data to / from Decision Support 3. Process a. Decision support Data made available from process above.
b. Data is analysed to determine if the decision support reached is correct for output.
c. Decision support data is output to correct destination (MOL / EOL), after various updating has been performed.
4. Output data- destination
– MOL – EOL.
13.4.2.2 MOL Model 1) DFD context diagram
Maintenance /Services
Determine data /support required
Data frommaintenance
/ servicesDecision SupportDecision
data
Various databases
Various data
Decision AnalysisSupportdecision
data
DSS relateddata
Maintenance /Product Tracking
DSS
PDKMMOL
StoredMOL
PDKM dataUpdated
MOLPDKM data
Supportdecision
dataupdated
Maintenance /Services
Figure 74: MOL Model - DFD level 1 2) DFD Description 2.1) External entity description
2.1.1) Maintenance/Services – data in MOL comes from these entities 2.2) Data store description
2.2.1) Maintenance / Product Tracking – holds data related to decision support 2.2.2) PDKM MOL – holds stored data from BOL 2.2.3) Various databases – miscellaneous databases
2.3) Process description
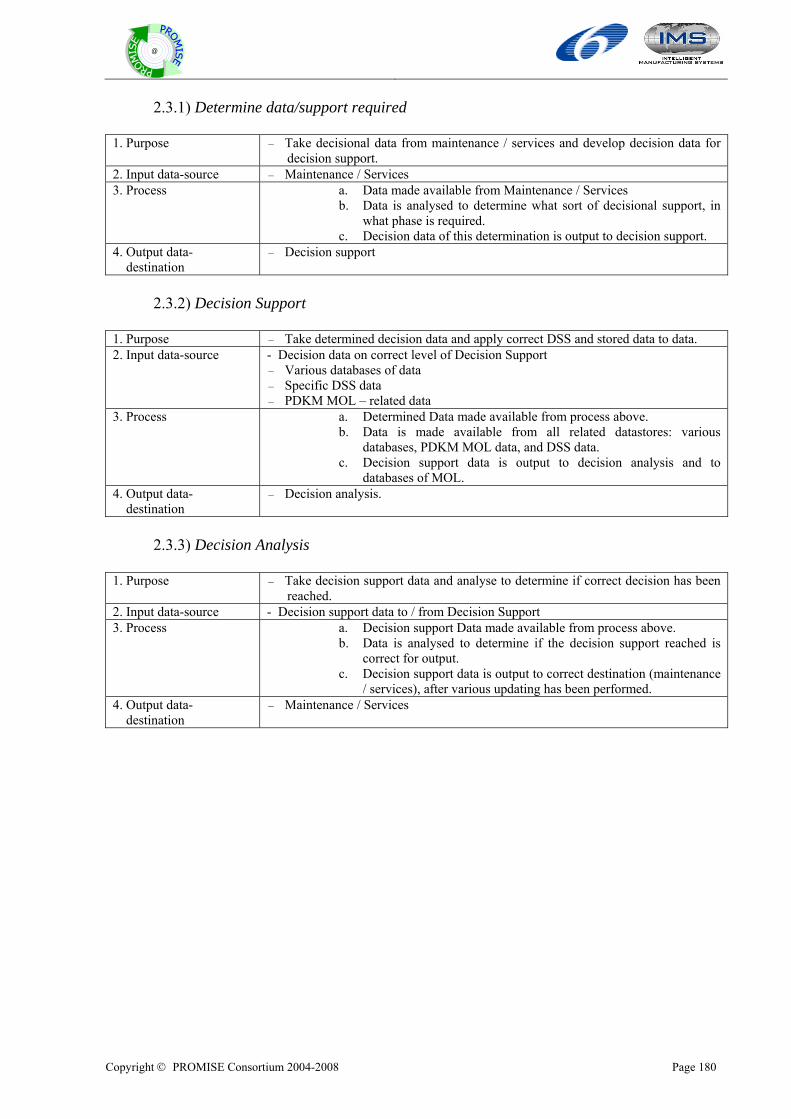
Copyright © PROMISE Consortium 2004-2008 Page 180
@
2.3.1) Determine data/support required
1. Purpose – Take decisional data from maintenance / services and develop decision data for decision support.
2. Input data-source – Maintenance / Services 3. Process a. Data made available from Maintenance / Services
b. Data is analysed to determine what sort of decisional support, in what phase is required.
c. Decision data of this determination is output to decision support. 4. Output data- destination
– Decision support
2.3.2) Decision Support
1. Purpose – Take determined decision data and apply correct DSS and stored data to data. 2. Input data-source - Decision data on correct level of Decision Support
– Various databases of data – Specific DSS data – PDKM MOL – related data
3. Process a. Determined Data made available from process above. b. Data is made available from all related datastores: various
databases, PDKM MOL data, and DSS data. c. Decision support data is output to decision analysis and to
databases of MOL. 4. Output data- destination
– Decision analysis.
2.3.3) Decision Analysis
1. Purpose – Take decision support data and analyse to determine if correct decision has been reached.
2. Input data-source - Decision support data to / from Decision Support 3. Process a. Decision support Data made available from process above.
b. Data is analysed to determine if the decision support reached is correct for output.
c. Decision support data is output to correct destination (maintenance / services), after various updating has been performed.
4. Output data- destination
– Maintenance / Services
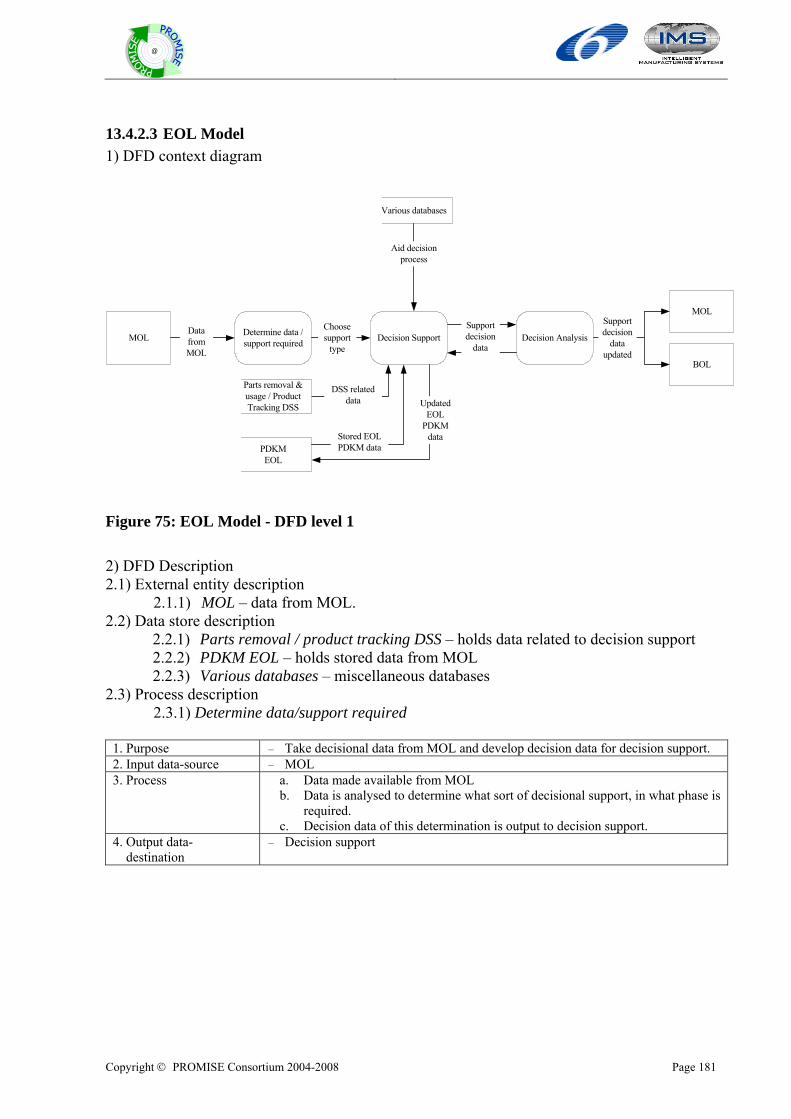
Copyright © PROMISE Consortium 2004-2008 Page 181
@
13.4.2.3 EOL Model 1) DFD context diagram
Determine data /support required Decision Support
Choosesupport
type
Various databases
Aid decisionprocess
Decision AnalysisSupportdecision
data
MOL
BOL
DSS relateddata
MOLDatafromMOL
Parts removal &usage / ProductTracking DSS
PDKMEOL
Stored EOLPDKM data
UpdatedEOL
PDKMdata
Supportdecision
dataupdated
Figure 75: EOL Model - DFD level 1 2) DFD Description 2.1) External entity description
2.1.1) MOL – data from MOL. 2.2) Data store description
2.2.1) Parts removal / product tracking DSS – holds data related to decision support 2.2.2) PDKM EOL – holds stored data from MOL 2.2.3) Various databases – miscellaneous databases
2.3) Process description 2.3.1) Determine data/support required
1. Purpose – Take decisional data from MOL and develop decision data for decision support. 2. Input data-source – MOL 3. Process a. Data made available from MOL
b. Data is analysed to determine what sort of decisional support, in what phase is required.
c. Decision data of this determination is output to decision support. 4. Output data- destination
– Decision support
Copyright © PROMISE Consortium 2004-2008 Page 182
@
2.3.2) Decision Support
1. Purpose – Take determined decision data and apply correct DSS and stored data to data. 2. Input data-source - Decision data on correct level of Decision Support
– Various databases of data – Specific DSS data – PDKM EOL – related data
3. Process a. Determined Data made available from process above. b. Data is made available from all related datastores: various databases, PDKM
EOL data, and DSS data. c. Decision support data is output to decision analysis and to databases of EOL.
4. Output data- destination
– Decision analysis.
2.3.3) Decision Analysis
1. Purpose – Take decision support data and analyse to determine if correct decision has been reached.
2. Input data-source - Decision support data to / from Decision Support 3. Process a. Decision support Data made available from process above.
b. Data is analysed to determine if the decision support reached is correct for output.
c. Decision support data is output to correct destination (MOL / BOL), after various updating has been performed.
4. Output data- destination
– MOL – BOL
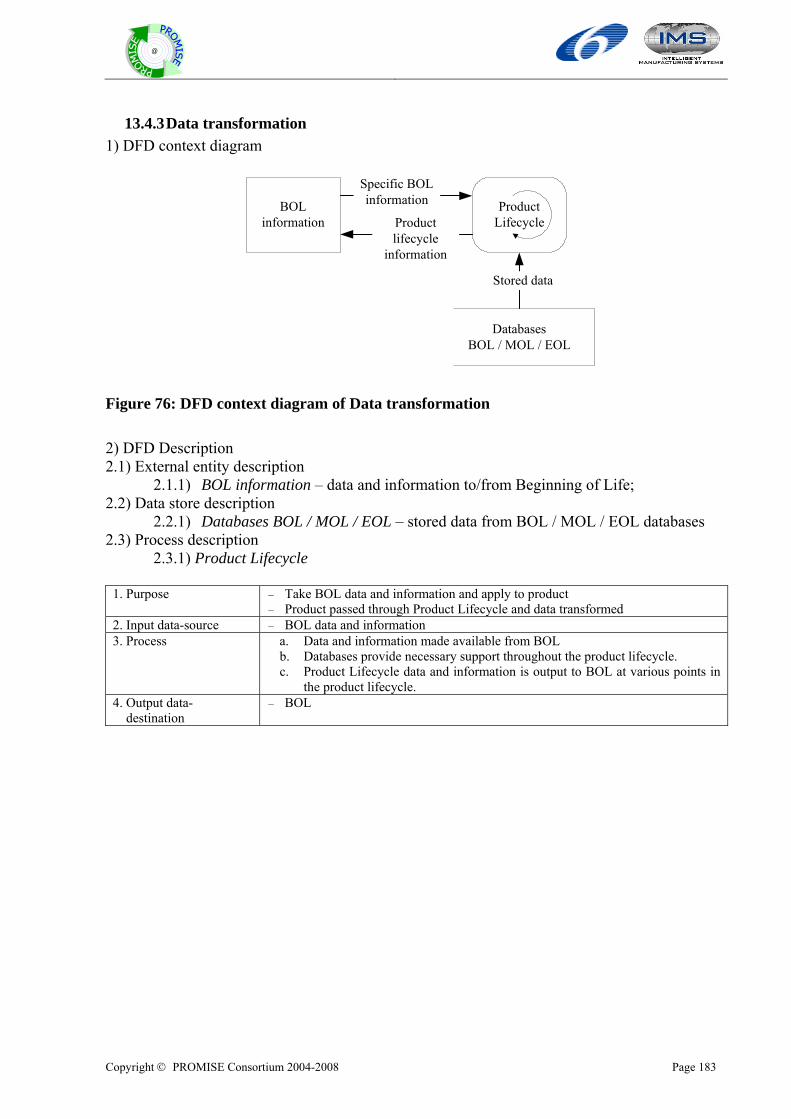
Copyright © PROMISE Consortium 2004-2008 Page 183
@
13.4.3 Data transformation 1) DFD context diagram
BOLinformation
ProductLifecycle
Specific BOLinformation
Productlifecycle
information
DatabasesBOL / MOL / EOL
Stored data
Figure 76: DFD context diagram of Data transformation 2) DFD Description 2.1) External entity description
2.1.1) BOL information – data and information to/from Beginning of Life; 2.2) Data store description
2.2.1) Databases BOL / MOL / EOL – stored data from BOL / MOL / EOL databases 2.3) Process description
2.3.1) Product Lifecycle
1. Purpose – Take BOL data and information and apply to product – Product passed through Product Lifecycle and data transformed
2. Input data-source – BOL data and information 3. Process a. Data and information made available from BOL
b. Databases provide necessary support throughout the product lifecycle. c. Product Lifecycle data and information is output to BOL at various points in
the product lifecycle. 4. Output data- destination
– BOL
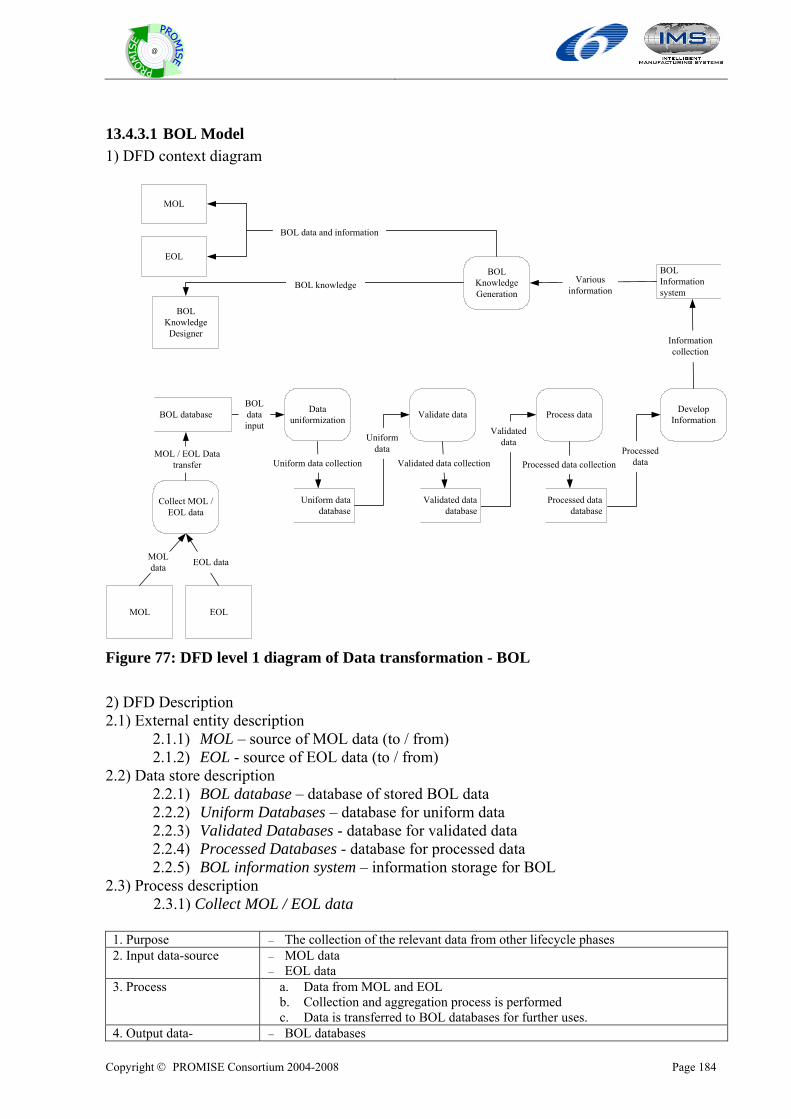
Copyright © PROMISE Consortium 2004-2008 Page 184
@
13.4.3.1 BOL Model 1) DFD context diagram
Collect MOL /EOL data
MOL EOL
MOLdata
Datauniformization
BOLdatainput
BOL database
Uniform datadatabase
Uniform data collection
Validate data
Uniformdata
BOLKnowledgeDesigner
Process data
Validateddata
Validated datadatabase
Processed datadatabase
DevelopInformation
BOLInformationsystem
Validated data collectionProcessed
data
Informationcollection
BOLKnowledgeGeneration
VariousinformationBOL knowledge
MOL
EOL
BOL data and information
EOL data
MOL / EOL Datatransfer Processed data collection
Figure 77: DFD level 1 diagram of Data transformation - BOL
2) DFD Description 2.1) External entity description
2.1.1) MOL – source of MOL data (to / from) 2.1.2) EOL - source of EOL data (to / from)
2.2) Data store description 2.2.1) BOL database – database of stored BOL data 2.2.2) Uniform Databases – database for uniform data 2.2.3) Validated Databases - database for validated data 2.2.4) Processed Databases - database for processed data 2.2.5) BOL information system – information storage for BOL
2.3) Process description 2.3.1) Collect MOL / EOL data
1. Purpose – The collection of the relevant data from other lifecycle phases 2. Input data-source – MOL data
– EOL data 3. Process a. Data from MOL and EOL
b. Collection and aggregation process is performed c. Data is transferred to BOL databases for further uses.
4. Output data- – BOL databases
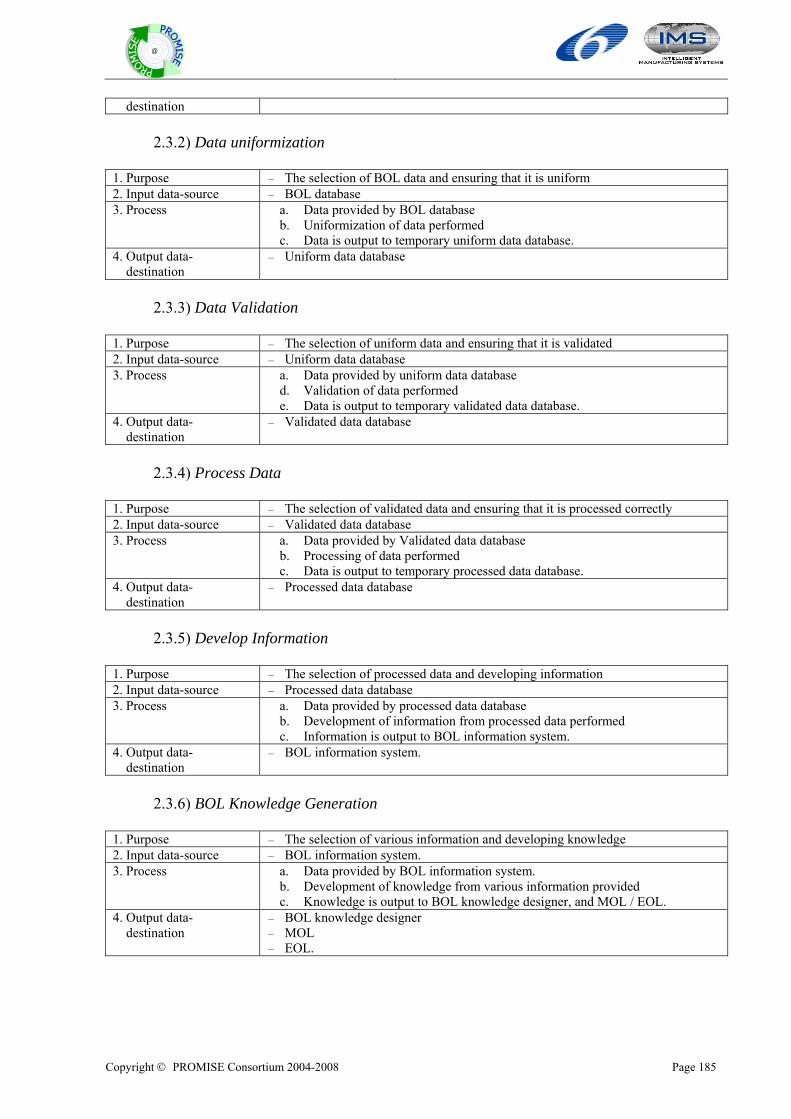
Copyright © PROMISE Consortium 2004-2008 Page 185
@
destination
2.3.2) Data uniformization
1. Purpose – The selection of BOL data and ensuring that it is uniform 2. Input data-source – BOL database 3. Process a. Data provided by BOL database
b. Uniformization of data performed c. Data is output to temporary uniform data database.
4. Output data- destination
– Uniform data database
2.3.3) Data Validation
1. Purpose – The selection of uniform data and ensuring that it is validated 2. Input data-source – Uniform data database 3. Process a. Data provided by uniform data database
d. Validation of data performed e. Data is output to temporary validated data database.
4. Output data- destination
– Validated data database
2.3.4) Process Data
1. Purpose – The selection of validated data and ensuring that it is processed correctly 2. Input data-source – Validated data database 3. Process a. Data provided by Validated data database
b. Processing of data performed c. Data is output to temporary processed data database.
4. Output data- destination
– Processed data database
2.3.5) Develop Information
1. Purpose – The selection of processed data and developing information 2. Input data-source – Processed data database 3. Process a. Data provided by processed data database
b. Development of information from processed data performed c. Information is output to BOL information system.
4. Output data- destination
– BOL information system.
2.3.6) BOL Knowledge Generation
1. Purpose – The selection of various information and developing knowledge 2. Input data-source – BOL information system. 3. Process a. Data provided by BOL information system.
b. Development of knowledge from various information provided c. Knowledge is output to BOL knowledge designer, and MOL / EOL.
4. Output data- destination
– BOL knowledge designer – MOL – EOL.
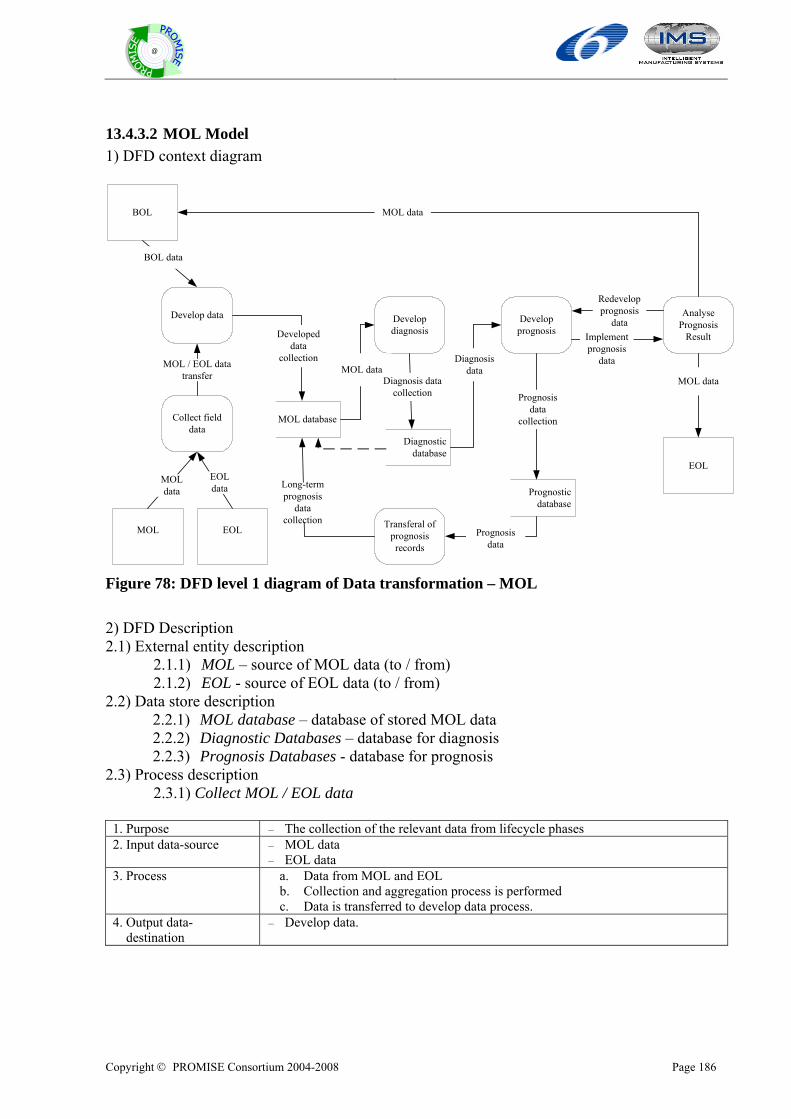
Copyright © PROMISE Consortium 2004-2008 Page 186
@
13.4.3.2 MOL Model 1) DFD context diagram
Collect fielddata
MOL EOL
MOLdata
MOL / EOL datatransfer
Developdiagnosis
Developprognosis
Develop data
BOL
BOL data
Developeddata
collection
MOL database
MOL data
Diagnosticdatabase
Diagnosis datacollection
Diagnosisdata
Prognosisdata
collection
Prognosticdatabase
Transferal ofprognosisrecords
Prognosisdata
Long-termprognosis
datacollection
AnalysePrognosis
ResultImplementprognosis
data
Redevelopprognosis
data
MOL data
EOL
MOL data
EOLdata
Figure 78: DFD level 1 diagram of Data transformation – MOL 2) DFD Description 2.1) External entity description
2.1.1) MOL – source of MOL data (to / from) 2.1.2) EOL - source of EOL data (to / from)
2.2) Data store description 2.2.1) MOL database – database of stored MOL data 2.2.2) Diagnostic Databases – database for diagnosis 2.2.3) Prognosis Databases - database for prognosis
2.3) Process description 2.3.1) Collect MOL / EOL data
1. Purpose – The collection of the relevant data from lifecycle phases 2. Input data-source – MOL data
– EOL data 3. Process a. Data from MOL and EOL
b. Collection and aggregation process is performed c. Data is transferred to develop data process.
4. Output data- destination
– Develop data.
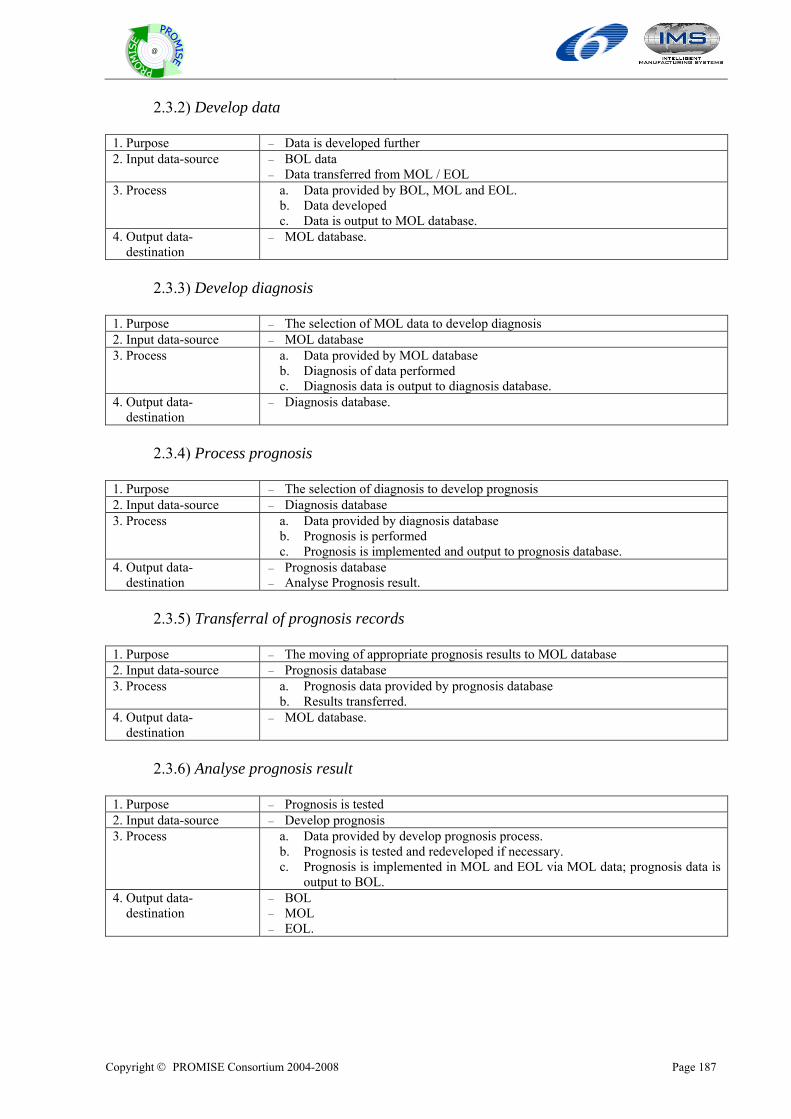
Copyright © PROMISE Consortium 2004-2008 Page 187
@
2.3.2) Develop data
1. Purpose – Data is developed further 2. Input data-source – BOL data
– Data transferred from MOL / EOL 3. Process a. Data provided by BOL, MOL and EOL.
b. Data developed c. Data is output to MOL database.
4. Output data- destination
– MOL database.
2.3.3) Develop diagnosis
1. Purpose – The selection of MOL data to develop diagnosis 2. Input data-source – MOL database 3. Process a. Data provided by MOL database
b. Diagnosis of data performed c. Diagnosis data is output to diagnosis database.
4. Output data- destination
– Diagnosis database.
2.3.4) Process prognosis
1. Purpose – The selection of diagnosis to develop prognosis 2. Input data-source – Diagnosis database 3. Process a. Data provided by diagnosis database
b. Prognosis is performed c. Prognosis is implemented and output to prognosis database.
4. Output data- destination
– Prognosis database – Analyse Prognosis result.
2.3.5) Transferral of prognosis records
1. Purpose – The moving of appropriate prognosis results to MOL database 2. Input data-source – Prognosis database 3. Process a. Prognosis data provided by prognosis database
b. Results transferred. 4. Output data- destination
– MOL database.
2.3.6) Analyse prognosis result
1. Purpose – Prognosis is tested 2. Input data-source – Develop prognosis 3. Process a. Data provided by develop prognosis process.
b. Prognosis is tested and redeveloped if necessary. c. Prognosis is implemented in MOL and EOL via MOL data; prognosis data is
output to BOL. 4. Output data- destination
– BOL – MOL – EOL.
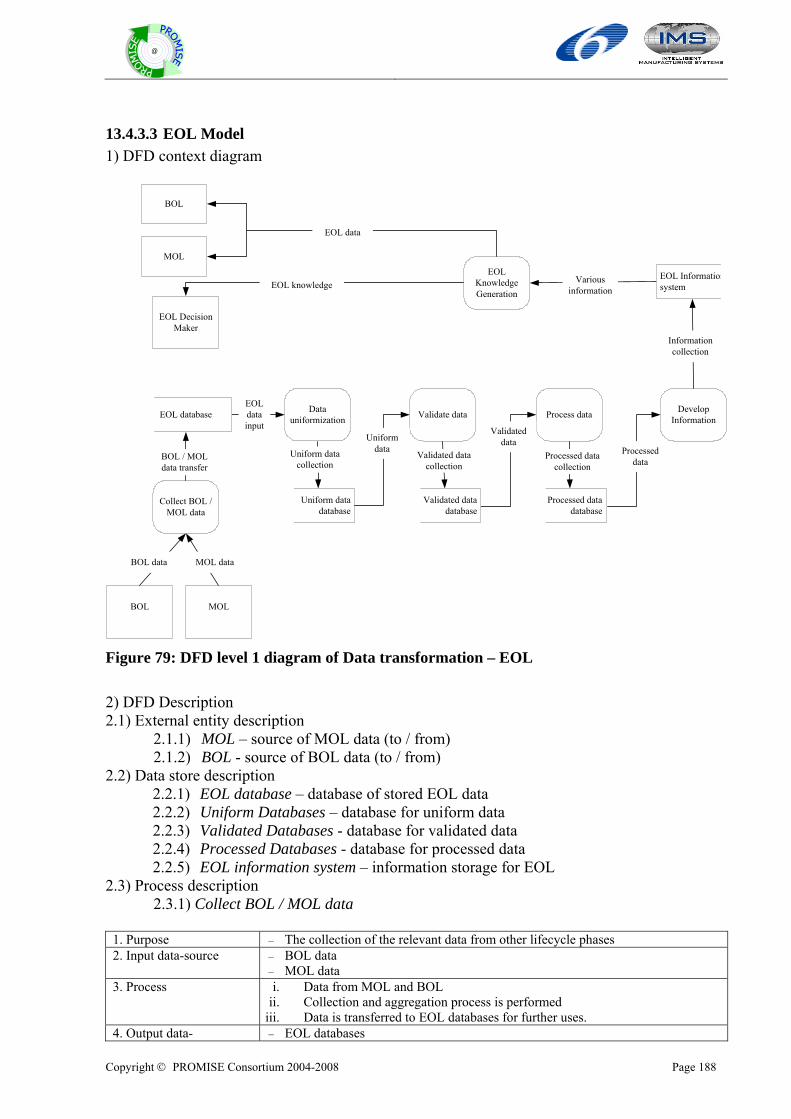
Copyright © PROMISE Consortium 2004-2008 Page 188
@
13.4.3.3 EOL Model 1) DFD context diagram
Collect BOL /MOL data
BOL MOL
BOL data
BOL / MOLdata transfer
Datauniformization
EOLdatainput
Uniform datadatabase
Uniform datacollection
Validate data
Uniformdata
EOL DecisionMaker
Process data
Validateddata
Validated datadatabase
Processed datadatabase
DevelopInformation
Processed datacollection
Validated datacollection
Processeddata
Informationcollection
EOLKnowledgeGeneration
VariousinformationEOL knowledge
BOL
MOL
EOL data
EOL database
EOL Informationsystem
MOL data
Figure 79: DFD level 1 diagram of Data transformation – EOL
2) DFD Description 2.1) External entity description
2.1.1) MOL – source of MOL data (to / from) 2.1.2) BOL - source of BOL data (to / from)
2.2) Data store description 2.2.1) EOL database – database of stored EOL data 2.2.2) Uniform Databases – database for uniform data 2.2.3) Validated Databases - database for validated data 2.2.4) Processed Databases - database for processed data 2.2.5) EOL information system – information storage for EOL
2.3) Process description 2.3.1) Collect BOL / MOL data
1. Purpose – The collection of the relevant data from other lifecycle phases 2. Input data-source – BOL data
– MOL data 3. Process i. Data from MOL and BOL
ii. Collection and aggregation process is performed iii. Data is transferred to EOL databases for further uses.
4. Output data- – EOL databases

Copyright © PROMISE Consortium 2004-2008 Page 189
@
destination
2.3.2) Data uniformization
1. Purpose – The selection of EOL data and ensuring that it is uniform 2. Input data-source – EOL database 3. Process 1. Data provided by EOL database
2. Uniformization of data performed 3. Data is output to temporary uniform data database.
4. Output data- destination
– Uniform data database
2.3.3) Data Validation
1. Purpose – The selection of uniform data and ensuring that it is validated 2. Input data-source – Uniform data database 3. Process 1. Data provided by uniform data database
2. Validation of data performed 3. Data is output to temporary validated data database.
4. Output data- destination
– Validated data database
2.3.4) Process Data
1. Purpose – The selection of validated data and ensuring that it is processed correctly 2. Input data-source – Validated data database 3. Process 1. Data provided by Validated data database
2. Processing of data performed 3. Data is output to temporary processed data database.
4. Output data- destination
– Processed data database
2.3.5) Develop Information
1. Purpose – The selection of processed data and developing information 2. Input data-source – Processed data database 3. Process 1. Data provided by processed data database
2. Development of information from processed data performed 3. Information is output to EOL information system.
4. Output data- destination
– EOL information system.
2.3.6) EOL Knowledge Generation
1. Purpose – The selection of various information and developing knowledge 2. Input data-source – EOL information system. 3. Process 1. Data provided by EOL information system.
2. Development of knowledge from various information provided 3. Knowledge is output to EOL decision maker, and MOL / BOL.
4. Output data- destination
– BOL decision maker – MOL – BOL.
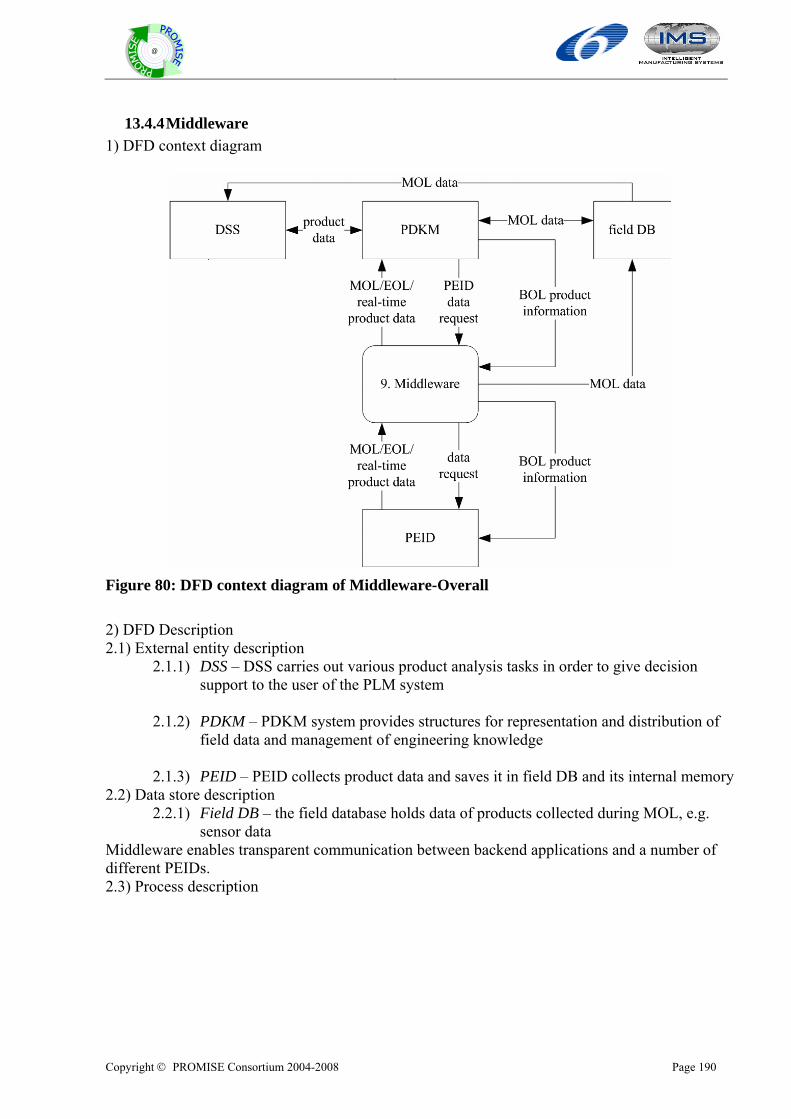
Copyright © PROMISE Consortium 2004-2008 Page 190
@
13.4.4 Middleware 1) DFD context diagram
Figure 80: DFD context diagram of Middleware-Overall 2) DFD Description 2.1) External entity description
2.1.1) DSS – DSS carries out various product analysis tasks in order to give decision support to the user of the PLM system
2.1.2) PDKM – PDKM system provides structures for representation and distribution of
field data and management of engineering knowledge 2.1.3) PEID – PEID collects product data and saves it in field DB and its internal memory
2.2) Data store description 2.2.1) Field DB – the field database holds data of products collected during MOL, e.g.
sensor data Middleware enables transparent communication between backend applications and a number of different PEIDs. 2.3) Process description
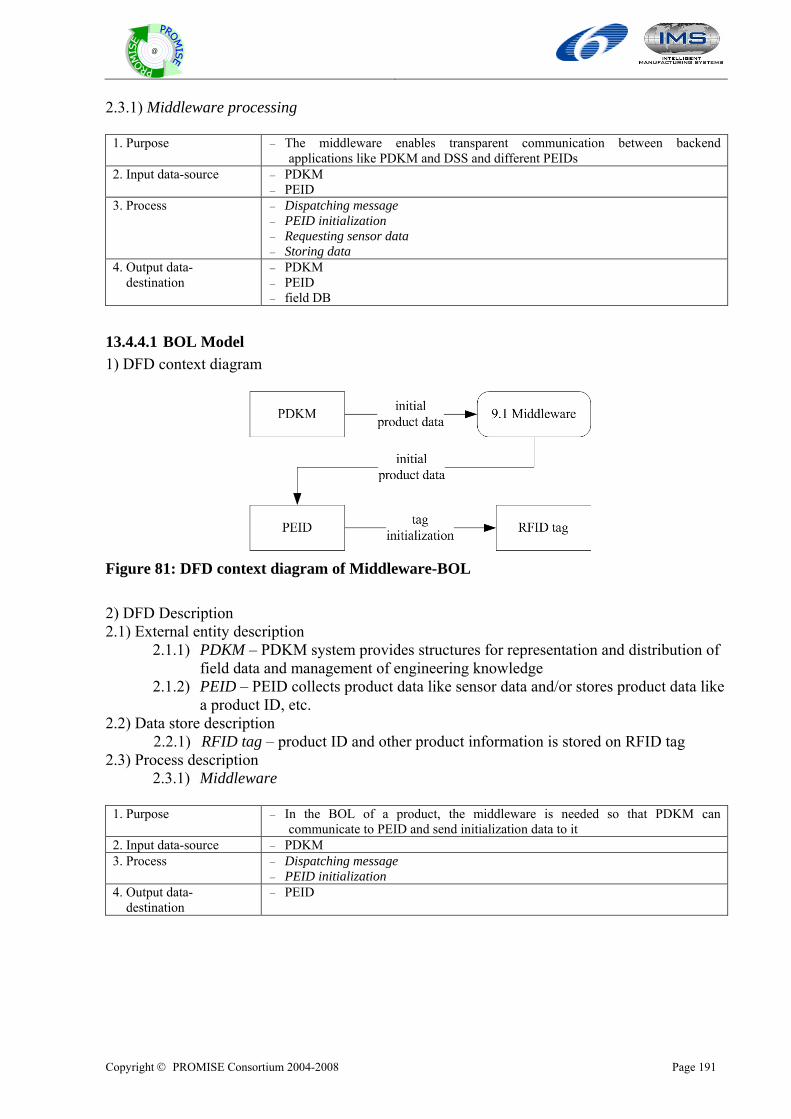
Copyright © PROMISE Consortium 2004-2008 Page 191
@
2.3.1) Middleware processing
1. Purpose – The middleware enables transparent communication between backend applications like PDKM and DSS and different PEIDs
2. Input data-source – PDKM – PEID
3. Process – Dispatching message – PEID initialization – Requesting sensor data – Storing data
4. Output data- destination
– PDKM – PEID – field DB
13.4.4.1 BOL Model 1) DFD context diagram
Figure 81: DFD context diagram of Middleware-BOL 2) DFD Description 2.1) External entity description
2.1.1) PDKM – PDKM system provides structures for representation and distribution of field data and management of engineering knowledge
2.1.2) PEID – PEID collects product data like sensor data and/or stores product data like a product ID, etc.
2.2) Data store description 2.2.1) RFID tag – product ID and other product information is stored on RFID tag
2.3) Process description 2.3.1) Middleware
1. Purpose – In the BOL of a product, the middleware is needed so that PDKM can
communicate to PEID and send initialization data to it 2. Input data-source – PDKM 3. Process – Dispatching message
– PEID initialization 4. Output data- destination
– PEID
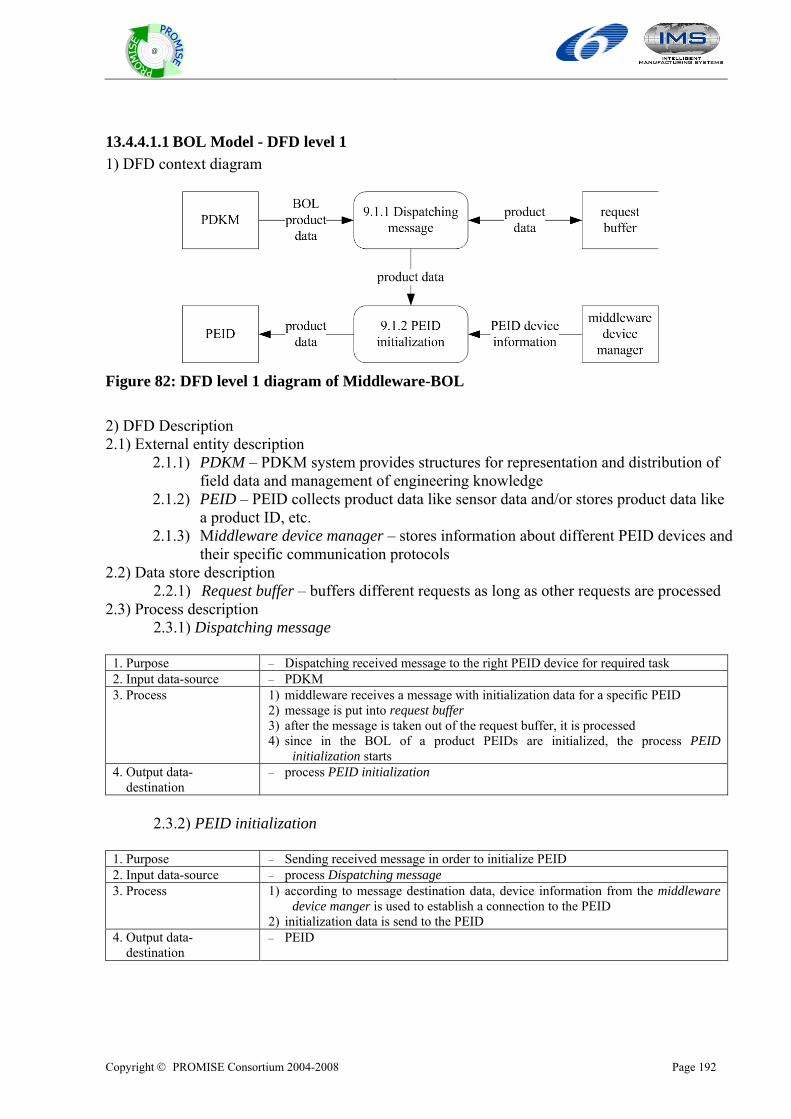
Copyright © PROMISE Consortium 2004-2008 Page 192
@
13.4.4.1.1 BOL Model - DFD level 1 1) DFD context diagram
Figure 82: DFD level 1 diagram of Middleware-BOL 2) DFD Description 2.1) External entity description
2.1.1) PDKM – PDKM system provides structures for representation and distribution of field data and management of engineering knowledge
2.1.2) PEID – PEID collects product data like sensor data and/or stores product data like a product ID, etc.
2.1.3) Middleware device manager – stores information about different PEID devices and their specific communication protocols
2.2) Data store description 2.2.1) Request buffer – buffers different requests as long as other requests are processed
2.3) Process description 2.3.1) Dispatching message
1. Purpose – Dispatching received message to the right PEID device for required task 2. Input data-source – PDKM 3. Process 1) middleware receives a message with initialization data for a specific PEID
2) message is put into request buffer 3) after the message is taken out of the request buffer, it is processed 4) since in the BOL of a product PEIDs are initialized, the process PEID
initialization starts 4. Output data- destination
– process PEID initialization
2.3.2) PEID initialization
1. Purpose – Sending received message in order to initialize PEID 2. Input data-source – process Dispatching message 3. Process 1) according to message destination data, device information from the middleware
device manger is used to establish a connection to the PEID 2) initialization data is send to the PEID
4. Output data- destination
– PEID
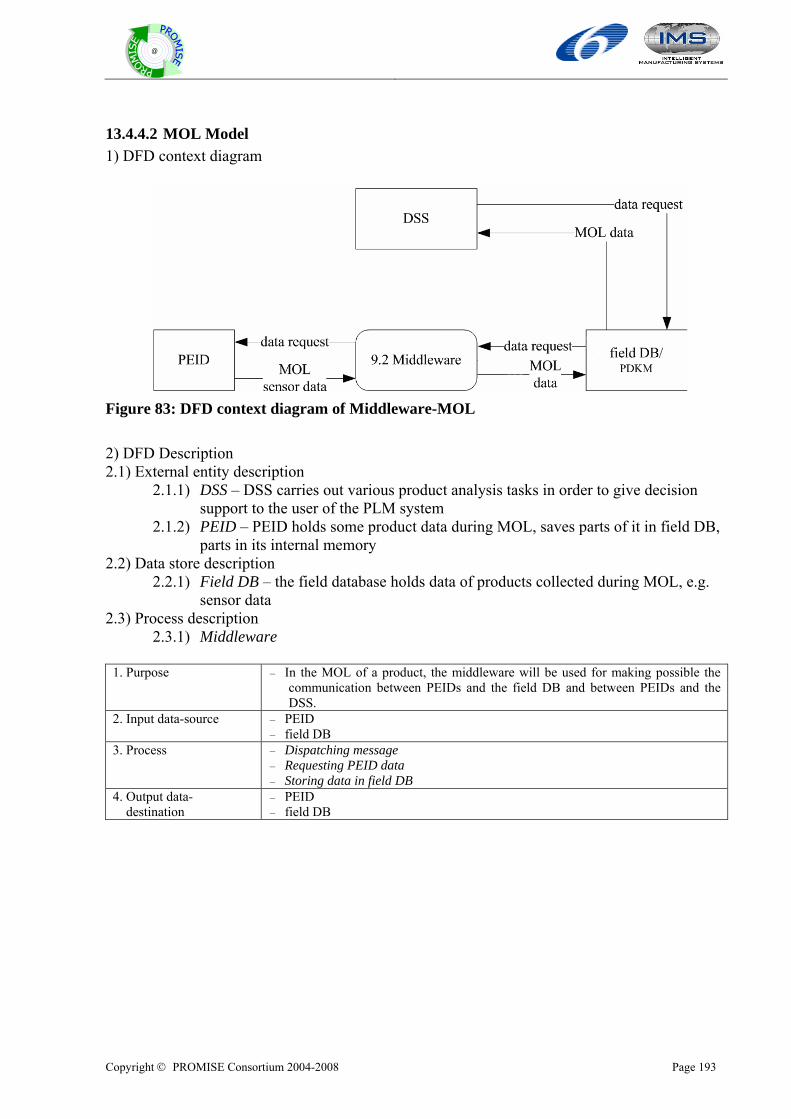
Copyright © PROMISE Consortium 2004-2008 Page 193
@
13.4.4.2 MOL Model 1) DFD context diagram
Figure 83: DFD context diagram of Middleware-MOL 2) DFD Description 2.1) External entity description
2.1.1) DSS – DSS carries out various product analysis tasks in order to give decision support to the user of the PLM system
2.1.2) PEID – PEID holds some product data during MOL, saves parts of it in field DB, parts in its internal memory
2.2) Data store description 2.2.1) Field DB – the field database holds data of products collected during MOL, e.g.
sensor data 2.3) Process description
2.3.1) Middleware
1. Purpose – In the MOL of a product, the middleware will be used for making possible the communication between PEIDs and the field DB and between PEIDs and the DSS.
2. Input data-source – PEID – field DB
3. Process – Dispatching message – Requesting PEID data – Storing data in field DB
4. Output data- destination
– PEID – field DB
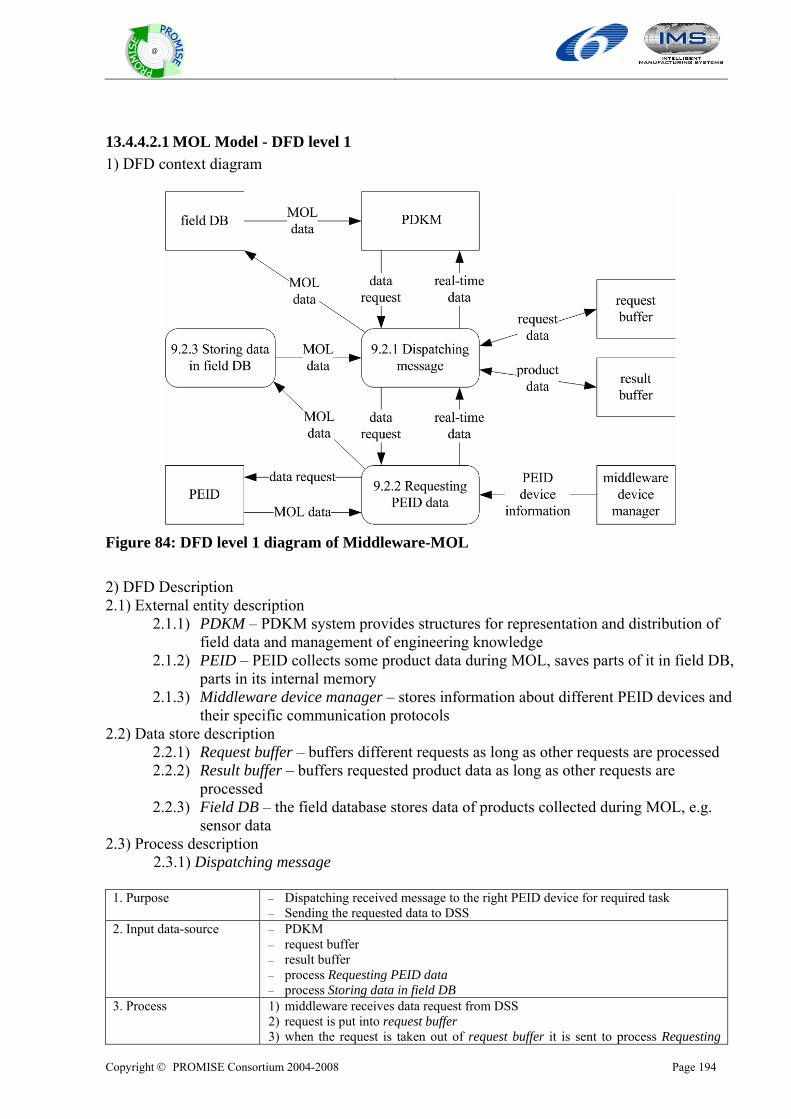
Copyright © PROMISE Consortium 2004-2008 Page 194
@
13.4.4.2.1 MOL Model - DFD level 1 1) DFD context diagram
Figure 84: DFD level 1 diagram of Middleware-MOL 2) DFD Description 2.1) External entity description
2.1.1) PDKM – PDKM system provides structures for representation and distribution of field data and management of engineering knowledge
2.1.2) PEID – PEID collects some product data during MOL, saves parts of it in field DB, parts in its internal memory
2.1.3) Middleware device manager – stores information about different PEID devices and their specific communication protocols
2.2) Data store description 2.2.1) Request buffer – buffers different requests as long as other requests are processed 2.2.2) Result buffer – buffers requested product data as long as other requests are
processed 2.2.3) Field DB – the field database stores data of products collected during MOL, e.g.
sensor data 2.3) Process description
2.3.1) Dispatching message
1. Purpose – Dispatching received message to the right PEID device for required task – Sending the requested data to DSS
2. Input data-source – PDKM – request buffer – result buffer – process Requesting PEID data – process Storing data in field DB
3. Process 1) middleware receives data request from DSS 2) request is put into request buffer 3) when the request is taken out of request buffer it is sent to process Requesting
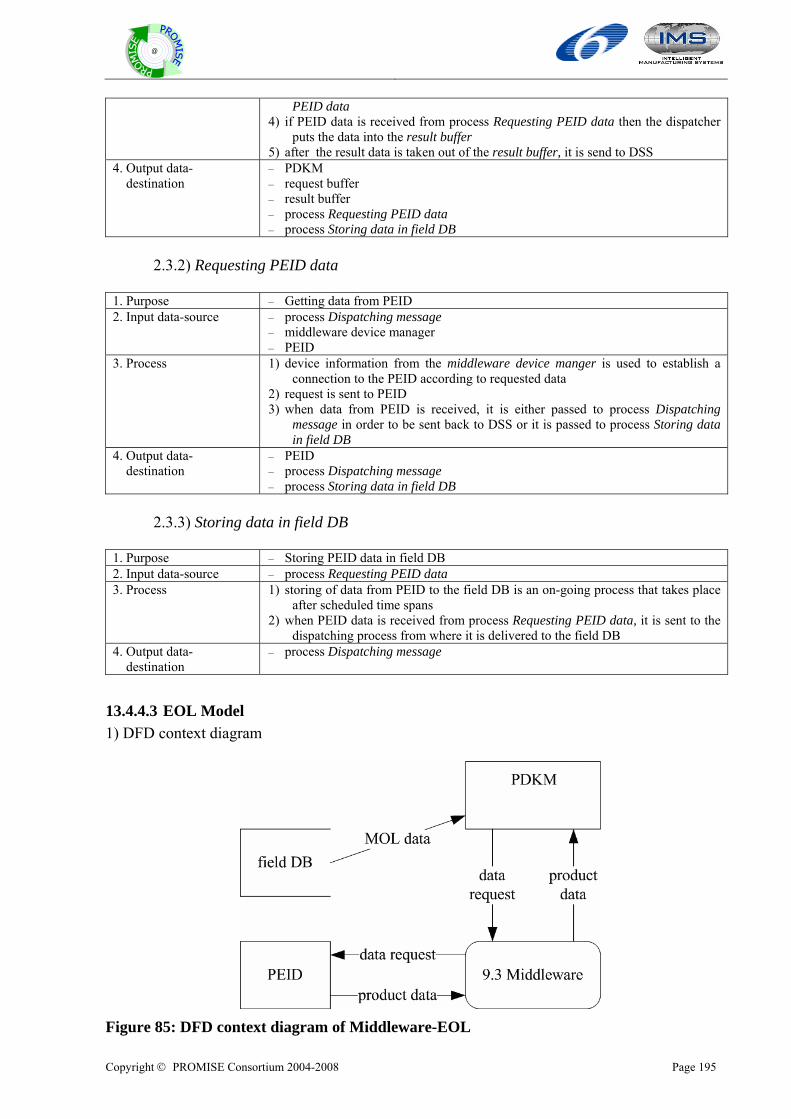
Copyright © PROMISE Consortium 2004-2008 Page 195
@
PEID data 4) if PEID data is received from process Requesting PEID data then the dispatcher
puts the data into the result buffer 5) after the result data is taken out of the result buffer, it is send to DSS
4. Output data- destination
– PDKM – request buffer – result buffer – process Requesting PEID data – process Storing data in field DB
2.3.2) Requesting PEID data
1. Purpose – Getting data from PEID 2. Input data-source – process Dispatching message
– middleware device manager – PEID
3. Process 1) device information from the middleware device manger is used to establish a connection to the PEID according to requested data
2) request is sent to PEID 3) when data from PEID is received, it is either passed to process Dispatching
message in order to be sent back to DSS or it is passed to process Storing data in field DB
4. Output data- destination
– PEID – process Dispatching message – process Storing data in field DB
2.3.3) Storing data in field DB
1. Purpose – Storing PEID data in field DB 2. Input data-source – process Requesting PEID data 3. Process 1) storing of data from PEID to the field DB is an on-going process that takes place
after scheduled time spans 2) when PEID data is received from process Requesting PEID data, it is sent to the
dispatching process from where it is delivered to the field DB 4. Output data- destination
– process Dispatching message
13.4.4.3 EOL Model 1) DFD context diagram
Figure 85: DFD context diagram of Middleware-EOL
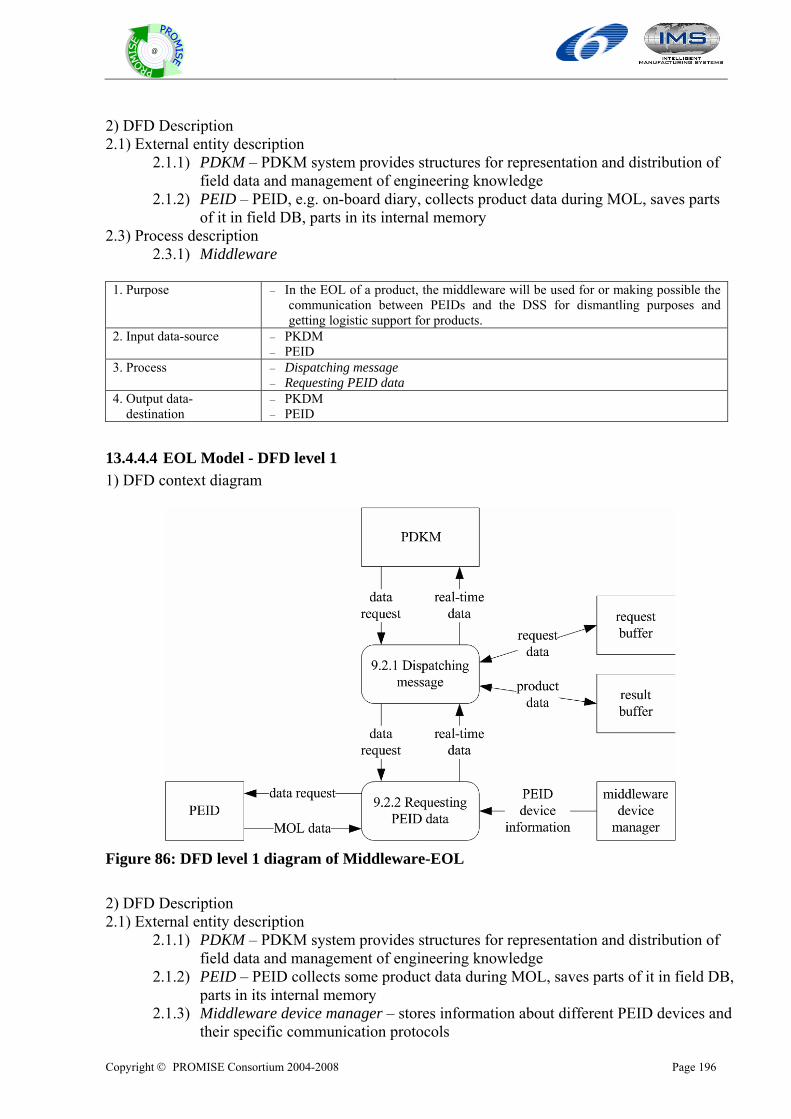
Copyright © PROMISE Consortium 2004-2008 Page 196
@
2) DFD Description 2.1) External entity description
2.1.1) PDKM – PDKM system provides structures for representation and distribution of field data and management of engineering knowledge
2.1.2) PEID – PEID, e.g. on-board diary, collects product data during MOL, saves parts of it in field DB, parts in its internal memory
2.3) Process description 2.3.1) Middleware
1. Purpose – In the EOL of a product, the middleware will be used for or making possible the
communication between PEIDs and the DSS for dismantling purposes and getting logistic support for products.
2. Input data-source – PKDM – PEID
3. Process – Dispatching message – Requesting PEID data
4. Output data- destination
– PKDM – PEID
13.4.4.4 EOL Model - DFD level 1 1) DFD context diagram
Figure 86: DFD level 1 diagram of Middleware-EOL 2) DFD Description 2.1) External entity description
2.1.1) PDKM – PDKM system provides structures for representation and distribution of field data and management of engineering knowledge
2.1.2) PEID – PEID collects some product data during MOL, saves parts of it in field DB, parts in its internal memory
2.1.3) Middleware device manager – stores information about different PEID devices and their specific communication protocols
Copyright © PROMISE Consortium 2004-2008 Page 197
@
2.2) Data store description 2.2.1) Request buffer – buffers different requests as long as other requests are processed 2.2.2) Result buffer – buffers requested product data as long as other requests are
processed 2.3) Process description 2.3.1) Dispatching message
1. Purpose – Dispatching received message to the right PEID device for required task – Sending the requested data to DSS
2. Input data-source – PDKM – request buffer – result buffer – process Requesting PEID data
3. Process 1) middleware receives data request from DSS 2) request is put into request buffer 3) after the request is taken out of request buffer, it is send to process Requesting
PEID data 4) if PEID data is received from process Requesting PEID data, then the dispatcher
puts the data into the result buffer 5) after the result data is taken out of the result buffer, it is send to DSS
4. Output data- destination
– PDKM – request buffer – result buffer – process Requesting PEID data
2.3.2) Requesting PEID data
1. Purpose – Getting data from PEID 2. Input data-source – process Dispatching message
– middleware device manager – PEID
3. Process 1) device information from the middleware device manger is used to establish a connection to the PEID according to requested data
2) request is sent to PEID 3) when data from PEID is received, it is passed to process Dispatching message in
order to be sent back to DSS 4. Output data- destination
– PEID – process Dispatching message
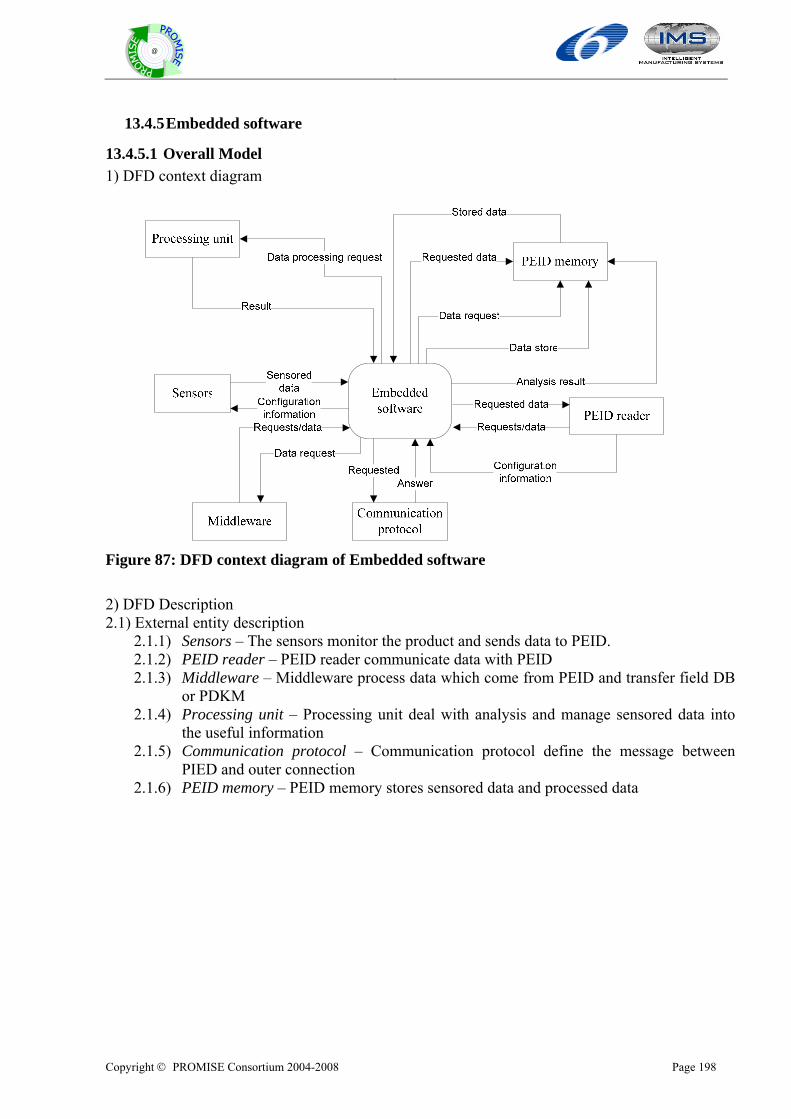
Copyright © PROMISE Consortium 2004-2008 Page 198
@
13.4.5 Embedded software
13.4.5.1 Overall Model 1) DFD context diagram
Figure 87: DFD context diagram of Embedded software 2) DFD Description 2.1) External entity description
2.1.1) Sensors – The sensors monitor the product and sends data to PEID. 2.1.2) PEID reader – PEID reader communicate data with PEID 2.1.3) Middleware – Middleware process data which come from PEID and transfer field DB
or PDKM 2.1.4) Processing unit – Processing unit deal with analysis and manage sensored data into
the useful information 2.1.5) Communication protocol – Communication protocol define the message between
PIED and outer connection 2.1.6) PEID memory – PEID memory stores sensored data and processed data
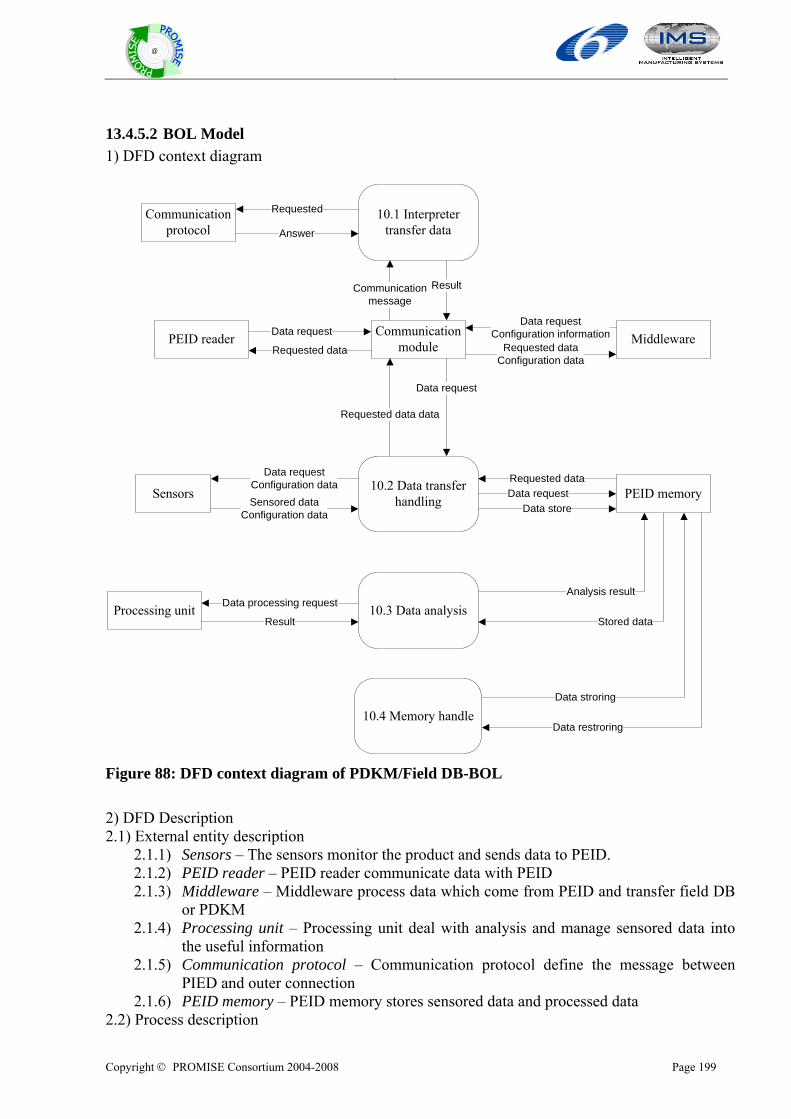
Copyright © PROMISE Consortium 2004-2008 Page 199
@
13.4.5.2 BOL Model 1) DFD context diagram
Sensors
10.3 Data analysis
PEID reader Middleware
Sensored dataConfiguration data
Data stroring
Data processing request
10.4 Memory handle
10.2 Data transfer handling
Communication module
Data store
Stored dataProcessing unit
PEID memory
Analysis result
Data requestConfiguration data
Data request
Data requestRequested data
Requested data data
Data restroring
Result
10.1 Interpreter transfer data
Communication protocol
Data requestConfiguration informationData request
Requested data Requested dataConfiguration data
Communicationmessage
Result
Requested
Answer
Figure 88: DFD context diagram of PDKM/Field DB-BOL 2) DFD Description 2.1) External entity description
2.1.1) Sensors – The sensors monitor the product and sends data to PEID. 2.1.2) PEID reader – PEID reader communicate data with PEID 2.1.3) Middleware – Middleware process data which come from PEID and transfer field DB
or PDKM 2.1.4) Processing unit – Processing unit deal with analysis and manage sensored data into
the useful information 2.1.5) Communication protocol – Communication protocol define the message between
PIED and outer connection 2.1.6) PEID memory – PEID memory stores sensored data and processed data
2.2) Process description

Copyright © PROMISE Consortium 2004-2008 Page 200
@
2.2.1) Interpreter transfer data
1. Purpose – Manage data transfer from PEID to PEID memory and communication module 2. Input data-source – Communication message – communication module 3. Process 1) Request for interpretation of communication message
2) Send communication message 3) Interpret or build message with protocol 4) Receive result
4. Output data- destination
– Sensored data/Configuration data– communication module/PEID memory
2.2.2) Data transfer handling
1. Purpose – Data transfer between PEID and outer entities 2. Input data-source – Sensored data/Configuration data – Sensors 3. Process 1) Receive sensored data and configuration data from sensors/Restore data from
PEID memory 2) Send data to communication module or PEID memory
4. Output data- destination
– Result – communication module
2.2.3) Data analysis
1. Purpose – Analysis sensored data 2. Input data-source – Sensored data/Configuration data – PEID memory 3. Process 1) Request sensored data from PEID memory
2) Analysis and process data 3) Send result and store to PEID memory
4. Output data- destination
– Analysis result – PEID memory
2.2.4) Memory handle
1. Purpose – Manage memory function 2. Input data-source – Sensored data/Configuration data – PEID memory
– Analysis result – Processing unit 3. Process 1) Store data
2) Restore data 4. Output data- destination
– Store data – Communication module – Sensored data – Processing unit

Copyright © PROMISE Consortium 2004-2008 Page 201
@
13.4.5.3 MOL Model 1) DFD context diagram
Sensors
10.3 Data analysis
PEID reader Middleware
Sensored dataConfiguration data
Data stroring
Data processing request
10.4 Memory handle
10.2 Data transfer handling
Communication module
Data store
Stored dataProcessing unit
PEID memory
Analysis result
Data requestConfiguration data
Data request
Data requestRequested data
Requested data data
Data restroring
Result
10.1 Interpreter transfer data
Communication protocol
Data requestConfiguration informationData request
Requested data Requested dataConfiguration data
Communicationmessage
Result
Requested
Answer
Figure 89: DFD context diagram of PDKM/Field DB-BOL 2) DFD Description 2.1) External entity description
2.1.1) Sensors – The sensors monitor the product and sends data to PEID. 2.1.2) PEID reader – PEID reader communicate data with PEID 2.1.3) Middleware – Middleware process data which come from PEID and transfer field DB
or PDKM 2.1.4) Processing unit – Processing unit deal with analysis and manage sensored data into
the useful information 2.1.5) Communication protocol – Communication protocol define the message between
PIED and outer connection 2.1.6) PEID memory – PEID memory stores sensored data and processed data
2.2) Process description
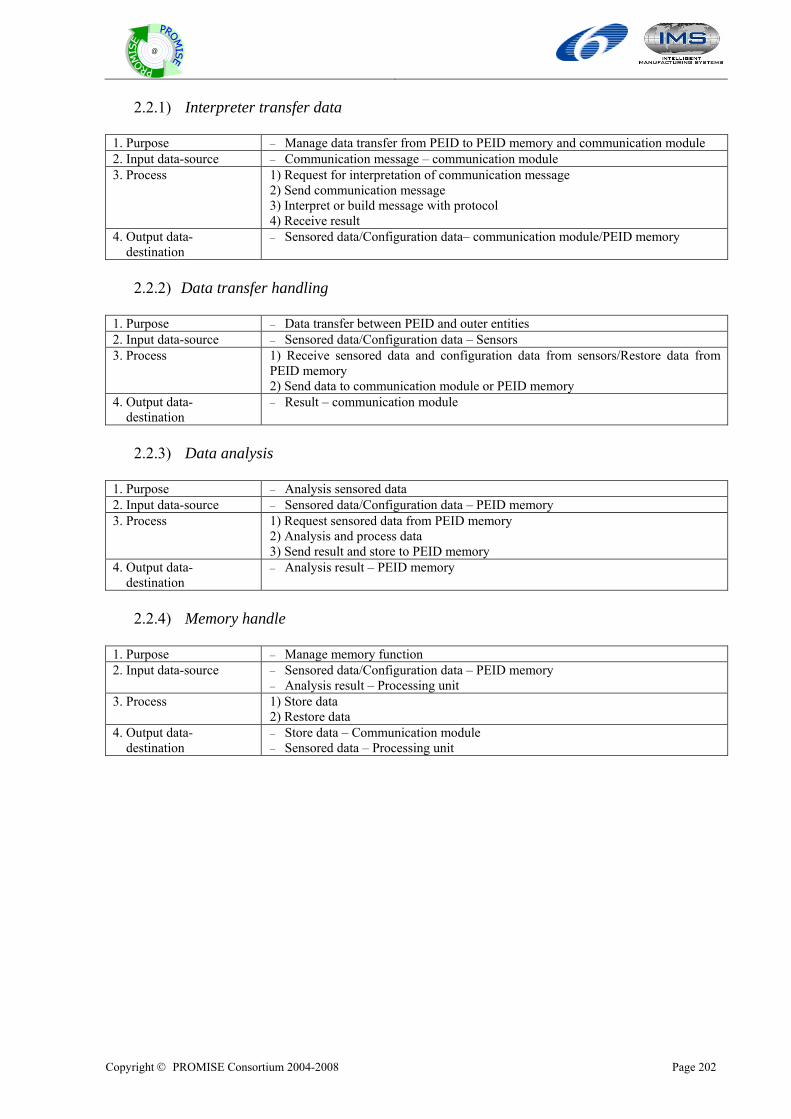
Copyright © PROMISE Consortium 2004-2008 Page 202
@
2.2.1) Interpreter transfer data
1. Purpose – Manage data transfer from PEID to PEID memory and communication module 2. Input data-source – Communication message – communication module 3. Process 1) Request for interpretation of communication message
2) Send communication message 3) Interpret or build message with protocol 4) Receive result
4. Output data- destination
– Sensored data/Configuration data– communication module/PEID memory
2.2.2) Data transfer handling
1. Purpose – Data transfer between PEID and outer entities 2. Input data-source – Sensored data/Configuration data – Sensors 3. Process 1) Receive sensored data and configuration data from sensors/Restore data from
PEID memory 2) Send data to communication module or PEID memory
4. Output data- destination
– Result – communication module
2.2.3) Data analysis
1. Purpose – Analysis sensored data 2. Input data-source – Sensored data/Configuration data – PEID memory 3. Process 1) Request sensored data from PEID memory
2) Analysis and process data 3) Send result and store to PEID memory
4. Output data- destination
– Analysis result – PEID memory
2.2.4) Memory handle
1. Purpose – Manage memory function 2. Input data-source – Sensored data/Configuration data – PEID memory
– Analysis result – Processing unit 3. Process 1) Store data
2) Restore data 4. Output data- destination
– Store data – Communication module – Sensored data – Processing unit
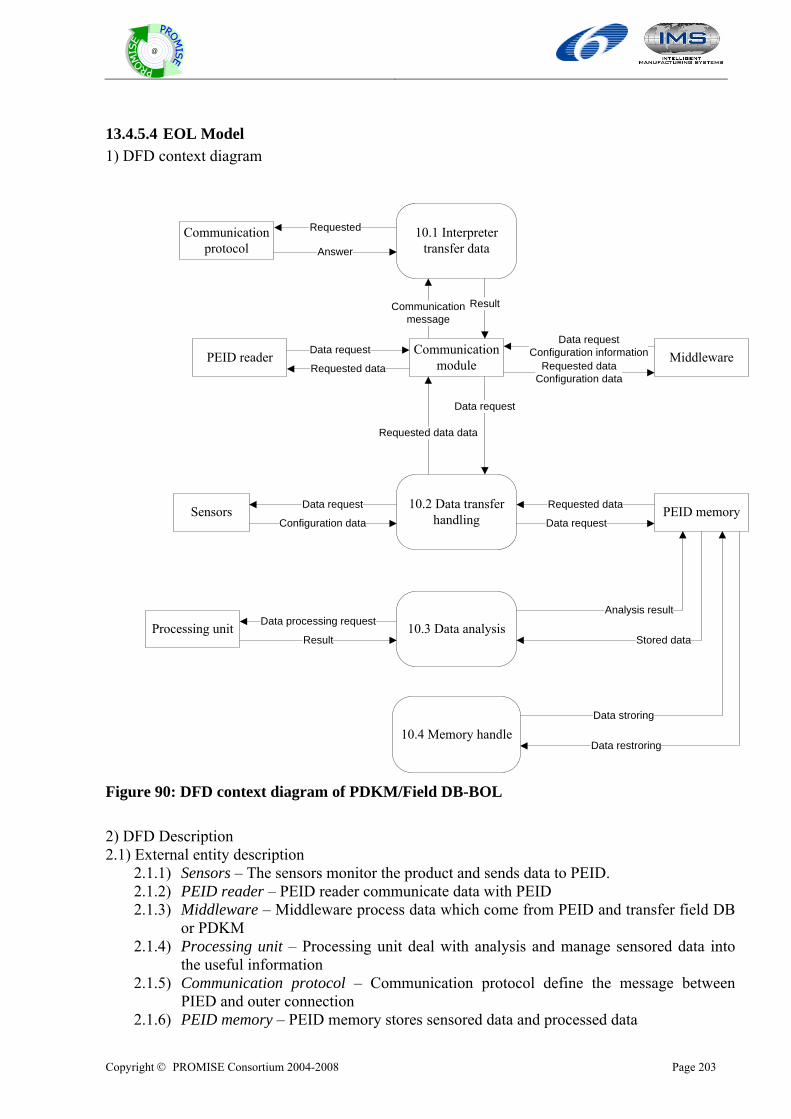
Copyright © PROMISE Consortium 2004-2008 Page 203
@
13.4.5.4 EOL Model 1) DFD context diagram
Sensors
10.3 Data analysis
PEID reader Middleware
Configuration data
Data stroring
Data processing request
10.4 Memory handle
10.2 Data transfer handling
Communication module
Stored dataProcessing unit
PEID memory
Analysis result
Data request
Data request
Data request
Requested data
Requested data data
Data restroring
Result
10.1 Interpreter transfer data
Communication protocol
Data requestConfiguration informationData request
Requested data Requested dataConfiguration data
Communicationmessage
Result
Requested
Answer
Figure 90: DFD context diagram of PDKM/Field DB-BOL 2) DFD Description 2.1) External entity description
2.1.1) Sensors – The sensors monitor the product and sends data to PEID. 2.1.2) PEID reader – PEID reader communicate data with PEID 2.1.3) Middleware – Middleware process data which come from PEID and transfer field DB
or PDKM 2.1.4) Processing unit – Processing unit deal with analysis and manage sensored data into
the useful information 2.1.5) Communication protocol – Communication protocol define the message between
PIED and outer connection 2.1.6) PEID memory – PEID memory stores sensored data and processed data

Copyright © PROMISE Consortium 2004-2008 Page 204
@
2.2) Process description 2.2.1) Interpreter transfer data
1. Purpose – Manage data transfer from PEID to PEID memory and communication module 2. Input data-source – Communication message – communication module 3. Process 1) Request for interpretation of communication message
2) Send communication message 3) Interpret or build message with protocol 4) Receive result
4. Output data- destination
– Sensored data/Configuration data– communication module/PEID memory
2.2.2) Data transfer handling
1. Purpose – Data transfer between PEID and outer entities 2. Input data-source – Sensored data/Configuration data – Sensors 3. Process 1) Receive sensored data and configuration data from sensors/Restore data from
PEID memory 2) Send data to communication module or PEID memory
4. Output data- destination
– Result – communication module
2.2.3) Data analysis
1. Purpose – Analysis sensored data 2. Input data-source – Sensored data/Configuration data – PEID memory 3. Process 1) Request sensored data from PEID memory
2) Analysis and process data 3) Send result and store to PEID memory
4. Output data- destination
– Analysis result – PEID memory
2.2.4) Memory handle
1. Purpose – Manage memory function 2. Input data-source – Sensored data/Configuration data – PEID memory
– Analysis result – Processing unit 3. Process 1) Store data
2) Restore data 4. Output data- destination
– Store data – Communication module – Sensored data – Processing unit

Copyright © PROMISE Consortium 2004-2008 Page 205
@
PART V: Concluding remarks

Copyright © PROMISE Consortium 2004-2008 Page 206
@
Copyright © PROMISE Consortium 2004-2008 Page 207
@
14 Concluding remarks to the work-package R2, deliverable DR2.1 In this deliverable, we have proposed the PROMISE generic models which consist of generic product lifecycle models and generic product information flow models. These models have three viewpoints such as hardware, software, and business model. For designing generic product lifecycle models, we used the use case diagram which is a well known modelling tool in the system engineering design domain. For designing product information flow model in a simple way, we used data flow diagram (DFD). These models will be the basis for the development of the required PROMISE tools and software components. This report will give some guidance when PROMISE consolidated models are designed in the next project period. The proposed generic models will be updated based on consolidated models to be developed based on the experience of the development of the PROMISE demonstrators.

Copyright © PROMISE Consortium 2004-2008 Page 208
@

Copyright © PROMISE Consortium 2004-2008 Page 209
@
References and Appendix

Copyright © PROMISE Consortium 2004-2008 Page 210
@
Copyright © PROMISE Consortium 2004-2008 Page 211
@
References Agile Solutions, 2005. http://www.agile.com/plm/plm_solutions.asp.
Ambler, S. W. 2005. The Elements of UML 2.0 Style, Cambridge University Press.
Arena Solutions, 2005. http://www.arenasolutions.com/products/professional/index.html.
Bernus, P., 1999,“Enterprise Integration Methodology in the Globeman21 Consortium”, Brisbane.
Bruno, G. and Agarwal, R., 1997, “Modeling the enterprise engineering environment,” IEEE Transactions on Engineering Management, 44(1), pp. 20-30.
CIMdata Inc., 2002, “Product Lifecycle Management-Empowering the Future of Business,” CIMdata report.
Gu, P. and Chan, K., 1995, “Product modeling using STEP,” Computer-Aided Design, 27(3), pp. 163-179.
Hewlett Packard Enterprise Information Managemnet systems (web pages), http://h71028.www7.hp.com/enterprise/cache/101414-0-0-225-121.html
Industrial Standard ISO document, TC184/S5/WG1, “Reference Model for shop floor production”, International Organisation for Standardisation, Switzerland, 1990
Industrial Standard ISO 14258, 1998, “Industrial automation systems – Concepts and rules for enterprise models”, International Organisation for Standardisation, Switzerland
Industrial Standard ISO 14258, 2000, “Industrial automation systems – Concepts and rules for enterprise models Technical Corrigendum 1”, International Organisation for Standardisation, Switzerland.
Iyer, N.; Jayanti, S.; Lou, K.; Kalyanaraman, Y.; Ramani, K., 2005, “Shape-based searching for product lifecycle applications,” Computer-Aided Design, 37(13), pp. 1435-1446.
Kimber, W. E., 1999, “XML representation methods for EXPRESS-Driven Data,” Technical report, NIST.
Loshin, D., 2003, Knowledge Integrity: Information Flow Modeling. DM Review Magazine, April 2003 Issue. Available online (21 Oct. 05): http://www.dmreview.com/article_sub.cfm?articleId=6523
Lubell, J., Russel, S. P., Srinivasan, V., Waterbury, S. C., 2004, “STEP, XML, AND UML: COMPLEMENTARY TECHNOLOGIES”, ASME 2004 Design Engineering Technical Conferences and Computers and Information in Engineering Conference, September 28–October 2, 2004, Salt Lake City, Utah USA.
Marshall, C., 1999, Enterprise modeling with UML: Designing successful software through business analysis, Addison-Wesley Publish Co.
Mayer, R. J., 1994, IDEF0 function modeling, Knowledge based systems.
Ming, X. G. and Lu, W. F., 2003, “A Framework of Implementation of Collaborative Product Service in Virtual Enterprise,” Innovation in Manufacturing Systems and Technology (IMST), http://hdl.handle.net/1721.1/3740, January.
Morris, H., Lee, S., Shan, E., and Zeng, S., 2004, “Information integration framework for product lifecycle management of diverse data,” Journal of computing and information science in engineering, 4, pp. 352-358.
Copyright © PROMISE Consortium 2004-2008 Page 212
@
OASIS Consortium, “http://www.oasis-open.org/committees/plcs/charter.php”
Pratt, M. J., 2005, “ISO 10303, the STEP standard for product data exchange, and its PLM capabilities”, International Journal of Product Lifecycle Management, 1(1).
Rosemann, M.; van der Aalst, W., 2005, “A configurable reference modelling language,” Information Systems, in Press.
Stark, J., 2004, Product Lifecycle Management: Paradigm for 21st century Product Realisation, Springer Publish Co.
SC4Online, http://www.tc184-sc4.org/
Scheer, A.-W., 1998a, ARIS Business process framework, Springer.
Scheer, A.-W., 1998b, ARIS-Business process modeling, Springer.
Tipnis, V. A., 1995, “Toward a comprehensive life cycle modeling for innovative strategy, systems, processes and products/services,” Proceedings of the IFIP WG5.3 International Conference on Life-cycle Modelling for Innovative Products and Processes, pp. 43-55.
Vernadat, F. B., 1996, Enterprise Modeling and Integration: Principles and Applications, Chapman and Hall.
Vernadat, F. B., 2002, “UEML: Towards a Unified Enterprise Modelling Language,” International Journal of Production Research, 40(17), pp. 4309-4321.
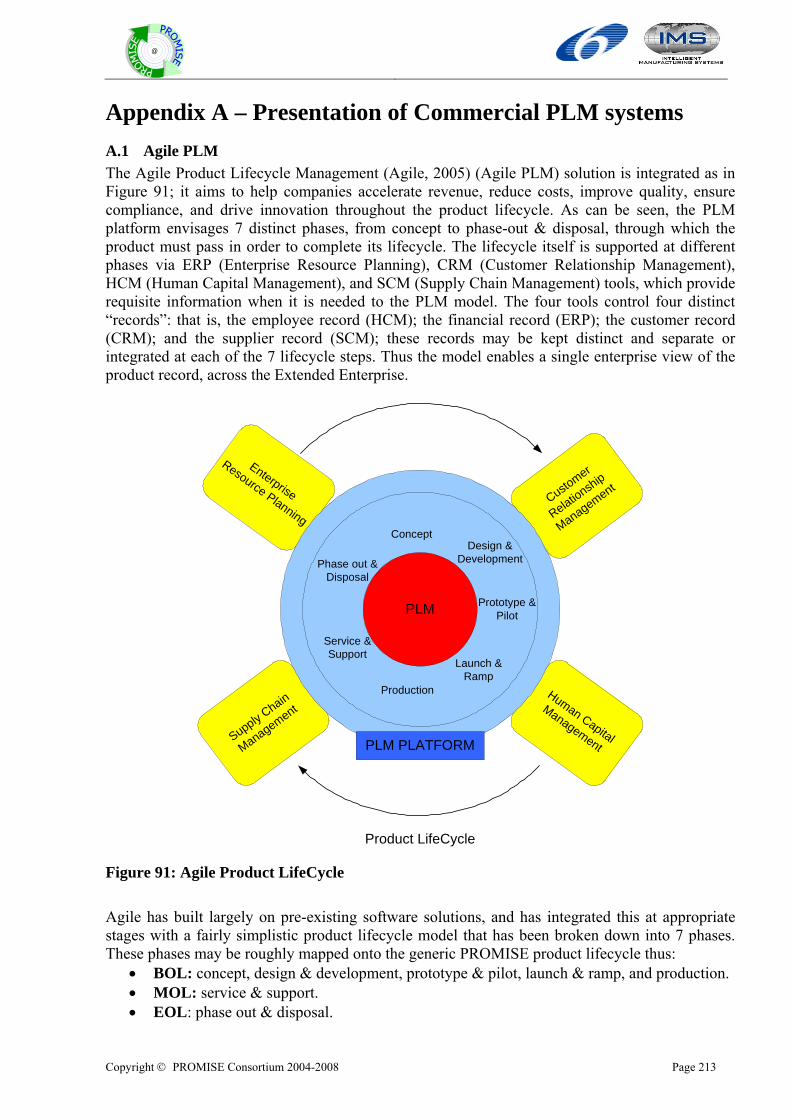
Copyright © PROMISE Consortium 2004-2008 Page 213
@
Appendix A – Presentation of Commercial PLM systems
A.1 Agile PLM The Agile Product Lifecycle Management (Agile, 2005) (Agile PLM) solution is integrated as in Figure 91; it aims to help companies accelerate revenue, reduce costs, improve quality, ensure compliance, and drive innovation throughout the product lifecycle. As can be seen, the PLM platform envisages 7 distinct phases, from concept to phase-out & disposal, through which the product must pass in order to complete its lifecycle. The lifecycle itself is supported at different phases via ERP (Enterprise Resource Planning), CRM (Customer Relationship Management), HCM (Human Capital Management), and SCM (Supply Chain Management) tools, which provide requisite information when it is needed to the PLM model. The four tools control four distinct “records”: that is, the employee record (HCM); the financial record (ERP); the customer record (CRM); and the supplier record (SCM); these records may be kept distinct and separate or integrated at each of the 7 lifecycle steps. Thus the model enables a single enterprise view of the product record, across the Extended Enterprise.
Enterprise
Resource Planning
Supply Chain
ManagementHuman Capital
Management
Customer
Relationship
Management
Product LifeCycle
Phase out &Disposal
Service &Support
Production
Launch &Ramp
Prototype &Pilot
ConceptDesign &
Development
PLM
PLM PLATFORM
Figure 91: Agile Product LifeCycle
Agile has built largely on pre-existing software solutions, and has integrated this at appropriate stages with a fairly simplistic product lifecycle model that has been broken down into 7 phases. These phases may be roughly mapped onto the generic PROMISE product lifecycle thus:
• BOL: concept, design & development, prototype & pilot, launch & ramp, and production. • MOL: service & support. • EOL: phase out & disposal.
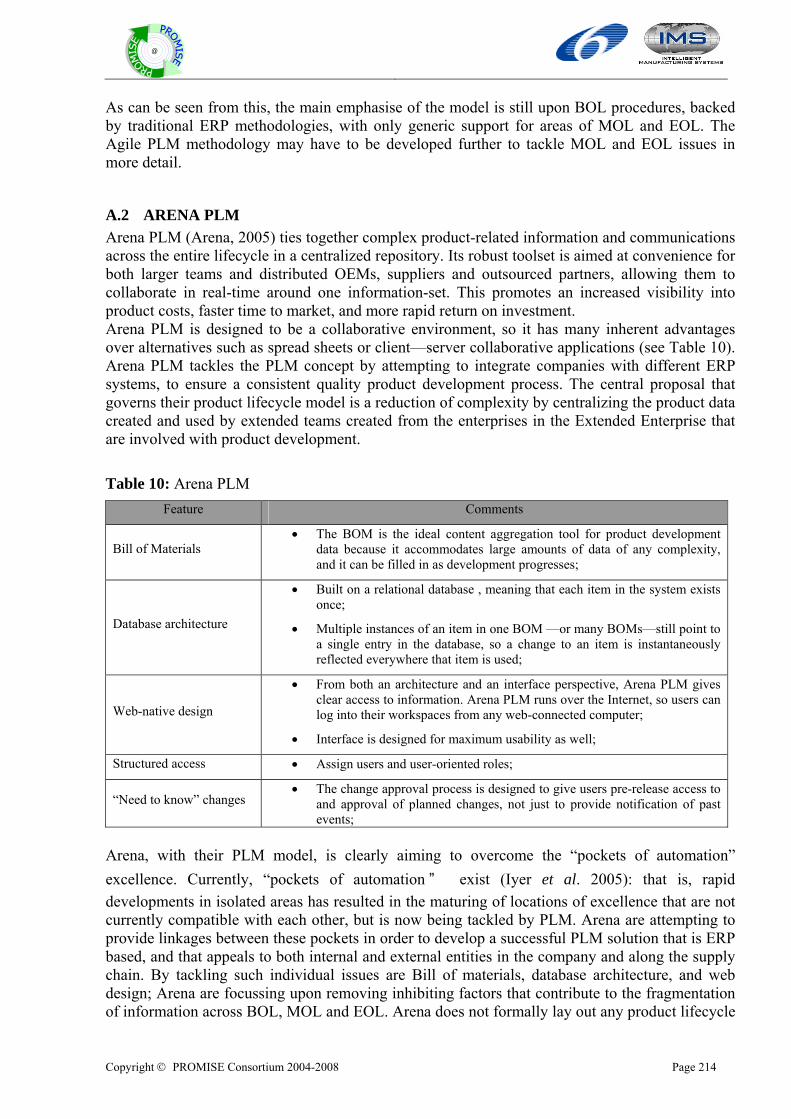
Copyright © PROMISE Consortium 2004-2008 Page 214
@
As can be seen from this, the main emphasise of the model is still upon BOL procedures, backed by traditional ERP methodologies, with only generic support for areas of MOL and EOL. The Agile PLM methodology may have to be developed further to tackle MOL and EOL issues in more detail.
A.2 ARENA PLM Arena PLM (Arena, 2005) ties together complex product-related information and communications across the entire lifecycle in a centralized repository. Its robust toolset is aimed at convenience for both larger teams and distributed OEMs, suppliers and outsourced partners, allowing them to collaborate in real-time around one information-set. This promotes an increased visibility into product costs, faster time to market, and more rapid return on investment. Arena PLM is designed to be a collaborative environment, so it has many inherent advantages over alternatives such as spread sheets or client—server collaborative applications (see Table 10). Arena PLM tackles the PLM concept by attempting to integrate companies with different ERP systems, to ensure a consistent quality product development process. The central proposal that governs their product lifecycle model is a reduction of complexity by centralizing the product data created and used by extended teams created from the enterprises in the Extended Enterprise that are involved with product development.
Table 10: Arena PLM Feature Comments
Bill of Materials • The BOM is the ideal content aggregation tool for product development
data because it accommodates large amounts of data of any complexity, and it can be filled in as development progresses;
Database architecture
• Built on a relational database , meaning that each item in the system exists once;
• Multiple instances of an item in one BOM —or many BOMs—still point to a single entry in the database, so a change to an item is instantaneously reflected everywhere that item is used;
Web-native design
• From both an architecture and an interface perspective, Arena PLM gives clear access to information. Arena PLM runs over the Internet, so users can log into their workspaces from any web-connected computer;
• Interface is designed for maximum usability as well;
Structured access • Assign users and user-oriented roles;
“Need to know” changes • The change approval process is designed to give users pre-release access to
and approval of planned changes, not just to provide notification of past events;
Arena, with their PLM model, is clearly aiming to overcome the “pockets of automation” excellence. Currently, “pockets of automation ” exist (Iyer et al. 2005): that is, rapid developments in isolated areas has resulted in the maturing of locations of excellence that are not currently compatible with each other, but is now being tackled by PLM. Arena are attempting to provide linkages between these pockets in order to develop a successful PLM solution that is ERP based, and that appeals to both internal and external entities in the company and along the supply chain. By tackling such individual issues are Bill of materials, database architecture, and web design; Arena are focussing upon removing inhibiting factors that contribute to the fragmentation of information across BOL, MOL and EOL. Arena does not formally lay out any product lifecycle
Copyright © PROMISE Consortium 2004-2008 Page 215
@
model, such as Agile PLM have done, but concentrates upon reducing the collaboration problems in BOL, MOL, and EOL phases.
A.3 MySAP PLM
A.3.1 Overview mySAP PLM, SAP’s Product Lifecycle Management Software, is a part of SAP’s mySAP Business Suite which consists of the following business management solutions:
• mySAP Customer Relationship Management (CRM), • mySAP Supply Chain Management (SCM), • mySAP Supplier Relationship Management (SRM), • mySAP Product Lifecycle Management (PLM), • mySAP Enterprise Resource Management (ERP)
Each solution is designed to work seamlessly with all other SAP solutions and to integrate with those of other providers. It is open and compatible and supplies interfaces to non-SAP solutions and a variety of partners – vendors of leading solutions that optimally complement SAP’s own portfolio, such as a direct link to the leading CAD interface packages. This high level of integration means mySAP PLM enables the end-to-end management of the product life cycle. mySAP PLM is a holistic PLM solution that manages all product definition information for an entire enterprise. It aims “to create that information, process and manage it, make the consistent, accurate, up-to-date information available throughout the enterprise and throughout all the phases of the lifecycle of a product.”
A.3.2 Key capabilities of mySAP PLM The important capabilities of mySAP PLM software are (see Figure 92):
a. Lifecycle Data Management (LDM). The life-cycle data management (LDM) capabilities of mySAP PLM help companies manage all product-related data, including product structures, documents, recipes, and all related configuration and change management processes. More importantly, mySAP PLM makes life-cycle information seamlessly accessible and useful to users across the enterprise. It supports product development with complete integration of authoring tools, such as CAD, office applications, and analysis tools. It also seamlessly supplies accurate, up-to-date information on the actual product configuration – from the start to the finish of the product life cycle.
b. Program and Project Management (PPM). mySAP PLM provides the advanced program and project management capabilities needed to plan, manage, and control programs and projects of all types, including the complete product development process. Its project management capabilities offer users the ability to manage the project structures, dates, costs, and resources needed in a project.
c. Enterprise Asset Management (EAM). This capability manages the complete life cycle of any asset (e.g. fleets, buildings, equipment, etc.) from selection and purchase, to installation and operation, right up to its end-of-life. Integration with mySAP SRM’s e-procurement tools allows companies to keep track of service parts, procurement, and returns management. Support for a wide range of mobile and wireless devices enables companies to stay in touch with field personnel and to manage maintenance operations at various locations.
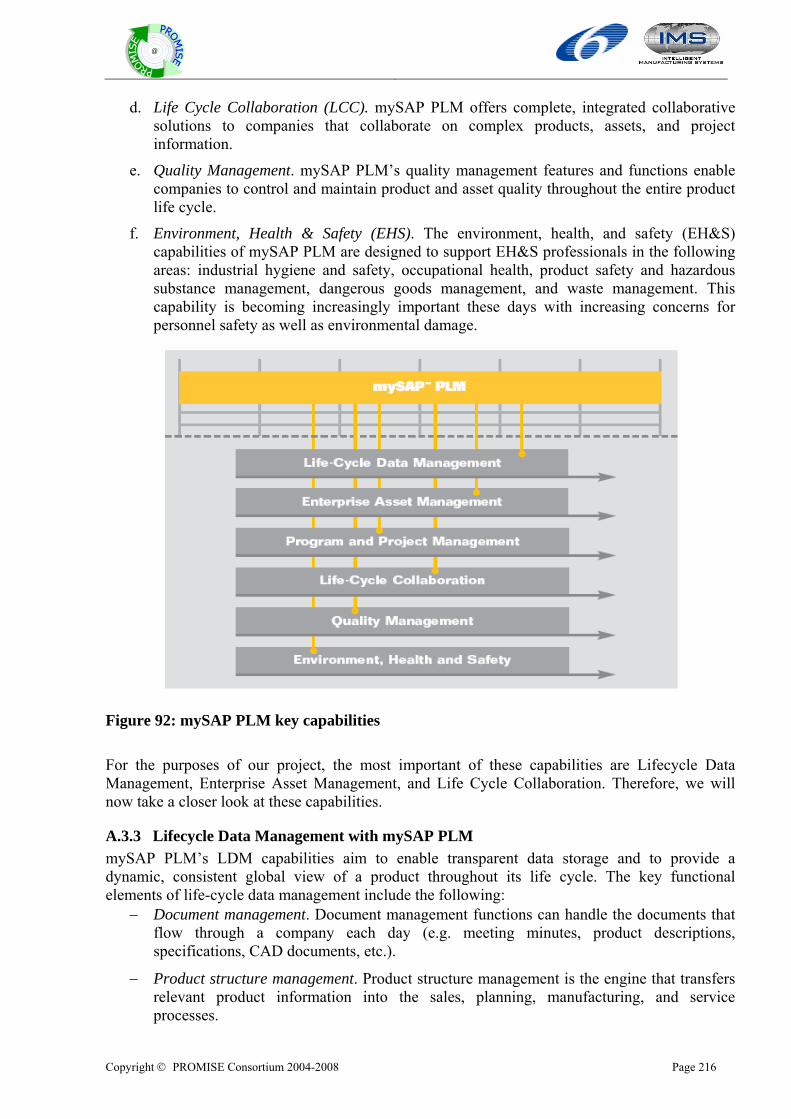
Copyright © PROMISE Consortium 2004-2008 Page 216
@
d. Life Cycle Collaboration (LCC). mySAP PLM offers complete, integrated collaborative solutions to companies that collaborate on complex products, assets, and project information.
e. Quality Management. mySAP PLM’s quality management features and functions enable companies to control and maintain product and asset quality throughout the entire product life cycle.
f. Environment, Health & Safety (EHS). The environment, health, and safety (EH&S) capabilities of mySAP PLM are designed to support EH&S professionals in the following areas: industrial hygiene and safety, occupational health, product safety and hazardous substance management, dangerous goods management, and waste management. This capability is becoming increasingly important these days with increasing concerns for personnel safety as well as environmental damage.
Figure 92: mySAP PLM key capabilities For the purposes of our project, the most important of these capabilities are Lifecycle Data Management, Enterprise Asset Management, and Life Cycle Collaboration. Therefore, we will now take a closer look at these capabilities.
A.3.3 Lifecycle Data Management with mySAP PLM mySAP PLM’s LDM capabilities aim to enable transparent data storage and to provide a dynamic, consistent global view of a product throughout its life cycle. The key functional elements of life-cycle data management include the following:
− Document management. Document management functions can handle the documents that flow through a company each day (e.g. meeting minutes, product descriptions, specifications, CAD documents, etc.).
− Product structure management. Product structure management is the engine that transfers relevant product information into the sales, planning, manufacturing, and service processes.
Copyright © PROMISE Consortium 2004-2008 Page 217
@
− Recipe management. Recipe management defines the product as well as the product formulation process.
− Integration. mySAP PLM integrates the entire product life-cycle management process from product development to product sell-through – bringing all engineering and business processes into one fully integrated solution. By using direct (CAD) integration with mySAP PLM, the work output of a design department is integrated immediately into the complete business flow and can be made available to other parties of the extended supply chain.
− Change and configuration management. mySAP PLM offers the integrated change management processes required to ensure quality and enable the efficient management of engineering change requests and orders in the design phase and also manages changes throughout all the other phases of the product life cycle.
In the coming sections, we will carefully look at those elements that are most relevant to our problem: (a) product structure management, (b) recipe management, and (c) change and configuration management, as these elements define how product data is defined and updated throughout the lifecycle of a product.
A.3.3.1 Product Structure Management Product structure management capabilities support a range of structures such as feature and requirement, functional, and product structures to optimize engineering processes for all life-cycle phases. In addition, users can define and modify separate BOMs for different areas within a company, such as engineering or production, giving each area its own view of the product with the specific data it requires. In the modern manufacturing era of mass customisation, increasing number of companies are offering numerous variants of a single product. mySAP PLM offers a ‘variant configurator’, by which users can describe and manage all the possible variants of a product. mySAP PLM handles multiple-variant products with ease. In the ordering process, customers can configure products to exactly match their requirements.
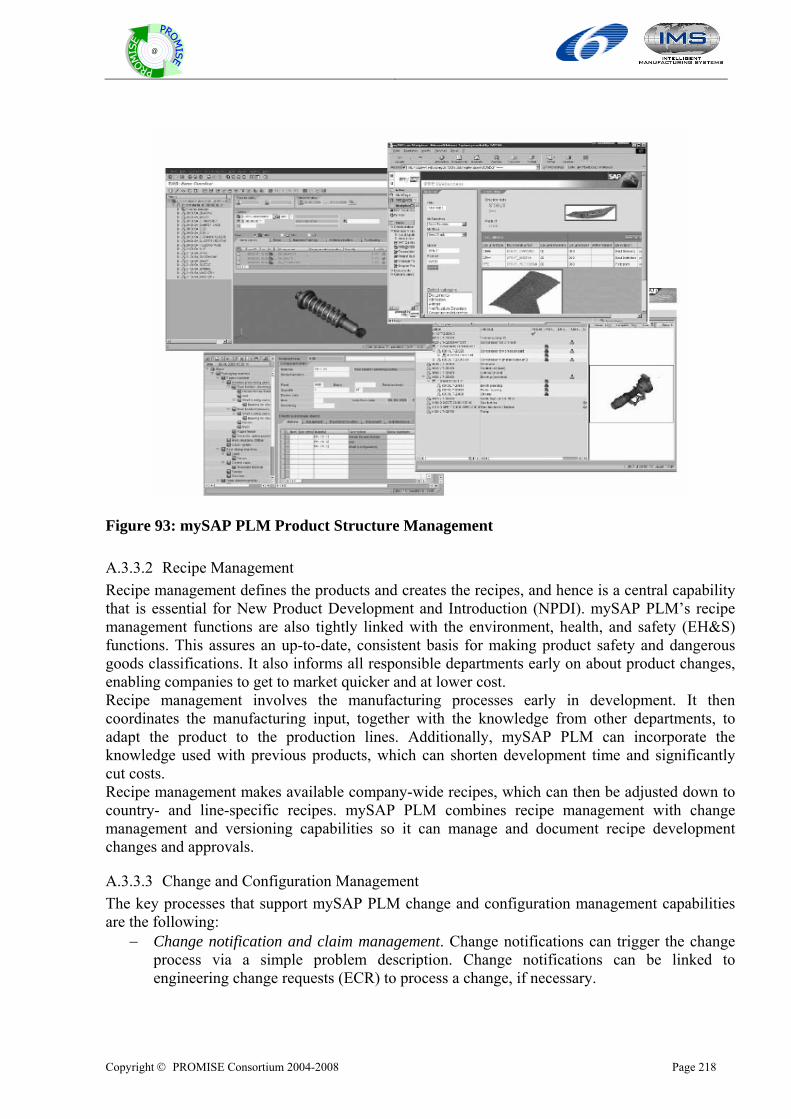
Copyright © PROMISE Consortium 2004-2008 Page 218
@
Figure 93: mySAP PLM Product Structure Management
A.3.3.2 Recipe Management Recipe management defines the products and creates the recipes, and hence is a central capability that is essential for New Product Development and Introduction (NPDI). mySAP PLM’s recipe management functions are also tightly linked with the environment, health, and safety (EH&S) functions. This assures an up-to-date, consistent basis for making product safety and dangerous goods classifications. It also informs all responsible departments early on about product changes, enabling companies to get to market quicker and at lower cost. Recipe management involves the manufacturing processes early in development. It then coordinates the manufacturing input, together with the knowledge from other departments, to adapt the product to the production lines. Additionally, mySAP PLM can incorporate the knowledge used with previous products, which can shorten development time and significantly cut costs. Recipe management makes available company-wide recipes, which can then be adjusted down to country- and line-specific recipes. mySAP PLM combines recipe management with change management and versioning capabilities so it can manage and document recipe development changes and approvals.
A.3.3.3 Change and Configuration Management The key processes that support mySAP PLM change and configuration management capabilities are the following:
− Change notification and claim management. Change notifications can trigger the change process via a simple problem description. Change notifications can be linked to engineering change requests (ECR) to process a change, if necessary.
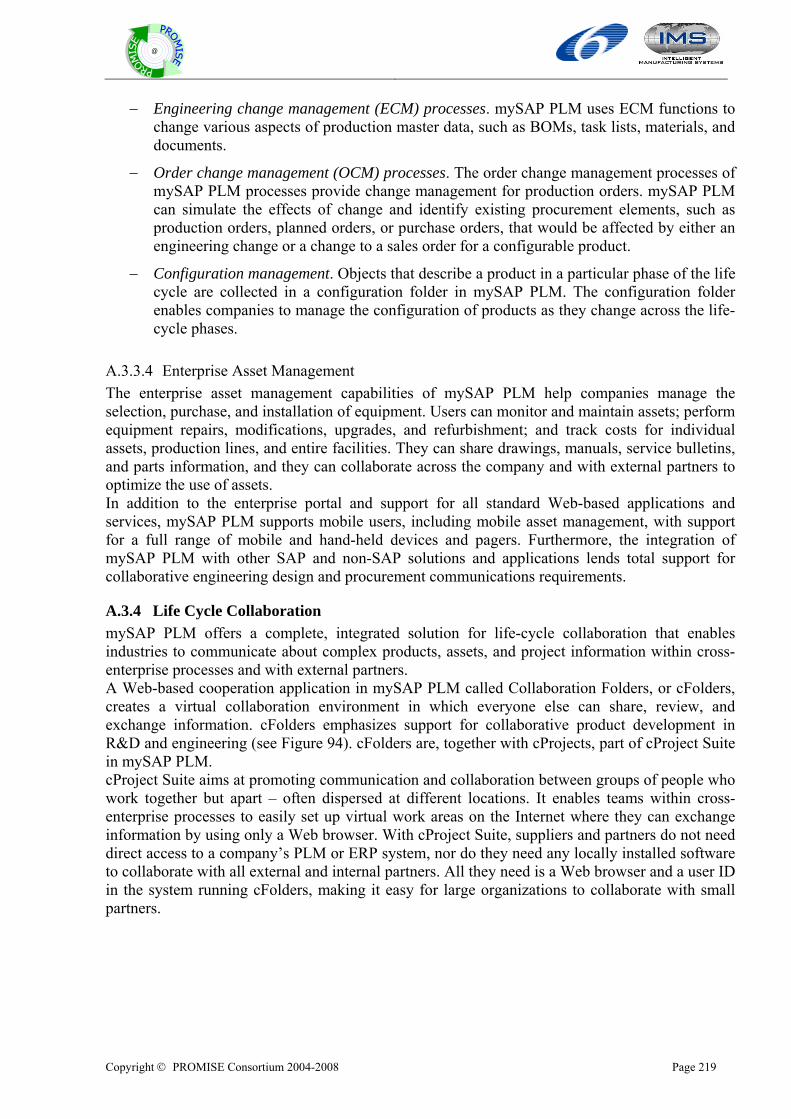
Copyright © PROMISE Consortium 2004-2008 Page 219
@
− Engineering change management (ECM) processes. mySAP PLM uses ECM functions to change various aspects of production master data, such as BOMs, task lists, materials, and documents.
− Order change management (OCM) processes. The order change management processes of mySAP PLM processes provide change management for production orders. mySAP PLM can simulate the effects of change and identify existing procurement elements, such as production orders, planned orders, or purchase orders, that would be affected by either an engineering change or a change to a sales order for a configurable product.
− Configuration management. Objects that describe a product in a particular phase of the life cycle are collected in a configuration folder in mySAP PLM. The configuration folder enables companies to manage the configuration of products as they change across the life-cycle phases.
A.3.3.4 Enterprise Asset Management The enterprise asset management capabilities of mySAP PLM help companies manage the selection, purchase, and installation of equipment. Users can monitor and maintain assets; perform equipment repairs, modifications, upgrades, and refurbishment; and track costs for individual assets, production lines, and entire facilities. They can share drawings, manuals, service bulletins, and parts information, and they can collaborate across the company and with external partners to optimize the use of assets. In addition to the enterprise portal and support for all standard Web-based applications and services, mySAP PLM supports mobile users, including mobile asset management, with support for a full range of mobile and hand-held devices and pagers. Furthermore, the integration of mySAP PLM with other SAP and non-SAP solutions and applications lends total support for collaborative engineering design and procurement communications requirements.
A.3.4 Life Cycle Collaboration mySAP PLM offers a complete, integrated solution for life-cycle collaboration that enables industries to communicate about complex products, assets, and project information within cross-enterprise processes and with external partners. A Web-based cooperation application in mySAP PLM called Collaboration Folders, or cFolders, creates a virtual collaboration environment in which everyone else can share, review, and exchange information. cFolders emphasizes support for collaborative product development in R&D and engineering (see Figure 94). cFolders are, together with cProjects, part of cProject Suite in mySAP PLM. cProject Suite aims at promoting communication and collaboration between groups of people who work together but apart – often dispersed at different locations. It enables teams within cross-enterprise processes to easily set up virtual work areas on the Internet where they can exchange information by using only a Web browser. With cProject Suite, suppliers and partners do not need direct access to a company’s PLM or ERP system, nor do they need any locally installed software to collaborate with all external and internal partners. All they need is a Web browser and a user ID in the system running cFolders, making it easy for large organizations to collaborate with small partners.
Copyright © PROMISE Consortium 2004-2008 Page 220
@
Figure 94: Example – cFolders and Distributed Content Server Architecture Because mySAP PLM supports distributed content servers, users can choose the nearest content server to decrease network traffic and improve access speed. And for users with low bandwidth Internet connections, mySAP PLM handles large files using FTP.
A.4 UGS TeamCenter UGS TeamCenter is a software suite for Product Data Management and Product Lifecycle Management. UGS is one of the biggest international Vendors for the Manufacturing Industry and provides the most enclosing spectrum of software solutions for PLM-Requirements. TeamCenter is a module based solution for the definition and management of digital product models about the whole product lifecycle. It is the first complete solution for the management of a product lifecycle and helps to establish products faster and cheaper on the market. The information that is captured reaches from demands, project data, engineering data, components, documents, product configurations to visualization and collaboration. Its scalable architecture supports the seamless interaction of different applications. The central element of TeamCenter is the digital backbone, which is used by different modules. These modules have different functionalities that can be combined together to shape a new overall solution. In the following section the particular functionalities are presented.
• Application integration – Teamcenter automatically registers files that are saved with a specific application and helps to acquire the information
• Information access – Teamcenter supports a universal search and allows users to search the PLM-Environment with a conventional web browser
• Information safety – Teamcenter manages and secures the knowledge in its databases and supports locking of edited files, versioning, restricted access and encryption
• Product definition – For the participants of a product lifecycle, Teamcenter allows the work in a product-centred scope which connects user, information and processes of a
Copyright © PROMISE Consortium 2004-2008 Page 221
@
company with a series of linked definitions of products, processes, manufacture and maintenance
• Process management – Teamcenter provides robust functions for production runs that enable companies automating the processes in the product lifecycle
• Document management – Teamcenter handles all documents that belong to a product lifecycle and provides a set of functions that includes online enterprise publishing, authoring tools, on demand viewing and automated release function
• Change management – Teamcenter enables companies to plan, to manage and to track product modifications
• Multi-CAD product development – Teamcenter’s multi-CAD ability enables development teams creation or modification of their designs with every popular CAD-system and to assemble these elements to a multi-CAD module
• Development management – The ability of Teamcenter to manage engineering processes easily outreach the conventional CAD file management. It allows managing development specifications, documents, requirements and other types of product information additionally to CAD, CAM and CAE data.
• Repeatable Digital Validation – Teamcenter facilitates the repeatable digital validation and allows developers anytime to analyze product modifications or alternative development concepts in real time
• Multi-Site-Collaboration – Teamcenter facilitates the collaboration of multiple locations with the possibility for development teams to exchange product information and to seamlessly communicate with each other in a global distributed environment
The functionality of this portfolio is combined with each other regarding to the application area. UGS Teamcenter provides different solutions that have been designed for especial application areas.
• Teamcenter Community makes up of mighty collaboration-, conference-tools and visualization software. Teamcenter Community enables improving of business processes that are critical for the product lifecycle.
• Teamcenter Engineering is the leading system for consistent management and allocation of all engineering data through the whole product development process. This covers geometry data and product structures and also other documents as well as all the parallel elapsing processes during the product development, manufacturing and maintenance.
• Teamcenter Enterprise enables extended companies with employees at different locations to bring new products faster, better and with lower costs to the market. For this purpose Teamcenter Enterprise provides the world market leading technologies, whereby extended companies create, store, utilize and manage global distributed product information.
• Teamcenter In-Service supports service organisations with transparency and continuous management of all product information from the first systems-draft to the service-suitable construction, assembly and maintenance offers. All product configurations and statuses of the lifecycle are managed in a single integrated environment. The whole product documentation including requirements, instructions, qualifications and the usage in the lifecycle is available for these product configurations.
• Teamcenter Manufacturing provides solutions based on an established portfolio for accomplishment of the complex requirements in the domain of manufacturing preparations.
• Teamcenter Project is a web native solution, which enables company wide distributed teams corporately to realize and to plan projects by the use of coordinated task- and time-management, as well as real time resource sharing.
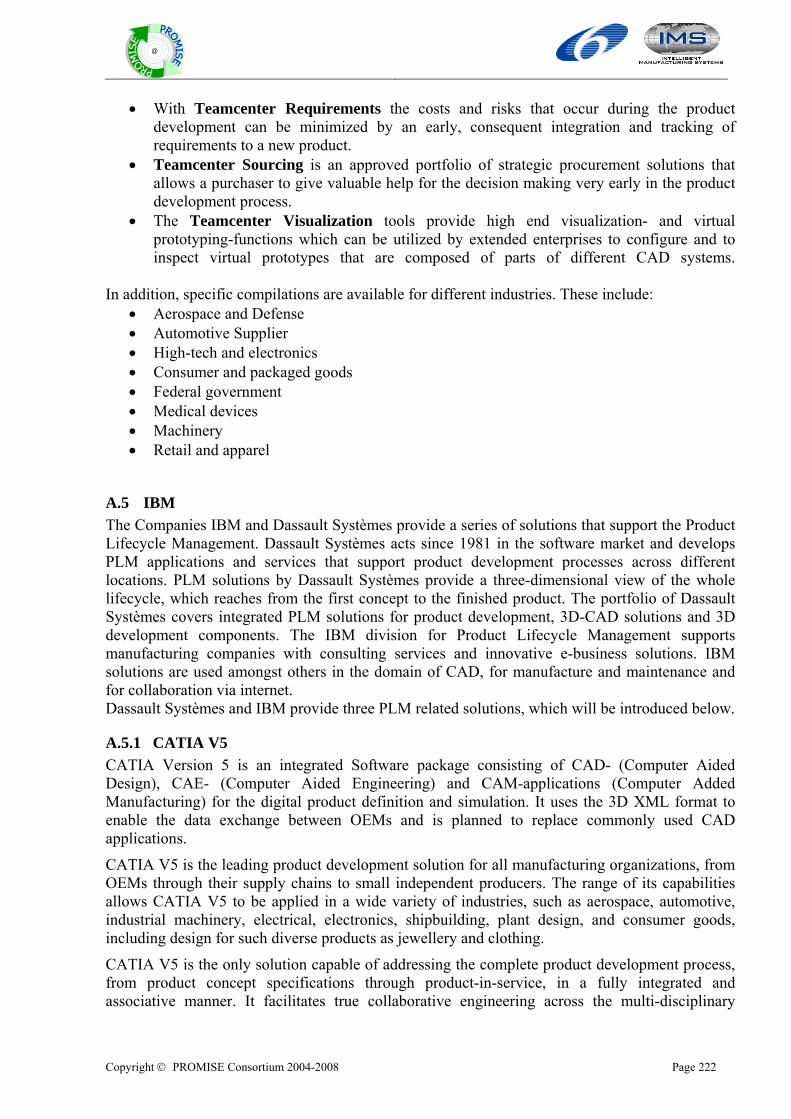
Copyright © PROMISE Consortium 2004-2008 Page 222
@
• With Teamcenter Requirements the costs and risks that occur during the product development can be minimized by an early, consequent integration and tracking of requirements to a new product.
• Teamcenter Sourcing is an approved portfolio of strategic procurement solutions that allows a purchaser to give valuable help for the decision making very early in the product development process.
• The Teamcenter Visualization tools provide high end visualization- and virtual prototyping-functions which can be utilized by extended enterprises to configure and to inspect virtual prototypes that are composed of parts of different CAD systems.
In addition, specific compilations are available for different industries. These include: • Aerospace and Defense • Automotive Supplier • High-tech and electronics • Consumer and packaged goods • Federal government • Medical devices • Machinery • Retail and apparel
A.5 IBM The Companies IBM and Dassault Systèmes provide a series of solutions that support the Product Lifecycle Management. Dassault Systèmes acts since 1981 in the software market and develops PLM applications and services that support product development processes across different locations. PLM solutions by Dassault Systèmes provide a three-dimensional view of the whole lifecycle, which reaches from the first concept to the finished product. The portfolio of Dassault Systèmes covers integrated PLM solutions for product development, 3D-CAD solutions and 3D development components. The IBM division for Product Lifecycle Management supports manufacturing companies with consulting services and innovative e-business solutions. IBM solutions are used amongst others in the domain of CAD, for manufacture and maintenance and for collaboration via internet. Dassault Systèmes and IBM provide three PLM related solutions, which will be introduced below.
A.5.1 CATIA V5 CATIA Version 5 is an integrated Software package consisting of CAD- (Computer Aided Design), CAE- (Computer Aided Engineering) and CAM-applications (Computer Added Manufacturing) for the digital product definition and simulation. It uses the 3D XML format to enable the data exchange between OEMs and is planned to replace commonly used CAD applications.
CATIA V5 is the leading product development solution for all manufacturing organizations, from OEMs through their supply chains to small independent producers. The range of its capabilities allows CATIA V5 to be applied in a wide variety of industries, such as aerospace, automotive, industrial machinery, electrical, electronics, shipbuilding, plant design, and consumer goods, including design for such diverse products as jewellery and clothing.
CATIA V5 is the only solution capable of addressing the complete product development process, from product concept specifications through product-in-service, in a fully integrated and associative manner. It facilitates true collaborative engineering across the multi-disciplinary
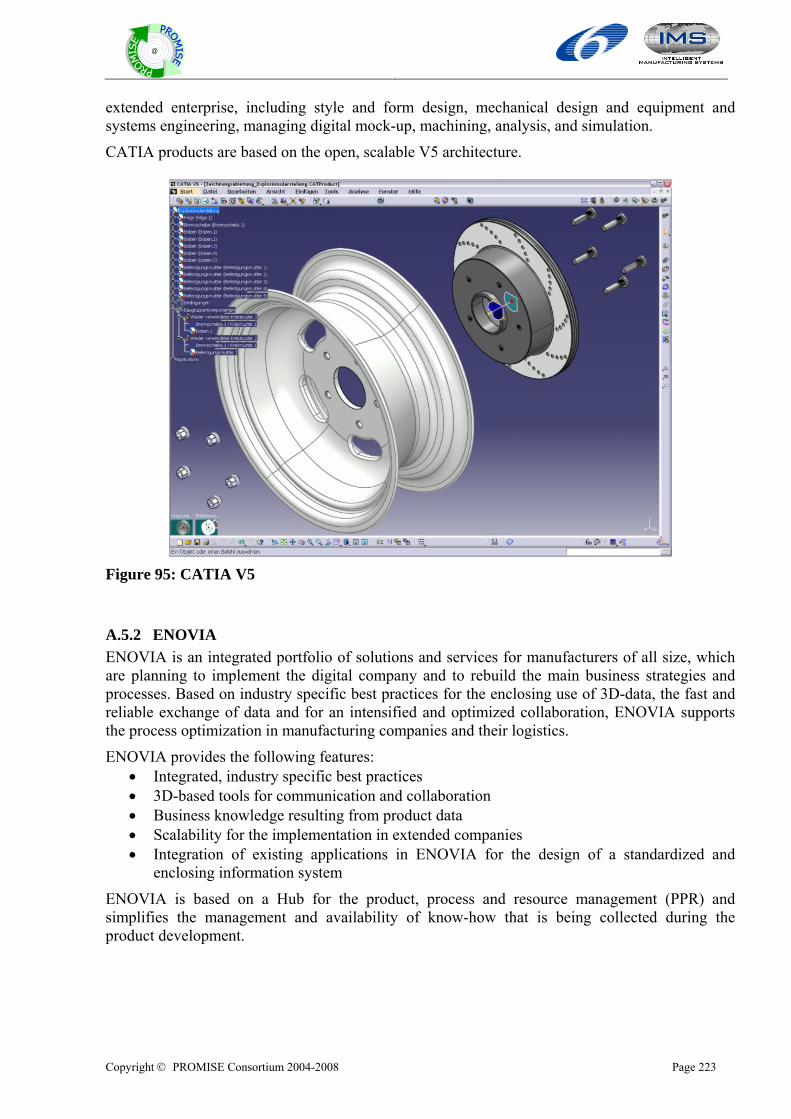
Copyright © PROMISE Consortium 2004-2008 Page 223
@
extended enterprise, including style and form design, mechanical design and equipment and systems engineering, managing digital mock-up, machining, analysis, and simulation.
CATIA products are based on the open, scalable V5 architecture.
Figure 95: CATIA V5
A.5.2 ENOVIA ENOVIA is an integrated portfolio of solutions and services for manufacturers of all size, which are planning to implement the digital company and to rebuild the main business strategies and processes. Based on industry specific best practices for the enclosing use of 3D-data, the fast and reliable exchange of data and for an intensified and optimized collaboration, ENOVIA supports the process optimization in manufacturing companies and their logistics.
ENOVIA provides the following features: • Integrated, industry specific best practices • 3D-based tools for communication and collaboration • Business knowledge resulting from product data • Scalability for the implementation in extended companies • Integration of existing applications in ENOVIA for the design of a standardized and
enclosing information system
ENOVIA is based on a Hub for the product, process and resource management (PPR) and simplifies the management and availability of know-how that is being collected during the product development.
Copyright © PROMISE Consortium 2004-2008 Page 224
@
Figure 96: ENOVIA
A.5.3 Smarteam SMARTEAM captures data directly from CAD constructions, manufacturing and maintenance, distributes it in the company and ensures that it can be utilized in other applications. It provides highly flexible product data management and mission-critical business process management, optimally leveraging product knowledge and driving collaboration across the enterprise and value chain. SMARTEAM delivers highly scalable Microsoft® Windows® and Web-based collaborative Product Lifecycle Management (PLM) products distinguished by rapid implementation, high usability and customizability. SMARTEAM PLM products help companies securely capture, manage and reuse corporate product knowledge across the extended global organization, facilitating innovation, while improving product quality, reducing costs and time-to-market and ensuring compliance with industry standards. Leveraging its open, standards-based architecture, SMARTEAM maintains data integrity throughout the product lifecycle, offering multi-CAD integration, product structure and configuration management, change management, program management, enterprise application integration and value chain collaboration. SMARTEAM provides a robust collaborative platform that plays a major role in PLM industry solutions.
A.6 HP Information Lifecycle Management (text collected and edited from web pages)
A.6.1 Supporting an intelligent, efficient Adaptive Enterprise Multiple industry studies show that the volume of information on the Web, sent through email, and housed in print, film, magnetic and optical storage media continues to explode exponentially. This is a good reason why storage is becoming a critical part of every business discussion – one that should include questions such as:
• How do you best leverage data to help you create new businesses and new customer experiences?
• How do you securely share more information with employees, customers, and partners?
Copyright © PROMISE Consortium 2004-2008 Page 225
@
• How do you make it easier to find the information needed to comply with new government regulations?
• How do find that one email out of a billion?
A.6.2 ILM solutions from HP ILM is not just technology, cheap storage, “archive and forget” or another task for end users. ILM is about turning your data into information that can be put to work to reduce cost and generate new revenue streams. Only HP has the completeness of vision and the ability to deliver ILM solutions that fit your unique needs. HP’s approach to ILM evolves the management of applications, storage, business records and other content to support an intelligent and efficient Adaptive Enterprise. HP offers a comprehensive portfolio of ILM solutions to capture, manage, retain and deliver information according to its value to the organization. Enabled by innovative technology for all stages of the lifecycle, HP ILM solutions align with the needs of specific industries and are supported by a full range of services.
A.6.3 A view of ILM As the name implies, Information Lifecycle Management is about information much more than it is about data. That is, it’s about more than just the storage of bits and bytes in blocks of data that we know nothing about. Put another way: The information part of ILM is all about understanding content and application context that turns that data into information. The lifecycle part of ILM recognizes the fact that an object’s usage requirement change throughout its lifecycle. The management part of ILM refers to the set of customer processes and policies combined with storage technologies and products that together control how data is stored, managed and flows through an IT environment over time. HP’s ILM solutions focus on supporting every phase of this ILM journey.
A.6.4 Continuous availability and continuous protection over the data lifespan Following policy-based data movement, the next phase in the ILM process is to ensure continuous data availability. This means that the data is indexed and content can be searched. It also means that your data is protected and secure within your infrastructure. In this way, your users have continuous long-term access to information through fast search and retrieval – independent of the application that originally created it. Users can also search and retrieve related data created by different applications. HP ILM solutions enable you to normalize and index content, then make it available for search and retrieval while protecting and optimizing stored data. HP’s ILM strategy also enables you to use new continuous data protection and disk-to-disk backup technologies to provide continuous file and database protection for file servers, database servers and even desktops. HP StorageWorks File System Extender is new-generation data management software that is part of the HP Information Lifecycle Management portfolio. File System Extender is a cost effective solution to providing reliable, long-term access to reference information so that information can be put to work throughout its lifecycle. By managing data across storage tiers, FSE allows data volumes to grow beyond the physical limits of the production storage systems. Operation is automatic and transparent with a resulting increase in efficiency of data management, reduction of storage costs and storage capacity growth without disruption. Policies are defined, using a rich set of rules, to manage the file movement and placement. These policies are typically created to maintain active data on the high performance, production storage tier and move inactive data to the lower cost secondary storage tier. A FSE managed file system can be optionally upgraded to a WORM file system.
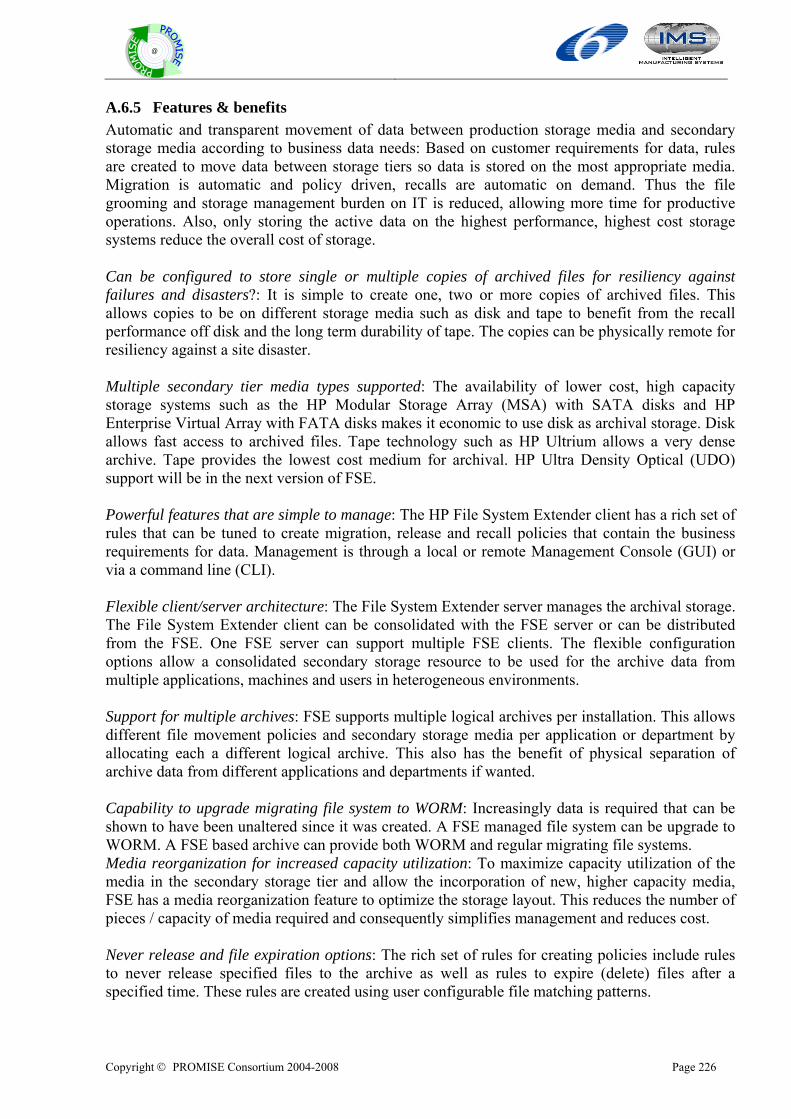
Copyright © PROMISE Consortium 2004-2008 Page 226
@
A.6.5 Features & benefits Automatic and transparent movement of data between production storage media and secondary storage media according to business data needs: Based on customer requirements for data, rules are created to move data between storage tiers so data is stored on the most appropriate media. Migration is automatic and policy driven, recalls are automatic on demand. Thus the file grooming and storage management burden on IT is reduced, allowing more time for productive operations. Also, only storing the active data on the highest performance, highest cost storage systems reduce the overall cost of storage. Can be configured to store single or multiple copies of archived files for resiliency against failures and disasters?: It is simple to create one, two or more copies of archived files. This allows copies to be on different storage media such as disk and tape to benefit from the recall performance off disk and the long term durability of tape. The copies can be physically remote for resiliency against a site disaster. Multiple secondary tier media types supported: The availability of lower cost, high capacity storage systems such as the HP Modular Storage Array (MSA) with SATA disks and HP Enterprise Virtual Array with FATA disks makes it economic to use disk as archival storage. Disk allows fast access to archived files. Tape technology such as HP Ultrium allows a very dense archive. Tape provides the lowest cost medium for archival. HP Ultra Density Optical (UDO) support will be in the next version of FSE. Powerful features that are simple to manage: The HP File System Extender client has a rich set of rules that can be tuned to create migration, release and recall policies that contain the business requirements for data. Management is through a local or remote Management Console (GUI) or via a command line (CLI). Flexible client/server architecture: The File System Extender server manages the archival storage. The File System Extender client can be consolidated with the FSE server or can be distributed from the FSE. One FSE server can support multiple FSE clients. The flexible configuration options allow a consolidated secondary storage resource to be used for the archive data from multiple applications, machines and users in heterogeneous environments. Support for multiple archives: FSE supports multiple logical archives per installation. This allows different file movement policies and secondary storage media per application or department by allocating each a different logical archive. This also has the benefit of physical separation of archive data from different applications and departments if wanted. Capability to upgrade migrating file system to WORM: Increasingly data is required that can be shown to have been unaltered since it was created. A FSE managed file system can be upgrade to WORM. A FSE based archive can provide both WORM and regular migrating file systems. Media reorganization for increased capacity utilization: To maximize capacity utilization of the media in the secondary storage tier and allow the incorporation of new, higher capacity media, FSE has a media reorganization feature to optimize the storage layout. This reduces the number of pieces / capacity of media required and consequently simplifies management and reduces cost. Never release and file expiration options: The rich set of rules for creating policies include rules to never release specified files to the archive as well as rules to expire (delete) files after a specified time. These rules are created using user configurable file matching patterns.
Copyright © PROMISE Consortium 2004-2008 Page 227
@
File system restore and recovery options: FSE has both restore and recovery options to protect the archived data and the archive in case of hardware or software failure without the need for a backup and recovery product.
A.6.6 Lifecycle information HP’s approach to ILM covers every phase of the lifecycle of information – so you can capture, manage, retain and deliver information according to its relevance to your organization and in a way that is consistent with your policies and preferences. ILM solutions from HP span the storage, compute and network infrastructure as well as applications that create information. Unlike competing vendors who only focus on servers, storage or software, HP can support each phase of this lifecycle with complete end-to-end solutions that incorporate the appropriate products and comprehensive services. HP Document Capture solutions provide a simple, flexible and reliable way to accelerate workflows, reduce the cost of operations, and control the risks of information management. These solutions can, for example, help you transform paper documents into electronic records that can be managed and retained by a storage solution like HP StorageWorks Reference Information Storage System (RISS).

Copyright © PROMISE Consortium 2004-2008 Page 228
@
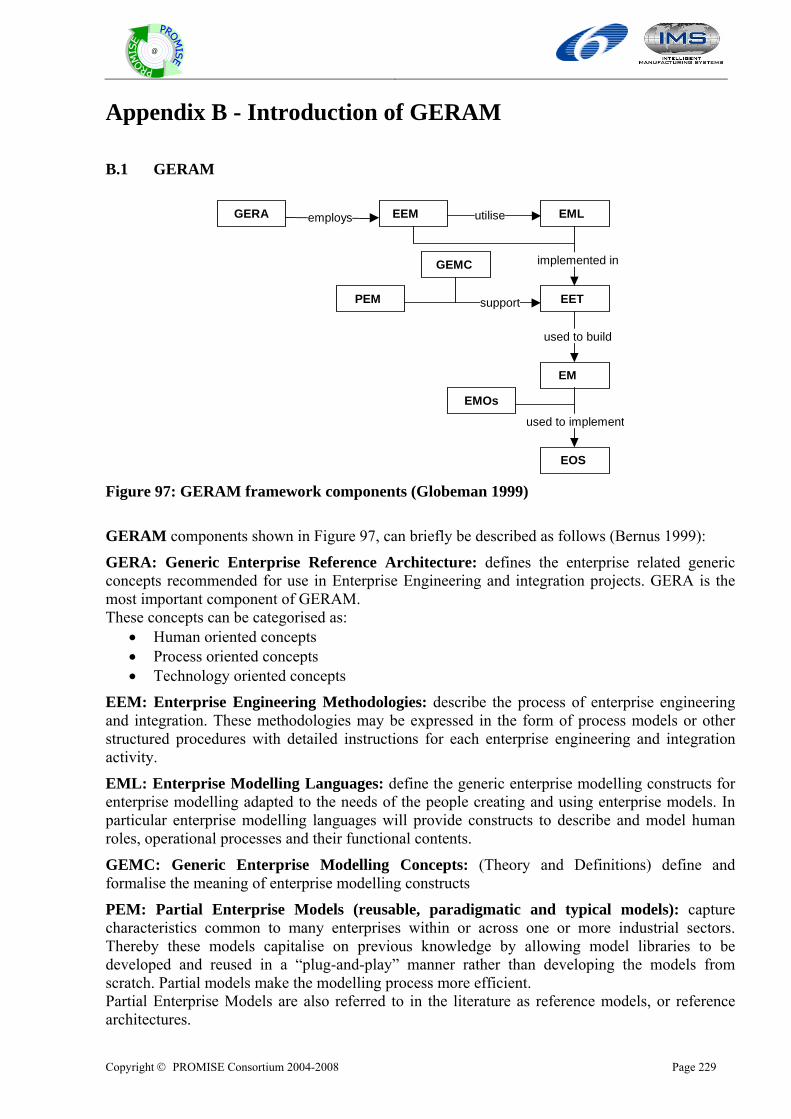
Copyright © PROMISE Consortium 2004-2008 Page 229
@
Appendix B - Introduction of GERAM
B.1 GERAM
GERA EEM EML
EET
GEMC
PEM
EM
EMOs
EOS
employs utilise
implemented in
used to build
used to implement
support
Figure 97: GERAM framework components (Globeman 1999)
GERAM components shown in Figure 97, can briefly be described as follows (Bernus 1999):
GERA: Generic Enterprise Reference Architecture: defines the enterprise related generic concepts recommended for use in Enterprise Engineering and integration projects. GERA is the most important component of GERAM. These concepts can be categorised as:
• Human oriented concepts • Process oriented concepts • Technology oriented concepts
EEM: Enterprise Engineering Methodologies: describe the process of enterprise engineering and integration. These methodologies may be expressed in the form of process models or other structured procedures with detailed instructions for each enterprise engineering and integration activity.
EML: Enterprise Modelling Languages: define the generic enterprise modelling constructs for enterprise modelling adapted to the needs of the people creating and using enterprise models. In particular enterprise modelling languages will provide constructs to describe and model human roles, operational processes and their functional contents.
GEMC: Generic Enterprise Modelling Concepts: (Theory and Definitions) define and formalise the meaning of enterprise modelling constructs
PEM: Partial Enterprise Models (reusable, paradigmatic and typical models): capture characteristics common to many enterprises within or across one or more industrial sectors. Thereby these models capitalise on previous knowledge by allowing model libraries to be developed and reused in a “plug-and-play” manner rather than developing the models from scratch. Partial models make the modelling process more efficient. Partial Enterprise Models are also referred to in the literature as reference models, or reference architectures.
Copyright © PROMISE Consortium 2004-2008 Page 230
@
EET: Enterprise Engineering Tools: support the processes of enterprise engineering and integrating by implementing enterprise engineering methodologies and modelling languages. Engineering tools should provide for analysis, design and use of enterprise models.
EM: Enterprise Models: represent the particular enterprise. Enterprise models can be expressed using enterprise modelling languages. EMs include various designs, models prepared for analysis, executable models to support the operation of the enterprise, etc. They may consist of several models describing various aspects (or views) of the enterprise.
EMO: Enterprise Modules: provide reusable products to be employed in the design, implementation and operation of the integrated enterprise. Examples of enterprise modules are human resources with given skill profiles (specific professions), types of manufacturing resources, common business equipment or IT infrastructure (software and hardware) intended to support the operational use of enterprise models.
EOS: (Partial) Enterprise Operational Systems: support the operation of a particular enterprise. Their implementation is guided by the enterprise engineering designs, which provides the system specifications and identifies the enterprise modules used in the system implementation.
B.1.1 GERA - Generalised Enterprise Reference Architecture GERA defines the enterprise related generic concepts recommended for use in Enterprise Engineering and integration projects. GERA is the most important and developed part of GERAM and a more detailed description of the module is given below. These concepts can be categorised as:
• Human oriented concepts; human roles, the way in which human roles are organized, the capabilities and quality of humans
• Process oriented concepts; deal with enterprise operations (functionality and behaviour) and cover enterprise entity life cycle and life cycle activities
• Technology oriented concepts; deal with various infrastructures used to support processes and include models
B.1.2 Human oriented concepts Information about human has to address several aspects:
• Role of humans in the enterprise and the task they perform • The knowledge and skills possessed by each individual human • Understand the decision-making process • Social needs of employees (wages, salaries, training, vacation, etc.)
GERA requires the role of humans to be developed and expressed. It is consequently necessary to define:
• Human tasks and roles in the enterprise • The organizational structure of the enterprise
B.1.3 Process oriented concepts Business process oriented modelling aims at describing the processes in the enterprise capturing both their functionality (WHAT has to be done) and their behaviour (WHEN things are done). In order to achieve a complete description of the processes a number of concepts have to be recognised in the guiding methodologies: life-cycle and life-cycle activities, life history, enterprise entity type, etc.
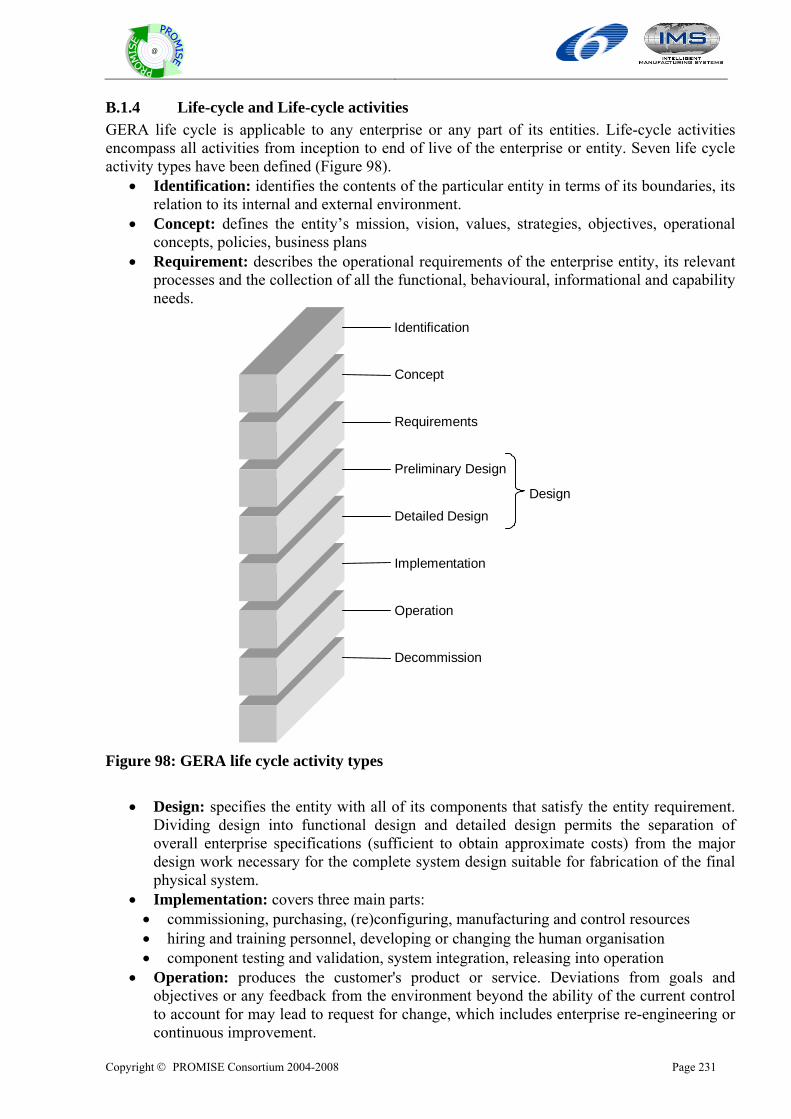
Copyright © PROMISE Consortium 2004-2008 Page 231
@
B.1.4 Life-cycle and Life-cycle activities GERA life cycle is applicable to any enterprise or any part of its entities. Life-cycle activities encompass all activities from inception to end of live of the enterprise or entity. Seven life cycle activity types have been defined (Figure 98).
• Identification: identifies the contents of the particular entity in terms of its boundaries, its relation to its internal and external environment.
• Concept: defines the entity’s mission, vision, values, strategies, objectives, operational concepts, policies, business plans
• Requirement: describes the operational requirements of the enterprise entity, its relevant processes and the collection of all the functional, behavioural, informational and capability needs.
Design
Identification
Concept
Requirements
Preliminary Design
Operation
Implementation
Detailed Design
Decommission
Figure 98: GERA life cycle activity types
• Design: specifies the entity with all of its components that satisfy the entity requirement.
Dividing design into functional design and detailed design permits the separation of overall enterprise specifications (sufficient to obtain approximate costs) from the major design work necessary for the complete system design suitable for fabrication of the final physical system.
• Implementation: covers three main parts: • commissioning, purchasing, (re)configuring, manufacturing and control resources • hiring and training personnel, developing or changing the human organisation • component testing and validation, system integration, releasing into operation
• Operation: produces the customer's product or service. Deviations from goals and objectives or any feedback from the environment beyond the ability of the current control to account for may lead to request for change, which includes enterprise re-engineering or continuous improvement.
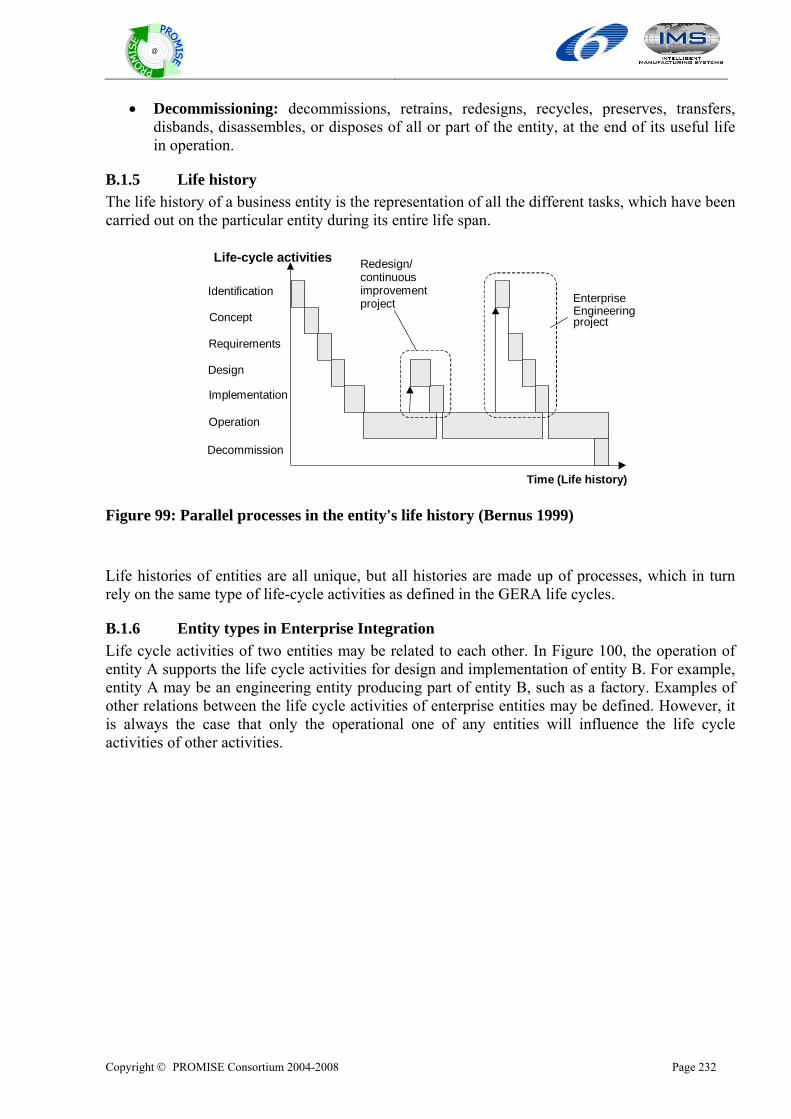
Copyright © PROMISE Consortium 2004-2008 Page 232
@
• Decommissioning: decommissions, retrains, redesigns, recycles, preserves, transfers, disbands, disassembles, or disposes of all or part of the entity, at the end of its useful life in operation.
B.1.5 Life history The life history of a business entity is the representation of all the different tasks, which have been carried out on the particular entity during its entire life span.
Operation
Decommission
Implementation
Design
Requirements
Concept
Identification
Life-cycle activities
Time (Life history)
Redesign/continuousimprovementproject Enterprise
Engineeringproject
Figure 99: Parallel processes in the entity's life history (Bernus 1999)
Life histories of entities are all unique, but all histories are made up of processes, which in turn rely on the same type of life-cycle activities as defined in the GERA life cycles.
B.1.6 Entity types in Enterprise Integration Life cycle activities of two entities may be related to each other. In Figure 100, the operation of entity A supports the life cycle activities for design and implementation of entity B. For example, entity A may be an engineering entity producing part of entity B, such as a factory. Examples of other relations between the life cycle activities of enterprise entities may be defined. However, it is always the case that only the operational one of any entities will influence the life cycle activities of other activities.
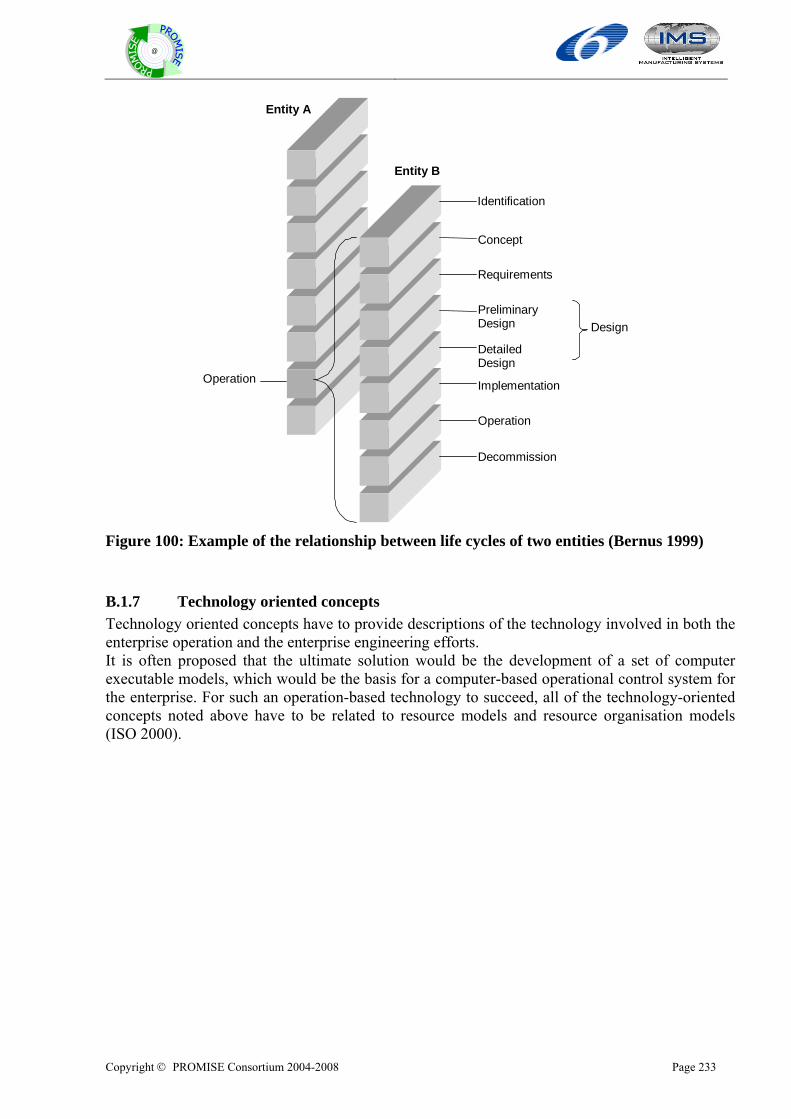
Copyright © PROMISE Consortium 2004-2008 Page 233
@
Design
Identification
Concept
Requirements
PreliminaryDesign
Operation
Implementation
DetailedDesign
Decommission
Entity A
Entity B
Operation
Figure 100: Example of the relationship between life cycles of two entities (Bernus 1999)
B.1.7 Technology oriented concepts Technology oriented concepts have to provide descriptions of the technology involved in both the enterprise operation and the enterprise engineering efforts. It is often proposed that the ultimate solution would be the development of a set of computer executable models, which would be the basis for a computer-based operational control system for the enterprise. For such an operation-based technology to succeed, all of the technology-oriented concepts noted above have to be related to resource models and resource organisation models (ISO 2000).
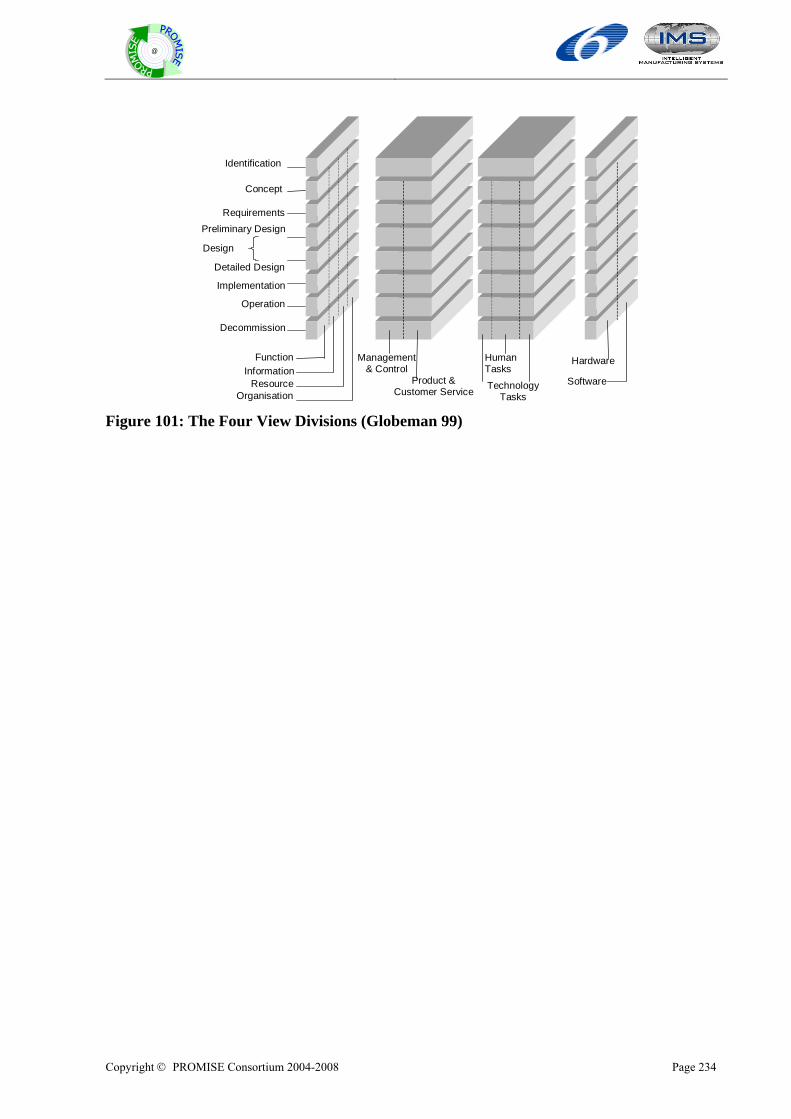
Copyright © PROMISE Consortium 2004-2008 Page 234
@
Design
Identification
Concept
RequirementsPreliminary Design
Operation
Implementation
Detailed Design
Decommission
FunctionInformation
ResourceOrganisation
Management& Control
Product &Customer Service
HumanTasks
TechnologyTasks
Hardware
Software
Figure 101: The Four View Divisions (Globeman 99)
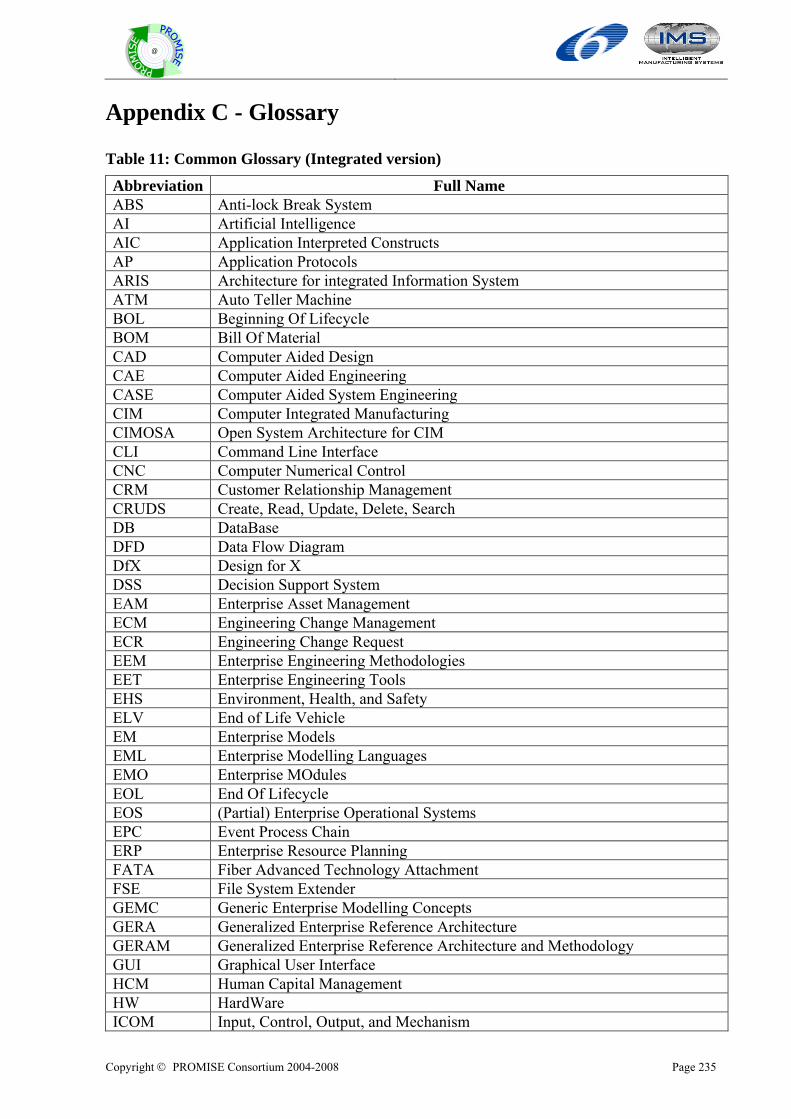
Copyright © PROMISE Consortium 2004-2008 Page 235
@
Appendix C - Glossary
Table 11: Common Glossary (Integrated version)
Abbreviation Full Name ABS Anti-lock Break System AI Artificial Intelligence AIC Application Interpreted Constructs AP Application Protocols ARIS Architecture for integrated Information System ATM Auto Teller Machine BOL Beginning Of Lifecycle BOM Bill Of Material CAD Computer Aided Design CAE Computer Aided Engineering CASE Computer Aided System Engineering CIM Computer Integrated Manufacturing CIMOSA Open System Architecture for CIM CLI Command Line Interface CNC Computer Numerical Control CRM Customer Relationship Management CRUDS Create, Read, Update, Delete, Search DB DataBase DFD Data Flow Diagram DfX Design for X DSS Decision Support System EAM Enterprise Asset Management ECM Engineering Change Management ECR Engineering Change Request EEM Enterprise Engineering Methodologies EET Enterprise Engineering Tools EHS Environment, Health, and Safety ELV End of Life Vehicle EM Enterprise Models EML Enterprise Modelling Languages EMO Enterprise MOdules EOL End Of Lifecycle EOS (Partial) Enterprise Operational Systems EPC Event Process Chain ERP Enterprise Resource Planning FATA Fiber Advanced Technology Attachment FSE File System Extender GEMC Generic Enterprise Modelling Concepts GERA Generalized Enterprise Reference Architecture GERAM Generalized Enterprise Reference Architecture and Methodology GUI Graphical User Interface HCM Human Capital Management HW HardWare ICOM Input, Control, Output, and Mechanism
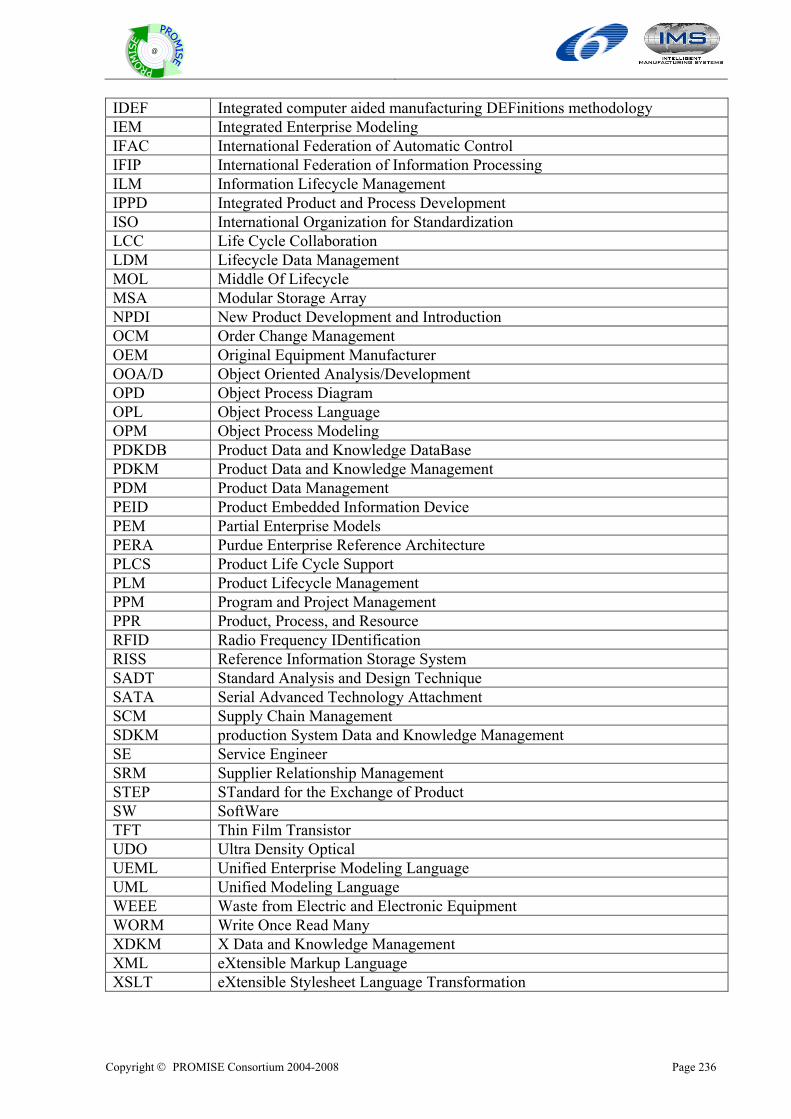
Copyright © PROMISE Consortium 2004-2008 Page 236
@
IDEF Integrated computer aided manufacturing DEFinitions methodology IEM Integrated Enterprise Modeling IFAC International Federation of Automatic Control IFIP International Federation of Information Processing ILM Information Lifecycle Management IPPD Integrated Product and Process Development ISO International Organization for Standardization LCC Life Cycle Collaboration LDM Lifecycle Data Management MOL Middle Of Lifecycle MSA Modular Storage Array NPDI New Product Development and Introduction OCM Order Change Management OEM Original Equipment Manufacturer OOA/D Object Oriented Analysis/Development OPD Object Process Diagram OPL Object Process Language OPM Object Process Modeling PDKDB Product Data and Knowledge DataBase PDKM Product Data and Knowledge Management PDM Product Data Management PEID Product Embedded Information Device PEM Partial Enterprise Models PERA Purdue Enterprise Reference Architecture PLCS Product Life Cycle Support PLM Product Lifecycle Management PPM Program and Project Management PPR Product, Process, and Resource RFID Radio Frequency IDentification RISS Reference Information Storage System SADT Standard Analysis and Design Technique SATA Serial Advanced Technology Attachment SCM Supply Chain Management SDKM production System Data and Knowledge Management SE Service Engineer SRM Supplier Relationship Management STEP STandard for the Exchange of Product SW SoftWare TFT Thin Film Transistor UDO Ultra Density Optical UEML Unified Enterprise Modeling Language UML Unified Modeling Language WEEE Waste from Electric and Electronic Equipment WORM Write Once Read Many XDKM X Data and Knowledge Management XML eXtensible Markup Language XSLT eXtensible Stylesheet Language Transformation