dr. james p. gaines - narcnarc.org/uploads/jim gaines.pdf · dr. james p. gaines research economist...
TRANSCRIPT

Dr. James P. Gaines Research Economist Real Estate Center
at Texas A&M University www.recenter.tamu.edu

Publications Tierra Grande
is our quarterly magazine with
timely research and analysis of the
trends and events shaping Texas
real estate today. Experts on
appraisal, housing , finance, law,
demography, economics,
investment and other areas share
insights unavailable anywhere
else.
Planning to invest in Texas real estate? Are you
looking for local real estate market information for
Texas cities? Click here for extensive data for every
metro area in the Lone Star state. Our reports include
employment trends, population, residential, multi-
family, office, industrial and retail information.
Market Reports
http://recenter.tamu.edu
REAL ESTATE CENTER at TEXAS A&M UNIVERSITY
Mays Business School
Data Building permits
Employment
Home Sales
Housing
Affordability
Population Rural Land
RECON Newsletter You'll be an insider – if you subscribe to
our electronic newsletter RECON.
RECON is an acronym for Real Estate
Center Online News. It's a twice-weekly
briefing on Texas real estate news.
Currently more than 20,000 subscribers
worldwide are signed on. Best of all,
RECON is free. RECON
News Releases
Events
Calendar
Videos
TRECI Index
News
Happy New Year! The staff of the Real
Estate Center wish you and yours a happy
and prosperous new year! This year marks
the 35th anniversary of the Real Estate
Center. In 1971, Gov. Preston Smith signed
legislation creating the Texas Real Estate
Research Center and placed it at Texas
A&M University.
Instructor Training Courses, May 18-19,
College Station, Texas. The Legal Update
and Ethics instructor training courses
include credit for the required 3-hour Legal
Update course and the required 3-hour
Ethics course. In addition, each instructor
training course will include a brief orientation
to the teacher’s manuals for each course as
well as a discussion of training issues.
Events Calendar

We’ve Spent a Lot of Time Around the Ole Water Cooler
3

Characteristics of This Recession
4
• A 0% funds rate, $1.4 trillion budget deficit and a $2.2
trillion Fed balance sheet
• Nearly one-third of homeowners have negative equity
• 1 in 6 are either unemployed or underemployed.
• 1 in 7 homeowners either delinquent or in the foreclosure
process
• 20% - 30% slide in home prices
• 40% - 50% plunge in commercial real estate values
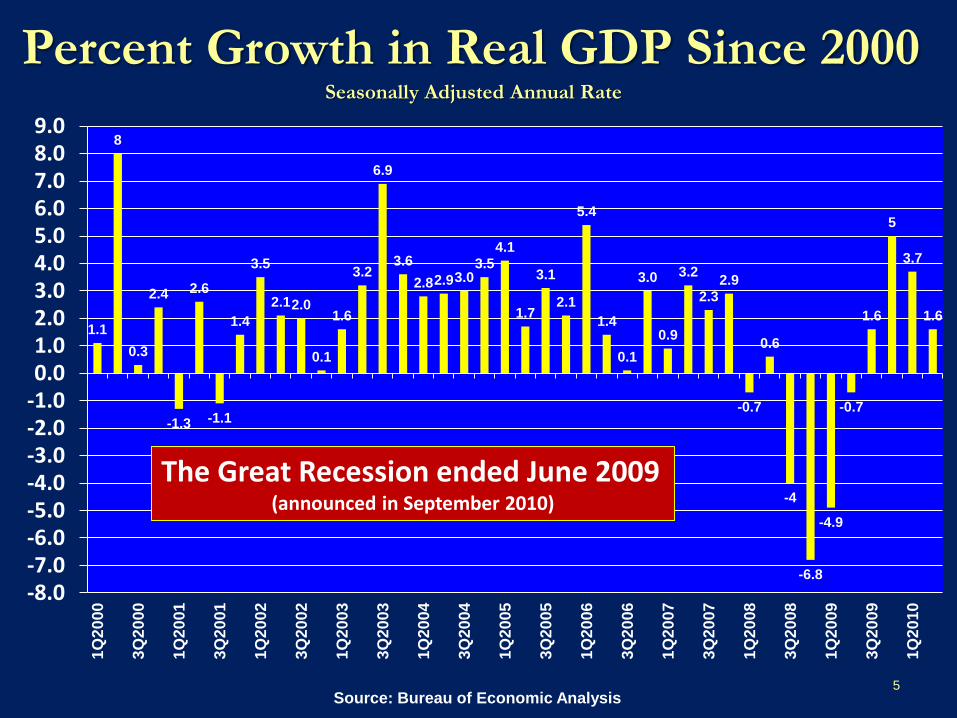
Percent Growth in Real GDP Since 2000 Seasonally Adjusted Annual Rate
1.1
8
0.3
2.4
-1.3
2.6
-1.1
1.4
3.5
2.1 2.0
0.1
1.6
3.2
6.9
3.6
2.8 2.9 3.0 3.5
4.1
1.7
3.1
2.1
5.4
1.4
0.1
3.0
0.9
3.2
2.3
2.9
-0.7
0.6
-4
-6.8
-4.9
-0.7
1.6
5
3.7
1.6
-8.0-7.0-6.0-5.0-4.0-3.0-2.0-1.00.01.02.03.04.05.06.07.08.09.0
1Q
20
00
3Q
20
00
1Q
20
01
3Q
20
01
1Q
20
02
3Q
20
02
1Q
20
03
3Q
20
03
1Q
20
04
3Q
20
04
1Q
20
05
3Q
20
05
1Q
20
06
3Q
20
06
1Q
20
07
3Q
20
07
1Q
20
08
3Q
20
08
1Q
20
09
3Q
20
09
1Q
20
10
5 Source: Bureau of Economic Analysis
The Great Recession ended June 2009 (announced in September 2010)

Personal Consumption Expenditures
Source: Department of Commerce, SAAR
6,000
7,000
8,000
9,000
10,000
11,000J
an
-00
Ma
y-0
0
Se
p-0
0
Ja
n-0
1
Ma
y-0
1
Se
p-0
1
Ja
n-0
2
Ma
y-0
2
Se
p-0
2
Ja
n-0
3
Ma
y-0
3
Se
p-0
3
Ja
n-0
4
Ma
y-0
4
Se
p-0
4
Jan
-05
Ma
y-0
5
Se
p-0
5
Ja
n-0
6
Ma
y-0
6
Se
p-0
6
Ja
n-0
7
May-0
7
Se
p-0
7
Ja
n-0
8
Ma
y-0
8
Se
p-0
8
Ja
n-0
9
Ma
y-0
9
Se
p-0
9
Ja
n-1
0
Ma
y-1
0
Se
p-1
0
Ja
n-1
1
Bil
lio
ns
of
Do
lla
rs
Personal consumption represents
about 70% of US economy and is
showing signs of recovery

Annual Employment Growth Rates
for US and Texas
-6.0
-5.0
-4.0
-3.0
-2.0
-1.0
0.0
1.0
2.0
3.0
4.0
5.0
Jan
-01
Ma
y-0
1
Sep
-01
Jan
-02
Ma
y-0
2
Sep
-02
Jan
-03
Ma
y-0
3
Sep
-03
Jan
-04
Ma
y-0
4
Sep
-04
Jan
-05
Ma
y-0
5
Sep
-05
Jan
-06
Ma
y-0
6
Sep
-06
Jan
-07
Ma
y-0
7
Sep
-07
Jan
-08
Ma
y-0
8
Sep
-08
Jan
-09
Ma
y-0
9
Sep
-09
Jan
-10
Ma
y-1
0
Sep
-10
Jan
-11
7
Texas
US
Source: BLS

Measures of Un- and Underemployment
3
4
5
6
7
8
9
10
11
12
13
14
15
16
17
18
19
1994
1995
1996
1997
1998
1999
2000
2001
2002
2003
2004
2005
2006
2007
2008
2009
2010
8 Source: BLS
Percent SA
U-6, the broadest measure
Headline Rate Texas

Unemployment Rate by Level of Education June 2010
14.1
10.8
8.2
4.4
0.0
2.0
4.0
6.0
8.0
10.0
12.0
14.0
16.0
18.0
No High SchoolDiploma
High School Diploma Some College College Degree+
2008 2009 Current
9 Source: BLS , 25-years old +; Seasonally adjusted rates

Even Universities Laying People Off , Faculty Are Taking Whatever Jobs They find

Are There Secular Changes Going On
Given Economy, Credit Collapse and
Household Net Worth Implosion?
• Debt vs. Savings
– Credit Contraction & Thrift
• Discretionary spending patterns
– Marginal spending vs. savings in period
of declining personal income
• Homeownership
– Maybe everyone doesn’t need to own a
home
• Deflationary vs. Inflationary Expectations 11

Monthly Core Inflation Rate (CPI Minus Food & Energy)
0.5%
1.0%
1.5%
2.0%
2.5%
3.0%
3.5%
Jan
-96
Ap
r-96
Ju
l-96
Oct-
96
Jan
-97
Ap
r-97
Ju
l-97
Oct-
97
Jan
-98
Ap
r-98
Ju
l-98
Oct-
98
Jan
-99
Ap
r-99
Ju
l-99
Oct-
99
Jan
-00
Ap
r-00
Ju
l-00
Oct-
00
Jan
-01
Ap
r-01
Ju
l-01
Oct-
01
Jan
-02
Ap
r-02
Ju
l-02
Oct-
02
Jan
-03
Ap
r-03
Ju
l-03
Oct-
03
Jan
-04
Ap
r-04
Ju
l-04
Oct-
04
Jan
-05
Ap
r-05
Ju
l-05
Oct-
05
Jan
-06
Ap
r-06
Ju
l-06
Oct-
06
Jan
-07
Ap
r-07
Ju
l-07
Oct-
07
Jan
-08
Ap
r-08
Ju
l-08
Oct-
08
Jan
-09
Ap
r-09
Ju
l-09
Oct-
09
Jan
-10
Ap
r-10
Ju
l-10
Oct-
10
Jan
-11
12
Source: Bureau of Labor Statistics Yr/Yr Rate of Change in the Monthly Index, US Urban, All Items
Deflationary pressures building for short-term;
long-term may be another matter

Summary
13
• American Consumers are fixing their balance sheet
and returning to the stores.
• American businesses have right-sized and returned to
profitability.
• Business owners are still frozen with uncertainty and
sitting on cash.
• States, cities, counties and school districts will have to
right-size their spending.
• Federal policies may create long-term problems with
tighter credit and higher taxes.
• The “extend and pretend” gambit in the banking
system will retard growth until it’s resolved.
• Housing not leading US economy out of recession

Wow, back in 1990, the Government
seized the Mustang Ranch brothel in
Nevada for tax evasion and, as
required by law, tried to run it.
They failed, and it closed.
A Thought from Maxine "BAIL EM OUT! ????”
Now we are trusting the auto industry, the
banking system and healthcare to the
same nit-wits who couldn't make money
running a whore house and selling
whiskey! 14

15
The Housing Market

Current Housing Issues
• Tax credit limited impact
• Lower demand, foreclosures and homebuilder
concessions depressing home prices
• Foreclosures still major concern nationally
• Appraisals are major issue in purchases
• Lenders making mortgages difficult to obtain
• ADC loans virtually non-existent in most of the
country
• Lowest mortgage rates in 50 years, no help
• Affordability operative market word
16

17
Bentley's First Law of Economics: The only
thing more dangerous than an economist is
an amateur economist!
Bentley's Second Law of Economics :
"The only thing more dangerous than an
amateur economist is a professional
economist."

Lost Wealth: Households’ Equity in Real
Estate 2005, $13,139
2Q2010, $6,968
0
2,000
4,000
6,000
8,000
10,000
12,000
14,00019
55
19
561
957
19
581
959
196
01
961
19
621
963
19
6419
65
19
661
967
19
681
969
197
01
971
19
721
973
19
7419
75
19
761
977
19
781
979
19
801
981
19
821
983
19
841
985
19
861
987
19
881
989
19
901
991
19
921
993
19
941
995
19
961
997
19
981
999
20
002
001
20
022
003
20
042
005
20
062
007
20
082
009
2Q2
01
0
Bill
ion
s $
Source: Federal Reserve, Flow of Funds, B-100
$6.2 trillion or 47% in lost real estate equity

19
62.0
63.0
64.0
65.0
66.0
67.0
68.0
69.0
70.0
2Q
197
1
2Q
197
2
2Q
197
3
2Q
197
4
2Q
197
5
2Q
197
6
2Q
1977
2Q
197
8
2Q
197
9
2Q
198
0
2Q
198
1
2Q
198
2
2Q
198
3
2Q
198
4
2Q
198
5
2Q
198
6
2Q
198
7
2Q
198
8
2Q
198
9
2Q
199
0
2Q
199
1
2Q
199
2
2Q
199
3
2Q
199
4
2Q
199
5
2Q
199
6
2Q
199
7
2Q
199
8
2Q
199
9
2Q
2000
2Q
200
1
2Q
200
2
2Q
200
3
2Q
200
4
2Q
200
5
2Q
200
6
2Q
200
7
2Q
200
8
2Q
200
9
2Q
2010
US Homeownership Rate
Source: US Census Bureau; FHLMC (4-quarter moving average homeownership rate)
1970s
Baby Boomers enter
market;
homeownership grows 1995-2005
Low interest
rates and new
mortgage
products;
Homeownership
explodes
(Percent)

0.0
2.0
4.0
6.0
8.0
10.0
12.0
14.0
16.0
18.0
20.0
22.0
24.0
26.0
28.0
30.01Q
1998
2Q
1998
3Q
1998
4Q
1998
1Q
1999
2Q
1999
3Q
1999
4Q
1999
1Q
2000
2Q
2000
3Q
2000
4Q
2000
1Q
2001
2Q
2001
3Q
2001
4Q
2001
1Q
2002
2Q
2002
3Q
2002
4Q
2002
1Q
2003
2Q
2003
3Q
2003
4Q
2003
1Q
2004
2Q
2004
3Q
2004
4Q
2004
1Q
2005
2Q
2005
3Q
2005
4Q
2005
1Q
2006
2Q
2006
3Q
2006
4Q
2006
1Q
2007
2Q
2007
3Q
2007
4Q
2007
1Q
2008
2Q
2008
3Q
2008
4Q
2008
1Q
2009
2Q
2009
3Q
2009
4Q
2009
1Q
2010
2Q
2010
Pe
rce
nt
of
Lo
an
s
Source: Mortgage Bankers Association, National Delinquency Survey
US Mortgage Delinquency Rates
All Mortgages
Prime Mortgages
Subprime Mortgages
US mortgage delinquency rate set all
time high in 4Q2009

Monthly Foreclosure Filings
0
10,000
20,000
30,000
40,000
50,000
60,000
70,000
80,000
90,000
100,000
110,000
120,000
130,000
140,000
150,000
160,000J
un
-05
Au
g-0
5
Oct-
05
De
c-0
5
Fe
b-0
6
Ap
r-06
Ju
n-0
6
Au
g-0
6
Oct-
06
De
c-0
6
Fe
b-0
7
Ap
r-07
Ju
n-0
7
Au
g-0
7
Oct-
07
De
c-0
7
Fe
b-0
8
Ap
r-08
Ju
n-0
8
Au
g-0
8
Oct-
08
De
c-0
8
Fe
b-0
9
Ap
r-09
Ju
n-0
9
Au
g-0
9
Oct-
09
De
c-0
9
Fe
b-1
0
Ap
r-10
Ju
n-1
0
Au
g-1
0
US
Texas
Source: RealtyTrac, Inc. Data include Notices of Trustee Sales plus Notices of Foreclosure Sale
21
Texas foreclosures have been
far more stable than US

Foreclosure Filings and the U.S.
Unemployment Rate
0.0
1.0
2.0
3.0
4.0
5.0
6.0
7.0
8.0
9.0
10.0
11.0
0
15,000
30,000
45,000
60,000
75,000
90,000
105,000
120,000
135,000
150,000
165,000
180,000J
an
-06
Ma
r-0
6
Ma
y-0
6
Ju
l-06
Sep
-06
No
v-0
6
Jan
-07
Ma
r-0
7
Ma
y-0
7
Ju
l-07
Sep
-07
No
v-0
7
Jan
-08
Ma
r-0
8
Ma
y-0
8
Ju
l-08
Sep
-08
No
v-0
8
Jan
-09
Ma
r-0
9
Ma
y-0
9
Ju
l-09
Sep
-09
No
v-0
9
Jan
-10
Ma
r-1
0
Ma
y-1
0
Ju
l-10
Un
em
plo
ym
en
t R
ate
Fo
rec
los
ure
Filin
gs
22 Sources: BLS, RealtyTrac, Inc. Foreclosure Filings include Notices of Trustee Sales plus Notices of Foreclosure Sale

23
$75,000
$100,000
$125,000
$150,000
$175,000
$200,000
$225,000
$250,000
Ja
n-9
0
Ju
l-90
Ja
n-9
1
Ju
l-91
Ja
n-9
2
Ju
l-92
Ja
n-9
3
Ju
l-93
Ja
n-9
4
Ju
l-94
Ja
n-9
5
Ju
l-95
Ja
n-9
6
Ju
l-96
Ja
n-9
7
Ju
l-97
Ja
n-9
8
Ju
l-98
Ja
n-9
9
Ju
l-99
Ja
n-0
0
Ju
l-00
Ja
n-0
1
Ju
l-01
Ja
n-0
2
Ju
l-02
Ja
n-0
3
Ju
l-03
Ja
n-0
4
Ju
l-04
Ja
n-0
5
Ju
l-05
Ja
n-0
6
Ju
l-06
Ja
n-0
7
Ju
l-07
Ja
n-0
8
Ju
l-08
Ja
n-0
9
Ju
l-09
Ja
n-1
0
Ju
l-10
Source: NAR, Real Estate Center at Texas A&M University
US Median Home Prices Since 1990
National House Price Bubble
12-Month Moving Average
Since 2001
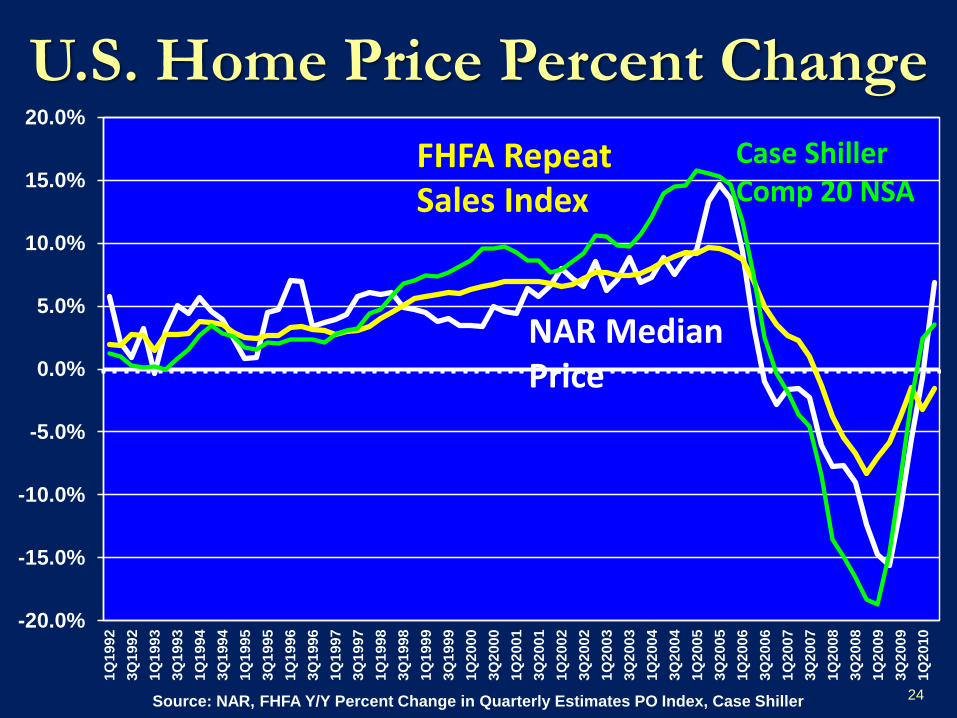
U.S. Home Price Percent Change
-20.0%
-15.0%
-10.0%
-5.0%
0.0%
5.0%
10.0%
15.0%
20.0%1Q
1992
3Q
1992
1Q
1993
3Q
19
93
1Q
1994
3Q
1994
1Q
1995
3Q
1995
1Q
1996
3Q
1996
1Q
1997
3Q
1997
1Q
1998
3Q
1998
1Q
1999
3Q
1999
1Q
2000
3Q
2000
1Q
2001
3Q
2001
1Q
2002
3Q
2002
1Q
2003
3Q
2003
1Q
2004
3Q
2004
1Q
2005
3Q
2005
1Q
2006
3Q
2006
1Q
20
07
3Q
2007
1Q
2008
3Q
2008
1Q
2009
3Q
2009
1Q
2010
24 Source: NAR, FHFA Y/Y Percent Change in Quarterly Estimates PO Index, Case Shiller
FHFA Repeat Sales Index
NAR Median Price
Case Shiller Comp 20 NSA

National Housing Affordability Index
Feb-99, 146.9
Jul-00, 122.8
Apr-03, 145.4
Jul-06, 99.6
Apr-09, 184
90
100
110
120
130
140
150
160
170
180
190
Jan
-94
Ju
l-9
4
Jan
-95
Ju
l-9
5
Jan
-96
Ju
l-96
Jan
-97
Ju
l-9
7
Jan
-98
Ju
l-9
8
Jan
-99
Ju
l-9
9
Jan
-00
Ju
l-0
0
Jan
-01
Ju
l-0
1
Jan
-02
Ju
l-0
2
Jan
-03
Ju
l-0
3
Jan
-04
Ju
l-0
4
Jan
-05
Ju
l-0
5
Jan
-06
Ju
l-0
6
Jan
-07
Ju
l-0
7
Jan
-08
Ju
l-0
8
Jan
-09
Ju
l-0
9
Jan
-10
Ju
l-1
0
Jan
-11
25 Source: NAR Composite Index
Average 1994-2003 = 132.4
Drop of 31.5% from
April 2003 to July
2006

Existing Home Sales
1567 1593 1613
2021
2254 2334 2273
2480
3066
3646
3987 3828
2972
2418
1990
2684 2817
3122
3478 3428 3483
3010 2914 2885
3150
3427 3544 3519
3797 3964
4495 4651 4604
4733
4,974
5,443
5,959
6,179
5,677
4,939
4,350
4,566
0
1,000
2,000
3,000
4,000
5,000
6,000
7,0001
96
8
196
9
197
0
197
1
197
2
197
3
197
4
197
5
197
6
197
7
197
8
197
9
198
0
198
1
198
2
198
3
198
4
198
5
198
6
198
7
198
8
198
9
199
0
199
1
199
2
199
3
199
4
199
5
199
6
199
7
199
8
199
9
200
0
200
1
200
2
200
3
200
4
200
5
200
6
200
7
200
8
200
9
Tho
usa
nd
s
26 Source: NAR
1978-1982 sales declined 50%
2005-2009YTD sales down 34%

27
0
1,000
2,000
3,000
4,000
5,000
6,000
7,000Jan
-95
Ju
l-95
Jan
-96
Ju
l-96
Jan
-97
Ju
l-97
Jan
-98
Ju
l-98
Jan
-99
Ju
l-99
Jan
-00
Ju
l-00
Jan
-01
Ju
l-01
Jan
-02
Ju
l-02
Jan
-03
Ju
l-03
Jan
-04
Ju
l-04
Jan
-05
Ju
l-05
Jan
-06
Ju
l-06
Jan
-07
Ju
l-07
Jan
-08
Ju
l-08
Jan
-09
Ju
l-09
Jan
-10
Ju
l-10
Jan
-11
Sources: US Census Bureau , NAR, NAHB, NBER
(000s)
Existing SF sales are down 21% from 2005 peak
New SF sales are down 78% from 2005 peak
New and Existing SF Home Sales U.S.
Average Annual Home Sales:
Years New Homes Existing Homes
1990-1997 650,000 3.4 million
1998-2002 900,000 4.7 million
2003-2007 1,078,000 5.7 million
2008- 2009 428,000 4.45 million

Months Inventory of New and
Existing Homes 12.1
11.0
3.0
4.0
5.0
6.0
7.0
8.0
9.0
10.0
11.0
12.0
13.0
Jan
-00
Ap
r-00
Ju
l-00
Oct-
00
Jan
-01
Ap
r-01
Ju
l-01
Oct-
01
Jan
-02
Ap
r-02
Ju
l-02
Oct-
02
Jan
-03
Ap
r-03
Ju
l-03
Oct-
03
Jan
-04
Ap
r-04
Ju
l-04
Oct-
04
Jan
-05
Ap
r-05
Ju
l-05
Oct-
05
Jan
-06
Ap
r-06
Ju
l-06
Oct-
06
Jan
-07
Ap
r-07
Ju
l-07
Oct-
07
Jan
-08
Ap
r-08
Ju
l-08
Oct-
08
Jan
-09
Ap
r-09
Ju
l-09
Oct-
09
Jan
-10
Ap
r-10
Ju
l-10
Oct-
10
Jan
-11
New Homes Existing Homes
28
Sources: US Census Bureau , NAR, NAHB (SAAR)

29
560 565 575
461 488 490
449
486
657
718
633
519
550
647
820 818
709
545
436 413
622 639
688
748
672 675 650
535 507
608
666 670 665
758
805
885 881 877
909
972
1,088
1,203
1,283
1,051
776
485
375
338
200
300
400
500
600
700
800
900
1,000
1,100
1,200
1,300
1,4001
96
3
196
4
196
5
196
6
196
7
196
8
196
9
197
0
197
1
197
2
197
3
197
4
197
5
197
6
197
7
197
8
197
9
198
0
198
1
198
2
198
3
198
4
198
5
198
6
198
7
198
8
198
9
199
0
199
1
199
2
199
3
199
4
199
5
199
6
199
7
199
8
199
9
200
0
200
1
200
2
200
3
200
4
200
5
200
6
200
7
200
8
200
9
201
0p
Annual New Home Sales
Source: US Census Bureau, NAHB, Real Estate Center
(000, SAAR)
Average Annual Sales by Decade:
60s 513
70s 656
80s 609
90s 698
00-06 1,055
07-09 533 -50% 1977
Peak to Trough
-32% 1986
Peak to Trough
-74% 2005 Peak
to Current
Trough
-28% 1972
Peak to Trough

NAHB HMI and Housing Starts
0
200
400
600
800
1,000
1,200
1,400
1,600
1,800
2,000
0
10
20
30
40
50
60
70
80
90
100J
an
-85
Jan
-86
Jan
-87
Jan
-88
Jan
-89
Jan
-90
Jan
-91
Jan
-92
Jan
-93
Jan
-94
Jan
-95
Jan
-96
Jan
-97
Jan
-98
Jan
-99
Jan
-00
Jan
-01
Jan
-02
Jan
-03
Jan
-04
Jan
-05
Jan
-06
Jan
-07
Jan
-08
Jan
-09
Jan
-10
Sta
rts
(00
0’s
SA
)
HM
I
Housing Market Index Single-Family Starts
30 Source: NAHB, Census Bureau, Real Estate Center at Texas A&M University

Median New Home Price
$160,000
$180,000
$200,000
$220,000
$240,000
$260,000
$280,000
Jan
-00
Ju
l-00
Jan
-01
Ju
l-01
Jan
-02
Ju
l-02
Jan
-03
Ju
l-03
Jan
-04
Ju
l-04
Jan
-05
Ju
l-05
Jan
-06
Ju
l-06
Jan
-07
Ju
l-07
Jan
-08
Ju
l-08
Jan
-09
Ju
l-09
Jan
-10
Ju
l-10
31 Source: US Census Bureau, NAHB
12-Month
Moving Average
Median new home price
is about the same as
around January 2004

Number of Housing Units Vacant
and Held Off Market “Other”
2,000
2,200
2,400
2,600
2,800
3,000
3,200
3,400
3,600
3,800
4,0001
Q1
990
3Q
19
90
1Q
19
91
3Q
19
91
1Q
19
92
3Q
19
92
1Q
19
93
3Q
19
93
1Q
19
94
3Q
19
94
1Q
19
95
3Q
19
95
1Q
19
96
3Q
19
96
1Q
19
97
3Q
19
97
1Q
19
98
3Q
19
98
1Q
19
99
3Q
19
99
1Q
20
00
3Q
20
00
1Q
20
01
3Q
20
01
1Q
20
02
3Q
20
02
1Q
20
03
3Q
20
03
1Q
20
04
3Q
20
04
1Q
20
05
3Q
20
05
1Q
20
06
3Q
20
06
1Q
20
07
3Q
20
07
1Q
20
08
3Q
20
08
1Q
20
09
3Q
20
09
1Q
20
10
Tho
usa
nd
s
32 Source: US Census Bureau, Quarterly Estimates of the Total Housing Inventory for the United States: 1965-Present
Maybe only part of the “shadow inventory”

Has the Housing Market
Bottomed? Answer: maybe… hopefully … probably. But we
will not really know for sure for some time.
Can the market sustain itself without massive Federal
government help
Defaults and foreclosures will stay high.
The health of the housing market, nationally and locally,
depends on a general economic recovery.
The housing market may have bottomed out, but
probably a long, slow recovery – think 5 to 10 years, not
just one or two.
33

Texas – Poised for a 21st
Century Boom
• Population and Economic growth
• Low cost, available labor
• Pro Growth Attitude
• Migration into State from elsewhere
• Attractive Retirement Area
• Pressure on infrastructure, government services, public finance
• Most affordable state for land, housing and overall cost of living
34

35
South Padre Island 2050

2000 – 2009 States with
Population Increases > 1 million
Source: U.S. Census Bureau Table 4: Cumulative Estimates of the Components of Resident Population Change for the United States, Regions, States, and
Puerto Rico: April 1, 2000 to July 1, 2009 36
State Population
Increase Percent Increase
2009 Population
Texas 3,930,484 18.8% 24,782,302
California 3,090,016 9.1% 36,961,664
Florida 2,555,130 16.0% 18,537,969
Georgia 1,642,430 20.1% 9,829,211
Arizona 1,465,171 28.6% 6,595,778
North
Carolina 1,334,478 16.6% 9,380,884

2000 – 2009 States with Population
Increases > 1 million
State
Total Population
Increase Natural Foreign
Immigration Domestic
Immigration
Texas 3,930,484 2,124,124 933,083 848,702
California 3,090,016 2,878,482 1,816,633 -1,509,708
Florida 2,555,130 479,586 851,260 1,182,974
Georgia 1,642,430 684,445 281,998 567,135
Arizona 1,465,171 464,238 272,410 714,354
North
Carolina 1,334,478 457,927 214,573 675,016
37
Source: U.S. Census Bureau

Texas Urban Triangle
38
In 2007, 15.3
million people,
about 90% of
the total
population in
the area, lived
in the four
principal metro
areas in the
triangle
By 2040, 33.7
million people
will live in the
four principal
metro areas in
the triangle, a
120% increase
58,410 square
miles
Source: Department of Landscape Architecture and Urban Planning, Texas A&M University

Percent Growth 1980-1990
Source: Texas State Data Center, Office of the State Demographer
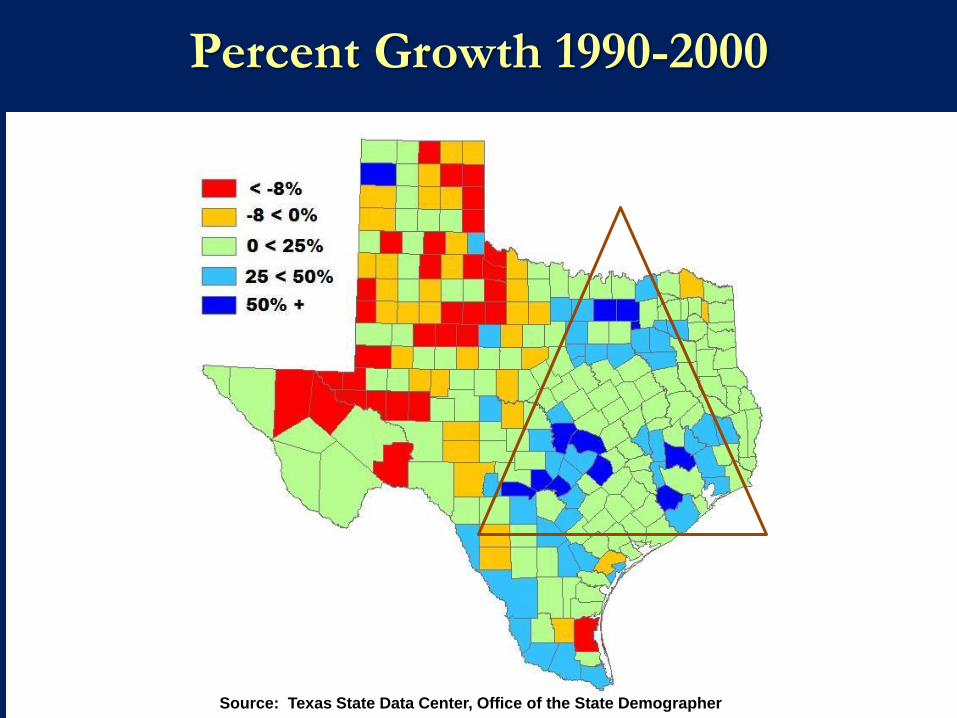
Percent Growth 1990-2000
Source: Texas State Data Center, Office of the State Demographer

Percent Growth 2000-2008
Source: Texas State Data Center, Office of the State Demographer

Percent Change in Metropolitan and
Micropolitan Areas: 2000 - 2009
42 Source: U.S. Census Bureau, Population Change in Central and Outlying Counties of
Metropolitan Statistical Areas: 2000 to 2007, June 2009.
The Texas Urban Triangle

Projected Percent Growth 2008-2040
43
Source: Texas State Data Center, Office of the State Demographer

Projected Population by County 2040
44
2040 Population
P_40
36 - 1000
1001 - 10000
10001 - 50000
50001 - 100000
100001 - 500000
500001 - 1000000
1000001 - 8000000
Source: Texas State Data Center, Office of the State Demographer

45
20,852
22,811
24,782
31,831
37,285
41,118
15,000
20,000
25,000
30,000
35,000
40,000
45,00020
00
20
01
20
02
20
03
20
04
20
05
20
06
20
07
20
08
20
09
. .
.
20
10
20
10
20
10
20
15
20
15
20
15
20
20
20
20
20
20
20
25
20
25
20
25
20
30
20
30
20
30
Source: U.S. Census Bureau, Texas State Demographer 2008 Projections
(000s)
Projected Texas Population 2000 - 2030
At 50% 1990-2000 rate of immigration
At 2000-2007 rate of immigration
At 100% 1990-2000 rate of immigration
Between 9 and 18 million more
residents between 2005 and 2030

46
Averaging the projections results in an
increase of 13.9 million people by 2030.
another 12-county Dallas-Ft.
Worth metropolitan area, plus
another 10-county Houston metropolitan area, plus
another 8-county San Antonio metropolitan area, plus
Over the next 25 years, equivalent of adding:
another Corpus Christi

Percent of Total Texas Population by Race Anglo and Hispanic Proportions Reverse by 2030
53.1%
49.5%
45.9%
42.4%
39.0%
35.7%
32.5%
11
.6%
11
.4%
11
.2%
10
.8%
10
.5%
10
.0%
9.5
%
3.3
%
3.8
%
4.3
%
4.9
%
5.4
%
6.1
%
6.7
%
0%
10%
20%
30%
40%
50%
60%
2000 2005 2010 2015 2020 2025 2030
Anglo Black Hispanic Other
Source: Texas State Data Center and Demographer, Average of Projections

48
Age Distribution of the United States 2005-2030
500,000
1,000,000
1,500,000
2,000,000
2,500,000
3,000,000
3,500,000
4,000,000
4,500,000
5,000,000
5,500,000
6,000,000
6,500,000
7,000,000
7,500,000
0 5
10
15
20
25
30
35
40
45
50
55
60
65
70
75
80
85
+
Boomers 41-59 2005
500,000
1,000,000
1,500,000
2,000,000
2,500,000
3,000,000
3,500,000
4,000,000
4,500,000
5,000,000
5,500,000
6,000,000
6,500,000
7,000,000
7,500,000
0 5
10
15
20
25
30
35
40
45
50
55
60
65
70
75
80
85
+
Age
Boomers 46-64 2010
500,000
1,000,000
1,500,000
2,000,000
2,500,000
3,000,000
3,500,000
4,000,000
4,500,000
5,000,000
5,500,000
6,000,000
6,500,000
7,000,000
7,500,000
0 5
10
15
20
25
30
35
40
45
50
55
60
65
70
75
80
85+
Age
Boomers 56-74 2020
500,000
1,000,000
1,500,000
2,000,000
2,500,000
3,000,000
3,500,000
4,000,000
4,500,000
5,000,000
5,500,000
6,000,000
6,500,000
7,000,000
7,500,000
0 5
10
15
20
25
30
35
40
45
50
55
60
65
70
75
80
85+
Age
2030 Boomers 66-84

49
Texas Age Distribution 2005-2030
0
50,000
100,000
150,000
200,000
250,000
300,000
350,000
400,000
450,000
500,000
550,000
600,000
650,000
0 5
10
15
20
25
30
35
40
45
50
55
60
65
70
75
80
85+
Age
Boomers
0
50,000
100,000
150,000
200,000
250,000
300,000
350,000
400,000
450,000
500,000
550,000
600,000
650,000
0 5
10
15
20
25
30
35
40
45
50
55
60
65
70
75
80
85+
Age
Boomers
0
50,000
100,000
150,000
200,000
250,000
300,000
350,000
400,000
450,000
500,000
550,000
600,000
650,000
0 5
10
15
20
25
30
35
40
45
50
55
60
65
70
75
80
85+
Age
2020 Boomers
0
50,000
100,000
150,000
200,000
250,000
300,000
350,000
400,000
450,000
500,000
550,000
600,000
650,000
0 5
10
15
20
25
30
35
40
45
50
55
60
65
70
75
80
85
+
Age
2030 Boomers
2005 2010

Educational Attainment (%) of Adults
Age 25+, Texas vs. Rest of the US
4.3%
10.3%
28.8% 28.8%
17.5%
10.3% 8.6%
11.8%
25.4%
28.8%
17.1%
8.3%
0.0
0.1
0.1
0.2
0.2
0.3
0.3
0.4
Rest of US Texas
Source: American Community Survey 2008

Projected Percent of Labor Force by Educational
Attainment in Texas, 2000 and 2040
* Proj ections are shown for the 1.0 scenario
18.8
29 28.7
18.2
5.3
30.128.7
23.9
12.9
4.4
No High
School Diploma
High School
Graduate
Some
College
Bachelor's
Degree
Graduate/Prof.
Degree
0
5
10
15
20
25
30
35
Percent
2000 2040
Source: Texas State Data Center, Office of the State Demographer

Dr. James P. Gaines Research Economist Real Estate Center
at Texas A&M University www.recenter.tamu.edu