
1
Marketing Implications of Online Consumer Product Reviews
YUBO CHENSCOTT FAYQI WANG*
February 2003
* Yubo Chen is a doctoral student, University of Florida, P.O. Box 117150, Gainesville, FL32611-7150 (Phone: 352 392 0161 Ext. 1280; Fax: 352 846 0457; email:[email protected]). Scott Fay is Assistant Professor of Marketing, University of Florida,P.O. Box 117150, Gainesville, FL 32611-7150 (Phone: 352 392 0161 Ext. 1249; Fax: 352 8460457; email: [email protected]). Qi Wang is a doctoral student, University of Florida, P. O. Box117150, Gainesville, FL 32611-7150 (Phone: 352 392 0161 Ext. 1333; Fax: 352 846 0457;email: [email protected]).

2
Marketing Implications of Online Consumer Product Reviews
Numerous websites provide forums for consumers to publicize their personal evaluations
of purchased products and thus facilitate word-of-mouth communication among consumers.
Based on the empirical data on 2001 automobile models from several online consumer review
sources (e.g. Epinions.com) and traditional sources (e.g. Consumer Reports and J.D. Power &
Associates), this paper addresses the following questions: 1) What are the underlying patterns of
online consumer posting behavior? 2) How can marketers strategically influence consumer
postings? 3) How reliable is online consumer review as a marketing research source? and 4)
How can marketers benefit from this wealth of data? Our study provides important implications
for marketers, online review providers and academic researchers.
Keywords: Product Evaluation, Word-of-Mouth, Online Forums, Customer Satisfaction,
Perceived Quality, E-Commerce

3
INTRODUCTION
Online communities, such as discussion forums and message boards, have become
commonplace. A search for “discussion forums” on Google.com yields over 3.7 million hits.
Product review forums, one type of community, provide platforms for consumers to publicize
their personal evaluations of product performance. Various sources supply online consumer
review websites. First, online retailers such as Amazon.com and Carpoint.com publish consumer
reviews on their websites. Second, traditional consumer magazines sponsor forums (e.g., Car &
Driver’s caranddriver.com and PC Magazine’s pcmag.com). Third, independent consumer
community intermediaries (e.g., epinions.com and consumerreview.com) organize consumer
reviews on various products from digital cameras to mountain bikes. There is increasing
evidence that electronic word-of-mouth has a significant influence on purchase behavior. For
example, a survey of Bizrate.com found that 44% of users consulted opinion sites prior to
making a purchase (Piller 1999).1 This survey also found that 59% of respondents considered
consumer-generated reviews to be more valuable than expert reviews. Hence, it has become very
important for marketers to understand the underlying pattern of online consumer review and to
consider how firms can exploit their marketing mix to affect consumer review. This paper offers
insight into these issues, which have not been previously discussed in the literature.
One important question that arises is whether these online consumer product reviews
contain valid information for marketers. In other words, can consumer review be an important
marketing research resource? Frequently, consumer forums are touted as giving consumers
access to unbiased viewpoints from a much larger base of real consumers than was possible
when communication was limited to friends, family and co-workers. Stauss (1997) calls Internet
word-of mouth a “powerful medium” that “gives power to isolated consumers,” allowing for a
“boundless dialogue with a potentially unlimited number of Net users.”2 Bickart and Schindler
1 Piller (1999) also reports that Forrester Research found that half of those who use web community sites say thatconsumer comments are important or extremely important in their buying decisions.2 Kirby (2000), in the San Francisco Chronicle, asserts that user opinion sites are proliferating because “consumersvalue hearing from people like themselves as opposed to expert opinions.” There is also a notion that such forumsbenefit in both breadth and reliability by having many participants. A large base of review contributors allows a siteto cover more product categories since “it’s difficult to gather expert opinions on every single product under thesun.” Plus, Kirby (2000) contends that even though you might not trust just one non-expert, “if 9 out of 10 non-experts agree, it’s probably worth buying.” Similar optimism is expressed in Business Week towards Firefly’sintelligent agent software based on word-of–mouth (Judge 1996). The writer envisions a world in which “hundreds

4
(2001), drawing upon intuition from the rich literature on persuasion, hypothesize that Internet
forum content may be more persuasive than other traditional sources of information (such as
marketer-generated content) since the reported experiences of peer consumers have the ability to
generate empathy among readers and may appear more credible, trustworthy, and relevant. On
the other hand, there are reasons to believe that these forums may not accurately reflect the true
performance of a product. First, posted opinions consist of unsolicited responses from a subset of
the population (Internet users familiar with that site) rather than being derived from a random
sample of all users. Second, because posters are anonymous, one is unsure of the veracity of the
information provided. For example, some posted opinions may not be based on personal
experience but instead may come from a biased source, such as a salesperson or manufacturer’s
employee--perhaps the poster is a disgruntled employee that wants to damage a firm’s
reputation.3 In fact, Mayzlin (2002) presents the possibility that firms could use web forums as a
marketing tool by sponsoring promotional chat designed to increase awareness for a new
product. Third, consumer review sites often are either sponsored by retailers, or accept referral
fees or advertising from manufacturers and retailers. This raises an issue of objectivity. For
example, as reported in New York Times, “since these sites derive revenue from transactions that
result from people responding to an opinion, it ultimately raises a question of bias” (Tedeschi
1999). Thus, through editorial policy and website design decisions, product forums may be
shaped to advantage the sponsor of the forum. One objective of this paper is to determine
whether online consumer review provides valid information. If this validity is confirmed, these
forums could prove useful to both consumers and marketers.
Recently, an increasing number of marketing scholars have studied the implications of
various product review information. Eliashberg and Shugan (1997) show that film critics are key
influencers for movie box office revenue in the short term. However, in the long run they are
predictors of a movie’s market performance. Reddy, Swaminathan and Motley (1998) find that
newspaper critics have a significant impact on the success of Broadway shows. Shaffer and
Zettlemeyer (2002) analyze how the provision of third-party information affects the division of
or even thousands of strangers—all of whom like the same things you do”—can guide your selection of a book,mutual fund or new car.3 Such misgivings are frequently voiced in the popular press as well as in the web forums themselves. For example,an LA Times feature reports of such dubious rankings as Alan Keyes being given the nod as the top Republicanpresidential hopeful by Deja.com and Harvard Medical School ranking 17th although it is widely considered tops in

5
profits in a multi-product distribution channel. Shugan and Winner (2002) study how
professional reviewers design review policy to keep review information unbiased and, at the
same time, to avoid offending advertisers. However, we are not aware of any marketing research
that has directly addressed the marketing implications of online consumer reviews. In particular,
we examine the following issues: 1) what are the underlying patterns of online consumer posting
behavior, 2) how marketers can strategically influence consumer postings, 3) how reliable online
consumer review is as a marketing research source, and 4) how marketers can benefit from this
wealth of data.
In this article, we empirically study online consumer reviews using data on 2001
automobile models from Consumer Reports, J.D. Power & Associates, and several online
consumer communities (e.g. Epinions.com). We explore how different factors affect posting
behavior in review websites, and whether Internet sites provide a representative view of product
performance. We find that posting behavior does not follow a random selection process but
rather that automobile characteristics have a significant impact on the propensity to post.
Attention-grabbing models (such as sporty and luxury cars) garner more postings than
uninspiring automobiles (like pickup trucks and minivans). Also, posters are more likely to
review automobiles that generate either extremely high or extremely low levels of satisfaction.
Furthermore, posting behavior varies with the characteristics of review web sites, suggesting that
each site attracts a different mix of consumers. We also test the validity of online consumer
product reviews by comparing the model ratings reported on Internet forums with the automobile
assessments made by more traditional sources (Consumer Reports and the survey by JD Power).
We find that two of the four online forums–Car & Driver (a traditional consumer magazine’s
site) and Epinions (a consumer community intermediary)--appear to be equally (or even more)
informative as the more scientific study conducted by JD Power.
The remainder of the article is organized as follows. The next section reviews the
relevant literature in order to construct hypotheses we will test. Then, we describe the data used
for this study, specify our empirical tests and report the results. As an extension, we further test
the accuracy of online consumer review by comparing these ratings to traditional customer
the nation (Piller 1999). This article also notes that “these opinion sites ... can be open targets by vendors whosurreptitiously pan competing products or from people with an ax to grind.”

6
survey data. Concluding remarks, including managerial implications, are found in the last
section.
HYPOTHESES
Word-of-Mouth communication is an important facilitator of learning and can have a
large impact on consumer decisions (see e.g. Leonard-Barton 1985; Feick and Price 1987). In
some cases, this impact is so large that individuals optimally ignore private signals and, instead,
rely entirely on the information from the aggregate behavior of others (Bannerjee 1993; Ellison
and Fudenberg 1995; McFadden and Train 1996). Prior to the Internet, a spreader of word-of-
mouth information would primarily impact her local group of friends and family, with dispersion
to a wider audience occurring only gradually. However, electronic communication, via online
consumer review sites, has enabled immediate information flows to a much wider audience since
a single message can affect all visitors of a site. Thus, it becomes even more imperative for firms
to understand the driving forces for online consumer posting behavior and to learn how they can
strategically affect posting behavior to their advantage.
We focus on several strategic variables firms can control to influence online consumer
review. For example, a product’s quality and other characteristics, as well as pricing, will
directly affect consumer satisfaction and ultimately posting behavior.4
Product Characteristics and the Number of Online Postings
Anderson (1998) presents empirical evidence that there exists a U-shape relationship
between customer satisfaction and the inclination to engage in word-of-mouth transfers,
suggesting that extremely satisfied and extremely dissatisfied customers are more likely to
initiate information flows than consumers with more moderate experiences. Satisfaction is a
function of both product performance and the price paid. For a given price, the lower the quality
of a product, the lower is customer satisfaction. For a given quality, the lower the price of a
product, the higher is customer satisfaction. Therefore, we hypothesize there exists a U-shape
relationship between the number of online postings and both quality and price:
4 Individual characteristics are also likely to affect posting behavior. However, our data does not provideinformation on individuals’ demographics since posters are anonymous.

7
H1: Controlling for price, more postings will be observed for extremely low or extremely
high quality products than for products of moderate quality.
H2: Controlling for quality, more postings will be observed for extremely low or
extremely high priced products than for moderately priced products.
Cost-side issues also may influence posting behavior. It takes both time and effort to
write a consumer product review. Since the opportunity cost of time is correlated with a person’s
income (Pashigian and Bowen 1994), we expect a negative relationship between a consumer’s
income and the inclination to post a review. In practice, the price of the product purchased by the
consumer is an instrument variable for his/her income, especially when the product is a relatively
high-priced durable good. Therefore we hypothesize:5
H3: The price of a product has a negative effect on the number of postings.
Furthermore, Rosen (2000) points out that many products have characteristics that can
create buzz. Using BMW Z3 with its stunning design as an example, she argues that products
that evoke an emotional response, such as excitement, are more likely to be spread by word-of-
mouth. Thus, we hypothesize:
H4: Products that can easily evoke an emotional response will garner more postings than
less inspiring products.
Product Characteristics and Online Consumer Review Ratings
Online product reviews usually report an overall rating. Such ratings measure customer
satisfaction and/or a consumer’s perceived quality. Therefore, ratings should be positively
5 We recognize that other individual characteristics besides income may affect posting behavior. In the market forpersonal computers, Mahajan, Muller and Srivastava (1990) finds that consumers who have greater expertise aremore likely to be involved in product evaluation and advising others on the product. Since different consumerreview web sites may attract different consumer segments, web sites that attract expert users are likely to have morepostings than other consumer review sites.

8
influenced by objective quality (Anderson and Sullivan 1993). This relationship is captured in
our fifth hypothesis:
H5: Objective quality has a positive effect on overall consumer ratings.
Satisfaction is also a function of price. For a given level of quality, the lower the price is,
the higher will be customer satisfaction:
H6: Controlling for quality, price has a negative effect on overall consumer ratings.
The Accuracy and Biases in Online Consumer Reviews
Lilien and Rangaswamy (2000) proclaim that the Internet “vastly increases the
opportunities for gathering and using data, information, and insights to support decision-
making.” They are not alone in this opinion, with others calling this newfound source of data
“unbelievable” (Hanson 2000) and an “unprecedented opportunity” (Wyner 2000) that “will
profoundly change the way knowledge is generated and disseminated.” (Johnson 2001). Data can
be found anywhere and everywhere from clickstream records (the navigation process of users
during a web visit) to online experiments, surveys, and focus groups to observations of chat
groups and forums (Lilien and Rangaswamy 2000). However, with this new opportunity also
comes challenges. For example, Johnson (2001) identifies instrument design issues and describes
the difficulty in recruiting subjects for surveys and experiments that market researchers face in
assuring the respondents are representative of the intended population and are given the proper
incentive to participate truthfully and conscientiously. If the research data comes from online
forums in which participants are anonymous and the researcher does not control the instrument
design, these issues of data reliability cause even greater concern. Before industry and academic
researchers rely on these newfound sources of consumer information, they need evidence that
these resources provide reliable information.6
6 Netnography is one area of the marketing literature that has begun to use data from online communities. Catteralland Maclaran (2002) outline this research method, discuss how it differs from ethnography, and explore potentialissues of concern such as representativeness and privacy. Kozinets (1998, 2002) also describes this methodology andsuggests applications to marketing. Examples of papers that employ netnography include Muniz and O’Guinn’s(2001) study of three brand communities (Ford Bronco, Macintosh, and Saab) and Kozinets’ (2002) study of thealt.coffee newsgroup.

9
Online consumer review websites provide overall ratings for each brand-model averaged
over individual ratings. Similar to response bias in traditional consumer survey (i.e., Kott 1987;
Greenleaf 1992), online consumer review is self-reported by posters and thus is susceptible to
self-reported sample biases. If the overall rating is based on only a few postings, the results may
be unreliable since they likely reflect only the most extreme experiences of consumers. When the
number of postings is larger, such extreme experiences constitute a smaller percentage of the
total pool of reviews, and thus have a reduced impact on ratings. Furthermore, as the number of
postings increases, it becomes more difficult for a partisan poster (such as a disgruntled ex-
employee or a competitor’s operative) to bias the rating in a significant manner. This leads to the
following hypothesis:
H7: The larger the number of postings, the more accurate the overall rating will be.
There are different motivations behind positive word-of-mouth versus negative word-of-
mouth (Anderson 1998). The main psychological incentive for individuals to spread positive
word-of-mouth is to gain social approval or self-approval by demonstrating their superb purchase
decisions and by engaging in the altruistic behavior of sharing their expertise with others (i.e.,
Dichter 1966; Arndt 1967; Richins 1983; Fehr and Falk 2002). However, dissatisfied consumers
engage in negative word-of-mouth in order to vent hostility (Jung 1959) and seek vengeance
(Allport and Postman 1947; Richins 1984). Some Internet review sites have added a monetary
incentive in order to stimulate postings. This would be expected to encourage both negative and
positive word-of-mouth transfers. However, previous studies have shown that the introduction
of explicit monetary incentives may weaken the approval incentive (i.e., Gachter and Fehr 1999;
Gneezy and Rustichini 2000a b). If you are paid for sharing your experiences, others may not
evaluate your behavior as being altruistic and individuals may consider themselves as less praise-
worthy. This asymmetric impact of monetary incentives on positive word-of-mouth behavior
introduces a bias in online consumer review:7
7 Research also suggests that dissatisfied consumers may not spread negative word-of-mouth because they areconcerned about social disapproval or embarrassment before peers (Lau and Ng 2001). The anonymity afforded byonline consumer review dampens this pressure. Thus, we would expect that online reviews would be negatively-biased in comparison to traditional word-of-mouth.
10
H8: Reviews in a website that provides monetary incentives for postings are more likely
to be negatively-biased in comparison to reviews from sites that do not offer such incentives.
DATA AND EMPIRICAL SPECIFICATION
Description of the Data
We collected data from six sources on 2001 models of automobiles in October of 2001.
One reason for selecting this particular market is that shopping for an automobile usually
involves intensive search since this consumption decision requires a commitment of significant
financial resources for most households (see Punj and Staelin 1983; Srinivasan and Ratchford
1991 for extensive examinations of the factors that affect automobile search). The Internet is
becoming a widely used source for such information. Morton, Zettelmeyer and Silva-Risso
(2001) report that 54% of all new vehicle buyers used the Internet in conjunction with buying a
car.8 Cho and Galbraith (2002), of J.D. Power and Associates, find that the type of sites
consulted are usually independent websites rather than manufacturer or dealer sites with 65% of
consumers rating the independent sites as being more useful information sources.9
The four online consumer review sources from which we collect data are: Epinions, Car
& Driver, Carpoint, and Autobytel -- four popular consumer review web sites for automobiles.10
We give the summary statistics for the available variables in table A-1 of the Appendix. Epinions
is an online independent consumer forum. Car & Driver is a consumer magazine’s website.
Carpoint and Autobytel are retailer websites. Overall ratings are present on all sites. For the first
three forums, ratings on other more-specific dimensions are also collected and these dimensions
vary across websites. Autobytel does ask consumers to rate comfort, performance, quality, and
8 They assert that this is because the Internet has dramatically decreased consumers’ costs of obtaining car-relatedinformation and that Internet information “is of higher quality (more timely, more detailed, customizable) thaninformation available from offline sources.”9 Ratchford, Talukdar and Lee (2001) present a model to explain what type of consumers have an incentive to searchonline, what information they will search for, and how much search will be conducted. This paper also presents datafrom a survey of automobile buyers. Thirty-eight percent of their sample report using the Internet to obtaininformation for purchases.10 The web addresses for these sites are www.epinions.com, www.caranddriver.com, www.carpoint.msn.com, andwww.autobytel.com. All of these websites also provide additional product-specific information such as technicalspecifications, price information, dealer directories, or expert reviews. For the purposes of this article, we only usethe data based on consumers’ ratings.

11
appearance. However, this information is not summarized across reviewers, making collection of
this data infeasible.
We collect sales and consumer survey data from J.D. Power and Associates. The number
of sales in Table A-1 is the Year-To-Date (through October) sales data that is published in the
October 2001 Sales Report. J.D. Power and Associates also conducts market research on
automobile performance for use by manufacturers, releasing portions of this data to the public.
The measurements for mechanical quality, features & accessories, and body & interior are taken
from the Initial Quality Study – a study based on the number of problems consumers report with
their new vehicles during the first three months of ownership.11 The measures of performance,
creature comfort and style are derived from the APEAL study. This study is based on a survey of
automobile owners that asks a variety of questions about how much people like or dislike the
way their vehicle looks, drives and feels.
Our final source of data comes from the 2001 Consumer Reports New Car Buying Guide.
This guide is published by Consumers Union, an independent, nonprofit testing and information
organization. Ratings are based on tests conducted at their auto-test facility in East Haddam, CT.
Consumers Union has published Consumer Reports since 1936. It is a respected source of
reliable information and has been a historically widely-read publication, with currently over four
million subscribers. Friedman (1987) found its report on used car problems to be a good
predictor of future problems. Furthermore, Friedman (1990) found Consumer Reports’ ratings to
be highly correlated with Which?, a British-based consumer testing magazine, across a wide
range of products. This suggests that Consumer Reports provides a valid indicator of a model’s
objective quality.
Specification
To test our hypotheses concerning the number of online postings, we estimate the
following regression:
(1) number of postings = α1 + β1 (quality) + β2 (quality)2 + β3 (price) + β4 (price)2
+∑i
β5i (vehicle class) + β6 (sales) + β7 (sales)2 + ε2
11 A full description of each of these variables is in an appendix available from the authors upon request.

12
Since the dependent variable, number of postings, is a count, we employ a Poisson log-
linear model (Maddala 1983; Chandrashekaran et al 1996) that explicitly allows for this type of
dependent variable. As our measure of quality, we use the overall performance rating in
Consumer Reports. Hypothesis 1 suggests that number of postings is a U-shaped function of
quality. Thus, we expect β1 < 0 and β2 > 0. Price is the reported average price paid in the data
from Epinions. Hypothesis 2 would suggest a U-shaped relationship with price and thus β3 < 0
and β4 > 0. H3 acknowledges that since the demographics of reviewers are not observable, price
may capture the opportunity cost of a potential reviewer’s time. This also suggests that β3 should
be negative. However, in contrast with H2, we would not expect to observe a high number of
postings for high-priced vehicles since consumers that face a high cost of posting a review make
such purchases. Thus we predict β3 < 0 and are ambivalent about the sign of β4. Vehicle class is a
series of dummy variables for the vehicle model type (Compact, SUV, Luxury, Midsize, Pickup
and Van). These variables provide controls for product characteristics that could impact the
emotional response produced by a vehicle (H4). The inclusion of sales (and its square) allows the
size of the pool of potential reviewers to influence the number of postings generated.
In estimating this regression (and the ones that follow), we run a regression for each
Internet site separately and then also stack the data to run a regression over all review websites
together.
To test our hypotheses on overall rating, we have the following specification:
(2) overall rating = α1 + β1 (quality) + β2 (price) + ∑i
β3i (vehicle class)
+ β4 (number of postings) + β5 (number of postings)2 + ε1
From H5, we expect the sign on quality to be positive if overall ratings are a valid
indicator of product performance or customer satisfaction. H6 suggests that the sign on price will
be negative. Finally, we include number of postings and its square to account for any systematic
biases that may occur when an overall rating is based on only a small number of self-reported
evaluations.12
12 H7 suggests an overall rating may be susceptible to exaggerated biases when the number of postings is low,reflecting mostly abnormal product experiences or the opinions of partial reviewers. We cannot a priori predict the

13
Since ratings come from different sources which all have different scales, when we
estimate regression (2), we compute the z-score for all models in each site as the dependent
variable to control for differences in the mean and standard deviations across sites. This
standardization allows us to pool the data across websites and also makes the coefficients for the
regressions involving individual sites more comparable.
To test what factors influence the accuracy of online reviews, we construct the following
specification:
(3) Diff = α1 + β1 (number of postings) + β2 (number of postings)2 + β3 (quality)
+ β4 (quality)2 + β5 (price) + β6 (price)2 + ε3
First, a z-score for each model is calculated using the source-specific vehicle class mean and
variance to exclude any systematic product category differences or rating scale differences
between the different sources. Diff is the absolute difference between the z-score of each model
on each site and Consumer Reports’ overall rating. Hypothesis 7 suggests that rating accuracy
will improve, and thus Diff will decrease, as the number of postings increases. Thus, we expect
β1 < 0. Measures of quality and price (along with their squared terms) are included to account for
biases in posting behavior due to extreme realizations of high or low customer satisfaction (as
described in H1 and H2).
RESULTS
Posting Numbers
Using specification (1), table 1 shows the results of the regressions on posting frequency.
Consistent with H1, there exists a U-shape relationship between product quality and online
posting numbers. Controlling for price and vehicle class (which is a proxy for emotional appeal),
online posting numbers are higher for extremely low quality or extremely high quality products
than for products of moderate quality. This result is statistically significant on the data across all
sites, and for both Car & Driver and Epinions individually (and is of the predicted sign for
sign of this bias. We enter the number of postings (and its square) into regression (2) to control for any bias that isconsistently present within a given data source.

14
TABLE 1
Poisson Regression on the Number of Postings
Variables All Sites Car & Driver Autobytel Epinions
Quality -.335**(-2.960)
-.600**(-4.236)
9.475E-02(.256)
-.394**(-2.397)
(Quality)2 8.630E-02**(5.565)
.123**(6.315)
1.677E-02(.331)
5.583E-02**(2.440)
Price -7.382E-06**(-4.833)
-1.006E-05**(-4.156)
-1.153E-05(-1.471)
-7.074E-07(-.734)
(Price)2 -7.773E-11**(-1.950)
-8.541E-11(-1.645)
-5.705E-11(-.383)
-1.199E-10**(-2.128)
Sport .485**(7.201)
.649**(7.907)
.136(.561)
-.124(-1.113)
Compact .398**(8.583)
.146**(2.353)
.264*(1.740)
-.240**(-3.012)
SUV .134**(2.508)
-6.635E-02(-.926)
.371**(2.307)
1.126E-03(.015)
Luxury .119**(2.059)
.231**(3.204)
.110(.591)
.240**(3.021)
Pickup -.312**(-4.011)
-.359**(-3.783)
-.417*(-1.707)
4.910E-02(.398)
Van -.649**(-8.525)
-1.147**(-9.637)
-.377*(-1.707)
-5.292E-02(-.587)
Sales 5.153E-06**(14.313)
5.525E-06**(12.040)
5.271E-06**(4.790)
3.604E-07(.509)
(Sales)2 -4.490E-12**(-7.302)
-4.778E-12**(-6.477)
-4.188E-12**(-2.378)
-1.013E-12(-.658)
Car & Driver .651**(19.519)
Autobytel -1.161**(-21.287)
R2 .521 .338 .228 .050F-statistic 28.83** 4.71** 2.78** .47
N 368 124 126 119Notes: 1. There is an intercept term in the regression.
2. ** Significant at .05 level* signicant at .10 level
3. Midsize is the omitted variable for car dummies. Epinions is the omitted site dummy.
Autobytel). We find that the effect of prices is negative as predicted, with the coefficient on price
being highly significant for both All Sites and Car & Driver. The signs on (price)2 are negative.
This result contradicts H2 and lends supports to H3. Apparently, the role of opportunity cost
plays a very important role in posting behavior. A higher car price usually indicates that a higher
income of purchasers. Such consumers are less likely to have the time to post reviews and this
effect is especially strong when the vehicle is very expensive. As for the impact of vehicle
characteristics on posting behavior, consistent with H4, we find that posting intensity varies

15
across product type. Sport, luxury, SUV and compact cars generate more postings than midsize
cars, with pickups and vans being even less popular targets.13 Those first four car categories are
more likely to have more stylish designs and thus to gain attention of potential posters. From the
coefficients of product category dummies in the last three columns, we see that different
websites attract different consumer segments. Particularly, the visitors of Epinions are more
heterogeneous than those from the two other web sites since most categories (except for compact
and luxury cars) attract the same intensity of postings. The control variable, sales, is positive and
highly significant. The sign of (sales)2 is negative and significant, indicating that there is non-
linearity in this relationship such that sales levels drive postings at a decreasing rate as sales
increase. This result is consistent with the existing finding that late adopters are less likely to
advise others than early adopters (Mahajan, Muller and Srivastava 1990).
Level of Overall Ratings
The results from regression (2) are reported in table 2.
For the data across all websites and within the Car & Driver data, product quality has a
positive impact on overall rating and this effect is highly significant. This is strong evidence in
support of H5. For the other three individual sites, the coefficient on quality is of the expected
sign even though these values are not statistically significant. The insignificant coefficients on
quality for Epinions and Autobytel data may be explained by the fact that the visitors of these
two sites are less likely to be expert consumers, compared to Car & Driver. Instead of the
negative relationship between price and overall rating as predicted by H6, we find that the
coefficient on price is consistently positive. One explanation of this finding is that the price
variable may be picking up perceived quality. Consumer Reports’ overall rating may not
perfectly capture a product’s quality. To the degree that prices and quality are closely correlated,
price may proxy for quality. One should also note the statistically significant U-shaped
relationship between overall ratings and the # of postings on Epinions (with the other sites
following a similar pattern). When a model has only a few postings, they tend to be negative-
biased, with the effect being strongest for Epinions. The fact that Epinions provides monetary
13 Stark differences in posting behavior are readily observed in the raw data. For example, on average, there is oneposting on Car & Driver about a sports car for every 691 sports cars that are sold in the United States, compared toonly one review for every 10,566 vans purchased. In general, after accounting for market share differences,

16
compensation to reviewers may be responsible for this difference in posting behavior, but more
research is needed to provide a complete explanation.
TABLE 2
Regression on Overall Rating
Variable All Sites Car & Driver Epinions Autobytel Carpoint
Quality.151**(2.555)
.189**(2.199)
.129(1.135)
8.410E-02(.747)
.114(1.579)
Price3.238E-05**
(5.026)2.564E-05**
(2.851)4.284E-05**
(3.547)3.271E-05**
(2.613)6.913E-06
(.933)
Sport.155
(.808).103
(.378)8.296E-02
(.229).257
(.712)-.287
(-1.283)
Luxury-.137
(-.885)-8.759E-02
(-.392)5.029E-02
(.177)-.432
(-1.422)-6.437E-02
(-.347)
Compact7.062E-02
(.476)-.121
(-.579).499*
(1.754)-.200
(-.700)-3.362E-02
(-.189)
SUV2.480E-02
(.167)-3.849E-02
(-.179)1.373E-03
(.005)4.103E-02
(.146)-.433**(-2.459)
Pickup.220
(1.190)-6.774E-02
(-.254).796**(2.284)
-.161(-.470)
-.271(-1.193)
Van-.429**(-2.434)
-.506*(-1.909)
-5.273E-02(-.164)
-.741**(-2.255)
-.213(-1.029)
# of Postings9.189E-03
(1.629)2.716E-03
(.379)3.532E-02**
(2.799)2.383E-02
(.402)
(# of Postings)2 -6.310E-05(-1.080)
-5.279E-07(-.008)
-3.361E-04**(-2.552)
-1.158E-03(-.347)
Quintile-.521**(-2.391)
(Quintile)2 7.208E-02**(2.184)
R2 .197 .289 .267 .192 .191F-statistic 8.684** 4.628** 4.233** 2.426** 2.746**
N 365 125 127 113 127Notes: Coefficients (t-statistics) reported.1. ** significant at .05 level
* signicant at .10 level2.Sport, luxury, compact, SUV, pickup and van are indicator variables (midsize is the omitted variable).3.In the Carpoint data, the number of postings is truncated from above with a report of “200+” if more than 200
postings have been received. Thus, the data has been adjusted into the form of Quintiles: “1” for 0-39 postings,“2” for 40-89, “3” for 90-149, “4” for 150-199, and “5” for 200+.
4. There is a constant term in each regression.
consumers are at least twice as likely to post a review about a sports car versus a car from any other category andabout 10 times less likely to review a pickup truck.

17
Accuracy of Ratings
To identify the factors that influence the accuracy of consumer reviews, we run a
regression using specification (3) and report the results in table 3. The results of All Sites, Car &
Driver and Epinions, lend strong support to H7: the higher the number of postings, the more
accurate the overall rating, i.e. the lower is Diff. The positive sign on (# of postings)2 suggests
that this effect diminishes as the number of reviews increases. The primary benefit of increasing
the number of reviews occurs when the sample size is so low that it can be easily manipulated by
one or a few biased reviews. Once a sufficient number of reviews have been posted, attracting
even more postings becomes less important. The statistically significant coefficients on quality
and its square suggest that there are systematic biases that follow an U-shaped pattern. For
models that have extremely high or extremely low quality, reported ratings differ substantially
from the ratings reported by Consumer Reports. One possible explanation is that consumer
reviewers lack the expertise to evaluate the long-term performance of a vehicle. For example,
Consumer Reports is likely to give very high ratings to vehicles that are judged to be durable,
well-built vehicles, based on close inspections by a team of structural engineers. A consumer
may only arrive at this conclusion after owning the car for many years (and our data is limited to
reviews made during the first year of purchase since we only observe reviews of new model
automobiles). Consistent with this intuition is the pattern we observe with price (and its square).
The results from table 3 suggest that the largest inaccuracy occurs with moderately-priced
vehicles. To the extent that performance is correlated with price, consumers can infer a model’s
“true” performance by simply recalling the price they paid for their vehicle. This will be a more
reliable signal when price is either extremely high or extremely low.
Summary of Results
Comparing our results to our hypotheses, we find strong evidence in support of H1, H3,
H4, H5, and H7. Our finding of a monotonic, negatively-correlated relationship between price
and # of postings is not completely consistent with H2 (which conjectures a U-shaped
relationship). Instead, this result suggests that the income effect identified in H3 has an even
stronger impact on posting behavior, with the magnitude of this effect increasing with vehicle
price. H6 is not supported. We cannot construct a direct test of H8. However, Epinions, the only

18
TABLE 3
Review Overall Rating Accuracy
Variable All Sites Car & Driver Epinions Autobytel Carpoint
# of Postings-1.845E-02**
(-3.645)-1.176E-02*
(-1.846)-3.332E-02**
(-3.476)-1.545E-02
(-.348)
(# of Postings)2 1.230E-04**(2.488)
5.759E-05(.961)
2.785E-04**(2.733)
2.825E-05(.011)
Quintile1.635E-02
(.066)
(Quintile)2 3.073E-03(.082)
Quality -1.309**(-5.434)
-1.041**(-2.536)
-1.584**(-3.639)
-1.401**(-3.317)
-2.389**(-5.667)
(Quality)2 .149**(4.423)
.117**(2.031)
.195**(3.181)
.153**(2.574)
.316**(5.319)
Price5.651E-05**
(3.255)8.106E-05**
(2.789)5.027E-05
(1.641)3.950E-05
(1.264)1.322E-05
(.449)
(Price)2 -9.696E-10**(-3.411)
-1.370E-09**(-2.892)
-9.256E-10*(-1.833)
-6.650E-10(-1.300)
-3.030E-10(-.629)
Car & Driver9.894E-02
(1.159)
Autobytel-7.572E-02
(-.837)R2 .191 .187 .212 .222 .240
F-statistic 10.53** 4.534** 5.383** 5.030** 6.302**N 365 125 127 113 127
Notes: Coefficients (t-statistics) reported.1. ** significant at .05 level
* signicant at .10 level2. Dependent variable is Diff, the absolute difference between the z-scores of each model on each site and
Consumer Reports. The z-score for each model is calculated using the source-specific vehicle class meanand variance. A lower value of Diff reflects a more accurate rating.
3. There is a constant term in each regression.4. Epinions is the omitted site dummy variable.
site that offers monetary incentive, does differ from the other online review sites in several
interesting ways. In Epinions, the number of postings has a strong impact on overall ratings and
their accuracy. This suggests that a bias may be created by monetary incentives, but that the size
of the bias depends on the size of the pool of reviewers. Obviously, a richer theory is needed to
explain this phenomenon.

19
COMPARISON BETWEEN ONLINE CONSUMER REVIEW AND TRADITIONAL
CUSTOMER SURVEY
The results on the quality coefficient in table 2 suggest that, overall, online consumer
review provides significant information about product objective quality and has the potential to
be used as a reliable information source for marketing research. In this section, we compare
online consumer review data with traditional authoritative customer survey data (JD Power
Survey) to address the following question: Do online consumer reviews provide less or more
valid information than traditional customer surveys?
Here, we compare the correlations between different review sources and Consumer
Reports and the correlation between JD Power and Consumer Reports. Similar methodologies
have been employed to assess the review accuracy among movie critics (Agresti and Winner
1997; Boor 1992). In the finance literature, similar approaches have also been used to study the
accuracy of financial analysts stock performance forecasts and recommendations and their herd
behavior (e.g., Chavalier and Ellison 1999; Hong, Kubik, and Solomon 2000; Welch 2000).
We wish to assess the correlations in overall rating among the various data sources.
Unfortunately, the JD Power data does not contain a measure of overall performance. We use
factor analysis to construct an overall rating based on the six attribute scores present in our data.
Similarly, we construct an overall rating for each of the other data sources using all the attributes
available in that data (if additional variables are available).14 As a further test of the validity of
online review, we consider ratings on more specific automobile dimensions. Attempting to
achieve as much comparability across the data sources as possible, we identify three
characteristics of automobiles, Quality, Comfort, and Performance, that are assessed within each
source.15 The classification used is given in table 4.
14 Ratings on such characteristics are not available in the Autobytel data. Thus, in table 5 we continue to use thereported overall rating for this web forum. For the other data sources, there are very high correlations between theconstructed latent variable and the reported overall ratings (when available). The pearson correlation coefficients forCar & Driver overall rating versus the Car & Driver first factor analysis component is .767; it is .958 and .636 forCarpoint and Epinions respectively. This suggests that using factor analysis to construct an overall rating is areasonable approach.15 From table A-1, one observes that forums are not homogeneous in the characteristics that they measure or in thelabeling of these measurements. Thus, there is some inherent subjectivity in constructing comparable measures.Also, it is apparent that there is wide divergence in the types of information available from each source – ConsumerReports offers assessments on a much wider range of vehicle characteristics including performance under extremedriving conditions (such as crash test performances, emergency handing, and driving with a full load of passengers

20
TABLE 4
Classification of Categories
Quality Comfort Performance
Car & Driver
Acceleration
Ride
Transmission
Interior ComfortBraking
Handling
Carpoint Quality Interior Performance
Epinions Quality and CraftsmanshipSeat Comfort
RoominessHandling and Control
JD Power Mechanical Quality Creature Comfort Performance
ConsumerReports
Acceleration
Transmission
Ride – Normal
Driving Position
Front-SeatComfort
Rear-SeatComfort
Braking
Routine Handling
In the cases when there are multiple measures of a component, we compute an overall
rating by averaging the ratings of these alternative measures.16 In table 5, we record the
correlations of ratings on constructed overall ratings and these three dimensions.
The JD Power overall rating is highly correlated with the Consumer Reports rating.
However, this correlation is significantly higher than the correlation between the web forum
rating and the Consumer Reports rating for only two of the websites: Autobytel and Carpoint (p
< .001 for both comparisons).17 The results on three specific dimensions lead to a consistent
or cargo). In tests, which to save space we do not report in this paper, we verify that this is not merely a differencein labeling; these additional variables do contain unique information.16 We use averages since factor analysis assigned nearly equal weight to each of the components of a given category.17 This identical pattern continues to hold if one uses z-scores to control for differences across vehicle classes.These results are presented in table A-2 of the appendix. An alternate test to compare accuracy across sites isconducted using the Diff variable which was used in Table 3. A regression is ran stacking Diff across sites andadding an indicator variable for each source. The results are reported in table A-3. Note that JD Power is the omittedvariable. A positive coefficient indicates poor accuracy, i.e. a higher level of disparity between that source’s ratingsand Consumer Reports than is present in the JD Power data. Again, we conclude with high confidence (pvalue <

21
conclusion. We find that Car & Driver always has the highest correlations with Consumer
Reports. It appears that Car & Driver provides at least as reliable information as JD Power. In
fact, the correlation for Performance between Car & Driver and Consumer Reports is
significantly higher than the one between JD Power and Consumer Reports (p = .026). Epinions
also does quite well. We cannot reject the hypothesis that the correlation between Epinions and
Consumer Reports is equal to the correlation between JD Power and Consumer Reports for any
of the dimensions. In contrast, the correlations between Carpoint and Consumer Reports are
lower than the ones between JD Power and Consumer Reports for all characteristics except
Performance (and in that case the difference is insignificant).18
TABLE 5
Correlation of Ratings with Consumer Reports
Overalla Quality Comfort Performance
Car & Driver .396 *** .488 *** .447 *** .527 ***
Epinions .412 *** .338 *** .424 *** .394 ***
Carpoint .264 *** .187 ** .255 *** .431 ***
Autobytel .149 ** NA NA NA
JD Power .494 *** .466 *** .393 *** .343 ***
Notes: 1. a: overall ratings based on factor analysis2. *** significant at .01 level ** significant at .05 level
In summary, for both overall ratings and separate vehicle dimensions, the information
provided by Car & Driver and Epinions appears to be as accurate as JD Power. And, Car &
Driver's information may be even more reliable than the one by JD Power. On the contrary,
information from Carpoint and Autobytel is less accurate than our traditional survey source.
.001) that Carpoint provides less valid information than JD Power and that Car & Driver and Epinions are at leastas valid as JD Power.18 A further implication of these results is that Car & Driver and Epinions are more accurate than either Carpoint orAutobytel.

22
DISCUSSION AND IMPLICATIONS
Implications for the Marketers
We find that product quality has a positive impact on generating positive online reviews.
In addition, attractive design may help evoke excitement among consumers and generate positive
word-of-mouth. Thus, online consumer review will benefit high-quality and emotion-evoking
products since firms generate awareness for their products without large expenditures on
advertising and promotion. In contrast, a large amount of negative word-of-mouth may make it
difficult for a low-quality seller to overcome its adverse positioning.
Surprisingly, we find that it is not necessary for firms to reduce product prices to satisfy
customers. Consumers do not always have enough expertise and knowledge to evaluate the
product even after their purchase and usage. The price-quality relationship may bring strong bias
to their judgment. This may be good news for a firm’s pricing decision.
We find, compared to traditional customer survey, online consumer review may not be
an inferior information source for marketing research. Consumer reviews from consumer
magazines websites (i.e., Caranddriver.com) and independent review websites (i.e.,
Epinions.com) are not less valid sources of information than traditional survey (i.e., J. D. Power
& Associates). Reviews from consumer magazines websites may be even more accurate than
traditional surveys since their contributors are mainly expert consumers. Furthermore, online
consumer reviews provide some advantages over traditional survey. They are free to access,
provide up-to-the-minute information and reviews are at the brand-model specific level. Online
consumer review provides firms with important information on consumer preference, customer
satisfaction and competitors’ products. Marketing scholars have constructed methodologies that
integrate customer preferences and satisfaction data into the new product development process
(Griffin and Hauser 1993). Traditionally, firms collect this data through personal interviews.
However, as Griffin and Hauser (1993) show, there are large monetary and time delay costs
inherent to this data collection process. If online consumer review can provide reliable
information on consumer needs and satisfaction, companies could realize large savings. In
addition, online consumer review provides customer satisfaction information on not only a firm’s
own products but also on its competitors’ products. Customer satisfaction information on
competitors’ products is very important because it can help firms identify market opportunities

23
(Hauser 1993). In addition, Hauser, Simester and Wernerfelt (1996) show that firms should
deploy relative customer satisfaction (focal product vs. competitors) to design reward incentive
systems for employees. Online consumer review information can also be useful for identifying
consumer preferences, finding out product defects and in correcting inadvertent mistakes.
However, our study suggests that firms should be aware of, and should make adjustments
in response to, biases that exist in online consumer reviews. Since online posting is self-reported
by consumers, there may be nonrandom sample bias. We find that, in general, the accuracy of the
consumer review improves as the number of postings increases. In addition, reviews from
websites that offer monetary incentives for postings are likely to be negative-biased since
monetary rewards reduce the social and self-approval rewards for consumers to spread positive
word-of-mouth.
Implications for Internet Consumer Review Platforms
Our study also provides important implications for different business models of online
review sites. Consumers can be motivated to make postings for non-monetary reasons (such as
interest or ego gratification) or directly through monetary incentives. Online review sites are
struggling to determine the best way to encourage consumers to post their evaluations (Tedeschi
1999). Some scholars argue that online consumer reviews are public goods, and will be
undersupplied without monetary rewards (Avery, Resnich and Zeckhauser 1999). However, in
our study, Car & Driver attracts more postings and provides more accurate information than
Epinions, even though, Epinions rewards product reviewers and Car & Driver does not.19
Monetary incentives may curb the social and self-approval reward from expert consumers, thus
leading to fewer postings by such persons that highly value the esteem from participating in
altruistic behavior. 20 The result is a greater percentage of inaccurate (and often negative)
postings. This has significant implications for various online consumer forums since their
business models depend on attracting a large number of high-quality consumer reviews to their
websites.
19 As of October 2001, Car & Driver contained a total of 3963 consumer reviews of new automobiles, compared to2292 on Epinions.20 This is closely related to the concept of market mavens—individuals with heightened market interest who haveinformation about many kinds of products and are likely to share that information with other consumers (Feick andPrice 1987). Such persons can be very influential on others’ purchasing decisions and thus have been considered an

24
Implications for Academic Researchers
Finally, our study has important implications for academic researchers. For example, in
the current customer satisfaction literature (e.g., Anderson and Sullivan 1993; Anderson, Fornell
and Lehmann 1994), customer satisfaction data are mainly at the firm level. If online consumer
review is a reliable information source, more research can be explored at the product level. Data
from online communities could also be useful to researchers in the field of social exchange
theory. For example, Brown and Reingen (1987) provide initial evidence that weak social ties
frequently serve as bridges for information flows between distinct subgroups in the social
system. And, Frenzen and Nakamoto (1993) suggest that consumers are reluctant to transfer
information that bears a social stigma and therefore, imposes “psychic costs” such as
embarrassment or shame, but that they “may reveal psychically costly information to compete
strangers.” Internet forums provide anonymity and thus may facilitate information flows that
might not occur otherwise. Online communities provide ample opportunity to test such theories.
Future Research
Since online consumer review is a new phenomenon, many interesting questions remain
for future investigation. In our study, we mainly discuss how product characteristics affect
consumer review posting behavior. Future study could explore how consumer demographic
characteristics affect posting behavior. Another important direction for future research is to
consider how such information is used and interpreted by consumers: what type of information is
searched for online; from which type of sites is this information gleaned; and how this
information affects purchase behavior.
important target for marketers. For online product forums, acting as an intermediary between consumers, successfulattraction of postings from market mavens could be useful in garnering attention and esteem for one’s site.

25
APPENDIX
TABLE A-1
Summary Statistics
Variable N Mean SDEpinions
Price (US Dollar)Number of postingsRatings (1 - 5)Overall ratingReliabilitySeat comfortQuality and craftsmanshipRoominessHandling and controlEase of conversion
Car & DriverNumber of postingsRatings (1 - 10)Overall ratingStylingBrakingHandlingFuel economyInterior comfortAccelerationDependabilityFit and finishTransmissionRide
CarpointNumber of postingsRatings (1 - 10)Overall ratingStylingPerformanceInteriorQualityRecommendation
AutobytelNumber of postingsOverall rating (1- 100)
205196
196190190190116
6315
212
212212212212212212212212212212212
140 21
200200200200200200
177177
2618410.40
4.294.544.164.274.304.334.10
19.42
8.618.718.818.337.198.388.669.078.108.398.65
92.12
8.248.568.268.268.178.14
3.5187.20
1593311.50
0.600.520.560.500.590.600.84
23.86
1.141.110.971.161.351.061.131.061.240.940.99
56.08
0.680.690.710.670.760.76
3.2011.70
21 There are 60 models of cars in the Carpoint data that list the number of reviews as “200+”. The mean andstandard deviation for the number of reviews are calculated omitting these ambiguously high numbers. Thus, theactual mean number of reviews per model is much higher than is reported above.

26
TABLE A-1
(Continued)
Variable N Mean SDJD Power
Number of sales (Unit)Ratings (1 - 5)Mechanical qualityFeature & accessoriesBody & interiorPerformanceCreature comfortsStyle
Consumer ReportsRatings (1 - 5)Overall CRSA scoreAccident avoidanceCrash protectionOverall performanceFront crash test – driverFront crash test – passengerSide crash test – driverSide crash test – passengerOffset crash testInjury claim (vs. all vehicles)Injury claim (vs. class)AccelerationBrakingTransmissionRoutine handlingEmergency HandlingRide (normal load)Ride (full load)NoiseDriving positionControls and displaysClimate-control systemAccessCargo areaFront-seat comfortRear-seat comfortFuel economyPredicted reliabilityPredicted depreciationOwner satisfaction
223
201201201201201201
777777
132121122
9788
106121121136135135135135135128135135135135135135135126135132133130
64986
3.153.133.113.103.133.07
3.513.473.733.914.054.273.813.992.833.603.433.713.884.303.743.083.263.363.793.774.194.733.563.263.902.992.582.993.133.42
86858
0.960.960.920.940.960.95
0.920.800.880.890.690.650.980.851.091.181.150.680.770.660.760.860.810.780.720.500.600.480.730.990.640.931.031.331.001.20
N is the number of models that are rated. Mean and SD record the average and standarddeviation of these ratings.
27
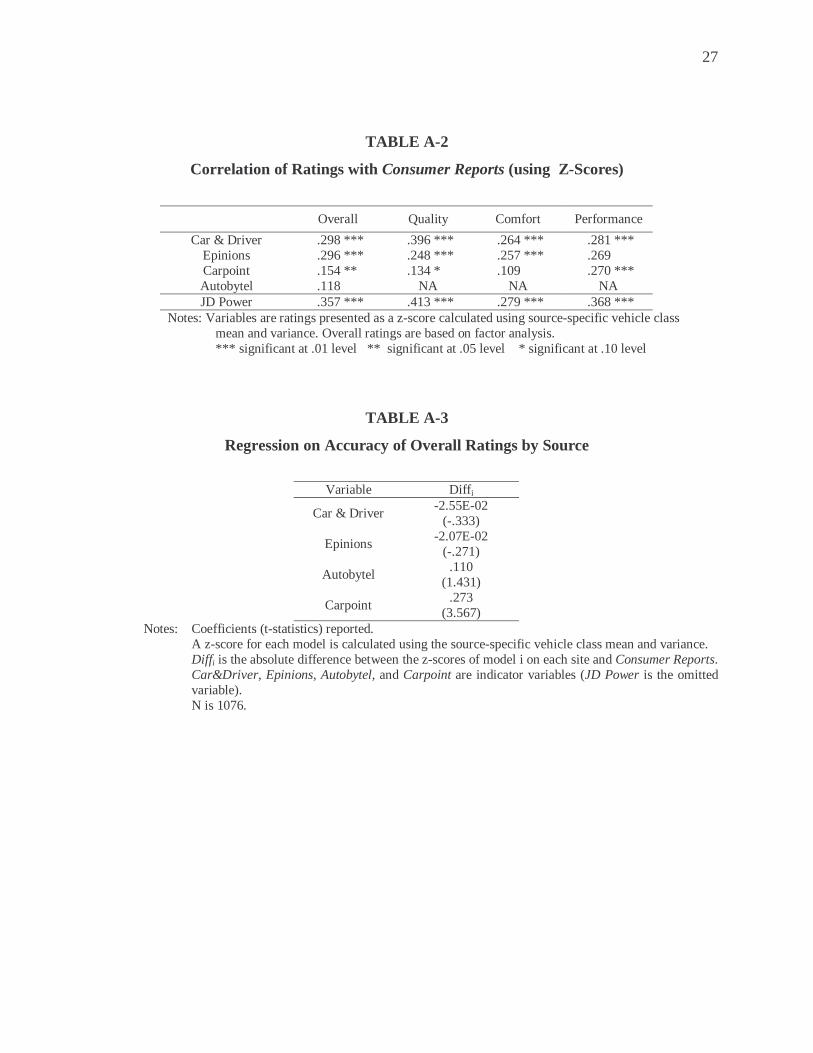
TABLE A-2
Correlation of Ratings with Consumer Reports (using Z-Scores)
Overall Quality Comfort Performance
Car & Driver .298 *** .396 *** .264 *** .281 ***Epinions .296 *** .248 *** .257 *** .269Carpoint .154 ** .134 * .109 .270 ***Autobytel .118 NA NA NAJD Power .357 *** .413 *** .279 *** .368 ***
Notes: Variables are ratings presented as a z-score calculated using source-specific vehicle classmean and variance. Overall ratings are based on factor analysis.*** significant at .01 level ** significant at .05 level * significant at .10 level
TABLE A-3
Regression on Accuracy of Overall Ratings by Source
Variable Diffi
Car & Driver-2.55E-02
(-.333)
Epinions-2.07E-02
(-.271)
Autobytel.110
(1.431)
Carpoint.273
(3.567)Notes: Coefficients (t-statistics) reported.
A z-score for each model is calculated using the source-specific vehicle class mean and variance.Diffi is the absolute difference between the z-scores of model i on each site and Consumer Reports.Car&Driver, Epinions, Autobytel, and Carpoint are indicator variables (JD Power is the omittedvariable).N is 1076.
28
REFERENCES
Agresti, Alan and Larry Winner (1997), “Evaluating Agreement and Disagreement Among
Movie Reviewers,” Chance, 10 (2), 10-14.
Allport, Gordon W. and Leo J Postman (1947), The Psychology of Rumor, New York: Holt,
Rinehar & Wilson.
Anderson, Eugene W. (1998), “Customer Satisfaction and Word of Mouth,” Journal of Service
Research, 1(1), 5-17.
----- and Mary W. Sullivan (1993), “The Antecedents and Consequences of Customer
Satisfaction for Firms,” Marketing Science, 12 (2), 125-143.
----, Claes Fornell and Donald R. Lehmann (1994), “Customer Satisfaction, Market Share, and
Profitability: Findings from Sweden,” Journal of Marketing, 58 (3), 53-66.
Arndt, Johan (1967), “The Role of Product-Related Conversation in the Diffusion of a New
Product,” Journal of Marketing Research, 4 (August), 291-95.
Avery, Christopher, Paul Resnich, and Richard Zeckhauser (1999), “The Market for
Evaluations,” The American Economic Review, 89 (3), 564-584.
29
Banerjee, V. Abhijit (1993), “The Economics of Rumors,” The Review of Economic Studies, 60
(2), 309-327.
Bickart, Barbara and Robert M. Schindler (2001), “Internet Forums as Influential Sources of
Consumer Information,” Journal of Interactive Marketing, 15 (3), 31-40.
Boor, Myron (1992), “Relationships Among Ratings of Motion Pictures by Viewers and Six
Professional Movie Critics,” Psychological Reports, 70, 1011-1021.
Brown, Jacqueline J. and Peter H. Reingen (1987), “Social Ties and Word-of-Mouth Referral
Behavior,” Journal of Consumer Research, 14 (December), 350-362.
Catterall, Miriam and Pauline Maclaran (2002), “Researching Consumers in Virtual Worlds, A
Cyberspace Odyssey,” Journal of Consumer Behavior, 1 (3), 228-237.
Chadrashekaran, Murali, Beth A. Walker, James C. Ward, and Peter H. Reingen (1996),
“Modeling Individual Preference Evolution and Choice in a Dynamic Group Setting,”
Journal of Marketing Research, 33 (May), 211-223.
Chevalier, Judith and Ellison Glenn (1999), “Career Concerns of Mutual Fund Managers,”
Quarterly Journal of Economics, 114.2 (May), 389-432.

30
Cho, Min and Dennis Galbraith (2002), “New Autoshopper.com: Automotive Web Sites Play
Different Roles in the Shopping Process,” The Power Report, 24 (1), 11.
Consumers Union (2000), “Survey Surprises,” Consumer Reports, 65 (4), 12.
---- (2001), New Car Buying Guide, Mt. Vernon, NY: Consumer Reports Books.
Dichter, Ernest (1966), “How Word-of-Mouth Advertising Works,” Harvard Business Review,
16 (November-December), 147-66.
Eliashberg, Joshua and Steven Shugan (1997), “Film critics: Influencers or Predictors,” Journal
of Marketing, 61 (April), 68-78.
Ellison, Glen and Drew Fudenberg (1995), “Word-Of-Mouth Communication and Social
Learning,” Quarterly Journal of Economics, 110 (1), 93-125.
Fehr, Ernst and Armin Falk (2002), “Psychological Foundations of Incentives,” European
Economic Review, 46, 687-724.
Feick, Lawrence F. and Linda L. Price (1987), “The Market Maven, a Diffuser of Marketplace
Information,” Journal of Marketing, 51 (January), 83-97.

31
Frenzen, Jonathan and Kent Nakamoto (1993), “Structure, Cooperation, and the Flow of Market
Information,” Journal of Consumer Research, 20 (December), 360-375.
Friedman, Monroe (1990), “Agreement Between Product Ratings Generated by Different
Consumer Testing Organizations: A Statistical Comparison of Consumer Reports and
Which? from 1957 to 1986,” The Journal of Consumer Affairs, 24 (1), 44-68.
---- (1987), “Survey Data on Owner-Reported Car Problems: How Useful to Prospective
Purchasers of Used Cars?” Journal of Consumer Research, 14 (December), 434-439.
Gachter, Simon and Ernst Fehr (1999), “Collective Action as a Social Exchange,” Journal of
Economic Behavior & Organization, 39, 341-369
Gneezy, Uri and Aldo Rustichini (2000a), “ A Fine is a Price,” Journal of Legal Studies, 29, 1-
17.
---- and ----(2000b), “Pay Enough or Don’t Pay at All,” Quarterly Journal of Economics, 115
(3), 791-810.
Greenleaf, Eric A. (1992), “Improving Rating Scale Measures by Detecting and Correcting Bias
Components in Some Response Styles,” Journal of Marketing Research, 29 (May), 176-88.

32
Griffin, Abbie and John R. Hauser (1993), "The Voice of the Customer," Marketing Science, 12
(1), 1-27.
Hanson, Heidi (2000), “Too Often, Research Plays a Less Important Role Than It Should,”
Marketing Research, 12 (2), 4-5.
Hauser, John R. (1993), "How Puritan-Bennett Used the House of Quality," Sloan Management
Review, 34 (3), 61-70.
----, Duncan I. Simester, and Birger Wernerfelt (1996), "Internal Customers and Internal
Suppliers," Journal of Marketing Research, 33 (August), 268-280.
Hong, Harrison, Jeffery D. Kubik and Amit Solomon (2000), “Security Analysts’ Career
Concerns and Herding of Earnings Forecasts,” The Rand Journal of Economics, 31 (1), 121-
144.
J.D. Power and Associates (2001), J.D. Power and Associates Sales Report, Agoura Hills, CA:
JD Power and Associates.
Johnson, Eric J. (2001), “Digitizing Consumer Research,” Journal of Consumer Research, 28
(September), 331-336.
Judge, Paul C. (1996), “Why Firefly had Mad. Ave. buzzing,” Business Week 3496 (Oct. 7), 100.

33
Jung, C. G. (1959), “ A Visionary Rumor,” Journal of Applied Psychology, 4, 5-19.
Kirby, Carrie (2000), “Everyone’s A Critic,” San Francisco Chronicle (Jan 22), E1.
Kott, Philip S. (1987), “Nonresponse in a Periodic Sample Survey,” Journal of Business and
Economic Statistics, 287-293.
Kozinets, Robert V. (1998), “On Netnography: Initial Reflections on Consumer Research
Investigations of Cyberculture,” Advances in Consumer Research, 25, 366-371.
---- (2002),“The Field Behind the Screen: Using Netnography for Market Research in Online
Communities,” Journal of Marketing Research, 34 (February), 61-72.
Lau, Geok Theng and Sophia Ng (2001), “Individual and Situational Factors Influencing
Negative Word-of-Mouth Behavior,” Canadian Journal of Administrative Sciences, 18(3),
163-178.
Leonard-Barton, Dorothy (1985), “Expert as Negative Opinion Leaders in the Diffusion of a
Technological Innovation,” Journal of Consumer Research, 11(4), 914-926.
Lillien, Gary L. and Arvind Rangaswamy (2000), “Modeled to Bits: Decision Models for the
Digital, Networked Economy,” International Journal of Research in Marketing, 17, 227-235.

34
Maddala, G.S. (1983), Limited Dependent and Qualitative Variables in Econometrics,
Cambridge, UK: Cambridge University Press.
Mahajan, Vijay, Eitan Muller and Rajendra Srivastava (1990), “Determination of Adopter
Categories by Using Innovation Diffusion Models,” Journal of Marketing Research (Feb.),
37-50.
Mayzlin, Dina (2002), “Promotional Chat on the Internet,” working paper, Yale School of
Management, New Haven, CT 06520.
McFadden, Daniel L. and Kenneth E. Train, (1996), “Consumers’ Evaluation of New Products:
Learning from Self and Others,” Journal of Political Economy, 104 (4), 683-703.
Morton, Fiona Scott, Florian Zettelmeyer and Jorge Silva-Risso (2001), “Internet Car Retailing,”
Journal of Industrial Economics, 49 (Decemeber), 501-519.
Muniz, Albert M. and Thomas C. O’Guinn (2001), “Brand Community,” Journal of Consumer
Research, 27 (4), 412-432.
Pashigian, B. Peter and Brian Bowen (1994), “The Rising Cost of Time of Females, the Growth
of National Brands and the Supply of Retail Services,” Economic Inquiry, 32 (January), 33-
65.
35
Piller, Charles (1999), “Everyone Is A Critic in Cyberspace,” Los Angeles Times, (Dec. 3), A1.
Punj, Girish N. and Richard Staelin (1983), “A Model of Consumer Information: Search
Behavior for New Automobiles,” Journal of Consumer Research, 9 (4), 366-380.
Ratchford, Brian T., Debabrata Talukdar, and Myung-Soo Lee (2001), “A Model of Consumer
Choice of the Internet as An Information Source,” International Journal of Electronic
Commerce, 5 (3), 7-21.
Reddy, Srinivas, Vanitha Swaminathan and Carol Motley (1998), "Exploring the Determinants
of Broadway Show Success," Journal of Marketing Research, 35 (August), 370-83.
Richins, Marsha L (1984), “Word-of-Mouth Communication as Negative Information,” in
Advances in Consumer Research, T. Kinnnear, eds. Provo, UT: Association of Consumer
Research, 697-702.
---- (1983), “Negative Word-of Mouth by Dissatisfied Consumers: A Pilot Study,” Journal of
Marketing, 47 (Winter), 68-78.
Rosen, Emanuel (2000), The Anatomy of Buzz, Currency Books, New York.
36
Shaffer, Greg and Florian Zettelmeyer, (2002), “When Good News About Your Rival Is Good
For You: The Effect Of Third-Party Information On The Division Of Channel Profits,"
Marketing Science, 21(3) (forthcoming).
Shugan, Steven M. and Larry Winner (2001), “Marketing Implications of Professional Product
Reviews,” working paper, University of Florida, September.
Srinivasan, Narasimhan and Brian T. Ratchford (1991), “The Empirical Test of a Model of
External Search for Automobiles,” Journal of Consumer Research, 18 (September), 233-242.
Stauss, Bernd (1997), “Global Word of Mouth.” Marketing Management, 6 (3), 28.
Tedeschi, Bob (1999), “Consumers Products are Being Reviewed on More Web Sites, Some
Featuring Comments from Anyone with an Opinion,” New York Times (Oct. 25th) C 16.
Welch, Ivo (2000), “ Herding Among Security Analysts,” Journal of Financial Economics, 58
(3), 369-396.
Wyner, Gordon A. (2000), “Learn and Earn Through Testing on the Internet,” Marketing
Research, 12 (3), 37-38.


