Are Crowds on the Internet Wiser than Experts? –
The Case of a Stock Prediction Community
Michael Nofer
Oliver Hinz
TU Darmstadt, Chair of Information Systems, esp. Electronic Markets, Hochschulstr. 1, 64289 Darmstadt, Germany.
Phone: +49-6151-16-75220, Fax: +49-6151-16-72220, e mail: nofer|[email protected].
Abstract
According to the “Wisdom of Crowds” phenomenon, a large crowd can perform better than
smaller groups or few individuals. This article investigates the performance of share
recommendations, which have been published by members of a stock prediction community on
the Internet. Participants of these online communities publish buy and sell recommendations for
shares and try to predict the stock market development. We collected unique field data on 10,146
recommendations that were made between May 2007 and August 2011 on one of the largest
European stock prediction communities. Our results reveal that on an annual basis investments
based on the recommendations of Internet users achieve a return that is on average 0.59
percentage points higher than investments of professional analysts from banks, brokers and
research companies. This means that on average investors are better off by trusting the crowd
rather than analysts. We furthermore investigate how the postulated theoretical conditions of
diversity and independence influence the performance of a large crowd on the Internet. While
independent decisions can substantially improve the performance of the crowd, there is no
evidence for the power of diversity.
Keywords: Wisdom of Crowds, Share Analysis, User-Generated Content, Social Media
JEL Classification: G21, L86
1 Introduction
Initially postulated by popular science authors (Surowiecki 2004), the “Wisdom of Crowds”
(WoC) hypothesis has been increasingly discussed by researchers from various disciplines in
recent years (e.g. Hertwig 2012; Koriat 2012; Simmons et al. 2011). According to this
phenomenon, a diverse and independent “crowd” can make more precise predictions than a few
people, even when only professionals are involved. In this article we follow Poetz and Schreier
(2012) who define the crowd as a “potentially large and unknown population” (pp. 246). While
the WoC can be widely explained by mathematical principles (Galton 1907; Hogarth 1978;
Treynor 1987) it is closely related to the concept of collective intelligence and many authors use
these terms as synonyms (Kittur and Kraut 2008; Leimeister et al. 2009; Surowiecki 2004). The
emergence of collective intelligence has been observed in many disciplines, and the Internet,
with its low communication and processing costs (Schwind et al. 2008), may especially foster
this phenomenon. The Internet is particularly suitable for studying the conditions for the WoC
phenomenon since diverse people from different places in the world interact with each other on
websites, blogs and message boards. The rise of social media applications over the last decade
fosters the extensive communication process among Internet users.
One often-cited example for this collective intelligence is the online encyclopedia Wikipedia.
The accuracy of Wikipedia’s science entries – written collectively by Internet users – was found
to be virtually as good as Britannica’s articles. Thus, an unpaid crowd did match a few
professional editors (Giles 2005).
The strength of the Internet also becomes apparent when it is used to predict future events.
Researchers successfully forecasted flu epidemics with Google (Ginsberg et al. 2009), music
sales with blogs and social networking sites (Dhar and Chang 2009), and election winners or
movie sales with prediction markets (Berg et al. 1997; Forsythe et al. 1999; Spann and Skiera
2003).
This promising evidence prompted companies to utilize the wisdom of crowds for business
purposes. The concept of open business models is not totally new. Many companies are already
“crowdsourcing” (Howe 2008) tasks to a large group of committed people on the Internet and
involve the crowd in solving business problems or in developing new products (Jeppesen and
Frederiksen 2006; Leimeister et al. 2009). Generally, the integration of customers and Internet
users is not restricted to high-technology or software companies. Chesbrough and Crowther
(2006) identified many industries (e.g. chemicals, medical devices, aerospace), which
successfully use the open innovation concept.
Previous research also suggests that the financial industry might consider the crowd’s
opinions for their investments although practical evidence is rather scarce. For instance, the
predictive value of user-generated content with regard to share returns bas been identified
(Antweiler and Frank 2004; Avery et al. 2009; Bollen et al. 2010). Hill and Ready-Campbell
(2011) used data from the Motley Fool CAPS, which is a stock prediction community in the
USA. The authors show that the members of the community outperform the S&P 500 with their
investment decisions. Moreover, using a genetic algorithm, superior investors from the crowd
can be identified based on their prior stock recommendations. In a similar study, Avery et al.
(2009) conclude that “CAPS participants possess price-relevant information that is far from
systematically incorporated in market prices” (pp. 35). However, these studies used a platform
where members can only assign buy or sell ratings for stocks and are not able to close
recommendations or specify price targets on their own.
The sole information with respect to the superior accuracy of user-generated stock predictions
compared to indices is not enough to draw conclusions about the real value for banks and
investors since professional analysts might still be more accurate with their decisions. Further,
none of the existing studies investigated the drivers of the WoC on the Internet so that forecast
accuracy might be improved by a changed setting. So far, authors only investigated
preconditions that must be met for a wise crowd in the offline world: members should be
knowledgeable, diverse and independent. In addition, participants should be motivated enough
(Page 2007; Simmons et al. 2011; Vul and Pashler 2008).
Our research is therefore twofold: First, we deal with the question of whether the crowd is
able to make better share price forecasts than professional analysts from banks, brokers and
research companies. Second, we aim to compare the forecast accuracy of the crowd under
varying degrees of diversity and independence. The article primarily focuses on the comparison
between the crowd and experts, while the influence of diversity and independence is our sub-
ordinate research objective.
We will close the gap in the literature by taking a stock prediction community as an example.
We collected data from one of the largest stock prediction communities in Europe. The platform
publishes recommendations of the crowd as well as professional analysts. Our research therefore
distinguishes from early approaches in that every recommendation has a price target and can be
opened or closed on regular trading days. Thus, we can precisely determine the performance and
the duration of the recommendations. Moreover, we can compare the accuracy of the crowd with
the accuracy of professional analysts from banks and ultimately examine the prediction accuracy
under different conditions.
The reader should always take the perspective of an investor who is seeking advice rather than
looking for the best portfolio or trading strategy. Experimental as well as empirical research
shows that many investors rely on analyst recommendations (Kelly et al. 2012). This is
especially true for smaller investors (Malmendier and Shanthikumar 2007). Our study shows
whether this confidence is justified or whether investors should better rely on the Internet crowd.
The remainder of our paper proceeds as follows: In the following section we will first
summarize important facts about stock prediction communities before presenting the theoretical
background which is necessary to derive our hypotheses. We discuss the value of expertise in
forecasting and the conditions that must be met for a wise crowd. Section 3 describes the setup of
our empirical study while section 4 presents the results. We conclude with implications and a
summary of our results before pointing out limitations and making suggestions for future
research.
2 Previous Research
In this section we will first outline was has been found about stock prediction communities and
the wisdom of crowds in general. Afterwards we present the theoretical background and related
hypotheses.
2.1 Domain Background

Before the emergence of sophisticated stock prediction communities, people discussed the stock
market development on the Internet with the help of blogs or message boards (e.g. Yahoo!
Finance). Computational linguistics methods allow researchers to determine the quality of
Internet posts as well as classify them into positive, negative or neutral opinions about the
respective company (Gu et al. 2007). For instance, Antweiler and Frank (2004) analyzed the
content of stock message boards and found that the volume of messages can predict market
volatility as well as stock returns. However, the authors did not find a statistically significant
relationship between positive (“bullish”) comments and share price returns.
With the rise of Social Media, stock prediction communities have gained more and more
attraction. Prominent examples of stock prediction communities include the Motley Fool CAPS,
Piqqem or Covestor. These platforms differ from traditional stock message boards to the extent
that community members not only discuss about companies but also pick stocks according to
their expectations. Thus, there is no need to interpret positive or negative signals by analyzing
text messages. Instead, buy and sell recommendations can be clearly identified depending on
whether an Internet user is buying or selling the respective stock.
2.2 Theoretical Background
In this section we focus on the theoretical background in order to derive our hypotheses. We
therefore present preconditions for a wise crowd, which have been mainly identified in the
offline world. Evidence from an Internet setting is rather scarce so far.
2.2.1 Comparison between Professional Analysts and the Crowd
Although previous research indicates that user-generated content can be used to predict share
returns, until now, no study has compared the performance of the crowd with the
recommendations of highly paid financial experts in the real world. In our case, we describe the
term “expert” as someone who performs a task for working reasons and spends plenty of time
with his profession. Thus in our context, an expert is defined as a professional analyst from a
bank who has a lot of experience in his area of expertise: publishing share recommendations and
predicting the stock market development.
Cognitive-science research attests that experts, at least within their domains, possess superior
skills and thinking strategies compared to novices (Anderson 1981; Larkin et al. 1980).
However, studies from finance, economics, medicine and other research areas suggest that the
value of expertise is limited, especially in terms of forecasting future developments (Johnston
and McNeal 1967). For instance, Levy and Ulman (1967) presented subjects, who had varying
expertise in psychology (i.e., professional mental health workers, student mental health workers
and people with no mental health experience at all), with 96 pictures – half painted by
psychiatric patients and half by normal people. Accuracy in distinguishing the healthy people
from the patients did not depend on the participants’ expertise.
Armstrong (1980) developed the seer-sucker theory concluding that “No matter how much
evidence exists that seers do not exist, suckers will pay for the existence”. According to the
author, this simply means that expertise is of little or no value at all. Armstrong refers to many
examples in the literature which support the seer-sucker theory. For instance, Taft (1955) shows
that professional psychologists are worse in judging people compared to non-psychologists.
On the Internet, you can find evidence suggesting that a large crowd is at least able to keep up
with experts. The accuracy of Wikipedia’s science entries that are mostly written by dedicated
amateurs matches those of the professional Encyclopedia Britannica (Giles 2005). Spann and
Skiera (2003) compared the Hollywood Stock Exchange prediction market with expert
predictions in terms of new movies’ box-office success, and found that the experts could not
substantially outperform the crowd on the opening weekend.
With regard to expertise in the financial industry, it is widely known that professional
financial analysts and fund managers tend to underperform the broader market with their
investment decisions (Carhart 1997; Jensen 1968; Malkiel 1995). Although share analyses exert
considerable influence on the market participants’ investment decisions through the media, the
accuracy of these forecasts has been found to be quite poor (Diefenbach 1972). Bogle (2005)
studied two 20-year periods between 1945-1965 and 1983-2003 and found that the average
equity fund return fell short of 1.7 percentage points of the S&P 500 return in the first case and
2.7 percentage points in the latter case. Taking another benchmark index, the author previously
showed that between 1984 and 1999, about 90 percent of all mutual funds achieved a lower
return than the Wilshire 5000 index, which measures the performance of all publicly traded
shares in the USA (Bogle 2001).
In contrast to professional share analyses, first studies in the area of stock prediction
communities show promising results with respect to the crowd’s ability to beat the broader
market. For instance, Hill and Ready-Campbell (2011) found that the Internet crowd is able to
outperform the S&P 500 by 12.3 percentage points during 2008. Collectively, the findings about
the value of expertise suggest:
H1: Members of a stock prediction community on the Internet (=crowd) are able to
achieve a higher daily return than professional analysts from banks, brokers and
research companies (=experts).
2.2.2 Conditions for a Wise Crowd
Researchers from various disciplines are preoccupied with the question why the WoC actually
works. According to a wide range of studies, there are four conditions that must be met for a
wise crowd: knowledge, motivation, diversity and independence (Simmons et al. 2011).
In our given setting, we assume that the platform leads to a typical self-selection towards
knowledgeable and motivated users. We believe that most of the participants have a certain
amount of knowledge about the stock market and are motivated enough. Members would not
voluntarily register on the platform and spend plenty of time for sharing their opinions with other
members if they had little knowledge or motivation. Antweiler and Frank (2004) studied content
of Internet stock message boards and refer to theories of DeMarzo et al. (2001) and Cao et al.
(2002) in order to explain the motivation for posting messages. For stock market participants it
might be profitable to gain influence in the community since recommendations can affect share
prices if other investors follow. Participation is also driven by the willingness to learn from other
members, especially in the case of sidelined investors.
The degree of independence and diversity is however changing on the platform – thus
affording the opportunity of a natural experiment – so that we can examine their effect on the
performance of the crowd.
Diversity
The reason why diverse groups are often doing better is grounded in the fact that they are more
able to take alternatives into account. A number of studies investigated the problem-solving
effectiveness of groups depending on their composition. For instance, Watson et al. (1993) found
that in the long run, groups with a higher cultural diversity generate more alternatives and a
broader range of perspectives. Hong and Page (2001) present a model showing that diversity in
terms of the workers’ perspectives significantly enhances their ability to solve even difficult
problems.
Organization science has also been reflecting on the optimum composition of working groups
(Williams and O’Reilly 1998). Informational diversity is considered as a key driver of
performance (Jehn et al. 1999), although too much informational overlap was found to be
counterproductive (Aral et al. 2008). Bantel and Jackson (1999) showed that innovation in banks
is positively influenced by the diversity of their management teams with regard to age, education
and functional experience. Reagans and Zuckerman (2001) found support for the positive
relationship between diversity and productivity in the sense that network heterogeneity leads to
more communication among team members with different organizational tenure. This reduces
demographic boundaries and enables access to different information, perspectives and
experiences.
Further evidence for the superior performance of diverse groups comes from March (1991).
While homogenous groups that are composed of only long-term employees focus on exploiting
the existing knowledge, heterogeneous groups with a mixed composition of employees are better
at exploring new ideas and alternatives. Although being less knowledgeable than their
experienced senior colleagues, new recruits enhance the diversity and therefore make the entire
group smarter regardless of their individual abilities. This is due to the novel information brought
to the group.
With respect to financial investment decisions, numerous studies report differences between
men and women. Sunden and Surette (1998) found that gender diversity exerts an influence on
the asset allocation of retirement savings plans. Other evidence for the different investment
behavior with respect to pensions comes from Bajtelsmit and VanDerhei (1996) and Hinz et al.
(1997) who show that women invest more conservatively than men. Researchers explain these
differences by investigating risk preferences: women tend to be more risk averse than men (Arch
1993; Byrnes et al. 1999; Jianakoplos and Bernasek 1998). These differences can be explained
by the level of overconfidence. Research in psychology demonstrates that in general men are
overconfident (Deaux and Farris 1977; Lewellen et al. 1977). According to Prince (1993) men
also feel more competent with respect to financial decision making. Overconfident investors hold
riskier portfolios (Odean 1998) and are more prone to excessive trading which leads to
decreasing returns (Barber and Odean 2001).
The overall conclusion from this line of research is that diversity opens possibilities for
gaining access to different sources of knowledge and information, which fosters problem solving
and overall performance. Further, differences in preferences or opinions among crowd members
(e.g. caused by gender differences) ensure that collective errors will be reduced and estimates
converge to the correct values. Collectively, the findings about diversity suggest:
H2: Increased diversity among the members of the crowd will lead to higher daily
returns of recommended stocks.
Independence
In contrast to diversity, the prevailing view in the literature with respect to the influence of
independence is not clear. Independence means that each crowd member can make his or her
decision relatively freely and without being influenced by other opinions (Surowiecki 2004).
According to previous research, independence is often shown to serve as a positive driver for the
performance of groups. By means of a laboratory experiment, Lorenz et al. (2011) revealed that
little social influence within the group can be enough to reduce the WoC effect. The subjects in
this experiment successively had to answer several estimation questions with regard to
geography and crime statistics, and were exposed to different degrees of social influence.
Participants either received full, aggregated or no information at all about their group members’
estimates. This study revealed that the information about the others’ opinion alone leads to a
convergence of the answers without improving the accuracy of the decision in terms of collective
error.
If individual decisions depend on the previous behavior of others, herding or so-called
“information cascades” can result just because of the assumption that the others are better
informed. Informational cascades occur when people ignore their private information and blindly
follow the crowd. This pattern has been shown theoretically as well as empirically for investment
recommendations (Graham 1999; Scharfstein and Stein 1990) and also for general social and
economic situations (Banerjee 1992; Bikhchandani et al. 1992). In the area of finance, herding
means that investors’ behavior converges. Welch (2000) has shown that the recommendation
revision of a security analyst positively influences the next two revisions of other analysts.
Interestingly, the influence of the consensus estimate on the recommendation revision of analysts
is not affected by its previous accuracy. Thus, herding can obviously happen without the
certainty of correct evaluations, which is why individuals sometimes seem to irrationally rely on
other opinions.
However, following the crowd does not always need to be irrational. Scharfstein and Stein
(1990) presented a model that assumes herding as rational behavior among investment managers.
In the case of a wrong decision, the reputation only suffers if the responsible manager was the
only one who bought the bad product. This is why even good managers herd on bad decisions
instead of taking the risk to fail exclusively. The theoretical insights from the model have been
tested empirically: Graham (1999) found evidence for herding behavior among investment
newsletters. The author observed newsletters that herd on the investment advices of the best
known and well-respected newsletter “Value Line”.
More evidence for behavior adaption comes from Banerjee (1992) and Bikhchandani et al.
(1992), who presented models showing that information cascades can arise when people believe
that the other persons have superior information. This leads to a loss of private information since
individuals adopt the behavior of others instead of relying on their own information. Similarly,
Hinz and Spann (2008) found that information coming from strong ties can decrease the
performance of economic decisions, while information coming from distant parts of social
networks can have a positive impact on said performance.
Despite this broad evidence for the power of independence, there are also notes in the
literature which indicate the opposite. Especially research on forecasting provides examples,
which show that communication among members can improve the overall group performance.
Prediction markets, such as the Iowa Electronic Markets (prediction of election winners) or the
Hollywood Stock Exchange (prediction of new movies’ box-office success), allow people to
trade virtual stocks that receive payoffs depending on the outcome (Wolfers and Zitzewitz 2004).
On these platforms, stock prices are visible to all members so that independence is rather small.
Another example where decisions depend on observable opinions of other participants is the
Delphi method. Participants are repeatedly asked to answer questionnaires. The fundamental idea
is to achieve convergence to the true value by iterating question rounds. After providing their
own beliefs, participants receive the opinions of other members as well as arguments for the
decision (Dalkey and Helmer 1963). Although both prediction markets as well as Delphi studies
violate the condition of independence, the accuracy of these methods has found to be quite high
(Ammon 2009; Forsythe et al. 1999; Spann and Skiera 2003).
Despite this evidence from Delphi studies and prediction markets, we expect that stock
predictions of an Internet community will benefit from more independence. Financial markets
have shown to be particularly vulnerable to herding, information cascades and other effects
which are threats to independence. Thus, we hypothesize:
H3: A reduced degree of independence among the members of the crowd will decrease
the daily return of recommended stocks.
3 Setup of Empirical Study
3.1 Data Collection
We collected data from one of the largest European stock prediction communities on which
members can assign buy or sell ratings, enter price targets and precisely quantify their
expectations on the stocks’ performances. This website publishes stock recommendations of
dedicated amateurs (=crowd) as well as professional analysts from banks, brokers and research
companies.
Every stock prediction is visible to the other members of the platform. In addition to the
predictions of the Internet crowd, the website also collects the recommendations of leading
financial institutions such as HSBC, Goldman Sachs, Deutsche Bank or Morgan Stanley, which
will be referred to as “analysts” or “experts” in the following analysis. Thus, a recommendation
of an analyst always occurs in the name of a bank or broker. While crowd members have to
register on the website and fill out the Internet form for publishing their recommendations, the
professional share recommendations are automatically integrated every time a bank publishes a
new share analysis. Overall, our dataset consists of 10,146 single stock predictions published
between May 2007 and August 2011. 1,623 different crowd members made 8,331
recommendations whereas 40 different analysts (i.e. financial institutions) made 1,815
recommendations. These numbers indicate that the crowd is much larger compared to the group
of analysts. We only considered blue chip stocks from the DAX index to ensure that stock
predictions on the platform have no direct market impact and thus to avoid endogeneity problems
which may exist, for example, for penny stocks.
In the same way as professional analysts operate in the real world, crowd members can open
and close their recommendations at any time during regular trading days. Each recommendation
is automatically closed after the maximum duration of 180 days. Thus, the platform transforms
the well-known principles of share analyses to the key features of the Internet. Recommendations
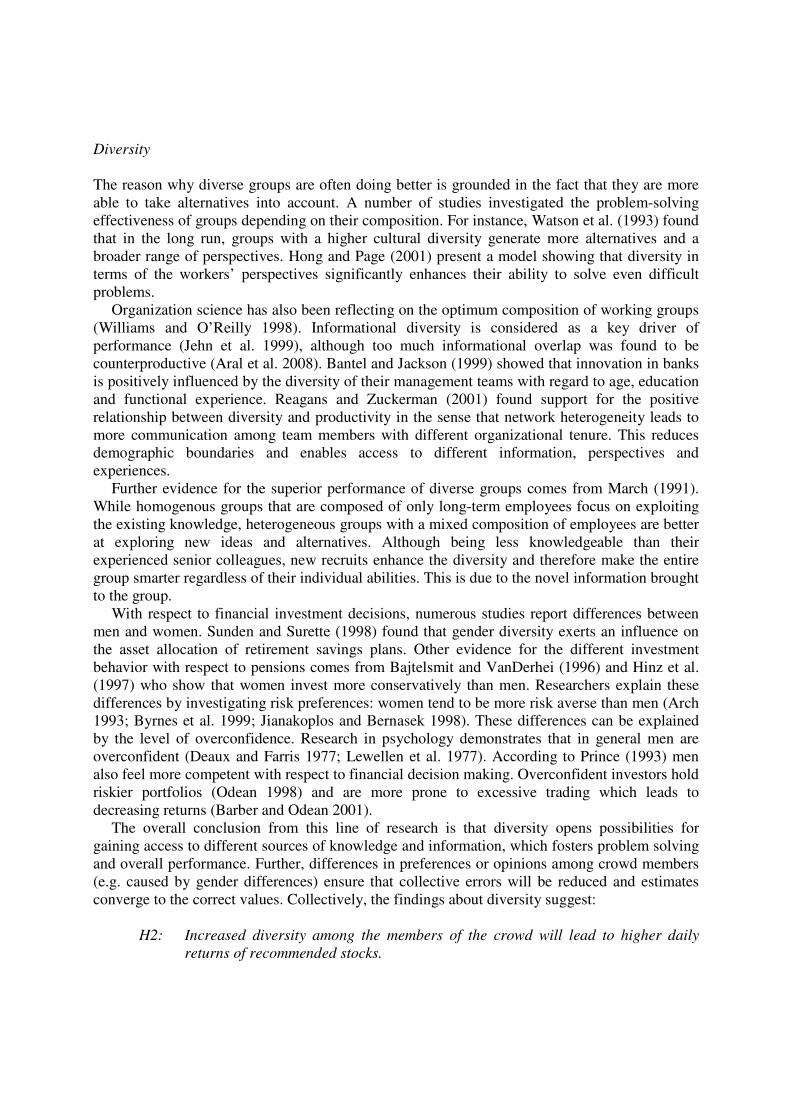
from professional analysts and the crowd are presented in a similar manner. Beside the name of
the bank or crowd member, each recommendation consists of the rating (buy, sell or hold),
current price, target price, start price, actual performance as well as target return. In addition, the
website also shows information on the previous accuracy (ranking). See Figure 1 for a
screenshot.
It is important to note that only the crowd members communicate with each other on the
website. Members can write public comments on other recommendations, private messages to
virtual friends or take part in forum discussions. Professional analysts are not an active part of
the stock community rather their recommendations in the name of the bank are automatically
integrated on the website as soon as these recommendations have been released to the public.
Figure 1: Screenshot of an Analyst’s Recommendation
While other stock prediction communities also provide buy and sell ratings, this platform is
unique in terms of the specification of price targets as well as the opportunity to close
recommendations. So far, researchers had to choose a time horizon by their own (i.e., four weeks
or two months), assuming that an open stock prediction is valid during the entire period. But it
surely can make a difference if an investor opens a recommendation on one day and closes it
three days after when his opinion has changed. The unique features of the community platform
enables us to take potentially different durations into account and thus to precisely determine the
performance and compare the results on a daily basis.
Table 1 provides descriptive statistics for all variables, which are used in the following
analysis. We obtained stock market data from the Frankfurt Stock Exchange (FWB).
In order to test our hypotheses, we use the daily return of recommended stocks as outcome
variable of interest. Assume that a buy recommendation for BMW was opened on May 3 with a
price target of 66€ for this particular share. The current share price of BMW was 60€ on that day.
One month later on June 3, the recommendation was closed by the member. During this month
the share price increased by 5% to 63€. Thus, this stock prediction for BMW would have
achieved an overall return of 5%. In order to compute the daily return, we divide the overall
return by the term of the recommendation (in days). Thus, in this case we divide 5% by 30 days
and receive a daily return of 0.17%. We measure daily returns to make different time horizons
comparable since it makes a difference if someone is able to achieve a 5% return within one
month or six months. In case of a sell recommendation, an individual achieves a positive return if
the share price decreases.
We further need information on the degree of diversity and independence on the platform. H2
postulates that the performance of the crowd improves with greater diversity. Previous studies
frequently operationalized diversity by means of demographic information, such as age and
gender (see Section 2). We follow this approach and operationalize diversity by the variance of

age and gender of the crowd members based on the self-reported personal profiles on the
platform.
Table 1: Operationalization Summary
Variable Unit Min Max Mean Std.Dev.
Independent
variable Daily
Return
Daily return of recommended stocks (in
percent) -0.06 0.20 0.0018 0.0134
Wo
C v
ari
able
s
Independence
Analysts
Dummy variable for the presence of
professional analysts on the platform (1 =
present; 0 = otherwise)
0 1 - -
Ranking
Dummy variable for the improved ranking
system on the platform (1 = improved ranking
system is present when the recommendation is
made; 0 = otherwise)
0 1 - -
Div
ers
ity Age Diversity Standard deviation of all crowd members‘ age 8.44 12.10 11.64 0.68
Gender
Diversity
Gender diversity of all crowd members as
measured by 1 - | % of male - % of female| 0 0.11 0.078 0.24
Co
ntr
ol
vari
able
s
Mark
et
Pa
ram
ete
rs
Momentum Share price when recommendation is made
divided by share price three months before 0.12 5.55 1.0099 0.26
Trading
volume
Average daily turnover (in €) of shares within
the last three months before the stock pick 14,001 14,806,239 1,965,386 1,816,787
DAXTrend
Dummy variable for the DAX performance
(=overall market trend) during the
recommendation period (1 = bull market, i.e.
level of the DAX increases during the
recommendation period; 0 = otherwise)
0 1 - -
Risk
Standard deviation of the daily returns of
recommended shares within the observation
period
0.015 0.039 0.025 0.007
Mem
bers
‘
Ch
ara
cte
rist
ics
Activity
Number of stock predictions divided by the
period of membership on the platform 0 15 0.7916 1.2610
Accuracy
Percentage of accurate stock predictions in the
past 0 0.98 0.5024 0.2513
We define age diversity as the standard deviation of the age of all members, which is around 8
in May 2007. This value increases to 12 by the end of our observation period (see Appendix).
We operationalize gender diversity by considering the deviation of the ratio between male and
female members from the 50:50 gender ratio on the platform:
������������� = 1 −|���������������� − ������������������| (1)
For instance, if there were a totally balanced gender distribution on the platform (50% men
and 50% women), the deviation from the 50:50 ratio would be 0 so that gender diversity has the
highest possible value of 1. The lowest value of 0 would occur if only men or women were
registered. Thus, the higher the value for this variable, the more diverse is the platform with
respect to gender.
At the end of 2007 there was only a gender diversity of 0.055, compared to 0.083 in August
2011. With a higher standard deviation of the crowd members’ age (in years) and changing
gender diversity, overall diversity increases over time (see Appendix).

Two radical changes on the platform reduce the degree of independence among the members
of the crowd. First, in May 2010, the platform provider introduced a new ranking system, which
provides a more precise picture of the members’ accuracy compared to the old system. Between
2007 and 2010, the rankings were only based on the hit rate (ratio between correct and wrong
picks) and average performance of the recommendations. The revised ranking system provides
several improvements so that the figures are more meaningful. Now, a complex algorithm
calculates the rankings, ensuring a high degree of transparency and forecasting quality.
Another new component is that the ranking calculation only considers shares fulfilling certain
quality criteria. For example, the particular share must trade above .10 EUR and exceed a daily
trading volume of 500,000 EUR, which ensures that so-called penny stocks are excluded from
the calculation. A further modification is that a member must reach a minimum number of five
recommendations before receiving a ranking position. The algorithm then determines the
members’ skill level on a daily basis through carrying out buy or sell transactions in a virtual
depot. The skill level is thereby calculated by the comparison between the performance of the
virtual portfolio and the STOXX Europe 600, a broad European market index. In sum,
performance indicators are more realistic now so that the improved ranking system provides a
more precise picture of the members’ ability to predict the stock market development. In addition
to quality improvements, the platform provider made considerable efforts to introduce the
ranking system to the community members (e.g. beta testers). Top users are more visible now
since members with the highest prediction accuracy are marked with a “top user” symbol. We
therefore suggest that more members will consider the other users’ recommendations so that
independence will decrease.
The second threat to independence is the publication of professional analysts’
recommendations on the platform. These were added in October 2009 and allowed us to
investigate whether the presence of professional analysts exerts an influence on the crowd’s
investment decisions.
Studies in financial economics have shown that stock returns depend on stock specific
characteristics and overall market conditions. It is therefore necessary to control for a number of
factors, which are not part of the WoC phenomenon. Momentum implies the performance within
the last three months before the recommendation was opened. This figure simply shows whether
a stock was a previous winner or loser. Infineon showed the highest three month momentum
when the share price quintupled between March and June 2009.
The inclusion of momentum is necessary since the members’ return might depend on market
trends (upturn or downturn phase). In a similar study of a stock prediction community, Avery et
al. (2009) also considered the stocks’ momentum for distinguishing between bull and bear
markets. Momentum strategies (buying past winners and selling past losers) are very common
among investors. Many studies which investigate the stock picking ability of mutual fund
managers refer to the momentum effect (e.g. Carhart 1997; Daniel et al. 1997). Among others,
Jegadeesh and Titman (1993) documented that superior returns in the US stock market can be
achieved by selecting shares based on their performance in the past 3 to 12 months. Rouwenhorst
(1998) confirmed this return continuation for European countries. The literature provides
different explanations for the relationship between past performance and future stock returns,
e.g. data mining or behavioral patterns (Hong and Stein 1999).
Trading volume represents the average daily turnover of shares within the last three months
before the recommendation was opened. There are companies, which are heavily traded
especially considering the critical months of the financial crisis in 2008 and 2009 (i.e.
Commerzbank, Deutsche Bank). On the other hand, companies of more defensive sectors (e.g.
E.ON) or smaller companies (e.g. Infineon) experience a much smaller trading volume. The
average daily turnover prior to the share recommendation is 2 million €.
DAXTrend is a dummy variable for the DAX performance (=overall market trend) during the
recommendation period (1 = bull market, i.e. level of the DAX increases during the
recommendation period; 0 = otherwise). Previous studies indicate that forecasting abilities of
investors might depend on market trends, being more optimistic during bull markets and vice
versa (see for example DeBondt 1993). We therefore control for the stock market climate on the
macro level.
Risk shows each company share’s risk as measured by the standard deviation of daily returns
within the observation period. Returns of riskier stocks fluctuate more heavily and therefore have
a higher standard deviation. We observe the lowest standard deviation for Deutsche Telekom
(.015) while Infineon is the riskiest company in our sample (.039). Studies in the area of stock
predictions typically take the risk of individual stocks into account (e.g. Hill and Ready-
Campbell 2011).
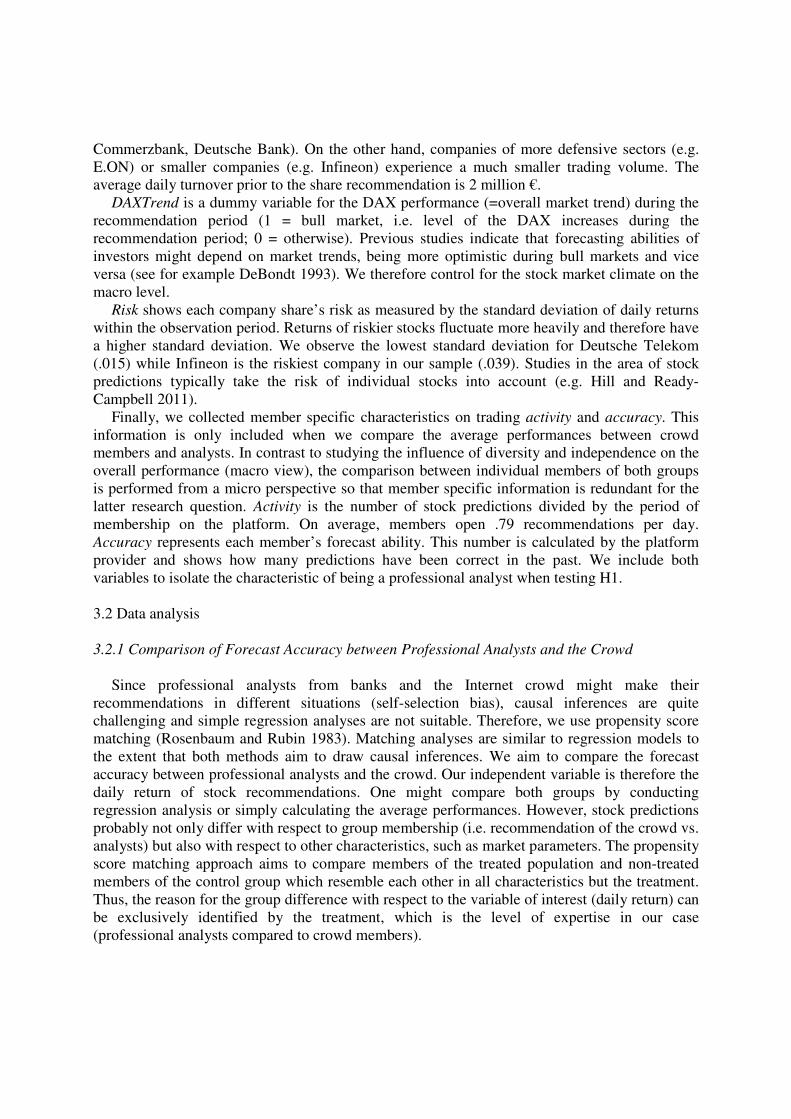
Finally, we collected member specific characteristics on trading activity and accuracy. This
information is only included when we compare the average performances between crowd
members and analysts. In contrast to studying the influence of diversity and independence on the
overall performance (macro view), the comparison between individual members of both groups
is performed from a micro perspective so that member specific information is redundant for the
latter research question. Activity is the number of stock predictions divided by the period of
membership on the platform. On average, members open .79 recommendations per day.
Accuracy represents each member’s forecast ability. This number is calculated by the platform
provider and shows how many predictions have been correct in the past. We include both
variables to isolate the characteristic of being a professional analyst when testing H1.
3.2 Data analysis
3.2.1 Comparison of Forecast Accuracy between Professional Analysts and the Crowd
Since professional analysts from banks and the Internet crowd might make their
recommendations in different situations (self-selection bias), causal inferences are quite
challenging and simple regression analyses are not suitable. Therefore, we use propensity score
matching (Rosenbaum and Rubin 1983). Matching analyses are similar to regression models to
the extent that both methods aim to draw causal inferences. We aim to compare the forecast
accuracy between professional analysts and the crowd. Our independent variable is therefore the
daily return of stock recommendations. One might compare both groups by conducting
regression analysis or simply calculating the average performances. However, stock predictions
probably not only differ with respect to group membership (i.e. recommendation of the crowd vs.
analysts) but also with respect to other characteristics, such as market parameters. The propensity
score matching approach aims to compare members of the treated population and non-treated
members of the control group which resemble each other in all characteristics but the treatment.
Thus, the reason for the group difference with respect to the variable of interest (daily return) can
be exclusively identified by the treatment, which is the level of expertise in our case
(professional analysts compared to crowd members).
We first identify statistical twins of the crowd’s recommendations, which are similar to
recommendations of analysts (=”treated” population). We first compute propensity scores, which
represent the probability that a recommendation was made from a professional analyst given the
following control variables: Trading volume, momentum, DAXTrend, risk, activity and accuracy
(see section 3.1 for a description of all variables).
In a next step, we match the recommendations of analysts and the crowd. Only share
recommendations that resemble each other in the above mentioned characteristics will be
compared. Since it is almost impossible to find statistical twins, which have identical values for
all characteristics, we calculate propensity scores in order to determine the similarity. Two share
recommendations with similar propensity scores can be compared so that the results are unbiased
and allow us to attenuate a potential self-selection bias.
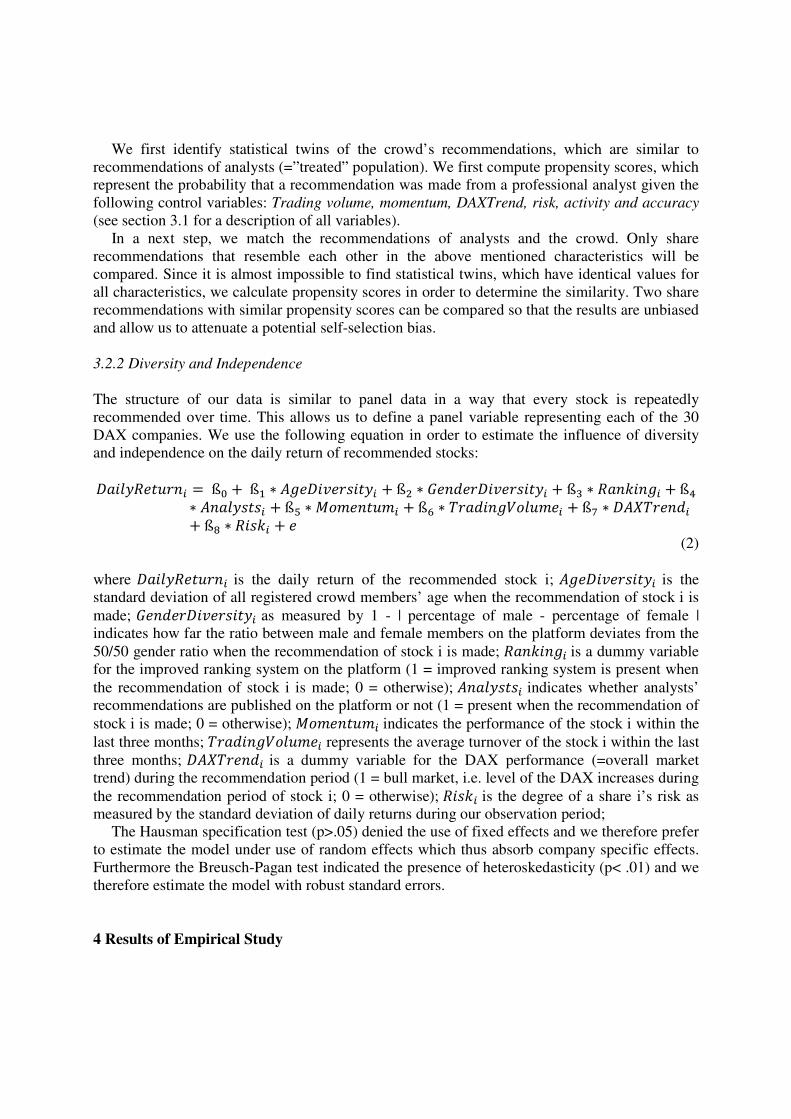
3.2.2 Diversity and Independence
The structure of our data is similar to panel data in a way that every stock is repeatedly
recommended over time. This allows us to define a panel variable representing each of the 30
DAX companies. We use the following equation in order to estimate the influence of diversity
and independence on the daily return of recommended stocks:
������������ =ß� +ß! ∗ #���������� + ß$ ∗ �������������� + ß% ∗ ���&���� + ß'∗ #������ + ß( ∗ ��������� + ß) ∗ *������+������ + ß, ∗ �#-*�����+ ß. ∗ ��&� + �
(2)
where ������������ is the daily return of the recommended stock i; #���������� is the
standard deviation of all registered crowd members’ age when the recommendation of stock i is
made; �������������� as measured by 1 - | percentage of male - percentage of female |
indicates how far the ratio between male and female members on the platform deviates from the
50/50 gender ratio when the recommendation of stock i is made; ���&���� is a dummy variable
for the improved ranking system on the platform (1 = improved ranking system is present when
the recommendation of stock i is made; 0 = otherwise); #������ indicates whether analysts’
recommendations are published on the platform or not (1 = present when the recommendation of
stock i is made; 0 = otherwise); ��������� indicates the performance of the stock i within the
last three months; *������+������ represents the average turnover of the stock i within the last
three months; �#-*����� is a dummy variable for the DAX performance (=overall market
trend) during the recommendation period (1 = bull market, i.e. level of the DAX increases during
the recommendation period of stock i; 0 = otherwise); ��&� is the degree of a share i’s risk as
measured by the standard deviation of daily returns during our observation period;
The Hausman specification test (p>.05) denied the use of fixed effects and we therefore prefer
to estimate the model under use of random effects which thus absorb company specific effects.
Furthermore the Breusch-Pagan test indicated the presence of heteroskedasticity (p< .01) and we
therefore estimate the model with robust standard errors.
4 Results of Empirical Study

4.1 Comparison of Forecast Accuracy between Professional Analysts and the Crowd
Table 2: Results from Probit Regression
Coefficient Std. Err. P > | t |
Constant -2.638 .107 .000
Momentum .501 .066 .000
TradingVolume -.000 .000 .000
DAXTrend .627 .039 .000
Risk -20.399 2.518 .000
Activity -.145 .018 .000
Accuracy 2.756 .100 .000
Dependent variable: Probability of being an analyst’s recommendation;
Number of observations: 10,146; R² = 0.210
Results from the probit regression (Table 2) reveal that the probability of being an analyst’s
recommendation decreases by trading volume, activity and risk. The probability increases by
accuracy, DAXTrend and momentum.
We are now able to match stock predictions of analysts and the crowd based on similar
propensity scores. Table 3 indicates that, on average, the daily return of an analyst is 0.0016
percentage points less than the return of a statistical twin of the crowd whose prediction is
similar in terms of the control variables (p<0.01). Without the matching method, the difference
between controls (=crowd) and treated (=analysts) would be underestimated (see “Unmatched”
row in Table 3).
Our results provide empirical evidence for the phenomenon that the crowd is able to
outperform the experts with regard to the prediction of share price returns, supporting H1.
Table 3: Results of Propensity Score Matching
Dependent
variable:
Daily
return
Sample Treated
(Analysts)
Controls
(Crowd)
Difference S.E. T-stat
Unmatched .000997082 .002034046 -.001036964 .000346798 -2.99
Average treatment
effect on the
treated (ATT)
.000997082 .002622888 -.001625806 .00029919 -5.43
The difference between the average performance of the crowd and analysts is statistically
significant (T = 5.43; p<0.01, two-tailed t-test) but economically small, even if we make a
projection for the entire year. Assuming 365 days, Internet users achieve an annual return that is
0.59 percentage points higher than professional analysts from banks, brokers and research
companies. For the reader, this number should only serve as orientation since security returns are
usually provided on annual basis. In our case, we only measure and compare the average return
per day. The construction of trading portfolios which follow the members of the stock prediction
community is out of the scope of this article. The reader is referred to Hill and Ready-Campbell
(2011) who create sophisticated trading algorithms based on the crowd’s stock picks.

However, we are confident that the crowd can also achieve reasonable returns after the
consideration of transaction costs. The average duration of a crowd member’s recommendation
is 81 days, while analysts’ recommendations are closed after 128 days. Thus, we need on average
8 trades per year (4 times open and close) for the crowd and 4 trades for analysts. Without
transaction costs, (matched) crowd members realize a return of 0.0026% per day (or 0.95% per
year), while analysts achieve 0.0010% percent per day (or 0.37% per year). Assuming
transaction costs of 0.1% per trade, this would reduce the return of an average crowd member to
0.15%, while the overall return of analysts would even be negative (-0.03%).
Thus, the superiority of the crowd would remain even after taking transaction costs into
account. However, from an economic point of view, these effects are quite small. We can
therefore confirm previous results from Antweiler and Frank (2004) who studied the influence of
stock message postings on returns and conclude that the result “does seem to be economically
small but statistically robust” (pp. 1261). Our study not only indicates the existence of a
collective intelligence within groups, but also finds evidence for the superiority of large diverse
groups compared to a few experts.
Another interesting finding is that the crowd is also able to outperform the broader stock
market. The DAX index, which contains the 30 largest companies in Germany, lost 20 percent
within the period of analysis and thus both, the focal community crowd and experts,
outperformed the market substantially. At first glance this seems surprising given the fact that
the size of the stock prediction community is relatively small compared to the entire stock
market. The whole wisdom of crowds approach is based on the assumption that large groups or
markets perform better than smaller groups and individuals. According to the efficient market
hypothesis, investors should not be able at all to gain superior returns (Fama 1970). However,
our results confirm previous studies showing that a stock prediction community on the Internet is
able to achieve excess returns against the stock market. In a study of Hill and Ready-Campbell
(2011) the Internet crowd outperforms the S&P 500 by 12.3 percentage points in 2008. Earlier
studies from Das and Chen (2007) and Antweiler and Frank (2004) focusing on Internet stock
message boards also indicate that content from financial communities has predictive value to
major stock indices.
One explanation for the superior performance of the Internet community compared to the
overall stock market might be that the stock market is worse affected by negative influences that
prohibit wise crowds. Numerous studies have shown herding among institutional investors (see
Section 2) and thus individual stock predictions of these professional analysts might not be
independent enough from each other. As a result, speculative bubbles can evolve driving security
prices far away from fundamental values since investors rely on common views of other
investors instead of rationally evaluated market prices (Shiller 2002). Thus, the stock prediction
community on the Internet might be more diverse and independent than the overall market which
is characterized by extensive word-of-mouth communication (Hong et al. 2005).
With regard to the superior performance of the crowd compared to analysts, we identify one
main explanation: the higher agility of the Internet users’ stock recommendations. We used two
agility figures and applied an independent-samples t-test for comparing mean values of the
crowd and analysts (Table 4).
First, crowd members are more active in opening and closing the recommendations. While the
average duration of an analyst’s prediction is 128 days, crowd members only leave their
recommendations open for an average of 81 days. This is why the crowd is more able to take
advantage of existing trends.
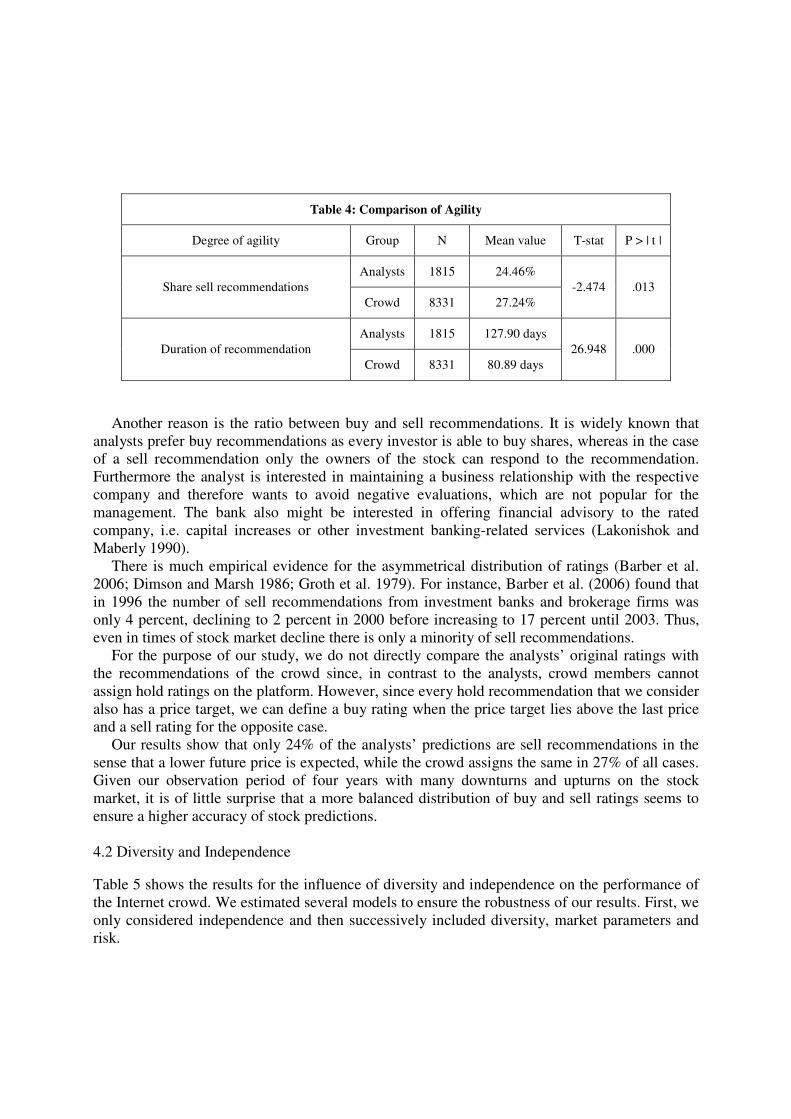
Table 4: Comparison of Agility
Degree of agility Group N Mean value T-stat P > | t |
Share sell recommendations
Analysts 1815 24.46%
-2.474 .013
Crowd 8331 27.24%
Duration of recommendation
Analysts 1815 127.90 days
26.948 .000
Crowd 8331 80.89 days
Another reason is the ratio between buy and sell recommendations. It is widely known that
analysts prefer buy recommendations as every investor is able to buy shares, whereas in the case
of a sell recommendation only the owners of the stock can respond to the recommendation.
Furthermore the analyst is interested in maintaining a business relationship with the respective
company and therefore wants to avoid negative evaluations, which are not popular for the
management. The bank also might be interested in offering financial advisory to the rated
company, i.e. capital increases or other investment banking-related services (Lakonishok and
Maberly 1990).
There is much empirical evidence for the asymmetrical distribution of ratings (Barber et al.
2006; Dimson and Marsh 1986; Groth et al. 1979). For instance, Barber et al. (2006) found that
in 1996 the number of sell recommendations from investment banks and brokerage firms was
only 4 percent, declining to 2 percent in 2000 before increasing to 17 percent until 2003. Thus,
even in times of stock market decline there is only a minority of sell recommendations.
For the purpose of our study, we do not directly compare the analysts’ original ratings with
the recommendations of the crowd since, in contrast to the analysts, crowd members cannot
assign hold ratings on the platform. However, since every hold recommendation that we consider
also has a price target, we can define a buy rating when the price target lies above the last price
and a sell rating for the opposite case.
Our results show that only 24% of the analysts’ predictions are sell recommendations in the
sense that a lower future price is expected, while the crowd assigns the same in 27% of all cases.
Given our observation period of four years with many downturns and upturns on the stock
market, it is of little surprise that a more balanced distribution of buy and sell ratings seems to
ensure a higher accuracy of stock predictions.
4.2 Diversity and Independence
Table 5 shows the results for the influence of diversity and independence on the performance of
the Internet crowd. We estimated several models to ensure the robustness of our results. First, we
only considered independence and then successively included diversity, market parameters and
risk.

We observe a positive parameter for the crowd members’ age as well as gender diversity.
However, the results are not statistically significant except of gender diversity in model 2. If we
control for market parameters and risk (full model), we can conclude that increasing diversity on
the platform does not improve the daily return of the crowd, rejecting H2.
Table 5: Results from Regression Analysis (Dependent Variable: Daily return)
Model 1:
Independence
Model 2:
+ Diversity
Model 3:
+ Market
parameters
Model 4 (full
Model):
+ Risk
Wo
C
va
ria
ble
s
Independence Analysts (0/1) -.003*** -.003*** -.003*** -.003***
Ranking (0/1) -.002*** -.001*** -.001*** -.001***
Diversity AgeDiversity .000 .000 .000
GenderDiversity .030** .012 .011
Co
ntr
ol
va
ria
ble
s
Market
parameters
Momentum -.004*** -.004***
TradingVolume .000 -.000
DAXTrend .002*** .002***
Risk .072***
Time Control Yes Yes Yes Yes
Observations 8,331 8,331 8,331 8,331
R2 0.004 0.005 0.013 0.014
** Significant at the 5% level; *** Significant at the 1% level
All models are estimated using random effects
In contrast to diversity, we find evidence for the influence of independence on the
performance of the crowd. Both the presence of analysts as well as the introduction of a new
ranking system exerts a negative impact on the daily return. The results are highly significant in
all of our models. We therefore find support for H3.
The daily return of crowd members’ stock prediction decreases by 0.3 basis points when
recommendations of professional analysts are published on the website. The revised ranking
system exerts a negative impact of 0.1 basis points on the daily return. Crowd members achieve a
higher return during bull markets (0.2 basis points) while increasing risk attitude is rewarded by
7.2 basis points. Surprisingly, momentum of individual stocks has a negative effect of 0.4 basis
points, while trading volume exerts no significant influence on daily returns.
We conducted several additional analyses in order to ensure the robustness of our results.
First, we tested a daily-base Sharpe Ratio as dependent variable. The Sharpe Ratio was first
introduced by Sharpe (1966) as a reward-to-volatility measure and is used by many authors
under different names. The original Sharpe Ratio is calculated as follows:
SharpeRatio = (:;<:=)
? (3)
where �@ is the return of an asset; �A is the return of a benchmark investment (typically a
riskless investment as measured by the risk-free interest rate); (�@ −�A) is the excess return
and B is the standard deviation of the excess return.
For our purpose we use a daily-base Sharpe Ratio to apply the measure for daily returns:
Daily − baseSharpeRatio = :H
? (4)

where �I is the daily return of the recommendation and B is the standard deviation of daily
returns during our observation period. The higher the daily-base Sharpe Ratio, the higher the
return that was achieved per unit of risk.
Again, we estimate the models under use of random effects (see section 3.2.2). Please note
that according to equation 4, risk is now included in the dependent variable.
����� − J��Kℎ��M�������= ß� +ß! ∗ #���������� + ß$ ∗ �������������� + ß% ∗ ���&���� + ß'∗ #������ + ß( ∗ ��������� + ß) ∗ *������+������ + ß, ∗ �#-*�����+ �
(5)
Table 6 shows the results for the daily-base Sharpe Ratio. Overall, our results with respect to
diversity and independence do not substantially change. The negative and highly significant
effect of independence persists while diversity does not exert a significant impact on the risk-
adjusted daily returns.
Table 6: Results from Regression Analysis (Dependent Variable: Daily-base Sharpe Ratio)
Model 1:
Independence
Model 2:
+ Diversity
Model 3 (full model):
+ Market parameters
Wo
C
va
ria
ble
s
Independence Analysts (0/1) -.143*** -.145*** -.148***
Ranking (0/1) -.064*** -.039*** -.054***
Diversity AgeDiversity .001 .000
GenderDiversity .937* .262
Co
ntr
ol
va
ria
ble
s
Market
parameters
Momentum -.164***
TradingVolume -.000
DAXTrend .067***
Time Control Yes Yes Yes
Observations 8,331 8,331 8,331
R2 0.005 0.006 0.015
* Significant the 10% level; ** Significant at the 5% level; *** Significant at the 1% level
All models are estimated using random effects
We also modified the calculation basis for momentum, trading volume and risk. The period
for momentum and trading volume was changed to one month and 12 months respectively. We
observe similar results for daily returns as well as daily-base Sharpe Ratio compared to our
original model (see Appendix, Table A1-A4).
In our full model (Table 5), risk is calculated by the standard deviation of daily share returns
during our entire observation period of roughly four years. Thus, the individual risk for each
share does not change over time. However, we modified the calculation basis for risk similar to
the market parameters. That is, risk is measured by the standard deviation of daily returns within
one month (and three months respectively) before the recommendation was opened (see
Appendix, Table A5-A8). In addition, we derived risk from the standard deviation of daily share
returns between the start and the end of the recommendation (see Appendix, Table 9-10).
All additional analyses confirm our original results, observing a negative effect of
independence on daily returns as well as daily-base Sharpe Ratio.
It should be noted that on first sight, R² values presented in Table 5 and 6 indicate a rather
weak explanatory power of our model. However, researchers studying the drivers of stock
returns typically report very low R² values. Avery et al. (2009) collected data from a US stock
prediction community and investigate the influence of stock picks (e.g. large and small cap, high
and low momentum) on returns. In this study, R² values lie between 0.0005 and 0.0151. Das and
Chen (2007) study the relationship between company sentiment derived from stock message
boards and the stock market. The authors report R² values of 0.0027 and 0.0041, concluding that
“the overall fit of the model is understandably poor as the regression lacks several other variables
that explain stock levels” (pp. 1385). Das and Sisk (2003) pay attention to group processes of
financial communities on the Internet. There is a significant relationship between the information
structure (i.e. centrality scores) and return covariance of the stocks, although the mean R² value
of 16 months is only 0.017. Antweiler and Frank (2004) show that the volume of messages
posted on stock message boards can predict returns, reporting R² of 0.049. In the offline world,
Malmendier and Shanthikumar (2007) study trade reactions of large and small investors to
analyst recommendations, receiving R² values in their models ranging from 0.001 to 0.0215.
In sum, all existing studies focusing on explaining stock returns observe very low R² values in
the one-digit range. Although the explanatory power of our model seems to be quite low, it
confirms previous findings in this research area. The poor fit is little surprising since stock
returns depend on many other factors, which we do not consider in our regression analysis. For
instance, we do not control for company or economic news, which have been found to exert a
strong influence on share prices (e.g. Mitchell and Mulherin 1994; Niederhoffer 1971; Tetlock
2007). However, our goal is not to fully explain price fluctuations at this point. We therefore
believe that our study fits well with the existing stream of research, contributing to a better
understanding of the WoC on the Internet.
5 Discussion
5.1 Implications
Our results have strong implications for the financial service industry as well as companies
from other industries. From a practical point of view, the financial service industry can take the
opinion of the crowd into consideration for their investments. Given today’s inflexible system of
share analysis, private investors are on average better served by trusting the recommendations of
an online prediction community instead of following the advice of their banks’ analysts. Banks
should therefore update their price targets more frequently and pay attention to a more balanced
distribution of buy and sell recommendations in order to translate financial advisory into the 21st
century. One possible way to take advantage of the user-generated content is to create a portfolio
which is based on the crowd’s stock recommendations. Banks might issue investment funds that
reproduce the buy or sell recommendations of the leading crowd members and thus develop real-
time trading strategies. According to our study, it can be expected that the performance will be
superior to the broader market as well as many conventional investment funds that are based on
the analysts’ recommendations.
Our study contributes to the debate about the wisdom of crowds in such a way that
independence seems to be an important condition on the Internet. The performance of the crowd
positively relates to a higher degree of independence. Companies which employ crowdsourcing
and open innovation concepts should thus ensure that decisions are made independent from each
other. In light of our results, independence is especially important for the area of finance. We

know from the offline world that converging investment behavior can destabilize security prices,
resulting in lower returns for investors in the long run (see discussion on herding in section 2).
Our study provides evidence for similar effects on the Internet. Thus, crowd members should
primarily rely on private information and follow their own beliefs instead of trusting other
market participants.
5.2 Summary and Outlook
This field study revealed that the WoC phenomenon that has been widely discussed by
researchers and popular science authors can be observed on the Internet, but it must be
approached on a differentiated basis. User-generated content undoubtedly contains valuable
information that might increase market efficiency and overall welfare. For instance, the crowd is
able to make better stock market predictions than professional analysts from banks, brokers and
research companies. On an annual basis, the crowd realizes a 0.59 percent higher return than
analysts.
While our field study confirms previous results with regard to the accuracy of Internet
applications (Forsythe et al. 1999; Ginsberg et al. 2009; Spann and Skiera 2003), we only partly
find support for the postulated theoretical conditions that have been found to be necessary for a
wise crowd in the offline world. Knowledge, motivation, diversity and independence of the
community members on our observed platform seem to be significant enough to create crowd
wisdom although we did not measure these conditions in absolute terms.
We particularly conclude that the performance of the crowd worsens with decreasing
independence. We therefore find support for the importance of independence in the online world
and confirm previous results from Lorenz et al. (2011) who experimentally showed that little
social influence is enough to eliminate the WoC. As expected, the daily return of the crowd
decreases after the introduction of recommendations made by professional analysts. The revised
ranking system, which makes top performer more visible and shows a much more precise picture
of the members’ ability, also exerts a significant influence on the crowd’s performance. In both
cases, members of the community seem to increasingly rely on the opinions of so-called experts
because of the assumption that highly paid analysts and the crowd’s top performer have more
knowledge or stock picking skills.
Empirical evidence indeed suggests that people attach great importance to the opinion of
experts. For instance, courts place reliance on the psychiatric predictions with regard to patients’
potential dangerousness, although many previous studies show that psychiatrics are not able to
forecast the patients’ behavior (Cocozza and Steadman 1978).
With the exception of model 2, we find no evidence for the influence of diversity. The
missing effect of gender diversity might be caused by the very small fraction of females on the
platform (<5%). Age diversity seems to play only a minor role on the Internet in contrast to the
offline world (Bantel and Jackson 1989). However, we only used age and gender to
operationalize diversity in a specific financial markets environment. Future research might
consider other diversity aspects (e.g. knowledge, education, etc.) and especially verify if our
results hold for areas outside the financial industry.
Our analysis is restricted to the exclusive consideration of blue chip stocks from the DAX
index. With the focus on large companies, we are able to avoid endogeneity problems since it is
not to be expected that single recommendations or comments of Internet users will directly
influence the price of these stocks. However, the consideration of small and mid-sized
companies would be an interesting area for future research since such organizations allow

investors to better take advantage of private information. Only a few analysts cover smaller
stocks and therefore company-related information is typically processed more slowly by the
media and other investors.
We examined the impact of a changing degree of independence (ranking system and analyst
recommendations) and diversity (age and gender diversity) on prediction accuracy. However,
these measures are relative and we cannot exactly determine an absolute level of diversity and
independence. Future research might try to address this problem in experimental settings. With
the help of experiments, one could also eliminate the limitation of restricted access to
information. Field studies typically have the problem that the operationalization is partly driven
by the available dataset. While there are various other variables that have been used in the past in
order to measure diversity (see Section 2), we have only access to the age and gender that the
members are providing in their personal profiles. The data does not allow for making
conclusions about knowledge, education or other distinguishing factors. The same limitation
holds for the independence variables. Thus, the operationalization would certainly benefit from
an experimental setting in future research projects.
With regard to the composition of the crowd, we are not able to draw conclusions about the
share of expertise. There may be professional analysts that register anonymously on the platform
and open recommendations in their spare time. We describe the crowd as dedicated amateurs, i.e.
sidelined investors who may be more or less professional. However, we have to be careful when
interpreting the superior performance of the crowd compared to analysts since the result might be
diluted by a certain fraction of analysts within the crowd. Transaction costs might also reduce the
performance of both groups. In our study, we only compare individual stock predictions without
developing trading portfolios. An interesting area for future research would be to create
algorithms which buy or sell shares according to the stock picks of the crowd and analysts.
Since members can write messages and comment on other recommendations, interaction
processes would also be an avenue for further research.
Overall, we have to be careful when interpreting our results. The stock predictions might not
represent the true opinion of the crowd members or analysts. Especially the crowd
recommendations could be uninformative babbling (“cheap talk”) since sharing private
information might reduce profits from stock returns (Bennouri et al. 2011). The informational
value of the recommendations could also be linked to price manipulations. Although we are
aware of this problem and therefore excluded penny stocks from our analysis, future research
might additionally look at the real stock portfolios of investors. This would allow researchers to
clearly identify attempts where members try to push prices after buying stocks in the real world.
The recommendations of professional analysts might be influenced by business interests.
Analysts publish their recommendations in the name of the bank which has strong incentives for
assigning buy ratings due to business relationships with the respective companies. Another
reason for the preference of buy instead of hold (or sell) ratings is the trading volume since banks
benefit from high trading volumes. Optimistic share recommendations address much more
clients than sell recommendations since only a small fraction of investors already has the shares.
Thus, inferring a superior performance of the crowd might be a result of strategic constraints.
However, the better performance of the crowd compared to analysts might have implications for
private investors behavior since many investors still rely on analyst recommendations (Kelly et
al. 2012; Malmendier and Shanthikumar 2007).
In sum, this study provided evidence that the WoC phenomenon exists on the Internet, but not
all findings from conceptual work and experiments with regard to the necessary conditions can
blindly be transferred. The WoC phenomenon turns out to be very complex, which underlines the
need for more research in this area.
References
Ammon U (2009) Delphi-Befragung - Handbuch Methoden der Organisationsforschung. VS
Verlag für Sozialwissenschaften, Wiesbaden
Anderson JR (1981) Cognitive skills and their acquisition. Erlbaum, New Jersey
Antweiler W, Frank MZ (2004) Is all that talk noise? the information content on Internet stock
message boards. Journal of Finance 59(3):1259-1294
Aral S, Brynjolfsson E, Van Alstyne M (2008) Sharing mental models: antecedents and
consequences of mutual knowledge in teams. Working Paper
Arch E (1993) Risk-taking: a motivational basis for sex differences. Psychological Reports
73(3):6-11
Armstrong JS (1980) The seer-sucker theory: the value of experts in forecasting. Technology
Review 83:16-24
Avery C, Chevalier J, Zeckhauser R (2009) The ‘CAPS’ prediction system and stock market
returns. Working Paper, Harvard Kennedy School
Bajtelsmit VL, VanDerhei JA (1997) Risk aversion and pension investment choices. In: Gordon
MS, Mitchell OS, Twinney MM (eds.) Positioning pensions for the twenty-first century.
University of Pennsylvania Press, Philadelphia, pp. 91-103
Banerjee AV (1992) A simple model of herd behavior. Quarterly Journal of Economics
107(3):797-817
Bantel KA, Jackson SE (1989) Top management and innovations in banking: does the
composition of the top team make a difference? Strategic Management Journal 10(S1):107-
124
Barber B, Odean T (2001) Boys will be boys: gender, overconfidence, and common stock
investment. Quarterly Journal of Economics 116(1):261-292
Barber BM, Lehavy R, McNichols M, Trueman B (2006) Buys, holds, and sells: the distribution
of investment banks’ stock ratings and the implications for the profitability of analysts’
recommendations. Journal of Accounting and Economics 41(1-2):87-117
Bennouri M, Gimpel H, Robert J (2011) Measuring the impact of information aggregation
mechanisms: an experimental investigation 78(3):302-318
Berg J, Forsythe R, Rietz T (1997) What makes markets predict well? Evidence from the Iowa
Electronic Markets. In: Albers W, Güth W Hammerstein P, Moldovanu B, Van Damme E
(eds.) Understanding Strategic Interaction: Essays in Honor of Reinhard Selten. Springer-
Verlag, New York, pp. 444-463
Bikhchandani S, Hirshleifer D, Welch I (1992) A theory of fads, fashion, custom, and cultural
change as informational cascades. Journal of Political Economy 100(5):992-1026
Bogle JC (2001) John Bogle on investing. McGraw-Hill, New York
Bogle JC (2005) The mutual fund industry sixty years later: for better or worse? Financial
Analysts Journal 61(1):15-24
Bollen J, Mao H, Zeng XJ (2010) Twitter mood predicts the stock market. Journal of
Computational Science 2(1):1-8
Byrnes J, Miller DC, Schafer WD (1999) Gender differences in risk taking: a meta-analysis.
Psychological Bulletin 125(3):367-383
Cao HH, Coval JD, Hirshleifer D (2002) Sidelined investors, trade-generated news, and security
returns. Review of Financial Studies 15(2):615-648
Carhart MM (1997) On persistence in mutual fund performance. Journal of Finance 52(1):57-82
Chesbrough H, Crowther AK (2006) Beyond high tech: early adopters of open innovation in
other industries. R&D Management 36(3):229-236
Cocozza JJ, Steadman HJ (1978) Prediction in psychiatry: an example of misplaced confidence
in experts. Social Problems 25(3):265-276
Dalkey N, Helmer O (1963) An experimental application of the delphi method to the use of
experts 9(3):458-467
Daniel K, Grinblatt M, Titman S, Wermers R (1997) Measuring mutual fund performance with
characteristic-based benchmarks. Journal of Finance 52(3):1035-1058
Das SR, Chen MY (2007) Yahoo! for Amazon: sentiment extraction from small talk on the web.
Management Science 53(9):1375-1388
Das SR, Sisk J (2003) Financial Communities. Santa Clara University, Working Paper.
DeBondt WFM (1993) Betting on trends: Intuitive forecasts of financial risk and return.
International Journal of Forecasting 9(3):355-371
Deaux K, Farris E (1977) Attributing causes for one's own performance: the effects of sex,
norms, and outcome. Journal of Research in Personality 11(1):59-72
DeMarzo PM, Vayanos D, Zwiebel J (2003) Persuasion bias, social influence, and
unidimensional opinions. Quarterly Journal of Economics 118(3):909-968
Dhar V, Chang E (2009) Does chatter matter? the impact of user-generated content on music
sales. Journal of Interactive Marketing 23(4):300-307
Diefenbach RE (1972) How good is institutional brokerage research? Financial Analysts Journal
28(1):54+56-60
Dimson E, Marsh P (1986) Event study methodologies and the size effect: the case of UK press
recommendations. Journal of Financial Economics 17(1):113-142
Fama EF (1970) Efficient capital markets: a review of theory and empirical work. Journal of
Finance 25(2):383-417
Forsythe R, Rietz TA, Ross TW (1999) Wishes, expectations and actions: a survey on price
formation in election stock markets. Journal of Economic Behavior & Organization 39(1):83-
110
Galton F (1907) Vox populi. Nature 75:450-451
Giles J (2005) Internet encyclopaedias go head to head. Nature 438:900-901
Ginsberg J, Mohebbi MH, Patel RS, Brammer L, Smolinski ML, Brilliant L (2009) Detecting
influenza epidemics using search engine query data. Nature 457:1012-1015
Graham JR (1999) Herding among investment newsletters: theory and evidence. Journal of
Finance 54(1):237-268
Groth JC, Lewellen WG, Schlarbaum GG, Lease RC (1979) An analysis of brokerage house
securities recommendations. Financial Analysts Journal 35(1):32-40
Gu B, Konana P, Rajagopalan B, Chen HWM (2007) Competition among virtual communities
and user valuation: the case of investing-related communities. Information Systems Research
18(1):68-85
Hertwig R (2012) Tapping into the wisdom of the crowd - with confidence. Science 336:303-304
Hill S, Ready-Campbell N (2011) Expert stock picker: the wisdom of (experts in) crowds.
International Journal of Electronic Commerce 15(3):73–101
Hinz RP, McCarthy DD, Turner JA (1997) Are women conservative investors? gender
differences in participant directed pension investments. In: Gordon MS, Mitchell OS,
Twinney MM (eds.) Positioning pensions for the twenty-first century. University of
Pennsylvania Press, Philadelphia, pp. 91-103
Hinz O, Spann M (2008) The impact of information diffusion on bidding behavior in secret
reserve price auctions. Information Systems Research 19(3):351–368
Hong H, Kubik JD, Stein JC (2005) Thy neighbor’s portfolio: word-of-mouth effects in the
holdings and trades of money managers. Journal of Finance 60(6):2801-2824
Hong H, Stein JC (1999) A unified theory of underreaction, momentum trading, and overreaction
in asset markets. Journal of Finance 54(6):2143-2184
Hong L, Page SE (2001) Problem solving by heterogeneous agents. Journal of Economic Theory
97(1):123-163
Howe J (2008) Crowdsourcing: why the power of the crowd is driving the future of business.
Crown Business, New York
Jegadeesh N, Titman S (1993) Returns to buying winners and selling losers: implications for
stock market efficiency. Journal of Finance 48(1):65-91
Jehn KA, Northcraft GB, Neale MA (1999) Why differences make a difference: a field study of
diversity, conflict, and performance in workgroups. Administrative Science Quarterly
44(4):741-763
Jensen M (1968) The performance of mutual funds in the period 1945-1964. Journal of Finance
23(2):389-416
Jeppesen LB, Frederiksen L (2006) Why do users contribute to firm-hosted user communities?
the case of computer-controlled music instruments. Organization Science 17(1):45-63
Jianakoplos NA, Bernasek A (1998) Are women more risk averse? Economic Inquiry 36(4):620-
630
Johnston R, McNeal BF (1967) Statistical versus clinical prediction: length of neuropsychiatric
hospital stay. Journal of Abnormal Psychology 72(4):335-340
Kelly K, Low B, Tan HT, Tan SK (2012) Investors’ reliance on analysts’ stock
recommendations and mitigating mechanisms for potential overreliance. Contemporary
Accounting Research 29(3):991-1012
Kittur A, Kraut RE (2008) Harnessing the wisdom of crowds in wikipedia: quality through
coordination. In: Proceedings of the 2008 ACM conference on Computer supported
cooperative work, pp. 37-46
Koriat A (2012) When are two heads better than one and why? Science 336:360-362
Lakonishok J, Maberly E (1990) The weekend effect: trading patterns of individual and
institutional investors. Journal of Finance 45(1):231-243
Larkin JH, McDermott J, Simon DP, Simon HA (1980) Expert and novice performance in
solving physics problems. Science 208:1335-1342
Leimeister JM, Huber M, Bretschneider U, Krcmar H (2009) Leveraging crowdsourcing:
activation-supporting components for IT-based ideas competition. Journal of Management
Information Systems 26(1):197-224
Levy BI, Ulman E (1967) Judging psychopathology from paintings. Journal of Abnormal
Psychology 72(2):182-187

Lewellen WG, Lease RC, Schlarbaum GG (1977) Patterns of investment strategy and behavior
among individual investors. Journal of Business 50(3):296-333
Lorenz J, Rauhut H, Schweitzer F, Helbing D (2011) How social influence can undermine the
wisdom of crowd effect. In: Proceedings of the National Academy of Sciences of the United
States of America 108(22):9020–9025
March JG (1991) Exploration and exploitation in organizational learning. Organization Science
2(1):71-87
Malkiel BG (1995) Returns from investing in equity mutual funds 1971-1991. Journal of Finance
50(2):549-572
Malmendier U, Shanthikumar D (2007) Are small investors naive about incentives? Journal of
Financial Economics 85(2):457-489
Mitchell ML, Mulherin JH (2007) The impact of public information on the stock market. Journal
of Finance 49(3):923-950
Niederhoffer V (1971) The analysis of world events and stock prices. Journal of Business
44(2):193-219
Odean T (1998) Volume, volatility, price, and profit when all traders are above average. Journal
of Finance 53(6):1887-1934
Page SE (2007) Making the difference: applying a logic of diversity. Academy of Management
Perspectives 21(4):6-20
Poetz MK, Schreier M (2012) The value of crowdsourcing: can users really compete with
professionals in generating new product ideas? Journal of Product Innovation Management
29(2):245-256
Prince M (1993) Women, men, and money styles. Journal of Economic Psychology 14(1):175-
182
Reagans R, Zuckerman EW (2001) Networks, diversity, and productivity: the social capital of
corporate R&D teams. Organization Science 12(4):502-517
Rosenbaum P, Rubin D (1983) The central role of the propensity score in observational studies
for causal effects. Biometrika 70(1):41-55
Rouwenhorst KG (1998) International Momentum Strategies. Journal of Finance 53(1):267-284
Scharfstein DS, Stein JC (1990) Herd behavior and investment. American Economic Review
80(3):465-479
Schwind M, Hinz O, Stockheim T, Bernhardt, M (2008) Standardizing interactive pricing for
electronic business. Electronic Markets, 18(2): 161-174.
Simmons JP, Nelson LD, Galak J, Frederick S (2011) Intuitive biases in choice versus
estimation: implications for the wisdom of crowds. Journal of Consumer Research 38(1):1-15
Sharpe W (1966) Mutual fund performance. Journal of Business 39(1):119-138
Shiller RJ (2002) Bubbles, human judgment, and expert opinion. Financial Analysts Journal
58(3):18-26
Spann M, Skiera B (2003) Internet-based virtual stock markets for business forecasting.
Management Science 49(10):1310–1326
Sunden AE, Surette BJ (1998) Gender differences in the allocation of assets in retirement
savings plans. American Economic Review 88(2):207-211
Surowiecki J (2004) The wisdom of crowds. Doubleday, New York
Taft R (1955) The ability to judge people. Psychological Bulletin 52(1):1-23
Tetlock PC (2007) Giving content to investor sentiment: The role of media in the stock market.
Journal of Finance 62(3):1139-1168
Treynor JL (1987) Market efficiency and the bean jar experiment. Financial Analysts Journal
43(3):50-53
Vul E, Pashler H (2008) Measuring the crowd within: probabilistic representations within
individuals. Psychological Science 19(7):645-647
Watson WE, Kumar K, Michaelsen LK (1993) Cultural diversity’s impact on interaction process
and performance: comparing homogeneous and diverse task groups. Academy of
Management Journal 36(3):590-602
Welch I (2000) Herding among security analysts. Journal of Financial Economics 58(3):369-396
Williams KY, O’Reilly CA (1998) Demography and diversity in organizations. In: Staw BM,
Sutton RM (eds.) Research in Organizational Behavior (20), JAI Press, Stamford, pp. 77-140
Wolfers J, Zitzewitz E (2004) Prediction markets. Journal of Economic Perspectives 18(2):107-
126
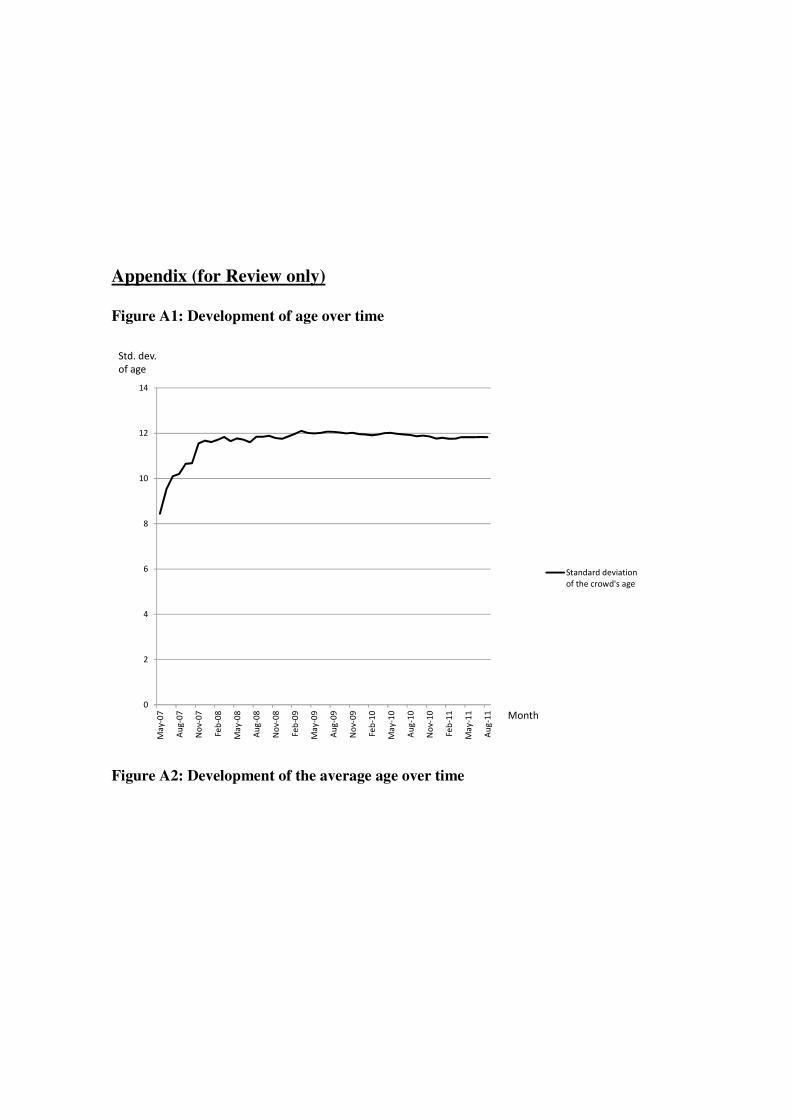
Appendix (for Review only)
Figure A1: Development of age over time
Figure A2: Development of the average age over time
0
2
4
6
8
10
12
14
Ma
y-0
7
Au
g-0
7
No
v-0
7
Fe
b-0
8
Ma
y-0
8
Au
g-0
8
No
v-0
8
Fe
b-0
9
Ma
y-0
9
Au
g-0
9
No
v-0
9
Fe
b-1
0
Ma
y-1
0
Au
g-1
0
No
v-1
0
Fe
b-1
1
Ma
y-1
1
Au
g-1
1
Standard deviation
of the crowd's age
Std. dev.
of age
Month

Original model estimated with 1 and 12 month momentum / trading volume
Table A1: Results from Regression Analysis (Dependent Variable: Daily return)
Independence Diversity
Market
parameters Risk
Wo
C
va
ria
ble
s
Independence Analysts (0/1) -.003*** -.003*** -.003*** -.003***
Ranking (0/1) -.002*** -.001*** -.001*** -.001***
Diversity AgeDiversity .000 .001 .001
GenderDiversity .030** .004 .003
Co
ntr
ol
va
ria
ble
s
Market
parameters
Momentum 1month -.006*** -.006***
TradingVolume 1month .000 .000
DAXTrend .002*** .002***
Risk .055***
Time Control Yes Yes Yes Yes
Observations 8,331 8,331 8,331 8,331
R2 0.004 0.005 0.013 0.014
** Significant at the 5% level; *** Significant at the 1% level; All models are estimated using random effects
Table A2: Results from Regression Analysis (Dependent Variable: Daily return)
Independence Diversity
Market
parameters Risk

Wo
C
va
ria
ble
s
Independence Analysts (0/1) -.003*** -.003*** -.003*** -.002***
Ranking (0/1) -.002*** -.001*** -.001*** -.001***
Diversity AgeDiversity .000 .000 .000
GenderDiversity .030** .022* .020
Co
ntr
ol
va
ria
ble
s
Market
parameters
Momentum 12months -.000 -.001*
TradingVolume 12months -.000 -.000*
DAXTrend .001*** .001***
Risk .075***
Time Control Yes Yes Yes Yes
Observations 8,331 8,331 8,331 8,331
R2 0.004 0.005 0.007 0.014
* Significant at the 10% level; ** Significant at the 5% level; *** Significant at the 1% level;
All models are estimated using random effects
Table A3: Results from Regression Analysis (Dependent Variable: Daily-base Sharpe Ratio)
Independence Diversity
Market
parameters
Wo
C
va
ria
ble
s
Independence Analysts (0/1) -.143*** -.147*** -.149 ***
Ranking (0/1) -.064*** -.041*** -.052***
Diversity AgeDiversity .001 .019
GenderDiversity .937* -.099
Co
ntr
ol
va
ria
ble
s
Market
parameters
Momentum 1 month -.256 ***
TradingVolume 1 month .000
DAXTrend .071 ***
Time Control Yes Yes Yes
Observations 8,331 8,331 8,331
R2 0.005 0.006 0.015
* Significant at the 10% level; ** Significant at the 5% level; *** Significant at the 1% level;
All models are estimated using random effects
Table A4: Results from Regression Analysis (Dependent Variable: Daily-base Sharpe Ratio)
Independence Diversity
Market
parameters
Wo
C
va
ria
ble
s
Independence Analysts (0/1) -.143*** -.147*** -.116 ***
Ranking (0/1) -.064*** -.040*** -.040 ***
Diversity AgeDiversity .001 .008
GenderDiversity .937* .621
Co
ntr
ol
va
ria
b
Market
parameters
Momentum 12 months -.022
TradingVolume 12 months -.000
DAXTrend .061***

Time Control Yes Yes Yes
Observations 8,331 8,331 8,331
R2 0.005 0.006 0.009
* Significant at the 10% level; ** Significant at the 5% level; *** Significant at the 1% level;
All models are estimated using random effects
Results for risk as measured by 1 and 3 month standard deviation of daily share returns
Table A5: Results from Regression Analysis (Dependent Variable: Daily return)
Independence
Diversity
Market
parameters Risk
Wo
C
va
ria
ble
s
Independence Analysts (0/1) -.003*** -.003*** -.003*** -.002***
Ranking (0/1) -.002*** -.001*** -.001*** -.001***
Diversity AgeDiversity .000 .001 .000
GenderDiversity .030** .004 .001
Co
ntr
ol
va
ria
ble
s
Market
parameters
Momentum
1month
-.006*** -.006***
TradingVolume
1month
.000 .000
DAXTrend .002*** .002***
Risk 1 month .075***
Time Control Yes Yes Yes Yes
Observations 8,331 8,331 8,331 8,331
R2 0.004 0.005 0.013 0.017
** Significant at the 5% level; *** Significant at the 1% level; All models are estimated using random effects
Table A6: Results from Regression Analysis (Dependent Variable: Daily return)
Independence
Diversity
Market
parameters Risk
W o C Independence Analysts (0/1) -.003*** -.003*** -.003*** -.002**

Ranking (0/1) -.002*** -.001*** -.001*** -.001**
Diversity AgeDiversity .000 .000 -.000
GenderDiversity .030** .012 .014
Co
ntr
ol
va
ria
ble
s
Market
parameters
Momentum
3months
-.004*** -.004***
TradingVolume
3months
.000 -.000
DAXTrend .002*** .002***
Risk 3months .079***
Time Control Yes Yes Yes Yes
Observations 8,331 8,331 8,331 8,331
R2 0.004 0.005 0.013 0.016
** Significant at the 5% level; *** Significant at the 1% level; All models are estimated using random effects
Table A7: Results from Regression Analysis (Dependent Variable: Daily-base Sharpe Ratio)
Independence Diversity
Market
parameters
Wo
C
va
ria
ble
s
Independence Analysts (0/1) -.062** -.068** -.070**
Ranking (0/1) -.065*** -.049*** -.058***
Diversity AgeDiversity .001 .000
GenderDiversity .850* .009
Co
ntr
ol
va
ria
ble
s
Market
parameters
Momentum 1 month -.204***
TradingVolume 1 month .000
DAXTrend .058***
Time Control Yes Yes Yes
Observations 8,331 8,331 8,331
R2 0.004 0.004 0.010
* Significant at the 10% level; ** Significant at the 5% level; *** Significant at the 1% level;
All models are estimated using random effects;
Note: 1 month standard deviation used for calculation of daily-base Sharpe Ratio
Table A8: Results from Regression Analysis (Dependent Variable: Daily-base Sharpe Ratio)
Independence Diversity
Market
parameters
Wo
C
va
ria
ble
s
Independence Analysts (0/1) -.064** -.074** -.077**
Ranking (0/1) -.053*** -.036** -.049***
Diversity AgeDiversity .000 -.001
GenderDiversity 1.041** .563
Co
ntr
ol
va
ria
ble
s
Market
parameters
Momentum 3 months -.134 ***
TradingVolume 3 months -.000
DAXTrend .048**
Time Control Yes Yes Yes

Observations 8,331 8,331 8,331
R2 0.003 0.003 0.009
** Significant at the 5% level; ***Significant at the 1% level;
All models are estimated using random effects;
Note: 3 month standard deviation used for calculation of daily-base Sharpe Ratio
Results for risk as measured by standard deviation of daily share returns during
recommendation period (start until the end of recommendation)
Table A9: Results from Regression Analysis (Dependent Variable: Daily return)
Independence
Diversity
Market
parameters Risk
Wo
C
va
ria
ble
s
Independence Analysts (0/1) -.003*** -.003*** -.003*** -.002***
Ranking (0/1) -.002*** -.001*** -.001*** -.001***
Diversity AgeDiversity .000 .001 .000
GenderDiversity .030** .004 .006
Co
ntr
ol
va
ria
ble
s
Market
parameters
Momentum
1month
-.006*** -.005 ***
TradingVolume
1month
.000 .000
DAXTrend .002*** .002***
Risk .063***
Time Control Yes Yes Yes Yes
Observations 8,331 8,331 8,331 8,331
R2 0.004 0.005 0.013 0.016
** Significant at the 5% level; *** Significant at the 1% level;
All models are estimated using random effects;
Note: Risk measured by standard deviation of daily share returns during recommendation period
Table A10: Results from Regression Analysis (Dependent Variable: Daily return)
Independence
Diversity
Market
parameters Risk
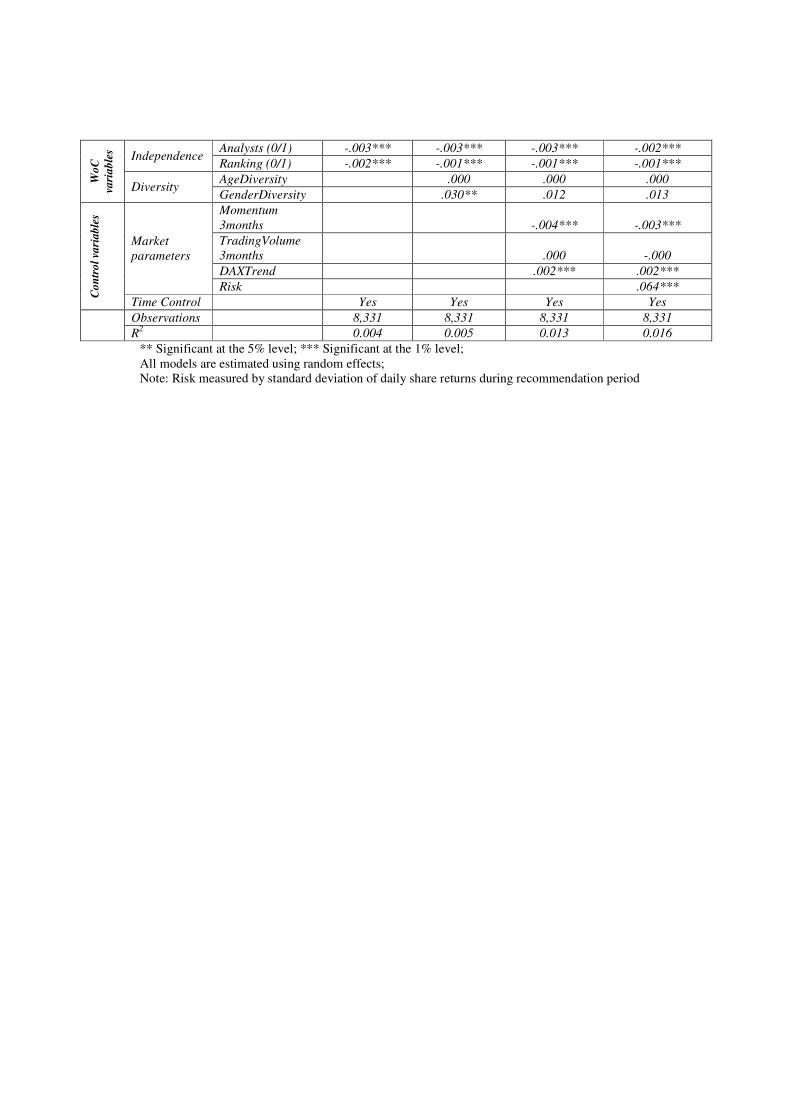
Wo
C
va
ria
ble
s
Independence Analysts (0/1) -.003*** -.003*** -.003*** -.002***
Ranking (0/1) -.002*** -.001*** -.001*** -.001***
Diversity AgeDiversity .000 .000 .000
GenderDiversity .030** .012 .013
Co
ntr
ol
va
ria
ble
s
Market
parameters
Momentum
3months
-.004*** -.003***
TradingVolume
3months
.000 -.000
DAXTrend .002*** .002***
Risk .064***
Time Control Yes Yes Yes Yes
Observations 8,331 8,331 8,331 8,331
R2 0.004 0.005 0.013 0.016
** Significant at the 5% level; *** Significant at the 1% level;
All models are estimated using random effects;
Note: Risk measured by standard deviation of daily share returns during recommendation period


