10/26/2015
1
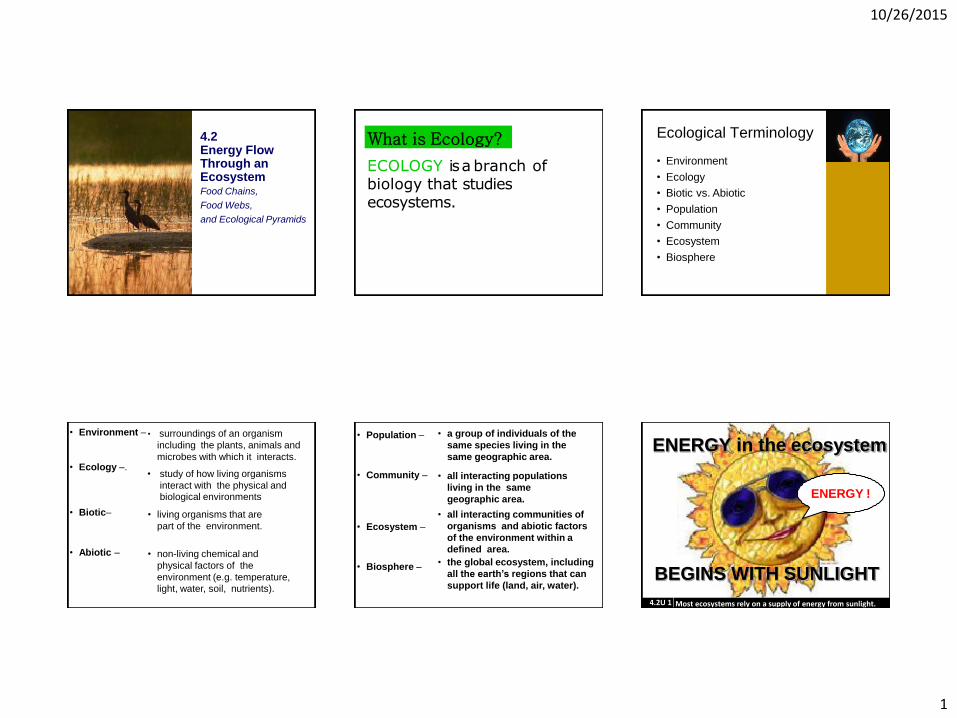
4.2 Energy Flow Through an Ecosystem Food Chains,
Food Webs,
and Ecological Pyramids
What is Ecology?
ECOLOGY is a branch of biology that studies ecosystems.
Ecological Terminology
• Environment
• Ecology
• Biotic vs. Abiotic
• Population
• Community
• Ecosystem
• Biosphere
• Environment –
• Ecology –.
• Biotic–
• Abiotic –
• surroundings of an organism
including the plants, animals and
microbes with which it interacts.
• study of how living organisms
interact with the physical and biological environments
• non-living chemical and
physical factors of the
environment (e.g. temperature,
light, water, soil, nutrients).
• living organisms that are
part of the environment.
• Population –
• Community –
• Ecosystem –
• Biosphere –
• a group of individuals of the
same species living in the
same geographic area.
• all interacting populations
living in the same
geographic area.
• all interacting communities of
organisms and abiotic factors
of the environment within a
defined area.
• the global ecosystem, including
all the earth’s regions that can
support life (land, air, water).
ENERGY in the ecosystem
BEGINS WITH SUNLIGHT
ENERGY !
4.2U 1 Most ecosystems rely on a supply of energy from sunlight.
10/26/2015
2
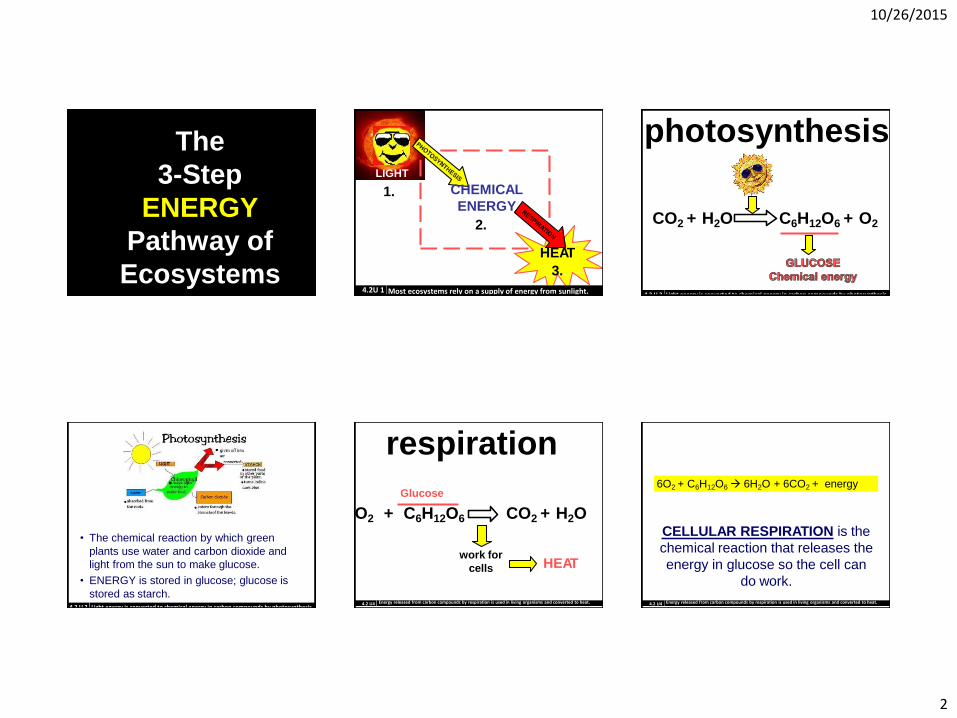
The
3-Step
ENERGY
Pathway of
Ecosystems
LIGHT
1. CHEMICAL
ENERGY
2.
HEAT
3. 4.2U 1 Most ecosystems rely on a supply of energy from sunlight.
photosynthesis
CO2 + H2O C6H12O6 + O2
4.2 U 2 Light energy is converted to chemical energy in carbon compounds by photosynthesis.
• The chemical reaction by which green
plants use water and carbon dioxide and
light from the sun to make glucose.
• ENERGY is stored in glucose; glucose is
stored as starch. 4.2 U 2 Light energy is converted to chemical energy in carbon compounds by photosynthesis.
Glucose
O2 + C6H12O6 CO2 + H2O
respiration
work for
cells HEAT
4.2 U4 Energy released from carbon compounds by respiration is used in living organisms and converted to heat.
CELLULAR RESPIRATION is the
chemical reaction that releases the
energy in glucose so the cell can
do work.
6O2 + C6H12O6 6H2O + 6CO2 + energy
4.2 U4 Energy released from carbon compounds by respiration is used in living organisms and converted to heat.
10/26/2015
3
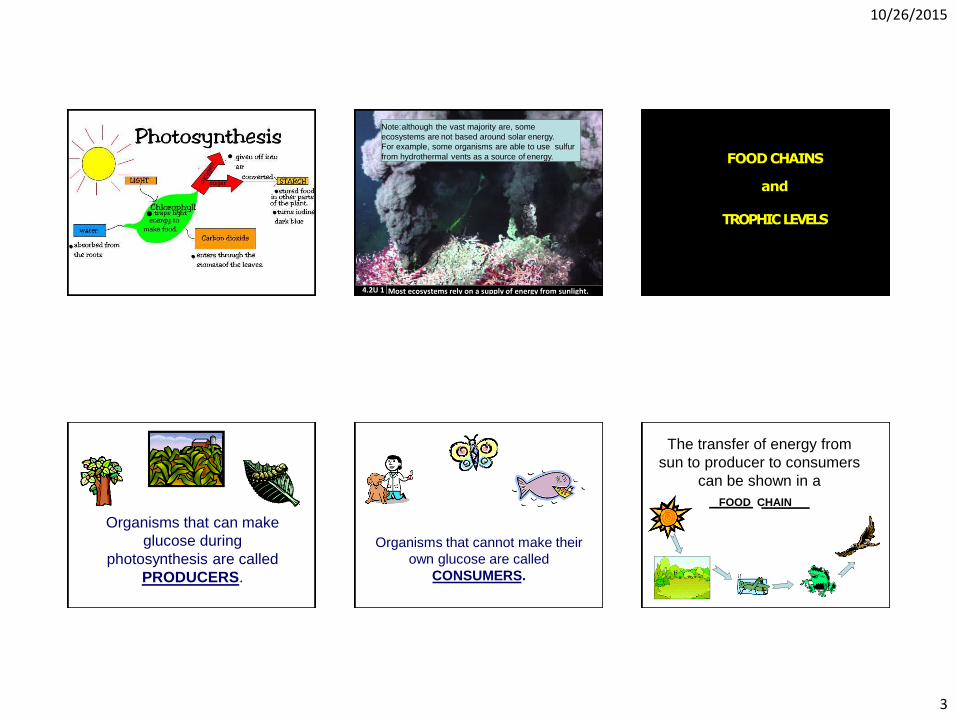
Note: although the vast majority are, some
ecosystems are not based around solar energy.
For example, some organisms are able to use sulfur
from hydrothermal vents as a source of energy.
4.2U 1 Most ecosystems rely on a supply of energy from sunlight.
FOOD CHAINS
and
TROPHIC LEVELS
Organisms that can make
glucose during
photosynthesis are called
PRODUCERS.
Organisms that cannot make their
own glucose are called
CONSUMERS.
The transfer of energy from
sun to producer to consumers
can be shown in a
FOOD CHAIN
10/26/2015
4
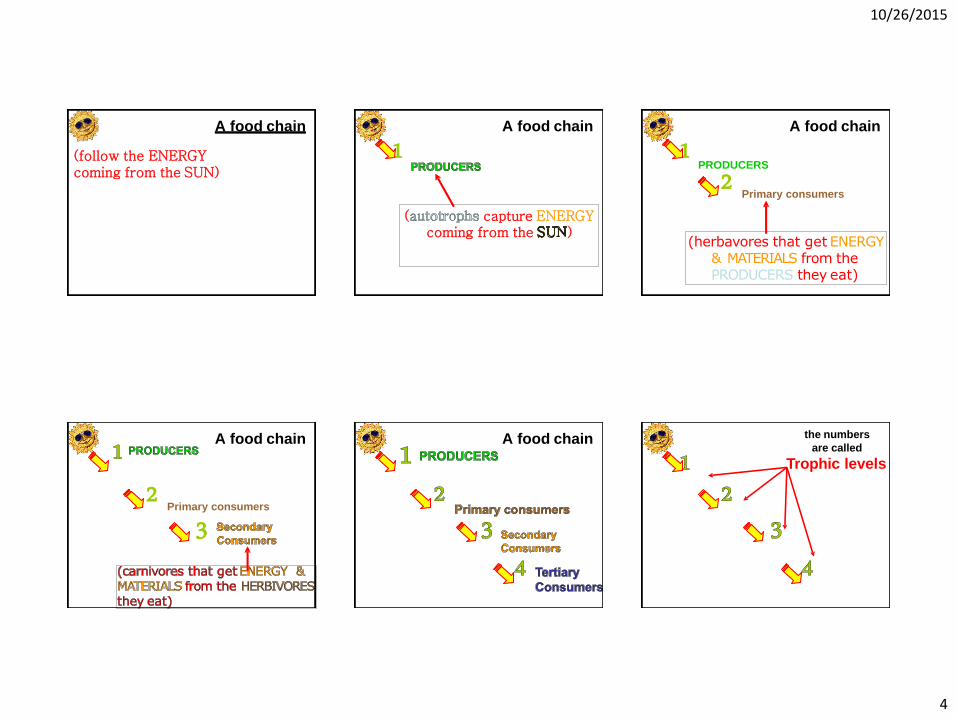
A food chain
(follow the ENERGY coming from the SUN)
1 A food chain
( capture ENERGY coming from the )
PRODUCERS
Primary consumers
1 2
A food chain
(herbavores that get ENERGY & MATERIALS from the PRODUCERS they eat)
Primary consumers 2
3
A food chain A food chain the numbers
are called
Trophic levels

10/26/2015
5
trophic levels
tell how far away
each feeding level
is from
Notice that the
arrows point in the
direction of
energy flow.
5
4
3
2
1
THE 10% RULE
and
ECOLOGICAL PYRAMIDS
The maximum amount of ENERGY that passes from one
trophic level to the next is usually around 10%.
About 90% of the ENERGY at each trophic level is used
to keep the organisms alive and is converted to HEAT.
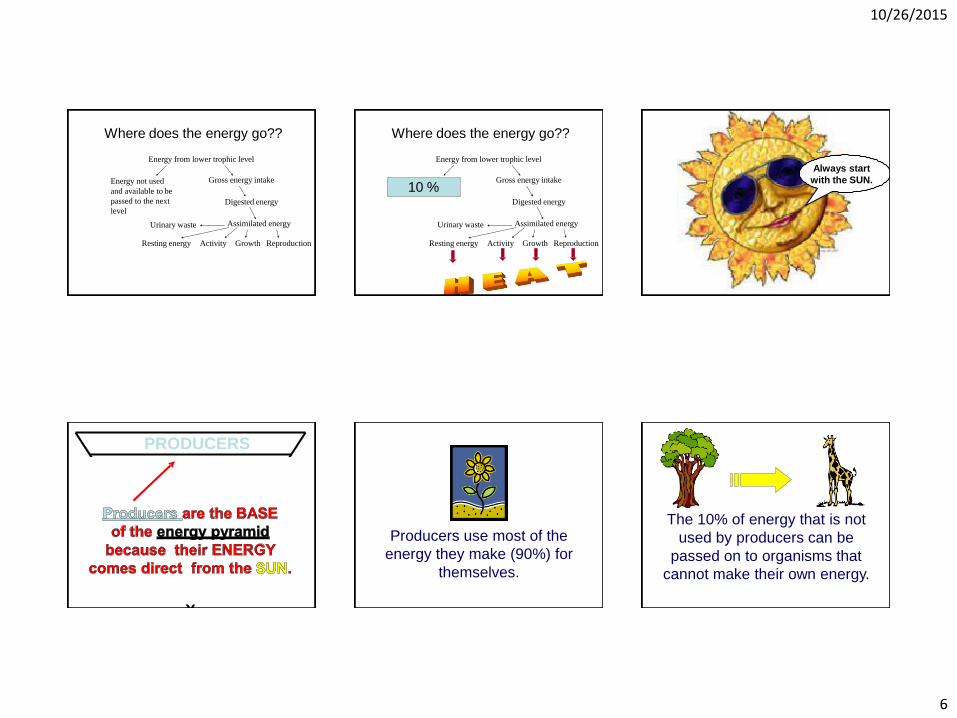
Where does the energy go??
Energy from lower trophic level
Energy not used Gross energy intake
Egested energy Digested energy
Urinary waste Assimilated energy
Resting energy Activity Growth Reproduction
Maintenance or Production respiration
10 % 90%
10/26/2015
6
Energy from lower trophic level
Gross energy intake
Digested energy
Energy not used
and available to be
passed to the next
level
Urinary waste Assimilated energy
Resting energy Activity Growth Reproduction
Where does the energy go??
Energy from lower trophic level
Energy not used Gross energy intake
Digested energy
Urinary waste Assimilated energy
Resting energy Activity Growth Reproduction
10 %
Where does the energy go??
Always start
with the SUN.
PRODUCERS
HERBIVORES
1st Order
CARNIVORES
2nd Order
CARNIVORES
3rd Order
CARNIVORES
Producers use most of the
energy they make (90%) for
themselves.
The 10% of energy that is not
used by producers can be
passed on to organisms that
cannot make their own energy.
10/26/2015
7
a. Nutrients are recycled by the decomposers back
to the producers.
b. Nutrients are lost from the ecosystem when
organisms die.
c. The conversion of food into growth by an
organism is not very efficient.
d. Energy is recycled by the decomposers back to
the producers.
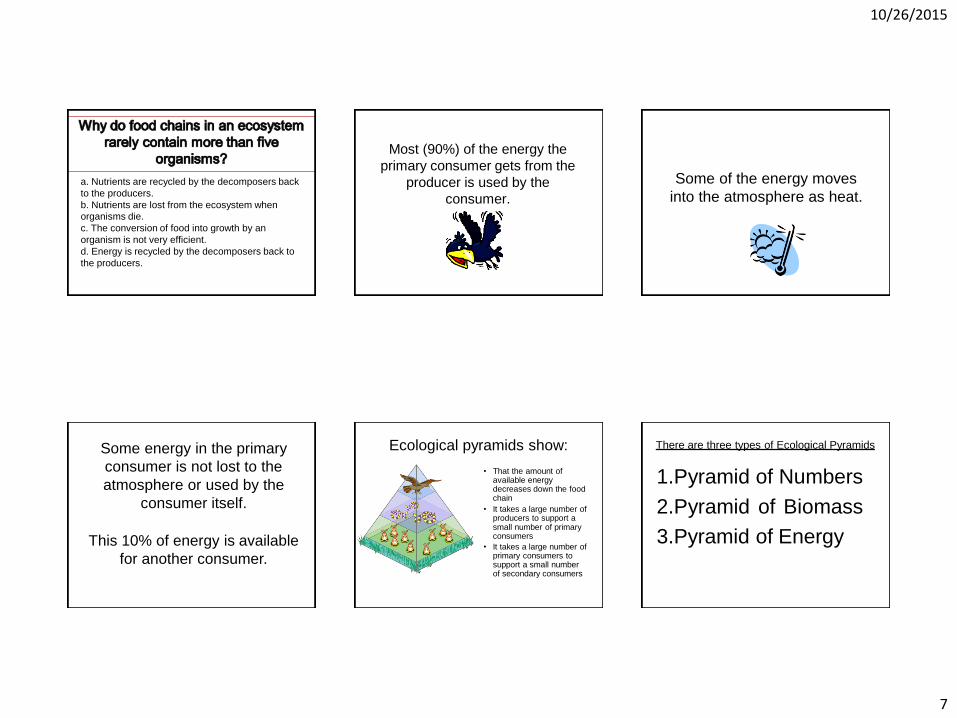
Most (90%) of the energy the
primary consumer gets from the
producer is used by the
consumer.
Some of the energy moves
into the atmosphere as heat.
Some energy in the primary
consumer is not lost to the
atmosphere or used by the
consumer itself.
This 10% of energy is available
for another consumer.
Ecological pyramids show:
• That the amount of available energy decreases down the food chain
• It takes a large number of producers to support a small number of primary consumers
• It takes a large number of primary consumers to support a small number of secondary consumers
There are three types of Ecological Pyramids
1.Pyramid of Numbers
2.Pyramid of Biomass
3.Pyramid of Energy

10/26/2015
8
Pyramid of Numbers
Shows the
number of
organisms at
each trophic
level.
Pyramids of numbers will often be
pyramid-shaped - but not always.
•
Pyramid of Biomass
Shows the total
mass of living tissue at each level e.g. shows that a large amount of tree mass is needed to feed a single caterpillar.
Pyramid of Biomass • Units are in mass per unit area.
• For example: – g/M2 “grams per square meter”
Example Pyramid of Biomass The 10% rule applies to
Pyramids of Biomass
10/26/2015
9
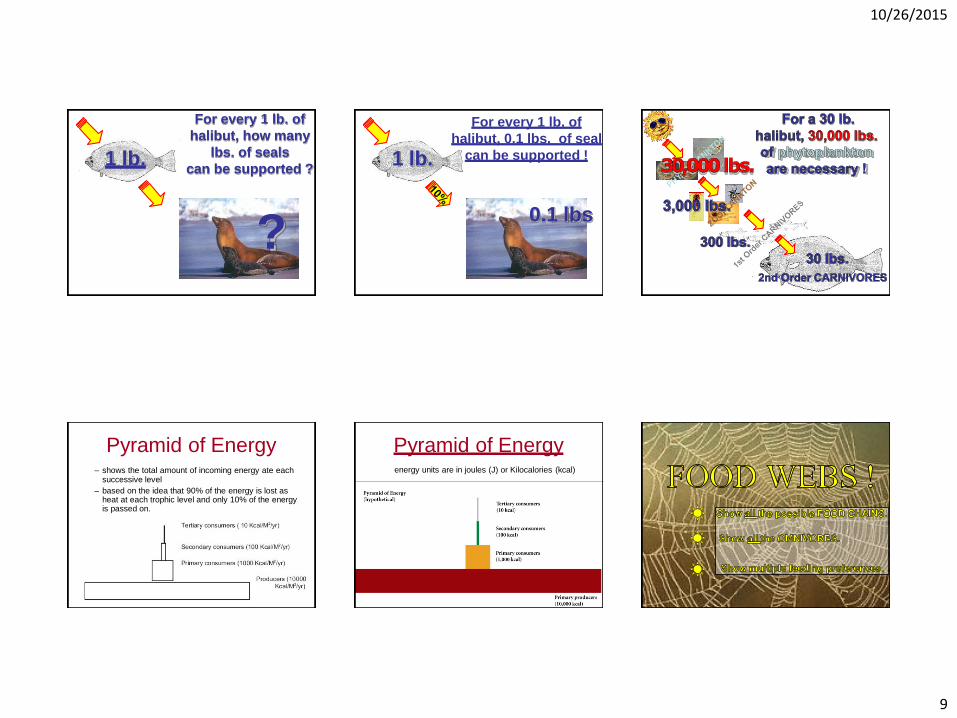
For every 1 lb. of
halibut, how many
lbs. of seals
can be supported ?
?
1 lb.
For every 1 lb. of
halibut, 0.1 lbs. of seal
can be supported !
0.1 lbs
1 lb.
Pyramid of Energy – shows the total amount of incoming energy ate each
successive level
– based on the idea that 90% of the energy is lost as heat at each trophic level and only 10% of the energy is passed on.
Pyramid of Energy energy units are in joules (J) or Kilocalories (kcal)
10/26/2015
10
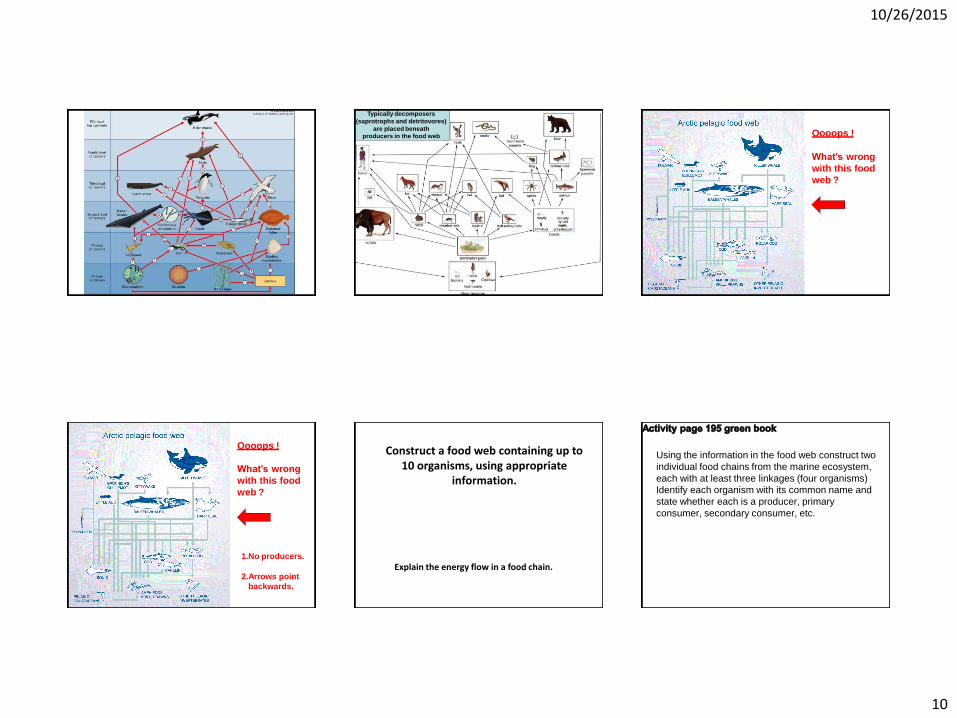
Typically decomposers
(saprotrophs and detritovores)
are placed beneath
producers in the food web Oooops !
What’s wrong
with this food
web ?
Oooops !
What’s wrong
with this food
web ?
1.No producers.
2.Arrows point
backwards.
Construct a food web containing up to 10 organisms, using appropriate
information.
Explain the energy flow in a food chain.
Using the information in the food web construct two
individual food chains from the marine ecosystem,
each with at least three linkages (four organisms)
Identify each organism with its common name and
state whether each is a producer, primary
consumer, secondary consumer, etc.
10/26/2015
11
Explain why, in a food chain, a large amount of
plant material supports a smaller mass of
herbivores and an even smaller mass of
carnivores.
-Energy is lost at each trophic level. Only 10-20% of the energy made available by producers passes to primary consumers. This is because plants use energy for their own metabolic processes such as creating ATP. Consumers use energy in movement; the energy dissipates and is lost as heat into the surrounding environment. Also, not all the organic matter is consumed. -The total amount of energy available to top consumers is small; a large number of producers are required to provide tertiary and quaternary consumers with enough energy.
Activity
Suggest what trophic level humans occupy. Give
examples.
Trophic levels of humans depend on what they feed on: - When eating vegetables, cereals and fruits only: primary consumers - When eating meat from herbivores: secondary consumers - When eating other carnivore animals: tertiary or quaternary consumers
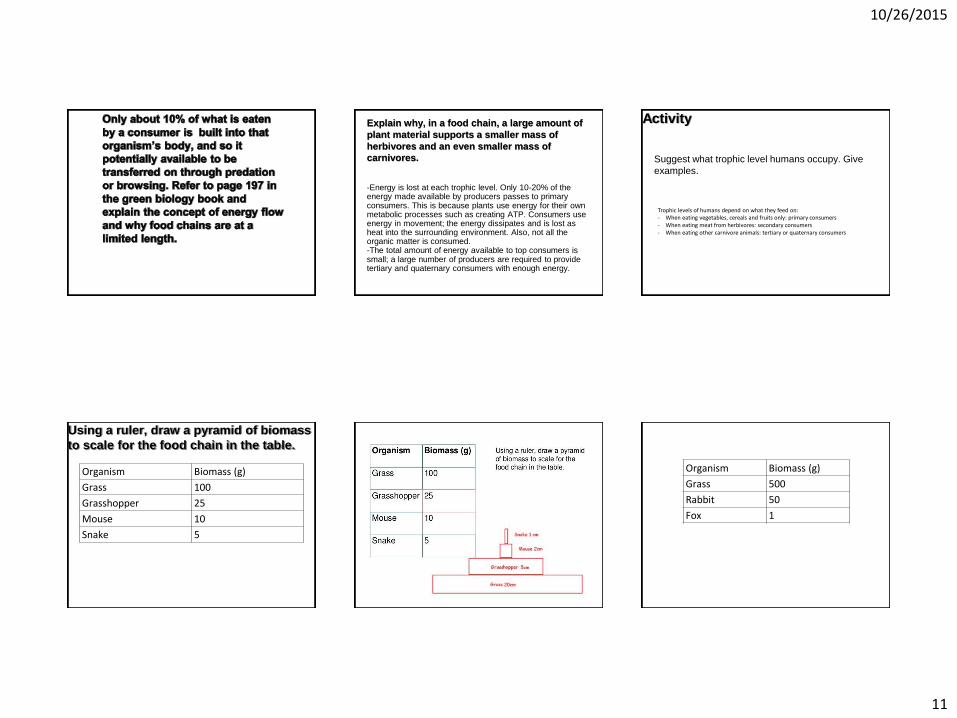
Using a ruler, draw a pyramid of biomass
to scale for the food chain in the table.
Organism Biomass (g)
Grass 100
Grasshopper 25
Mouse 10
Snake 5
Organism Biomass (g)
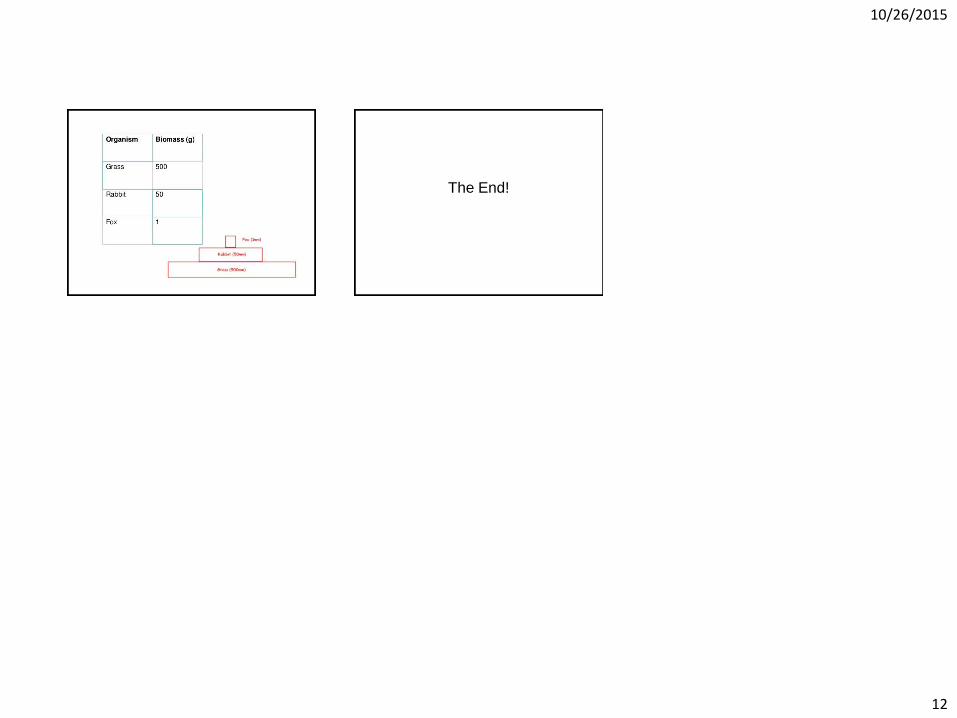
Grass 500
Rabbit 50
Fox 1
10/26/2015
12
The End!


