REPORT
WATER QUALITY MANAGEMENT AND MONITORING PLAN ONONDAGA LAKE
Prepared for
Prepared by
May 2012
WATER QUALITY MANAGEMENT AND MONITORING PLAN ONONDAGA LAKE
Prepared for
Prepared by
May 2012
Water Quality Management and Monitoring Plan May 2012 Onondaga Lake i 120139-01
TABLE OF CONTENTS EXECUTIVE SUMMARY ...................................................................................................... ES-1
1 INTRODUCTION .................................................................................................................. 1
1.1 WQMMP Goals and Objectives ......................................................................................1
1.2 WQMMP Organization ...................................................................................................1
2 WATER QUALITY ALERT AND ACTION LEVELS ........................................................... 3
2.1 Turbidity ...........................................................................................................................3
2.2 Chemistry Samples ...........................................................................................................4
3 WATER QUALITY MANAGEMENT AND ENGINEERED CONTROLS ........................... 7
4 WATER QUALITY MONITORING PROGRAM ................................................................. 9
4.1 Monitoring Parameters ....................................................................................................9
4.2 Monitoring Station Locations ..........................................................................................9
4.2.1 Performance Monitoring Stations ...........................................................................10
4.2.2 Compliance Monitoring Stations .............................................................................11
4.3 Monitoring Schedules ....................................................................................................11
4.4 Sampling and Analysis Methods ...................................................................................12
4.4.1 Water Quality Sampling ..........................................................................................12
4.4.1.1 Turbidity Monitoring ..................................................................................... 12
4.4.1.2 Discrete Water Column Sampling ................................................................. 13
4.5 Health and Safety ...........................................................................................................14
4.6 Quality Assurance ..........................................................................................................15
4.7 Sample and Data Management and Reporting .............................................................15
5 RESPONSE ACTIONS ......................................................................................................... 16
6 REFERENCES ...................................................................................................................... 18
Table of Contents
Water Quality Management and Monitoring Plan May 2012 Onondaga Lake ii 120139-01
List of Tables Table 2-1 Water Quality Monitoring Parameters and Associated Aquatic (Acute)
Criteria .................................................................................................................... 5
Table 4-1 Water Quality Monitoring Plan Summary Table 4-2 Water Quality Parameters, Frequency of Sample Collection, and Analytical
Methods ................................................................................................................ 14
List of Figures Figure 3-1 Proposed Turbidity Curtain 2012 Alignment Figure 3-2 Proposed Turbidity Curtain 2013 Alignment Figure 3-3 Proposed Turbidity Curtain 2014 Alignment Figure 3-4 Proposed Turbidity Curtain 2015 Alignment Figure 4-1 Typical Performance and Compliance Monitoring Stations During Dredging –
Remediation Areas C and D Figure 4-2 Typical Performance and Compliance Monitoring Stations During Capping –
Remediation Areas C and D Figure 4-3 Typical Monitoring Equipment Figure 5-1 Response Action Flow Chart
List of Appendices Appendix A Standard Operating Procedure: Surface Water Quality Monitoring and
Sampling
Appendix B Onondaga Lake Water Quality Data Summary and Interpretation

Water Quality Management and Monitoring Plan May 2012 Onondaga Lake iii 120139-01
LIST OF ACRONYMS AND ABBREVIATIONS µg/L micrograms per liter A(A) aquatic (acute) Anchor QEA Anchor QEA, LLC BMP best management practice CM compliance monitoring CPOI chemical parameters of interest eDMS electronic data management system HSP2 Honeywell Syracuse Portfolio Health and Safety Program JSA Job Safety Analysis NTU Nephelometric Turbidity Units NYSDEC New York State Department of Environmental Conservation OCDWEP Onondaga County Department of Water Environment Protection PAH PDI
polycyclic aromatic hydrocarbons Pre-Design Investigation
PM performance monitoring PSP Project Safety Plan QAPP Quality Assurance Project Plan QA quality assurance QC quality control SMU Sediment Management Unit SOP Standard Operating Procedure SRP soluble reactive phosphorus SVOC semivolatile organic compound TDP total dissolved phosphorus TP total phosphorus TSS Total Suspended Solids VOC volatile organic compound WQMMP Water Quality Management and Monitoring Plan
Water Quality Management and Monitoring Plan May 2012 Onondaga Lake ES-1 120139-01
EXECUTIVE SUMMARY
The Onondaga Lake remediation plan, which was selected by the New York State Department of Environmental Conservation (NYSDEC) and the U.S. Environmental Protection Agency (USEPA), calls for a combination of dredging, capping, and monitored natural recovery, which are proven environmental remediation methods that address contamination in Lake sediment. To prevent potential unacceptable water quality impacts as a result of sediment disturbances during these activities, a comprehensive water quality management and monitoring program will be implemented. This program will address suspension of contaminated sediments and potential release of contaminants. Suspension controls, both physical (i.e., silt or turbidity curtains) and operational (e.g., minimizing cutterhead rotation speed and implementing other best management practices [BMPs]) have proven effective at numerous capping and dredging sites, and will be used to mitigate any potential impacts during Onondaga Lake remedial activities. The proposed methods and procedures for management of ambient water quality impacts are presented in this Water Quality Management and Monitoring Plan (WQMMP). The goals and objectives of this WQMMP are to: 1) describe water quality management and control measures; 2) provide procedures and protocols to monitor water quality during dredging and capping activities; and 3) establish response actions in the unlikely event that unacceptable conditions are detected. Water quality alert and action levels, management activities and controls such as silt curtains, water quality monitoring program elements, and potential response activities, are described in detail in the WQMMP. Water quality alert and action levels have been developed such that an efficient and environmentally protective program can be implemented. A program based on real-time turbidity monitoring and supplemented periodically with samples analyzed for chemicals of interest will be used to monitor the impacts of dredging and capping and will provide for rapid implementation of response actions, if warranted, to ensure protection of water quality is achieved.
Water Quality Management and Monitoring Plan May 2012 Onondaga Lake 1 120139-01
1 INTRODUCTION
The Onondaga Lake remediation is composed of a combination of dredging and capping in littoral areas as well as thin-layer capping and monitored natural recovery in the profundal zone, referred to as Sediment Management Unit (SMU) 8. Additional background information and an overview of the remedial action are provided in Section 1 of the Onondaga Lake Capping, Dredging, Habitat and Profundal Zone (SMU 8) Final Design (Final Design; Parsons and Anchor QEA, LLC [Anchor QEA], 2012). This Water Quality Management and Monitoring Plan (WQMMP) describes the water quality monitoring and response activities to be performed during dredging and capping in the Lake.
1.1 WQMMP Goals and Objectives
The goals and objectives of the WQMMP are as follows:
• Identify water quality alert and action levels that would initiate investigation and/or implementation of additional engineering practices to control potential impacts of ongoing remedial work
• Describe water quality management and control measures (e.g., best management practices [BMPs]) that will mitigate unanticipated unacceptable water quality impacts
• Provide procedures and protocols to monitor water quality during dredging and capping activities to assess and manage potential impacts to water quality associated with the remedial construction activities on the Lake
• Establish response actions in the unlikely event that unacceptable conditions are detected
1.2 WQMMP Organization
This WQMMP includes the following sections:
• Section 1 presents a general overview of the WQMMP including the goals and objectives of the water quality monitoring program.
• Section 2 presents the water quality alert and action levels developed for this project.
Introduction
Water Quality Management and Monitoring Plan May 2012 Onondaga Lake 2 120139-01
• Section 3 discusses the management activities and controls that will be in place to protect water quality during dredging and capping activities.
• Section 4 describes the water quality monitoring program, including the monitoring parameters, locations, schedule, equipment, analyses, and reporting requirements.
• Section 5 discusses the response actions that will be followed based on monitoring results (i.e., in the unlikely event that construction-related impacts cause alert and action levels and/or criteria to be exceeded).
• Section 6 provides the references for this WQMMP.
Water Quality Management and Monitoring Plan May 2012 Onondaga Lake 3 120139-01
2 WATER QUALITY ALERT AND ACTION LEVELS
Water quality alert and action levels for the dredging and capping work have been developed such that an efficient and environmentally protective program can be implemented. The primary means of monitoring impacts of dredging and capping on water quality will be based on real-time turbidity monitoring (as described in Section 4.4). Because turbidity is a measure of particulate matter that may contain sorbed phase chemicals (e.g., associated with dredging releases), real-time turbidity monitoring will allow for rapid response to adverse water quality conditions. The monitoring program will also include periodic sampling for analytical chemistry.
2.1 Turbidity
Based on the analysis of ambient turbidity measurements collected as part of the 2010 and 2011 Water Quality Monitoring for Construction Baseline programs (described in Sections 2 and 3 of Appendix B) and a review of relevant environmental dredging projects, a two-tiered approach will be used. The alert and action levels will be based on observed increases in turbidity relative to that measured at a designated “background” monitoring station. Turbidity alert levels of 25 Nephelometric Turbidity Units (NTU) above background at near-field, performance monitoring (PM) stations and turbidity action levels of 50 NTU above background at far-field, compliance monitoring (CM) stations have been deemed to be both protective and practical for this project.1 This two-tiered turbidity program allows for early identification of elevated turbidity levels at the PM station (i.e., 25 NTU above background) with the initiation of specific investigative steps (described in Section 5) following a turbidity alert level exceedance at the PM station. As illustrated by the various graphics presented in Appendix B, the range of ambient turbidity in the Lake has been observed to be generally under 10 NTU, but can temporarily increase to several hundred NTU due to tributary runoff
1 A relationship between Total Suspended Solids (TSS) and turbidity was observed using paired TSS/turbidity data from Onondaga Lake and its tributaries (discussed in Section 4 of Appendix B, and as noted on Figure B-13 of Appendix B). This relationship can be revised as additional data are collected during construction activities and, as necessary, could be used as a general guideline for estimating TSS levels for a given turbidity measurement.
Water Quality Action Levels
Water Quality Management and Monitoring Plan May 2012 Onondaga Lake 4 120139-01
and/or high winds.2 Therefore, a turbidity alert level of 25 NTU above background at the PM station during dredging and capping operations is considered appropriate to provide a sufficient degree of indication to impacts on water quality from those activities, beyond levels expected under ambient conditions, and in the absence of substantial weather-related influence. These numerical trigger values (i.e., 25 and 50 NTU) may be modified based on observed field conditions (e.g., if frequent exceedances due to non-construction related factors occur); any such modifications would be made in consultation with the New York State Department of Environmental Conservation [NYSDEC]). In summary, the real-time turbidity monitoring system will provide for rapid implementation of response actions, if warranted, to ensure that the water quality action level is met at the CM stations.
2.2 Chemistry Samples
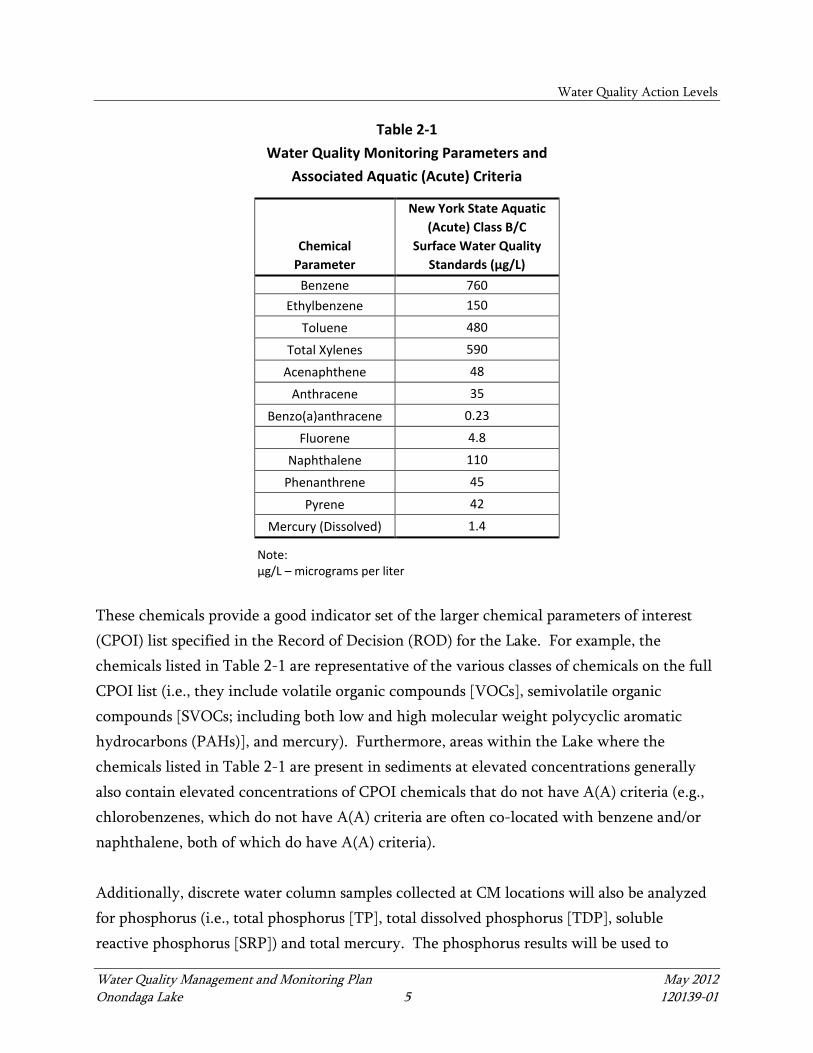
During dredging and capping, discrete water column samples will also be collected at CM locations (as described in Section 4), and analyzed for chemical compounds with a corresponding NYSDEC aquatic (acute) (A[A]) water quality standard. The results from such sampling will be compared to these standards for documentation purposes. Those chemical compounds that have A(A) water quality criteria are listed in Table 2-1.
2 Specifically, this point is demonstrated by: 1) Figures B-4 and B-5 of Appendix B, which present probability distributions of continuous turbidity monitoring data from 2010 and 2011, respectively; and 2) Figure B-8 of Appendix B, which compares turbidity measurements to flows in nearby tributaries, wind speed/direction, and precipitation.
Water Quality Action Levels
Water Quality Management and Monitoring Plan May 2012 Onondaga Lake 5 120139-01
Table 2-1 Water Quality Monitoring Parameters and
Associated Aquatic (Acute) Criteria
Chemical Parameter
New York State Aquatic (Acute) Class B/C
Surface Water Quality Standards (µg/L)
Benzene 760 Ethylbenzene 150
Toluene 480
Total Xylenes 590
Acenaphthene 48
Anthracene 35
Benzo(a)anthracene 0.23
Fluorene 4.8
Naphthalene 110
Phenanthrene 45
Pyrene 42
Mercury (Dissolved) 1.4
Note: µg/L – micrograms per liter
These chemicals provide a good indicator set of the larger chemical parameters of interest (CPOI) list specified in the Record of Decision (ROD) for the Lake. For example, the chemicals listed in Table 2-1 are representative of the various classes of chemicals on the full CPOI list (i.e., they include volatile organic compounds [VOCs], semivolatile organic compounds [SVOCs; including both low and high molecular weight polycyclic aromatic hydrocarbons (PAHs)], and mercury). Furthermore, areas within the Lake where the chemicals listed in Table 2-1 are present in sediments at elevated concentrations generally also contain elevated concentrations of CPOI chemicals that do not have A(A) criteria (e.g., chlorobenzenes, which do not have A(A) criteria are often co-located with benzene and/or naphthalene, both of which do have A(A) criteria). Additionally, discrete water column samples collected at CM locations will also be analyzed for phosphorus (i.e., total phosphorus [TP], total dissolved phosphorus [TDP], soluble reactive phosphorus [SRP]) and total mercury. The phosphorus results will be used to
Water Quality Action Levels
Water Quality Management and Monitoring Plan May 2012 Onondaga Lake 6 120139-01
supplement data collected by the Onondaga County Department of Water Environment Protection (OCDWEP).
Water Quality Management and Monitoring Plan May 2012 Onondaga Lake 7 120139-01
3 WATER QUALITY MANAGEMENT AND ENGINEERED CONTROLS
Water quality protection during construction activities was built into the overall Lake remedy through several layers of protection within each stage of the project, including the choice of dredging equipment, implementation of turbidity controls and BMPs, and performance of monitoring activities to identify and help minimize any environmental impacts. Hydraulic dredging will be utilized for removal of sediments within the project area. Hydraulic dredging inherently causes fewer water quality impacts than mechanical dredging because the sediments are removed at the sediment surface and pumped to a treatment area rather than lifting a bucket through the water column. Turbidity controls, such as silt curtains and BMPs, will also be employed. Silt curtains promote deposition of suspended solids within the boundary of the curtain and mitigate transport of these solids to other regions of the Lake. Silt curtains will enclose the dredging areas throughout the dredging activities and will remain in place until the initial mixing layer of the cap has been placed over the completed dredge area. After dredging, adjacent dredge and cap areas will be separated using an interior silt curtain that can be moved as work progresses. The interior curtain will limit migration of turbidity from a dredge area to a cap area. Movable interior curtains will also be used to isolate areas not requiring remediation located within the primary silt curtain boundary to the extent practical. The location of the movable interior curtain will vary as the dredging and capping progress through a remediation area. Preliminary silt curtain alignments for each year of construction are provided on Figures 3-1 through 3-4. The final configurations and requirements for silt curtain placement may be modified during construction in consultation with NYSDEC, as the project advances and dredging and capping operations sequencing is finalized. As described in Section 5.3 of Appendix B, the capping activities in a cap-only area during the Capping Field Demonstration Program had minimal impact on turbidity outside of the demarcation curtain, and the turbidity plumes, when observed, quickly dissipated within the demarcation curtain. Therefore, demarcation curtains will be used in cap-only areas during capping activities.
Water Quality Management and Engineered Controls
Water Quality Management and Monitoring Plan May 2012 Onondaga Lake 8 120139-01
In addition to silt curtains, the following BMPs will be implemented to minimize potential adverse impacts on water quality:
• The construction contractor will ensure that no fuel, garbage, or debris enters the Lake from the dredge, capping barge, or other vessels associated with the project.
• Capping materials will generally be placed uniformly over the sediment surface and in multiple lifts, minimizing potential disturbance to the sediment or previously placed cap material.
• Sequencing of dredging and capping will be optimized (upcurrent to downcurrent, offshore to onshore, or with respect to number of lifts) to minimize disturbance of non-impacted sediments.
• Dredging on slopes steeper than a set angle (e.g., steeper than 10 horizontal to 1 vertical) will begin, where feasible, at the highest elevation and work towards the lowest elevation to minimize sloughing. This will be modified as necessary to allow dredging from deeper water to shallower water where necessary to allow the dredge to approach the shallow shoreline areas.
• Operational controls will be implemented if adverse effects are noted. • Capping materials will be placed from toe to the top of the slope on slopes steeper
than a set angle (e.g., steeper than 10 horizontal to 1 vertical) to minimize sloughing. • Location and material control equipment will be used to maximize controlled
placement of cap material and, thus, minimize placement outside of the desired capping limits.
• Sheens, if observed, will be controlled through deployment of booms or other methods.
A comprehensive monitoring program, presented in Section 4 of this WQMMP, has been developed to identify and minimize any environmental impacts.
Water Quality Management and Monitoring Plan May 2012 Onondaga Lake 9 120139-01
4 WATER QUALITY MONITORING PROGRAM
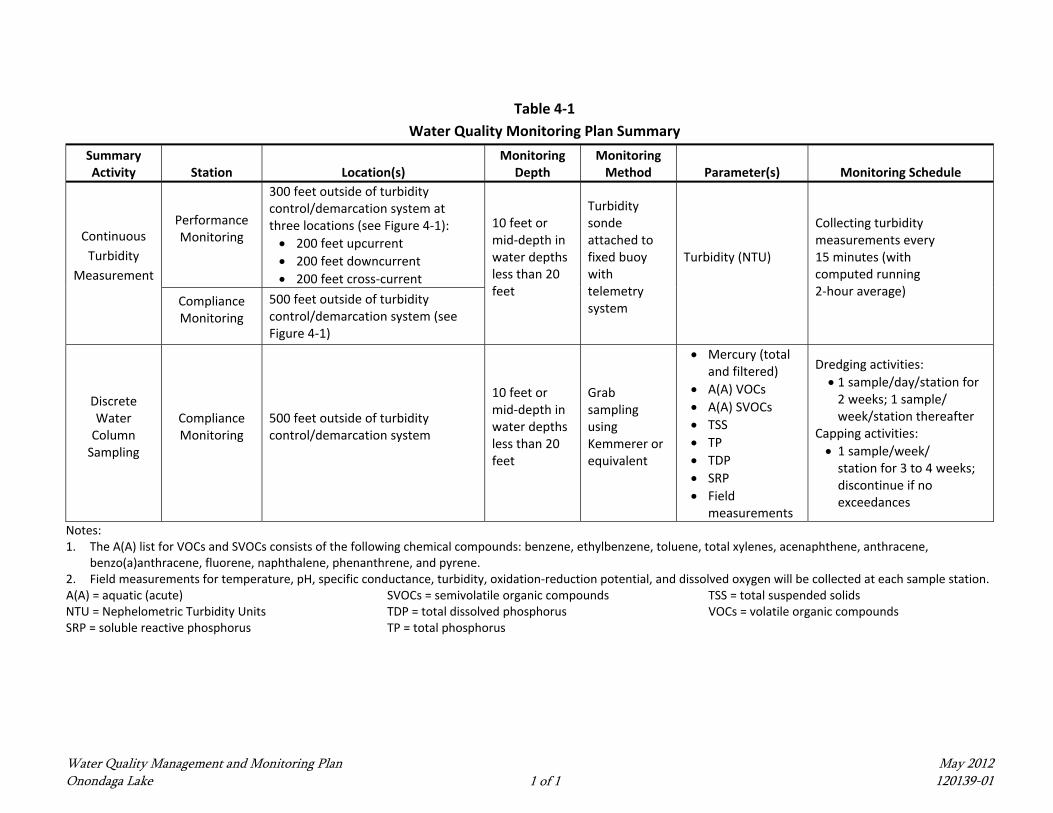
This section discusses the water quality monitoring program to be conducted during construction of the remedial action. Table 4-1 provides a summary of the proposed monitoring activities including monitoring location, schedule, analytes, and methods. Monitoring activities described below may change in response to site conditions and results of previous monitoring. Any modifications to the monitoring activities described herein will be made in consultation with NYSDEC.
4.1 Monitoring Parameters
The monitoring parameters used as part of the water quality monitoring program include both parameters measured in the field and laboratory analyses. Turbidity, measured continuously in the field with a turbidity probe, will be the primary indication that water quality management is achieved. Visual monitoring of turbidity and sheens will also be employed. If visual observations indicate that revisions to the monitoring program such as adding monitoring locations, increasing the frequency of monitoring, or moving monitoring locations closer to the work area would provide more useful data, Honeywell will consult with NYSDEC on any such proposed modification(s). Water column chemical analytes will be evaluated periodically during dredging and capping as well. Given the short-term nature of potential construction-related impacts, the water column monitoring parameters will be the site sediment CPOIs that have acute toxicity criteria (see Tables 2-1 and 4-1). As stated in Section 2, these compounds with acute toxicity standards are typically generally representative of the full suite of compounds containing the highest concentrations observed in sediment.
4.2 Monitoring Station Locations
Water quality monitoring will be performed near dredging and capping activities using a tiered location approach. The primary monitoring locations will be the PM stations, located outside of the turbidity controls (i.e., silt curtains) in the vicinity of ongoing dredging or capping operations. Secondary measurements will be taken at CM stations, which will be located some distance outside the remediation area boundaries, to ensure that water quality
Water Quality Monitoring Program
Water Quality Management and Monitoring Plan May 2012 Onondaga Lake 10 120139-01
in the larger, Lake-wide system is maintained during construction. Each of these monitoring locations is discussed below.
4.2.1 Performance Monitoring Stations
The intent of the PM stations will be to monitor near-field turbidity in the vicinity of the construction area and provide an “early warning” of potential water quality impacts. PM stations will consist of real-time, continuous turbidity measurements using buoy systems that are easily transportable to various locations near dredging and capping activities. PM stations will be positioned approximately 200 feet from the edge of the turbidity control structure (i.e., silt curtain) during dredging, or approximately 200 feet from the demarcation system during capping activities. Three PM stations will be placed at each dredging/capping operation oriented around the turbidity control or demarcation system in an upcurrent, downcurrent, and cross-current configuration. For example, if both capping and dredging operations are occurring at separate locations within the Lake, two sets of three PM stations will be used, for a total of six PM stations. In the event that both capping and dredging operations are occurring near one another, some PM stations may be shared between the operations based on their proximity. Figure 4-1 provides proposed PM stations that will be used during dredging in 2012. As shown, two silt curtain alignments (e.g., Remediation Area C and Remediation Area D) will be used in 2012. However, depending on the timing/sequencing of operations, both silt curtain alignments (and corresponding turbidity monitoring buoys) may not be used concurrently. PM stations will only be operated when dredging or capping activities are conducted within the respective turbidity or demarcation system. As demarcation curtains used during capping will surround smaller areas and may be moved frequently in the field, a conceptual configuration of PM stations in proximity to a proposed demarcation curtain alignment is shown on Figure 4-2. The locations of PM stations for subsequent years will follow the general pattern depicted on Figures 4-1 and 4-2. During dredging and capping activities, one of the three PM stations will be used to define local background conditions for assessing compliance with water quality alert and action levels. The background turbidity monitor will be conservatively defined as the monitor at the PM station having the lowest turbidity reading. If observations in the field indicate that
Water Quality Monitoring Program
Water Quality Management and Monitoring Plan May 2012 Onondaga Lake 11 120139-01
the PM station designated as “background” is not adequately capturing the local background conditions, an additional dedicated background turbidity station may be deployed based on consultation with the NYSDEC.
4.2.2 Compliance Monitoring Stations
CM stations will serve as the official compliance locations for water quality and will be used to assess and protect water quality associated with the remedial construction activities. Real-time, continuous turbidity readings and water quality grab samples will be collected from CM stations. These stations will be located approximately 500 feet from the edge of the turbidity control structures during dredging, or approximately 500 feet from the demarcation system during capping activities. One CM station will be placed at each dredging/capping operation; however, if both capping and dredging operations are occurring near one another, the CM station may be shared between the operations based on their proximity. Example locations for the CM stations during dredging and capping activities are presented on Figures 4-1 and 4-2, respectively. As with the PM stations, the CM stations will only be operated when dredging or capping activities are conducted within the respective turbidity or demarcation system.
4.3 Monitoring Schedules
Table 4-1 presents the monitoring activities and schedule for the water quality program. As discussed previously, turbidity is the primary indicator of water quality management and will be monitored continuously during dredging and capping operations at the PM and CM stations described in the previous sections. Turbidity measurements will be collected every 15 minutes and 2-hour running averages will be computed for assessment purposes. Water column samples will also be collected at the CM station to evaluate chemical compounds. Separate tiered programs will be implemented during dredging and capping operations:
• For dredging operations, samples will be collected daily for an initial “verification period” that will span the first 2 weeks of dredging to gather site-specific data and confirm BMPs are protective. At the conclusion of this 2-week verification period, collection of grab samples at the CM station(s) will continue on a weekly basis (or

Water Quality Monitoring Program
Water Quality Management and Monitoring Plan May 2012 Onondaga Lake 12 120139-01
biweekly, based on supporting compliance data and concurrence with NYSDEC). • During capping operations (i.e., when only capping is being performed), visual
turbidity is typically a result of clean material within the water column. Therefore, the water quality grab sampling will begin with weekly monitoring upon initiation of capping (to characterize construction-related general trends), graduating to a turbidity-only monitoring program after 3 to 4 weeks if water quality action level exceedance for chemicals is not observed.
4.4 Sampling and Analysis Methods
4.4.1 Water Quality Sampling
As discussed above, water quality data will be collected during dredging and capping activities to assess construction performance and resulting system-wide response of water quality in the Lake. Specific details pertaining to the collection of turbidity measurements and water column samples to be analyzed for chemical compounds are discussed below.
4.4.1.1 Turbidity Monitoring
Continuous turbidity measurements will be collected within the water column at buoyed PM and CM stations during dredging and capping activities, as discussed in Section 4.2. Turbidity sondes (i.e., probes) at each deployment will be set at a fixed depth of 10 feet or mid-depth in water depths shallower than 20 feet, consistent with the depth used to represent the upper mixed layer of the Lake in the discrete water quality sampling (see Section 4.4.1.2 below). Continuous turbidity monitoring will be conducted in accordance with Appendix A – Surface Water Sampling Standard Operating Procedure (SOP). Each continuous (15-minute) turbidity monitoring station will consist of a manually deployed system comprised of a buoy with associated anchors and floats, a turbidity sonde, solar panel and battery, and data logging equipment (see Figure 4-3 for typical turbidity monitoring equipment configuration). This system will log and transmit data via cellular modem in real-time to an electronic data management system (eDMS). The buoyed stations will be designed to withstand anticipated annual weather conditions and will meet regulatory requirements for buoys placed in a navigable waterbody. Manual
Water Quality Monitoring Program
Water Quality Management and Monitoring Plan May 2012 Onondaga Lake 13 120139-01
inspection and maintenance, consisting of sonde cleaning and calibration (as necessary), will be conducted routinely (approximately weekly). Manual turbidity measurements will be made during these routine inspections with additional (hand-held) equipment, and deployed sonde units will also be exchanged with shop-calibrated units on a routine basis to ensure consistency and accuracy of the turbidity monitoring program (routine probe change-out will help avoid potential sonde malfunctioning associated with biofouling).
4.4.1.2 Discrete Water Column Sampling
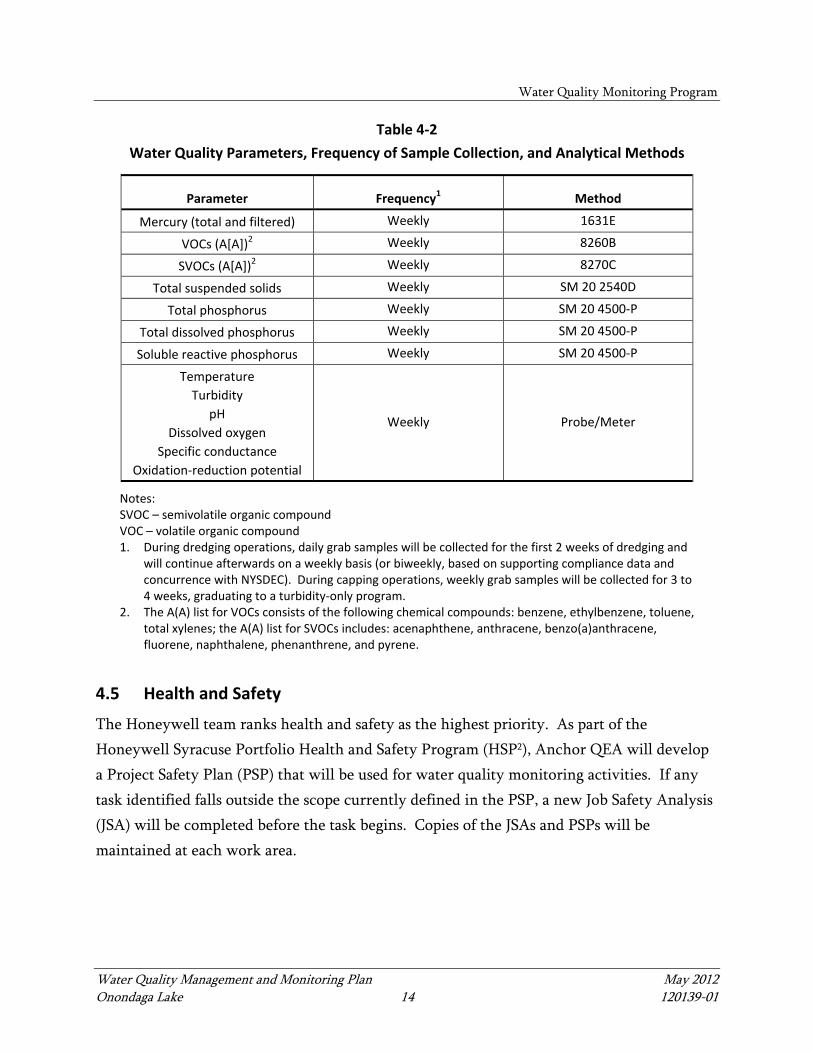
As discussed in Section 4.3, discrete water column sampling is anticipated to occur approximately weekly during dredging activities (following daily sampling during the initial verification period). A tiered sampling program will also be employed during capping activities. Grab samples will be collected from the water column at the CM stations. Additionally, grab sample(s) will be collected at the CM station if the turbidity action level is exceeded (i.e., 50 NTU above background). Consistent with the 2011 Water Quality Monitoring for Construction Baseline program (Parsons 2011), discrete water column samples will be collected from a fixed depth of 10 feet from the water surface. Based on a review of the typical depths of the thermocline observed in the Lake during approximately the last 10 years, a depth of 10 feet was selected to be representative of water quality within the upper mixed layer of the Lake during stratification. In cases where the water depth is less than 20 feet, sampling will be conducted from the midpoint of the water column, as was done in the Water Quality Monitoring for Construction Baseline program. The discrete water column sampling will be conducted in accordance with standard operating procedures documented in Appendix A. Samples will be analyzed for the suite of parameters listed in Table 4-2 and the results will be compared to the A(A) water quality standards listed in Table 2-1. Measurements of Total Suspended Solids (TSS) will provide further information on particle concentrations and impacts on water clarity. Phosphorus results will be used to supplement data collected by the OCDWEP. Field measurements for temperature, pH, specific conductance, turbidity, oxidation-reduction potential, and dissolved oxygen will also be taken.
Water Quality Monitoring Program
Water Quality Management and Monitoring Plan May 2012 Onondaga Lake 14 120139-01
Table 4-2 Water Quality Parameters, Frequency of Sample Collection, and Analytical Methods
Parameter Frequency1 Method
Mercury (total and filtered) Weekly 1631E
VOCs (A[A])2 Weekly 8260B
SVOCs (A[A])2 Weekly 8270C
Total suspended solids Weekly SM 20 2540D
Total phosphorus Weekly SM 20 4500-P
Total dissolved phosphorus Weekly SM 20 4500-P
Soluble reactive phosphorus Weekly SM 20 4500-P
Temperature Turbidity
pH Dissolved oxygen
Specific conductance Oxidation-reduction potential
Weekly Probe/Meter
Notes: SVOC – semivolatile organic compound VOC – volatile organic compound 1. During dredging operations, daily grab samples will be collected for the first 2 weeks of dredging and
will continue afterwards on a weekly basis (or biweekly, based on supporting compliance data and concurrence with NYSDEC). During capping operations, weekly grab samples will be collected for 3 to 4 weeks, graduating to a turbidity-only program.
2. The A(A) list for VOCs consists of the following chemical compounds: benzene, ethylbenzene, toluene, total xylenes; the A(A) list for SVOCs includes: acenaphthene, anthracene, benzo(a)anthracene, fluorene, naphthalene, phenanthrene, and pyrene.
4.5 Health and Safety
The Honeywell team ranks health and safety as the highest priority. As part of the Honeywell Syracuse Portfolio Health and Safety Program (HSP2), Anchor QEA will develop a Project Safety Plan (PSP) that will be used for water quality monitoring activities. If any task identified falls outside the scope currently defined in the PSP, a new Job Safety Analysis (JSA) will be completed before the task begins. Copies of the JSAs and PSPs will be maintained at each work area.
Water Quality Monitoring Program
Water Quality Management and Monitoring Plan May 2012 Onondaga Lake 15 120139-01
4.6 Quality Assurance
Laboratory procedures will be conducted in accordance with the Quality Assurance Project Plan (QAPP; Parsons et al. 2012). Field quality assurance (QA) and quality control (QC) will consist of the collection and analysis of field duplicates, and matrix spike/matrix spike duplicate samples in accordance with the QAPP. One equipment rinse blank will be collected for each sampling event.
4.7 Sample and Data Management and Reporting
Sample names, QA/QC procedures, sample collection, data entry, and data validation for this water quality monitoring program will be conducted in accordance with the Phase I PDI Sampling and Analysis Plan (Parsons 2005). Any deviations from these procedures will be discussed with NYSDEC prior to execution of the work. Analytical data generated during this investigation will be reviewed and validated for usability in accordance with pre-established data validation procedures summarized in the forthcoming QAPP. The results will be incorporated into the Honeywell Locus Focus database following validation. As described in Section 4.3 and Table 4-1, water quality monitoring will occur continuously (e.g., turbidity) or daily/weekly (e.g., analytical chemistry) depending on the parameter of interest. Unvalidated, draft data will be informally shared with the NYSDEC representative at the on-site office, and a comprehensive water quality report will be submitted to NYSDEC annually. In the event an exceedance of the water quality performance criteria occurs, protocols outlined in the response action flow chart (Figure 5-1; discussed in Section 5 below) will be followed and NYSDEC will be notified of the exceedance. A description of the exceedance and any response actions taken will be documented in the monthly report following the exceedance.
Water Quality Management and Monitoring Plan May 2012 Onondaga Lake 16 120139-01
5 RESPONSE ACTIONS
Water quality monitoring will be performed to confirm that water quality protection measures (presented in Section 3) are effective. Turbidity measurements at the PM stations will serve as an early warning for possible unacceptable levels at the CM stations; therefore, response actions are discussed in this WQMMP with respect to the PM stations. However, if the water quality at a CM station does not meet the analytical chemistry (Table 2-1) or turbidity action levels (i.e., 50 NTU above background), additional sampling and further investigations will be performed to assess whether the water quality is being impacted by the remediation activities. If the turbidity alert level (i.e., 25 NTU above background, based on 2-hour rolling averages) at a PM station is exceeded, specific steps will be initiated to address the exceedances according to the flow chart presented on Figure 5-1. The first step will be to perform secondary evaluations or investigations, including the following:
• Confirm the turbidity values with additional measurements (i.e., manual probe measurements and visual observation from a sampling vessel)
• Evaluate potential causes of turbidity excursion Turbidity values at PM stations will be confirmed by evaluating trends in turbidity for four consecutive 2-hour averaged turbidity values to remove potential anomalies. If 2-hour average turbidity values continue to exceed the turbidity alert level (i.e., 25 NTU above background), the cause of the elevated values will be investigated. Investigative activities will include, but not be limited to, the following:
• Inspection of the turbidity meter for damage, fouling, malfunction, or other localized conditions that may cause an elevated turbidity reading
• Visual inspection of the silt curtain, including a surface assessment of curtain condition, location, and anchoring, and, if necessary, an underwater assessment using a remote camera
• Visual inspection of the surrounding area for increased turbidity resulting from non-remedial activities (e.g., tributaries, wind-wave activity); turbidity readings may also be collected in this area using a hand-held turbidity meter to confirm elevated turbidity
Response Actions
Water Quality Management and Monitoring Plan May 2012 Onondaga Lake 17 120139-01
If the turbidity exceedance can be reasonably attributed to a turbidity sonde or silt curtain malfunction or damage, the equipment will be repaired concurrent with dredging and/or capping activities, as appropriate. If the turbidity exceedance is determined to be attributable to dredging or capping activities, dredging or capping operations will be evaluated and appropriate operational changes will be implemented as necessary, which may include the following:
• Optimizing specific dredging or capping operations (such as ladder swing speed, cutter rotation speed, depth of cut, speed of advance of dredge, cap material placement rate, and height/depth of release of cap material from bucket)
• Limiting dredging and placement operations to calmer environmental/weather conditions (e.g., modifying dredging or placement when wave heights or wind speeds exceed a certain value)
• Modifying single-cut depths to be more efficient • Decreasing the cap lift thickness if turbidity exceedances are a result of resuspended
sediment and not clean sand • Modifying turbidity controls, as appropriate, to contain construction-related impacts
Water Quality Management and Monitoring Plan May 2012 Onondaga Lake 18 120139-01
6 REFERENCES
Parsons, 2005. Onondaga Lake Pre-Design Investigation: Phase I Work Plan. Prepared for Honeywell. September 2005.
Parsons, 2011. Onondaga Lake Pre-Design Investigation: Water Quality Monitoring for Construction Baseline Work Plan. Prepared for Honeywell. May 2011.
Parsons and Anchor QEA, LLC [Anchor QEA], 2012. Onondaga Lake Capping, Dredging, Habitat and Profundal Zone (Sediment Management Unit 8) Final Design. Prepared for Honeywell. March 2012.
Parsons, Anchor QEA, and Upstate Freshwater Institute, 2012. Draft Quality Assurance Project Plan for Onondaga Lake Construction and Post-Construction Media Monitoring (surface water, biota and sediment). Prepared for Honeywell. May 2012.

TABLE
Water Quality Management and Monitoring Plan May 2012 Onondaga Lake 120139-01 1 of 1
Table 4‐1 Water Quality Monitoring Plan Summary
Summary Activity Station Location(s)
Monitoring Depth
Monitoring Method Parameter(s) Monitoring Schedule
Continuous Turbidity
Measurement
Performance Monitoring
300 feet outside of turbidity control/demarcation system at three locations (see Figure 4‐1): 200 feet upcurrent 200 feet downcurrent 200 feet cross‐current
10 feet or mid‐depth in water depths less than 20 feet
Turbidity sonde attached to fixed buoy with telemetry system
Turbidity (NTU)
Collecting turbidity measurements every 15 minutes (with computed running 2‐hour average)
Compliance Monitoring
500 feet outside of turbidity control/demarcation system (see Figure 4‐1)
Discrete Water Column Sampling
Compliance Monitoring
500 feet outside of turbidity control/demarcation system
10 feet or mid‐depth in water depths less than 20 feet
Grab sampling using Kemmerer or equivalent
Mercury (total and filtered)
A(A) VOCs A(A) SVOCs TSS TP TDP SRP Field
measurements
Dredging activities: 1 sample/day/station for 2 weeks; 1 sample/ week/station thereafter
Capping activities: 1 sample/week/ station for 3 to 4 weeks; discontinue if no exceedances
Notes: 1. The A(A) list for VOCs and SVOCs consists of the following chemical compounds: benzene, ethylbenzene, toluene, total xylenes, acenaphthene, anthracene,
benzo(a)anthracene, fluorene, naphthalene, phenanthrene, and pyrene. 2. Field measurements for temperature, pH, specific conductance, turbidity, oxidation‐reduction potential, and dissolved oxygen will be collected at each sample station. A(A) = aquatic (acute) NTU = Nephelometric Turbidity Units SRP = soluble reactive phosphorus
SVOCs = semivolatile organic compounds TDP = total dissolved phosphorus TP = total phosphorus
TSS = total suspended solids VOCs = volatile organic compounds

FIGURES
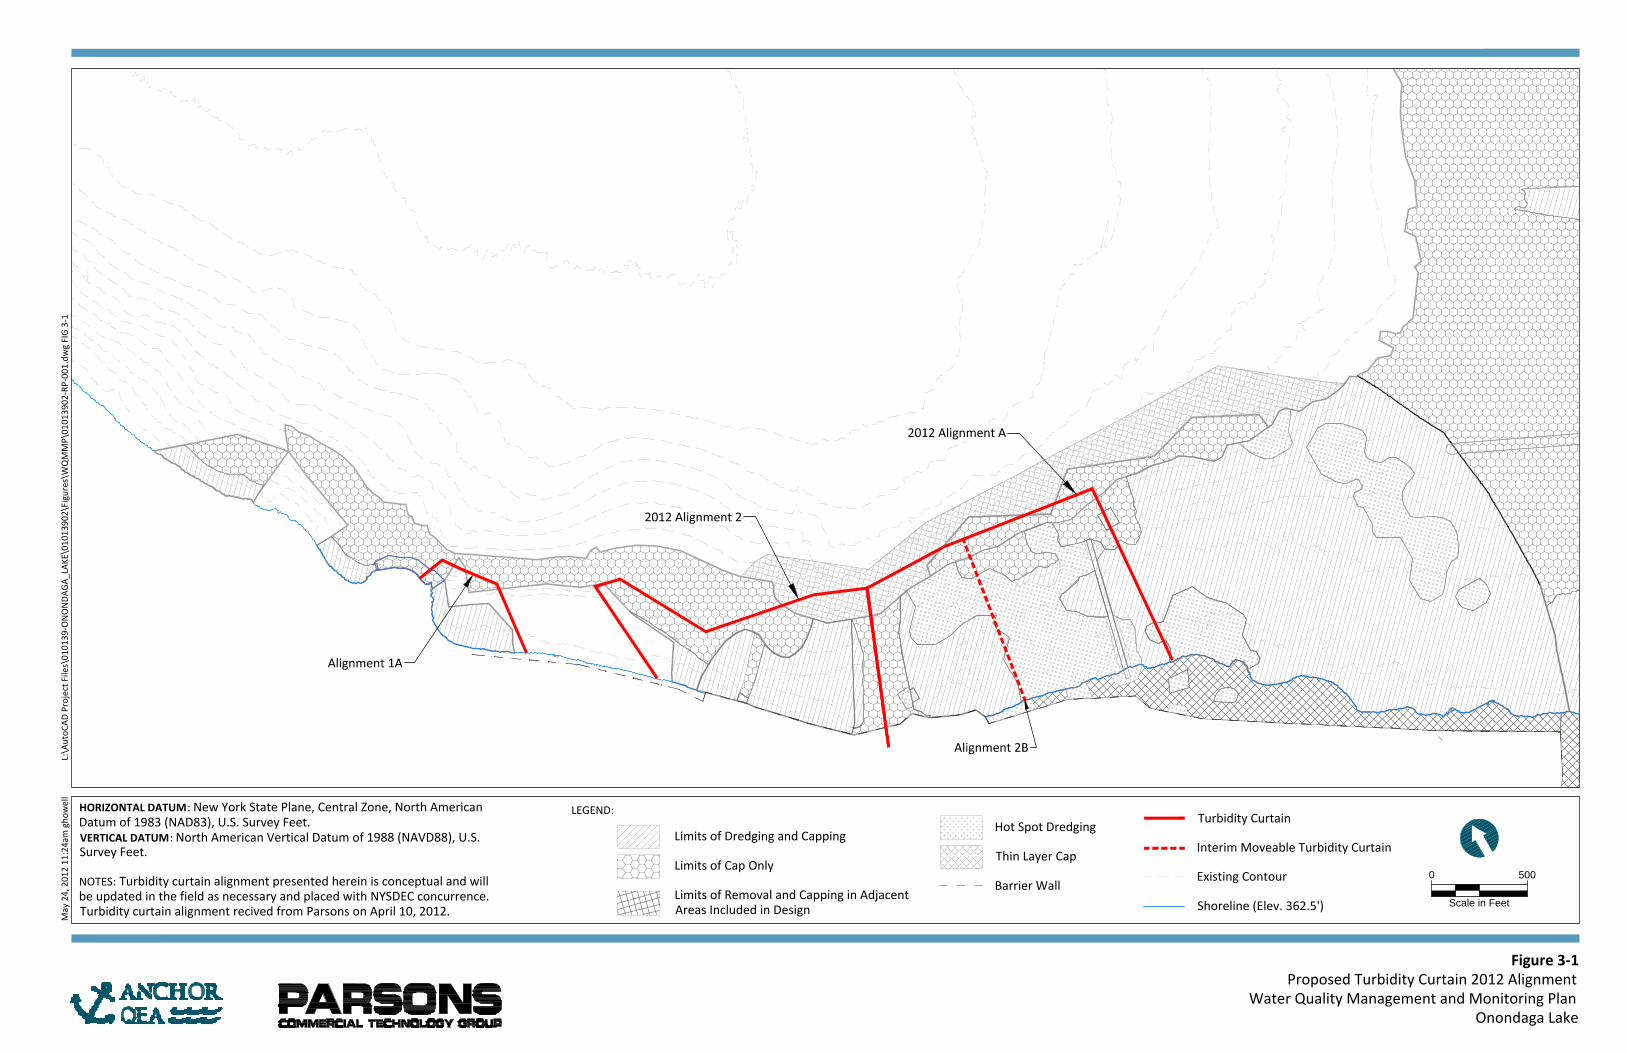
Figure 3-1Proposed Turbidity Curtain 2012 Alignment
Water Quality Management and Monitoring Plan Onondaga Lake
May
24,
201
2 11
:24a
m g
how
ell
L:\
Auto
CAD
Proj
ect F
iles\
0101
39-O
NO
NDA
GA_L
AKE\
0101
3902
\Fig
ures
\WQ
MM
P\01
0139
02-R
P-00
1.dw
g FI
G 3-
1
0
Scale in Feet
500
LEGEND:HORIZONTAL DATUM: New York State Plane, Central Zone, North AmericanDatum of 1983 (NAD83), U.S. Survey Feet.VERTICAL DATUM: North American Vertical Datum of 1988 (NAVD88), U.S.Survey Feet.
NOTES: Turbidity curtain alignment presented herein is conceptual and willbe updated in the field as necessary and placed with NYSDEC concurrence.Turbidity curtain alignment recived from Parsons on April 10, 2012.
Limits of Dredging and Capping
Limits of Cap Only
Limits of Removal and Capping in AdjacentAreas Included in Design
Hot Spot Dredging
Thin Layer Cap
Barrier Wall
Turbidity Curtain
Interim Moveable Turbidity Curtain
Existing Contour
Shoreline (Elev. 362.5')
Figure 3-2Proposed Turbidity Curtain 2013 Alignment
Water Quality Management and Monitoring Plan Onondaga Lake
May
24,
201
2 11
:30a
m g
how
ell
L:\
Auto
CAD
Proj
ect F
iles\
0101
39-O
NO
NDA
GA_L
AKE\
0101
3902
\Fig
ures
\WQ
MM
P\01
0139
02-R
P-00
2.dw
g FI
G 3-
2
0
Scale in Feet
500
HORIZONTAL DATUM: New York State Plane, Central Zone, North AmericanDatum of 1983 (NAD83), U.S. Survey Feet.VERTICAL DATUM: North American Vertical Datum of 1988 (NAVD88), U.S.Survey Feet.
NOTES: Turbidity curtain alignment presented herein is conceptual and willbe updated in the field as necessary and placed with NYSDEC concurrence.Turbidity curtain alignment recived from Parsons on July 25, 2011.
LEGEND:Turbidity Curtain
Interim Moveable TurbidityCurtain
Hot Spot Dredging
Limits of Dredging and Capping
Limits of Cap Only
Limits of Removal and Capping in AdjacentAreas Included in Design
Thin Layer Cap
Existing Contour
Shoreline (Elev. 362.5')
Barrier Wall
Figure 3-3Proposed Turbidity Curtain 2014 Alignment
Water Quality Management and Monitoring Plan Onondaga Lake
May
24,
201
2 11
:07a
m g
how
ell
L:\
Auto
CAD
Proj
ect F
iles\
0101
39-O
NO
NDA
GA_L
AKE\
0101
3902
\Fig
ures
\WQ
MM
P\01
0139
02-R
P-00
2.dw
g FI
G 3-
3
0
Scale in Feet
500
LEGEND:
Existing Contour
Shoreline (Elev. 362.5')
Turbidity Curtain
Interim Moveable TurbidityCurtain
HORIZONTAL DATUM: New York State Plane, Central Zone, North AmericanDatum of 1983 (NAD83), U.S. Survey Feet.VERTICAL DATUM: North American Vertical Datum of 1988 (NAVD88), U.S.Survey Feet.
NOTES: Turbidity curtain alignment presented herein is conceptual and willbe updated in the field as necessary and placed with NYSDEC concurrence.Turbidity curtain alignment recived from Parsons on July 25, 2011.
Limits of Dredging and Capping
Limits of Cap Only
Limits of Removal and Capping in AdjacentAreas Included in Design
Figure 3-4Proposed Turbidity Curtain 2015 Alignment
Water Quality Management and Monitoring Plan Onondaga Lake
May
24,
201
2 11
:27a
m g
how
ell
L:\
Auto
CAD
Proj
ect F
iles\
0101
39-O
NO
NDA
GA_L
AKE\
0101
3902
\Fig
ures
\WQ
MM
P\01
0139
02-R
P-00
2.dw
g FI
G 3-
4
0
Scale in Feet
500
LEGEND:
Existing Contour
Shoreline (Elev. 362.5')
Barrier Wall
HORIZONTAL DATUM: New York State Plane, Central Zone, North AmericanDatum of 1983 (NAD83), U.S. Survey Feet.VERTICAL DATUM: North American Vertical Datum of 1988 (NAVD88), U.S.Survey Feet.
NOTES: Turbidity curtain alignment presented herein is conceptual and willbe updated in the field as necessary and placed with NYSDEC concurrence.Turbidity curtain alignment recived from Parsons on July 25, 2011.
Limits of Dredging and Capping
Limits of Cap Only
Limits of Removal and Capping in AdjacentAreas Included in Design
Turbidity Curtain
Interim Moveable Turbidity Curtain
Thin Layer Cap
Figure 4-1Typical Performance and Compliance Monitoring Stations During Dredging – Remediation Areas C and D
Water Quality Management and Monitoring Plan Onondaga Lake
May
24,
201
2 11
:32a
m g
how
ell
L:\
Auto
CAD
Proj
ect F
iles\
0101
39-O
NO
NDA
GA_L
AKE\
0101
3902
\Fig
ures
\WQ
MM
P\01
0139
02-R
P-00
3.dw
g FI
G 4-
1
0
Scale in Feet
500
LEGEND:2. Labeling: CM-D-C1 (Type of monitoring station [CM =Compliance Monitoring; PM = Performance Monitoring; BG =Background]; Remediation activity [D = dredging; C = capping;DC = dredging and capping]; Remediation area/number ofgroups and/or buoys [C2C = Remediation Area C with twomonitoring groups identifying the third buoy in the group]
HORIZONTAL DATUM: New York State Plane, Central Zone, North AmericanDatum of 1983 (NAD83), U.S. Survey Feet.VERTICAL DATUM: North American Vertical Datum of 1988 (NAVD88), U.S.Survey Feet.NOTES:1. Turbidity curtain alignment presented herein is conceptual
and will be updated in the field as necessary and placed with DEC concurrence.
Hot Spot DredgingPerformance Monitoring Station
Compliance Monitoring Station
Turbidity Curtain
Interim Moveable Turbidity Curtain
Thin Layer Cap
Limits of Dredging and Capping
Limits of Cap Only
Limits of Removal and Capping inAdjacent Areas Included in Design
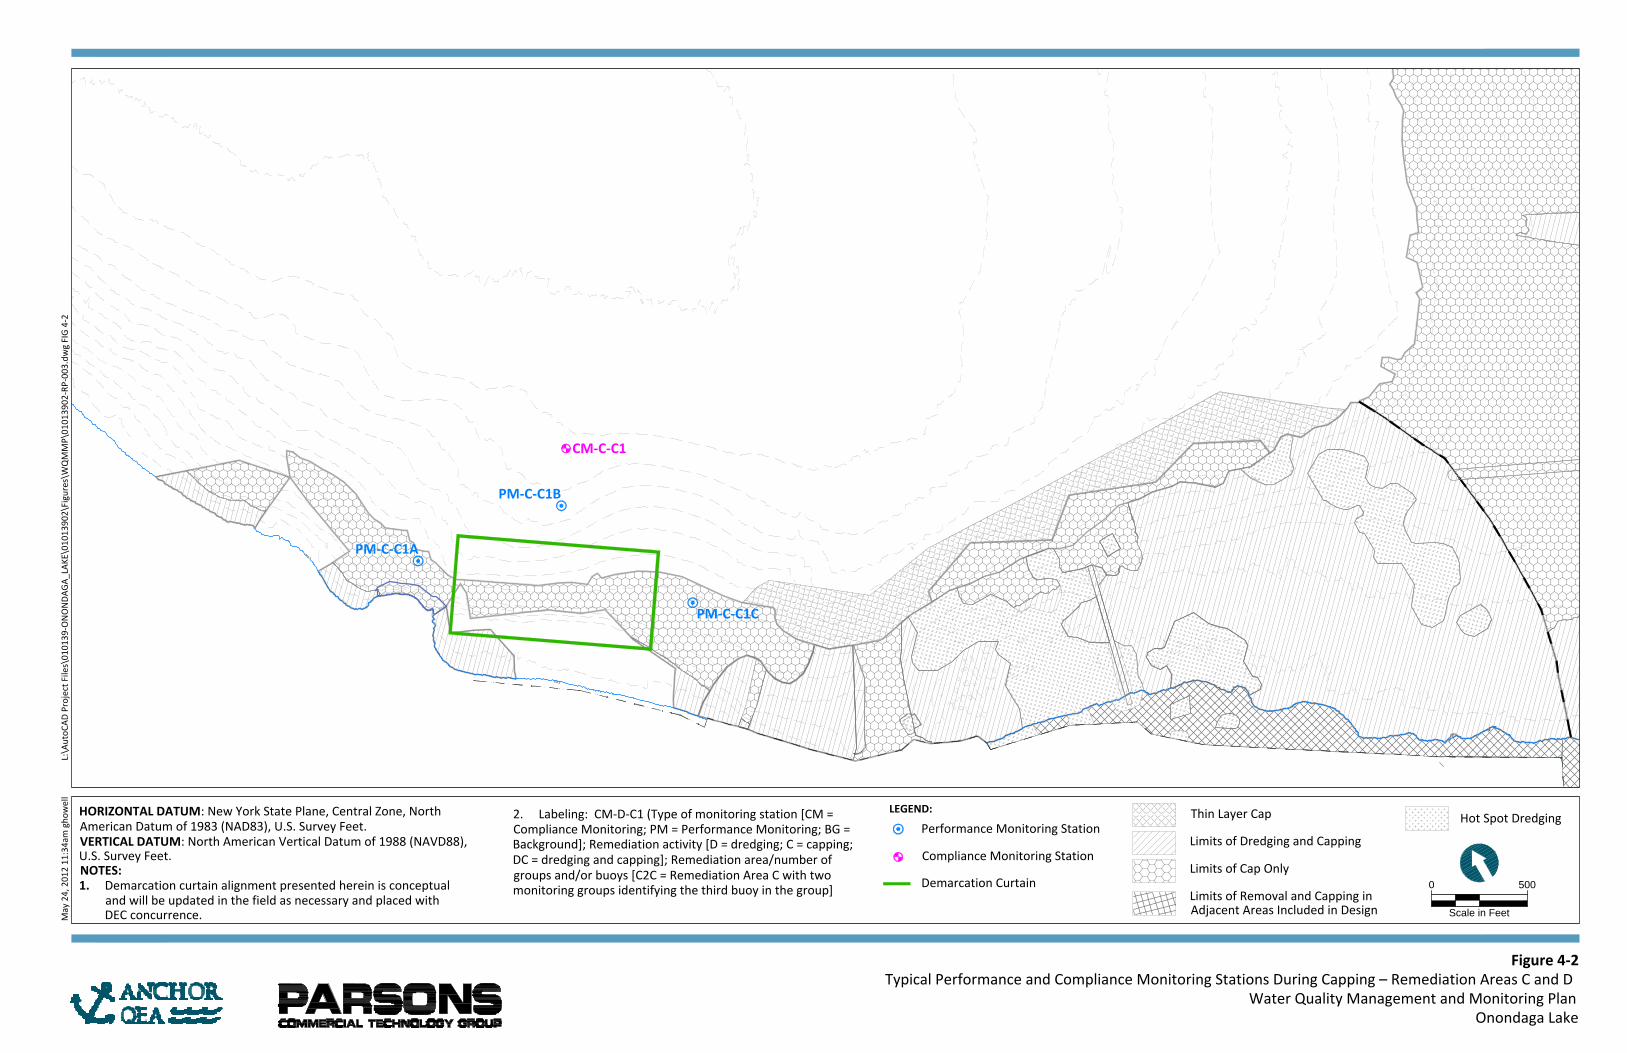
Figure 4-2Typical Performance and Compliance Monitoring Stations During Capping – Remediation Areas C and D
Water Quality Management and Monitoring Plan Onondaga Lake
May
24,
201
2 11
:34a
m g
how
ell
L:\
Auto
CAD
Proj
ect F
iles\
0101
39-O
NO
NDA
GA_L
AKE\
0101
3902
\Fig
ures
\WQ
MM
P\01
0139
02-R
P-00
3.dw
g FI
G 4-
2
0
Scale in Feet
500
LEGEND:2. Labeling: CM-D-C1 (Type of monitoring station [CM =Compliance Monitoring; PM = Performance Monitoring; BG =Background]; Remediation activity [D = dredging; C = capping;DC = dredging and capping]; Remediation area/number ofgroups and/or buoys [C2C = Remediation Area C with twomonitoring groups identifying the third buoy in the group]
HORIZONTAL DATUM: New York State Plane, Central Zone, NorthAmerican Datum of 1983 (NAD83), U.S. Survey Feet.VERTICAL DATUM: North American Vertical Datum of 1988 (NAVD88),U.S. Survey Feet.NOTES:1. Demarcation curtain alignment presented herein is conceptual
and will be updated in the field as necessary and placed with DEC concurrence.
Hot Spot DredgingPerformance Monitoring Station
Compliance Monitoring Station
Demarcation Curtain
Thin Layer Cap
Limits of Dredging and Capping
Limits of Cap Only
Limits of Removal and Capping inAdjacent Areas Included in Design
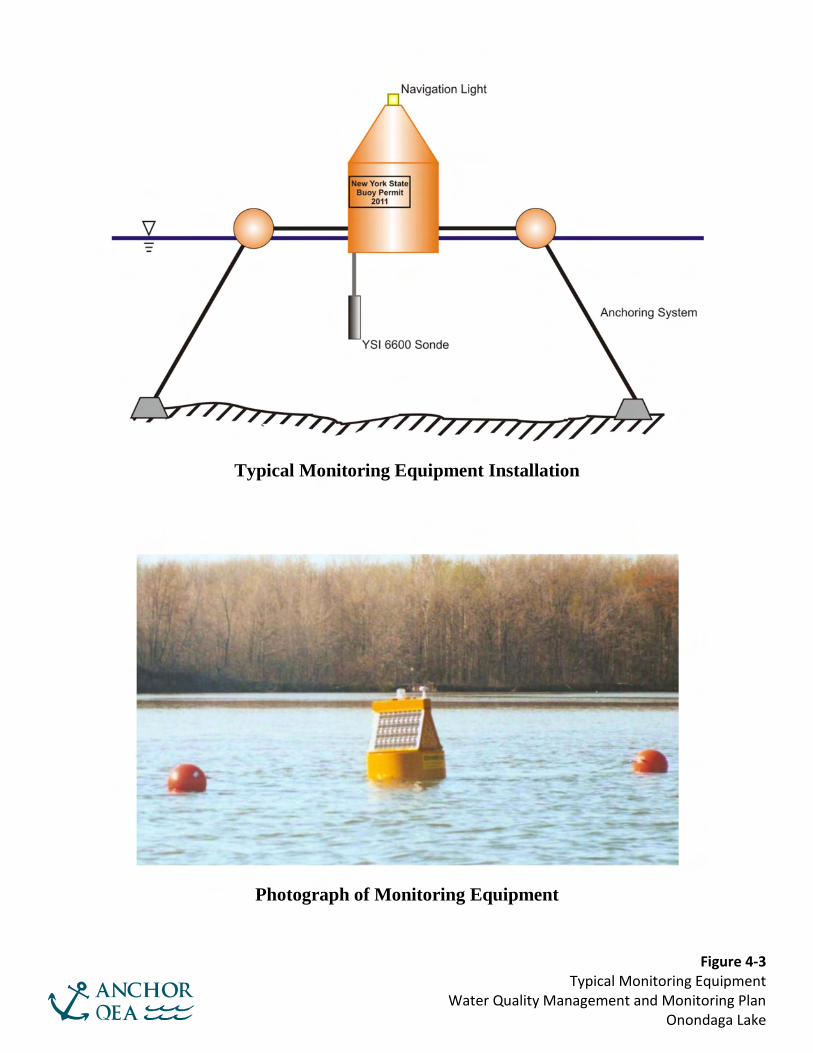
Figure 4-3 Typical Monitoring Equipment
Water Quality Management and Monitoring Plan Onondaga Lake
Typical Monitoring Equipment Installation
Photograph of Monitoring Equipment
YSI 6600 Sonde
Navigation Light
Anchoring System
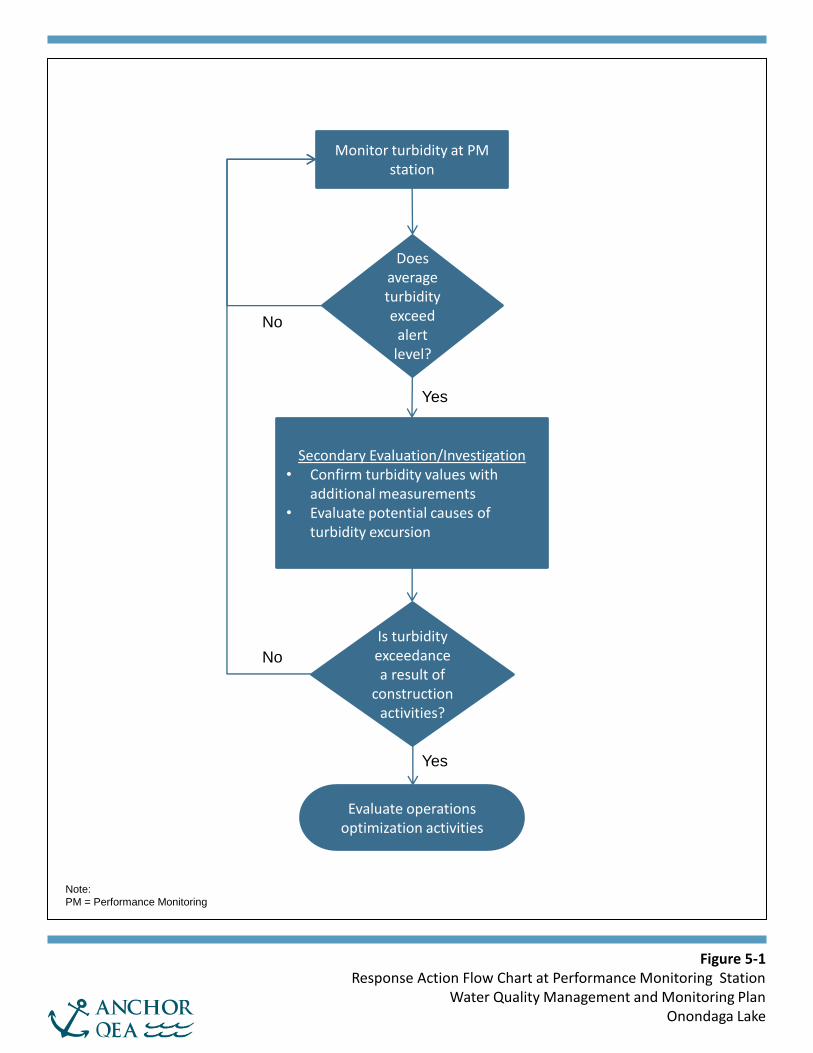
Figure 5-1 Response Action Flow Chart at Performance Monitoring Station
Water Quality Management and Monitoring Plan Onondaga Lake
Monitor turbidity at PM station
Does average turbidity exceed
alert level?
Secondary Evaluation/Investigation • Confirm turbidity values with
additional measurements • Evaluate potential causes of
turbidity excursion
Is turbidity exceedance a result of
construction activities?
Evaluate operations optimization activities
No
Yes
No
Yes
Note:
PM = Performance Monitoring
APPENDIX A STANDARD OPERATING PROCEDURE: SURFACE WATER QUALITY MONITORING AND SAMPLING
Water Quality Management and Monitoring Plan Appendix A May 2012 Onondaga Lake i 120139-01
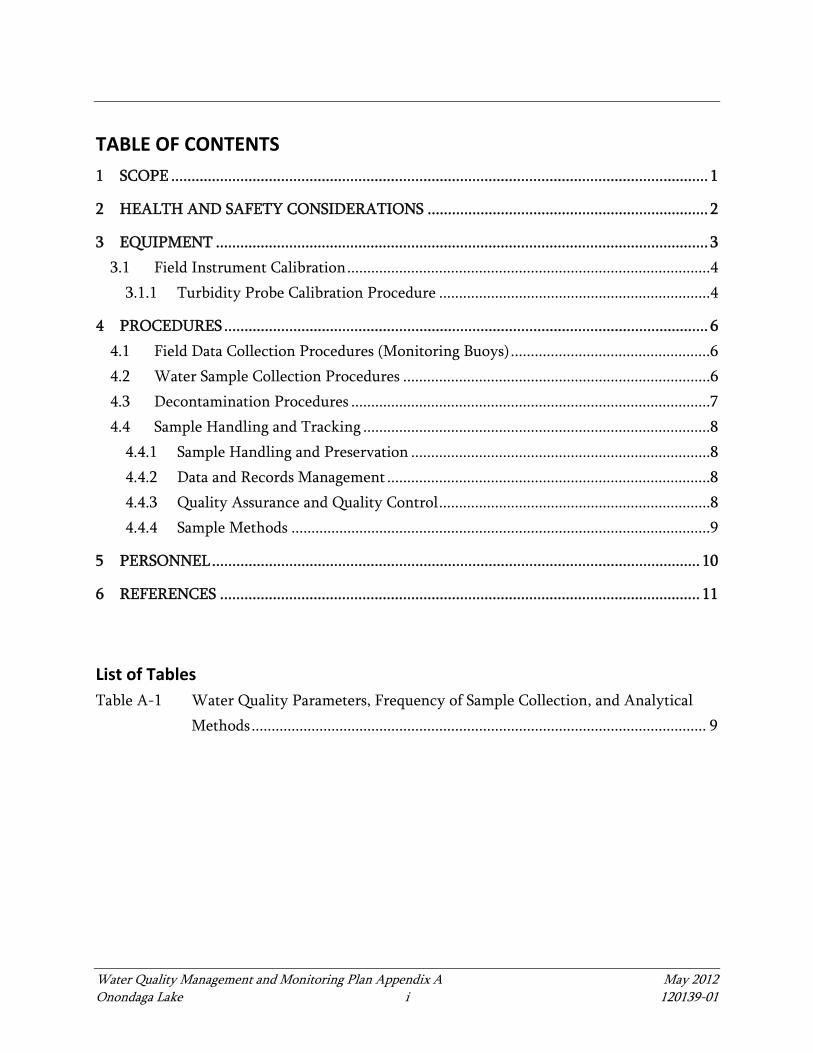
TABLE OF CONTENTS 1 SCOPE .................................................................................................................................... 1
2 HEALTH AND SAFETY CONSIDERATIONS ..................................................................... 2
3 EQUIPMENT ......................................................................................................................... 3 3.1 Field Instrument Calibration ...........................................................................................4
3.1.1 Turbidity Probe Calibration Procedure ....................................................................4
4 PROCEDURES ....................................................................................................................... 6 4.1 Field Data Collection Procedures (Monitoring Buoys) ..................................................6 4.2 Water Sample Collection Procedures .............................................................................6 4.3 Decontamination Procedures ..........................................................................................7 4.4 Sample Handling and Tracking .......................................................................................8
4.4.1 Sample Handling and Preservation ...........................................................................8 4.4.2 Data and Records Management .................................................................................8 4.4.3 Quality Assurance and Quality Control ....................................................................8 4.4.4 Sample Methods .........................................................................................................9
5 PERSONNEL ........................................................................................................................ 10
6 REFERENCES ...................................................................................................................... 11
List of Tables Table A-1 Water Quality Parameters, Frequency of Sample Collection, and Analytical
Methods .................................................................................................................. 9
Water Quality Management and Monitoring Plan Appendix A May 2012 Onondaga Lake ii 120139-01
LIST OF ACRONYMS AND ABBREVIATIONS A(A) aquatic acute GPS global positioning system ISO International Organization for Standardization MSDS Material Safety Data Sheets NTU Nephelometric Turbidity Units NYSDEC New York State Department of Environmental Conservation PPE personal protective equipment PSP project safety plan QA/QC quality assurance and quality control QAPP Quality Assurance Project Plan SOP Standard Operating Procedure SSP Subcontractor Safety Plan SVOC semivolatile organic carbon TSS Total Suspended Solids VOC volatile organic carbon

Water Quality Management and Monitoring Plan Appendix A May 2012 Onondaga Lake 1 120139-01
1 SCOPE
This Standard Operating Procedure (SOP) describes procedures used to monitor water quality in Onondaga Lake during dredging and capping activities. These activities will include deployment and servicing of continuous monitoring water quality sondes, conducting field measurements using a multi-parameter probe focusing on turbidity, and collecting water samples for subsequent laboratory analysis for selected chemical parameters.
Water Quality Management and Monitoring Plan Appendix A May 2012 Onondaga Lake 2 120139-01
2 HEALTH AND SAFETY CONSIDERATIONS
A safety briefing will be held at the beginning of each sampling event and at each change in personnel. The designated safety officer on the sampling vessel shall be responsible for ensuring the safety of personnel and will be contacted immediately in the event of an emergency. The standard safety considerations for marine sampling—caution deploying and retrieving heavy equipment, keeping hands and clothing out of winches and A-frame supports, and stepping in the bight of lines or cables—apply to the field crew during sampling. Winches, lifts, cables, and lines will be used within their designed limits to avoid injury from equipment failures. Appropriate personal protective equipment (PPE) will be donned prior to the start of work as described in the project safety plan (PSP). When using standard solutions for calibrations or decontamination of sampling equipment, care will be taken to avoid inhalation, skin contact, eye contact, and ingestion. Material Safety Data Sheets (MSDS) provided by the manufacturer should be reviewed by personnel prior to the use of a chemical. These considerations are discussed in more detail in the PSP (Anchor QEA, in preparation)
Water Quality Management and Monitoring Plan Appendix A May 2012 Onondaga Lake 3 120139-01
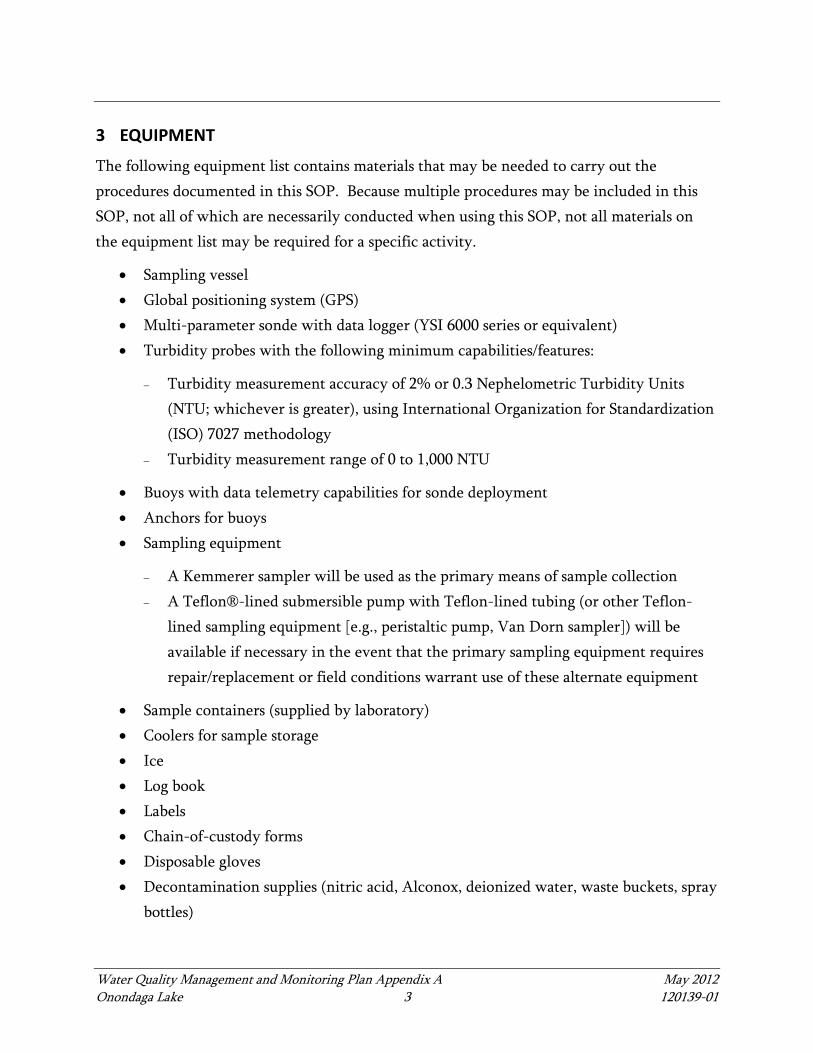
3 EQUIPMENT
The following equipment list contains materials that may be needed to carry out the procedures documented in this SOP. Because multiple procedures may be included in this SOP, not all of which are necessarily conducted when using this SOP, not all materials on the equipment list may be required for a specific activity.
Sampling vessel Global positioning system (GPS) Multi-parameter sonde with data logger (YSI 6000 series or equivalent) Turbidity probes with the following minimum capabilities/features:
Turbidity measurement accuracy of 2% or 0.3 Nephelometric Turbidity Units (NTU; whichever is greater), using International Organization for Standardization (ISO) 7027 methodology
Turbidity measurement range of 0 to 1,000 NTU
Buoys with data telemetry capabilities for sonde deployment Anchors for buoys Sampling equipment
A Kemmerer sampler will be used as the primary means of sample collection A Teflon®-lined submersible pump with Teflon-lined tubing (or other Teflon-
lined sampling equipment [e.g., peristaltic pump, Van Dorn sampler]) will be available if necessary in the event that the primary sampling equipment requires repair/replacement or field conditions warrant use of these alternate equipment
Sample containers (supplied by laboratory) Coolers for sample storage Ice Log book Labels Chain-of-custody forms Disposable gloves Decontamination supplies (nitric acid, Alconox, deionized water, waste buckets, spray
bottles)
Equipment
Water Quality Management and Monitoring Plan Appendix A May 2012 Onondaga Lake 4 120139-01
3.1 Field Instrument Calibration
All probes for the multi-parameter water quality sonde will be calibrated prior to use per manufacturer recommendations. The procedures described in the sonde owner’s manual will be adhered to when performing calibrations for temperature, pH, specific conductance, and dissolved oxygen. When calibrating for turbidity, the procedures listed below will be followed. These procedures have been modified from those prescribed in the owner’s manual to account for fouling of the probe that can occur from long-term deployment, and will provide for increased accuracy of the turbidity sensor. Logs will be maintained on all calibrated equipment each time a calibration is performed.
3.1.1 Turbidity Probe Calibration Procedure
The turbidity method is based upon a comparison of intensity of light scattered by a sample under defined conditions with the intensity of light scattered by standard reference solutions. Ensuring that the lens covering the detection unit is clean, both during the calibration and during field use, is critical to the instrument’s operation. The turbidity probe used on the YSI 6000 Series sonde includes an automated optics wiper. This wiper can be activated using the display/logger. The manufacturer recommends use of a two-point calibration procedure and that the YSI 6136 turbidity probe be calibrated using the calibration cup provided with the sonde; however, one major drawback to this method is that the standard solutions must be discarded after calibration due to possible contamination. An alternative method is to place the standard solutions in secondary containers with openings large enough to allow the turbidity probe to be placed into the standard. These containers should have similar physical properties as the calibration cup (i.e., clear to opaque, plastic). The sides of the container should not have any material such as tape or writing on them. This alternative method will be used for the Onondaga Lake construction monitoring; furthermore, to provide for additional accuracy in turbidity measurements in the range of interest (i.e., <100 NTU) a three-point calibration procedure will be used. This turbidity calibration method is as follows:
1. Pour calibration solutions into the YSI calibration cups long enough before calibrating so bubbles have time to dissipate and do not interfere with optics. A separate calibration cup should be used for each solution.
Equipment
Water Quality Management and Monitoring Plan Appendix A May 2012 Onondaga Lake 5 120139-01
2. Clean all of the probes on the sonde and rinse with deionized water. Shake off excess water. Dry with a lint-free cloth.
3. Remove wiper and clean. Replace wiper pad if needed. Reattach after calibration is complete.
4. Place the probes on the sonde into the 0.0 NTU standard (which can be deionized water).
5. From the “Calibrate” menu on the display/logger, select the “Turbidity” option and press enter.
6. Select the “2-point” option and press enter. 7. Enter “0.0” as the first calibration standard and press enter. 8. Wait for the turbidity measurement to equilibrate, and then press the enter key. 9. Dry probe with a lint-free cloth. 10. Place the probe in the YSI 6073G 126 NTU standard. Do not clean the probe before
placing into the second standard. 11. Press enter to continue calibration. 12. Enter “126.0” as the second calibration standard and press enter. 13. Wait for the turbidity measurement to equilibrate and then press the enter key. 14. Rinse all of the probes on the sonde with deionized water. Shake off excess water and
dry with a lint-free cloth. 15. Insert probes into the YSI 6072 12.7 NTU standard. The turbidity reading should be
in the range of 12.5 to 12.9 NTU. If the buffer reading is not in this range, repeat the calibration procedure.
16. Fill in calibration forms each time a calibration is conducted.
Water Quality Management and Monitoring Plan Appendix A May 2012 Onondaga Lake 6 120139-01
4 PROCEDURES
4.1 Field Data Collection Procedures (Monitoring Buoys)
Data will be obtained using multi-parameter sondes suspended from buoys at each continuous turbidity monitoring station (as discussed in the main body of this report; [i.e., Water Quality Management and Monitoring Plan]). IDs and target coordinates for each station will be predetermined. Station IDs and coordinates will be downloaded to an on-board GPS. Below are the procedures for turbidity data collection.
1. Before collecting any data, calibrate the multi-parameter sonde in accordance with the specifications listed in Section 3 above.
2. Navigate the sampling vessel to the continuous turbidity monitoring station of interest. Anchor a buoy at the desired monitoring location.
3. Program the multi-parameter sondes to begin collecting data immediately after deployment and continue to collect and store data at 15-minute intervals.
4. Suspend the sonde from each buoy at a depth of 10 feet within the water column or at the midpoint of the water column if the water depth is less than 20 feet.
5. Sonde data will be routinely inspected to ensure data are being logged and that the equipment is functioning properly.
6. Routine sonde maintenance will be performed on a weekly basis and will include cleaning and comparing the measurements recorded by each sonde against those from a spare sonde on the sampling vessel.
7. Any sonde determined to have a malfunction or to be out of calibration will be replaced by a newly calibrated sonde. A percentage of sondes will also be exchanged on a routine basis to reduce deployment times and decrease the risk of fouling of the turbidity probes.
8. Retrieve the buoys, anchors, and sondes at the end of the data collection period. Download the data stored on each sonde to the appropriate database, if necessary.
4.2 Water Sample Collection Procedures
Samples will be collected in general accordance with SOP SB-9 (Parsons 2008; Littoral Zone Surface Water Sampling), with the following modifications:
The USEPA “Clean Hands/Dirty Hands” protocols specified in SOP SB-9 (Parsons
Procedures
Water Quality Management and Monitoring Plan Appendix A May 2012 Onondaga Lake 7 120139-01
2008) will be followed for mercury samples, but will not be followed for the other analytes (i.e., Total Suspended Solids [TSS], volatile organic carbons [VOCs], and semivolatile organic carbons [SVOCs]).
Obtain water quality data at each station by lowering a YSI 6000 series (or equivalent) water quality sonde to a depth of 10 feet (or mid-depth if the total water depth is less than 20 feet) and record data in the field database and field notebook.
Instead of collecting near-surface grab samples (as specified in SOP SB-9; Parsons 2008), a sample will be collected at a depth 10 feet from the water surface or from mid-depth if the total water depth is less than 20 feet. The sampling depth will be determined either by using the vessel’s depth finder/sonar, hand-held electronic depth finder/sonar, or by manually deploying a telescoping stadia rod or weight attached to a calibrated rope/cable.
All samples will be collected by lowering a Kemmerer sampler or equivalent (e.g., Van Dorn sampler, submersible pump, peristaltic pump) appropriate for trace metal sampling at each location.
The Kemmerer sampler will be lowered to the desired sampling depth, deploying the messenger to trigger sample collection, and then filling the containers. When sampling for VOCs, water will be discharged from the sampling port on the bottom of the Kemmerer sampler slowly and allowed to flow in a laminar manner along the side of the designated VOC containers to minimize concerns over volatilization loss.
4.3 Decontamination Procedures
Sampling equipment that comes into contact with lake water will be decontaminated between each sampling location according to the following procedures:
1. Before commencing a sampling event, sampling equipment will be rinsed with a 10 percent nitric acid solution.
2. Rinse equipment with Alconox (or other low-phosphate detergent) along with deionized water, and if necessary scrub with a bristle brush or similar utensil to remove any solids.
3. This rinse shall utilize sufficient amounts of water to flush rather than just wet the surface.
Procedures
Water Quality Management and Monitoring Plan Appendix A May 2012 Onondaga Lake 8 120139-01
4. Rinse with deionized water. 5. Rinse with dilute solution of nitric acid. 6. Rinse with deionized water. 7. Place equipment in a clean area and allow to air dry to the extent practicable. 8. Contain all wastes from decontamination in tubs or buckets to be properly disposed of
after sampling is completed.
4.4 Sample Handling and Tracking
Samples will be handled, preserved, shipped, and tracked as described in SOP 1 (Parsons 2005).
4.4.1 Sample Handling and Preservation
Sample containers will be labeled during sample collection in accordance with labeling requirements specified in the Quality Assurance Project Plan (QAPP; Parsons et al. 2012). Each container will be placed in re-sealable food storage bags (double bagged, one inside the other for mercury samples) and placed in a clean dedicated cooler. The samples will be chilled with ice to approximately 4°C. Samples will be shipped by overnight delivery to the laboratory at the end of each day. Chain-of-custody procedures will be followed, as specified in the QAPP.
4.4.2 Data and Records Management
Data from water sample collection will be recorded in the field database using a laptop computer and field notebooks upon completion of sampling at one location. Blank field log sheets may also be used to record information manually in case difficulties with data entry using the computer are encountered. Manually recorded data will be transcribed into the field database at the end of each day, if necessary.
4.4.3 Quality Assurance and Quality Control
Quality assurance and quality control (QA/QC) procedures are defined in the QAPP, and include collecting field QA/QC samples. Field QA/QC samples to be collected are blind duplicate samples, equipment blank samples, and matrix spike samples. One set of field
Procedures
Water Quality Management and Monitoring Plan Appendix A May 2012 Onondaga Lake 9 120139-01
QA/QC samples will be collected for each sampling event. Blind duplicate samples and matrix spike samples will be prepared by filling additional appropriately marked containers at pre-selected sampling stations (both samples will not be collected at the same station). The station where these samples are collected will be rotated randomly for each sampling event. Equipment blank samples will be collected at the last location sampled for each event.
4.4.4 Sample Methods
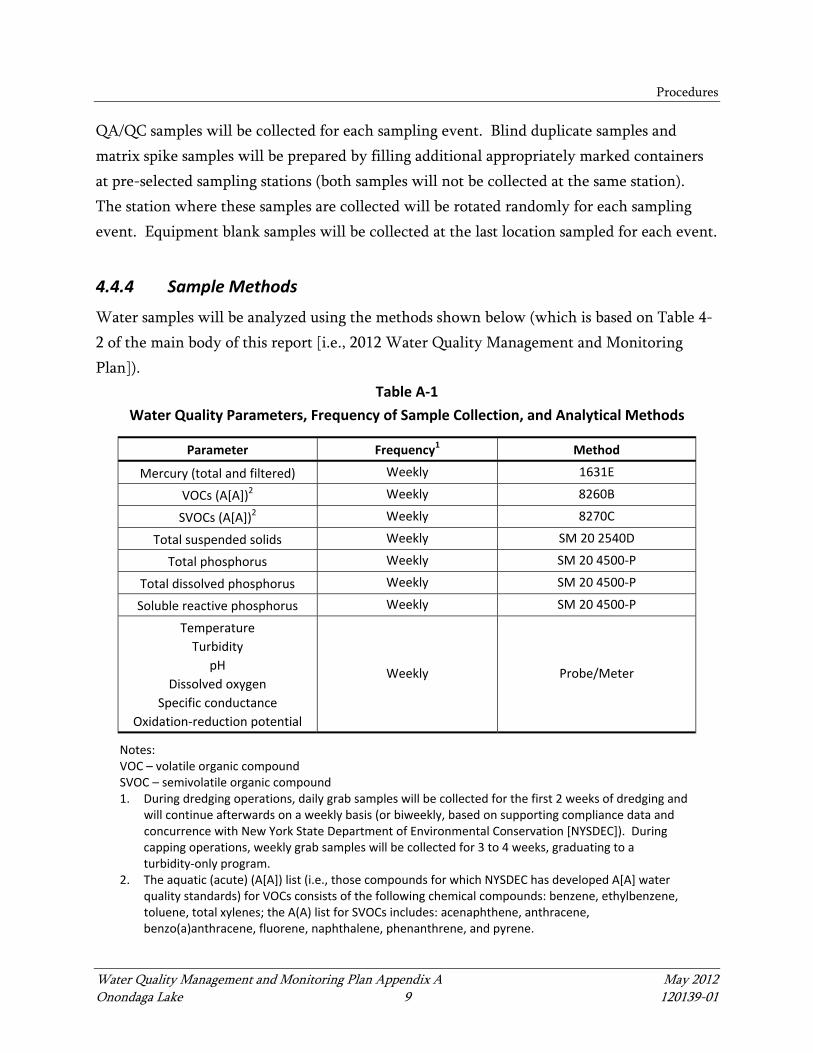
Water samples will be analyzed using the methods shown below (which is based on Table 4-2 of the main body of this report [i.e., 2012 Water Quality Management and Monitoring Plan]).
Table A‐1 Water Quality Parameters, Frequency of Sample Collection, and Analytical Methods
Parameter Frequency1 Method
Mercury (total and filtered) Weekly 1631E
VOCs (A[A])2 Weekly 8260B
SVOCs (A[A])2 Weekly 8270C
Total suspended solids Weekly SM 20 2540D
Total phosphorus Weekly SM 20 4500‐P
Total dissolved phosphorus Weekly SM 20 4500‐P
Soluble reactive phosphorus Weekly SM 20 4500‐P
Temperature Turbidity
pH Dissolved oxygen
Specific conductance Oxidation‐reduction potential
Weekly Probe/Meter
Notes: VOC – volatile organic compound SVOC – semivolatile organic compound 1. During dredging operations, daily grab samples will be collected for the first 2 weeks of dredging and
will continue afterwards on a weekly basis (or biweekly, based on supporting compliance data and concurrence with New York State Department of Environmental Conservation [NYSDEC]). During capping operations, weekly grab samples will be collected for 3 to 4 weeks, graduating to a turbidity‐only program.
2. The aquatic (acute) (A[A]) list (i.e., those compounds for which NYSDEC has developed A[A] water quality standards) for VOCs consists of the following chemical compounds: benzene, ethylbenzene, toluene, total xylenes; the A(A) list for SVOCs includes: acenaphthene, anthracene, benzo(a)anthracene, fluorene, naphthalene, phenanthrene, and pyrene.
Water Quality Management and Monitoring Plan Appendix A May 2012 Onondaga Lake 10 120139-01
5 PERSONNEL
The captain and cruise leader shall be the primary persons responsible for ensuring the safety of personnel and following procedural guidelines. The field crew will be informed of boat rules and shall follow the captain’s and cruise leader’s guidelines. Documentation of training and certifications for the captain, cruise leader, and field crew will be maintained in the SSP.
Water Quality Management and Monitoring Plan Appendix A May 2012 Onondaga Lake 11 120139-01
6 REFERENCES
Parsons, 2005. Onondaga Lake Pre-Design Investigation: Standard Operating Procedures. Prepared for Honeywell, Morristown, New Jersey. Syracuse, New York.
Parsons, 2008. Onondaga Lake Baseline Monitoring Book 2 Work Plan Fish, Invertebrate And Littoral Water Monitoring For 2008 Appendices. Prepared for Honeywell, Morristown, New Jersey. Syracuse New York.
Parsons, 2010. Onondaga Lake Pre-Design Investigation: Revised Quality Assurance Project Plan. Prepared for Honeywell, Morristown, New Jersey. Syracuse, New York.
Parsons, Anchor QEA, LLC, and Upstate Freshwater Institute, 2012. Draft Quality Assurance Project Plan for Onondaga Lake Construction and Post-Construction Media Monitoring (surface water, biota and sediment). Prepared for Honeywell. May 2012.


