2Water Management and Irrigation
INTRODUCTION2.1 Sustainable development and efficient manage-ment of water is an increasingly complex challenge inIndia. Increasing population, growing urbanization,and rapid industrialization combined with the needfor raising agricultural production generates compet-ing claims for water. There is a growing perception ofa sense of an impending water crisis in the country.Some manifestations of this crisis are:
• There is hardly any city which receives a 24-hoursupply of drinking water.
• Many rural habitations which had been coveredunder the drinking water programme are now be-ing reported as having slipped back with target datesfor completion continuously pushed back. Thereare pockets where arsenic, nitrate, and fluoride indrinking water are posing a serious health hazard.
• In many parts, the groundwater table declines dueto over-exploitation imposing an increasing finan-cial burden on farmers who need to deepen theirwells and replace their pump sets and on StateGovernments whose subsidy burden for electricitysupplies rises.
• Many major and medium irrigation (MMI) projectsseem to remain under execution forever as they slipfrom one plan to the other with enormous cost andtime overruns.
• Owing to lack of maintenance, the capacity of theolder systems seems to be going down.
• The gross irrigated area does not seem to be risingin a manner that it should be, given the investment
in irrigation. The difference between potentialcreated and area actually irrigated remains large.Unless we bridge the gap, significant increase inagricultural production will be difficult to realize.
• Floods are a recurring problem in many partsof the country. Degradation of catchment areasand loss of flood plains to urban developmentand agriculture have accentuated the intensity offloods.
• Water quality in our rivers and lakes is far from sat-isfactory. Water in most parts of rivers is not fit forbathing, let alone drinking. Untreated or partiallytreated sewage from towns and cities is beingdumped into the rivers.
• Untreated or inadequately treated industrial efflu-ents pollute water bodies and also contaminategroundwater.
• At the same time water conflicts are increasing.Apart from the traditional conflicts about waterrights between upper and lower riparians in a river,conflicts about quality of water, people’s right forrainwater harvesting in a watershed against down-stream users, industrial use of groundwater andits impact on water tables and between urban andrural users have emerged.
2.2 India with 2.4% of the world’s total area has 16%of the world’s population; but has only 4% of the totalavailable fresh water. This clearly indicates the needfor water resource development, conservation, andoptimum use. Fortunately, at a macro level India is notshort of water. The problems that seem to loom large
44 Eleventh Five Year Plan
over the sector are manageable and the challenges fac-ing it are not insurmountable.
AVAILABILITY OF WATER
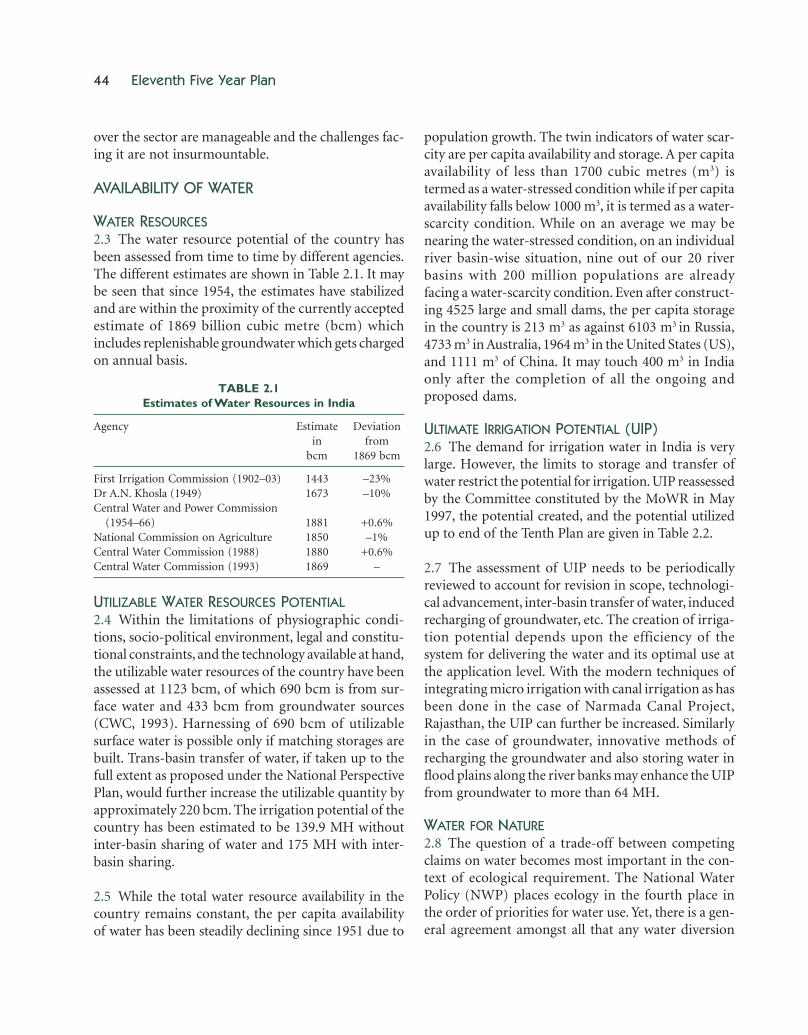
WATER RESOURCES2.3 The water resource potential of the country hasbeen assessed from time to time by different agencies.The different estimates are shown in Table 2.1. It maybe seen that since 1954, the estimates have stabilizedand are within the proximity of the currently acceptedestimate of 1869 billion cubic metre (bcm) whichincludes replenishable groundwater which gets chargedon annual basis.
TABLE 2.1Estimates of Water Resources in India
Agency Estimate Deviationin from
bcm 1869 bcm
First Irrigation Commission (1902–03) 1443 –23%Dr A.N. Khosla (1949) 1673 –10%Central Water and Power Commission
(1954–66) 1881 +0.6%National Commission on Agriculture 1850 –1%Central Water Commission (1988) 1880 +0.6%Central Water Commission (1993) 1869 –
UTILIZABLE WATER RESOURCES POTENTIAL2.4 Within the limitations of physiographic condi-tions, socio-political environment, legal and constitu-tional constraints, and the technology available at hand,the utilizable water resources of the country have beenassessed at 1123 bcm, of which 690 bcm is from sur-face water and 433 bcm from groundwater sources(CWC, 1993). Harnessing of 690 bcm of utilizablesurface water is possible only if matching storages arebuilt. Trans-basin transfer of water, if taken up to thefull extent as proposed under the National PerspectivePlan, would further increase the utilizable quantity byapproximately 220 bcm. The irrigation potential of thecountry has been estimated to be 139.9 MH withoutinter-basin sharing of water and 175 MH with inter-basin sharing.
2.5 While the total water resource availability in thecountry remains constant, the per capita availabilityof water has been steadily declining since 1951 due to
population growth. The twin indicators of water scar-city are per capita availability and storage. A per capitaavailability of less than 1700 cubic metres (m3) istermed as a water-stressed condition while if per capitaavailability falls below 1000 m3, it is termed as a water-scarcity condition. While on an average we may benearing the water-stressed condition, on an individualriver basin-wise situation, nine out of our 20 riverbasins with 200 million populations are alreadyfacing a water-scarcity condition. Even after construct-ing 4525 large and small dams, the per capita storagein the country is 213 m3 as against 6103 m3 in Russia,4733 m3 in Australia, 1964 m3 in the United States (US),and 1111 m3 of China. It may touch 400 m3 in Indiaonly after the completion of all the ongoing andproposed dams.
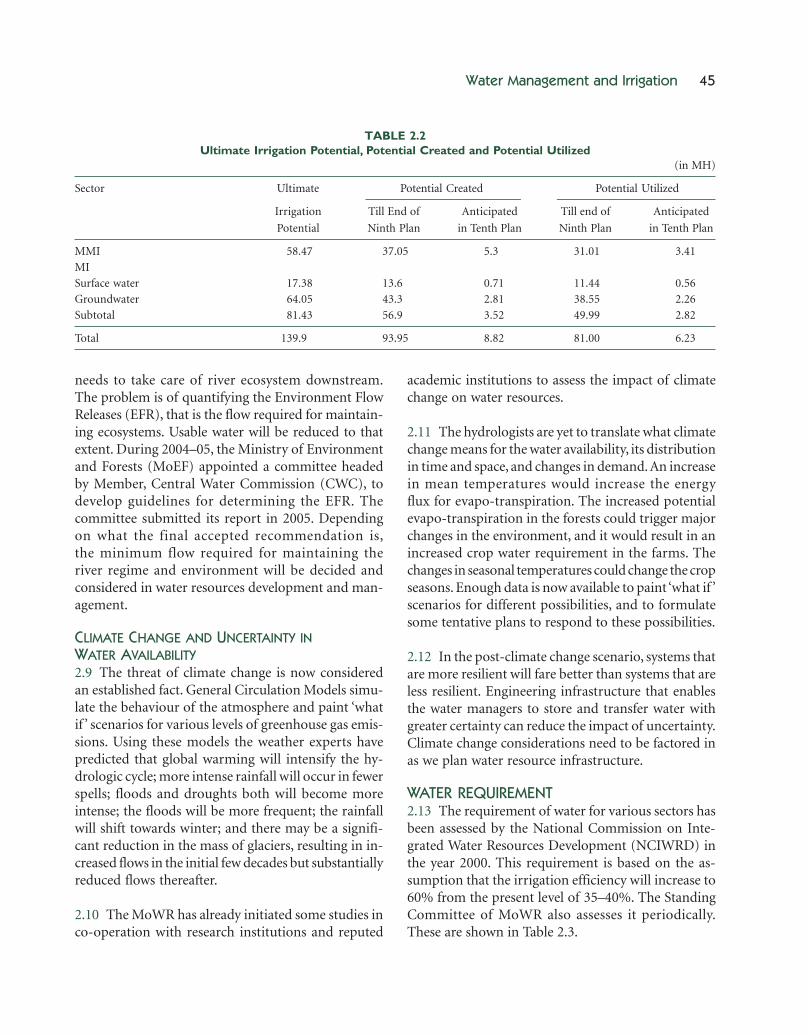
ULTIMATE IRRIGATION POTENTIAL (UIP)2.6 The demand for irrigation water in India is verylarge. However, the limits to storage and transfer ofwater restrict the potential for irrigation. UIP reassessedby the Committee constituted by the MoWR in May1997, the potential created, and the potential utilizedup to end of the Tenth Plan are given in Table 2.2.
2.7 The assessment of UIP needs to be periodicallyreviewed to account for revision in scope, technologi-cal advancement, inter-basin transfer of water, inducedrecharging of groundwater, etc. The creation of irriga-tion potential depends upon the efficiency of thesystem for delivering the water and its optimal use atthe application level. With the modern techniques ofintegrating micro irrigation with canal irrigation as hasbeen done in the case of Narmada Canal Project,Rajasthan, the UIP can further be increased. Similarlyin the case of groundwater, innovative methods ofrecharging the groundwater and also storing water inflood plains along the river banks may enhance the UIPfrom groundwater to more than 64 MH.
WATER FOR NATURE2.8 The question of a trade-off between competingclaims on water becomes most important in the con-text of ecological requirement. The National WaterPolicy (NWP) places ecology in the fourth place inthe order of priorities for water use. Yet, there is a gen-eral agreement amongst all that any water diversion
Water Management and Irrigation 45
needs to take care of river ecosystem downstream.The problem is of quantifying the Environment FlowReleases (EFR), that is the flow required for maintain-ing ecosystems. Usable water will be reduced to thatextent. During 2004–05, the Ministry of Environmentand Forests (MoEF) appointed a committee headedby Member, Central Water Commission (CWC), todevelop guidelines for determining the EFR. Thecommittee submitted its report in 2005. Dependingon what the final accepted recommendation is,the minimum flow required for maintaining theriver regime and environment will be decided andconsidered in water resources development and man-agement.
CLIMATE CHANGE AND UNCERTAINTY INWATER AVAILABILITY2.9 The threat of climate change is now consideredan established fact. General Circulation Models simu-late the behaviour of the atmosphere and paint ‘whatif ’ scenarios for various levels of greenhouse gas emis-sions. Using these models the weather experts havepredicted that global warming will intensify the hy-drologic cycle; more intense rainfall will occur in fewerspells; floods and droughts both will become moreintense; the floods will be more frequent; the rainfallwill shift towards winter; and there may be a signifi-cant reduction in the mass of glaciers, resulting in in-creased flows in the initial few decades but substantiallyreduced flows thereafter.
2.10 The MoWR has already initiated some studies inco-operation with research institutions and reputed
academic institutions to assess the impact of climatechange on water resources.
2.11 The hydrologists are yet to translate what climatechange means for the water availability, its distributionin time and space, and changes in demand. An increasein mean temperatures would increase the energyflux for evapo-transpiration. The increased potentialevapo-transpiration in the forests could trigger majorchanges in the environment, and it would result in anincreased crop water requirement in the farms. Thechanges in seasonal temperatures could change the cropseasons. Enough data is now available to paint ‘what if ’scenarios for different possibilities, and to formulatesome tentative plans to respond to these possibilities.
2.12 In the post-climate change scenario, systems thatare more resilient will fare better than systems that areless resilient. Engineering infrastructure that enablesthe water managers to store and transfer water withgreater certainty can reduce the impact of uncertainty.Climate change considerations need to be factored inas we plan water resource infrastructure.
WATER REQUIREMENT2.13 The requirement of water for various sectors hasbeen assessed by the National Commission on Inte-grated Water Resources Development (NCIWRD) inthe year 2000. This requirement is based on the as-sumption that the irrigation efficiency will increase to60% from the present level of 35–40%. The StandingCommittee of MoWR also assesses it periodically.These are shown in Table 2.3.
TABLE 2.2Ultimate Irrigation Potential, Potential Created and Potential Utilized
(in MH)
Sector Ultimate Potential Created Potential Utilized
Irrigation Till End of Anticipated Till end of Anticipated
Potential Ninth Plan in Tenth Plan Ninth Plan in Tenth Plan
MMI 58.47 37.05 5.3 31.01 3.41
MI
Surface water 17.38 13.6 0.71 11.44 0.56
Groundwater 64.05 43.3 2.81 38.55 2.26
Subtotal 81.43 56.9 3.52 49.99 2.82
Total 139.9 93.95 8.82 81.00 6.23
46 Eleventh Five Year Plan
WATER RESOURCES DEVELOPMENTAND USE: IRRIGATION
HISTORICAL DEVELOPMENT2.14 The planned development of irrigation sectorstarted in a big way since the First Five Year Plan(1951–56). New projects were taken up in the SecondFive Year Plan, the Third Five Year Plan, and theAnnual Plans 1966–69. During the Fourth Five YearPlan emphasis was shifted to the completion of ongo-ing schemes. The widening gap between potentialcreation and utilization was felt in the Fifth Plan (1974–78) and accordingly Command Area Development(CAD) programme was launched. The Annual Plans1978–80 and the Sixth Plan witnessed new starts andthen the focus was shifted towards completion ofirrigation projects. By the end of the Eighth Plan(1996–97), central assistance was provided under AIBPto help the State Governments in early completion ofthe projects.
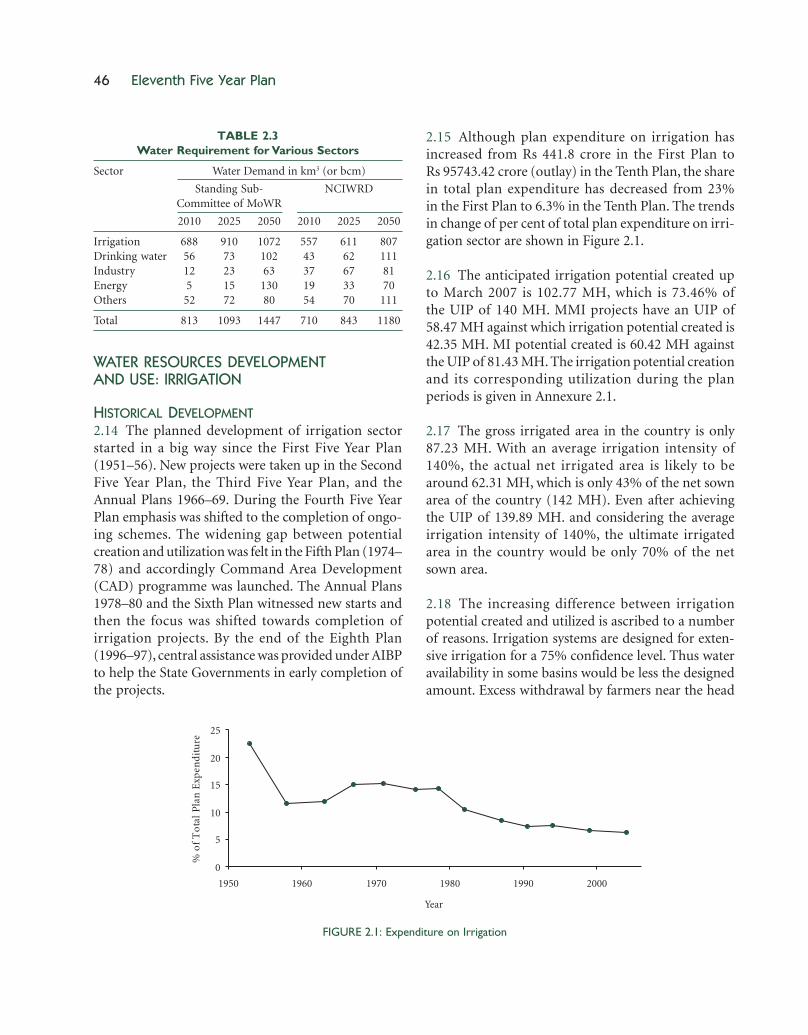
2.15 Although plan expenditure on irrigation hasincreased from Rs 441.8 crore in the First Plan toRs 95743.42 crore (outlay) in the Tenth Plan, the sharein total plan expenditure has decreased from 23%in the First Plan to 6.3% in the Tenth Plan. The trendsin change of per cent of total plan expenditure on irri-gation sector are shown in Figure 2.1.
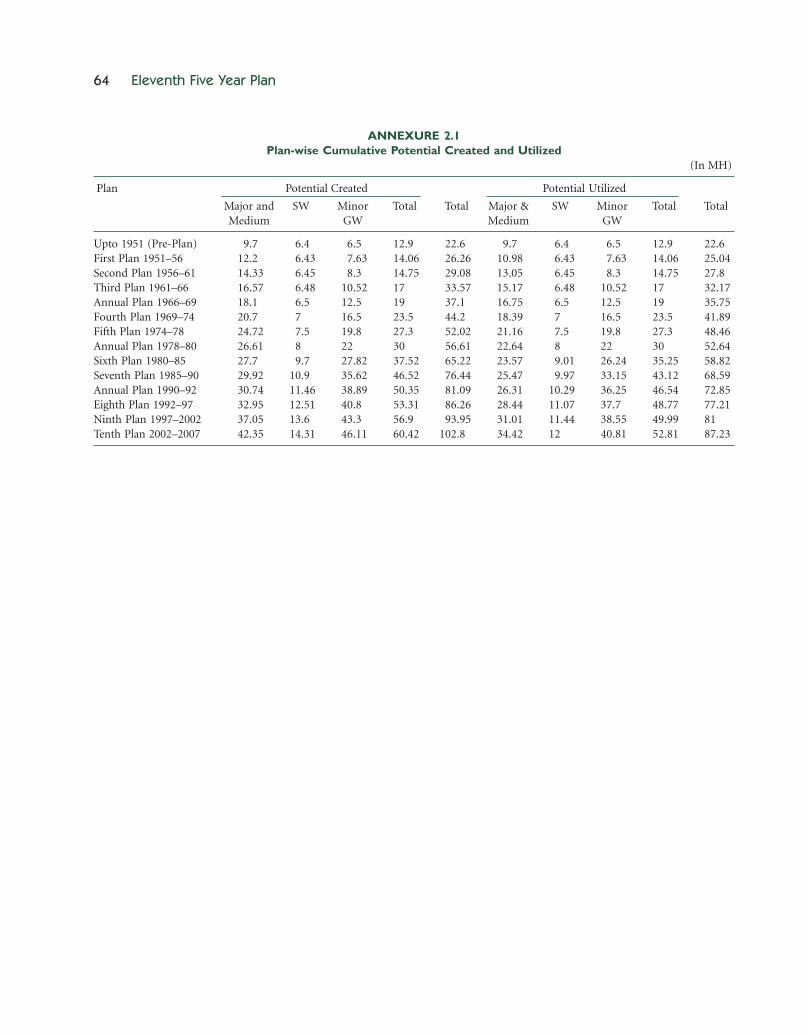
2.16 The anticipated irrigation potential created upto March 2007 is 102.77 MH, which is 73.46% ofthe UIP of 140 MH. MMI projects have an UIP of58.47 MH against which irrigation potential created is42.35 MH. MI potential created is 60.42 MH againstthe UIP of 81.43 MH. The irrigation potential creationand its corresponding utilization during the planperiods is given in Annexure 2.1.
2.17 The gross irrigated area in the country is only87.23 MH. With an average irrigation intensity of140%, the actual net irrigated area is likely to bearound 62.31 MH, which is only 43% of the net sownarea of the country (142 MH). Even after achievingthe UIP of 139.89 MH. and considering the averageirrigation intensity of 140%, the ultimate irrigatedarea in the country would be only 70% of the netsown area.
2.18 The increasing difference between irrigationpotential created and utilized is ascribed to a numberof reasons. Irrigation systems are designed for exten-sive irrigation for a 75% confidence level. Thus wateravailability in some basins would be less the designedamount. Excess withdrawal by farmers near the head
TABLE 2.3Water Requirement for Various Sectors
Sector Water Demand in km3 (or bcm)
Standing Sub- NCIWRDCommittee of MoWR
2010 2025 2050 2010 2025 2050
Irrigation 688 910 1072 557 611 807Drinking water 56 73 102 43 62 111Industry 12 23 63 37 67 81Energy 5 15 130 19 33 70Others 52 72 80 54 70 111
Total 813 1093 1447 710 843 1180
FIGURE 2.1: Expenditure on Irrigation
0
5
10
15
20
25
1950 1960 1970 1980 1990 2000
Year
%o
fT
ota
lP
lan
Exp
end
itu
re
Water Management and Irrigation 47
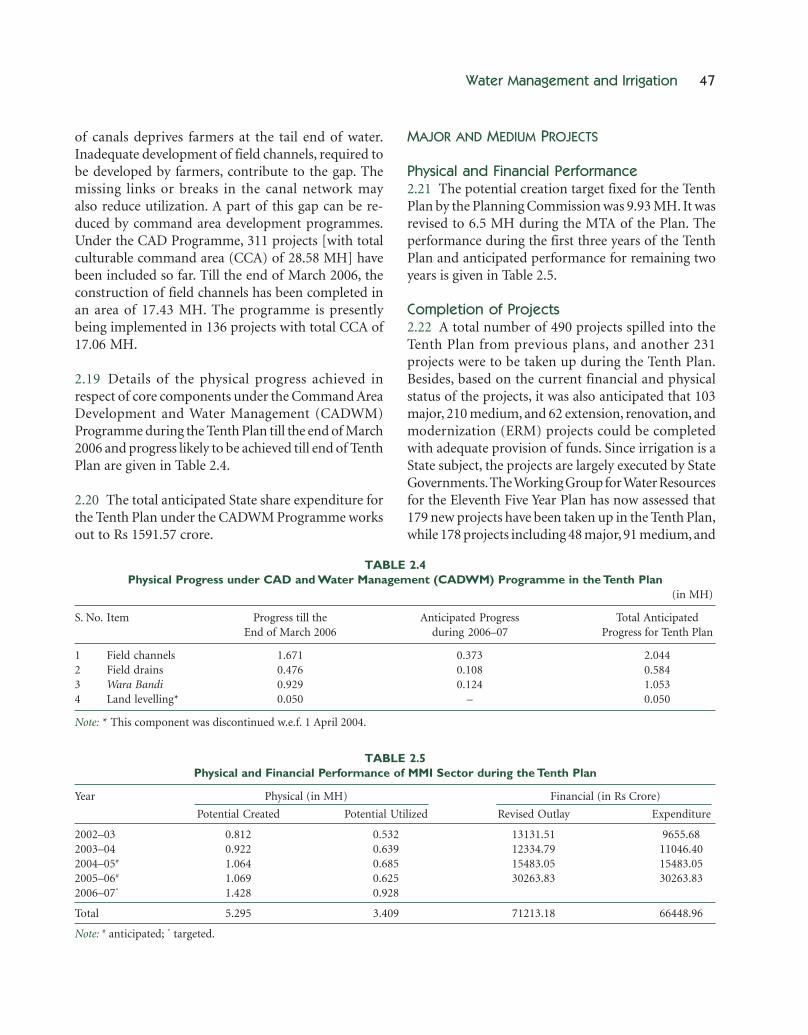
of canals deprives farmers at the tail end of water.Inadequate development of field channels, required tobe developed by farmers, contribute to the gap. Themissing links or breaks in the canal network mayalso reduce utilization. A part of this gap can be re-duced by command area development programmes.Under the CAD Programme, 311 projects [with totalculturable command area (CCA) of 28.58 MH] havebeen included so far. Till the end of March 2006, theconstruction of field channels has been completed inan area of 17.43 MH. The programme is presentlybeing implemented in 136 projects with total CCA of17.06 MH.
2.19 Details of the physical progress achieved inrespect of core components under the Command AreaDevelopment and Water Management (CADWM)Programme during the Tenth Plan till the end of March2006 and progress likely to be achieved till end of TenthPlan are given in Table 2.4.
2.20 The total anticipated State share expenditure forthe Tenth Plan under the CADWM Programme worksout to Rs 1591.57 crore.
MAJOR AND MEDIUM PROJECTS
Physical and Financial Performance2.21 The potential creation target fixed for the TenthPlan by the Planning Commission was 9.93 MH. It wasrevised to 6.5 MH during the MTA of the Plan. Theperformance during the first three years of the TenthPlan and anticipated performance for remaining twoyears is given in Table 2.5.
Completion of Projects2.22 A total number of 490 projects spilled into theTenth Plan from previous plans, and another 231projects were to be taken up during the Tenth Plan.Besides, based on the current financial and physicalstatus of the projects, it was also anticipated that 103major, 210 medium, and 62 extension, renovation, andmodernization (ERM) projects could be completedwith adequate provision of funds. Since irrigation is aState subject, the projects are largely executed by StateGovernments. The Working Group for Water Resourcesfor the Eleventh Five Year Plan has now assessed that179 new projects have been taken up in the Tenth Plan,while 178 projects including 48 major, 91 medium, and
TABLE 2.4Physical Progress under CAD and Water Management (CADWM) Programme in the Tenth Plan
(in MH)
S. No. Item Progress till the Anticipated Progress Total AnticipatedEnd of March 2006 during 2006–07 Progress for Tenth Plan
1 Field channels 1.671 0.373 2.0442 Field drains 0.476 0.108 0.5843 Wara Bandi 0.929 0.124 1.0534 Land levelling* 0.050 – 0.050
Note: * This component was discontinued w.e.f. 1 April 2004.
TABLE 2.5Physical and Financial Performance of MMI Sector during the Tenth Plan
Year Physical (in MH) Financial (in Rs Crore)
Potential Created Potential Utilized Revised Outlay Expenditure
2002–03 0.812 0.532 13131.51 9655.682003–04 0.922 0.639 12334.79 11046.402004–05# 1.064 0.685 15483.05 15483.052005–06# 1.069 0.625 30263.83 30263.832006–07* 1.428 0.928
Total 5.295 3.409 71213.18 66448.96
Note: # anticipated; * targeted.
48 Eleventh Five Year Plan
39 ERM projects would be completed during the TenthPlan. The reasons for non-completion of the projectsfrom the projected level include inadequate funds dueto thin spread of funds over many projects, revisionin the estimated costs, change in scope of the works, un-foreseen bottlenecks involving other agencies,opposition by the project-affected persons (PAPs), etc.
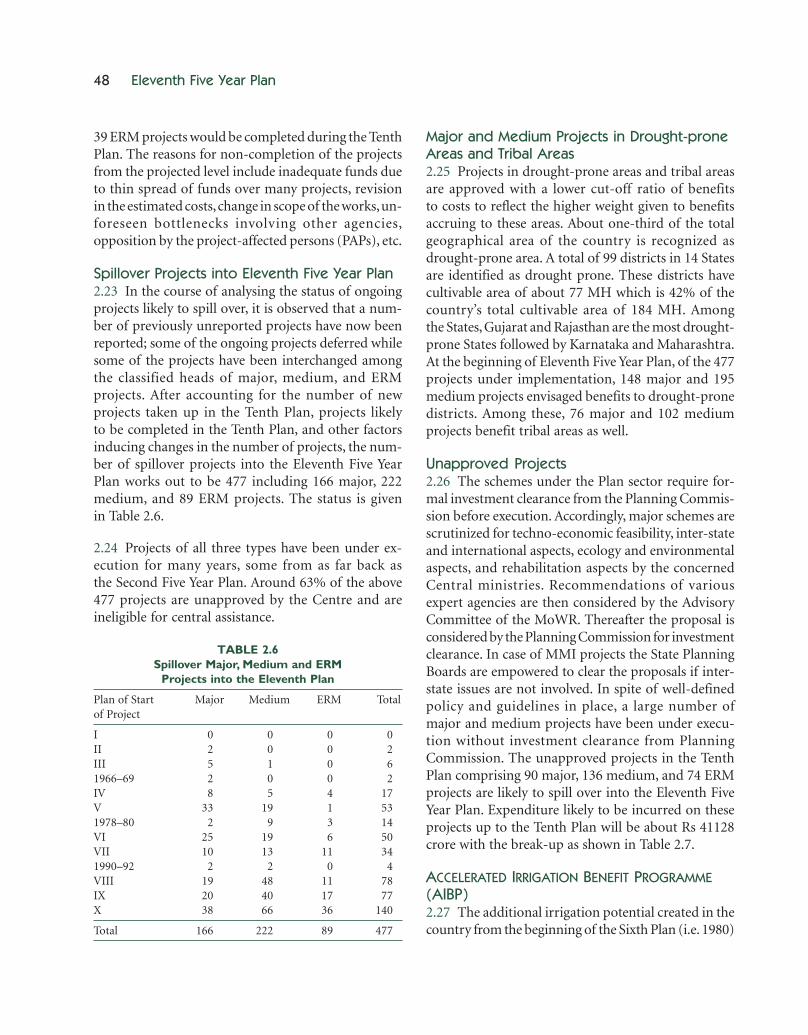
Spillover Projects into Eleventh Five Year Plan2.23 In the course of analysing the status of ongoingprojects likely to spill over, it is observed that a num-ber of previously unreported projects have now beenreported; some of the ongoing projects deferred whilesome of the projects have been interchanged amongthe classified heads of major, medium, and ERMprojects. After accounting for the number of newprojects taken up in the Tenth Plan, projects likelyto be completed in the Tenth Plan, and other factorsinducing changes in the number of projects, the num-ber of spillover projects into the Eleventh Five YearPlan works out to be 477 including 166 major, 222medium, and 89 ERM projects. The status is givenin Table 2.6.
2.24 Projects of all three types have been under ex-ecution for many years, some from as far back asthe Second Five Year Plan. Around 63% of the above477 projects are unapproved by the Centre and areineligible for central assistance.
Major and Medium Projects in Drought-proneAreas and Tribal Areas2.25 Projects in drought-prone areas and tribal areasare approved with a lower cut-off ratio of benefitsto costs to reflect the higher weight given to benefitsaccruing to these areas. About one-third of the totalgeographical area of the country is recognized asdrought-prone area. A total of 99 districts in 14 Statesare identified as drought prone. These districts havecultivable area of about 77 MH which is 42% of thecountry’s total cultivable area of 184 MH. Amongthe States, Gujarat and Rajasthan are the most drought-prone States followed by Karnataka and Maharashtra.At the beginning of Eleventh Five Year Plan, of the 477projects under implementation, 148 major and 195medium projects envisaged benefits to drought-pronedistricts. Among these, 76 major and 102 mediumprojects benefit tribal areas as well.
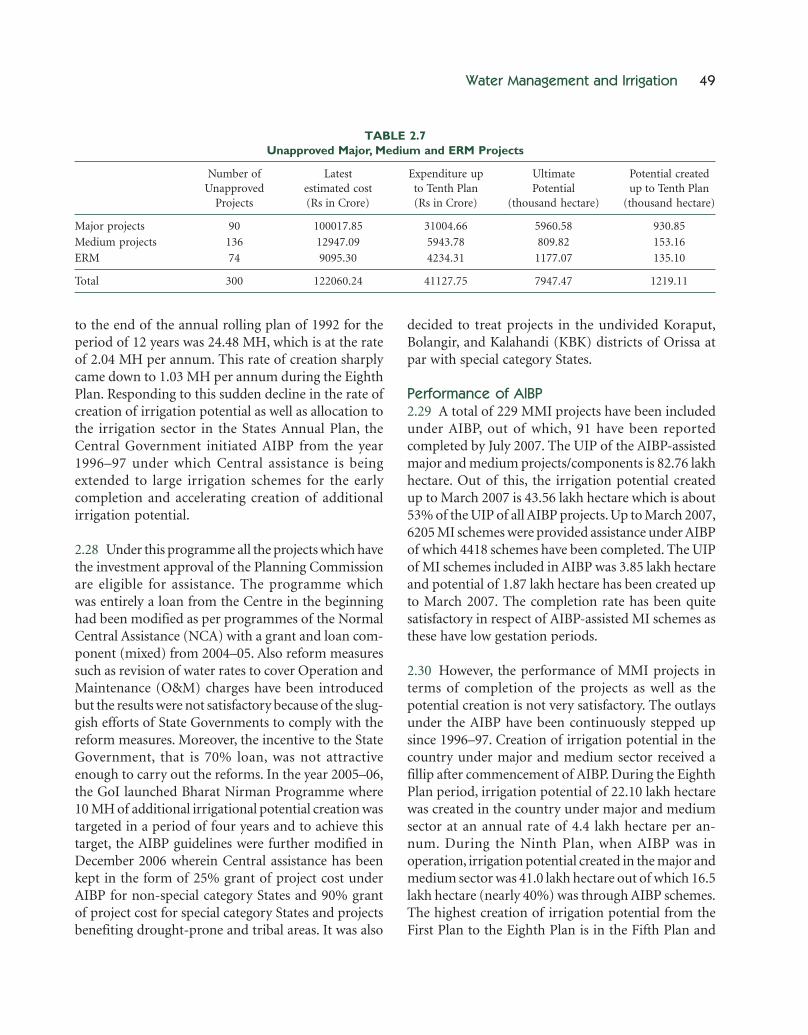
Unapproved Projects2.26 The schemes under the Plan sector require for-mal investment clearance from the Planning Commis-sion before execution. Accordingly, major schemes arescrutinized for techno-economic feasibility, inter-stateand international aspects, ecology and environmentalaspects, and rehabilitation aspects by the concernedCentral ministries. Recommendations of variousexpert agencies are then considered by the AdvisoryCommittee of the MoWR. Thereafter the proposal isconsidered by the Planning Commission for investmentclearance. In case of MMI projects the State PlanningBoards are empowered to clear the proposals if inter-state issues are not involved. In spite of well-definedpolicy and guidelines in place, a large number ofmajor and medium projects have been under execu-tion without investment clearance from PlanningCommission. The unapproved projects in the TenthPlan comprising 90 major, 136 medium, and 74 ERMprojects are likely to spill over into the Eleventh FiveYear Plan. Expenditure likely to be incurred on theseprojects up to the Tenth Plan will be about Rs 41128crore with the break-up as shown in Table 2.7.
ACCELERATED IRRIGATION BENEFIT PROGRAMME(AIBP)2.27 The additional irrigation potential created in thecountry from the beginning of the Sixth Plan (i.e. 1980)
TABLE 2.6Spillover Major, Medium and ERM
Projects into the Eleventh Plan
Plan of Start Major Medium ERM Totalof Project
I 0 0 0 0II 2 0 0 2III 5 1 0 61966–69 2 0 0 2IV 8 5 4 17V 33 19 1 531978–80 2 9 3 14VI 25 19 6 50VII 10 13 11 341990–92 2 2 0 4VIII 19 48 11 78IX 20 40 17 77X 38 66 36 140
Total 166 222 89 477
Water Management and Irrigation 49
to the end of the annual rolling plan of 1992 for theperiod of 12 years was 24.48 MH, which is at the rateof 2.04 MH per annum. This rate of creation sharplycame down to 1.03 MH per annum during the EighthPlan. Responding to this sudden decline in the rate ofcreation of irrigation potential as well as allocation tothe irrigation sector in the States Annual Plan, theCentral Government initiated AIBP from the year1996–97 under which Central assistance is beingextended to large irrigation schemes for the earlycompletion and accelerating creation of additionalirrigation potential.
2.28 Under this programme all the projects which havethe investment approval of the Planning Commissionare eligible for assistance. The programme whichwas entirely a loan from the Centre in the beginninghad been modified as per programmes of the NormalCentral Assistance (NCA) with a grant and loan com-ponent (mixed) from 2004–05. Also reform measuressuch as revision of water rates to cover Operation andMaintenance (O&M) charges have been introducedbut the results were not satisfactory because of the slug-gish efforts of State Governments to comply with thereform measures. Moreover, the incentive to the StateGovernment, that is 70% loan, was not attractiveenough to carry out the reforms. In the year 2005–06,the GoI launched Bharat Nirman Programme where10 MH of additional irrigational potential creation wastargeted in a period of four years and to achieve thistarget, the AIBP guidelines were further modified inDecember 2006 wherein Central assistance has beenkept in the form of 25% grant of project cost underAIBP for non-special category States and 90% grantof project cost for special category States and projectsbenefiting drought-prone and tribal areas. It was also
decided to treat projects in the undivided Koraput,Bolangir, and Kalahandi (KBK) districts of Orissa atpar with special category States.
Performance of AIBP2.29 A total of 229 MMI projects have been includedunder AIBP, out of which, 91 have been reportedcompleted by July 2007. The UIP of the AIBP-assistedmajor and medium projects/components is 82.76 lakhhectare. Out of this, the irrigation potential createdup to March 2007 is 43.56 lakh hectare which is about53% of the UIP of all AIBP projects. Up to March 2007,6205 MI schemes were provided assistance under AIBPof which 4418 schemes have been completed. The UIPof MI schemes included in AIBP was 3.85 lakh hectareand potential of 1.87 lakh hectare has been created upto March 2007. The completion rate has been quitesatisfactory in respect of AIBP-assisted MI schemes asthese have low gestation periods.
2.30 However, the performance of MMI projects interms of completion of the projects as well as thepotential creation is not very satisfactory. The outlaysunder the AIBP have been continuously stepped upsince 1996–97. Creation of irrigation potential in thecountry under major and medium sector received afillip after commencement of AIBP. During the EighthPlan period, irrigation potential of 22.10 lakh hectarewas created in the country under major and mediumsector at an annual rate of 4.4 lakh hectare per an-num. During the Ninth Plan, when AIBP was inoperation, irrigation potential created in the major andmedium sector was 41.0 lakh hectare out of which 16.5lakh hectare (nearly 40%) was through AIBP schemes.The highest creation of irrigation potential from theFirst Plan to the Eighth Plan is in the Fifth Plan and
TABLE 2.7Unapproved Major, Medium and ERM Projects
Number of Latest Expenditure up Ultimate Potential createdUnapproved estimated cost to Tenth Plan Potential up to Tenth Plan
Projects (Rs in Crore) (Rs in Crore) (thousand hectare) (thousand hectare)
Major projects 90 100017.85 31004.66 5960.58 930.85
Medium projects 136 12947.09 5943.78 809.82 153.16
ERM 74 9095.30 4234.31 1177.07 135.10
Total 300 122060.24 41127.75 7947.47 1219.11
50 Eleventh Five Year Plan
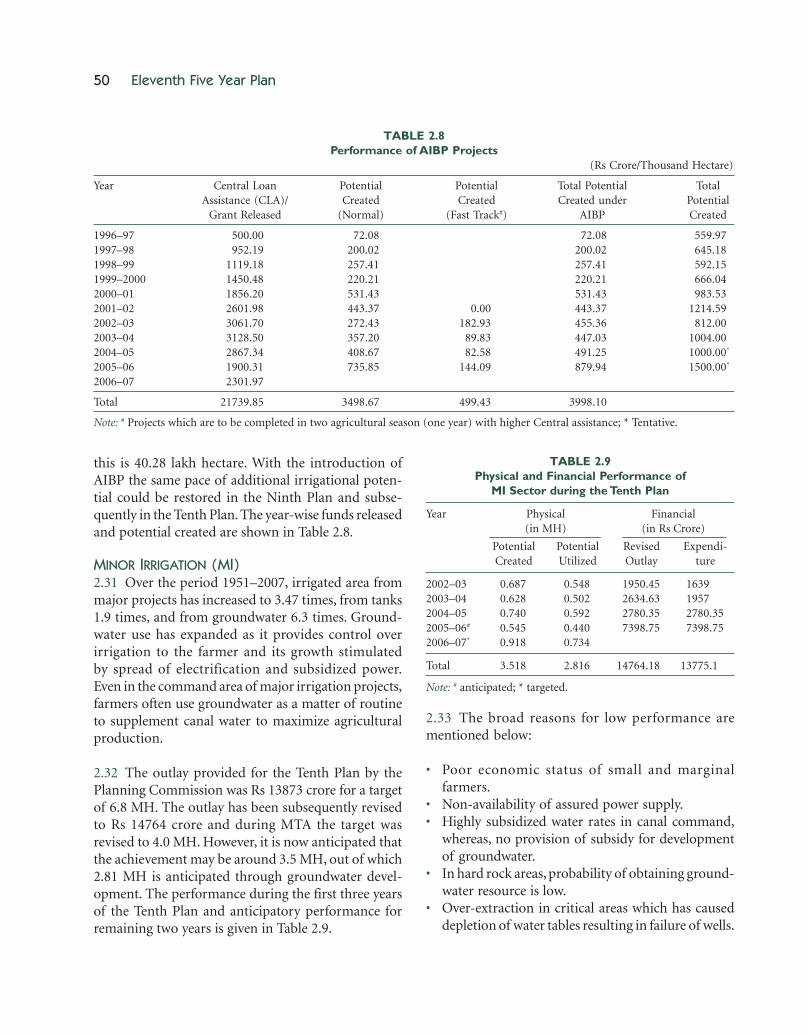
this is 40.28 lakh hectare. With the introduction ofAIBP the same pace of additional irrigational poten-tial could be restored in the Ninth Plan and subse-quently in the Tenth Plan. The year-wise funds releasedand potential created are shown in Table 2.8.
MINOR IRRIGATION (MI)2.31 Over the period 1951–2007, irrigated area frommajor projects has increased to 3.47 times, from tanks1.9 times, and from groundwater 6.3 times. Ground-water use has expanded as it provides control overirrigation to the farmer and its growth stimulatedby spread of electrification and subsidized power.Even in the command area of major irrigation projects,farmers often use groundwater as a matter of routineto supplement canal water to maximize agriculturalproduction.
2.32 The outlay provided for the Tenth Plan by thePlanning Commission was Rs 13873 crore for a targetof 6.8 MH. The outlay has been subsequently revisedto Rs 14764 crore and during MTA the target wasrevised to 4.0 MH. However, it is now anticipated thatthe achievement may be around 3.5 MH, out of which2.81 MH is anticipated through groundwater devel-opment. The performance during the first three yearsof the Tenth Plan and anticipatory performance forremaining two years is given in Table 2.9.
2.33 The broad reasons for low performance arementioned below:
• Poor economic status of small and marginalfarmers.
• Non-availability of assured power supply.• Highly subsidized water rates in canal command,
whereas, no provision of subsidy for developmentof groundwater.
• In hard rock areas, probability of obtaining ground-water resource is low.
• Over-extraction in critical areas which has causeddepletion of water tables resulting in failure of wells.
TABLE 2.8Performance of AIBP Projects
(Rs Crore/Thousand Hectare)
Year Central Loan Potential Potential Total Potential TotalAssistance (CLA)/ Created Created Created under Potential
Grant Released (Normal) (Fast Track#) AIBP Created
1996–97 500.00 72.08 72.08 559.971997–98 952.19 200.02 200.02 645.181998–99 1119.18 257.41 257.41 592.151999–2000 1450.48 220.21 220.21 666.042000–01 1856.20 531.43 531.43 983.532001–02 2601.98 443.37 0.00 443.37 1214.592002–03 3061.70 272.43 182.93 455.36 812.002003–04 3128.50 357.20 89.83 447.03 1004.002004–05 2867.34 408.67 82.58 491.25 1000.00*
2005–06 1900.31 735.85 144.09 879.94 1500.00*
2006–07 2301.97
Total 21739.85 3498.67 499.43 3998.10
Note: # Projects which are to be completed in two agricultural season (one year) with higher Central assistance; * Tentative.
TABLE 2.9Physical and Financial Performance of
MI Sector during the Tenth Plan
Year Physical Financial(in MH) (in Rs Crore)
Potential Potential Revised Expendi-Created Utilized Outlay ture
2002–03 0.687 0.548 1950.45 16392003–04 0.628 0.502 2634.63 19572004–05 0.740 0.592 2780.35 2780.352005–06# 0.545 0.440 7398.75 7398.752006–07* 0.918 0.734
Total 3.518 2.816 14764.18 13775.1
Note: # anticipated; * targeted.
Water Management and Irrigation 51
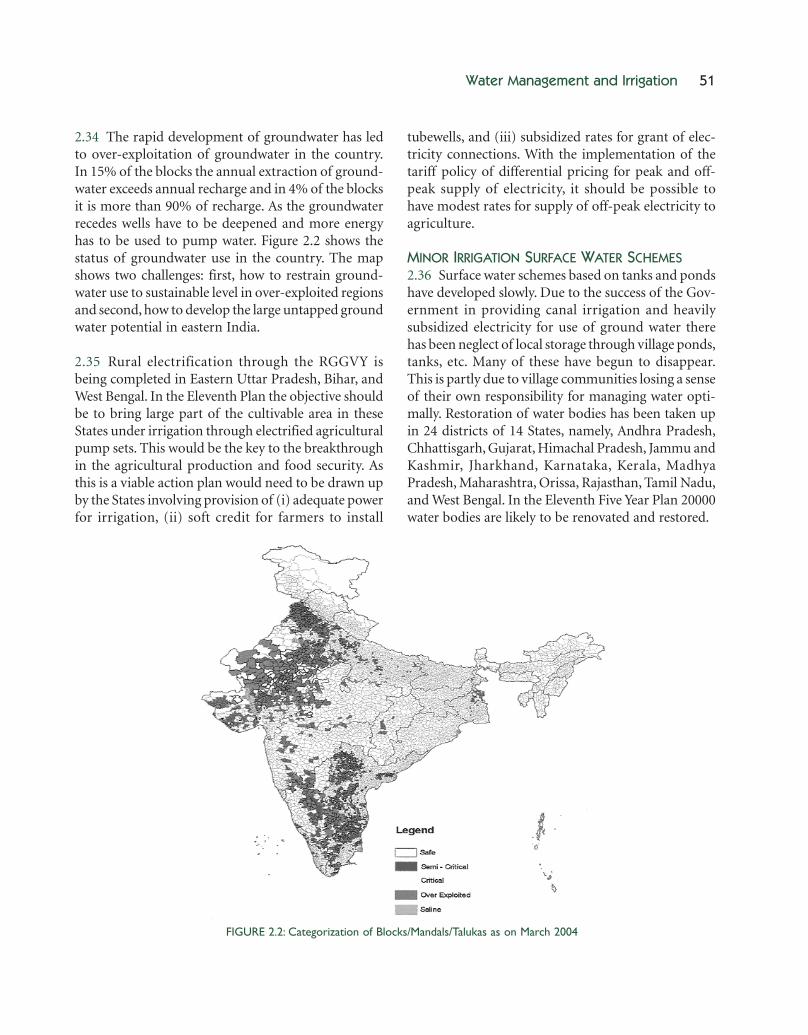
2.34 The rapid development of groundwater has ledto over-exploitation of groundwater in the country.In 15% of the blocks the annual extraction of ground-water exceeds annual recharge and in 4% of the blocksit is more than 90% of recharge. As the groundwaterrecedes wells have to be deepened and more energyhas to be used to pump water. Figure 2.2 shows thestatus of groundwater use in the country. The mapshows two challenges: first, how to restrain ground-water use to sustainable level in over-exploited regionsand second, how to develop the large untapped groundwater potential in eastern India.
2.35 Rural electrification through the RGGVY isbeing completed in Eastern Uttar Pradesh, Bihar, andWest Bengal. In the Eleventh Plan the objective shouldbe to bring large part of the cultivable area in theseStates under irrigation through electrified agriculturalpump sets. This would be the key to the breakthroughin the agricultural production and food security. Asthis is a viable action plan would need to be drawn upby the States involving provision of (i) adequate powerfor irrigation, (ii) soft credit for farmers to install
tubewells, and (iii) subsidized rates for grant of elec-tricity connections. With the implementation of thetariff policy of differential pricing for peak and off-peak supply of electricity, it should be possible tohave modest rates for supply of off-peak electricity toagriculture.
MINOR IRRIGATION SURFACE WATER SCHEMES2.36 Surface water schemes based on tanks and pondshave developed slowly. Due to the success of the Gov-ernment in providing canal irrigation and heavilysubsidized electricity for use of ground water therehas been neglect of local storage through village ponds,tanks, etc. Many of these have begun to disappear.This is partly due to village communities losing a senseof their own responsibility for managing water opti-mally. Restoration of water bodies has been taken upin 24 districts of 14 States, namely, Andhra Pradesh,Chhattisgarh, Gujarat, Himachal Pradesh, Jammu andKashmir, Jharkhand, Karnataka, Kerala, MadhyaPradesh, Maharashtra, Orissa, Rajasthan, Tamil Nadu,and West Bengal. In the Eleventh Five Year Plan 20000water bodies are likely to be renovated and restored.
FIGURE 2.2: Categorization of Blocks/Mandals/Talukas as on March 2004
52 Eleventh Five Year Plan
FLOOD MANAGEMENT
Physical Achievements2.37 At the beginning of the Tenth Plan (2002), thearea benefited or the area provided with a reasonabledegree of protection was about 16.44 MH. The Plan-ning Commission approved an outlay of Rs 4619 crorefor State sector to protect 1.93 MH. The area likely tobe protected as reported by the States in their respec-tive annual plan documents is 1.78 MH. Thus, totalarea reasonably protected against flood by end of theTenth Plan is likely to be 18.22 MH. The physicalachievements per unit investment follow a reducingtrend because of cost escalation and increased alloca-tion for stabilization of existing works.
2.38 The year-wise outlays of the State and Centralsectors for the Tenth Plan and the actual/anticipatedexpenditures are given in Table 2.10.
Flood Damages and Relief2.39 During the first three years of the Tenth Plan,the flood damages as reported by the States and therelief fund released are given in Table 2.11.
2.40 The aforementioned relief funds also includeassistance for cyclones and other such natural calami-ties. It would be seen from the above table that duringthe first three years of the Tenth Plan, the expenditureon relief was significantly high and the correspondingPlan outlays were inadequate. It is necessary that amore rational approach and optimum programme ofworks is adopted for flood management.
2.41 The preceding paragraphs describe the situationanalyses of the irrigation sector in the country. Ashas been indicated at the beginning of the chapter,water scarcity and uncertainty in availability ofwater are important constraints that would need tobe addressed in the Eleventh Five Year Plan. Thestrategy to be followed in the Eleventh Five YearPlan for this sector is described in the followingsection.
ELEVENTH FIVE YEAR PLAN STRATEGY FORMAJOR, MEDIUM, AND MINOR IRRIGATION2.42 The GoI launched Bharat Nirman Programmein 2005–06. The irrigation component of the pro-gramme envisages creation of an additional 6.2 MH
TABLE 2.10Financial Performance in Flood Management during the Tenth Plan
(Rs Crore)
Year Approved/Revised Outlay Expenditure (Actual/Anticipated)
States Centre Total States Centre Total
2002–03 624 151 775 698 86 7852003–04 496 156 652 523 96 6192004–05 669 184 853 644 100 7442005–06 933 232 1165 830 181 10112006–07 1034 680 2520 1116 194 1310
Total 4562 1403 5965 3811 657 4468
TABLE 2.11Flood Damage and Relief in the Tenth Plan
(Rs Crore)
Year Flood RecommendedDamage CalamityReported Relief Fund
2002–03 2575 16002003–04 4434 15872004–05 3337 1286
of irrigation potential. This target will be achievedthrough major, medium, and minor projects forsurface water and ERM schemes. Owing to compara-tively low allocation by the States for irrigation projects,intervention of the Centre for creation of irrigationpotential will be required. AIBP is the only programmeunder MoWR to assist State Governments to achievethe targets set under the surface water component ofirrigation programme of Bharat Nirman.
Water Management and Irrigation 53
2.43 The Prime Minister has announced a rehabilita-tion package for agrarian distress districts of AndhraPradesh, Karnataka, Kerala, and Maharashtra whichincludes early creation of irrigation facilities in thesedistricts. The package includes 65 MMI projects to becompleted through assistance to be provided underAIBP out of which 28 projects are already includedunder AIBP assistance. It has also been decided to pro-vide assistance under AIBP to the projects providingirrigation facilities to drought-prone tribal areas as wellas to States which are having irrigation developmentof their potential below national average.
Linkage of AIBP with CommandArea Development2.44 It has been observed that utilization of the cre-ated irrigation potential through AIBP is not up to theexpected level. One of the reasons for non-utilizationor low utilization of created irrigation potential is non-completion of CAD work in the area where irrigationfacilities have been created. The CAD Programmeshould be integrated with the project implementationand upon completion of the project the water shouldreach to the farm gate instead of creating the irriga-tion potential which is not immediately utilized. It isalso pertinent to mention that the cost of land devel-opment works should also be integrated with theproject cost which may be funded under AIBP. Theinclusion of CAD component with the cost of theproject may affect the benefit–cost ratio of the project.
National Projects2.45 For quite sometime many State Governmentshave been raising the issue of declaring some irrigationprojects as ‘National Projects’. The criteria for the selec-tion of these projects, their mode of implementationand pattern of funding, etc. are yet to be finalized.However, it is obvious that the projects which are oninternational borders and the projects benefiting twoor more States should figure as National Projects.
Monitoring of the Projects with Remote Sensing2.46 During the end of the Tenth Plan, the PlanningCommission insisted on monitoring of the projectfunded under AIBP through remote sensing. Accord-ingly a pilot scheme for monitoring Teesta and UpperKrishna projects through remote sensing has been taken
up. The results of remote sensing have been matchedwith the ground realities and were found to the extentof 90% close to actuals. Accordingly the MoWR hasassigned the job of monitoring of 53 projects coveringthe area of 5 MH for remote sensing monitoring.
STRATEGY2.47 The following steps could be taken for major,medium, and minor irrigation sector for the EleventhFive Year Plan.
Major and Medium Irrigation Projects• Funds would be earmarked by the Planning Com-
mission in the State plans so that the ongoingschemes under AIBP can be completed in time andcost over-run is avoided.
• Since the fund requirement for medium or minorirrigation projects are less, adequate funds maybe made available for completion of these projects,without jeopardizing the programme for majorprojects. ERM projects should be given due prior-ity where the eroded potential can be restored withmoderate expenditure.
• Foremost priority should be given for completionof the ongoing projects.
• Ongoing projects which have already achieved90% or more of the ultimate potential should beconsidered as completed. It is also neceesary to criti-cally review all such projects which are having onlymarginal benefit left or are near impossible to com-plete because of various problems, and declare themcompleted or curtailed or deleted. The balance costof the remaining projects should be updated realis-tically for consideration during the Eleventh Plan.
• Inter se priority should be decided consideringvarious aspects such as externally aided projects,inter-state projects, projects benefiting drought-prone or tribal areas, etc. as per the guidelines pre-pared by National Commission for Integrated WaterResources Development Plan.
• High priority should be accorded to the Pre-Seventh and Seventh Plan Projects for fundingunder AIBP to complete these projects during theEleventh Plan.
• Schemes should be given out on fixed cost time cer-tain contract basis with incentive and penalty clause.
• Remote sensing satellite monitoring should be the
54 Eleventh Five Year Plan
basis for the performance of the implementationand accordingly the next release of funds should bemade.
• The CAD works and project execution should be inone package to ensure the availability of water uponcompletion of the project.
• The ERM projects are being funded under AIBPassistance and their funding should be linked withimprovement in efficiency of the irrigation systemand for this purpose minimum threshold targetefficiency should be considered.
• To improve efficiency, irrigation projects should bebenchmarked for performance evaluation by anindependent expert group so that optimum use ofwater is realized. The AIBP assistance in the formof grant should be made according to the perfor-mance parameters.
• A separate budget head up to 15% of Plan fund maybe provided as Irrigation Maintenance Fund (IMF)and full amount of irrigation revenue as collectedshould be credited to the IMF.
• In addition to the liabilities of completed projectsand provision for ongoing and new projects, theState plan proposals should incorporate provisionsfor special repairs of existing irrigation systems, damsafety measures, improved water management, andwater development aspect encompassing surveyand investigation, R&D, training, and NationalHydrology Project.
• System maintenance and revenue realization shouldbe handed over to beneficiaries groups or WaterUsers Associations (WUAs).
• The existing regional and State-level institutionssuch as Water and Land Management Institutesshould be strengthened and brought into main-stream activities for irrigation management im-provement.
• Dam safety measures should be taken up system-atically for Disaster Prevention and Management.5% of plan fund may be allocated for undertakingdam safety activities to ensure that dams in distressget special and timely attention.
• The performance evaluation of completed projectsneeds to be continued for benchmarking andimprovement in irrigation efficiency.
• New projects should be undertaken only afterconfirming that adequate funds for ongoing
programmes are available, in the State plan aswell as the availability of Central assistance by thePlanning Commission.
• Introduce the concept of National Projects.• Review the requirements and process of environ-
mental clearance.
Minor Irrigation Sector• Renovation and restoration of old tanks as well as
old diversion channels in hilly regions may be givenhigh priority.
• Micro irrigation system in water deficit areas shouldbe promoted.
• Groundwater development in areas havinguntapped and unutilized potential, particularly inthe Eastern Region should be promoted through atime-bound programme.
• A comprehensive strategy as recommended by theexpert group for regulation of groundwater devel-opment and use on sustainable basis should beimplemented.
GROUNDWATER EXPLOITATION AND GOVERNANCEFOR PREVENTING OVER-EXPLOITATION OFGROUNDWATER2.48 The two concerns about groundwater areover-exploitation in parts of the country and under-utilization in large parts of the country. The region-wise potential is as follows.
• Alluvial areas of the east and north east regions(NER) (particularly Assam, Bihar, West Bengal,and Uttar Pradesh) with low stage of groundwaterdevelopment have an additional potential of around2.7 MH from the unconfined aquifers.
• Hard rock areas of peninsular India have anadditional potential of around 0.8 MH by judiciousand scientific development of groundwater inAndhra Pradesh, Chhattisgarh, Jharkhand, Kerala,Maharashtra, Orissa, Tamil Nadu, and parts ofMadhya Pradesh.
• Hilly areas of the north and the NER have a mar-ginal additional potential of around 0.04 MH inArunachal Pradesh, Himachal Pradesh, Jammu andKashmir, Manipur, Tripura, and Uttaranchal.
• Deeper confined aquifers in the alluvial plainsof Uttar Pradesh, Haryana, and Punjab have an
Water Management and Irrigation 55
additional potential of 1.0 MH by tapping deeperconfined aquifers. However, there is need to under-take detailed studies to establish the ‘Safe Yield’ fromsuch aquifers to avoid any adverse environmentalimpacts.
2.49 Sustainable groundwater development and man-agement need to be taken up by incorporating studieson artificial recharge to groundwater and rainwaterharvesting, management of salinity ingress in coastalregions, sustainable management in areas with highlevels of groundwater development, conjunctive useof surface water and groundwater, and regulationof groundwater development. There are numberof groundwater extraction structures in the countrywhich are very old, have outlived their working life,and are not functional. These structures, in reality, donot contribute to irrigation potential. Such structuresneed replacement for restoration of old/alreadycreated potential. As suggested by NABARD, replace-ment may be planned at 0.5 MH during the EleventhFive Year Plan in only safe and semi-critical blocks/units.
2.50 MI and groundwater development provide plentyof scope for employment of unskilled labour forces. Itis, therefore, very important to link National RuralEmployment Guarantee Programme (NREGP) withMI and groundwater development.
2.51 The UIP through ground- water resources hasbeen assessed to be about 64 MH in the country, outof which 46.03 MH has been created upto the end ofthe Tenth Plan. Since groundwater is an open accessresource and everyone is entitled to pump water be-low his own land, it is over-exploited in a number ofblocks in the country and the water table is going down.This increases the cost of irrigation and farmers arerequired to periodically deepen their wells.
2.52 In order to address the issues of sustainable useof groundwater and the question of ownership of thegroundwater, the Planning Commission has set upan expert group on ‘GroundWater Management andOwnership’ chaired by Member (Water and Energy)Kirit S. Parikh. The group recommended that theownership of the groundwater below the land will
continue to remain with the owner of the land as perthe Easement Act 1882 as long as the exploitation ofgroundwater is not causing depletion in the groundwater levels so the similar rights of the adjoining land-owners and public at large are not encroached upon.Centre’s intervention would be required when thegroundwater level falls below the replenishable level.In such events, the affected area will be declared asan area under threat and any exploitation willbe regulated. The Central Ground Water Authority,under the provisions of Environment Act 1986, isempowered to make such declarations and it wouldbe the responsibility of the State Government toensure that the exploitation in the area is regulated.
2.53 The group has noted that the experiences atnational and international levels have shown that acommand and control mechanism has not yieldedgood results in protecting the groundwater resourcesfrom over-exploitation. The regulation/reduction/restriction on the groundwater usage can be madeeffective by the State Government only with theco-operation of user groups and community partici-pation involving PRIs. The user groups will be respon-sible for regulating the ground water usage amongvarious sectors, that is irrigation, drinking, and indus-trial. Such regulations by the user group can be madeeffective only if the State/Central Ground Water Board(CGWB) monitors and provides information on safelyextractable water on the basis of water table levelsrecorded scientifically.
AUGMENTING UTILIZABLE WATER2.54 Usable water availability can be increased by tap-ping water that otherwise would have run-off to thesea. Water storage above ground through dams anddiversion through weirs are the conventional means.However, water can also be stored underground byenhancing percolation through artificial recharge. Rainwater harvesting in many small ponds through con-struction of bunds can also add to water availability.Inter-basin transfer of water through inter-linking ofrivers can substantially expand availability.
ARTIFICIAL RECHARGE AND RAIN WATER HARVESTING2.55 The groundwater levels are declining in manyparts of the country. Artificial recharge of groundwater
56 Eleventh Five Year Plan
with rainwater is an important strategy to arrest thistrend. The CGWB has already prepared a master planto recharge 36 bcm of rainwater into groundwater at acost of Rs 24500 crore. Except for pilot projects in theEighth and Ninth Plans, no serious effort has beenmade to implement this on a mission mode. In urbanareas, many cities have by-laws making rainwaterharvesting compulsory for new buildings. However inrural areas there is no such programme.
2.56 Local storage is cost effective. There is significantpotential for increasing the overall utilizable waterthrough rainwater harvesting, construction of checkdams, watershed management, and restoration of tra-ditional water bodies as well as creation of new ones.In areas where groundwater is under severe stress,artificial recharging would need to be undertaken withproper technical support. Resources under the NREGP,BRGF, etc. are available for this purpose. The multilat-eral agencies such as World Bank and Asian Develop-ment Bank (ADB) have also been requested to providefinancing for this purpose. Alternatively, a cess on thebottled water (since many negative externalities areassociated with it like generation of plastic waste, theirimproper disposal, etc.) can be levied and funds fromsuch levy could be used for revival of traditional waterbodies or for recharging ground water with commu-nity participation. The challenge is to motivate thelocal communities to undertake this work on prioritybasis and to build their capacity for this purpose. Tech-nical support systems for developing an optimalwater management master plan for a micro watershed/hydrological unit need to be created. Groundwatermapping, GIS mapping, satellite imagery, etc. need tobe utilized for assisting the village community in pre-paring water resource development and managementof master plans. With broadband connectivity expectedto reach all over rural India in the Eleventh Plan this isfeasible. It does however pose a difficult challenge increating the institutional systems and delivery mecha-nisms for providing technical back-up support to thevillage community for preparing water managementmaster plans.
2.57 The flood plains in the vicinity of rivers can begood repositories of groundwater. A planned manage-ment of groundwater in the flood plain aquifers offers
an excellent scope of its development to meet theadditional requirements of water. The development ofgroundwater in the Yamuna flood plain area in Delhiis an example of scientific management of water re-sources. During rainy season, the flood water spreadsover the plains but due to very shallow water table therecharge is small and the rejected recharge result inriver out flows. CGWB constructed 95 tubewells inPalla Sector in the depth range of 38–50 m for DelhiJal Board. The total pumpage during the pre-monsoonperiod of 2002 was 40 million gallons per day whichcreated a regional drawdown of about 5 m in theflood plain area. It was observed that immediatelyafter rainy season, the depleted aquifer fully recouped.Thus over-development of shallow aquifers in floodplains creates the necessary subsurface space foraugmentation of groundwater from the river flowsduring the monsoon. Induced recharge is an effectivemanagement tool to meet the gap of demand and sup-ply in areas adjacent to rivers with active flood plains.
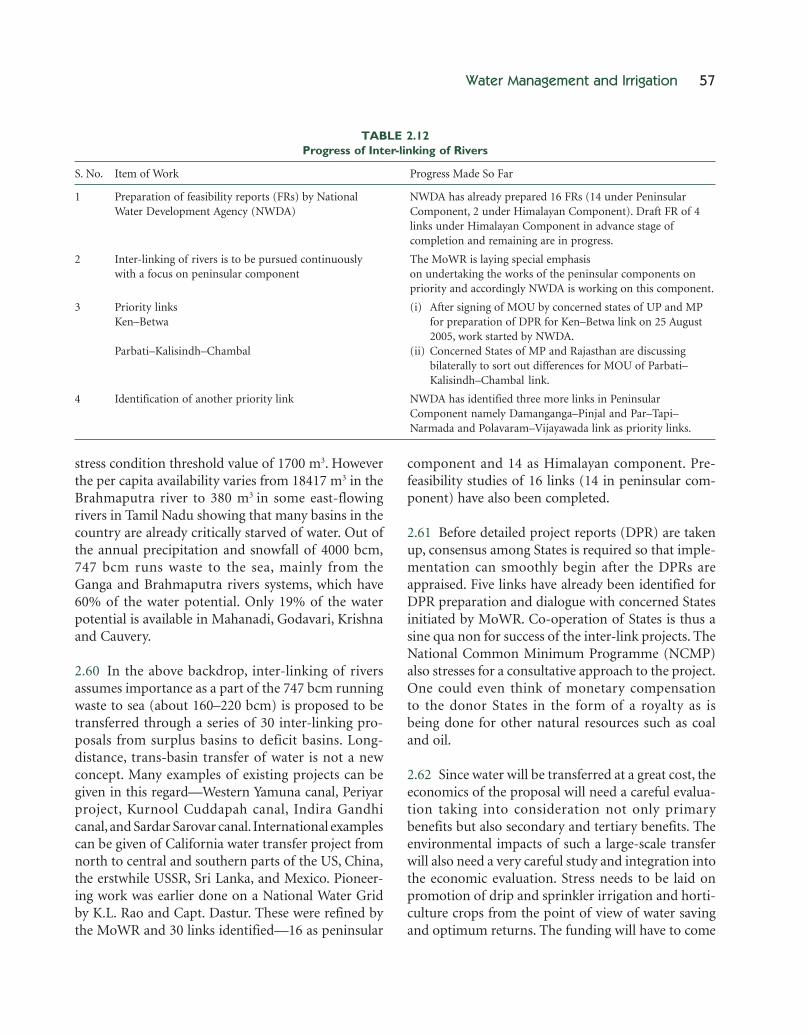
INTER-BASIN TRANSFERS THROUGHINTER-LINKING OF RIVERS2.58 The inter-linking of rivers and the transfer ofsurplus water, especially in the monsoon period fromthe surplus basins to the deficient basins has beenchampioned by many experts over time. The task forceon the inter-linking of rivers has drawn up a set ofproject proposals. The total amount of water that canbe usefully transferred is estimated to be about 220bcm. However, there are apprehensions that the as-sessed surplus is somewhat illusory for many basinsand future generations would actually need all thewater. Sceptics have reservations about the economicviability of such large projects. Environmental con-cerns would need to be addressed through the envi-ronmental appraisal process of each project. For thesereasons the pace of progress in the Tenth Plan periodhas been quite modest and is summarized in Table 2.12.
2.59 The availability of water in the country has vastvariation both in time and space. The bulk of the rain-fall is concentrated in the monsoon months June toSeptember. While 51.12 MH is affected by droughts,mainly in peninsular India, 40 MH is affected byfloods mainly in Bihar and Assam. The per capita avail-ability of water is 1820 m3 which is above the water
Water Management and Irrigation 57
stress condition threshold value of 1700 m3. Howeverthe per capita availability varies from 18417 m3 in theBrahmaputra river to 380 m3 in some east-flowingrivers in Tamil Nadu showing that many basins in thecountry are already critically starved of water. Out ofthe annual precipitation and snowfall of 4000 bcm,747 bcm runs waste to the sea, mainly from theGanga and Brahmaputra rivers systems, which have60% of the water potential. Only 19% of the waterpotential is available in Mahanadi, Godavari, Krishnaand Cauvery.
2.60 In the above backdrop, inter-linking of riversassumes importance as a part of the 747 bcm runningwaste to sea (about 160–220 bcm) is proposed to betransferred through a series of 30 inter-linking pro-posals from surplus basins to deficit basins. Long-distance, trans-basin transfer of water is not a newconcept. Many examples of existing projects can begiven in this regard—Western Yamuna canal, Periyarproject, Kurnool Cuddapah canal, Indira Gandhicanal, and Sardar Sarovar canal. International examplescan be given of California water transfer project fromnorth to central and southern parts of the US, China,the erstwhile USSR, Sri Lanka, and Mexico. Pioneer-ing work was earlier done on a National Water Gridby K.L. Rao and Capt. Dastur. These were refined bythe MoWR and 30 links identified—16 as peninsular
component and 14 as Himalayan component. Pre-feasibility studies of 16 links (14 in peninsular com-ponent) have also been completed.
2.61 Before detailed project reports (DPR) are takenup, consensus among States is required so that imple-mentation can smoothly begin after the DPRs areappraised. Five links have already been identified forDPR preparation and dialogue with concerned Statesinitiated by MoWR. Co-operation of States is thus asine qua non for success of the inter-link projects. TheNational Common Minimum Programme (NCMP)also stresses for a consultative approach to the project.One could even think of monetary compensationto the donor States in the form of a royalty as isbeing done for other natural resources such as coaland oil.
2.62 Since water will be transferred at a great cost, theeconomics of the proposal will need a careful evalua-tion taking into consideration not only primarybenefits but also secondary and tertiary benefits. Theenvironmental impacts of such a large-scale transferwill also need a very careful study and integration intothe economic evaluation. Stress needs to be laid onpromotion of drip and sprinkler irrigation and horti-culture crops from the point of view of water savingand optimum returns. The funding will have to come
TABLE 2.12Progress of Inter-linking of Rivers
S. No. Item of Work Progress Made So Far
1 Preparation of feasibility reports (FRs) by National NWDA has already prepared 16 FRs (14 under PeninsularWater Development Agency (NWDA) Component, 2 under Himalayan Component). Draft FR of 4
links under Himalayan Component in advance stage ofcompletion and remaining are in progress.
2 Inter-linking of rivers is to be pursued continuously The MoWR is laying special emphasiswith a focus on peninsular component on undertaking the works of the peninsular components on
priority and accordingly NWDA is working on this component.
3 Priority links (i) After signing of MOU by concerned states of UP and MPKen–Betwa for preparation of DPR for Ken–Betwa link on 25 August
2005, work started by NWDA.Parbati–Kalisindh–Chambal (ii) Concerned States of MP and Rajasthan are discussing
bilaterally to sort out differences for MOU of Parbati–Kalisindh–Chambal link.
4 Identification of another priority link NWDA has identified three more links in PeninsularComponent namely Damanganga–Pinjal and Par–Tapi–Narmada and Polavaram–Vijayawada link as priority links.
58 Eleventh Five Year Plan
from a mix of budgetary support, market borrowings,and external assistance. For the implementation ofsuch a mega project, an authority may have to be setup akin to the National Highways Authority of India(NHAI) with full autonomy for raising loan, approv-als, etc. The maintenance of the created assets willhave to be properly done with required revenuesgenerated from the project.
2.63 Inter-linking of rivers is a challenging project andis essential for meeting the looming water crisis in fu-ture. The syndrome of drought and floods is hamper-ing the required growth in agriculture and inter-linkingof rivers offers an effective solution to the problem.In the Eleventh Plan the inter-basin transfer of waterneeds to be pursued more vigorously. Where a con-sensus emerges regarding the prima facie feasibility ofspecific projects their DPR preparation, environmen-tal appraisal and decision on investment as well asexecution modalities need to be completed in a time-bound manner. The execution of some projects shouldcommence in the Eleventh Plan period.
IMPROVING WATER USE EFFICIENCY2.64 For a gross irrigated area of about 87 MH, thewater use is 541 bcm which gives a delta of 0.68 m perha of gross irrigated area. The average annual rainfall is1170 mm (1.17 m). Taking 70% of the rainfall as effec-tive for crop consumptive use, the gross water use isabout 1.45 m (4.8 feet) per ha of the gross irrigated area.This is very high as compared to water use in irrigationsystems in say the US where water allocation is about 3feet. This overuse in the country reflects a low irrigationefficiency of about 25% to 35% in most irrigation sys-tems, with efficiency of 40% to 45% in a few exceptionalcases. A basin-wise study conducted by A. Vaidyanathanand K. Sivasubramaniam of the Madras Institute ofDevelopment Studies (MIDS) using potential evapo-transpiration data and gross water withdrawals reportsthe overall irrigation efficiency in the country as 38%.The study reveals that the Krishna, Godavari, Cauvery,and Mahanadi systems have a very low efficiency ofaround 27% while the Indus and Ganga systems aredoing better with efficiencies in the range of 43%–47%.This is understandable as the peninsular rivers havelarge areas under irrigation in delta areas, wherethe water management practices are poor, while the
rotational water supply (wara bandi) is practised in theIndus and Ganga systems. However, this is only amacro-level study. Project-level data available on irri-gation efficiency unfortunately is minimal. It needsto be appreciated that 55% of the area irrigated is bygroundwater sources where the efficiencies are quitehigh (70%–80%) in view of absence of long conveyancesystems. Consequently the efficiencies in surface irriga-tion systems must be much lower than the averagefigure of 38%.
REASONS FOR LOW IRRIGATION EFFICIENCY2.65 The reasons that contribute to low irrigationefficiency can be identified as follows:
• Completion of dam/head works ahead of canals.• Dilapidated irrigation systems.• Unlined canal systems with excessive seepage.• Lack of field channels.• Lack of canal communication network.• Lack of field drainage.• Improper field levelling.• Absence of volumetric supply.• Inadequate extension services.• Low rate for water.
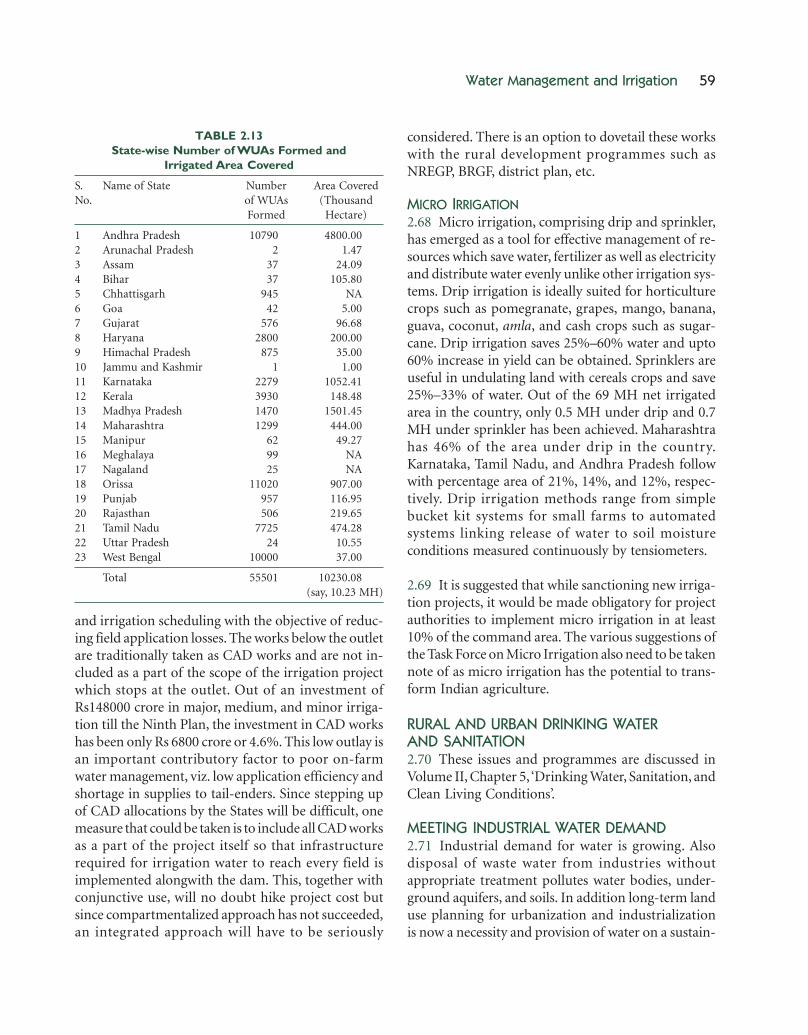
2.66 The equitable and optimal use of water fromcanal irrigation has been a matter of continuingconcern. The traditional approach of pursuing theseobjectives through the field-level functionaries ofirrigation department had its limitations. The partici-pation of actual beneficiaries through PIM and themaintenance of village-level distribution channelsthrough WUAs have been found useful. There isbroad consensus that this has been a step in the rightdirection. This needs to be pursued more vigorouslywith genuine empowerment of WUAs. The objectiveshould be to cover the entire command of all majorand medium projects with WUAs by the end of theEleventh Plan. The experience across States has beenuneven. It is reported that 55501 users associations hasbeen created and their State-wise position is indicatedin Table 2.13.
ON-FARM WATER MANAGEMENT2.67 On-farm water management covers a gamut ofareas such as field channels, field drains, land levelling,
Water Management and Irrigation 59
and irrigation scheduling with the objective of reduc-ing field application losses. The works below the outletare traditionally taken as CAD works and are not in-cluded as a part of the scope of the irrigation projectwhich stops at the outlet. Out of an investment ofRs148000 crore in major, medium, and minor irriga-tion till the Ninth Plan, the investment in CAD workshas been only Rs 6800 crore or 4.6%. This low outlay isan important contributory factor to poor on-farmwater management, viz. low application efficiency andshortage in supplies to tail-enders. Since stepping upof CAD allocations by the States will be difficult, onemeasure that could be taken is to include all CAD worksas a part of the project itself so that infrastructurerequired for irrigation water to reach every field isimplemented alongwith the dam. This, together withconjunctive use, will no doubt hike project cost butsince compartmentalized approach has not succeeded,an integrated approach will have to be seriously
considered. There is an option to dovetail these workswith the rural development programmes such asNREGP, BRGF, district plan, etc.
MICRO IRRIGATION2.68 Micro irrigation, comprising drip and sprinkler,has emerged as a tool for effective management of re-sources which save water, fertilizer as well as electricityand distribute water evenly unlike other irrigation sys-tems. Drip irrigation is ideally suited for horticulturecrops such as pomegranate, grapes, mango, banana,guava, coconut, amla, and cash crops such as sugar-cane. Drip irrigation saves 25%–60% water and upto60% increase in yield can be obtained. Sprinklers areuseful in undulating land with cereals crops and save25%–33% of water. Out of the 69 MH net irrigatedarea in the country, only 0.5 MH under drip and 0.7MH under sprinkler has been achieved. Maharashtrahas 46% of the area under drip in the country.Karnataka, Tamil Nadu, and Andhra Pradesh followwith percentage area of 21%, 14%, and 12%, respec-tively. Drip irrigation methods range from simplebucket kit systems for small farms to automatedsystems linking release of water to soil moistureconditions measured continuously by tensiometers.
2.69 It is suggested that while sanctioning new irriga-tion projects, it would be made obligatory for projectauthorities to implement micro irrigation in at least10% of the command area. The various suggestions ofthe Task Force on Micro Irrigation also need to be takennote of as micro irrigation has the potential to trans-form Indian agriculture.
RURAL AND URBAN DRINKING WATERAND SANITATION2.70 These issues and programmes are discussed inVolume II, Chapter 5, ‘Drinking Water, Sanitation, andClean Living Conditions’.
MEETING INDUSTRIAL WATER DEMAND2.71 Industrial demand for water is growing. Alsodisposal of waste water from industries withoutappropriate treatment pollutes water bodies, under-ground aquifers, and soils. In addition long-term landuse planning for urbanization and industrializationis now a necessity and provision of water on a sustain-
TABLE 2.13State-wise Number of WUAs Formed and
Irrigated Area Covered
S. Name of State Number Area CoveredNo. of WUAs (Thousand
Formed Hectare)
1 Andhra Pradesh 10790 4800.002 Arunachal Pradesh 2 1.473 Assam 37 24.094 Bihar 37 105.805 Chhattisgarh 945 NA6 Goa 42 5.007 Gujarat 576 96.688 Haryana 2800 200.009 Himachal Pradesh 875 35.0010 Jammu and Kashmir 1 1.0011 Karnataka 2279 1052.4112 Kerala 3930 148.4813 Madhya Pradesh 1470 1501.4514 Maharashtra 1299 444.0015 Manipur 62 49.2716 Meghalaya 99 NA17 Nagaland 25 NA18 Orissa 11020 907.0019 Punjab 957 116.9520 Rajasthan 506 219.6521 Tamil Nadu 7725 474.2822 Uttar Pradesh 24 10.5523 West Bengal 10000 37.00
Total 55501 10230.08(say, 10.23 MH)
60 Eleventh Five Year Plan
able long-term basis should be a key factor in suchplanning exercises. In the absence of such planningdemand for water emerges in areas where the provi-sion of water requires enormous investments incarriage systems over long distances or even treatmentof sea water. With proper long-term planning in termsof location of special economic zones (SEZs), indus-trial parks, and townships it should be possible tooptimize costs of industrial development. For meet-ing the water needs of industry the approach discussednext appears appropriate.
2.72 New industries should ideally be located only inplanned industrial areas, industrial parks, townshipson industrial/zones identified in township MasterPlans. They should be provided water by the localauthorities who should charge prescribed rates on avolumetric basis. These rates should fully cover:
• the cost of supply.• a premium to reflect the scarcity value of water in
areas where there is water shortage.• the cost of treatment to enable the discharge to go
back into the water system through drainage intoirrigation canals, rivers, lakes, etc.
2.73 Where groundwater is the source of supply andis under stress, the cost of supply should include thecost of recharge wherever such recharge is required andthe recharge component should be credited to a dedi-cated Recharge Fund (RF) so that its utilization is suit-ably monitored. For new and existing industries whichwould use groundwater on their own there should bea system of IT-based volumetric metering of actualextraction by water-intensive industries in those areaswhere ground water levels have become critical. Forthese areas, there should be prescribed rates for groundwater use by industry in a particular hydrological unit.The option of recycling the water and using it forsecondary needs, that is other than drinking, shouldbe a strategy for the Eleventh Plan.
FLOOD MANAGEMENT2.74 Every year some part or other of the countrygets flooded. A multi-pronged approach consistingof measures of prevention, protection, management,forecasting, and early warning are needed.
PREVENTION AND PROTECTION2.75 Floods can be prevented or significantly moder-ated by watershed management of the catchment areaof rivers. Agriculture, which is the nodal ministryfor the watershed management works, should workout a detailed programme in consultation with theMoWR. For international rivers originating in Nepaland Bhutan, a joint mechanism for watershed man-agement needs to be evolved. Another way is to pre-serve and augment flood cushions like natural swampsand lakes which can be developed into detentionbasins. Also, capacity of existing depressions can beimproved for absorbing flood waters. Special drivesfor development of Tal and Diara areas are needed.Construction of dams and reservoir schemes withadequate flood cushion provide long-term solutionof flood problems. Efforts should also be made forutilizing the existing reservoirs in the country forflood moderation to the extent possible. Even in res-ervoirs constructed for power or other purposes, therule curves may be framed in such way that effectiveflood moderation is achieved. Rule curves guide theoperation of a reservoir and ensure that a desiredlevel of storage cushion is maintained to absorbfloods of specified probability. Raising and strength-ening of the existing embankments, if required afterdetailed studies of hydrological, morphological, topo-graphical, and developmental aspects, provide someprotection.
2.76 Watershed management in the hilly catchmentsof the rivers originating in Nepal, Bhutan, and hillyareas of India should be selectively chosen and fullyfunded. Implementation should be done through ajoint mechanism.
2.77 The ideal solution for flood control is the cre-ation of adequate storages in flood prone riversystems. The Damodar Valley Corporation (DVC) isthe best example of a series of storage projects whichhave made floods in the Damodar river basin a matterof history. The Ganga–Brahmaputra–Barak basins areour most flood-prone basins. There is clearly a needto build storage reservoirs in the northern tributariesof the Ganga and in the Brahmputra and its tributar-ies in the NER. These storage projects need to beinvestigated designed and executed expeditiously.
Water Management and Irrigation 61
For the northern tributaries of the Ganga, co-operation with Nepal would be required. Negotiationswould need to be pursued with vision and construc-tive pragmatism.
2.78 The strategy of flood control through embank-ments has been pursued by the States over the years. Aholistic view of an entire tributary or a large stretch ofa tributary needs to be taken. Wherever feasible a onetime decisive investment for a flood protection projectshould be made. The recommendations of expertgroups and contemporary international experiencein other rivers in Asia with monsoon climate need tobe looked into.
MANAGING FLOODS2.79 Construction at appropriate location of spillingsections/sluices in the flood embankment for thecontrolled flooding of the protected areas for restoringfertility, recharge of soil moisture and groundwater canbe useful. Drainage sluices should be integral part ofembankments to prevent water-logging in the protectedareas. Flood management schemes should be integratedwith other infrastructural development programmesin the sectors of roads, railways, inland waterways, andcanal/command area development works. Drainageimprovement in critical areas in the country should begiven priority. Also dredging at selective locations, thatis outfalls, etc. in the rivers and the tributaries, helpsreduce flood levels in low-lying areas and also helps inquick drainage. Erosion of land by rivers should beminimized through suitable cost effective measures.The Centre should continue to assist the States in theGanga and Brahmaputra Valleys through Plan Fundsto counter land erosion by river action. In order to giveadequate emphasis on the O&M of the flood protec-tion measures already created, a percentage of outlayof the flood sector should be earmarked for this pur-pose. R&D activities for improved flood managementneed to be encouraged.
2.80 To the extent groundwater is intensively utilizedfor irrigation for multiple cropping in north Biharand Bengal and local water bodies are restored, thecapacity for recharge of groundwater in the monsoonperiod would increase and flooding would get miti-gated partially. In other parts of India flash floods
would get minimized if local drainage and restoration/creation of local water bodies was done with water-shed planning under NREGP, BRGF, etc.
FORECASTING AND EARLY WARNING2.81 Development of digital elevation model of flood-prone areas for taking up schemes for inundationforecast, preparation of flood risk maps, planning offlood management schemes, etc. should be taken up.Steps should be taken to ensure implementation ofAction Plan prepared by National Disaster Manage-ment Authority (NDMA) for flood management.
SUSTAINABILITY2.82 Two major challenges are being faced in ensur-ing sustainability of water, that is quality and quan-tity, to meet the needs. Groundwater use has to berestricted to average recharge and quality of waterhas to be improved and should be protected frombiological and chemical contamination. Sustainableuse of groundwater has been already discussed.
PRESERVING WATER QUALITY2.83 The threats to water quality are from untreatedindustrial effluents and municipal wastes from habi-tations, pollution from open defecation, and run-offfrom farms containing fertilizers and pesticides.Upscaling total sanitation campaign (TSC) pro-gramme for rural sanitation (see Volume II, Chapter5), strict enforcement of industrial effluent standards,and treatment of all municipal wastes are needed. Atthe same time farming practices have to be adjustedto use as little chemical fertilizers and pesticidesand apply them in ways that minimize residues inrun-off water, which is a waste for the farmer, arecalled for.
CONVERGENCE2.84 The subject of water is presently being dealt atthe Centre by a number of Ministries/Departments.The linkages of water with other sectors are many.Water availability and quality impact on social, hu-man development and economic activities. Effectivecoordination among different ministries and conver-gence of programmes is essential. Suitable institutionalarrangements would be made in the Eleventh Plan inthis regard.
62 Eleventh Five Year Plan
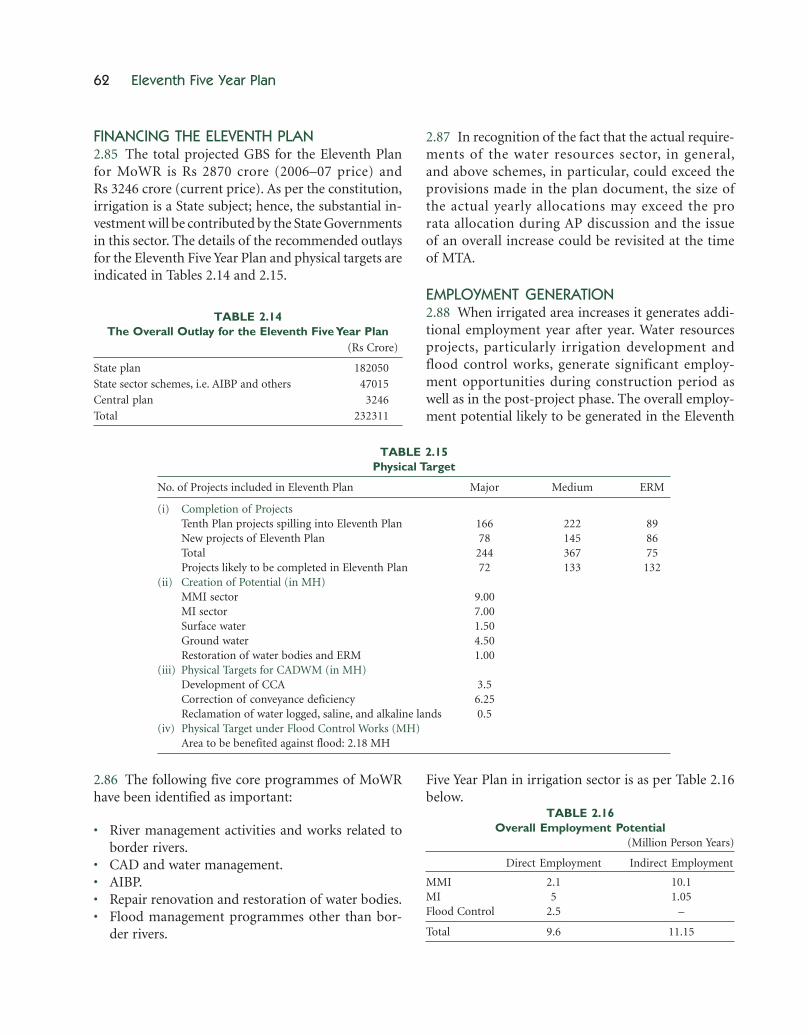
FINANCING THE ELEVENTH PLAN2.85 The total projected GBS for the Eleventh Planfor MoWR is Rs 2870 crore (2006–07 price) andRs 3246 crore (current price). As per the constitution,irrigation is a State subject; hence, the substantial in-vestment will be contributed by the State Governmentsin this sector. The details of the recommended outlaysfor the Eleventh Five Year Plan and physical targets areindicated in Tables 2.14 and 2.15.
2.87 In recognition of the fact that the actual require-ments of the water resources sector, in general,and above schemes, in particular, could exceed theprovisions made in the plan document, the size ofthe actual yearly allocations may exceed the prorata allocation during AP discussion and the issueof an overall increase could be revisited at the timeof MTA.
EMPLOYMENT GENERATION2.88 When irrigated area increases it generates addi-tional employment year after year. Water resourcesprojects, particularly irrigation development andflood control works, generate significant employ-ment opportunities during construction period aswell as in the post-project phase. The overall employ-ment potential likely to be generated in the Eleventh
TABLE 2.15Physical Target
No. of Projects included in Eleventh Plan Major Medium ERM
(i) Completion of ProjectsTenth Plan projects spilling into Eleventh Plan 166 222 89New projects of Eleventh Plan 78 145 86Total 244 367 75Projects likely to be completed in Eleventh Plan 72 133 132
(ii) Creation of Potential (in MH)MMI sector 9.00MI sector 7.00Surface water 1.50Ground water 4.50Restoration of water bodies and ERM 1.00
(iii) Physical Targets for CADWM (in MH)Development of CCA 3.5Correction of conveyance deficiency 6.25Reclamation of water logged, saline, and alkaline lands 0.5
(iv) Physical Target under Flood Control Works (MH)Area to be benefited against flood: 2.18 MH
2.86 The following five core programmes of MoWRhave been identified as important:
• River management activities and works related toborder rivers.
• CAD and water management.• AIBP.• Repair renovation and restoration of water bodies.• Flood management programmes other than bor-
der rivers.
Five Year Plan in irrigation sector is as per Table 2.16below.
TABLE 2.16Overall Employment Potential
(Million Person Years)
Direct Employment Indirect Employment
MMI 2.1 10.1MI 5 1.05Flood Control 2.5 –
Total 9.6 11.15
TABLE 2.14The Overall Outlay for the Eleventh Five Year Plan
(Rs Crore)
State plan 182050
State sector schemes, i.e. AIBP and others 47015
Central plan 3246
Total 232311
Water Management and Irrigation 63
THE WAY FORWARD2.89 The measures suggested for the Eleventh Planaddress the whole range of issues concerning watermanagement and irrigation. The long gestation periodin building irrigation infrastructure and thin spread ofresources are the main reasons for delay in completionof a number of ongoing projects. During the EleventhPlan a total of 477 projects including 166 major,222 minimum, and 89 ERM projects are likely to spill-over. The spill-over cost of these projects during theEleventh Plan is estimated to be about Rs 133746 crore.There is a need for reducing the gestation periodand making available the benefits of irrigation to theusers by way of integrating CAD programme with theprojects. The projects should be implemented on aconstruction schedule not more than four to five years.The land acquisition and R&R works should be takensimultaneously with the project formulation. Irrigationefficiency in the systems needs to be upgraded fromthe present level of 35% to about 60% in case ofsurface water system and from about 65% to 75% ingroundwater system. The efforts of the other depart-ments such as Rural Development and Agriculture, etc.should be converged and an integrated approach for
water resources development and conservation shouldbe adopted. The various schemes of MoRD for rainwater harvesting, watershed development, and NREGAct should be implemented in consultation withMoWR and Department of Drinking Water Supply(DoDWS). There is a need for (PPP) in developmentof water resource projects as this issue has already beenaddressed by NWP, 2002. The modern scientific devel-opment of water resources conservation, transfer, andapplication to the field is needed to be applied in theirrigation command. In flood management, the recur-rence interval of the floods should be the guiding fac-tor for taking up flood control measures. The floodcontrol measures should not be taken in isolation butit should be based on master plan approach in an inte-grated manner. The sustainability of ground water isone of the core areas which require attention for meet-ing irrigation and drinking water requirements. Use ofground water should be limited and linked with thequantum of water being recharged. The issue of moni-toring ground water levels through scientific methodssuch as Piezo meters, etc. should be left to the group ofbeneficiaries with proper technical support from theCentral Government and the State Governments.
64 Eleventh Five Year Plan
ANNEXURE 2.1Plan-wise Cumulative Potential Created and Utilized
(In MH)
Plan Potential Created Potential Utilized
Major and SW Minor Total Total Major & SW Minor Total TotalMedium GW Medium GW
Upto 1951 (Pre-Plan) 9.7 6.4 6.5 12.9 22.6 9.7 6.4 6.5 12.9 22.6First Plan 1951–56 12.2 6.43 7.63 14.06 26.26 10.98 6.43 7.63 14.06 25.04Second Plan 1956–61 14.33 6.45 8.3 14.75 29.08 13.05 6.45 8.3 14.75 27.8Third Plan 1961–66 16.57 6.48 10.52 17 33.57 15.17 6.48 10.52 17 32.17Annual Plan 1966–69 18.1 6.5 12.5 19 37.1 16.75 6.5 12.5 19 35.75Fourth Plan 1969–74 20.7 7 16.5 23.5 44.2 18.39 7 16.5 23.5 41.89Fifth Plan 1974–78 24.72 7.5 19.8 27.3 52.02 21.16 7.5 19.8 27.3 48.46Annual Plan 1978–80 26.61 8 22 30 56.61 22.64 8 22 30 52.64Sixth Plan 1980–85 27.7 9.7 27.82 37.52 65.22 23.57 9.01 26.24 35.25 58.82Seventh Plan 1985–90 29.92 10.9 35.62 46.52 76.44 25.47 9.97 33.15 43.12 68.59Annual Plan 1990–92 30.74 11.46 38.89 50.35 81.09 26.31 10.29 36.25 46.54 72.85Eighth Plan 1992–97 32.95 12.51 40.8 53.31 86.26 28.44 11.07 37.7 48.77 77.21Ninth Plan 1997–2002 37.05 13.6 43.3 56.9 93.95 31.01 11.44 38.55 49.99 81Tenth Plan 2002–2007 42.35 14.31 46.11 60.42 102.8 34.42 12 40.81 52.81 87.23


