Value Chain and Policy Analysis of Fossil Fuel Trade, Subsidy and Tax in Viet Nam
By: PeaPros Consulting JSC
Hanoi, May 2011 (with minor revisions in December 2011)
Package 1, under the UNDP Viet Nam research project “Research on fossil fuel prices and taxes, and their effects on economic development and income distribution in Viet Nam” The opinions, analyses and recommendations contained in this document do not necessarily reflect the opinions of the United Nations Development Programme in Viet Nam. The Report is an independent publication commissioned by UNDP.
i
Table of Contents
List of Figures ii
List of Tables iii
Abbreviations iv
1. Introduction 1 1.1. Methodology 1 1.2. Study Constraints 2 1.3. The cost of subsidies 2
2. Energy Use in general in Viet Nam 4
3. Electricity Generation and Use In Viet Nam 5 3.1. Electricity generation in Viet Nam, 2009 5 3.2. Master plan directions 9
3.2.1. Constraints in meeting National Plan VI 12 3.3. The Electricity Market in Viet Nam 13
3.3.1. The Role of EVN 13 3.3.1. Market revenue 15
3.4. Electricity usage in Viet Nam 20 3.5. Key constraints and implications 21
3.5.1. Pricing constraints 21 3.5.2. The Role of Coal 22
3.6. Electricity Fossil Fuel use Conclusion 25
4. Refined Petroleum market 27 4.1. Refined Petroleum Demand 27 4.2. Users of Refined Petroleum in Viet Nam 29 4.3. Refined Petroleum market structure 30 4.4. State Revenues 31 4.5. Price fluctuations and stabilization 32 4.6. Refined Petroleum products conclusion 34 4.7. Map of the refined petroleum market 36
5. Household fuel use, overview 37 5.1. Fossil Fuel for household cooking 37 5.2. Household Electricity Use 39 5.3. Household Petroleum Use 40 5.4. Gas, Coal and firewood 42
6. Conclusion 42 6.1. Electricity market 42 6.2. Refined Petroleum 43 6.3. Government Subsidies 43 6.4. Next Steps 45
References 47
ANNEX 1: Terms of Reference for the study 53
ANNEX 2: ASEAN Electricity Tariffs, February 2011 56
ANNEX 3: Retail Petroleum Prices in ASEAN Member Countries 59
ANNEX 4: Regulations guiding the Fossil Fuel Market 60
ii
List of Figures Figure 1: Energy Consumption by Fuel 2008, ktoe .......................................................................... 4 Figure 2: Energy Consumption by Economic Sector, 2008 ktoe ...................................................... 4 Figure 3: Electricity Production and Use Growth and GDP Growth, 2000-2009 ............................. 6 Figure 4: Viet Nam’s Electricity Generation by Source, 2000 and 2009 .......................................... 7 Figure 5: Changes in Viet Nam’s Electricity production structure 2000-2010(est.) MW ................. 8 Figure 6: Change in electricity generation structure 2009 to 2025, MW ...................................... 10 Figure 7: Production comparison, the World, China and Viet Nam ............................................... 13 Figure 8: Viet Nam’s Electricity Market Structure.......................................................................... 14 Figure 9: Electricity Production Share ............................................................................................ 15 Figure 10: Electricity Generation, Transmission and Retail Market in 2009 .................................... 17 Figure 11: Main users of Electricity .................................................................................................. 20 Figure 12: Coal and Electricity Production ....................................................................................... 23 Figure 13: Volume sales of refined petroleum products, 2007 to 2009 .......................................... 27 Figure 14: Transportation 2000 to 2009, million person kilometers ............................................... 28 Figure 15: Volume of Freight 2000 to 2009, thousands of tons ...................................................... 29 Figure 16: Import and Export of Petroleum products, 2003 to 2009 .............................................. 31 Figure 17: Household Fossil Fuel Use ............................................................................................... 38 Figure 18: Main energy source for cooking used by households, 2010 ........................................... 38 Figure 19: Average Electricity Consumption for Residential Consumers, by Poverty Status (kWh
per month): 2002-2008 ............................................................................................................... 40
iii
List of Tables Table 1: Electricity Generating Capacity and Production, 2009 .......................................................... 7 Table 2: Viet Nam energy capacity projections, 2009 to 2025 ........................................................... 9 Table 3: Total Costs of Generating Electricity in US cents per Kilowatt-hour ................................... 11 Table 4: Market value and tax revenues, 2007 to 2010 .................................................................... 16 Table 5: Minimum Wholesale and Retail Price Structure per Kwh (excl. VAT) under Decision
24/2011, 2011 .............................................................................................................................. 18 Table 6: Average price data for users across ASEAN, 2010 ............................................................... 19 Table 7: Share of electricity consumption by sector , 2015 to 2030 ................................................. 20 Table 8: Percentage of market by key industry................................................................................. 21 Table 9: Demand for Coal, 2010 to 2015 (1,000 Tons) ..................................................................... 23 Table 10: Direct and Indirect Subsidies to the Electricity sector .................................................... 26 Table 11: Growth in passenger and freight transport and the demand for refined petroleum
products ....................................................................................................................................... 28 Table 12: Sector use of refined petroleum, 2007 to 2009 .............................................................. 29 Table 13: Use of refined petroleum, 2007 to 2009......................................................................... 30 Table 14: Revenues from Petroleum, 2007 to 2009 ....................................................................... 31 Table 15: Retail Price structure for Refined Petroleum, April 2011 ............................................... 33 Table 16: ASEAN Prices of Gasoline and Diesel, February 2011 ..................................................... 34 Table 17: Direct and Indirect Subsidies to the Refined Petroleum Sector ..................................... 35 Table 18: Proportion Of Households Owning Electrical Appliances, by Poverty Status 2002 – 2008
(Poverty by WB/GSO Poverty Line) .............................................................................................. 40 Table 19: List of 31 eligible provinces (Zone 2) for fix 2% top-up ................................................... 41 Table 20: List of eligible districts (Zone 2) in 9 other provinces for fix 2% top-up ......................... 41 Table 21: Direct and Indirect Subsidies to the Energy Sector ......................................................... 44
iv
Abbreviations ADB Asian Development Bank bcm billion cubic meters BOO Build-operate-own BOT Build-operate-transfer CGE Computable general-equilibrium ERAV The Electricity Regulatory Authority of Vietnam EVN Electricity Vietnam GDP Gross Domestic Product GW Giga Watts GSO General Statistics Office IEA International Energy Association ktoe Kilo ton of oil equivalent Kwh Kilo watt hour MoF Ministry of Finance MoIT Ministry of Industry and Trade MoNRE Ministry of Natural Resources and Environment MW Mega Watts OECD Organisation of Economic Cooperation and Development PetroVietnam Vietnam Oil and Gas Group PPA Power Purchasing Agreement PVN Vietnam Oil and Gas Group UNDP United Nations Development Programme UNEP United Nations Environment Programme UNIDO United Nations Industrial Development Organisation VAT Value Added Tax Vinacomin The Vietnam National Coal and Mineral Industries Group VNEEP Vietnam Energy Efficiency Programme
1
1. Introduction This study was commissioned as part of a three phase in-depth examination of the fossil fuel market in Viet Nam and the role of subsidies and taxes in the use of fossil fuels (see also Annex I for the Terms of Reference). The three study areas included:-
Package 1: Value Chain and Policy Analysis of Fossil Fuel Trade, Subsidy and Tax.
Package 2: A Computable general-equilibrium (CGE) Model of the fiscal and social impacts of fuel taxation in Viet Nam.
Package 3: Environmental Assessment of the Potential Effects and Impacts of removal of Fuel Subsidies and Fuel Taxes
Under this value chain study (package 1) fossil fuel use was examined for electricity generation (coal, oil and gas), the use of refined fossil fuels in transportation (gasoline, diesel etc.) and the use of fossil fuels at the household level (electricity, bottled gas, kerosene as well as transportation). In addition to mapping the value chain for these fossil fuel markets and uses a key focus of the study was the identification of different subsidies and taxes across the various value chains for fossil fuels. Through the identification of these subsidies and examination of the regulations for these subsidies the study hoped to pin point the main beneficiaries of fossil fuel subsidies and also the main payer of fossil fuel taxes. The package 1 study has two objectives:
1. Analysis of the current energy landscape and the energy market in Viet Nam 2. Recommendations on the potential effects of removal of subsidies and introduction of fossil
fuel taxes on revenue collection.
Due to time and data access constraints the majority of the study’s work was spent on objective 1.
1.1. Methodology In order to map the movement of value and the benefits from subsidies and taxes to the government, producers and users, the study team did the following:
i. Desk Review of key fossil fuel and industry reports for Viet Nam as well as background materials on the role and impact of subsidies in fossil fuel markets.
ii. Collection and review of regulations guiding the use of fossil fuels: a database of regulations, master plans and strategies detailing price controls and structures, taxes and subsidies was built up. A brief literary review covering these regulations is available in the annexes.
iii. Gather key data on production and use of fossil fuels in the three main areas. Key data is presented in this report with more detailed data available separately in an excel sheet
iv. Interview key stakeholders in the regulation of fossil fuel as well as key producers and users. This included interviews with representatives of government ministries and institutions and leading state owned enterprises in the fossil fuel market.
v. Map the value chains of the markets and provide analysis: This focused mostly on the structure of two main fossil fuel markets, for electricity and transportation.
vi. Coordination with package 2 and 3: Throughout the study the team coordinated with package 2 and 3 in the provision of data as well as the market structure for each area to ensure key lessons and information supported their work.
2
1.2. Study Constraints The study was commissioned and finalized between January and February 2011 and initial deskwork began in March 2011. Initial work had to be reviewed as considerable movements occurred in the fossil fuel markets in the first quarter of 2011 including:
Increased global oil prices and the almost collapse of the Government’s oil stabalisation fund which led to a considerable revision of the retail price for refined oils in April 2011 include the deference of several taxes1.
Revised regulations in the electricity market allowing for quarterly revisions of the price of electricity2.
Acceleration of the move towards a more competitive market for electricity generation in line with 2004 Electricity Law3.
Further adjustments to the sales price of coal to industrial users though not for electricity producers4
For the purposes of this study we have taken January 2011 as the focal point for the market structures in different fossil fuel use areas though consideration is given throughout our analysis of these changes within the fossil fuel use market and what they mean for the value chain for fossil fuels. We have also considered policy changes between January 2011 and May 2011. Accessing specific data and qualifying data was a further hindrance to the study. Aggregated data for most fossil fuel production and usages is available from a variety of sources (GSO, ERAV, EVN, PVN). However, more detailed disaggregated data especially on usage was difficult to access as in many cases disaggregated data has only recently started to be collected by these agencies5. In other areas information was commercially sensitive. This was especially the case for coal sales to different power plants and also electricity sales prices to EVN under power purchasing agreements (PPAs). These issues will be highlighted throughout the report.
1.3. The cost of subsidies The International Energy Association (IEA) estimated that fossil fuel consumption subsidies cost governments across the world US$557 billion per year in fuel consumption subsidies. Subsidies to producers are estimated at US$100 million in 2008.6 While subsidies may help to ensure some equitable access to energy, such as petrol and electricity, it is recognized that subsidies often benefit the more well off in society as their use of energy is higher
1 http://bizvietnam.com/2011/02/oil-price-stabilization-fund-has-run-out-of-money/
2 Decision 24/2011D-TTg dated 16th
April 2011 on the adjustment of electricity selling
price according to market mechanism
3http://www.erav.vn/index.php?option=com_content&view=article&id=180%3Athang-72011-vn-hanh-thi-im-
th-trng-phat-in-cnh-tranh&catid=55%3Atin-tc-th-trng-in&Itemid=129&lang=vi3
4http://www.vinacomin.vn/temps/home/template2/defaultE.asp?Newid=17019&rootcate=1247
5 This was especially the case for disaggregated data on refined oil usage (gasoline, Diesel etc.) by industrial
sector for the 26 production areas identified by package two for analysis.
6 World Bank, IEA and OECD, 4:2008, “Analysis of the Scope of Energy Subsidies and Suggestions for the G-20
Initiative”
3
than the poorer groups. Though subsidies may be aimed at poorer groups and rural populations they tend to spend less of their incomes on energy. As IEA figures show, subsidies also incur high revenue costs for governments while the taxation of fossil fuels can both provide governments revenues while also providing a strong tool to encourage lower fossil fuel usage, energy savings and the adoption of cleaner energy and more efficient energy saving equipment. The IEA estimates that OECD countries collected revenues of US$400 billion between each year between 2003 and 2008 from taxes and VAT on fossil fuel.7 Subsidies come in a variety of formats, both direct and (increasingly) indirect. Over the last 20 years Viet Nam has moved away from a system of direct subsidies to energy but pressures to keep prices low and stable are leading to more indirect methods. These indirect tools maybe more damaging to a government’s revenues and oversight of state assets as it is difficult to quantify these tools and analyse their financial impact, as we will see. There are a number of different approaches to identifying direct and indirect subsidies, for the purposes of this paper we have used a framework developed by the OECD (2002) and the UNEP (2008) who categorized subsidies into five key areas.8
a. Direct financial transfers: grants to consumers, grants to producers, low-interest or preferential loans and government loan guarantees;
b. Preferential tax treatment: tax credits, tax rebates, exemptions on royalties, duties or tariffs, reduced tax rates, deferred tax liabilities and accelerated depreciation on energy-supply equipment;
c. Trade restrictions: tariffs, tariff-rate import quotas and non-tariff trade barriers; d. Energy-related services provided directly by government at less than full cost: government-
provided energy infrastructure, public research and development on fossil fuels; and e. Regulation of the energy sector: demand guarantees, mandated deployment rates, price
controls, environmental regulations and market-access restrictions. To some degree each of these five methods are used in Viet Nam though direct transfers as illustrated in the first method above, are less common today. However, preferential loans to producers as well as loan guarantees are still strongly used for state owned enterprises in the energy sector such as PetroViet Nam, EVN and Vinacomin. The survey uses the above framework of direct and indirect subsidies when looking at fossil fuel use in electricity and transportation to identify where the subsidies are and their nature.
7 World Bank, IEA and OECD, 4:2008, “Analysis of the Scope of Energy Subsidies and Suggestions for the G-20
Initiative” 8 GSI/ iisd, 11:2010, “The Effects of Fossil-Fuel Subsidy Reform: A review of modeling and empirical studies”
4
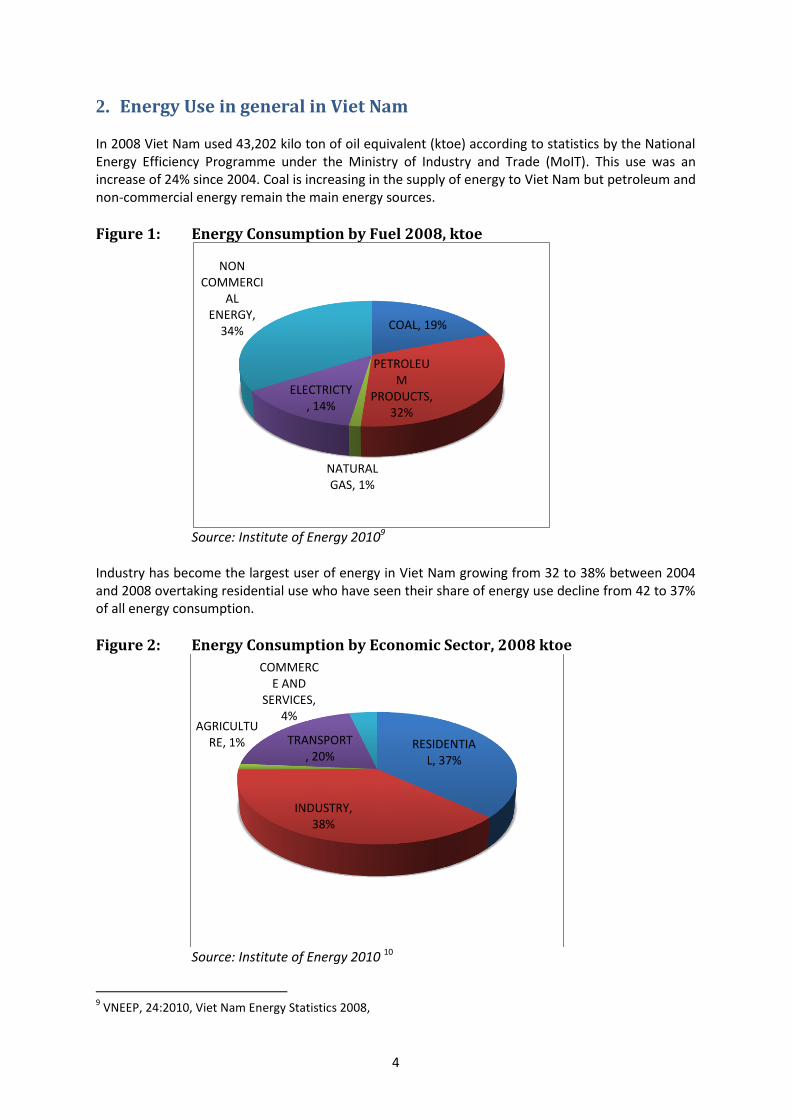
2. Energy Use in general in Viet Nam In 2008 Viet Nam used 43,202 kilo ton of oil equivalent (ktoe) according to statistics by the National Energy Efficiency Programme under the Ministry of Industry and Trade (MoIT). This use was an increase of 24% since 2004. Coal is increasing in the supply of energy to Viet Nam but petroleum and non-commercial energy remain the main energy sources.
Figure 1: Energy Consumption by Fuel 2008, ktoe
Source: Institute of Energy 20109
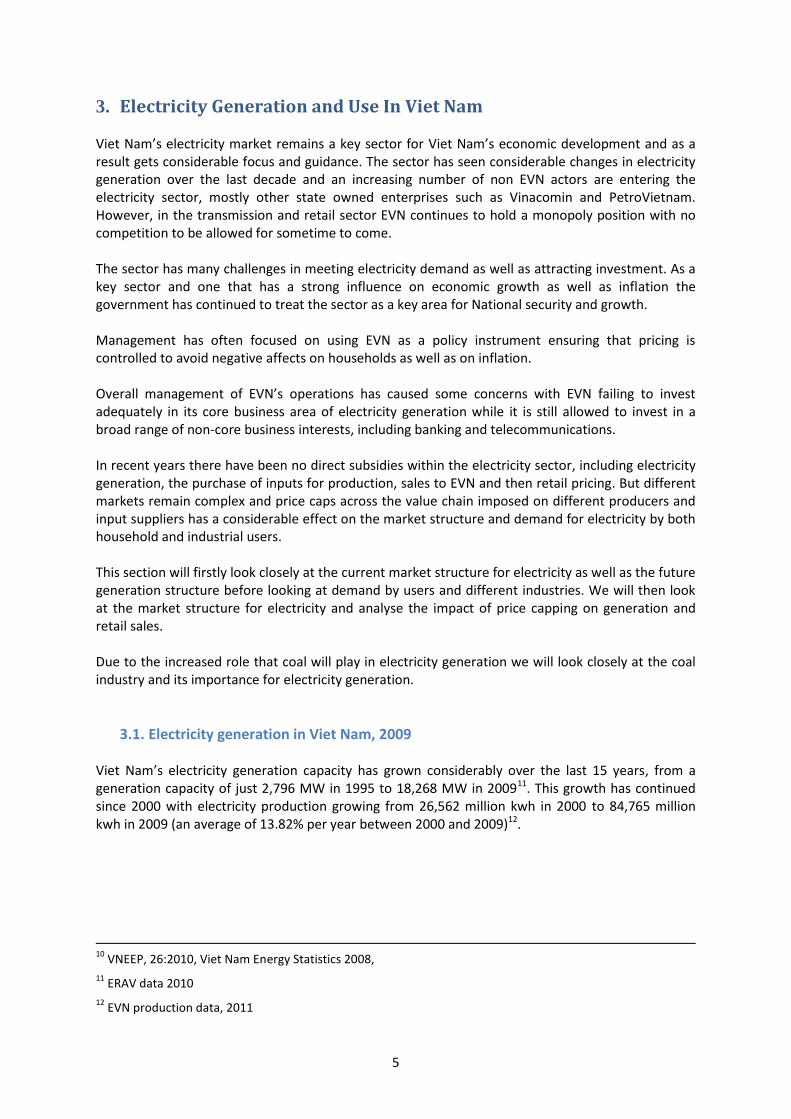
Industry has become the largest user of energy in Viet Nam growing from 32 to 38% between 2004 and 2008 overtaking residential use who have seen their share of energy use decline from 42 to 37% of all energy consumption.
Figure 2: Energy Consumption by Economic Sector, 2008 ktoe
Source: Institute of Energy 2010 10
9 VNEEP, 24:2010, Viet Nam Energy Statistics 2008,
COAL, 19%
PETROLEUM
PRODUCTS, 32%
NATURAL GAS, 1%
ELECTRICTY, 14%
NON COMMERCI
AL ENERGY,
34%
RESIDENTIAL, 37%
INDUSTRY, 38%
AGRICULTURE, 1% TRANSPORT
, 20%
COMMERCE AND
SERVICES, 4%
5
3. Electricity Generation and Use In Viet Nam Viet Nam’s electricity market remains a key sector for Viet Nam’s economic development and as a result gets considerable focus and guidance. The sector has seen considerable changes in electricity generation over the last decade and an increasing number of non EVN actors are entering the electricity sector, mostly other state owned enterprises such as Vinacomin and PetroVietnam. However, in the transmission and retail sector EVN continues to hold a monopoly position with no competition to be allowed for sometime to come. The sector has many challenges in meeting electricity demand as well as attracting investment. As a key sector and one that has a strong influence on economic growth as well as inflation the government has continued to treat the sector as a key area for National security and growth. Management has often focused on using EVN as a policy instrument ensuring that pricing is controlled to avoid negative affects on households as well as on inflation. Overall management of EVN’s operations has caused some concerns with EVN failing to invest adequately in its core business area of electricity generation while it is still allowed to invest in a broad range of non-core business interests, including banking and telecommunications. In recent years there have been no direct subsidies within the electricity sector, including electricity generation, the purchase of inputs for production, sales to EVN and then retail pricing. But different markets remain complex and price caps across the value chain imposed on different producers and input suppliers has a considerable effect on the market structure and demand for electricity by both household and industrial users. This section will firstly look closely at the current market structure for electricity as well as the future generation structure before looking at demand by users and different industries. We will then look at the market structure for electricity and analyse the impact of price capping on generation and retail sales. Due to the increased role that coal will play in electricity generation we will look closely at the coal industry and its importance for electricity generation.
3.1. Electricity generation in Viet Nam, 2009 Viet Nam’s electricity generation capacity has grown considerably over the last 15 years, from a generation capacity of just 2,796 MW in 1995 to 18,268 MW in 200911. This growth has continued since 2000 with electricity production growing from 26,562 million kwh in 2000 to 84,765 million kwh in 2009 (an average of 13.82% per year between 2000 and 2009)12.
10
VNEEP, 26:2010, Viet Nam Energy Statistics 2008,
11 ERAV data 2010
12 EVN production data, 2011
6
Figure 3: Electricity Production and Use Growth and GDP Growth, 2000-2009
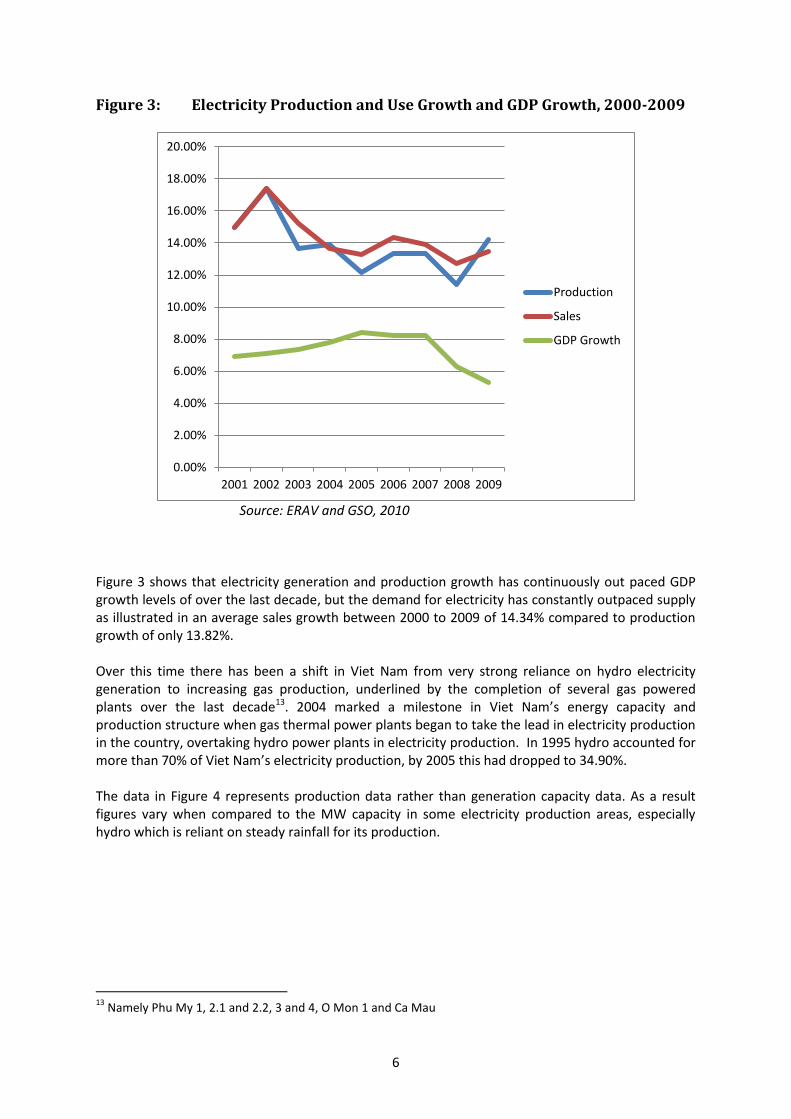
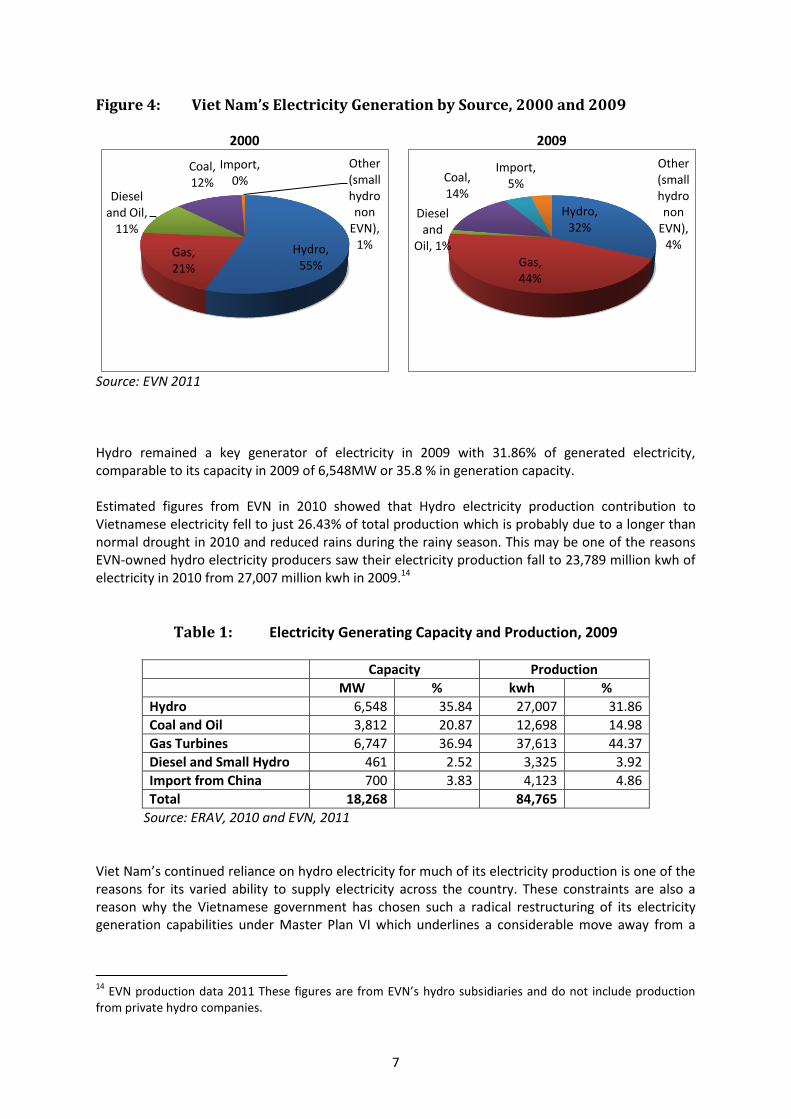
Source: ERAV and GSO, 2010 Figure 3 shows that electricity generation and production growth has continuously out paced GDP growth levels of over the last decade, but the demand for electricity has constantly outpaced supply as illustrated in an average sales growth between 2000 to 2009 of 14.34% compared to production growth of only 13.82%. Over this time there has been a shift in Viet Nam from very strong reliance on hydro electricity generation to increasing gas production, underlined by the completion of several gas powered plants over the last decade13. 2004 marked a milestone in Viet Nam’s energy capacity and production structure when gas thermal power plants began to take the lead in electricity production in the country, overtaking hydro power plants in electricity production. In 1995 hydro accounted for more than 70% of Viet Nam’s electricity production, by 2005 this had dropped to 34.90%. The data in Figure 4 represents production data rather than generation capacity data. As a result figures vary when compared to the MW capacity in some electricity production areas, especially hydro which is reliant on steady rainfall for its production.
13
Namely Phu My 1, 2.1 and 2.2, 3 and 4, O Mon 1 and Ca Mau
0.00%
2.00%
4.00%
6.00%
8.00%
10.00%
12.00%
14.00%
16.00%
18.00%
20.00%
2001 2002 2003 2004 2005 2006 2007 2008 2009
Production
Sales
GDP Growth
7
Figure 4: Viet Nam’s Electricity Generation by Source, 2000 and 2009
2000 2009
Source: EVN 2011 Hydro remained a key generator of electricity in 2009 with 31.86% of generated electricity, comparable to its capacity in 2009 of 6,548MW or 35.8 % in generation capacity. Estimated figures from EVN in 2010 showed that Hydro electricity production contribution to Vietnamese electricity fell to just 26.43% of total production which is probably due to a longer than normal drought in 2010 and reduced rains during the rainy season. This may be one of the reasons EVN-owned hydro electricity producers saw their electricity production fall to 23,789 million kwh of electricity in 2010 from 27,007 million kwh in 2009.14
Table 1: Electricity Generating Capacity and Production, 2009
Capacity Production
MW % kwh %
Hydro 6,548 35.84 27,007 31.86
Coal and Oil 3,812 20.87 12,698 14.98
Gas Turbines 6,747 36.94 37,613 44.37
Diesel and Small Hydro 461 2.52 3,325 3.92
Import from China 700 3.83 4,123 4.86
Total 18,268 84,765
Source: ERAV, 2010 and EVN, 2011 Viet Nam’s continued reliance on hydro electricity for much of its electricity production is one of the reasons for its varied ability to supply electricity across the country. These constraints are also a reason why the Vietnamese government has chosen such a radical restructuring of its electricity generation capabilities under Master Plan VI which underlines a considerable move away from a
14
EVN production data 2011 These figures are from EVN’s hydro subsidiaries and do not include production from private hydro companies.
Hydro, 55%
Gas, 21%
Diesel and Oil,
11%
Coal, 12%
Import, 0%
Other (small hydro non
EVN), 1%
Hydro, 32%
Gas, 44%
Diesel and
Oil, 1%
Coal, 14%
Import, 5%
Other (small hydro non
EVN), 4%
8
reliance on hydro and gas electricity generation towards increased coal powered electricity production. The sixth Master Plan for Power Development states the following principles for the development of the electricity sector without giving a rational for the move towards coal over other forms of electricity generation. The development of electric facilities must meet the demand of load as mentioned
above (growth levels); it must ensure the construction schedules of hydro-electric plants that offer the general benefits such as: flood control, water supply, electric generation; there must be rational & efficient development of gas-operated electric plants & acceleration in the construction of thermal electric plants;15
It goes on to suggest that the development of small hydro and renewable energy will only be developed to service remote areas.
Development of small-scale hydroelectric plants, use of renewable energy & recycled materials for electric generation to serve the remote & far flung regions, mountainous areas, border land, sea islands16
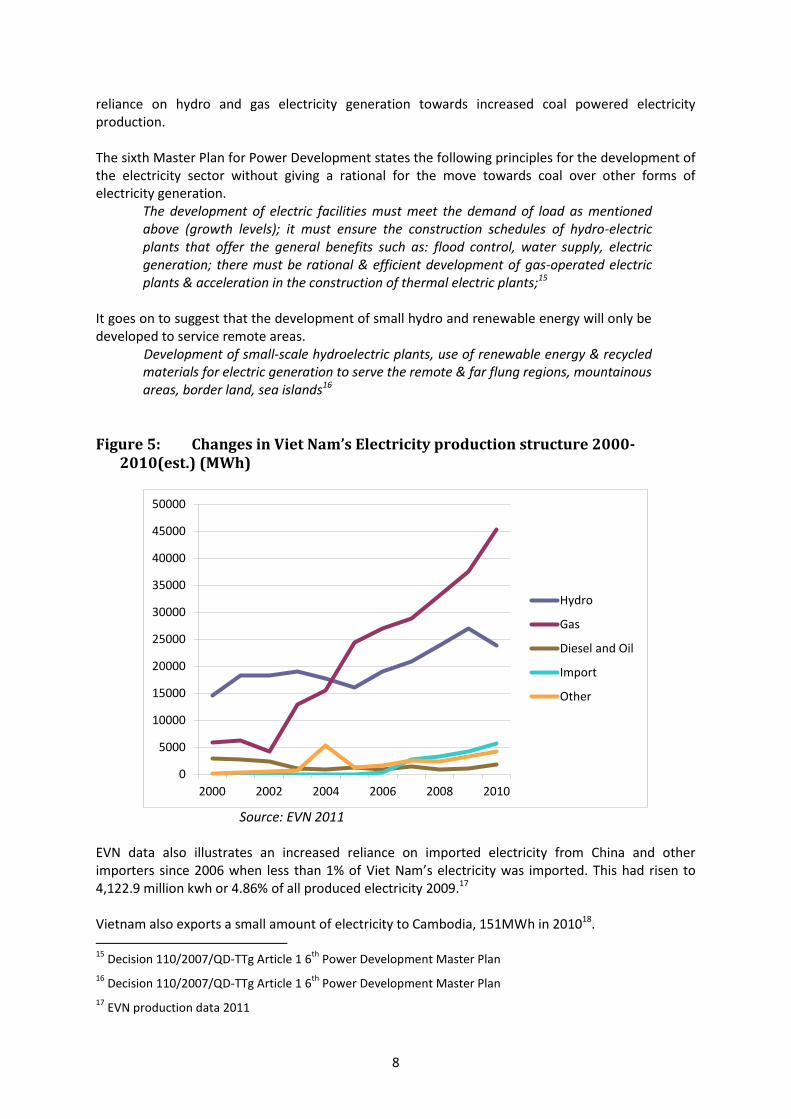
Figure 5: Changes in Viet Nam’s Electricity production structure 2000-2010(est.) (MWh)
Source: EVN 2011 EVN data also illustrates an increased reliance on imported electricity from China and other importers since 2006 when less than 1% of Viet Nam’s electricity was imported. This had risen to 4,122.9 million kwh or 4.86% of all produced electricity 2009.17 Vietnam also exports a small amount of electricity to Cambodia, 151MWh in 201018. 15
Decision 110/2007/QD-TTg Article 1 6th
Power Development Master Plan
16 Decision 110/2007/QD-TTg Article 1 6
th Power Development Master Plan
17 EVN production data 2011
0
5000
10000
15000
20000
25000
30000
35000
40000
45000
50000
2000 2002 2004 2006 2008 2010
Hydro
Gas
Diesel and Oil
Import
Other
9
3.2. Master plan directions The National Plan for Electric Power Development, National Plan VI19 outlines the Vietnamese government’s strategy for electricity generation from 2006 to 2015 with consideration to 2025. A seventh national plan has been drafted by the Ministry of Industry and Trade (MOIT) and is, at the time of writing, with the Prime Minster for consideration. Stakeholders interviewed believe the VII National plan will not deviate too much from the VI plan. The national plan is detailed in its identification of plants to be built over the 2006 to 2015 period and also assigns responsibility to a variety of agencies, such as EVN, Vinacomin, Lilama and construction and contract options such as BOO/ BOT. There is a recognition that the National Plan is some way behind schedule due to limited access to finance for many large state owned enterprises as well as limited interest in investment in the power sector in Viet Nam due to a regressive pricing structure that favors equitable access to electricity but which is forcing prices increasingly below generation costs. This will be discussed further on in the report. With electricity demand and generation growth due to increase considerably between 2006 and 2015, and on to 2025, considerable investment is also needed in the electricity industry. The World Bank estimated in 2008 that Viet Nam would need to invest $4 billion annually between 2006 and 2020 in order to develop the electricity generation, transmission and retail sectors20.
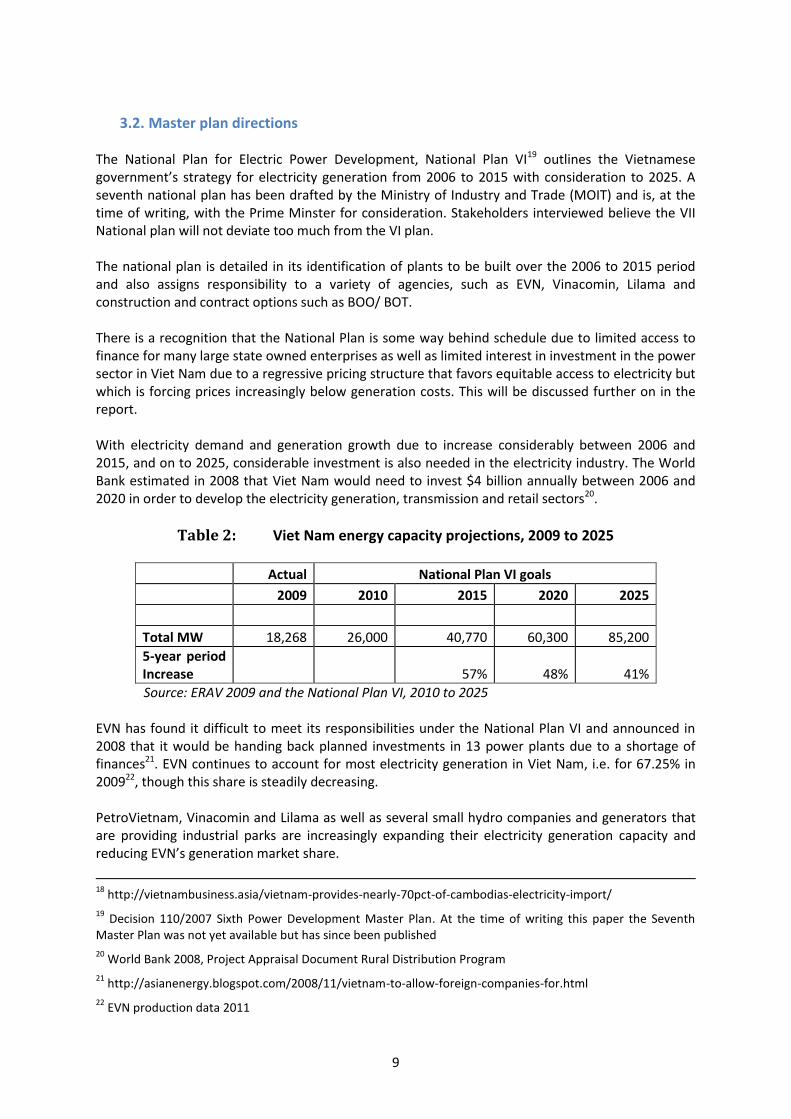
Table 2: Viet Nam energy capacity projections, 2009 to 2025
Actual National Plan VI goals
2009 2010 2015 2020 2025
Total MW 18,268 26,000 40,770 60,300 85,200
5-year period Increase 57% 48% 41%
Source: ERAV 2009 and the National Plan VI, 2010 to 2025 EVN has found it difficult to meet its responsibilities under the National Plan VI and announced in 2008 that it would be handing back planned investments in 13 power plants due to a shortage of finances21. EVN continues to account for most electricity generation in Viet Nam, i.e. for 67.25% in 200922, though this share is steadily decreasing. PetroVietnam, Vinacomin and Lilama as well as several small hydro companies and generators that are providing industrial parks are increasingly expanding their electricity generation capacity and reducing EVN’s generation market share.
18
http://vietnambusiness.asia/vietnam-provides-nearly-70pct-of-cambodias-electricity-import/
19 Decision 110/2007 Sixth Power Development Master Plan. At the time of writing this paper the Seventh
Master Plan was not yet available but has since been published
20 World Bank 2008, Project Appraisal Document Rural Distribution Program
21 http://asianenergy.blogspot.com/2008/11/vietnam-to-allow-foreign-companies-for.html
22 EVN production data 2011
10
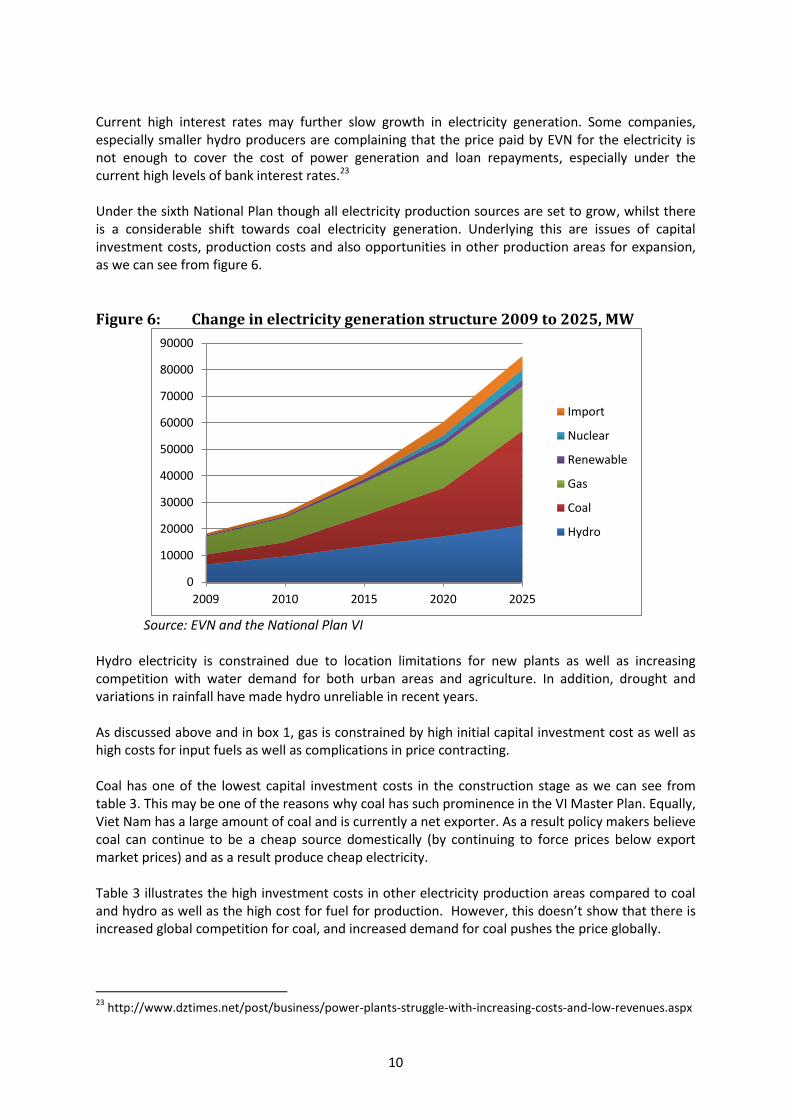
Current high interest rates may further slow growth in electricity generation. Some companies, especially smaller hydro producers are complaining that the price paid by EVN for the electricity is not enough to cover the cost of power generation and loan repayments, especially under the current high levels of bank interest rates.23 Under the sixth National Plan though all electricity production sources are set to grow, whilst there is a considerable shift towards coal electricity generation. Underlying this are issues of capital investment costs, production costs and also opportunities in other production areas for expansion, as we can see from figure 6.
Figure 6: Change in electricity generation structure 2009 to 2025, MW
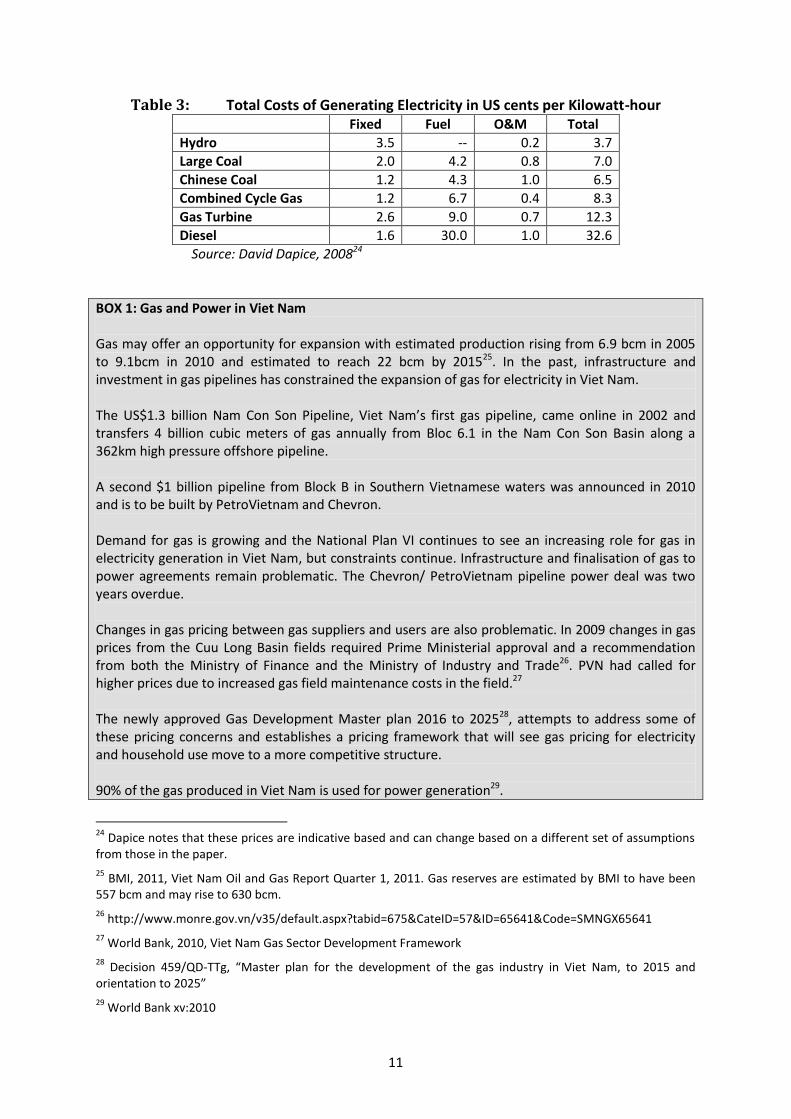
Source: EVN and the National Plan VI Hydro electricity is constrained due to location limitations for new plants as well as increasing competition with water demand for both urban areas and agriculture. In addition, drought and variations in rainfall have made hydro unreliable in recent years. As discussed above and in box 1, gas is constrained by high initial capital investment cost as well as high costs for input fuels as well as complications in price contracting. Coal has one of the lowest capital investment costs in the construction stage as we can see from table 3. This may be one of the reasons why coal has such prominence in the VI Master Plan. Equally, Viet Nam has a large amount of coal and is currently a net exporter. As a result policy makers believe coal can continue to be a cheap source domestically (by continuing to force prices below export market prices) and as a result produce cheap electricity. Table 3 illustrates the high investment costs in other electricity production areas compared to coal and hydro as well as the high cost for fuel for production. However, this doesn’t show that there is increased global competition for coal, and increased demand for coal pushes the price globally.
23
http://www.dztimes.net/post/business/power-plants-struggle-with-increasing-costs-and-low-revenues.aspx
0
10000
20000
30000
40000
50000
60000
70000
80000
90000
2009 2010 2015 2020 2025
Import
Nuclear
Renewable
Gas
Coal
Hydro
11
Table 3: Total Costs of Generating Electricity in US cents per Kilowatt-hour Fixed Fuel O&M Total
Hydro 3.5 -- 0.2 3.7
Large Coal 2.0 4.2 0.8 7.0
Chinese Coal 1.2 4.3 1.0 6.5
Combined Cycle Gas 1.2 6.7 0.4 8.3
Gas Turbine 2.6 9.0 0.7 12.3
Diesel 1.6 30.0 1.0 32.6
Source: David Dapice, 200824
BOX 1: Gas and Power in Viet Nam Gas may offer an opportunity for expansion with estimated production rising from 6.9 bcm in 2005 to 9.1bcm in 2010 and estimated to reach 22 bcm by 201525. In the past, infrastructure and investment in gas pipelines has constrained the expansion of gas for electricity in Viet Nam. The US$1.3 billion Nam Con Son Pipeline, Viet Nam’s first gas pipeline, came online in 2002 and transfers 4 billion cubic meters of gas annually from Bloc 6.1 in the Nam Con Son Basin along a 362km high pressure offshore pipeline. A second $1 billion pipeline from Block B in Southern Vietnamese waters was announced in 2010 and is to be built by PetroVietnam and Chevron. Demand for gas is growing and the National Plan VI continues to see an increasing role for gas in electricity generation in Viet Nam, but constraints continue. Infrastructure and finalisation of gas to power agreements remain problematic. The Chevron/ PetroVietnam pipeline power deal was two years overdue. Changes in gas pricing between gas suppliers and users are also problematic. In 2009 changes in gas prices from the Cuu Long Basin fields required Prime Ministerial approval and a recommendation from both the Ministry of Finance and the Ministry of Industry and Trade26. PVN had called for higher prices due to increased gas field maintenance costs in the field.27 The newly approved Gas Development Master plan 2016 to 202528, attempts to address some of these pricing concerns and establishes a pricing framework that will see gas pricing for electricity and household use move to a more competitive structure. 90% of the gas produced in Viet Nam is used for power generation29.
24
Dapice notes that these prices are indicative based and can change based on a different set of assumptions from those in the paper.
25 BMI, 2011, Viet Nam Oil and Gas Report Quarter 1, 2011. Gas reserves are estimated by BMI to have been
557 bcm and may rise to 630 bcm.
26 http://www.monre.gov.vn/v35/default.aspx?tabid=675&CateID=57&ID=65641&Code=SMNGX65641
27 World Bank, 2010, Viet Nam Gas Sector Development Framework
28 Decision 459/QD-TTg, “Master plan for the development of the gas industry in Viet Nam, to 2015 and
orientation to 2025”
29 World Bank xv:2010
12
3.2.1. Constraints in meeting National Plan VI
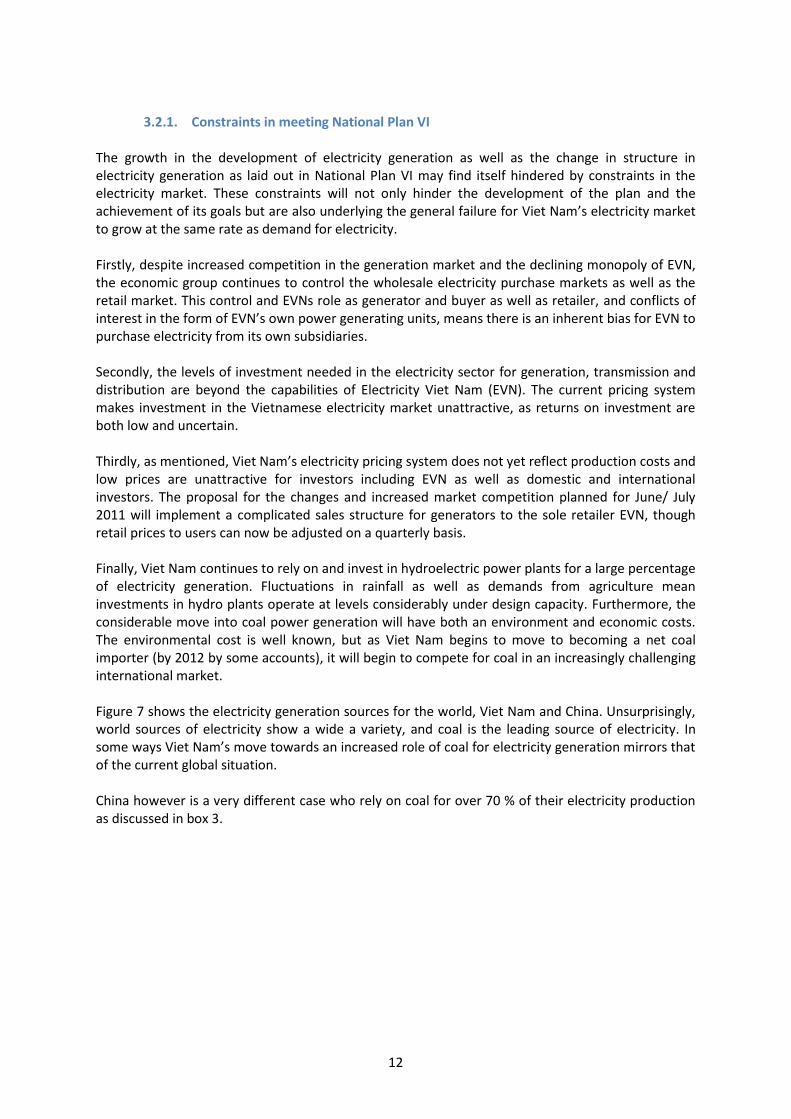
The growth in the development of electricity generation as well as the change in structure in electricity generation as laid out in National Plan VI may find itself hindered by constraints in the electricity market. These constraints will not only hinder the development of the plan and the achievement of its goals but are also underlying the general failure for Viet Nam’s electricity market to grow at the same rate as demand for electricity. Firstly, despite increased competition in the generation market and the declining monopoly of EVN, the economic group continues to control the wholesale electricity purchase markets as well as the retail market. This control and EVNs role as generator and buyer as well as retailer, and conflicts of interest in the form of EVN’s own power generating units, means there is an inherent bias for EVN to purchase electricity from its own subsidiaries. Secondly, the levels of investment needed in the electricity sector for generation, transmission and distribution are beyond the capabilities of Electricity Viet Nam (EVN). The current pricing system makes investment in the Vietnamese electricity market unattractive, as returns on investment are both low and uncertain. Thirdly, as mentioned, Viet Nam’s electricity pricing system does not yet reflect production costs and low prices are unattractive for investors including EVN as well as domestic and international investors. The proposal for the changes and increased market competition planned for June/ July 2011 will implement a complicated sales structure for generators to the sole retailer EVN, though retail prices to users can now be adjusted on a quarterly basis. Finally, Viet Nam continues to rely on and invest in hydroelectric power plants for a large percentage of electricity generation. Fluctuations in rainfall as well as demands from agriculture mean investments in hydro plants operate at levels considerably under design capacity. Furthermore, the considerable move into coal power generation will have both an environment and economic costs. The environmental cost is well known, but as Viet Nam begins to move to becoming a net coal importer (by 2012 by some accounts), it will begin to compete for coal in an increasingly challenging international market. Figure 7 shows the electricity generation sources for the world, Viet Nam and China. Unsurprisingly, world sources of electricity show a wide a variety, and coal is the leading source of electricity. In some ways Viet Nam’s move towards an increased role of coal for electricity generation mirrors that of the current global situation. China however is a very different case who rely on coal for over 70 % of their electricity production as discussed in box 3.
13
Figure 7: Production comparison, the World, China and Viet Nam
Source: IEA, 2010 World data, Chinese Academy of Engineering, 2007, EVN, 2010
3.3. The Electricity Market in Viet Nam
3.3.1. The Role of EVN State owned enterprise Electricity Viet Nam (EVN) continues to dominate the electricity market, including generation, transmission and retail. The 2004 Electricity Law does lay out a long-term vision for the restructuring of the electricity market, between 2005 and 2025 but postpones the opportunity for other actors to take part in retail until 2022 or 2024.
Coal/ Peat
Coal/ Peat
Coal/ Peat
Oil
Oil
Gas
Gas
Gas
Nuclear Nuclear
Nuclear
Hydro Hydro
Hydro
Import Import
Import
Other Other Other
0%
10%
20%
30%
40%
50%
60%
70%
80%
90%
100%
World China Vietnam
2008 2010 2009
Other
Import
Hydro
Nuclear
Gas
Oil
Coal/ Peat
14
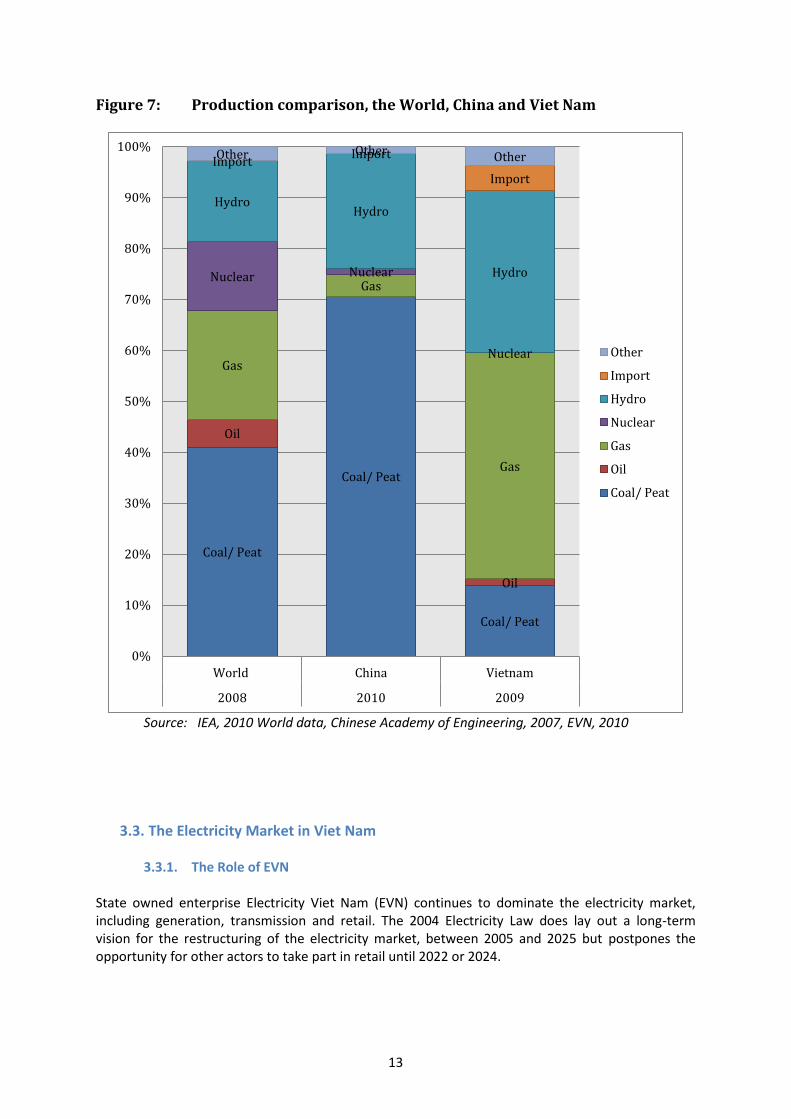
The key milestones include30:
2005 to 2014: the establishment of a competitive Generation market.
2014 to 2022: the establishment of a competitive Wholesale market
2022 to 2024: the establishment of a competitive Retail market
Figure 8: Viet Nam’s Electricity Market Structure
EVN’s control over the electricity generation market has eroded considerably in the last decade and is sure to decline even more over the next few years as Vinacomin and PetroVietnam expand their investment. While the role of these two economic groups may be growing in the electricity market it is unclear if they will favour further changes within the current structure for electricity despite some conflicts with EVN over pricing as well as claiming losses in electricity production. As their position strengthens they may begin to put pressure on EVN and MoIT to improve the pricing system in order to ensure they cover their costs as well as make a profit. Alternatively, they may prefer to continue to blame “losses” on the pricing structure and EVN and bow to pressure from the central government that the electricity pricing system should remain below production cost for the time being. While Viet Nam’s electricity production has risen on average by 13.82% between 2000 and 2009, EVN’s own production figures show that much of this growth was from non-EVN actors. Analysis of EVN’s figures show that non-EVN production has grown by 49.50% on average annually between 2000 and 2009, though this is mostly from the development of gas electricity production. EVN’s production growth has been steady at around 10%.31
30
2006 Electricity Law
31 EVN production data, 2011
GENERATION (2009)
TRANSMISSION, SCHEDULING AND DISPATCHING
DISTRIBUTION AND RETAIL
BOTs and IPPS
(33%)
Power Plants under EVN
(67%)
National Load
Dispatch Center (SMO)
National Power
Transmission
Corporation (TNO)
Electric Power Trading
Company (SB)
Power Companies
(11 PCs)
EVN
15
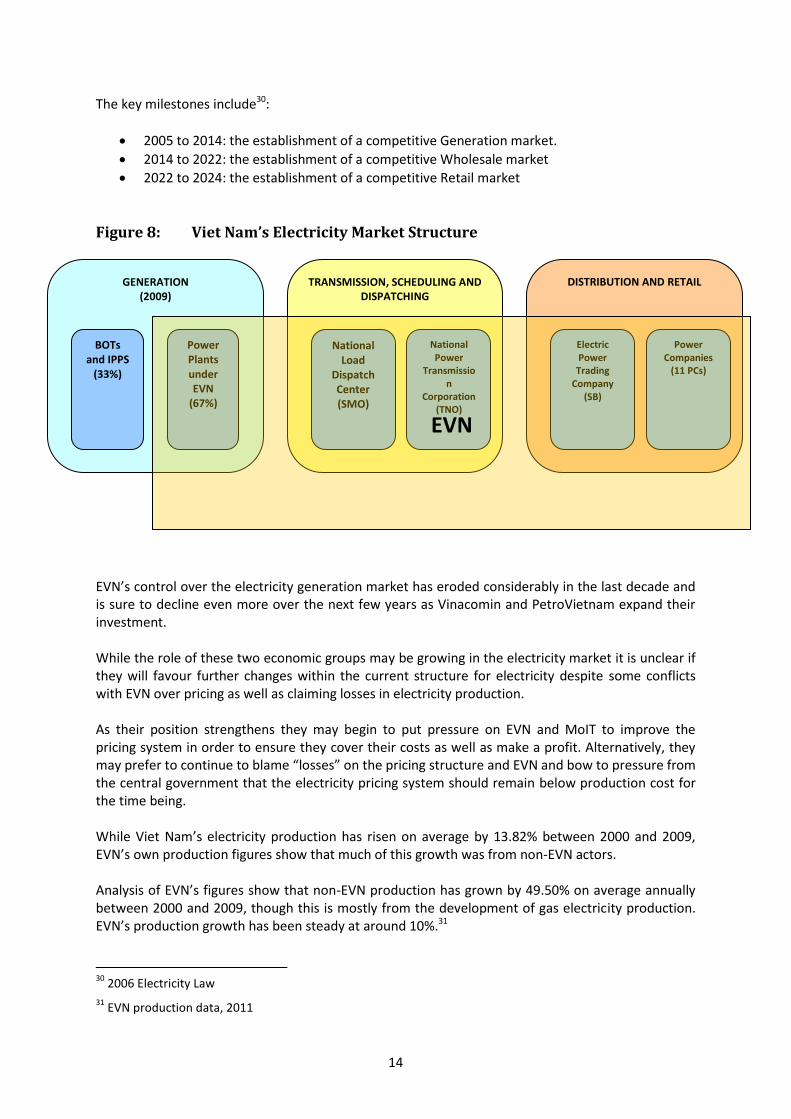
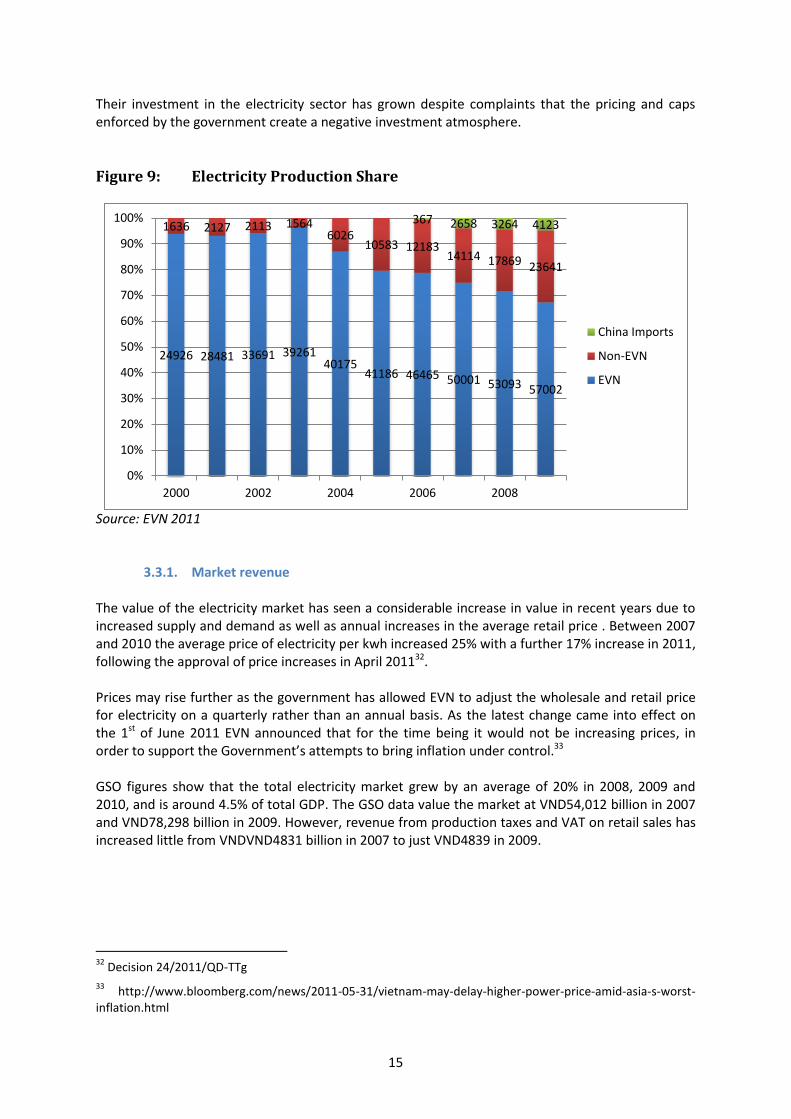
Their investment in the electricity sector has grown despite complaints that the pricing and caps enforced by the government create a negative investment atmosphere.
Figure 9: Electricity Production Share
Source: EVN 2011
3.3.1. Market revenue The value of the electricity market has seen a considerable increase in value in recent years due to increased supply and demand as well as annual increases in the average retail price . Between 2007 and 2010 the average price of electricity per kwh increased 25% with a further 17% increase in 2011, following the approval of price increases in April 201132. Prices may rise further as the government has allowed EVN to adjust the wholesale and retail price for electricity on a quarterly rather than an annual basis. As the latest change came into effect on the 1st of June 2011 EVN announced that for the time being it would not be increasing prices, in order to support the Government’s attempts to bring inflation under control.33 GSO figures show that the total electricity market grew by an average of 20% in 2008, 2009 and 2010, and is around 4.5% of total GDP. The GSO data value the market at VND54,012 billion in 2007 and VND78,298 billion in 2009. However, revenue from production taxes and VAT on retail sales has increased little from VNDVND4831 billion in 2007 to just VND4839 in 2009.
32
Decision 24/2011/QD-TTg
33 http://www.bloomberg.com/news/2011-05-31/vietnam-may-delay-higher-power-price-amid-asia-s-worst-
inflation.html
24926 28481 33691 39261 40175
41186 46465 50001 53093 57002
1636 2127 2113 1564 6026
10583 12183 14114 17869 23641
367 2658 3264 4123
0%
10%
20%
30%
40%
50%
60%
70%
80%
90%
100%
2000 2002 2004 2006 2008
China Imports
Non-EVN
EVN
16
Table 4: Market value and tax revenues, 2007 to 2010
Value in VND Billion 2007 2008 2009
Taxes from electricity production 3,983 5,221 3,746
VAT from Retail sales 848 953 1,093
Growth in revenues and taxes % %
Market value 16.93 23.98
Taxes from electricity production 31.09 -28.26
VAT from Retail sales 12.46 14.64
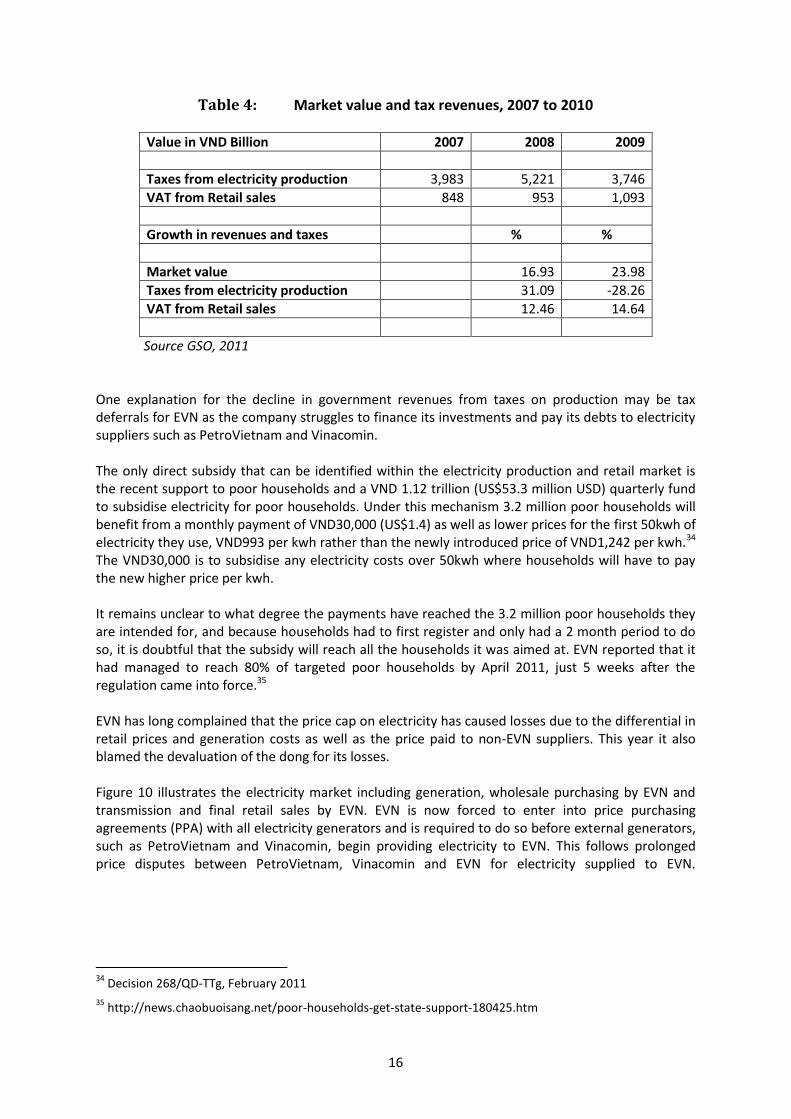
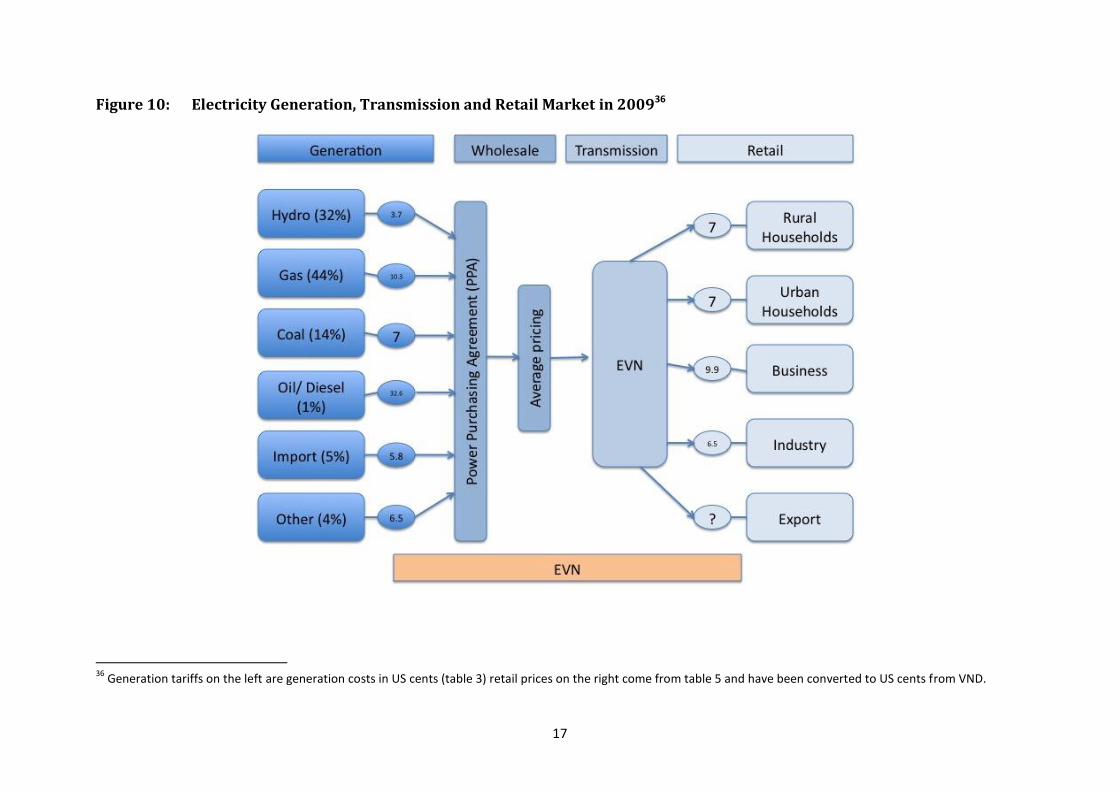
Source GSO, 2011 One explanation for the decline in government revenues from taxes on production may be tax deferrals for EVN as the company struggles to finance its investments and pay its debts to electricity suppliers such as PetroVietnam and Vinacomin. The only direct subsidy that can be identified within the electricity production and retail market is the recent support to poor households and a VND 1.12 trillion (US$53.3 million USD) quarterly fund to subsidise electricity for poor households. Under this mechanism 3.2 million poor households will benefit from a monthly payment of VND30,000 (US$1.4) as well as lower prices for the first 50kwh of electricity they use, VND993 per kwh rather than the newly introduced price of VND1,242 per kwh.34 The VND30,000 is to subsidise any electricity costs over 50kwh where households will have to pay the new higher price per kwh. It remains unclear to what degree the payments have reached the 3.2 million poor households they are intended for, and because households had to first register and only had a 2 month period to do so, it is doubtful that the subsidy will reach all the households it was aimed at. EVN reported that it had managed to reach 80% of targeted poor households by April 2011, just 5 weeks after the regulation came into force.35 EVN has long complained that the price cap on electricity has caused losses due to the differential in retail prices and generation costs as well as the price paid to non-EVN suppliers. This year it also blamed the devaluation of the dong for its losses. Figure 10 illustrates the electricity market including generation, wholesale purchasing by EVN and transmission and final retail sales by EVN. EVN is now forced to enter into price purchasing agreements (PPA) with all electricity generators and is required to do so before external generators, such as PetroVietnam and Vinacomin, begin providing electricity to EVN. This follows prolonged price disputes between PetroVietnam, Vinacomin and EVN for electricity supplied to EVN.
34
Decision 268/QD-TTg, February 2011
35 http://news.chaobuoisang.net/poor-households-get-state-support-180425.htm
17
Figure 10: Electricity Generation, Transmission and Retail Market in 200936
36
Generation tariffs on the left are generation costs in US cents (table 3) retail prices on the right come from table 5 and have been converted to US cents from VND.
18
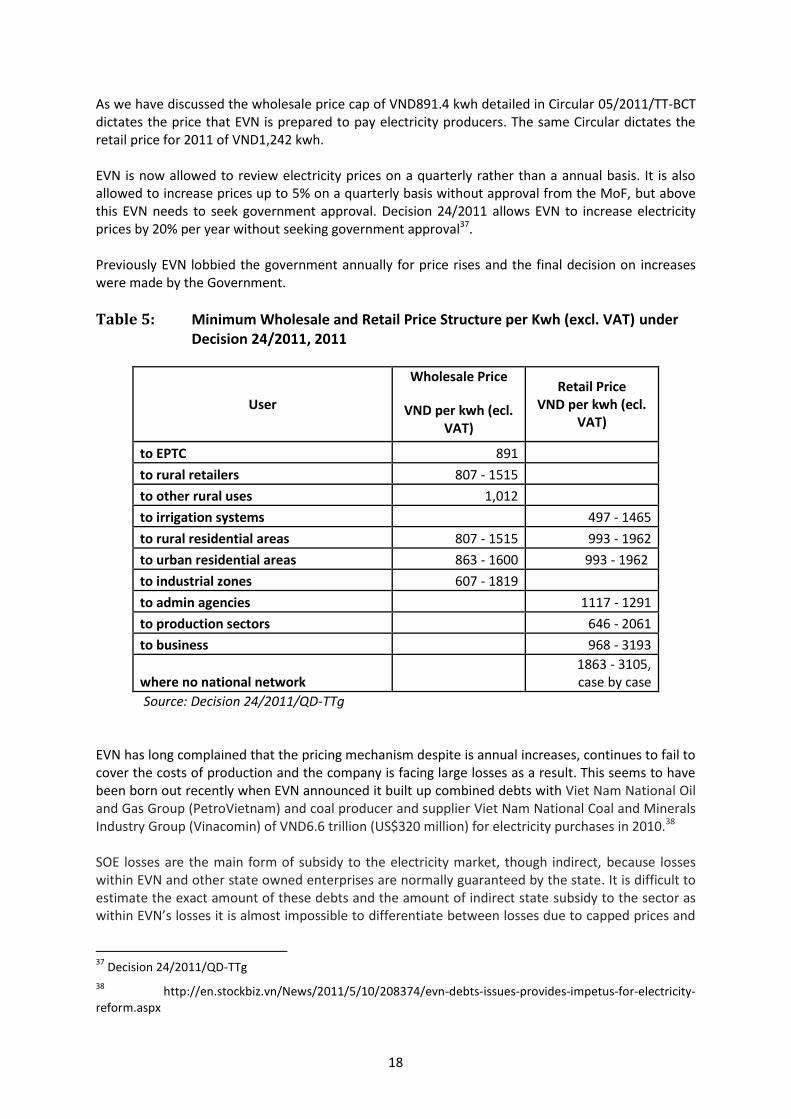
As we have discussed the wholesale price cap of VND891.4 kwh detailed in Circular 05/2011/TT-BCT dictates the price that EVN is prepared to pay electricity producers. The same Circular dictates the retail price for 2011 of VND1,242 kwh. EVN is now allowed to review electricity prices on a quarterly rather than a annual basis. It is also allowed to increase prices up to 5% on a quarterly basis without approval from the MoF, but above this EVN needs to seek government approval. Decision 24/2011 allows EVN to increase electricity prices by 20% per year without seeking government approval37. Previously EVN lobbied the government annually for price rises and the final decision on increases were made by the Government.
Table 5: Minimum Wholesale and Retail Price Structure per Kwh (excl. VAT) under Decision 24/2011, 2011
User
Wholesale Price
VND per kwh (ecl. VAT)
Retail Price VND per kwh (ecl.
VAT)
to EPTC 891
to rural retailers 807 - 1515
to other rural uses 1,012
to irrigation systems 497 - 1465
to rural residential areas 807 - 1515 993 - 1962
to urban residential areas 863 - 1600 993 - 1962
to industrial zones 607 - 1819
to admin agencies 1117 - 1291
to production sectors 646 - 2061
to business 968 - 3193
where no national network 1863 - 3105, case by case
Source: Decision 24/2011/QD-TTg EVN has long complained that the pricing mechanism despite is annual increases, continues to fail to cover the costs of production and the company is facing large losses as a result. This seems to have been born out recently when EVN announced it built up combined debts with Viet Nam National Oil and Gas Group (PetroVietnam) and coal producer and supplier Viet Nam National Coal and Minerals Industry Group (Vinacomin) of VND6.6 trillion (US$320 million) for electricity purchases in 2010.38 SOE losses are the main form of subsidy to the electricity market, though indirect, because losses within EVN and other state owned enterprises are normally guaranteed by the state. It is difficult to estimate the exact amount of these debts and the amount of indirect state subsidy to the sector as within EVN’s losses it is almost impossible to differentiate between losses due to capped prices and
37
Decision 24/2011/QD-TTg
38 http://en.stockbiz.vn/News/2011/5/10/208374/evn-debts-issues-provides-impetus-for-electricity-
reform.aspx
19
the structure of the electricity market and inefficiencies in EVN’s management, poor investment and operating decisions. This form of subsidy, allowing losses by a company does not clearly fall within the OECD framework introduced in section 1.3. Enterprise losses may fall most closely into category a. of direct financial transfers to producers and soft loans, as losses will ultimately be covered by the Government (see section1.3). However, the below market price for electricity also acts as an indirect transfer to consumers. One way to identify to what degree Viet Nam’s pricing structure is causing losses is to compare Viet Nam’s electricity prices with other countries in the region or a regional average. This helps identify some losses (and gains) in the market due to the pricing structure as well as state revenue losses (or gains) due to a below region pricing structure. This is however, just indicative and may not correctly reflect losses (or gains) due to the current price cap structure as other countries in the region may have considerably different power generation source structures (hydro, gas, coal, oil etc.), which in turn allow countries to charge higher or lower prices than Viet Nam. At the same time the region has a varied level of competition in the electricity sector, which will also affect prices.
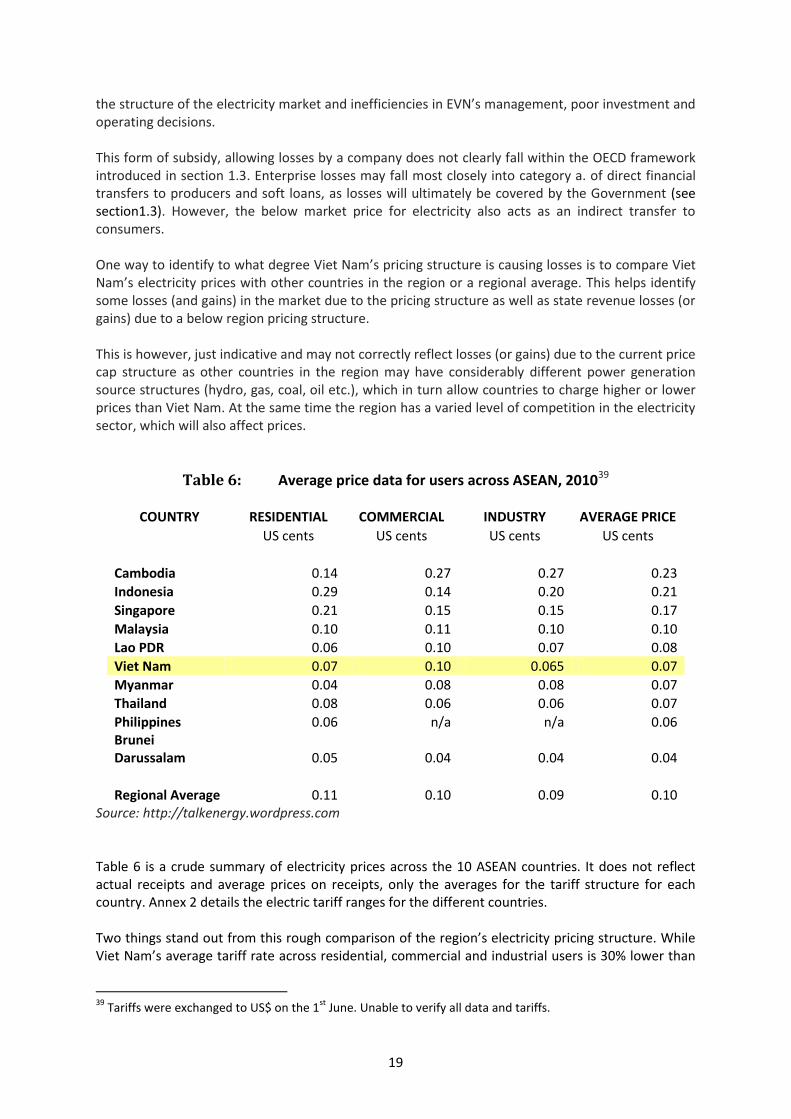
Table 6: Average price data for users across ASEAN, 201039
COUNTRY RESIDENTIAL COMMERCIAL INDUSTRY AVERAGE PRICE
US cents US cents US cents US cents
Cambodia 0.14 0.27 0.27 0.23
Indonesia 0.29 0.14 0.20 0.21
Singapore 0.21 0.15 0.15 0.17
Malaysia 0.10 0.11 0.10 0.10
Lao PDR 0.06 0.10 0.07 0.08
Viet Nam 0.07 0.10 0.065 0.07
Myanmar 0.04 0.08 0.08 0.07
Thailand 0.08 0.06 0.06 0.07
Philippines 0.06 n/a n/a 0.06 Brunei Darussalam 0.05 0.04 0.04 0.04
Regional Average 0.11 0.10 0.09 0.10 Source: http://talkenergy.wordpress.com Table 6 is a crude summary of electricity prices across the 10 ASEAN countries. It does not reflect actual receipts and average prices on receipts, only the averages for the tariff structure for each country. Annex 2 details the electric tariff ranges for the different countries. Two things stand out from this rough comparison of the region’s electricity pricing structure. While Viet Nam’s average tariff rate across residential, commercial and industrial users is 30% lower than
39
Tariffs were exchanged to US$ on the 1st
June. Unable to verify all data and tariffs.
20
the regional average it is in line with several comparator countries, namely Thailand and the Philippines. The comparison also shows that residential tariffs are 65% of the regional average less than those in Thailand and Malaysia but higher than those in the Philippines. Industrial tariffs show a similar pattern and amount to 72% of the regional average tariff and is lower than rates in Indonesia and Malaysia but still higher than those in Thailand. A move in pricing towards the regional average, as is generally happening, would expand the market as a whole and also provide higher revenues for the government, and it would attract investment into the electricity sector.
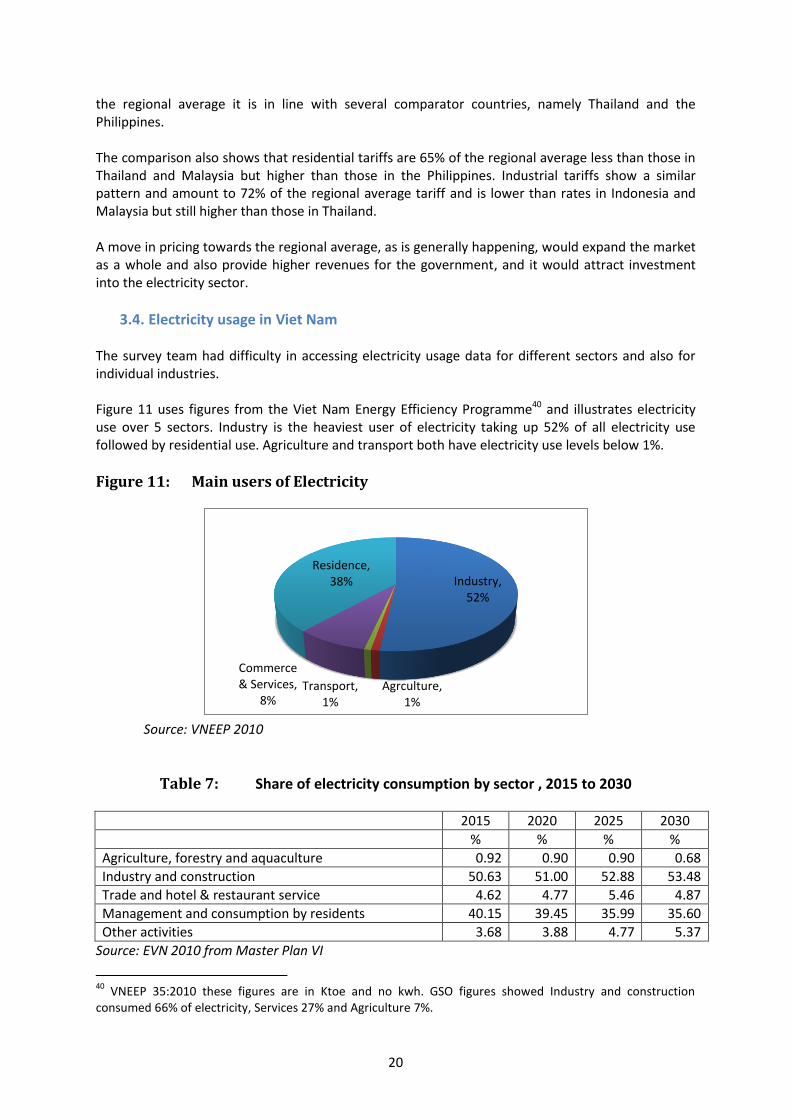
3.4. Electricity usage in Viet Nam The survey team had difficulty in accessing electricity usage data for different sectors and also for individual industries. Figure 11 uses figures from the Viet Nam Energy Efficiency Programme40 and illustrates electricity use over 5 sectors. Industry is the heaviest user of electricity taking up 52% of all electricity use followed by residential use. Agriculture and transport both have electricity use levels below 1%.
Figure 11: Main users of Electricity
Source: VNEEP 2010
Table 7: Share of electricity consumption by sector , 2015 to 2030
2015 2020 2025 2030
% % % %
Agriculture, forestry and aquaculture 0.92 0.90 0.90 0.68
Industry and construction 50.63 51.00 52.88 53.48
Trade and hotel & restaurant service 4.62 4.77 5.46 4.87
Management and consumption by residents 40.15 39.45 35.99 35.60
Other activities 3.68 3.88 4.77 5.37
Source: EVN 2010 from Master Plan VI
40
VNEEP 35:2010 these figures are in Ktoe and no kwh. GSO figures showed Industry and construction consumed 66% of electricity, Services 27% and Agriculture 7%.
Industry, 52%
Agrculture, 1%
Transport, 1%
Commerce & Services,
8%
Residence, 38%
21
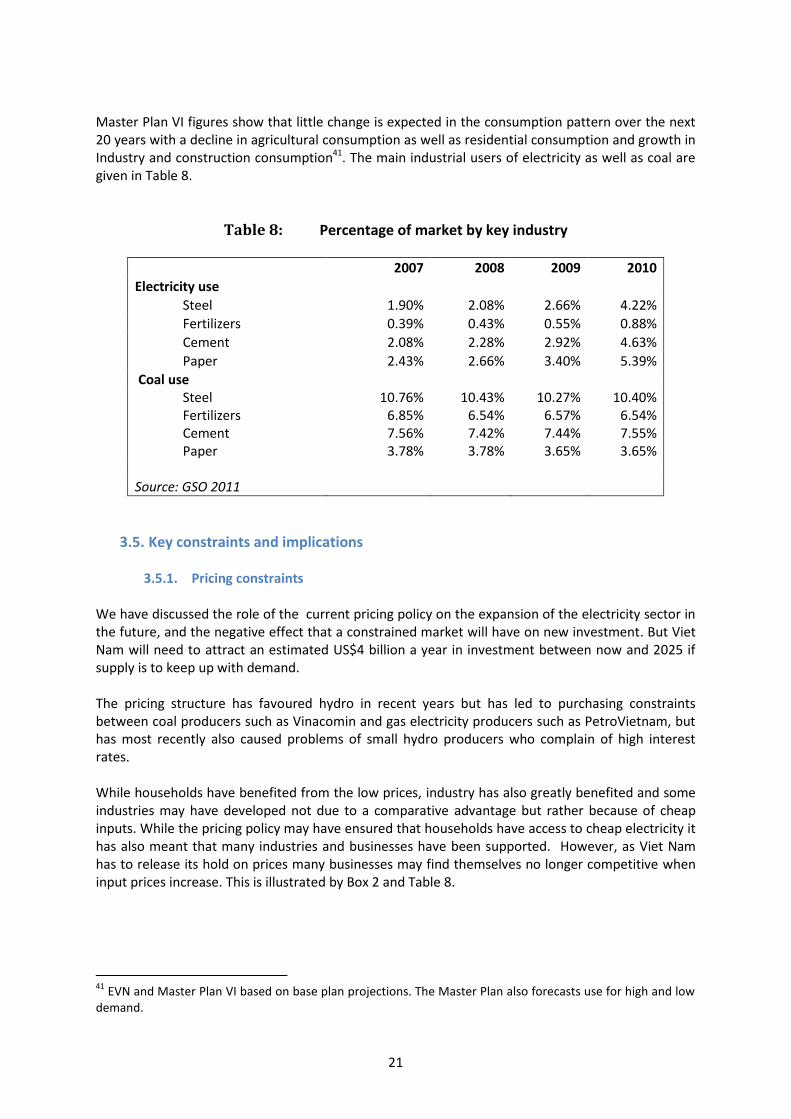
Master Plan VI figures show that little change is expected in the consumption pattern over the next 20 years with a decline in agricultural consumption as well as residential consumption and growth in Industry and construction consumption41. The main industrial users of electricity as well as coal are given in Table 8.
Table 8: Percentage of market by key industry
2007 2008 2009 2010
Electricity use
Steel 1.90% 2.08% 2.66% 4.22%
Fertilizers 0.39% 0.43% 0.55% 0.88%
Cement 2.08% 2.28% 2.92% 4.63%
Paper 2.43% 2.66% 3.40% 5.39%
Coal use Steel 10.76% 10.43% 10.27% 10.40% Fertilizers 6.85% 6.54% 6.57% 6.54% Cement 7.56% 7.42% 7.44% 7.55% Paper 3.78% 3.78% 3.65% 3.65% Source: GSO 2011
3.5. Key constraints and implications
3.5.1. Pricing constraints We have discussed the role of the current pricing policy on the expansion of the electricity sector in the future, and the negative effect that a constrained market will have on new investment. But Viet Nam will need to attract an estimated US$4 billion a year in investment between now and 2025 if supply is to keep up with demand. The pricing structure has favoured hydro in recent years but has led to purchasing constraints between coal producers such as Vinacomin and gas electricity producers such as PetroVietnam, but has most recently also caused problems of small hydro producers who complain of high interest rates. While households have benefited from the low prices, industry has also greatly benefited and some industries may have developed not due to a comparative advantage but rather because of cheap inputs. While the pricing policy may have ensured that households have access to cheap electricity it has also meant that many industries and businesses have been supported. However, as Viet Nam has to release its hold on prices many businesses may find themselves no longer competitive when input prices increase. This is illustrated by Box 2 and Table 8.
41
EVN and Master Plan VI based on base plan projections. The Master Plan also forecasts use for high and low demand.
22
BOX 2: Subsidising Viet Nam‘s Steel Industry Many industries benefit from Viet Nam’s capped electricity pricing system, notably the cement, fertilizer, paper and steel industry that are using an increasingly large a share of electricity.42 The steel industry expanded hugely between 2009 and 2010 producing 9.2 million tons an increase of 33% and as a result an increase in the use of electricity in the sector. In 2010 the Steel industry consumed 4.67 billion kwh of electricity, 4.22% of total electricity produced for the year.43 The steel industry has increasingly had to pay market (export) prices for coal as does the cement industry, however they continue to benefit from low electricity prices, which is also a key input. A UNIDO study in 2010 found that Vietnamese steel manufacturers used coal for only 10% of their energy needs but relied on electricity for 64% of embodied energy. As a result recent increases in the price of coal for steel producers will have little impact on their production costs. However, any increase in the price of electricity will impact on their costs significantly, especially since recently key industries have increased their use of electricity drastically. It is clear that price caps in the electricity sector are an indirect subsidy to the steel industry, as well as other industries.44 One former vice minister of Ministry of Industry and Trade dismissed Viet Nam’s steel industry and said the country “did not export steel, it exported electricity” through the steel industry. Price increases may indeed have a high inflationary impact, especially for the construction sector, but they will also force these industries to begin to operate more competitively.
3.5.2. The Role of Coal While the role of the coal industry in electricity generation was small at 14% in 2009 the National Plan VI shows coal’s increasing role in power generation over the next 15 years, with coal set to take a leading role in electricity generation by 2020. However, the current coal export and pricing structure is causing Viet Nam’s mining monopoly some headaches. Viet Nam produced 43.7 million tonnes of coal in 2009, 25 million tonnes of which was exported. Viet Nam holds considerable deposits of Anthracite coal in Quang Ninh province as well as lower deposits of sub-bituminous coal in the Red River Delta. Viet Nam is currently a net exporter of coal through Vinacomin, who controls over 94% of the coal mining in the country. However, due to the growth in demand for coal in the power sector, as well as in industry (cement, chemicals, metallurgy and other industries) this export is expected to reduce considerably as Viet Nam moves to becoming a net importer of coal between 2012 and 2015. 42
GSO figures for the value of electricity sold show that the Steel, cement, fertilizer and paper industries consumed electricity worth VND4.7 trillion in 2009, 7% of all market receipts. By 2010 these four industries provided 15% of the market for electricity consuming VND14.24 trillion in electricity.
43 http://english.vietnamnet.vn/en/business/9035/mof-attempts-to-raise-export-tariffs-on-some-steel-products.html
44 UNIDO, 2010, “Energy and Resource Efficiency in the Vietnamese Steel Industry”
23
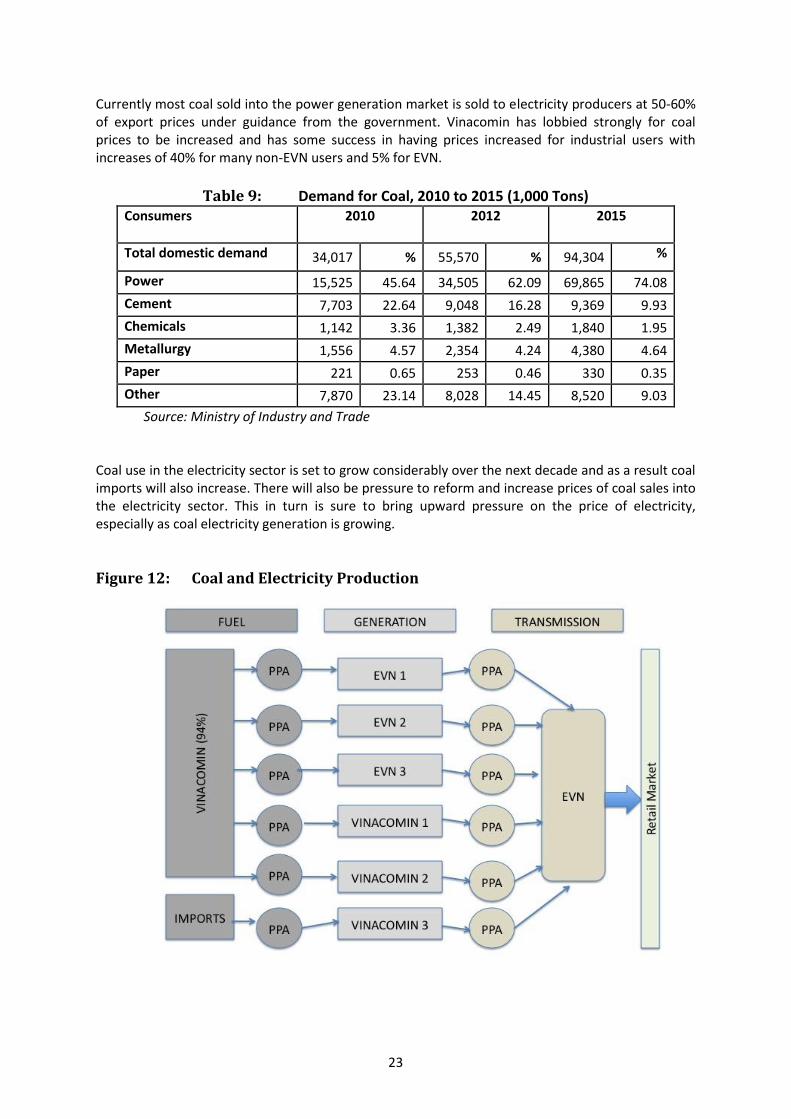
Currently most coal sold into the power generation market is sold to electricity producers at 50-60% of export prices under guidance from the government. Vinacomin has lobbied strongly for coal prices to be increased and has some success in having prices increased for industrial users with increases of 40% for many non-EVN users and 5% for EVN.
Table 9: Demand for Coal, 2010 to 2015 (1,000 Tons)
Consumers 2010
2012
2015
Total domestic demand 34,017 % 55,570 % 94,304 %
Power 15,525 45.64 34,505 62.09 69,865 74.08
Cement 7,703 22.64 9,048 16.28 9,369 9.93
Chemicals 1,142 3.36 1,382 2.49 1,840 1.95
Metallurgy 1,556 4.57 2,354 4.24 4,380 4.64
Paper 221 0.65 253 0.46 330 0.35
Other 7,870 23.14 8,028 14.45 8,520 9.03
Source: Ministry of Industry and Trade Coal use in the electricity sector is set to grow considerably over the next decade and as a result coal imports will also increase. There will also be pressure to reform and increase prices of coal sales into the electricity sector. This in turn is sure to bring upward pressure on the price of electricity, especially as coal electricity generation is growing.
Figure 12: Coal and Electricity Production
24
BOX 3: China’s Coal Conundrum China is currently suffering an electricity crisis due to its continued control of the pricing of electricity into the domestic and industrial market and its reliance on coal for electricity production. China relies on coal for 73% of its electricity production and the price of coal has been steadily rising as demand for electricity has grown across the country to power growth in industry and also a growing consumer market. Yet while coal prices are allowed to increase in line with domestic and import costs, electricity producers are forced to keep their prices in line with government guidelines. As a result electricity generators are suffering increasing financial losses as input price rise and retail prices remain steady. This is now hindering China’s economic growth as electricity generators and utility companies, the majority of whom are state owned, are showing increased displeasure at the situation and the fact that the Chinese Government is allowing them to accrue ever-increasing losses. Many electricity generators have decided to cut production rather than continue to incur ever-increasing losses. This is impacting industry across China as many factories are forced to cut production due to brown outs and black outs, and it is impacting commodity markets as far away as Australia who are suffering from a down turn in demand for coal as well as inputs such as copper and tin, used in China’s manufacturing industry. The obvious lesson is that the Vietnamese government should be careful in how it introduces competition into the electricity market and should ensure that input markets move at the same time. It is also a warning that input suppliers and producers can suffer losses for only so long and as Viet Nam’s demand for electricity grows so will the strength of those participants in the electricity sector.45 Despite China’s reliance on coal and its new position as the leading emitter of greenhouse gases it is also the world’s leading producer of renewable electricity producing 537 billion kilo watt hours in 2008. The United States produced 393 billion kwh in 2008.
45
http://www.nytimes.com/2011/05/25/business/energy-environment/25coal.html?_r=1&ref=china
25
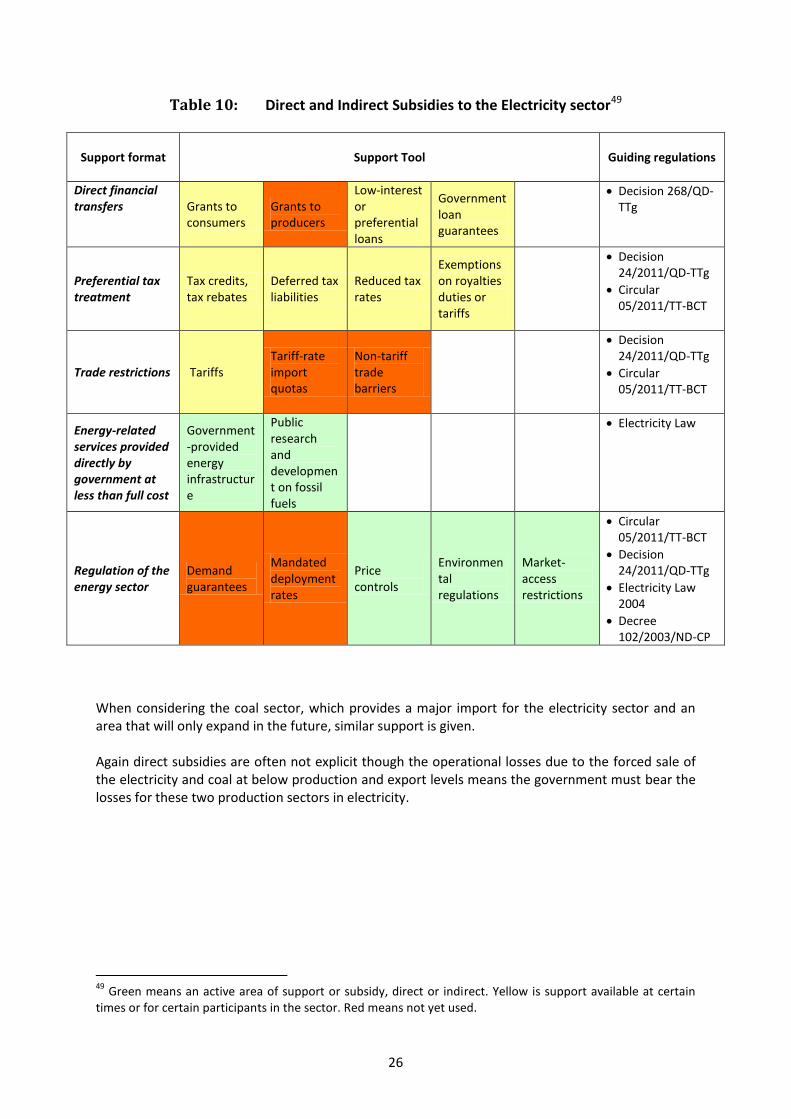
3.6. Electricity Fossil Fuel use Conclusion Table 10 illustrates the various direct and indirect subsidies that might be available in the electricity sector when using the OECD (2002) and the UNEP (2008) structure given in section 1.3. The electricity sector is key for the Vietnamese economy and society and several of the tools discussed below have been used at one time or another to support the electricity sector. However, the survey found few direct subsidies beyond the recent support to poor households due to price increases across the sector. Most subsidies are indirect subsidies and as a result are difficult to quantify. As we can see form table 10 there are in fact few direct subsidies to the electricity sector. Most support using the OECD/ UNEP approach is focused on infrastructure and research support as well as a regulated market with restricted access. Other areas of support are somewhat irregular and are taken as a given due to the nature of state owned participation in Viet Nam. As mentioned, the current subsidies for the poor are not a long-term measure. However, state owned enterprises such as EVN, PetroVietnam and Vinacomin benefit from priority access to finance as well preferential loans and loan rates, if not directly from the government then from many of their subsidiaries which include financing and banking. EVN is a key investor in An Binh Commercial Bank (AB Bank), with AB Bank stating in its Annual Report for 2010 that “AB BANK continuously developed new products to meet the highest demand of EVN, member entities, associate entities as well as power project contractors”.46 EVN also has a finance branch. PetroVietnam Finance is also a strategic shareholder in AB Bank. PetroVietnam owns a 20% stake in Ocean Bank and controls PetroVietnam Finance.47 Vinacomin doesn’t have a banking subsidiary but does have the Viet Nam National Coal and Mineral Industries Group (Vinacomin)'s Finance one-member Ltd Co (CMF). CMF and the Military Bank appear to have close connections.48 As we will see in the petroleum industry the government is ready to use tax deferrals to ensure a stable price in certain fossil fuels rather than to subsidise a particular sector. However, the loss of revenue could be considered a subsidy of sorts. Again, these losses taken by firms and covered by the Government are difficult to categorise under the OECD framework for subsidies but are likely to be resolved with direct financial transfers and low interest loans to producers (ref category a.; section 1.3). Other areas are not being used at the moment and are also not currently given any consideration within the current regulatory framework. However, as we have seen with support for the poor as well as the change to quarterly electricity pricing, the Government is not adverse to make ad hoc changes to the regulatory framework of the electricity sector and therefore may consider these areas at some moment in the future.
46
http://www.abbank.vn/Upload/file/thongtincodong/bieumau/ABBANK_BCTN_2010_TiengAnh.pdf
47 http://www.vnstocknews.com/2008/10/petrovietnam-buys-20-pct-in-ocean-bank.html
48 http://www.vnstocknews.com/2009/08/military-bank-signs-comprehensive.html
26
Table 10: Direct and Indirect Subsidies to the Electricity sector49
Support format Support Tool Guiding regulations
Direct financial transfers Grants to
consumers Grants to producers
Low-interest or preferential loans
Government loan guarantees
Decision 268/QD-TTg
Preferential tax treatment
Tax credits, tax rebates
Deferred tax liabilities
Reduced tax rates
Exemptions on royalties duties or tariffs
Decision 24/2011/QD-TTg
Circular 05/2011/TT-BCT
Trade restrictions Tariffs Tariff-rate import quotas
Non-tariff trade barriers
Decision 24/2011/QD-TTg
Circular 05/2011/TT-BCT
Energy-related services provided directly by government at less than full cost
Government-provided energy infrastructure
Public research and development on fossil fuels
Electricity Law
Regulation of the energy sector
Demand guarantees
Mandated deployment rates
Price controls
Environmental regulations
Market-access restrictions
Circular 05/2011/TT-BCT
Decision 24/2011/QD-TTg
Electricity Law 2004
Decree 102/2003/ND-CP
When considering the coal sector, which provides a major import for the electricity sector and an area that will only expand in the future, similar support is given. Again direct subsidies are often not explicit though the operational losses due to the forced sale of the electricity and coal at below production and export levels means the government must bear the losses for these two production sectors in electricity.
49
Green means an active area of support or subsidy, direct or indirect. Yellow is support available at certain times or for certain participants in the sector. Red means not yet used.
27
4. Refined Petroleum market Despite the large growth in demand for fossil fuels for electricity in Viet Nam over the last decades figure 1 in section 2 shows that petroleum products continue to be one of the leading providers of energy in Viet Nam, accounting for 26.3% of energy supplies in 2008, slightly behind renewable energy. It is likely that petroleum products will have taken the lead today but figures were unavailable for this study.50 This section will look at the use of refined petroleum products in Viet Nam, including the share of use by different fuels (gasoline, diesel, kerosene etc) and their means of use (transportation, domestic transport, Air etc). Viet Nam has been very proactive in implementing increasingly market based pricing for refined petroleum products due to the growth in refined petroleum use as well as fluctuations in world market prices and Viet Nam’s lack of a refinery until 2009. However, the Government has attempted to influence the price of retail of refined petroleum through a stabilisation fund contributed to by enterprises in the retail petroleum market. The Government has also used tax and tariff waivers in order to ensure a low price and a reduced impact of rising global prices for refined products on inflation. However, this reduced Government revenues from refined petroleum, as we will see. This section will not look at oil production and exploration in Viet Nam beyond its relationship to Viet Nam’s first refinery (Dung Quat in Quang Ngai province, which opened in February 2009 and now satisfies around 30% of Vietnamese refined petroleum demand).
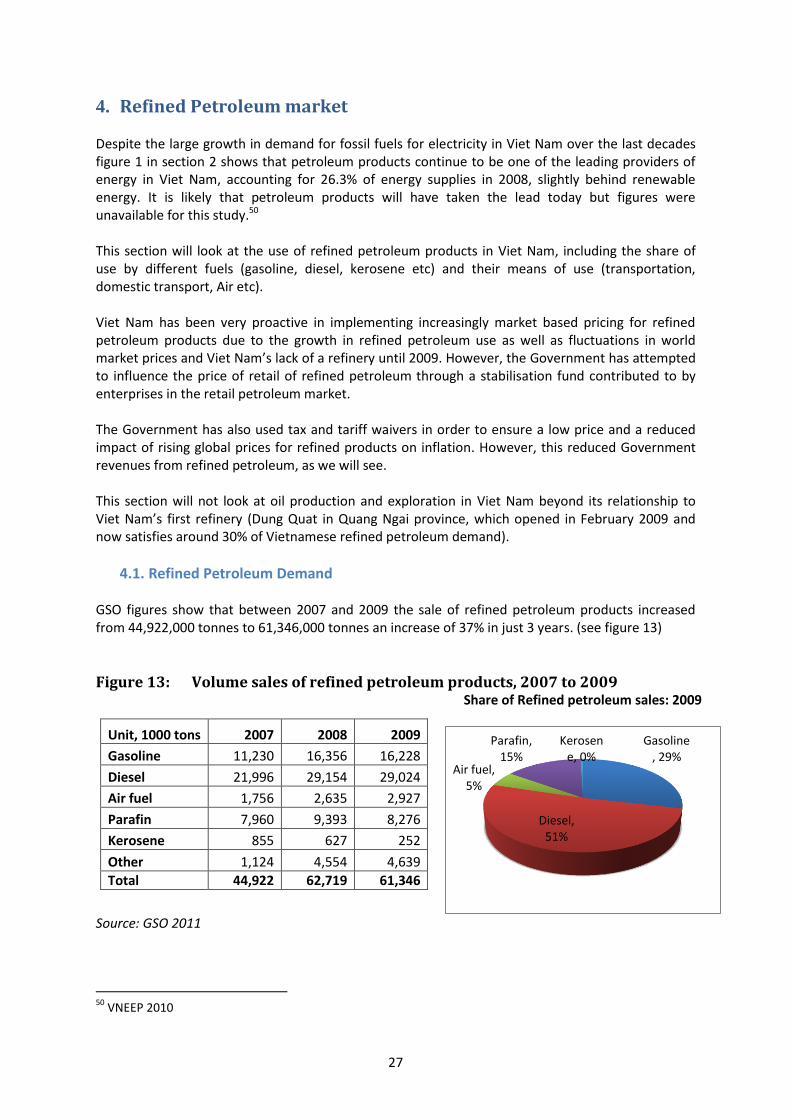
4.1. Refined Petroleum Demand GSO figures show that between 2007 and 2009 the sale of refined petroleum products increased from 44,922,000 tonnes to 61,346,000 tonnes an increase of 37% in just 3 years. (see figure 13)
Figure 13: Volume sales of refined petroleum products, 2007 to 2009
Unit, 1000 tons 2007 2008 2009
Gasoline 11,230 16,356 16,228
Diesel 21,996 29,154 29,024
Air fuel 1,756 2,635 2,927
Parafin 7,960 9,393 8,276
Kerosene 855 627 252
Other 1,124 4,554 4,639
Total 44,922 62,719 61,346
Share of Refined petroleum sales: 2009
Source: GSO 2011
50
VNEEP 2010
Gasoline, 29%
Diesel, 51%
Air fuel, 5%
Parafin, 15%
Kerosene, 0%
28
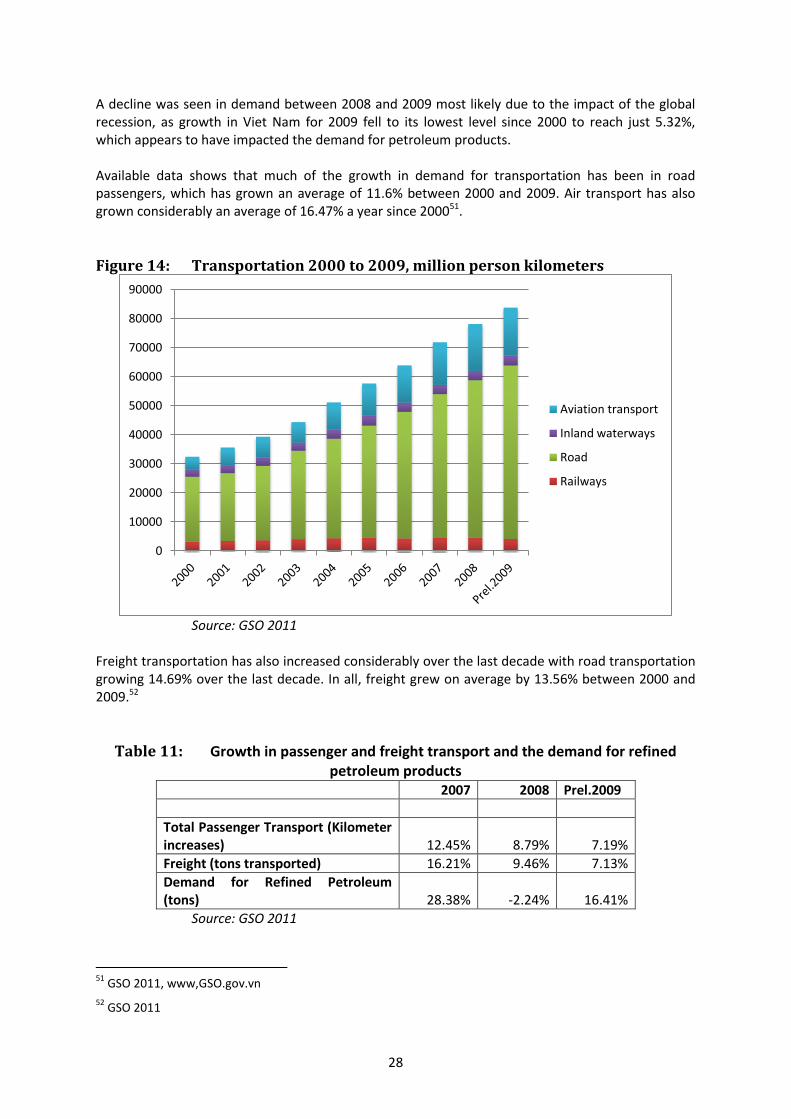
A decline was seen in demand between 2008 and 2009 most likely due to the impact of the global recession, as growth in Viet Nam for 2009 fell to its lowest level since 2000 to reach just 5.32%, which appears to have impacted the demand for petroleum products. Available data shows that much of the growth in demand for transportation has been in road passengers, which has grown an average of 11.6% between 2000 and 2009. Air transport has also grown considerably an average of 16.47% a year since 200051.
Figure 14: Transportation 2000 to 2009, million person kilometers
Source: GSO 2011 Freight transportation has also increased considerably over the last decade with road transportation growing 14.69% over the last decade. In all, freight grew on average by 13.56% between 2000 and 2009.52
Table 11: Growth in passenger and freight transport and the demand for refined petroleum products
2007 2008 Prel.2009
Total Passenger Transport (Kilometer increases) 12.45% 8.79% 7.19%
Freight (tons transported) 16.21% 9.46% 7.13%
Demand for Refined Petroleum (tons) 28.38% -2.24% 16.41%
Source: GSO 2011
51
GSO 2011, www,GSO.gov.vn
52 GSO 2011
0
10000
20000
30000
40000
50000
60000
70000
80000
90000
Aviation transport
Inland waterways
Road
Railways
29
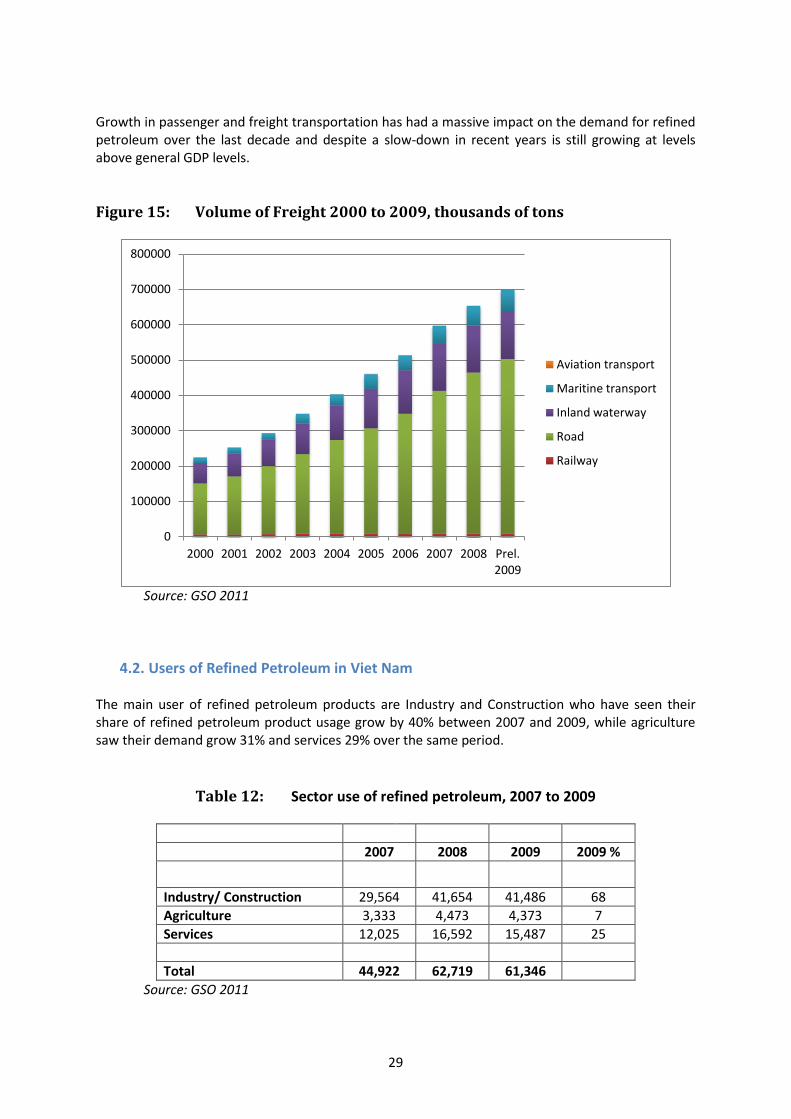
Growth in passenger and freight transportation has had a massive impact on the demand for refined petroleum over the last decade and despite a slow-down in recent years is still growing at levels above general GDP levels.
Figure 15: Volume of Freight 2000 to 2009, thousands of tons
Source: GSO 2011
4.2. Users of Refined Petroleum in Viet Nam The main user of refined petroleum products are Industry and Construction who have seen their share of refined petroleum product usage grow by 40% between 2007 and 2009, while agriculture saw their demand grow 31% and services 29% over the same period.
Table 12: Sector use of refined petroleum, 2007 to 2009
2007 2008 2009 2009 %
Industry/ Construction 29,564 41,654 41,486 68
Agriculture 3,333 4,473 4,373 7
Services 12,025 16,592 15,487 25
Total 44,922 62,719 61,346
Source: GSO 2011
0
100000
200000
300000
400000
500000
600000
700000
800000
2000 2001 2002 2003 2004 2005 2006 2007 2008 Prel. 2009
Aviation transport
Maritine transport
Inland waterway
Road
Railway
30
Urban users remain the main users of refined petroleum consuming 71% of refined petroleum products in 2009 and increasing their use by 42% over the 2007 to 2009 period from 30,693,000 tons in 2007 to 43,449,000 tons in 2009 while rural use has grown from 14,229,000 tons in 2007 to 17,346,000 tons in 2009. Looking at specific industries there has been little change in the structure of refined petroleum use between 2007 and 2009, with household use making up the majority of use (personal motorbikes and cars), followed by transportation and then logistics.
Table 13: Use of refined petroleum, 2007 to 2009
2007 2008 2009
1,000 tons % 1,000 tons % 1,000 tons %
Household (motorbikes and cars) 8,162 18.17 12,277 19.57 11,566 18.85
Transportation (bus/ train) 7,071 15.74 10,134 16.16 9,777 15.94
Logistics (lorries etc.) 3,303 7.35 4,662 7.43 4,869 7.94
Shipping 4,206 9.36 6,180 9.85 5,605 9.14
Airlines 7,483 16.66 10,403 16.59 10,420 16.99
Other 14,697 32.72 19,064 30.40 19,109 31.15
Units: 1000 tons 44,922 62,719 61,346 Source: GSO 2011
4.3. Refined Petroleum market structure As with the electricity sector and other sectors in Viet Nam, refined petroleum imports and retail sales are dominated by a state owned enterprise, the Viet Nam National Petroleum Corp (Petrolimex), as well as other state owned enterprises including the Military Petroleum Company and Saigon Petro (under Ho Chi Minh City People’s Committee). Until February 2009 all of Viet Nam’s refined petroleum products were imported and Viet Nam was a net exporter of crude oil. The completion of Dung Quat Oil refinery in February 2009 slowly brought a range of domestically produced refined petroleum products onto the market. A mixture of domestic Bac Ho sweet crude, Nam Rong-Doi Moi oil from Vietnamese fields as well as imported crude oil from Malaysia53. This is impacting on Viet Nam’s exports of crude oil and government revenues from exports54. The completion and full operation of Dung Quat refinery had no affect on the sale price of refined petroleum into the domestic market as from the outset Dung Quat was selling all production at global market prices. By 2008 Viet Nam became a net importer of oil by value though not in volume.
53
http://www.vneconomynews.com/2011/01/dung-quat-refinery-to-import-malaysia.html
54 http://www.intellasia.net/news/articles/resources/111288874.shtml
31
Figure 16: Import and Export of Petroleum products, 2003 to 2009
Source: GSO 2010
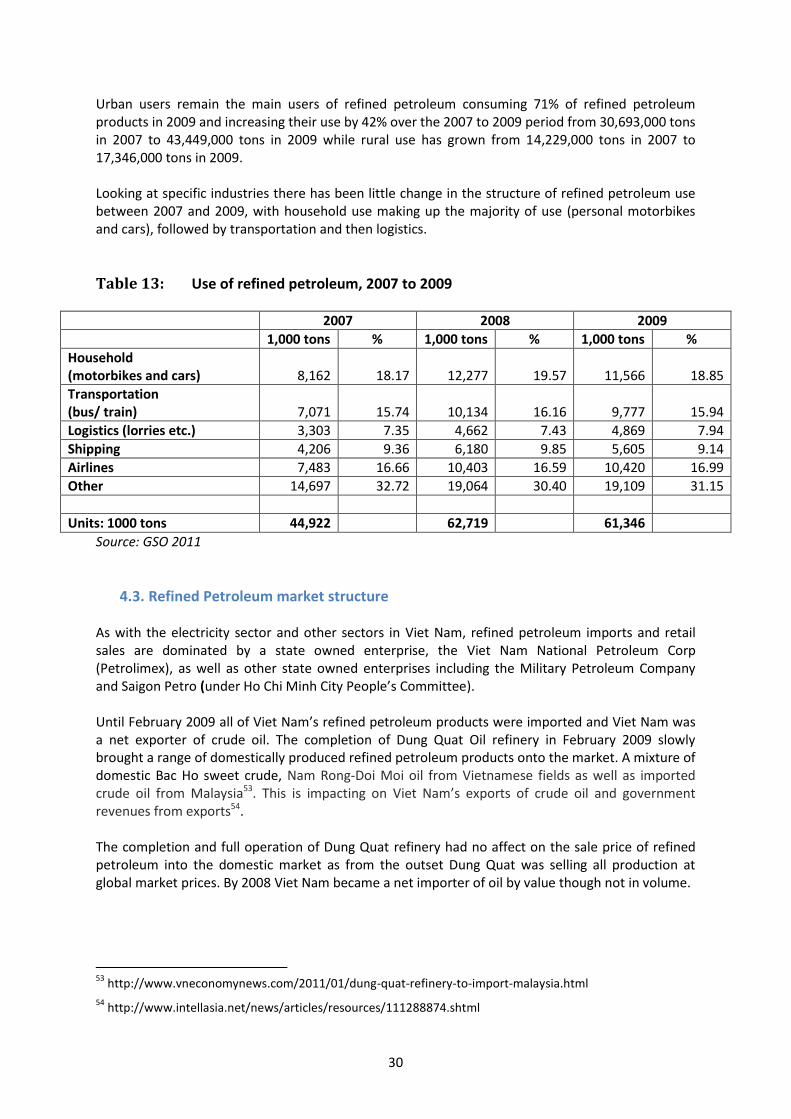
Petrolimex controls around 60% of all petroleum imports. From 2009 petroleum imports reduce as Vietnam’s first refinery, Dung Quat in Quang Ngai province came online and began production meeting 30% of Vietnam’s domestic demand. From 2009 Petrolimex held 41% of the refined petroleum retail market in 2009, according to GSO figures55, selling 30,420,000 tons in 2009. Saigon Petro holds 31% of the retail market with sales of 22,609,000 tons in 2009 and the Military Petroleum Company holds 25% with 18,302,000 tons56.
4.4. State Revenues Revenues from the petroleum sector steadily increased between 2007 and 2010 despite the reduction in sales for refined petroleum products during the 2008/2009 period (Table 14).
Table 14: Revenues from Petroleum, 2007 to 2009 Revenues in VND billions 2007 2008 2009
Value of taxes from petroleum sales 13,544 16,930 20,257
Value of VAT from petroleum retail sales 201 237 283
Import duties from petroleum 3,210 3,671 4,382
Total state revenue 16,955 20,838 24,922
Growth in revenues
Taxes from petroleum sales 20.00% 16.42%
VAT from petroleum retail sales 14.94% 16.43%
Import duties from petroleum 12.55% 16.22%
Source: GSO 2010 & 2011
55
BMI, Quarterly review 2011, puts Petrolimex’s market share at 51%
56 GSO 2011
0
5000
10000
15000
20000
25000
2003 2004 2005 2006 2007 2008 2009
Export value US$ million
Import value US$ million
Export tons (1,000)
Import tons (1,000)
32
Revenues from refined petroleum are considerably higher than those from electricity shown in table 5, reflecting both the desire for the government to keep electricity prices low and the difficulty in controlling the price of refined petroleum products . Total revenues from petroleum sales shown above amounted to VND24,922 billion in 2009 compared to VND4,839 billion for electricity illustrating the importance of oil taxes for government revenues. Import duties from petroleum are comparable to taxes from electricity production, however VAT from petroleum in 2009, VND283 billion, was considerably lower than that from electricity sales, VND1,093 billion.
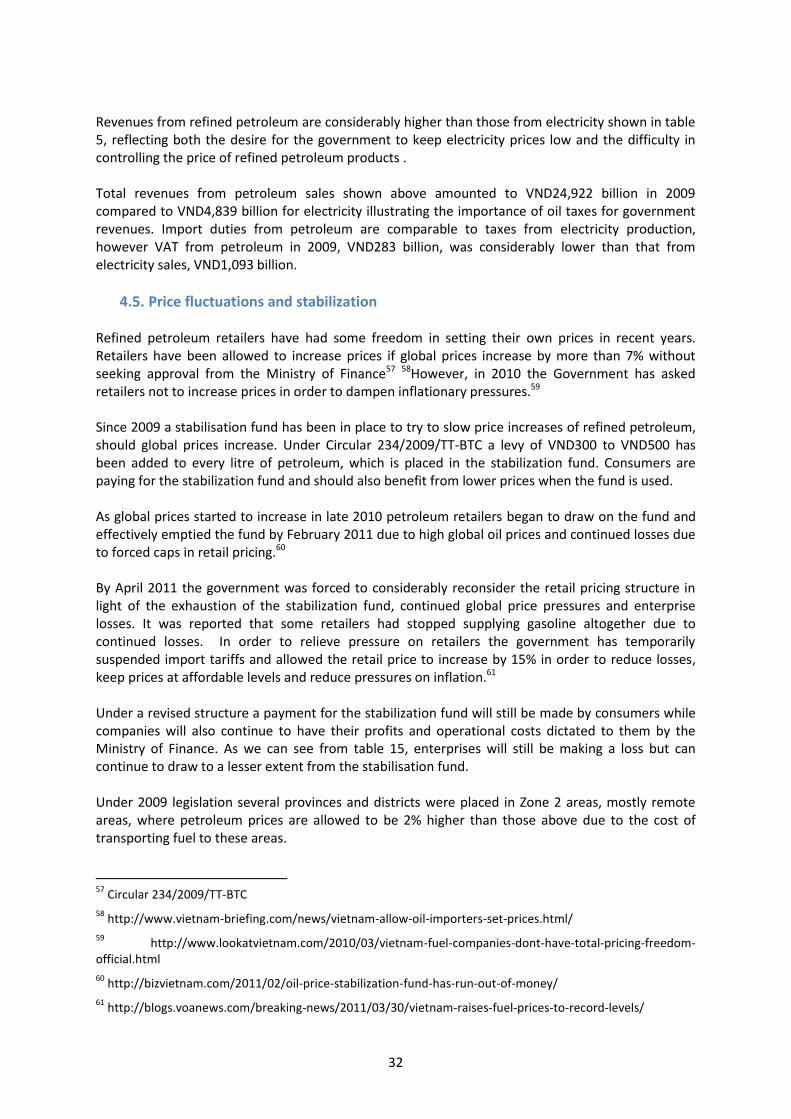
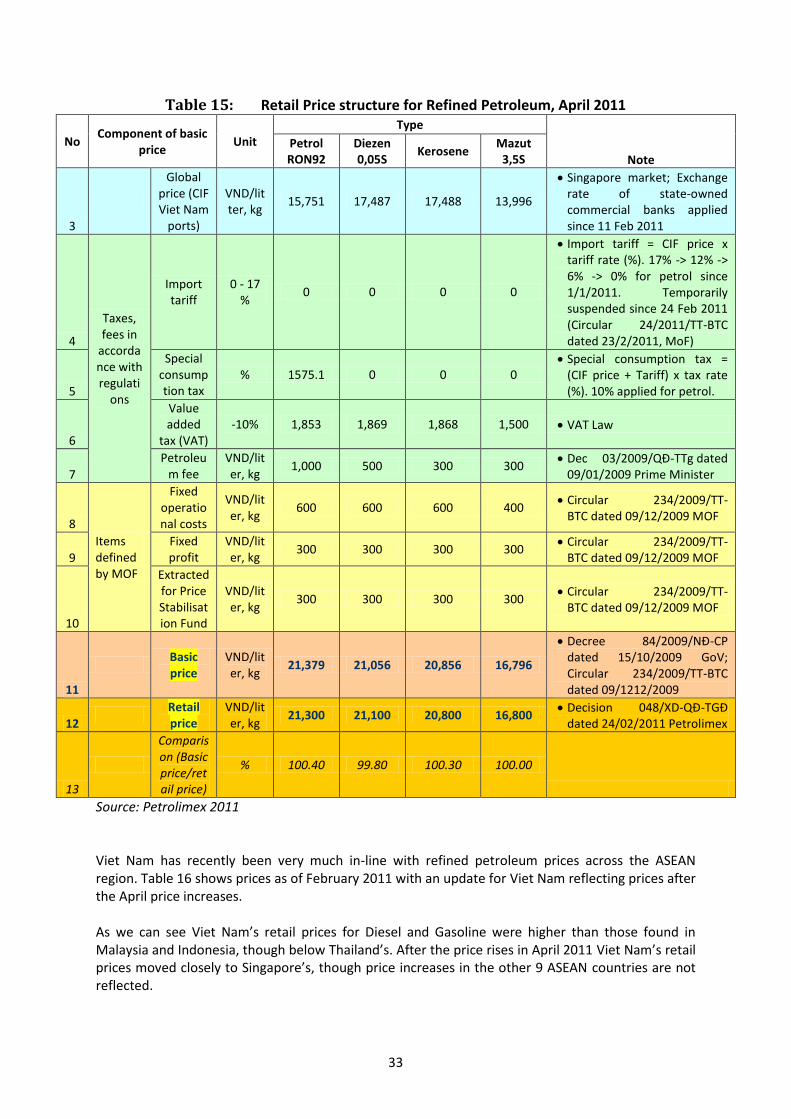
4.5. Price fluctuations and stabilization Refined petroleum retailers have had some freedom in setting their own prices in recent years. Retailers have been allowed to increase prices if global prices increase by more than 7% without seeking approval from the Ministry of Finance57 58However, in 2010 the Government has asked retailers not to increase prices in order to dampen inflationary pressures.59 Since 2009 a stabilisation fund has been in place to try to slow price increases of refined petroleum, should global prices increase. Under Circular 234/2009/TT-BTC a levy of VND300 to VND500 has been added to every litre of petroleum, which is placed in the stabilization fund. Consumers are paying for the stabilization fund and should also benefit from lower prices when the fund is used. As global prices started to increase in late 2010 petroleum retailers began to draw on the fund and effectively emptied the fund by February 2011 due to high global oil prices and continued losses due to forced caps in retail pricing.60 By April 2011 the government was forced to considerably reconsider the retail pricing structure in light of the exhaustion of the stabilization fund, continued global price pressures and enterprise losses. It was reported that some retailers had stopped supplying gasoline altogether due to continued losses. In order to relieve pressure on retailers the government has temporarily suspended import tariffs and allowed the retail price to increase by 15% in order to reduce losses, keep prices at affordable levels and reduce pressures on inflation.61 Under a revised structure a payment for the stabilization fund will still be made by consumers while companies will also continue to have their profits and operational costs dictated to them by the Ministry of Finance. As we can see from table 15, enterprises will still be making a loss but can continue to draw to a lesser extent from the stabilisation fund. Under 2009 legislation several provinces and districts were placed in Zone 2 areas, mostly remote areas, where petroleum prices are allowed to be 2% higher than those above due to the cost of transporting fuel to these areas.
57
Circular 234/2009/TT-BTC
58 http://www.vietnam-briefing.com/news/vietnam-allow-oil-importers-set-prices.html/
59 http://www.lookatvietnam.com/2010/03/vietnam-fuel-companies-dont-have-total-pricing-freedom-
official.html
60 http://bizvietnam.com/2011/02/oil-price-stabilization-fund-has-run-out-of-money/
61 http://blogs.voanews.com/breaking-news/2011/03/30/vietnam-raises-fuel-prices-to-record-levels/
33
Table 15: Retail Price structure for Refined Petroleum, April 2011
No Component of basic
price Unit
Type
Note
Petrol RON92
Diezen 0,05S
Kerosene Mazut
3,5S
3
Global price (CIF Viet Nam
ports)
VND/litter, kg
15,751 17,487 17,488 13,996
Singapore market; Exchange rate of state-owned commercial banks applied since 11 Feb 2011
4
Taxes, fees in
accordance with regulati
ons
Import tariff
0 - 17 %
0 0 0 0
Import tariff = CIF price x tariff rate (%). 17% -> 12% -> 6% -> 0% for petrol since 1/1/2011. Temporarily suspended since 24 Feb 2011 (Circular 24/2011/TT-BTC dated 23/2/2011, MoF)
5
Special consumption tax
% 1575.1 0 0 0 Special consumption tax =
(CIF price + Tariff) x tax rate (%). 10% applied for petrol.
6
Value added
tax (VAT) -10% 1,853 1,869 1,868 1,500 VAT Law
7
Petroleum fee
VND/liter, kg
1,000 500 300 300 Dec 03/2009/QĐ-TTg dated
09/01/2009 Prime Minister
8
Items defined by MOF
Fixed operational costs
VND/liter, kg
600 600 600 400 Circular 234/2009/TT-
BTC dated 09/12/2009 MOF
9
Fixed profit
VND/liter, kg
300 300 300 300 Circular 234/2009/TT-
BTC dated 09/12/2009 MOF
10
Extracted for Price Stabilisation Fund
VND/liter, kg
300 300 300 300 Circular 234/2009/TT-
BTC dated 09/12/2009 MOF
11
Basic price
VND/liter, kg
21,379 21,056 20,856 16,796
Decree 84/2009/NĐ-CP dated 15/10/2009 GoV; Circular 234/2009/TT-BTC dated 09/1212/2009
12
Retail price
VND/liter, kg
21,300 21,100 20,800 16,800 Decision 048/XD-QĐ-TGĐ
dated 24/02/2011 Petrolimex
13
Comparison (Basic price/retail price)
% 100.40 99.80 100.30 100.00
Source: Petrolimex 2011 Viet Nam has recently been very much in-line with refined petroleum prices across the ASEAN region. Table 16 shows prices as of February 2011 with an update for Viet Nam reflecting prices after the April price increases. As we can see Viet Nam’s retail prices for Diesel and Gasoline were higher than those found in Malaysia and Indonesia, though below Thailand’s. After the price rises in April 2011 Viet Nam’s retail prices moved closely to Singapore’s, though price increases in the other 9 ASEAN countries are not reflected.
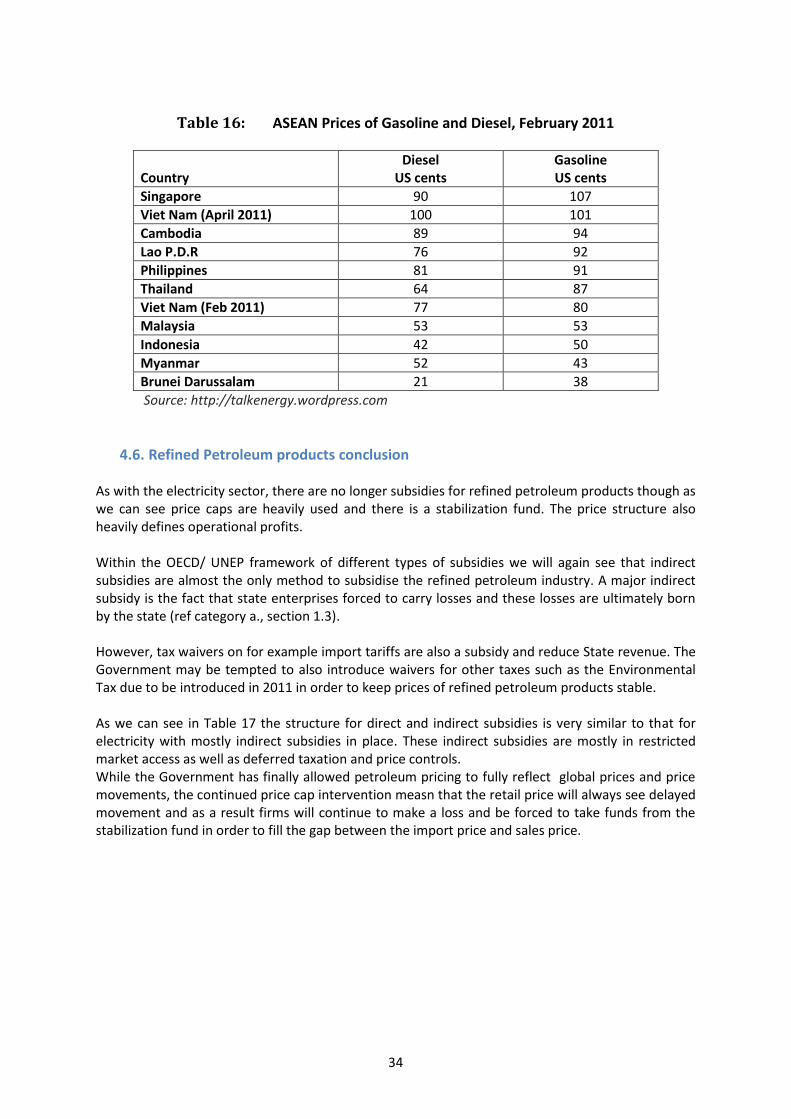
34
Table 16: ASEAN Prices of Gasoline and Diesel, February 2011
Country Diesel
US cents Gasoline US cents
Singapore 90 107
Viet Nam (April 2011) 100 101
Cambodia 89 94
Lao P.D.R 76 92
Philippines 81 91
Thailand 64 87
Viet Nam (Feb 2011) 77 80
Malaysia 53 53
Indonesia 42 50
Myanmar 52 43
Brunei Darussalam 21 38
Source: http://talkenergy.wordpress.com
4.6. Refined Petroleum products conclusion As with the electricity sector, there are no longer subsidies for refined petroleum products though as we can see price caps are heavily used and there is a stabilization fund. The price structure also heavily defines operational profits. Within the OECD/ UNEP framework of different types of subsidies we will again see that indirect subsidies are almost the only method to subsidise the refined petroleum industry. A major indirect subsidy is the fact that state enterprises forced to carry losses and these losses are ultimately born by the state (ref category a., section 1.3). However, tax waivers on for example import tariffs are also a subsidy and reduce State revenue. The Government may be tempted to also introduce waivers for other taxes such as the Environmental Tax due to be introduced in 2011 in order to keep prices of refined petroleum products stable. As we can see in Table 17 the structure for direct and indirect subsidies is very similar to that for electricity with mostly indirect subsidies in place. These indirect subsidies are mostly in restricted market access as well as deferred taxation and price controls. While the Government has finally allowed petroleum pricing to fully reflect global prices and price movements, the continued price cap intervention measn that the retail price will always see delayed movement and as a result firms will continue to make a loss and be forced to take funds from the stabilization fund in order to fill the gap between the import price and sales price.
35
Table 17: Direct and Indirect Subsidies to the Refined Petroleum Sector62
Subsidy format Subsidy Tool Guiding regulations
Direct financial transfers Grants to
consumers Grants to producers
Low-interest or preferential loans
Government loan guarantees
Preferential tax treatment Tax credits,
tax rebates Deferred tax liabilities
Reduced tax rates
Exemptions on royalties duties or tariffs
Decision 190/2010/TT-BTC
Trade restrictions
Tariffs Tariff-rate import quotas
Non-tariff trade barriers
Decision
190/2010/TT-BTC
Circular 234/2009/TT-BTC
Decree 100/2009/ND-CP
Circular
70/2009/TT-BTC
Energy-related services provided directly by government at less than full cost
Government-provided energy infrastructure
Public research and development on fossil fuels
Regulation of the energy sector
Demand guarantees
Mandated deployment rates
Price controls
Environmental regulations
Market-access restrictions
Circular 234/2009/TT-BTC
Decree 115/2009/ND-CP
Decree 100/2009/ND-CP
Decree 84/2009/ND-CP
Decision 78/2008/QD-BTC
It is also clear that the Government is willing to take a revenue loss from deferred taxes in order to keep some stability in the retail price. This is possible while Viet Nam benefits from export revenues during high global oil prices and as a result the Government will get increased revenues from oil exports. However, as Viet Nam imports more than it exports this Government revenue-benefit may be wiped out by losses due to tax deferrals.63
62
Green means subsidy, direct or indirect, normally in place, yellow is support available at certain times or for certain participants in the sector. Red means not yet in force.
63 At the time of finalizing this report some open discussion and dispute was reported between the Ministry of
Finance’s proposed price management and the Ministry of Trade and Industry, both of whom have a hand in the manage of the petroleum sector. MoF manages the price of petroleum and the stabilization fund while the MoIT manages supply of oil and oversees enterprises involved in the sector. http://english.vietnamnet.vn/en/business/13264/mof--moit-disagree-on-petrol-price-control.html
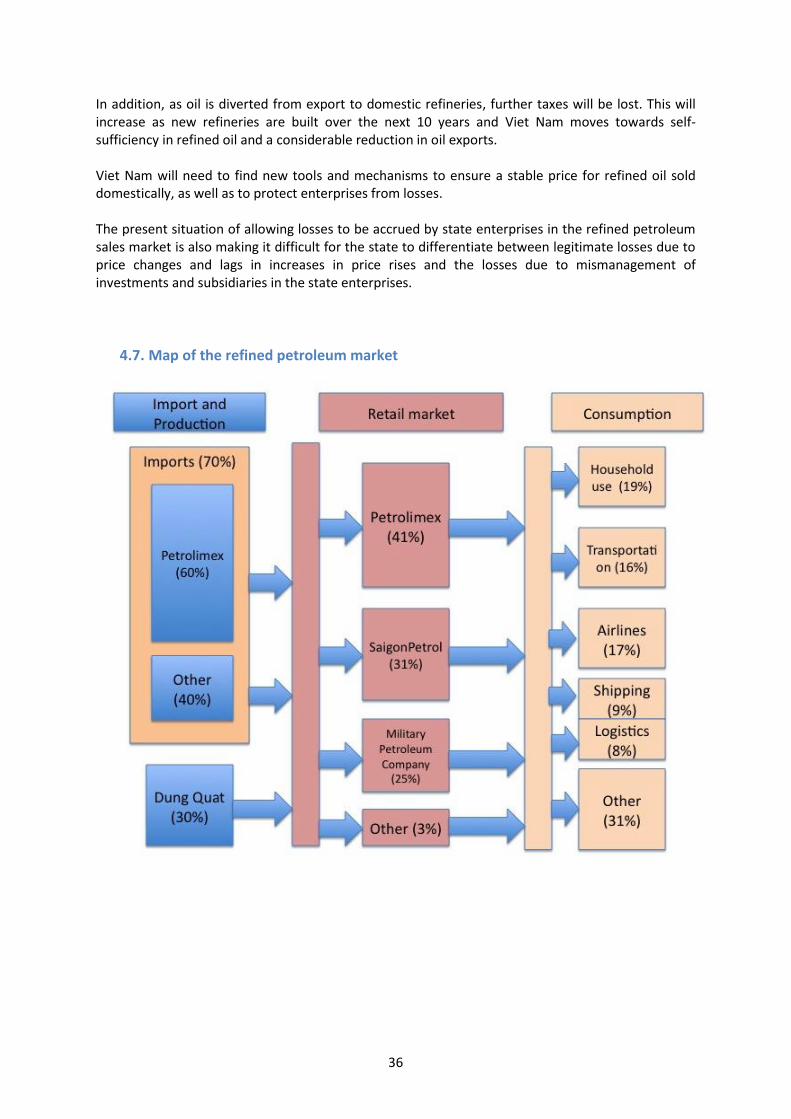
36
In addition, as oil is diverted from export to domestic refineries, further taxes will be lost. This will increase as new refineries are built over the next 10 years and Viet Nam moves towards self-sufficiency in refined oil and a considerable reduction in oil exports. Viet Nam will need to find new tools and mechanisms to ensure a stable price for refined oil sold domestically, as well as to protect enterprises from losses. The present situation of allowing losses to be accrued by state enterprises in the refined petroleum sales market is also making it difficult for the state to differentiate between legitimate losses due to price changes and lags in increases in price rises and the losses due to mismanagement of investments and subsidiaries in the state enterprises.
4.7. Map of the refined petroleum market
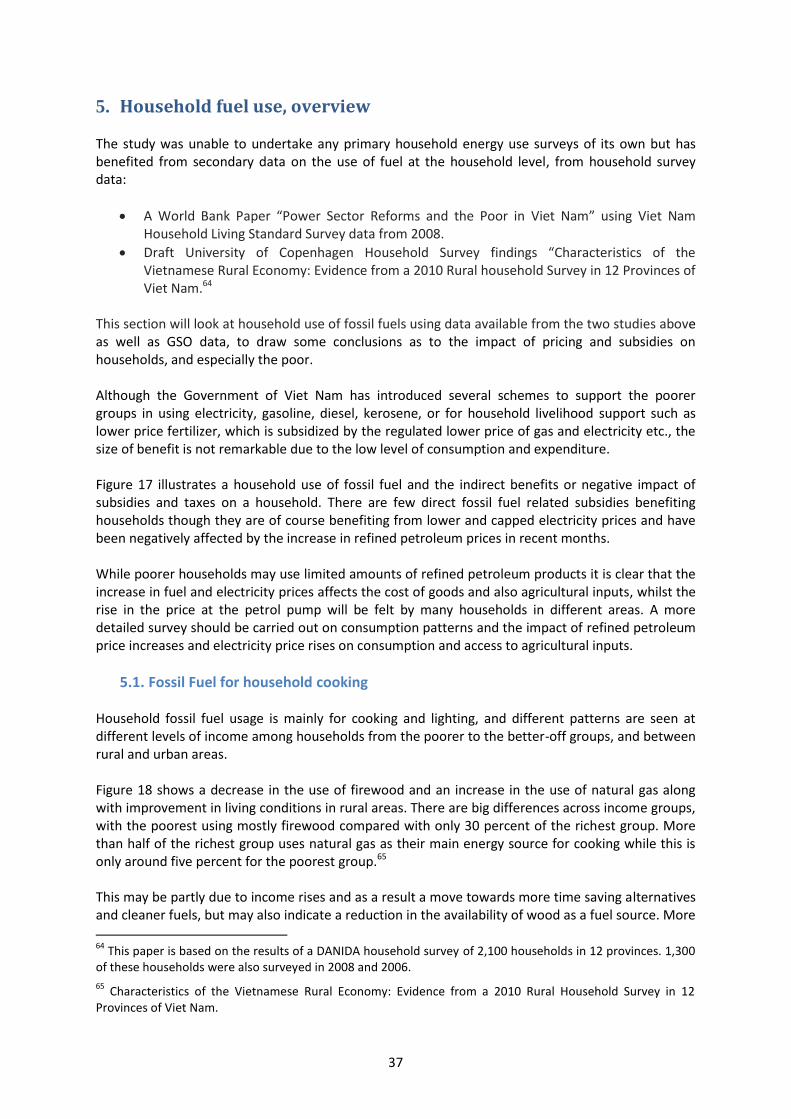
37
5. Household fuel use, overview The study was unable to undertake any primary household energy use surveys of its own but has benefited from secondary data on the use of fuel at the household level, from household survey data:
A World Bank Paper “Power Sector Reforms and the Poor in Viet Nam” using Viet Nam Household Living Standard Survey data from 2008.
Draft University of Copenhagen Household Survey findings “Characteristics of the Vietnamese Rural Economy: Evidence from a 2010 Rural household Survey in 12 Provinces of Viet Nam.64
This section will look at household use of fossil fuels using data available from the two studies above as well as GSO data, to draw some conclusions as to the impact of pricing and subsidies on households, and especially the poor. Although the Government of Viet Nam has introduced several schemes to support the poorer groups in using electricity, gasoline, diesel, kerosene, or for household livelihood support such as lower price fertilizer, which is subsidized by the regulated lower price of gas and electricity etc., the size of benefit is not remarkable due to the low level of consumption and expenditure. Figure 17 illustrates a household use of fossil fuel and the indirect benefits or negative impact of subsidies and taxes on a household. There are few direct fossil fuel related subsidies benefiting households though they are of course benefiting from lower and capped electricity prices and have been negatively affected by the increase in refined petroleum prices in recent months. While poorer households may use limited amounts of refined petroleum products it is clear that the increase in fuel and electricity prices affects the cost of goods and also agricultural inputs, whilst the rise in the price at the petrol pump will be felt by many households in different areas. A more detailed survey should be carried out on consumption patterns and the impact of refined petroleum price increases and electricity price rises on consumption and access to agricultural inputs.
5.1. Fossil Fuel for household cooking Household fossil fuel usage is mainly for cooking and lighting, and different patterns are seen at different levels of income among households from the poorer to the better-off groups, and between rural and urban areas. Figure 18 shows a decrease in the use of firewood and an increase in the use of natural gas along with improvement in living conditions in rural areas. There are big differences across income groups, with the poorest using mostly firewood compared with only 30 percent of the richest group. More than half of the richest group uses natural gas as their main energy source for cooking while this is only around five percent for the poorest group.65 This may be partly due to income rises and as a result a move towards more time saving alternatives and cleaner fuels, but may also indicate a reduction in the availability of wood as a fuel source. More
64
This paper is based on the results of a DANIDA household survey of 2,100 households in 12 provinces. 1,300 of these households were also surveyed in 2008 and 2006.
65 Characteristics of the Vietnamese Rural Economy: Evidence from a 2010 Rural Household Survey in 12
Provinces of Viet Nam.
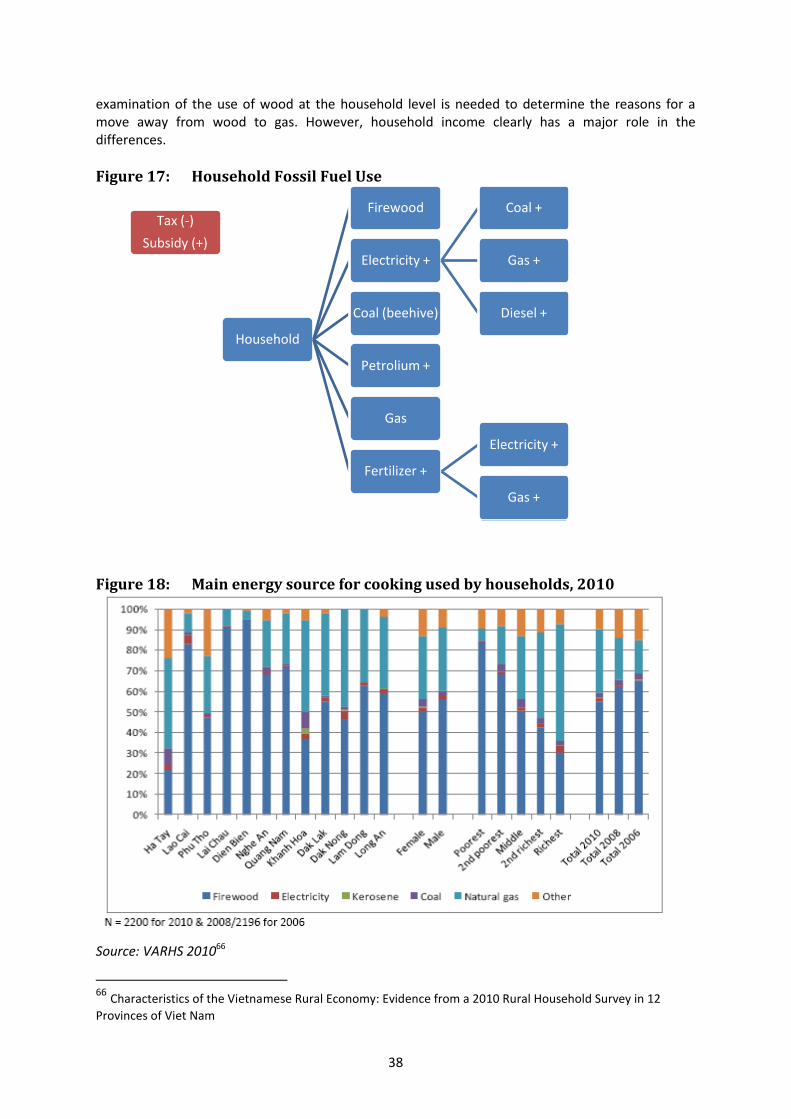
38
examination of the use of wood at the household level is needed to determine the reasons for a move away from wood to gas. However, household income clearly has a major role in the differences.
Figure 17: Household Fossil Fuel Use
Figure 18: Main energy source for cooking used by households, 2010
Source: VARHS 201066
66 Characteristics of the Vietnamese Rural Economy: Evidence from a 2010 Rural Household Survey in 12
Provinces of Viet Nam
Household
Firewood
Electricity +
Coal +
Gas +
Diesel + Coal (beehive)
Petrolium +
Gas
Fertilizer +
Electricity +
Gas +
Tax (-)
Subsidy (+)
39
Electricity and other fuel sources (paraffin and kerosene) for cooking are used by only a few households. Movements then In the price of electricity and liquid fuels have a limited impact on most households, however, increases in the price of natural gas does have an impact and may lead poorer households to move back to firewood as a fuel source.
5.2. Household Electricity Use As we saw in the discussion of the electricity sector, rural areas accounted for only 30% of electricity use in 2009 despite making up 60% of Viet Nam’s population. With the high inflation since mid 2010 and the price rise in electricity in February 2011, the Government was quick to implement a system of direct support for poorer households so they were not overly affected by the price rise. The subsidy system implemented in March 2011 targeted 3.2 million poor households benefiting from a monthly payment of VND30,000 (US$1.4) as well as lower prices for the first 50kwh of electricity they use, VND993 per kwh rather than the newly introduced price of VND1,242 per kwh.67 This is not a new system, though the one off payment is new. Since 2009 an incremental block tariff meant that all households (rural and urban) would receive their first 50kwh of consumption at a low tariff set at 35-40% of the average price.68 In addition to the new support of VND30,000, the poor are also entitled to receive an extra VND12,000 from EVN. The instruction of EVN requires that poor households have to commit to use less than 50kWh per month, otherwise will be treated as any normal household with the removal of support.69 A recent survey support by the World Bank suggests that the high level of electricity access across Viet Nam means that large numbers of the poor have connections and therefore have the potential to be impacted by changes to tariffs and service levels. According to EVN 100% of districts are connected to the national grid, 98.63% of communes and 97.08% of households.70 VHLSS data from 2008 shows that 88.4% of the poorest 10% have access to electricity and the poor spend 2.9% of their total expenditures on electricity compared to 3.2% for the non-poor. Table 18 illustrates that while fewer poor have access to electricity they also have lower demand / consumption as they have fewer equipment that requires electricity. This is confirmed by VHLSS electricity consumption figures from the World Bank.
67
Decision 268/QD-TTg, February 2011
68 World Bank 2:2010 A lifeline tariff allows the first band of electricity use, 50-100kwh, to be sold at lower that
average levels ensuring that the poor have access to low price electricity. Though all users benefit those that use more may repay the lower price once they use more electricity at higher tariff bands.
69 MOIT Circular No. 05/2011/TT-BCT 25 February 2011, and EVN instruction on
http://www.evn.com.vn/Default.aspx?tabid=60&TopicId=32&ItemId=5588&language=vi-VN
70http://www.evn.com.vn
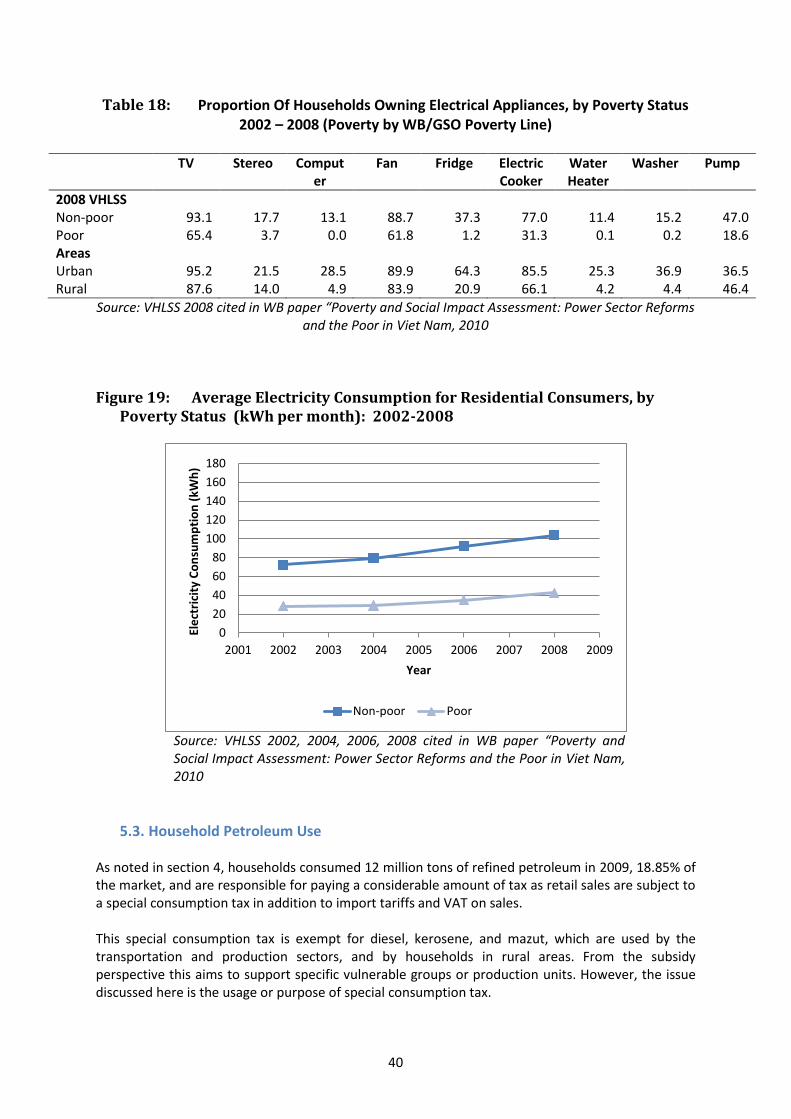
40
Table 18: Proportion Of Households Owning Electrical Appliances, by Poverty Status 2002 – 2008 (Poverty by WB/GSO Poverty Line)
TV Stereo Comput
er Fan Fridge Electric
Cooker Water Heater
Washer Pump
2008 VHLSS Non-poor 93.1 17.7 13.1 88.7 37.3 77.0 11.4 15.2 47.0 Poor 65.4 3.7 0.0 61.8 1.2 31.3 0.1 0.2 18.6 Areas Urban 95.2 21.5 28.5 89.9 64.3 85.5 25.3 36.9 36.5 Rural 87.6 14.0 4.9 83.9 20.9 66.1 4.2 4.4 46.4
Source: VHLSS 2008 cited in WB paper “Poverty and Social Impact Assessment: Power Sector Reforms and the Poor in Viet Nam, 2010
Figure 19: Average Electricity Consumption for Residential Consumers, by Poverty Status (kWh per month): 2002-2008
Source: VHLSS 2002, 2004, 2006, 2008 cited in WB paper “Poverty and Social Impact Assessment: Power Sector Reforms and the Poor in Viet Nam, 2010
5.3. Household Petroleum Use As noted in section 4, households consumed 12 million tons of refined petroleum in 2009, 18.85% of the market, and are responsible for paying a considerable amount of tax as retail sales are subject to a special consumption tax in addition to import tariffs and VAT on sales. This special consumption tax is exempt for diesel, kerosene, and mazut, which are used by the transportation and production sectors, and by households in rural areas. From the subsidy perspective this aims to support specific vulnerable groups or production units. However, the issue discussed here is the usage or purpose of special consumption tax.
0
20
40
60
80
100
120
140
160
180
2001 2002 2003 2004 2005 2006 2007 2008 2009
Ele
ctri
city
Co
nsu
mp
tio
n (
kWh
)
Year
Non-poor Poor
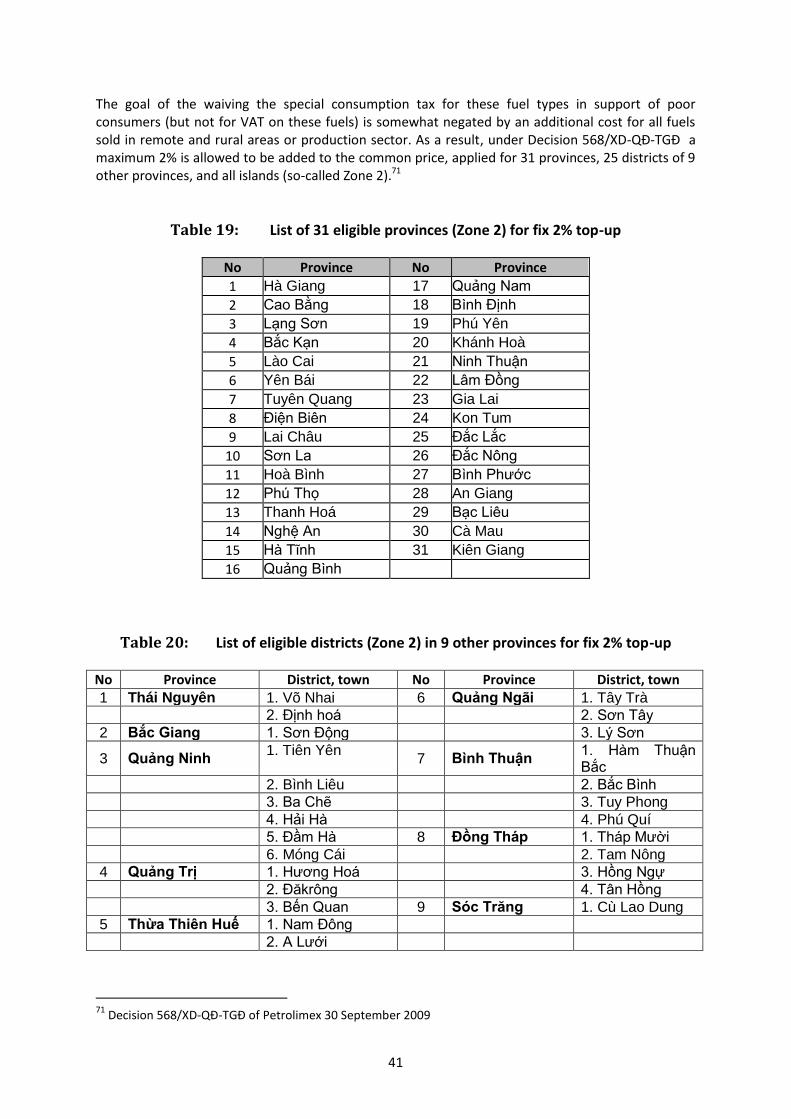
41
The goal of the waiving the special consumption tax for these fuel types in support of poor consumers (but not for VAT on these fuels) is somewhat negated by an additional cost for all fuels sold in remote and rural areas or production sector. As a result, under Decision 568/XD-QĐ-TGĐ a maximum 2% is allowed to be added to the common price, applied for 31 provinces, 25 districts of 9 other provinces, and all islands (so-called Zone 2).71
Table 19: List of 31 eligible provinces (Zone 2) for fix 2% top-up
No Province No Province
1 Hà Giang 17 Quảng Nam
2 Cao Bằng 18 Bình Định
3 Lạng Sơn 19 Phú Yên
4 Bắc Kạn 20 Khánh Hoà
5 Lào Cai 21 Ninh Thuận
6 Yên Bái 22 Lâm Đồng
7 Tuyên Quang 23 Gia Lai
8 Điện Biên 24 Kon Tum
9 Lai Châu 25 Đắc Lắc
10 Sơn La 26 Đắc Nông
11 Hoà Bình 27 Bình Phước
12 Phú Thọ 28 An Giang
13 Thanh Hoá 29 Bạc Liêu
14 Nghệ An 30 Cà Mau
15 Hà Tĩnh 31 Kiên Giang
16 Quảng Bình
Table 20: List of eligible districts (Zone 2) in 9 other provinces for fix 2% top-up
No Province District, town No Province District, town 1 Thái Nguyên 1. Võ Nhai 6 Quảng Ngãi 1. Tây Trà
2. Định hoá 2. Sơn Tây
2 Bắc Giang 1. Sơn Động 3. Lý Sơn
3 Quảng Ninh 1. Tiên Yên
7 Bình Thuận 1. Hàm Thuận Bắc
2. Bình Liêu 2. Bắc Bình
3. Ba Chẽ 3. Tuy Phong
4. Hải Hà 4. Phú Quí
5. Đầm Hà 8 Đồng Tháp 1. Tháp Mười
6. Móng Cái 2. Tam Nông
4 Quảng Trị 1. Hương Hoá 3. Hồng Ngự
2. Đăkrông 4. Tân Hồng
3. Bến Quan 9 Sóc Trăng 1. Cù Lao Dung
5 Thừa Thiên Huế 1. Nam Đông
2. A Lưới
71
Decision 568/XD-QĐ-TGĐ of Petrolimex 30 September 2009
42
5.4. Gas, Coal and firewood Gas is used for cooking in urban area and richer groups in rural areas. A larger volume of gas is being imported and prices are increasing. No subsidy is provided. Firewood, beehive and low quality coal are being used by low-income households in both rural and urban areas for cooking, as a substitute for electricity and gas. Though it is cheap there is no evidence of subsidy. However, it is clearly a “dirty” fuel, which does not only emit greenhouse gas but also fumes that are harmful for human health.
6. Conclusion The main body the report details much of the findings and conclusions for each section as well as recommendations for each sector.
6.1. Electricity market
Electricity prices are sure to see upward pressures on price in the future, which will impact on all users.
A rethinking of the electricity pricing structure as well as the creation of a more level playing field for domestic and international companies will make investment in electricity generation more attractive to investors.
Increased investment will allow for a more rational investment in different electricity generation options, which may move away from a reliance on coal as targeted in the National Plan for electricity.
The Government needs to accelerate reforms in the electricity sector and reduce the role of EVN in order to bring more players in generation as well as retail sales of electricity to ensure that investment continues and that supply can meet demand.
The increased reliance on coal will require a considerable rethinking of the pricing policy for domestic and imported coal especially for the electricity sector. The current structure will continue to force losses on enterprises in the electricity market.
Losses in the electricity sector as incurred under the current price capping system for electricity and coal cannot be quantified or easily rectified, which is a further reason for bringing the pricing system in-line with the cost of production.
Increased competition in generation and retail would allow the sector to identify appropriate costs themselves.
A less ad hoc system of support for the low income groups needs to be identified in order to reduce the impact of electricity price rises on the poor. A system of grants such as implemented with the recent electricity price rise is a move in the right direction, but further analysis of the use of electricity by the poor should be carried out to identify the impact of price rises and the appropriate level of cash grants to compensate the low income groups.
43
Several industries have benefited considerably from low electricity prices and also low prices for coal. The role of low energy costs in the competitiveness of these industries needs to be examined in detail to assess to what degree they are inefficient in their energy use and to what extent price increases will impact these industries.
The focus of the National Plan for electricity is focused on the expansion of generation facilities. Regulations and guidance do exist to encourage energy efficiency by electricity users. However, the current pricing system does not encourage efficient use of electricity as prices are generally quite low, which discourages firms from investing in energy saving technologies, efficient use of electricity and the saving of electricity: little benefit is seen from investing in technology as returns will not be great.
6.2. Refined Petroleum
Global refined petroleum prices remain unstable and subject to considerable fluctuation.
The costs of keeping prices low will increase even if world prices remain stable as demand for refined petroleum is will rise in Viet Nam in the future.
While the direct cost to the poor and households will vary depending on their consumption of refined petroleum, the indirect costs will be also be costly, including the increased costs for goods transported to rural areas as well as input costs increases such as fertilisers.
The impact of both direct and indirect price increases must be calculated and support measures designed to ensure the poor do not bear more than they can cope with.
If the Government continues to pursue stable pricing then it will need to look at a more efficient system to ensure stable prices when the global prices are high. There is a danger that the Government will continue to use tax waivers as a means to ensuring price stability. Such a mechanism will reduce Government revenue from the sale of refined petroleum, leaving the Government with fewer resources to support poorer households.
6.3. Government Subsidies Most subsidies on fossil fuels in Viet Nam are indirect and as a result very hard to quantify. It is also difficult to identify who the target groups of these subsidies are or if they are benefiting from the subsidies. Viet Nam’s current electricity pricing structure and petroleum pricing structure are such that much of the Government support goes to state owned enterprises. In turn, these enterprises blame the system that is in place to ensure equitable access for their own losses. The system also negatively impacts the oversight and management of these enterprises as losses due to weaknesses in the pricing, Government support system and financial structure in Viet Nam and weaknesses within enterprises themselves can not be differentiated. Therefore losses cannot be assigned and a true picture of the market taken. Table 21 is an amalgamation of direct and indirect support using the OECD/ UNEP framework.
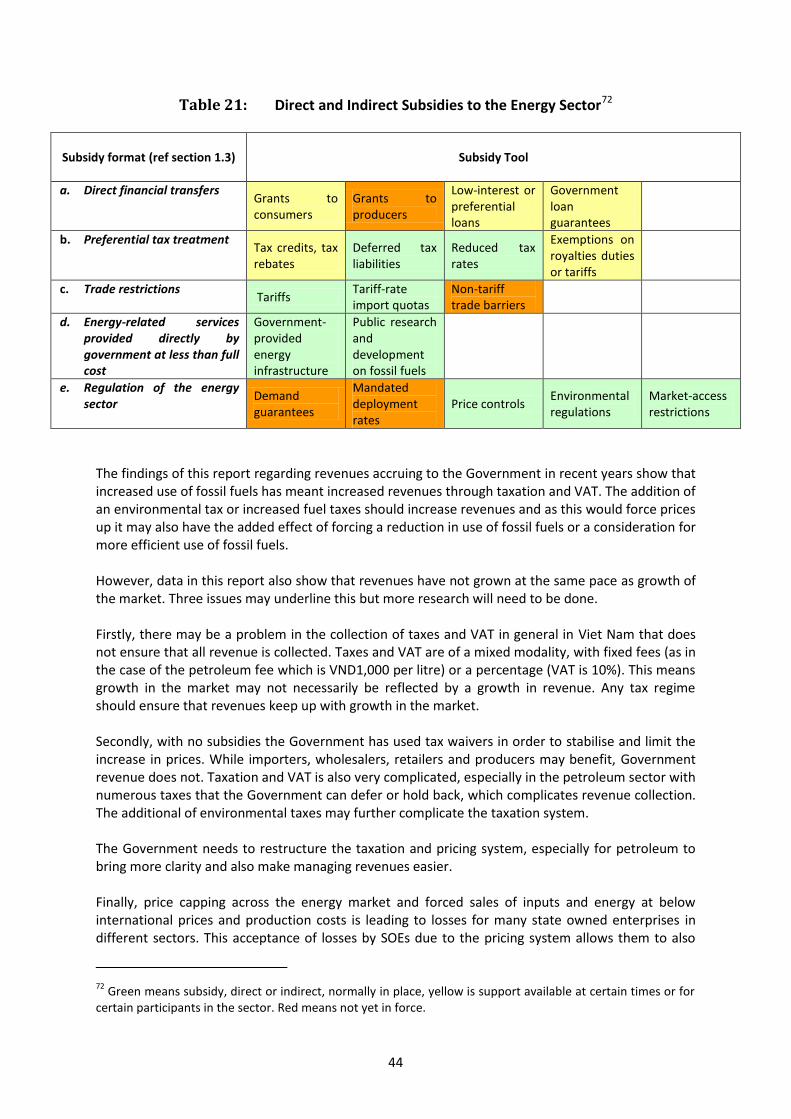
44
Table 21: Direct and Indirect Subsidies to the Energy Sector72
Subsidy format (ref section 1.3) Subsidy Tool
a. Direct financial transfers Grants to consumers
Grants to producers
Low-interest or preferential loans
Government loan guarantees
b. Preferential tax treatment Tax credits, tax rebates
Deferred tax liabilities
Reduced tax rates
Exemptions on royalties duties or tariffs
c. Trade restrictions Tariffs
Tariff-rate import quotas
Non-tariff trade barriers
d. Energy-related services provided directly by government at less than full cost
Government-provided energy infrastructure
Public research and development on fossil fuels
e. Regulation of the energy sector
Demand guarantees
Mandated deployment rates
Price controls Environmental regulations
Market-access restrictions
The findings of this report regarding revenues accruing to the Government in recent years show that increased use of fossil fuels has meant increased revenues through taxation and VAT. The addition of an environmental tax or increased fuel taxes should increase revenues and as this would force prices up it may also have the added effect of forcing a reduction in use of fossil fuels or a consideration for more efficient use of fossil fuels. However, data in this report also show that revenues have not grown at the same pace as growth of the market. Three issues may underline this but more research will need to be done. Firstly, there may be a problem in the collection of taxes and VAT in general in Viet Nam that does not ensure that all revenue is collected. Taxes and VAT are of a mixed modality, with fixed fees (as in the case of the petroleum fee which is VND1,000 per litre) or a percentage (VAT is 10%). This means growth in the market may not necessarily be reflected by a growth in revenue. Any tax regime should ensure that revenues keep up with growth in the market. Secondly, with no subsidies the Government has used tax waivers in order to stabilise and limit the increase in prices. While importers, wholesalers, retailers and producers may benefit, Government revenue does not. Taxation and VAT is also very complicated, especially in the petroleum sector with numerous taxes that the Government can defer or hold back, which complicates revenue collection. The additional of environmental taxes may further complicate the taxation system. The Government needs to restructure the taxation and pricing system, especially for petroleum to bring more clarity and also make managing revenues easier. Finally, price capping across the energy market and forced sales of inputs and energy at below international prices and production costs is leading to losses for many state owned enterprises in different sectors. This acceptance of losses by SOEs due to the pricing system allows them to also
72
Green means subsidy, direct or indirect, normally in place, yellow is support available at certain times or for certain participants in the sector. Red means not yet in force.
45
hide other losses due to poor investments and mismanagement. More dangerously, losses in SOEs mean no or lower than expected transfers to the state budget from SOEs, again impacting revenues. So what could be the source of financing for subsidies in the energy sector in Viet Nam, as the SOEs are making losses and the state revenue is sometimes shrinking due to very often “sudden and temporary” exemptions of taxes and fees. The State will sometimes bail out the SOEs with low interest loans for example, directly or indirectly through state owned banks, and thus take some of the losses. Otherwise, the transfer of losses as a form of indirect subsidies can only come from the SOEs, which are operating in the area of natural resources exploitation such as coal, gas, and crude oil. The last source of “subsidy” are the natural resources themselves, such as oil and coal, which are sold at below market prices into the different markets. Analyzing this fact and following the value chain for fossil fuels also led the team to a conclusion that there has for long been a covered and complicated system which allows the SOEs to exploit the natural resources for financing their losses with the excuse of subsidizing some target groups or keeping the economy stable. The possible quantification of subsidies, in this situation, requires further enquiry.
6.4. Next Steps This study was limited by time, access to data, whilst assessing a dynamic market: the fossil fuel market is changing rapidly. Changes over the last few months in pricing for electricity as well as the implementation of new competitive rules for the generation market, in addition to new price structures for the refined petroleum market will take some time to show results and impacts. As a result this study should be revisited in 6 to 12 months time to review the impacts on pricing and fossil fuel use of :-
Increased global oil prices and the role of the governments stabilization fund
The impact of revised regulations in the electricity market allowing for quarterly revisions of the price of electricity and the use of this new power by EVN.
The impact of the move towards a more competitive market for electricity generation and the operation of new purchasing agreements between generators and EVN and the impact of this on electricity access.
In addition several more detailed studies need to be considered to go deeper and offer the Government greater options in the management of fossil fuel use markets.
In electricity the government should look closely at revising the Electricity law with a view to accelerating competition across the market bring competition in wholesale and retail forward ahead of the current strategy.
EVNs role as monopoly retailer and purchaser of electricity should be reviewed with a focus on its losses, i.e. to ascertain whether the firm is losing money due to the current pricing structure or mismanagement of state assets and investments.

46
A review of coal demand and pricing. Higher prices for coal in Viet Nam, in-line with global prices may make investment in coal powered plants as detailed under the National Plan VI less attractive and force a rethinking towards more cleaner energy production.
A review of the National Plan and electricity law should also put renewable and clean energy methods central to electricity production in Viet Nam and not on the periphery as they are now.
Pricing and taxation in the refined petroleum market should be reconsidered and a move away from ad hoc adjustments designed. Countries all over the word have systems that ensure pricing reflects global prices and delivers Government.
47
References Used in the report
ADB (11/2009). Socialist Republic of Viet Nam: Climate Change Impact and Adaptation Study in the Mekong Delta. ADB.
Baumüller, H (2/2010). “Building a Low Carbon Future for Viet Nam Technological and other needs for climate change mitigation and adaptation”. Energy, Environment and Development Programme Paper: 09/02. Chatham House.
BMI (2011). “Viet Nam Oil and Gas Report, Q1 2011: Includes 10-Year Forecasts to 2014”. Business Monitor International Ltd.
Business monitor international Ltd. (October 2008). “Viet Nam Oil & Gas Report Q4 2008”.
Cuong N C (3/2008). “Experience of the institute of energy in the preparation of the renewable master plan”. Institute of Energy.
Dapice, D, 2009, Case Study: Viet Nam Electricity, Harvard Kennedy School
ERAV (10/2010). “Power market developments in Viet Nam”. Electricity Regulatory Authority of Viet Nam. available from http://www.theapex.org/Documentos/Apex10/Sesion4/Dinh_The_Phuc-Power_Market_Developments_in_Vietnam.pdf last accessed 24th June 2011
ESMAP (01/2010). “Final Report: Viet Nam Gas Sector Development Framework”. The World Bank.
EVN (2011), EVN Electricity Production data provided to JICA in 2011
Freshfields, 2005, Viet Nam-New Electricity Law, Hanoi
General Statistics Office (2009) Statistical Yearbook of Viet Nam 2008. Hanoi: Statistical Publishing House.
General Statistics Office (2011), tailored data provided to the research team on electricity, coal and petroleum use
General Statistics Office website (2011), www.gso.gov.vn accessed in April, May and June 2011
Giesecke, J and Tran Hoang Nhi (2/2009). “Sources of Growth and Structural Change in the Vietnamese Economy, 1996–2003: A Computable General Equilibrium Analysis” Asian Economic Journal 2009, Vol. 23 No. 2, 195–224.
GSI/ iisd, (2010), “The Effects of Fossil-Fuel Subsidy Reform: A review of modeling and empirical studies”
IEA (2008). “Global fossil fuel subsidies and the impacts of their removal”. Office of the Chief Economist International Energy Agency.
International Energy Agency (2008). “Energy Policy Review of Indonesia”. OECD.
Jennifer, E (3/2010). “The Effects of Fossil-Fuel Subsidy Reform: A review of modellingmodeling and empirical studies. The Global Subsidies Initiative. International Institute for Sustainable Development.
Jones, R (3/2010). “The Vietnamese Energy Sector: An Overview” Report. For CIDA
Jones, R, H, Tran, P A Nguyen and TTT Trang (2009), “A Mapping Exercise- Poverty Reduction Programmes and Polciies in Viet Nam”, UNDP
48
Le Son (2008). “Viet Nam: Electric Power Industry”. U.S. Commercial Service.
Le T L, Gerald Atampugre, Perrine De Vleeschouwer, Etaferahu Ejegu, and Altantsetseg Sodnomtseren (6/2010). “The effects of international emission policies on US’ and China’s trade and welfare. ENR 30306.
Nguyen Q K (6/2006). “Impacts of wind power generation and CO2 emission constraints on the future choice of fuels and technologies in the power sector of Viet Nam”. Elsevier Ltd.
Nguyen T T (2/2008). “Overview - Sector: Energy (Oil and Gas)”. Mirae Asset Securities, Viet Nam.
Nguyen Tien Dung and Misuo Ezaki (11/2005). “Regional economic integration and its impacts on growth, poverty and income distribution: the case of Viet Nam”. Blackwell Publishing Asia Pty Ltd.
Nguyen Van Ngai (3/2005). “Application of Computable General Equilibrium Model in Agricultural Economics: A case study of Viet Nam”. Faculty of Economics, Nong Lam University, Ho Chi Minh City.
OECD (2010). “Analysis Of The Scope Of Energy Subsidies And Suggestions For The G-20 Initiative”. OECD.
Ometeyama, S, 2009, Energy Sector Situation in Viet Nam
Perkins, D H and Tu Thanh Tu Anh, 2010, Viet Nam’s Industrial Policy, Harvard Kennedy School, Ho Chi Minh City
Pham Khanh Toan, Nguyen Minh Bao, Nguyen Ha Dieu (2009). “Energy supply, demand, and policy in Viet Nam, with future projections”. Elsevier Ltd.
Sachs, J (2010). “A New Path to a Low-Carbon Economy”. Project Syndicate, 2010. www.project-syndicate.org
SEI (10/2007). “Strategic Environmental Assessment Of The Hydropower Master Plan In The Context Of The Pdp Vi: Energy Supply and Demand – Baseline Assessment”. ADB.
Thanh X T, 2010, Viet Nam’s Infrastructure Constraints, Harvard Kennedy School, Ho Chi Minh City
The Global Subsidies Initiative (10/2010). “Delivering on G-20 commitments: The path to fossil-fuel subsidy reform”. International Institute for sustainable development.
The global subsidies initiative (2011). “A summary of the fossil-fuel subsidies work-plan: 2009 to 2011”. International Institute for sustainable development.
The Global Subsidies Initiative (4/2010). “Untold Billions: Fossil-fuel subsidies, their impacts and the path to reform”. International Institute for sustainable development.
The World Bank (2010). “Program information document (PID) appraisal stage. Report No.: 53289”. The World Bank.
To Hai Au (8/2010). “Viet Nam Power Generation Sector: Investment Opportunities and Challenges”. Viet Nam Investment Network.
Tran Huu Truong Son (9/2007). “Viet Nam Oil Security Policies”. Ministry of Industry and Trade.
Trineesh Biswas (11/2010). “Summary Report of the OECD Expert Workshop on Estimating Support to Fossil Fuels”. OECD.
UK Foreign Office SE Asia Economy and Climate Change Teams (2010). “Fossil Fuel Subsidies In Southeast Asia: Costly, Regressive And Growth-Impeding”.
UNCTD, 2008, Investment Policy Review, Geneva
49
UNDP (2011). “Terms of reference for Research on fossil fuel prices and taxes, and their effects on economic development and income distribution in Viet Nam”.
UNDP, 2007, Energy and Poverty in Viet Nam: Challenges and the Way Forward, Bangkok
UNIDO, 2010, Energy and Efficiency in the Vietnamese Steel Industry, Hanoi
Van Heerden, J., Gerlagh, R., Blignaut, J., Horridge, M., Hess, S., Mabugu, R., and Mabugu, M. (3/2005). “Fighting CO2 pollution and poverty while promoting growth: searching for triple dividends in South Africa”. Institute for Environmental Studies - The Netherlands.
Victor David (10/2009). “The Politics of Fossil-Fuel Subsidies”. The Global Subsidies Initiative. International Institute for Sustainable Development.
Viet Nam National Energy Efficiency Program, (2010), Viet Nam Energy Statistics 2008, Hanoi
Viet Nam’s National Assembly (2010). “Law on Environment Tax”.
VINAPCO Aviation Petroleum One member Company Ltd. (2010). “Report dated 15 December 2010 by Viet Nam Aviation Corporation”.
Vivid Economics (10/2010). “The implicit price of carbon in the electricity sector of six major economies”. Report prepared for The Climate Institute.
VOGC (2005). “Petroleum exploration Opportunities in Viet Nam”. Viet Nam Oil And Gas Corporation.
Vu Van Thai (2008). “Consultation on MRC’s Hydropower Programme - Vientiane, Lao PDR, 25-26 September 2008-Meeting rapid electricity demand growth”. Ministry of Industry and Trade, Viet Nam
West S E and Roberton C. Williams III (10/2006). “Optimal taxation and cross-price effects on labor supply: Estimates of the optimal gas tax”. Journal of Public Economics 91 (2007) 593–617.
Willenbockel, D (2010). “Impact Assessment Report of Draft Environmental Tax Law for Viet Nam. Final Report, June 2010:. GTZ, Danida, Institute of Development Studies (IDS), University of Sussex, Department of Economics, University of Copenhagen
World Bank, IEA and OECD, (2008), “Analysis of the Scope of Energy Subsidies and Suggestions for the G-20 Initiative”
50
Background material for reference
Ananthapadmanabhan G., Srinivas K. and Gopal Vinuta (10/2007). “Hiding behind the poor”. Greenpeace on Climate injustice. Greenpeace India Society.
Ashokankur Datta. “The incidence of fuel taxation in India”. Energy Economics. Elsevier B.V.
Baumol, W J (1972). “On Taxation and the Control of Externalities”. The American Economic Review, Vol. 62, No. 3 (Jun., 1972), pp. 307-322. The American Economic Association.
Blackman, A, Rebecca Osakwe, Francisco Alpizar (2010). “Fuel tax incidence in developing countries: The case of Costa Rica”. Energy Policy 38 (2010) 2208–2215. Elsevier Ltd.
Bovenberg,A. Lans and Lawrence H. Goulder (1996). “Optimal Environmental Taxation in the Presence of Other Taxes: General- Equilibrium Analyses”. The American Economic Review, Vol. 86, No. 4 (Sep., 1996), pp. 985-1000. The American Economic Association.
Bruce, N and Gregory M. Ellis (9/1993). “Environmental Taxes and Policies for Developing Countries”. The World Bank.
Bureau, B.(5/2009). “Distributional effects of a carbon tax on car fuels in France”. Mines ParisTech, Cerna.
Cantore, N, and Emilio Padilla. “Equality and CO2 emissions distribution in climate change integrated assessment modeling”. Energy 35 (2010) 298–313. Elsevier Ltd.
Carraro, C, Marzio Galeotti, and Massimo Gallo (1996). “Environmental taxation and unemployment: Some evidence on the 'double dividend hypothesis' in Europe”. Journal of Public Economics 62 0996) 141-181.
Cut Dian R.D. Agustina, Javier Arze del Granado, Tim Bulman, Wolfgang Fengler, and Mohamad Ikhsan (9/2008). “Black Hole or Black Gold? The Impact of Oil and Gas Prices on Indonesia’s Public Finances. The World Bank.
de Gracia, Juncal Cun˜ado, Fernando Pe´rez .” Do oil price shocks matter? Evidence for some European countries”. Energy Economics 25 (2003) 137–154. Elsevier Science B.V.
Ellis, J PhD (3/2010). “The Effects of Fossil-Fuel Subsidy Reform: A review of modelling and empirical studies”. International Institute for Sustainable Development.
Goulder, L H. (1994). “Effects of Carbon Taxes in an Economy with Prior Tax Distortions: an international general equilibrium Analysis”. Journal of Environmental Economics and Management 29, 271-297 (1995).
GSI (7/2010). “A How-to Guide: Measuring subsidies to fossil-fuel producers”. The Global Subsidies Initiative. International Institute for Sustainable Development.
Hamilton, K (12/2009). “Unlocking Finance for Clean Energy: The Need for ‘Investment Grade’ Policy”. Chathamhouse.
Hamilton, K (26/6/2008). “Clean Energy- Investment and the ‘New Competitiveness”. Environment and Development Programme. Chatham House.
Hooker, M (1996). “What happened to the oil price-macro-economy relationship?”. Journal of Monetary Economics 38 (1996) 195-213.
Hunt, B , Peter Isard, and Douglas Laxton (01/2001). “The Macro-economic effects of higher oil prices”. IMF.
Hunt, B, P Isard and D Laxson (01/2001). “The Macroeconomic effects of Higher Oil Prices”. IMF.
James,H (1996). “This is what happened to the oil price-macro economy relationship”. Journal of Monetary
51
Economics 38 (1996) 215 220.
Jansen, H and Ger Klaassen (200). “Economic Impacts of the 1997 EU Energy Tax: Simulations with Three EU-Wide Models”. Environmental and Resource Economics 15: 179–197, 2000. Kluwer Academic Publishers.
Jiménez-Rodríguez, R and Marcelo Sánchez (5/2004). “Oil price shocks and real GDP growth empirical evidence for some OECD countries”. European Central Bank.
Justice, S (12/2009). “Private financing of renewable energy - a guide for policymakers”. UNEP, SEFI, Bloomberg, Chatham House.
Laan, T Christopher Beaton and Bertille Presta (4/2010). “Strategies for Reforming Fossil-Fuel Subsidies: Practical lessons from Ghana, France and Senegal”. The Global Subsidies Initiative. International Institute for Sustainable Development.
M. Hakan Berument, Nildag Basak Ceylan and Nukhet Dogan (2010). “The Impact of Oil Price Shocks on the Economic Growth of Selected MENA Countries”. The Energy Journal, Vol. 31, No. 1. IAEE.
Maradan, D and Anatoli Vassiliev. “Marginal Costs of Carbon Dioxide Abatement: Empirical Schweizerische Zeitschrift für Volkswirtschaft und Statistik (2005). “Evidence from Cross-Country Analysis”. Schweizerische Zeitschrift für Volkswirtschaft und Statistik 2005, Vol. 141 (3) 377–410.
Milne, J E (2008). “The reality of carbon taxes in the 21st century”. Environmental Tax Policy Institute and the Vermont Journal of Environmental Law - Vermont Law School.
Nicolau, M (10/2009). “The influence of taxation on energy products price and consequences on the global economy”. http://mpra.ub.uni-muenchen.de/22628/
O´Ryan, R Carlos J. de Miguel and Sebastian Miller (2002). “A CGE model for environmental and trade policy analysis in Chile: case study for fuel tax increases”. University of Chile, and Director of the Program for Environmental Economic and Management, the Industrial Engineering Department.
OECD (2010). “Taxation, Innovation and the Environment”. ISBN 978-92-64-087620.
Parry, I (8/1999). “Tax Deductions, Environmental Policy, and the "Double Dividend" Hypothesis”. Journal of Environmental Economics and Management 39, 67-96 (2000). Academic Press.
Parry, I and Govinda R. Timilsina (6/2008). “How Should Passenger Travel in Mexico City Be Priced?”.
Parry, I and Jon Strand (2/2010). “International Fuel Tax Assessment: An Application to Chile”. The Resources for the Future. www.rff.org
Pearce D (1991). “The Role of Carbon Taxes in Adjusting to Global Warming”. The Economic Journal, Vol. 101, No. 407 (Jul., 1991), pp. 938-948. Blackwell Publishing for the Royal Economic Society.
Poterba, J M (1990).“Is The Gasoline Tax Regressive?”. National Bureau of Economic Research. USA.
Qili Huang (2007). “Status and Development of Chinese Coal-fired Power Generation”. Day 1 Monday 15 October 2007. Session 2: Clean Coal Power Generation.
Seung-Hoon Yoo. “Electricity consumption and economic growth: evidence from Korea”. Energy Policy 33 (2005) 1627–1632. Elsevier Ltd.
Sterner T(2006). “Fuel taxes: An important instrument for climate policy”. Energy Policy 35 (2007) 3194–3202. Elsevier Ltd.
Strand J (01/2010). “Taxes and Caps as Climate Policy Instruments with Domestic and Imported Fuels”. The
52
World Bank.
The National Council of Appliued Economic Research (2006). “Study of Macroeconomic Impact of High Oil Prices”. Petroleum Federation of India.
Thomas, C, D. Fitz Gerald John, Malaguzzi Valeri Laura, and Richard S.J. Tol (8/2008). “The Impact of a Carbon Tax on Economic Growth and Carbon Dioxide Emissions in Ireland”. ESRI.
Ussif Rashid Sumaila, Louise Teh, Reg Watson, Peter Tyedmers, and Daniel Pauly (2007). “Fuel price increase, subsidies, overcapacity, and resource sustainability”. International Council for the Exploration of the Sea. Published by Oxford Journals.
van Vuuren, D.P. and A. Faber (2009). “Growing within Limits: A Report to the Global Assembly 2009 of the Club of Rome”. Netherlands Environmental Assessment Agency.
W. H. Parry and Kenneth A (2005). “Does Britain or the United States Have the Right Gasoline Tax?”. The American Economic Review, Vol. 95, No. 4 (Sep., 2005), pp. 1276-1289 Published by: American Economic Association.
Yusuf Arief Anshory (2008). “The Distributional Impact of Environmental Policy: The Case of Carbon Tax and Energy Pricing Reform in Indonesia”. The Economy and Environment Program for Southeast Asia.
ZhongXiang Zhang and Andrea Baranzini (2003). “What do we know about carbon taxes? An inquiry into their impacts on competitiveness and distribution of income”. Energy Policy 32 (2004) 507–518. Elsevier Ltd.
53
ANNEX 1: Terms of Reference for the study A. PACKAGE 1 – VALUE CHAIN AND POLICY ANALYSIS OF FOSSIL FUEL TRADE, SUBSIDY AND TAX A.1. Scope of Work
Value chain and fossil fuel policy analysis is crucial to understand fuel markets, including how consumers and industries are affected by subsidies and (possibly) fees and taxes. It is important to distinguish the various types of fuel and to identify the major actors in these markets. The analysis should provide information on and analysis of direct and indirect subsidies (State support) to different fossil fuels and their producers, traders and users, as well as fees and taxes, and provide an overview of the main actors in the market, profits, and the fiscal burden they are facing. Fossil fuels could be grouped in functional categories such transportation (gasoline, diesel), electricity generation (coal, gas, oil), industrial use (coal, gas, oil, electricity), cooking (bottled gas, beehive coal, kerosene, electricity), and other household use including lighting (electricity, kerosene). Moreover, the fossil fuel types have principal users. For example diesel is used primarily by trucks and public transport, whereas gasoline is mainly for motorbikes and cars. Bottled gas, electricity, kerosene and beehive coal are used for cooking by different income groups, with better off households usually favouring electricity and gas. Different subsidies are in place in Viet Nam. For example, kerosene is commonly used for lighting and also cooking in remote areas, and transportation costs are often subsidised. State-owned fuel traders, electricity producers and the various sectors of the economy such as the steel, cement, electricity production or transport seem to experience different direct and indirect subsidies and price regulations regarding fossil fuels. Such particularities in the fuel markets are critical for anticipating the distributional effects as well as investment behaviour of enterprises as a result of removing (certain) fuel subsidies and introducing or increasing different fossil fuel taxes and fees. Key operators in fossil fuel markets in Viet Nam include state owned firms that are responsible for an important part of revenue through transfers of profits to the State and local authorities. In other words, taxes and fees (existing or new) are not the only source of State revenue, and must be assessed The following should be undertaken by a small team of economic policy analysts: (a) Analyse the current energy policy landscape and the energy market in Viet Nam, with a focus on
the production, trade and retail of different fossil fuels, including use by consumers and industry. The analysis should include interventions such as price ceilings; direct and indirect subsidies and other support measures for state owned and private companies; (enterprise, VAT) taxes; possibly (local) fees; as well as the overall costs and benefits from production and trade in fossil fuels by key operators. It should include indirect state intervention in the energy markets such as concessional loans and other support, as well as transfer of profits from state owned firms to the national and local authorities. Estimates of total revenue as well as State expenditure should be made, for recent years.
(b) Make recommendations on the potential effects of removal of subsidies and introduction of fossil fuel taxes on revenue collection in Viet Nam including potential effects on profits of state owned enterprises and their transfers to the central and local authorities. Analyse the potential for financing social measures, and make recommendations for further studies including
54
modelling of removal of certain subsidies and of different taxation scenarios and support measures in fuel markets. Make recommendations on how to minimize potential negative economic impacts of fuel tax and how to create a “double dividend” for environmental quality and long-term growth, whilst maintaining social fairness.
This work will be based on desk research / (grey) literature review, and key informant interviews in Ministries, research organisations, and enterprises. No field surveys are expected to be implemented. Analysis and conclusions should be compared with analysis in other countries, partly based on the literature review undertaken by the Policy Advisors Team (UNDP), as reflected in these TOR. The team is expected to present draft conclusions at an expert workshop (discussed below under package 2), and finalise their report based on discussions there, as well as take into account written comments from the UNDP Policy Advisors Team. A.2. Deliverables/ Outputs
The contractor will:
1) Develop a work plan for submission to UNDP. The proposal should outline the steps, inputs, and deadlines the contractor believes are necessary.
2) Conduct desk research / (grey) literature review 3) Do key informant interviews, mostly but not only in Hanoi 4) Present initial results to stakeholders for validation in first stakeholders workshop (see
package 2) 5) Make available a draft report for written comments from UNDP advisors and other
stakeholders 6) Produce a final analytical report in English and Vietnamese that reflects well the collected
data and the comments from UNDP advisors and other stakeholders. The contractor will reflect the following in the report:
Collect, analyse and make available (in annex) the various official regulations regarding price regulation, direct and indirect subsidies (such as concessional loans), various taxes and (possible, local) fees for different fossil fuels, fossil fuel producers and users
Analyse other support measures for state owned and private companies and asses the overall costs and benefits from production and trade in fossil fuels by key stakeholders
Assess the transfer of profits from state owned firms in the fossil fuel markets (production, trade, retail) to the national and local public budget.
Make estimates of total revenue as well as State expenditure, for recent years; of the potential effects of fossil fuel taxes on revenue collection in Viet Nam; and of the potential for financing social measures. Propose further study including suggestions for modelling of phase out subsidies and support measures and different taxation scenarios in fossil fuel markets; and on how to minimize potential negative economic impacts of fuel tax and to create a “double dividend” for environmental quality and long-term growth.
Include a list of literature and resource persons contacted
55
A.3. Durations of Assignment, Duty Station and Expected Places of Travel Up to a combined total of 25 working days are expected, predominantly by national experts but including some backstopping by an international expert, within the period from January to February 2011. The international expert may advise on design and draft findings – from home base. The national experts are expected to interview various stakeholders in Viet Nam, mostly but not only in Hanoi. A.4. Degree of Expertise and Qualifications The contractor should have a deep understanding of the Vietnamese fiscal system as well as the Vietnamese administration. Fluency in the Vietnamese language is crucial for core members of the team. The experts should also be familiar with prices and fuel market mechanisms in Viet Nam in order to produce an analysis. The team’s expertise must include good understanding of climate change, including greenhouse gas emissions in Viet Nam and specifically knowledge of energy production, trade and consumption in Viet Nam. The expertise of the team should include in depth knowledge of similar questions in other developing countries. Team members should hold secondary degrees in relevant subjects and have minimally 10 years working experience. All should have basic fluency in English, and at least one should have excellent English. The contractor will propose maximum 3 team members including possibly an international backstopper, and one of whom is the team leader. The team leader will have overall responsibility for the quality and timely submission of the final output.
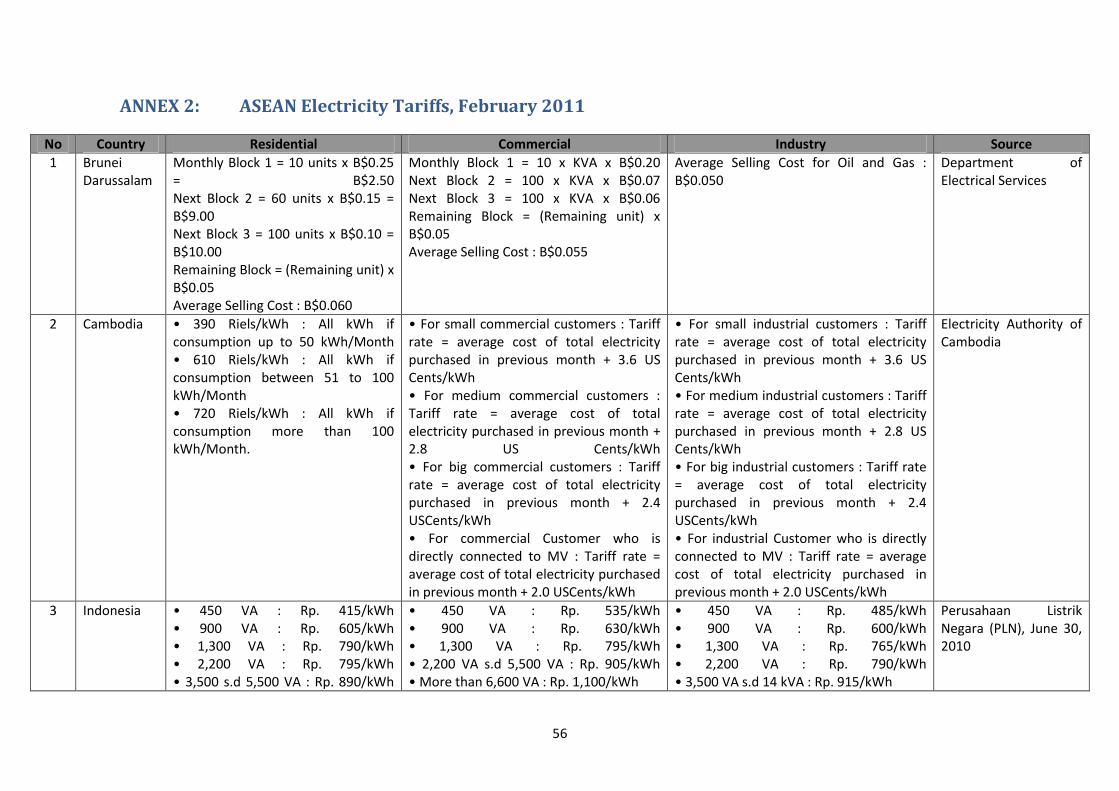
56
ANNEX 2: ASEAN Electricity Tariffs, February 2011
No Country Residential Commercial Industry Source
1 Brunei Darussalam
Monthly Block 1 = 10 units x B$0.25 = B$2.50 Next Block 2 = 60 units x B$0.15 = B$9.00 Next Block 3 = 100 units x B$0.10 = B$10.00 Remaining Block = (Remaining unit) x B$0.05 Average Selling Cost : B$0.060
Monthly Block 1 = 10 x KVA x B$0.20 Next Block 2 = 100 x KVA x B$0.07 Next Block 3 = 100 x KVA x B$0.06 Remaining Block = (Remaining unit) x B$0.05 Average Selling Cost : B$0.055
Average Selling Cost for Oil and Gas : B$0.050
Department of Electrical Services
2 Cambodia • 390 Riels/kWh : All kWh if consumption up to 50 kWh/Month • 610 Riels/kWh : All kWh if consumption between 51 to 100 kWh/Month • 720 Riels/kWh : All kWh if consumption more than 100 kWh/Month.
• For small commercial customers : Tariff rate = average cost of total electricity purchased in previous month + 3.6 US Cents/kWh • For medium commercial customers : Tariff rate = average cost of total electricity purchased in previous month + 2.8 US Cents/kWh • For big commercial customers : Tariff rate = average cost of total electricity purchased in previous month + 2.4 USCents/kWh • For commercial Customer who is directly connected to MV : Tariff rate = average cost of total electricity purchased in previous month + 2.0 USCents/kWh
• For small industrial customers : Tariff rate = average cost of total electricity purchased in previous month + 3.6 US Cents/kWh • For medium industrial customers : Tariff rate = average cost of total electricity purchased in previous month + 2.8 US Cents/kWh • For big industrial customers : Tariff rate = average cost of total electricity purchased in previous month + 2.4 USCents/kWh • For industrial Customer who is directly connected to MV : Tariff rate = average cost of total electricity purchased in previous month + 2.0 USCents/kWh
Electricity Authority of Cambodia
3 Indonesia • 450 VA : Rp. 415/kWh • 900 VA : Rp. 605/kWh • 1,300 VA : Rp. 790/kWh • 2,200 VA : Rp. 795/kWh • 3,500 s.d 5,500 VA : Rp. 890/kWh
• 450 VA : Rp. 535/kWh • 900 VA : Rp. 630/kWh • 1,300 VA : Rp. 795/kWh • 2,200 VA s.d 5,500 VA : Rp. 905/kWh • More than 6,600 VA : Rp. 1,100/kWh
• 450 VA : Rp. 485/kWh • 900 VA : Rp. 600/kWh • 1,300 VA : Rp. 765/kWh • 2,200 VA : Rp. 790/kWh • 3,500 VA s.d 14 kVA : Rp. 915/kWh
Perusahaan Listrik Negara (PLN), June 30, 2010
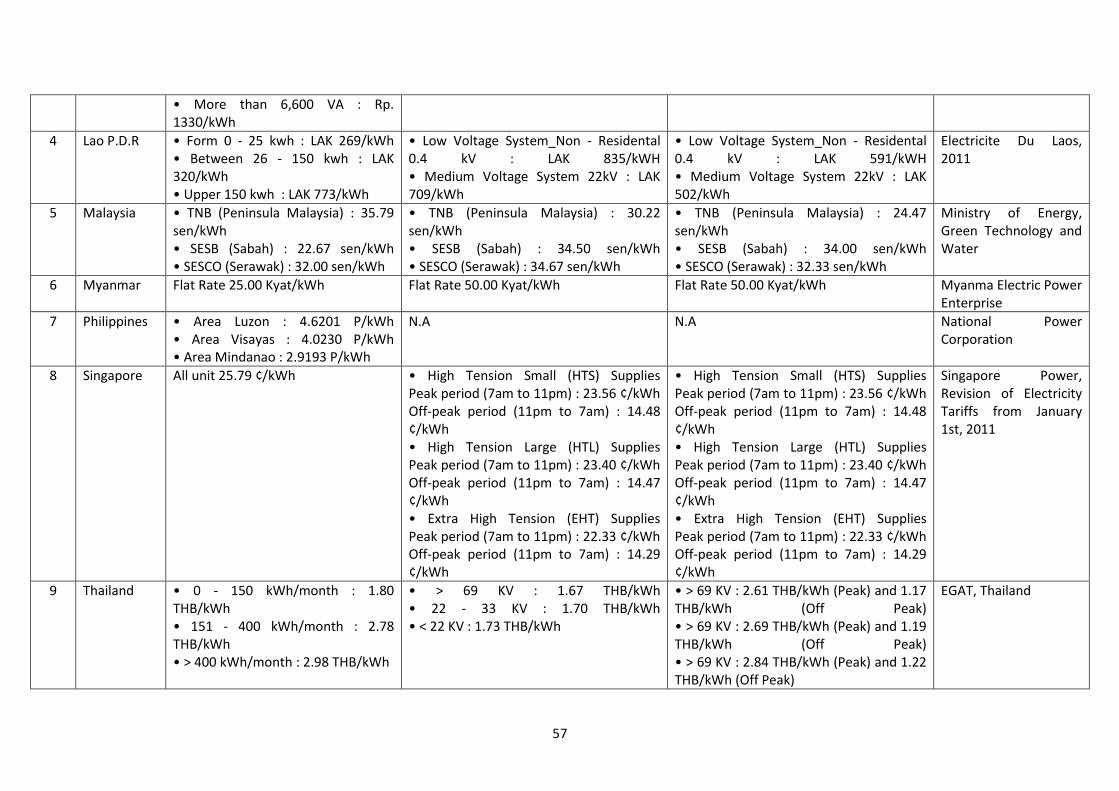
57
• More than 6,600 VA : Rp. 1330/kWh
4 Lao P.D.R • Form 0 - 25 kwh : LAK 269/kWh • Between 26 - 150 kwh : LAK 320/kWh • Upper 150 kwh : LAK 773/kWh
• Low Voltage System_Non - Residental 0.4 kV : LAK 835/kWH • Medium Voltage System 22kV : LAK 709/kWh
• Low Voltage System_Non - Residental 0.4 kV : LAK 591/kWH • Medium Voltage System 22kV : LAK 502/kWh
Electricite Du Laos, 2011
5 Malaysia • TNB (Peninsula Malaysia) : 35.79 sen/kWh • SESB (Sabah) : 22.67 sen/kWh • SESCO (Serawak) : 32.00 sen/kWh
• TNB (Peninsula Malaysia) : 30.22 sen/kWh • SESB (Sabah) : 34.50 sen/kWh • SESCO (Serawak) : 34.67 sen/kWh
• TNB (Peninsula Malaysia) : 24.47 sen/kWh • SESB (Sabah) : 34.00 sen/kWh • SESCO (Serawak) : 32.33 sen/kWh
Ministry of Energy, Green Technology and Water
6 Myanmar Flat Rate 25.00 Kyat/kWh Flat Rate 50.00 Kyat/kWh Flat Rate 50.00 Kyat/kWh Myanma Electric Power Enterprise
7 Philippines • Area Luzon : 4.6201 P/kWh • Area Visayas : 4.0230 P/kWh • Area Mindanao : 2.9193 P/kWh
N.A N.A National Power Corporation
8 Singapore All unit 25.79 ¢/kWh • High Tension Small (HTS) Supplies Peak period (7am to 11pm) : 23.56 ¢/kWh Off-peak period (11pm to 7am) : 14.48 ¢/kWh • High Tension Large (HTL) Supplies Peak period (7am to 11pm) : 23.40 ¢/kWh Off-peak period (11pm to 7am) : 14.47 ¢/kWh • Extra High Tension (EHT) Supplies Peak period (7am to 11pm) : 22.33 ¢/kWh Off-peak period (11pm to 7am) : 14.29 ¢/kWh
• High Tension Small (HTS) Supplies Peak period (7am to 11pm) : 23.56 ¢/kWh Off-peak period (11pm to 7am) : 14.48 ¢/kWh • High Tension Large (HTL) Supplies Peak period (7am to 11pm) : 23.40 ¢/kWh Off-peak period (11pm to 7am) : 14.47 ¢/kWh • Extra High Tension (EHT) Supplies Peak period (7am to 11pm) : 22.33 ¢/kWh Off-peak period (11pm to 7am) : 14.29 ¢/kWh
Singapore Power, Revision of Electricity Tariffs from January 1st, 2011
9 Thailand • 0 - 150 kWh/month : 1.80 THB/kWh • 151 - 400 kWh/month : 2.78 THB/kWh • > 400 kWh/month : 2.98 THB/kWh
• > 69 KV : 1.67 THB/kWh • 22 - 33 KV : 1.70 THB/kWh • < 22 KV : 1.73 THB/kWh
• > 69 KV : 2.61 THB/kWh (Peak) and 1.17 THB/kWh (Off Peak) • > 69 KV : 2.69 THB/kWh (Peak) and 1.19 THB/kWh (Off Peak) • > 69 KV : 2.84 THB/kWh (Peak) and 1.22 THB/kWh (Off Peak)
EGAT, Thailand
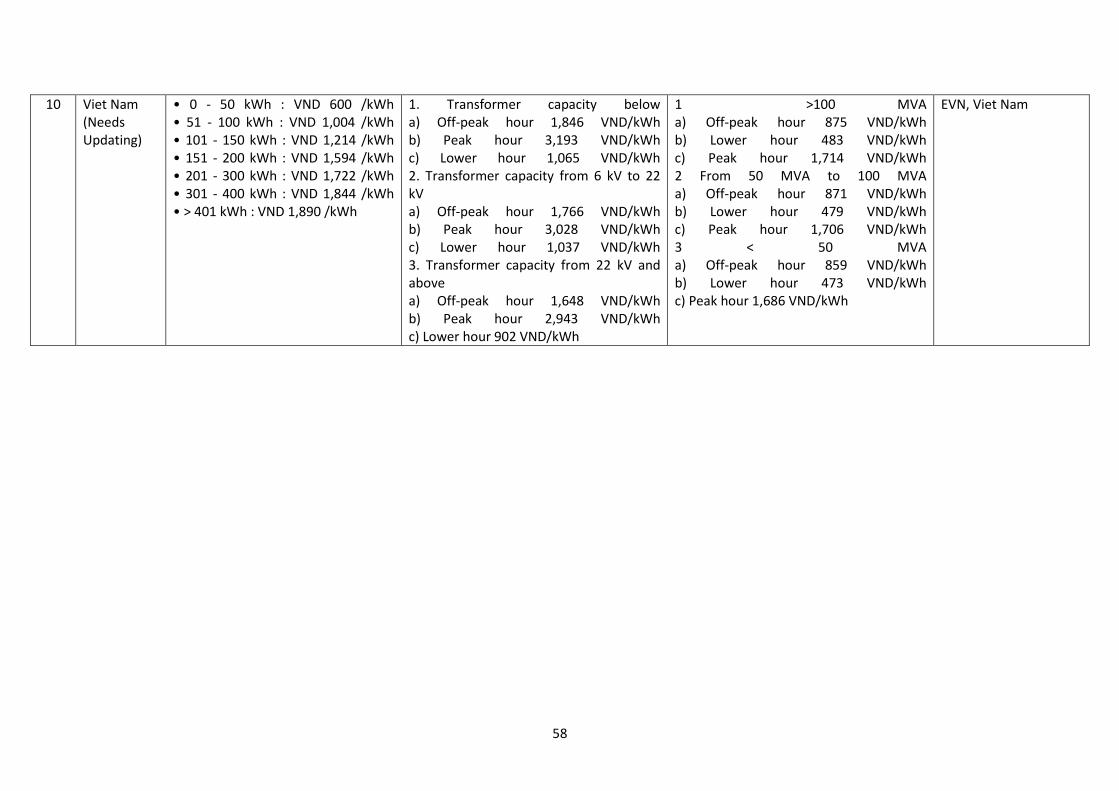
58
10 Viet Nam (Needs Updating)
• 0 - 50 kWh : VND 600 /kWh • 51 - 100 kWh : VND 1,004 /kWh • 101 - 150 kWh : VND 1,214 /kWh • 151 - 200 kWh : VND 1,594 /kWh • 201 - 300 kWh : VND 1,722 /kWh • 301 - 400 kWh : VND 1,844 /kWh • > 401 kWh : VND 1,890 /kWh
1. Transformer capacity below a) Off-peak hour 1,846 VND/kWh b) Peak hour 3,193 VND/kWh c) Lower hour 1,065 VND/kWh 2. Transformer capacity from 6 kV to 22 kV a) Off-peak hour 1,766 VND/kWh b) Peak hour 3,028 VND/kWh c) Lower hour 1,037 VND/kWh 3. Transformer capacity from 22 kV and above a) Off-peak hour 1,648 VND/kWh b) Peak hour 2,943 VND/kWh c) Lower hour 902 VND/kWh
1 >100 MVA a) Off-peak hour 875 VND/kWh b) Lower hour 483 VND/kWh c) Peak hour 1,714 VND/kWh 2 From 50 MVA to 100 MVA a) Off-peak hour 871 VND/kWh b) Lower hour 479 VND/kWh c) Peak hour 1,706 VND/kWh 3 < 50 MVA a) Off-peak hour 859 VND/kWh b) Lower hour 473 VND/kWh c) Peak hour 1,686 VND/kWh
EVN, Viet Nam
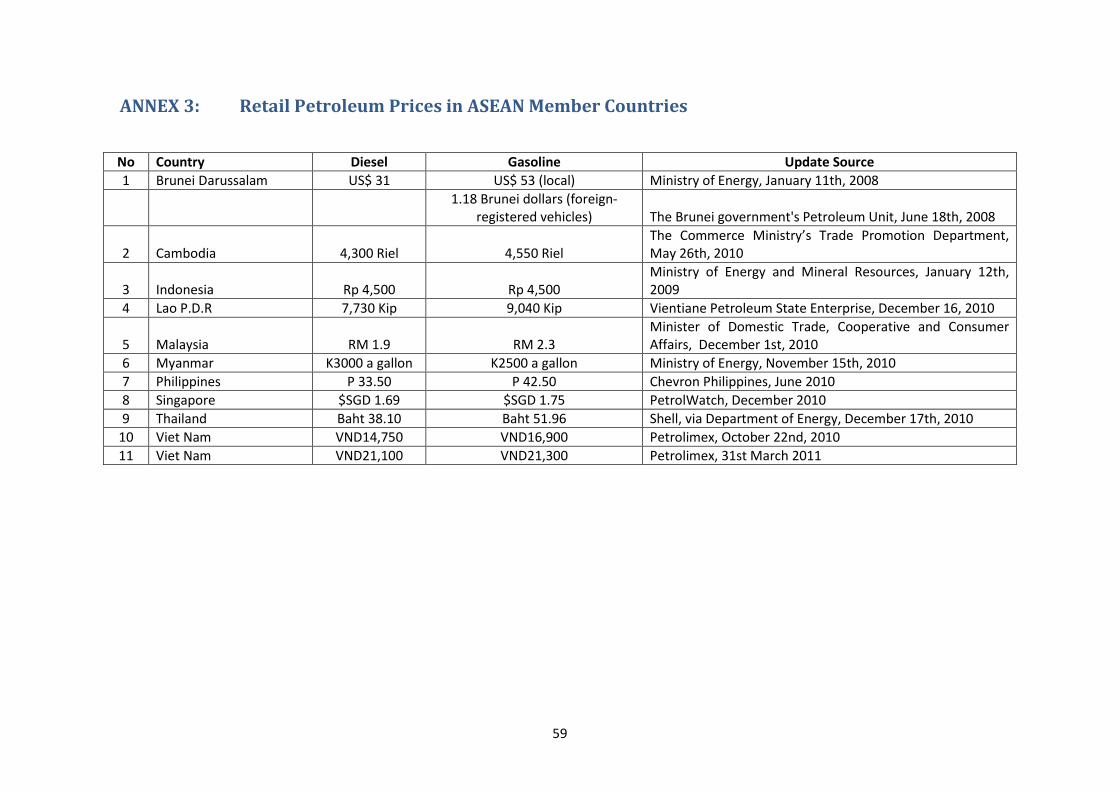
59
ANNEX 3: Retail Petroleum Prices in ASEAN Member Countries
No Country Diesel Gasoline Update Source
1 Brunei Darussalam US$ 31 US$ 53 (local) Ministry of Energy, January 11th, 2008
1.18 Brunei dollars (foreign-
registered vehicles) The Brunei government's Petroleum Unit, June 18th, 2008
2 Cambodia 4,300 Riel 4,550 Riel The Commerce Ministry’s Trade Promotion Department, May 26th, 2010
3 Indonesia Rp 4,500 Rp 4,500 Ministry of Energy and Mineral Resources, January 12th, 2009
4 Lao P.D.R 7,730 Kip 9,040 Kip Vientiane Petroleum State Enterprise, December 16, 2010
5 Malaysia RM 1.9 RM 2.3 Minister of Domestic Trade, Cooperative and Consumer Affairs, December 1st, 2010
6 Myanmar K3000 a gallon K2500 a gallon Ministry of Energy, November 15th, 2010
7 Philippines P 33.50 P 42.50 Chevron Philippines, June 2010
8 Singapore $SGD 1.69 $SGD 1.75 PetrolWatch, December 2010
9 Thailand Baht 38.10 Baht 51.96 Shell, via Department of Energy, December 17th, 2010
10 Viet Nam VND14,750 VND16,900 Petrolimex, October 22nd, 2010
11 Viet Nam VND21,100 VND21,300 Petrolimex, 31st March 2011
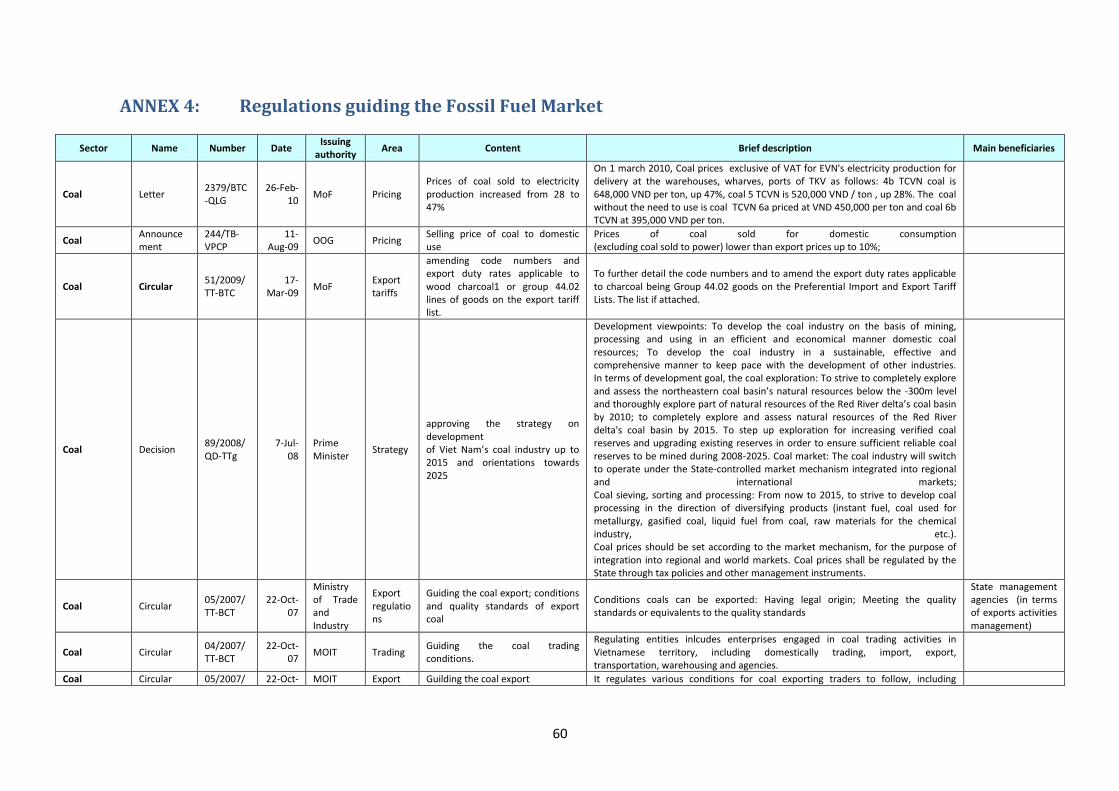
60
ANNEX 4: Regulations guiding the Fossil Fuel Market
Sector Name Number Date Issuing
authority Area Content Brief description Main beneficiaries
Coal Letter 2379/BTC-QLG
26-Feb-10
MoF Pricing Prices of coal sold to electricity production increased from 28 to 47%
On 1 march 2010, Coal prices exclusive of VAT for EVN's electricity production for delivery at the warehouses, wharves, ports of TKV as follows: 4b TCVN coal is 648,000 VND per ton, up 47%, coal 5 TCVN is 520,000 VND / ton , up 28%. The coal without the need to use is coal TCVN 6a priced at VND 450,000 per ton and coal 6b TCVN at 395,000 VND per ton.
Coal Announcement
244/TB-VPCP
11-Aug-09
OOG Pricing Selling price of coal to domestic use
Prices of coal sold for domestic consumption (excluding coal sold to power) lower than export prices up to 10%;
Coal Circular 51/2009/TT-BTC
17-Mar-09
MoF Export tariffs
amending code numbers and export duty rates applicable to wood charcoal1 or group 44.02 lines of goods on the export tariff list.
To further detail the code numbers and to amend the export duty rates applicable to charcoal being Group 44.02 goods on the Preferential Import and Export Tariff Lists. The list if attached.
Coal Decision 89/2008/QD-TTg
7-Jul-08
Prime Minister
Strategy
approving the strategy on development of Viet Nam’s coal industry up to 2015 and orientations towards 2025
Development viewpoints: To develop the coal industry on the basis of mining, processing and using in an efficient and economical manner domestic coal resources; To develop the coal industry in a sustainable, effective and comprehensive manner to keep pace with the development of other industries. In terms of development goal, the coal exploration: To strive to completely explore and assess the northeastern coal basin’s natural resources below the -300m level and thoroughly explore part of natural resources of the Red River delta’s coal basin by 2010; to completely explore and assess natural resources of the Red River delta's coal basin by 2015. To step up exploration for increasing verified coal reserves and upgrading existing reserves in order to ensure sufficient reliable coal reserves to be mined during 2008-2025. Coal market: The coal industry will switch to operate under the State-controlled market mechanism integrated into regional and international markets; Coal sieving, sorting and processing: From now to 2015, to strive to develop coal processing in the direction of diversifying products (instant fuel, coal used for metallurgy, gasified coal, liquid fuel from coal, raw materials for the chemical industry, etc.). Coal prices should be set according to the market mechanism, for the purpose of integration into regional and world markets. Coal prices shall be regulated by the State through tax policies and other management instruments.
Coal Circular 05/2007/TT-BCT
22-Oct-07
Ministry of Trade and Industry
Export regulations
Guiding the coal export; conditions and quality standards of export coal
Conditions coals can be exported: Having legal origin; Meeting the quality standards or equivalents to the quality standards
State management agencies (in terms of exports activities management)
Coal Circular 04/2007/TT-BCT
22-Oct-07
MOIT Trading Guiding the coal trading conditions.
Regulating entities inlcudes enterprises engaged in coal trading activities in Vietnamese territory, including domestically trading, import, export, transportation, warehousing and agencies.
Coal Circular 05/2007/ 22-Oct- MOIT Export Guilding the coal export It regulates various conditions for coal exporting traders to follow, including
61
Sector Name Number Date Issuing
authority Area Content Brief description Main beneficiaries
TT-BCT 07 regulations
effective lisences, contracts, and valid documents to prove legal sources of coals explored for exports or imports. report regime for the coal exports and imports are also specified. Traders need to register their coal export plan to MOIT. At the same time, they need to submit list, conditions and quality standards of exported coal as well. Technical requirements for exports of diffferen types of coals are also specified.
Coal Decision 20/2003/QD-TTg
29-Jan-03
Prime Minister
Strategy
Approving the development planning for Viet Nam's coal industry in the 2003-2010 period, with the prospects till 2020 taken into consideration
Orientations for the development of coal industry: coal must be done in an economical and efficient manner; sustainably develop the coal industry; The production output of merchandise coal is estimated at the following levels: By 2005: 16-17 million tons; By 2010: 23-24 million tons; By 2015: 26-27 million tons; By 2020: 29-30 million tons. The merchandise coal output may be adjusted to suit the market demand in each period, taking into consideration the importation of coal on the basis of balancing the common efficiency of the economy. The total investment capital for the 2003-2010 period is estimated at about VND 14,166 billion, in which: Capital for investment in maintenance, expansion and construction shall be about VND 12,933 billion; Additional capital for business activities shall be about VND 1,233 billion. Responsibilities of different relevant ministries are specified, in which the Ministry of Finance are to submit to the Prime Minister for decision on reasonable selling prices of coal for four big coal consumers, namely electricity, cement, paper and fertilizer industries, on the principle of fully covering reasonable production costs, then striving to apply coal selling prices under the market mechanism by 2006
Coal Decision 38/2002/QD-TTg
17-Jan-02
Prime Minister
Import Tariffs
prescribing the preferential import tax rate for a number of explosion-preventing machinery and equipment for exclusive use in pit coal mining as well as a number of supplies and equipment for manufacture and assembly thereof
To apply the import tax rate of 0% (zero per cent) to a number of explosion-preventing machinery and equipment for exclusive use in pit coal mining as well as a number of supplies and equipment for manufacture and assembly of such machinery and equipment
Electricty Decision 24/2011/QD-TTg
16-Apr-11
Prime Minister
Pricing
on the adjustment of electricity selling price according to market mechanism
Applied to the organizations, individuals who participate in activities of electricity and use electricity. Average electricity selling price means the price is defined in accordance with principle of average calculation per 01 KWh of electricity, including 04 components: price of electricity generation, price of electricity transmission, price of electricity distribution, cost of management and administration and electricity system supporting services; hereinafter called as electricity selling price. In the financial year, electricity selling price is adjusted just when the basic input parameter changing compared to the parameter which is used to define the current electricity selling price. Other input parameter of electricity selling price are considered to adjust electricity selling price only after having accounting, audit reports according to the provisions; duration of adjustment is every 3 months.
Electricty Circular 05/2011/ 25-Feb- MOIT Pricing Regulating the selling price of Applied to all organizations, individuals buying and selling electricity from national Benefiticiaries tend
62
Sector Name Number Date Issuing
authority Area Content Brief description Main beneficiaries
TT-BCT 11 electricity in 2011 and implementation guildlines
supply network; average selling price of electricity for 2011 is 1.242VND/Kwh (VAT excl); EVN-EPTC's average wholesale price to electricity companies: 891,4 VND/kwh; whole sale price for other purposes (rather than for daily life and irrigation) is 1.012VND/kwh. The circular also specifies various methods of calculating selling prices of electricity to different buyers from rural areas to industrial parks.
to be I favour of individual users for purposes of daily life
Electricty Decision 268/QD-TTg
23-Feb-11
Prime Minister
Pricing Regulating electricity retail prices
Principles on developing retail prices: prices are regulated based on different users: production, businesses; administrative agencies, residents. Selling prices at different range of time within a day are specified for users of big amount of electricity like for production and businesses. The poor household according to GoV criteria shall be subsidised for 50kwh/month; the subsidy amount is 30,000VND/month. Budget for subsidy comes from electricity selling. The Ministry of Finance and MOIT to coordinate to issue subsidy regime for poor families. And MOLISA shall receive subsidy to allocate to different localities/provinces.
Electricty Circular 08/2010/TT-BCT
24-Feb-10
MOIT Pricing Regulating the selling price of electricity in 2010 and implementation guildlines
Applied to all organizations, individuals buying and selling electricity from national supply network; average selling price of electricity for 2010 is 1.058VND/Kwh (VAT excl); EVN-EPTC's average wholesale price to electricity companies: 718,1 VND/kwh; wholesale price for rural irrigation is 703 VND/kwh.; whole sale price for other purposes (rather than for daily life and irrigation) is 1.010VND/kwh. The circular also specifies various methods of calculating selling prices of electricity to different buyers.
Benefiticiaries tend to be in favour of individual users for purposes of daily life
Electricty Law n/a 1-Jul-
05 National Assembly
Law Electricity Law
The Law aims to stimulate development and diversify forms of investment in the electricity sector, encourage economical use of electricity, protect the country’s electricity infrastructure and develop a competitive electricity market. The output target of 44bn kWh by 2005, set out in the five year plan passed by the Party’s National Congress IX in April 2001, was met on 10 December 2004, over a year ahead of schedule; Yet, much work remains to be done to meet the new and more ambitious targets of 53bn kWh by the end of 2005, 88-93 bn kWh by 2010 and 201-250bn kWh by 2020 as laid down in the Strategy for Electricity Development set out . Planning for electricity development is the first issue addressed in the Electricity Law. The Law sets forth policy on electricity pricing, including to implement and then gradually reduce and eliminate a reasonable price cross-subsidy regime between different groups of customers; and to ensure the right of entities purchasing and selling electricity on the electricity market to make their own decisions on the price of purchase and sale of electricity within the electricity tariff stipulated in the state regulations.
Electricity Law 28/2004- 3-Dec- National Law Viet Nam electricity law This Law regulates planning and investment in the development of electricity;
63
Sector Name Number Date Issuing
authority Area Content Brief description Main beneficiaries
QH11 04 Assembly saving electricity power market, rights and obligations of organizations and individuals engaged in electricity activities and electricity use, protection of electrical equipment, electricity works and electric safety.
Electricity Decision 176/2004/QD-TTg
5-Oct-04
Prime Minister
Strategy
approving the strategy on development of Viet Nam electricity industry in the 2004-2010 period, with orientations towards 2020
Specific objectives: Meet electricity needs for social.-economic development- Striving to output in 2005 reached about 53 billion kWh, in 2010 output from about 88 to 93 billion kWh, in 2020 output from 201 to 250 billion kWh; Accelerate the program of stringing electricity to the countryside, mountaineous areas, striving in 2010 to reach 90% of rural households having electricity, 2020, 100% of rural households having electricity. Development of coal thermal powerstations: expected in 2010 with a total capacity of 4,400 MW. Period 2011 - 2020 required the construction of around 4500-5500 MW (base load), from 8000 to 10,000 MW (high load). Due to the fact that domestic coal resources are limited, consider the construction of power plants using imported coal. Gas thermal power: up to 2010 with total capacity of about 7,000 MW, the period from 2011 to 2020 to build about 3,500 MW (the gas supply facilities), in the case of discovered gas resources needed to build more about 7,000 MW. Investment surveys, research, preparing the conditions necessary to build the first atomic power plant in Viet Nam with the capacity of 2,000 MW, is expected to commence operation period after 2015 .
Energy General
Decision 1885/QD-TTg
27-Dec-07
Strategy
approve Viet Nam's national energy development strategy up to 2020, with 2050 vision
the overall objectives are to assure national energy security, contributing to firmly maintaining security and defense and developing an independent and self-reliant economy; to supply adequate high-quality energy for socio-economic development; to exploit and use domestic energy resources in a rational and efficient manner; to diversify forms of investment and business in the energy domain, and develop an energy market conducive to fair competition; to boost the development of new and renewable energies, bio-energy and nuclear power in order to meet the requirements of socio-economic development, especially in deep-lying, remote and border areas and offshore islands; and developing the energy sector in a quick, efficient and sustainable manner in association with environmental protection. Specifically: To strive to supply adequate energy for society-economic development, including about 47.5 - 49.5 million TOE (ton of oil equivalent) of primary energy by 2010, about 100 -110 million TOE by 2020, 110 - 120million TOE by 2025 and 310-320 million TOE by 2050.; To develop electricity sources and grids, to meet electricity demands for socioeconomic development, by 2010, the supply reliability of electricity sources will reach 99 .7%; and electricity grids will reach n-I standard. - To develop oil refineries, step by step satisfy domestic demand for oil product, and increase the total capacity of oil refineries to 25-30 million tons of crude oil by 2020; - To raise the level of national strategic petrol and oil reserves to the
power sectors: petroleum, electricity, coal...
64
Sector Name Number Date Issuing
authority Area Content Brief description Main beneficiaries
equivalent of 45 days of average consumption by 2010, 60 days by 2020 and 90 days by 2025; - To strive to increase the proportion of new and renewable energies to about 3% of the total amount of commercial primary energy by 2010; a+G10bout 5% by 2020 and 11% by 2050.; - To complete the program on rural and mountainous energy. To increase the rate of rural household using commercial energy for cooking to 50% by 2010 and 80% by 2020. By 2010, 95% of rural households will be supplied with electricity and by 2020, almost all rura1 households will be supplied with electricity.
Energy General
Decision 110/2007/QD-TTg
18-Jul-07
Prime Minister
Master Plan
6th Power development Master Plan
Decision of the Prime Minister dated July 18th 2007 on National power development for the period 2006-2015 with outlook to 2025
Energy General
Law 50/2010/QH12
17-Jun-10
National Assembly
Energy Conservation
on economical and efficient use of energy
This Law provides economical and efficient use of energy; policies and measures to promote economical and efficient use of energy; and the rights, obligations and responsibilities of organizations, households and individuals in economical and efficient use of energy.
Energy General
Decree 21/2011/NĐ-CP
29-Mar-11
GoV Energy Conservation
Detailed regulations and measures to implement the Law on economical and efficient use of energy
This Decree provides for statistics on energy use, key facilities using energy, energy saving and efficiency in the agencies and units using state budget; labeling for energy facilities, equipment using energy, measures to promote energy saving and effective inspection and inspection on the use of energy saving and efficiency.
Environment Decision 4103/QD-BCT
3-Aug-10
MOIT Action Plan
Action Plan In response to climate change of MOIT
One of the objective mentioned in the AP is to concertedly and synchronously implement related activities under NTP on Energy Efficinency and Conservation, the biofuel development scheme and related others, research and apply "low carbon emission technologies", take the advantage of making green industry towards the development of low carbon economy; budget for programmed implementation is taken from the state budget callocated to NTP on CC's response for MOIT.
Environment Decision 153/2004/QĐ-TTG
17-Aug-04
Prime Minister
Energy Conservation
Agenda 21
Sustainable development is mentioned; safety of resources; envionmental protection is most prioritised by GoV in economic development; bio-diversification preservation; petroleum and coal have been much used for daily life and transportation; Energy sector created great amount of emissions to the surrounding; currently there are more than 1000 mines in operation exploiting more than 50 kinds of minerals; comprehensive solutions are stated; appropriate exploitation of natural resources; coal, gas and small-scale hydro-power are encouraged for use in stead of woods; system of policies and laws/regulations should be strengthened; financial tools are used to encourage and support sustainable development; state budget to be more allocated to this area;
Environment Circular 230/2009/TT-BTC
8-Dec-09
MoF Tax
Guiding tax incentives for environmental protection activities prescribed in the government's Decree no. 04/2009/nd-cp
Tax exemption; tax rate; Enterprise income tax incentives ; Value-added tax incentives
Enterprises following environmentatl protecttion provisions
Environment Decree 102/2003 9-Mar- GoV Energy Energy Conservation and Energy a) To establish and notify energy standards for factory, building and equipment; To
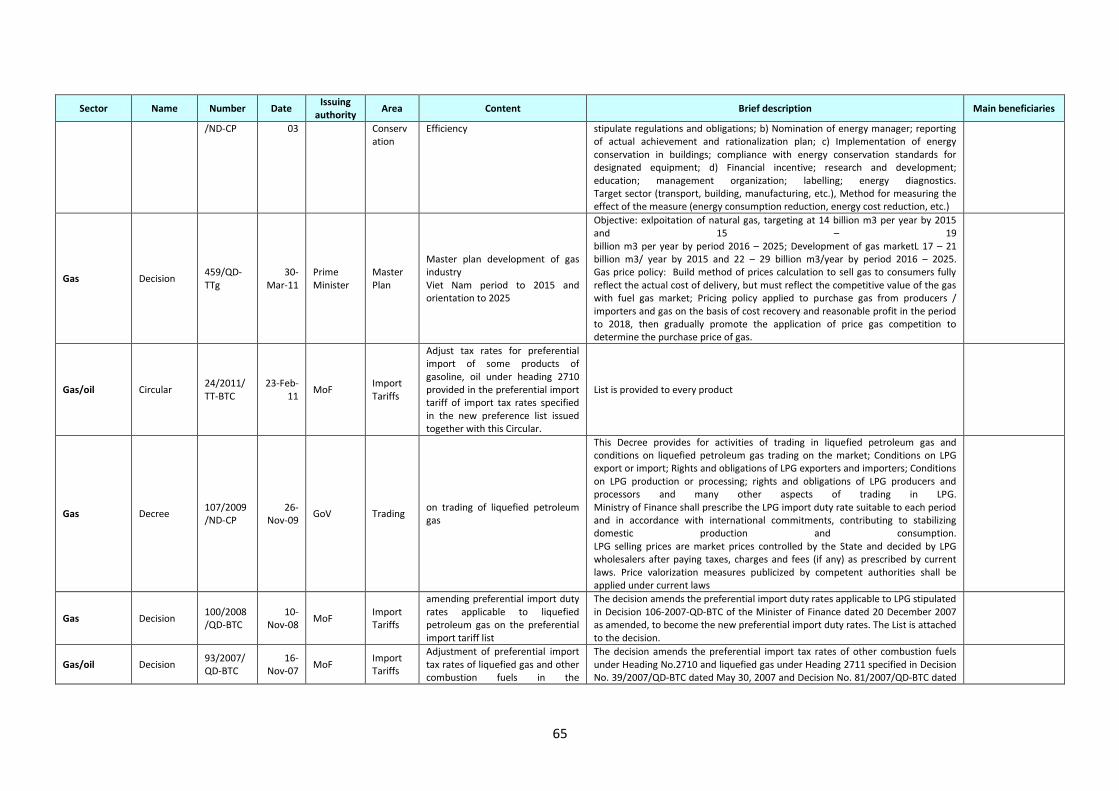
65
Sector Name Number Date Issuing
authority Area Content Brief description Main beneficiaries
/ND-CP 03 Conservation
Efficiency stipulate regulations and obligations; b) Nomination of energy manager; reporting of actual achievement and rationalization plan; c) Implementation of energy conservation in buildings; compliance with energy conservation standards for designated equipment; d) Financial incentive; research and development; education; management organization; labelling; energy diagnostics. Target sector (transport, building, manufacturing, etc.), Method for measuring the effect of the measure (energy consumption reduction, energy cost reduction, etc.)
Gas Decision 459/QD-TTg
30-Mar-11
Prime Minister
Master Plan
Master plan development of gas industry Viet Nam period to 2015 and orientation to 2025
Objective: exlpoitation of natural gas, targeting at 14 billion m3 per year by 2015 and 15 – 19 billion m3 per year by period 2016 – 2025; Development of gas marketL 17 – 21 billion m3/ year by 2015 and 22 – 29 billion m3/year by period 2016 – 2025. Gas price policy: Build method of prices calculation to sell gas to consumers fully reflect the actual cost of delivery, but must reflect the competitive value of the gas with fuel gas market; Pricing policy applied to purchase gas from producers / importers and gas on the basis of cost recovery and reasonable profit in the period to 2018, then gradually promote the application of price gas competition to determine the purchase price of gas.
Gas/oil Circular 24/2011/TT-BTC
23-Feb-11
MoF Import Tariffs
Adjust tax rates for preferential import of some products of gasoline, oil under heading 2710 provided in the preferential import tariff of import tax rates specified in the new preference list issued together with this Circular.
List is provided to every product
Gas Decree 107/2009/ND-CP
26-Nov-09
GoV Trading on trading of liquefied petroleum gas
This Decree provides for activities of trading in liquefied petroleum gas and conditions on liquefied petroleum gas trading on the market; Conditions on LPG export or import; Rights and obligations of LPG exporters and importers; Conditions on LPG production or processing; rights and obligations of LPG producers and processors and many other aspects of trading in LPG. Ministry of Finance shall prescribe the LPG import duty rate suitable to each period and in accordance with international commitments, contributing to stabilizing domestic production and consumption. LPG selling prices are market prices controlled by the State and decided by LPG wholesalers after paying taxes, charges and fees (if any) as prescribed by current laws. Price valorization measures publicized by competent authorities shall be applied under current laws
Gas Decision 100/2008/QD-BTC
10-Nov-08
MoF Import Tariffs
amending preferential import duty rates applicable to liquefied petroleum gas on the preferential import tariff list
The decision amends the preferential import duty rates applicable to LPG stipulated in Decision 106-2007-QD-BTC of the Minister of Finance dated 20 December 2007 as amended, to become the new preferential import duty rates. The List is attached to the decision.
Gas/oil Decision 93/2007/QD-BTC
16-Nov-07
MoF Import Tariffs
Adjustment of preferential import tax rates of liquefied gas and other combustion fuels in the
The decision amends the preferential import tax rates of other combustion fuels under Heading No.2710 and liquefied gas under Heading 2711 specified in Decision No. 39/2007/QD-BTC dated May 30, 2007 and Decision No. 81/2007/QD-BTC dated
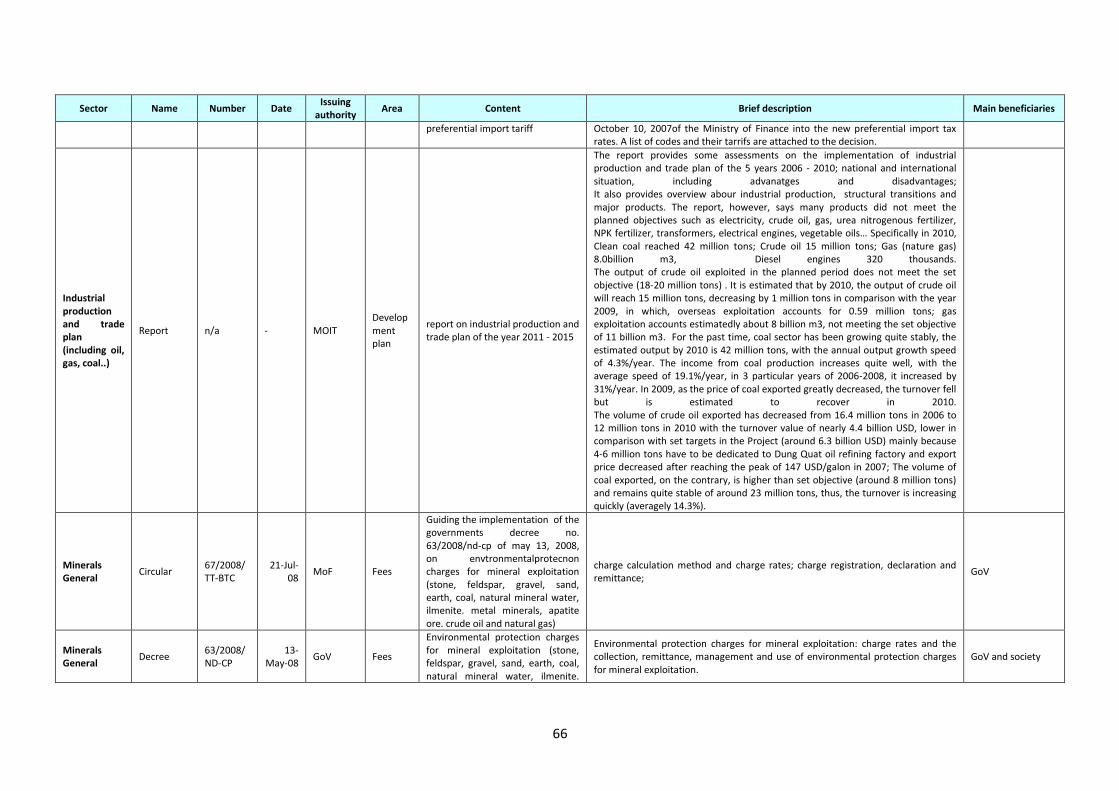
66
Sector Name Number Date Issuing
authority Area Content Brief description Main beneficiaries
preferential import tariff October 10, 2007of the Ministry of Finance into the new preferential import tax rates. A list of codes and their tarrifs are attached to the decision.
Industrial production and trade plan (including oil, gas, coal..)
Report n/a - MOIT Development plan
report on industrial production and trade plan of the year 2011 - 2015
The report provides some assessments on the implementation of industrial production and trade plan of the 5 years 2006 - 2010; national and international situation, including advanatges and disadvantages; It also provides overview abour industrial production, structural transitions and major products. The report, however, says many products did not meet the planned objectives such as electricity, crude oil, gas, urea nitrogenous fertilizer, NPK fertilizer, transformers, electrical engines, vegetable oils… Specifically in 2010, Clean coal reached 42 million tons; Crude oil 15 million tons; Gas (nature gas) 8.0billion m3, Diesel engines 320 thousands. The output of crude oil exploited in the planned period does not meet the set objective (18-20 million tons) . It is estimated that by 2010, the output of crude oil will reach 15 million tons, decreasing by 1 million tons in comparison with the year 2009, in which, overseas exploitation accounts for 0.59 million tons; gas exploitation accounts estimatedly about 8 billion m3, not meeting the set objective of 11 billion m3. For the past time, coal sector has been growing quite stably, the estimated output by 2010 is 42 million tons, with the annual output growth speed of 4.3%/year. The income from coal production increases quite well, with the average speed of 19.1%/year, in 3 particular years of 2006-2008, it increased by 31%/year. In 2009, as the price of coal exported greatly decreased, the turnover fell but is estimated to recover in 2010. The volume of crude oil exported has decreased from 16.4 million tons in 2006 to 12 million tons in 2010 with the turnover value of nearly 4.4 billion USD, lower in comparison with set targets in the Project (around 6.3 billion USD) mainly because 4-6 million tons have to be dedicated to Dung Quat oil refining factory and export price decreased after reaching the peak of 147 USD/galon in 2007; The volume of coal exported, on the contrary, is higher than set objective (around 8 million tons) and remains quite stable of around 23 million tons, thus, the turnover is increasing quickly (averagely 14.3%).
Minerals General
Circular 67/2008/TT-BTC
21-Jul-08
MoF Fees
Guiding the implementation of the governments decree no. 63/2008/nd-cp of may 13, 2008, on envtronmentalprotecnon charges for mineral exploitation (stone, feldspar, gravel, sand, earth, coal, natural mineral water, ilmenite. metal minerals, apatite ore. crude oil and natural gas)
charge calculation method and charge rates; charge registration, declaration and remittance;
GoV
Minerals General
Decree 63/2008/ND-CP
13-May-08
GoV Fees
Environmental protection charges for mineral exploitation (stone, feldspar, gravel, sand, earth, coal, natural mineral water, ilmenite.
Environmental protection charges for mineral exploitation: charge rates and the collection, remittance, management and use of environmental protection charges for mineral exploitation.
GoV and society
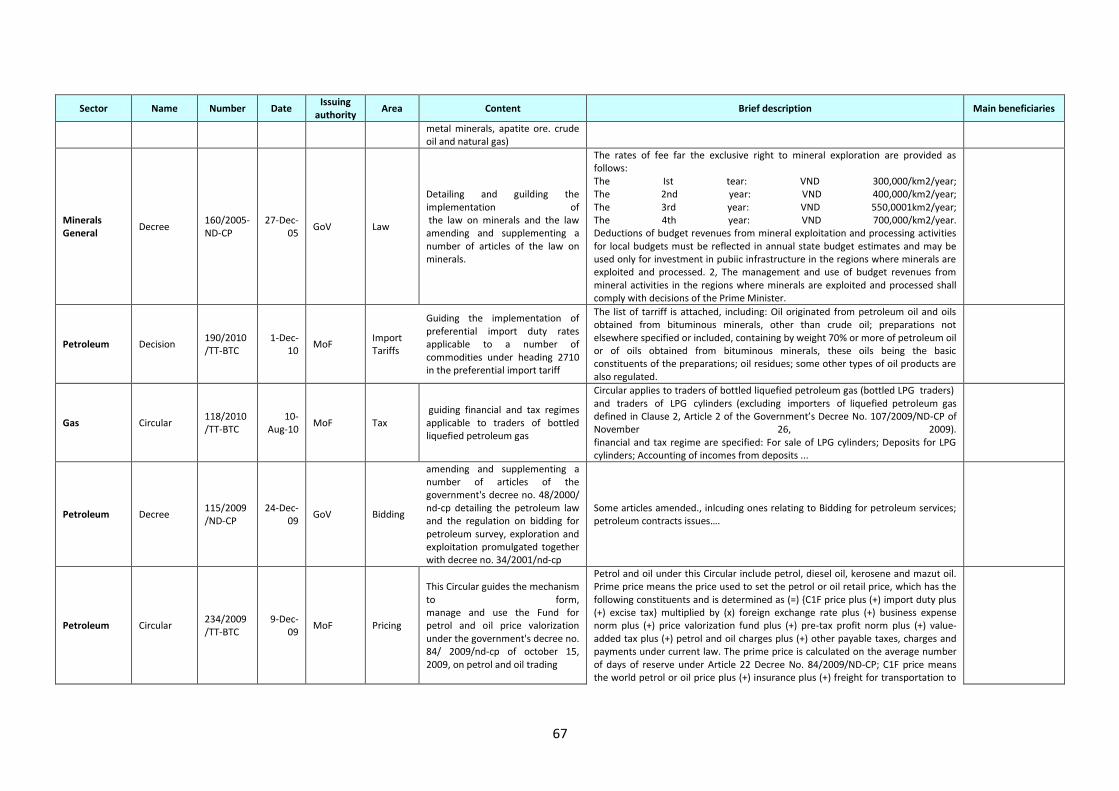
67
Sector Name Number Date Issuing
authority Area Content Brief description Main beneficiaries
metal minerals, apatite ore. crude oil and natural gas)
Minerals General
Decree 160/2005-ND-CP
27-Dec-05
GoV Law
Detailing and guilding the implementation of the law on minerals and the law amending and supplementing a number of articles of the law on minerals.
The rates of fee far the exclusive right to mineral exploration are provided as follows: The Ist tear: VND 300,000/km2/year; The 2nd year: VND 400,000/km2/year; The 3rd year: VND 550,0001km2/year; The 4th year: VND 700,000/km2/year. Deductions of budget revenues from mineral exploitation and processing activities for local budgets must be reflected in annual state budget estimates and may be used only for investment in pubiic infrastructure in the regions where minerals are exploited and processed. 2, The management and use of budget revenues from mineral activities in the regions where minerals are exploited and processed shall comply with decisions of the Prime Minister.
Petroleum Decision 190/2010/TT-BTC
1-Dec-10
MoF Import Tariffs
Guiding the implementation of preferential import duty rates applicable to a number of commodities under heading 2710 in the preferential import tariff
The list of tarriff is attached, including: Oil originated from petroleum oil and oils obtained from bituminous minerals, other than crude oil; preparations not elsewhere specified or included, containing by weight 70% or more of petroleum oil or of oils obtained from bituminous minerals, these oils being the basic constituents of the preparations; oil residues; some other types of oil products are also regulated.
Gas Circular 118/2010/TT-BTC
10-Aug-10
MoF Tax guiding financial and tax regimes applicable to traders of bottled liquefied petroleum gas
Circular applies to traders of bottled liquefied petroleum gas (bottled LPG traders) and traders of LPG cylinders (excluding importers of liquefied petroleum gas defined in Clause 2, Article 2 of the Government’s Decree No. 107/2009/ND-CP of November 26, 2009). financial and tax regime are specified: For sale of LPG cylinders; Deposits for LPG cylinders; Accounting of incomes from deposits ...
Petroleum Decree 115/2009/ND-CP
24-Dec-09
GoV Bidding
amending and supplementing a number of articles of the government's decree no. 48/2000/ nd-cp detailing the petroleum law and the regulation on bidding for petroleum survey, exploration and exploitation promulgated together with decree no. 34/2001/nd-cp
Some articles amended., inlcuding ones relating to Bidding for petroleum services; petroleum contracts issues….
Petroleum Circular 234/2009/TT-BTC
9-Dec-09
MoF Pricing
This Circular guides the mechanism to form, manage and use the Fund for petrol and oil price valorization under the government's decree no. 84/ 2009/nd-cp of october 15, 2009, on petrol and oil trading
Petrol and oil under this Circular include petrol, diesel oil, kerosene and mazut oil. Prime price means the price used to set the petrol or oil retail price, which has the following constituents and is determined as (=) {C1F price plus (+) import duty plus (+) excise tax} multiplied by (x) foreign exchange rate plus (+) business expense norm plus (+) price valorization fund plus (+) pre-tax profit norm plus (+) value-added tax plus (+) petrol and oil charges plus (+) other payable taxes, charges and payments under current law. The prime price is calculated on the average number of days of reserve under Article 22 Decree No. 84/2009/ND-CP; C1F price means the world petrol or oil price plus (+) insurance plus (+) freight for transportation to
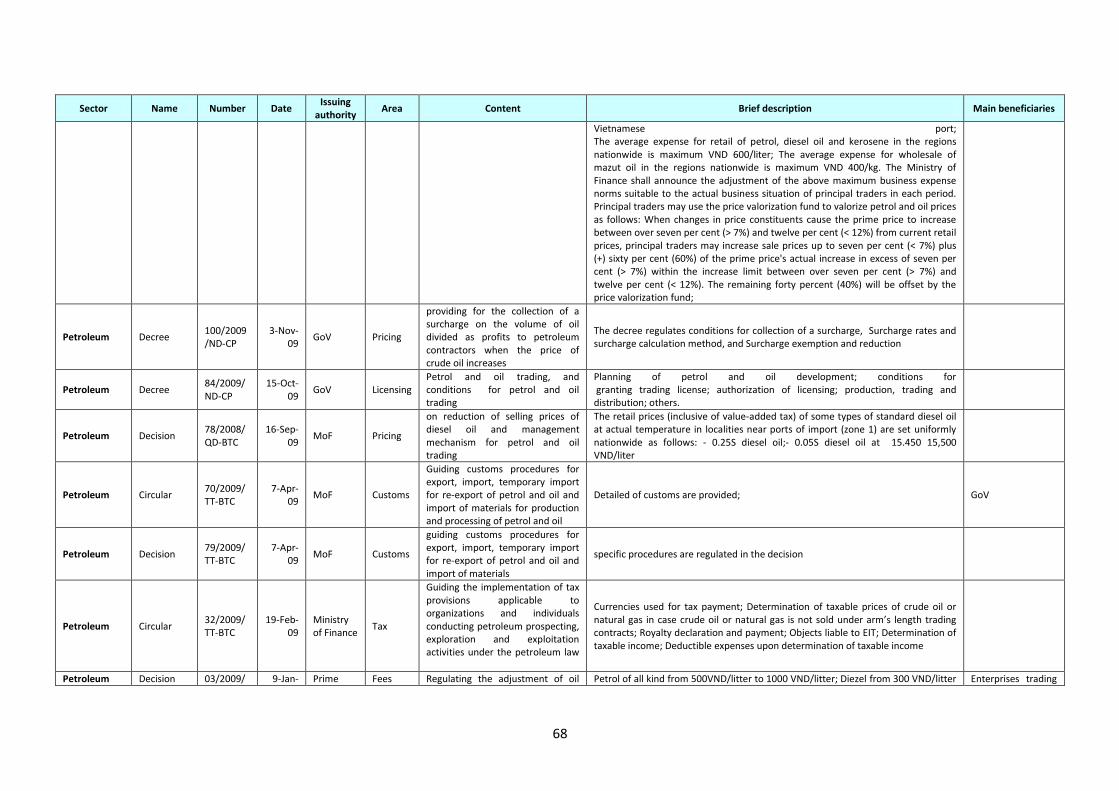
68
Sector Name Number Date Issuing
authority Area Content Brief description Main beneficiaries
Vietnamese port; The average expense for retail of petrol, diesel oil and kerosene in the regions nationwide is maximum VND 600/liter; The average expense for wholesale of mazut oil in the regions nationwide is maximum VND 400/kg. The Ministry of Finance shall announce the adjustment of the above maximum business expense norms suitable to the actual business situation of principal traders in each period. Principal traders may use the price valorization fund to valorize petrol and oil prices as follows: When changes in price constituents cause the prime price to increase between over seven per cent (> 7%) and twelve per cent (< 12%) from current retail prices, principal traders may increase sale prices up to seven per cent (< 7%) plus (+) sixty per cent (60%) of the prime price's actual increase in excess of seven per cent (> 7%) within the increase limit between over seven per cent (> 7%) and twelve per cent (< 12%). The remaining forty percent (40%) will be offset by the price valorization fund;
Petroleum Decree 100/2009/ND-CP
3-Nov-09
GoV Pricing
providing for the collection of a surcharge on the volume of oil divided as profits to petroleum contractors when the price of crude oil increases
The decree regulates conditions for collection of a surcharge, Surcharge rates and surcharge calculation method, and Surcharge exemption and reduction
Petroleum Decree 84/2009/ND-CP
15-Oct-09
GoV Licensing Petrol and oil trading, and conditions for petrol and oil trading
Planning of petrol and oil development; conditions for granting trading license; authorization of licensing; production, trading and distribution; others.
Petroleum Decision 78/2008/QD-BTC
16-Sep-09
MoF Pricing
on reduction of selling prices of diesel oil and management mechanism for petrol and oil trading
The retail prices (inclusive of value-added tax) of some types of standard diesel oil at actual temperature in localities near ports of import (zone 1) are set uniformly nationwide as follows: - 0.25S diesel oil;- 0.05S diesel oil at 15.450 15,500 VND/liter
Petroleum Circular 70/2009/TT-BTC
7-Apr-09
MoF Customs
Guiding customs procedures for export, import, temporary import for re-export of petrol and oil and import of materials for production and processing of petrol and oil
Detailed of customs are provided; GoV
Petroleum Decision 79/2009/TT-BTC
7-Apr-09
MoF Customs
guiding customs procedures for export, import, temporary import for re-export of petrol and oil and import of materials
specific procedures are regulated in the decision
Petroleum Circular 32/2009/TT-BTC
19-Feb-09
Ministry of Finance
Tax
Guiding the implementation of tax provisions applicable to organizations and individuals conducting petroleum prospecting, exploration and exploitation activities under the petroleum law
Currencies used for tax payment; Determination of taxable prices of crude oil or natural gas in case crude oil or natural gas is not sold under arm’s length trading contracts; Royalty declaration and payment; Objects liable to EIT; Determination of taxable income; Deductible expenses upon determination of taxable income
Petroleum Decision 03/2009/ 9-Jan- Prime Fees Regulating the adjustment of oil Petrol of all kind from 500VND/litter to 1000 VND/litter; Diezel from 300 VND/litter Enterprises trading
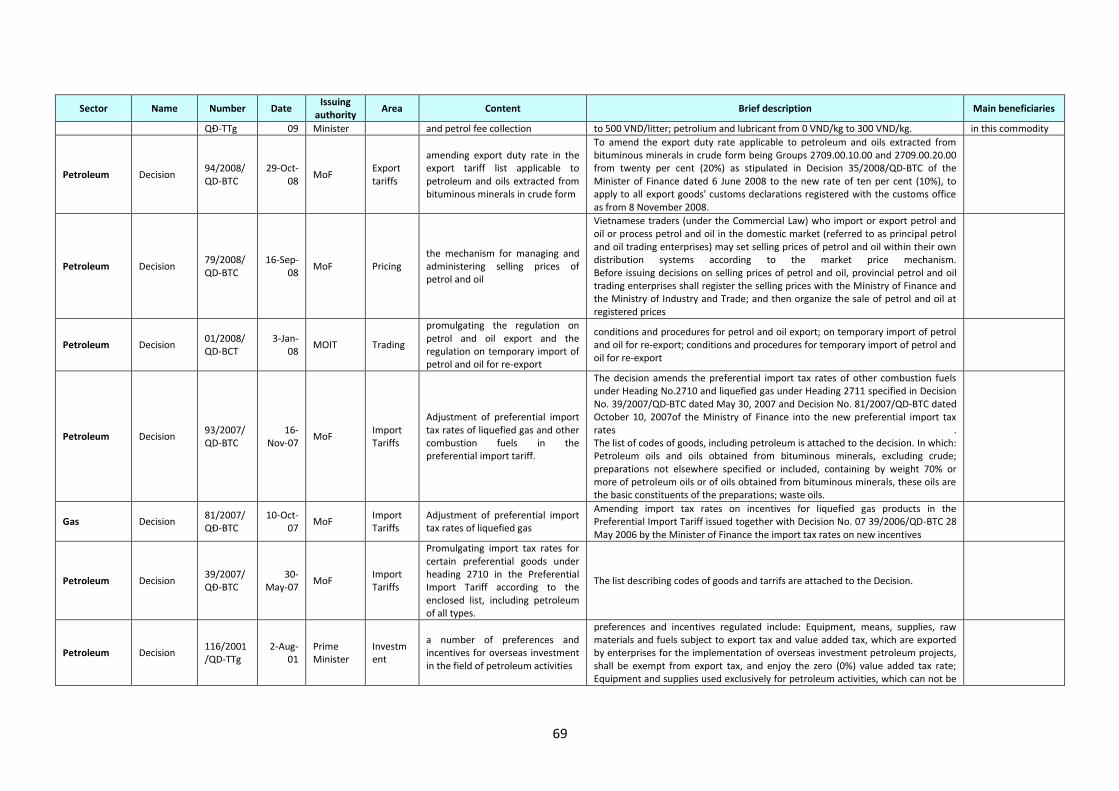
69
Sector Name Number Date Issuing
authority Area Content Brief description Main beneficiaries
QĐ-TTg 09 Minister and petrol fee collection to 500 VND/litter; petrolium and lubricant from 0 VND/kg to 300 VND/kg. in this commodity
Petroleum Decision 94/2008/QD-BTC
29-Oct-08
MoF Export tariffs
amending export duty rate in the export tariff list applicable to petroleum and oils extracted from bituminous minerals in crude form
To amend the export duty rate applicable to petroleum and oils extracted from bituminous minerals in crude form being Groups 2709.00.10.00 and 2709.00.20.00 from twenty per cent (20%) as stipulated in Decision 35/2008/QD-BTC of the Minister of Finance dated 6 June 2008 to the new rate of ten per cent (10%), to apply to all export goods' customs declarations registered with the customs office as from 8 November 2008.
Petroleum Decision 79/2008/QD-BTC
16-Sep-08
MoF Pricing the mechanism for managing and administering selling prices of petrol and oil
Vietnamese traders (under the Commercial Law) who import or export petrol and oil or process petrol and oil in the domestic market (referred to as principal petrol and oil trading enterprises) may set selling prices of petrol and oil within their own distribution systems according to the market price mechanism. Before issuing decisions on selling prices of petrol and oil, provincial petrol and oil trading enterprises shall register the selling prices with the Ministry of Finance and the Ministry of Industry and Trade; and then organize the sale of petrol and oil at registered prices
Petroleum Decision 01/2008/QD-BCT
3-Jan-08
MOIT Trading
promulgating the regulation on petrol and oil export and the regulation on temporary import of petrol and oil for re-export
conditions and procedures for petrol and oil export; on temporary import of petrol and oil for re-export; conditions and procedures for temporary import of petrol and oil for re-export
Petroleum Decision 93/2007/QD-BTC
16-Nov-07
MoF Import Tariffs
Adjustment of preferential import tax rates of liquefied gas and other combustion fuels in the preferential import tariff.
The decision amends the preferential import tax rates of other combustion fuels under Heading No.2710 and liquefied gas under Heading 2711 specified in Decision No. 39/2007/QD-BTC dated May 30, 2007 and Decision No. 81/2007/QD-BTC dated October 10, 2007of the Ministry of Finance into the new preferential import tax rates . The list of codes of goods, including petroleum is attached to the decision. In which: Petroleum oils and oils obtained from bituminous minerals, excluding crude; preparations not elsewhere specified or included, containing by weight 70% or more of petroleum oils or of oils obtained from bituminous minerals, these oils are the basic constituents of the preparations; waste oils.
Gas Decision 81/2007/QĐ-BTC
10-Oct-07
MoF Import Tariffs
Adjustment of preferential import tax rates of liquefied gas
Amending import tax rates on incentives for liquefied gas products in the Preferential Import Tariff issued together with Decision No. 07 39/2006/QD-BTC 28 May 2006 by the Minister of Finance the import tax rates on new incentives
Petroleum Decision 39/2007/QĐ-BTC
30-May-07
MoF Import Tariffs
Promulgating import tax rates for certain preferential goods under heading 2710 in the Preferential Import Tariff according to the enclosed list, including petroleum of all types.
The list describing codes of goods and tarrifs are attached to the Decision.
Petroleum Decision 116/2001/QD-TTg
2-Aug-01
Prime Minister
Investment
a number of preferences and incentives for overseas investment in the field of petroleum activities
preferences and incentives regulated include: Equipment, means, supplies, raw materials and fuels subject to export tax and value added tax, which are exported by enterprises for the implementation of overseas investment petroleum projects, shall be exempt from export tax, and enjoy the zero (0%) value added tax rate; Equipment and supplies used exclusively for petroleum activities, which can not be
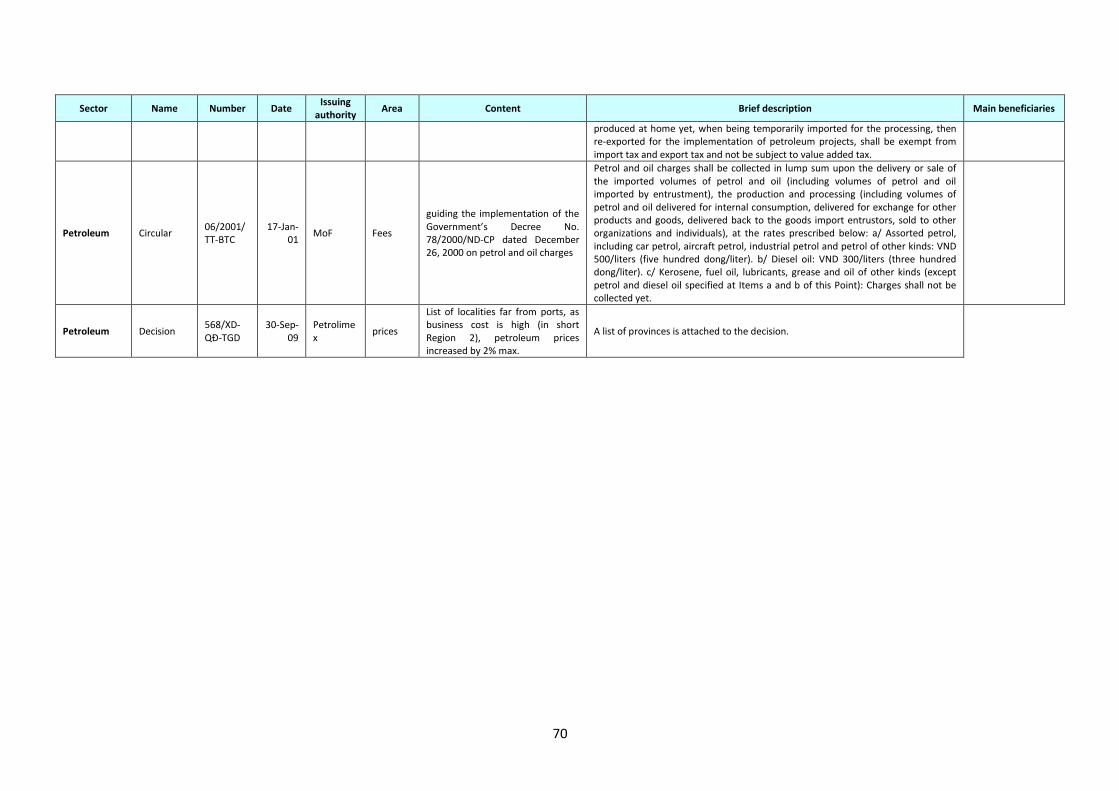
70
Sector Name Number Date Issuing
authority Area Content Brief description Main beneficiaries
produced at home yet, when being temporarily imported for the processing, then re-exported for the implementation of petroleum projects, shall be exempt from import tax and export tax and not be subject to value added tax.
Petroleum Circular 06/2001/TT-BTC
17-Jan-01
MoF Fees
guiding the implementation of the Government’s Decree No. 78/2000/ND-CP dated December 26, 2000 on petrol and oil charges
Petrol and oil charges shall be collected in lump sum upon the delivery or sale of the imported volumes of petrol and oil (including volumes of petrol and oil imported by entrustment), the production and processing (including volumes of petrol and oil delivered for internal consumption, delivered for exchange for other products and goods, delivered back to the goods import entrustors, sold to other organizations and individuals), at the rates prescribed below: a/ Assorted petrol, including car petrol, aircraft petrol, industrial petrol and petrol of other kinds: VND 500/liters (five hundred dong/liter). b/ Diesel oil: VND 300/liters (three hundred dong/liter). c/ Kerosene, fuel oil, lubricants, grease and oil of other kinds (except petrol and diesel oil specified at Items a and b of this Point): Charges shall not be collected yet.
Petroleum Decision 568/XD-QĐ-TGD
30-Sep-09
Petrolimex
prices
List of localities far from ports, as business cost is high (in short Region 2), petroleum prices increased by 2% max.
A list of provinces is attached to the decision.


