1
U.S. Fish and Wildlife Service
Early Detection and Monitoring of Non-Native Fishes in Lake Erie, 2013-2015
March 2016
U.S. Fish and Wildlife Service Alpena Fish and Wildlife Conservation Office 480 West Fletcher Street Alpena, Michigan 49707
U.S. Fish and Wildlife Service Lower Great Lakes Fish and Wildlife Conservation Office 1101 Casey Road Basom, New York 14013
2
Suggested citation: USFWS. 2016. Early detection and monitoring of non-native fishes in Lake Erie, 2013-2015. U.S. Fish and Wildlife Service, Lower Great Lakes Fish and Wildlife Conservation Office, Basom, NY and U.S. Fish and Wildlife Service, Alpena Fish and Wildlife Conservation Office, Alpena, MI. 59 pp.
On the cover: (Left photo): Benthic sled deployed in Buffalo, NY. (Right photo): Juvenile and adult sampling efforts underway in the Detroit River. The Detroit, MI skyline is in the background.
3
TABLE OF CONTENTS EXECUTIVE SUMMARY .......................................................................................................... 4
ACKNOWLEDGEMENTS ......................................................................................................... 6
INTRODUCTION......................................................................................................................... 7
STUDY AREAS ............................................................................................................................ 8
Detroit River, Michigan/Ontario ................................................................................................. 8
Maumee Bay, Michigan/Ohio ...................................................................................................... 9
Sandusky Bay, Ohio ..................................................................................................................... 9
Buffalo and upper Niagara River, New York .............................................................................. 9
METHODS .................................................................................................................................. 10
Fish Sampling ............................................................................................................................ 10
Data Analysis ............................................................................................................................. 11
RESULTS .................................................................................................................................... 12
2013 ........................................................................................................................................... 12
2014 ........................................................................................................................................... 13
2015 ........................................................................................................................................... 15
Species Accumulation Curves and Rarefaction ......................................................................... 16
DISCUSSION .............................................................................................................................. 17
REFERENCES ............................................................................................................................ 19
TABLES ....................................................................................................................................... 22
FIGURES ..................................................................................................................................... 42
4
EXECUTIVE SUMMARY
The Laurentian Great Lakes have encountered numerous aquatic non-native and invasive species introductions since Europeans settled in North America (Mills et al. 1994). The impact of aquatic invasive species (AIS) on the Great Lakes has been widely documented by the scientific community (Leung et al. 2002; Mills et al. 1993). Despite increasing regulations aimed at reducing the likelihood of the introduction and spread of AIS into the Great Lakes, there remains a need to monitor for and detect new species before they become established. This is especially true given the costs and difficulty of attempting to control or eradicate a non-native species once it has become established within the system (Trebitz et al. 2009). If a non-native species is detected prior to becoming well established, rapid response decisions can be made in an effort to eradicate or control the species from further spread. Furthermore, continuous monitoring also allows resource managers to look at historical data and assess the impact of future invasions (Trebitz et al. 2009). This report summarizes the 2013-2015 efforts for early detection of non-native fishes in Lake Erie (USFWS 2014a) as implemented by the U.S. Fish and Wildlife Service (USFWS), Alpena Fish and Wildlife Conservation Office, the Lower Great Lakes Fish and Wildlife Conservation Office, and partner agencies. Multiple sampling locations in Lake Erie were selected due to their high likelihood of new non-native species introductions according to vector risk analysis (USFWS 2014a). Lake Erie sampling locations included the Detroit River (MI/ON), Maumee Bay (OH/MI), Sandusky Bay (OH), and Buffalo Harbor/upper Niagara River (NY). Sampling was conducted each year during 2013-2015 and at each location in an effort to detect non-native juvenile and adult fish. Sites within locations were stratified by suitable gear type according to sampling depth and randomly selected from all sites meeting each depth criteria (USFWS 2014a). Gear used to target juvenile and adult fish included bottom trawling, day/night electrofishing, paired fyke nets, and minnow trap arrays. During monitoring efforts conducted from 2013-2015, surveillance crews captured a total of 10,413 fish representing 53 species in the Detroit River; a total of 37,879 fish representing 42 species in Maumee Bay; a total of 24,253 fish representing 37 species in Sandusky Bay; and a total of 23,951 total fish that represent 58 species in Buffalo Harbor/upper Niagara River. Non-native species were captured often during our sampling (e.g., Alewife Alosa pseudoharengus, Bigmouth Buffalo Ictiobus cyprinellus, Common Carp Cyprinus carpio, Goldfish Carassius auratus, Rainbow Smelt Osmerus mordax, Round Goby Neogobius melanostomus, Rudd Scardinius erythropthalmus, Tubenose Goby Proterorhinus semilunaris, and White Perch Morone americana), yet no previously undocumented non-native species were detected in Lake Erie during this study.

5
Using to rarefaction analysis, the current detection rate is approximately 80-90% of the estimated species assemblage at sampling locations. For the sampling regime to be most effective, species detection efficiency must be high (e.g., 95%) enough to detect rare species present at low abundances (Hoffman et al. 2011). While no new non-native species were detected in 2013-2015 at these four locations, it is critical that we continue this early detection monitoring program in 2016 as it is an essential part of the non-native and invasive species management for Lake Erie.

6
ACKNOWLEDGEMENTS
We thank our partners who assisted with planning, sampling, and analysis associated with this effort including: J. Hoffman (USEPA Mid-Continent Ecology Division), C. Olds (USFWS Alpena FWCO), J. Schlosser (USFWS Ashland FWCO), Ottawa National Wildlife Refuge, Youth Conservation Corps, S. Sanders, R. Collins, J. McCarter, M. Hutton, E. Stadig, M. Lancewicz, R. Pokorzynski, and a number of volunteers. This project was funded in part by the Great Lakes Restoration Initiative.
7
INTRODUCTION
Establishment of aquatic non-native species in the Great Lakes has caused major ecological and economic impacts (Mills et al. 1993, Vanderploeg et al. 2002). Non-native species have entered the Great Lakes through a variety of vectors including ballast water from shipping vessels, canals, aquarium releases, bait release, and intentional stocking by management agencies (Mills et al. 1994). The Great Lakes currently contain 182 identified nonindigenous aquatic species (Ricciardi 2006), 130 of which are present in Lake Erie (Great Lakes Aquatic Nonindigenous Species Information System, GLANSIS, NOAA 2016). The impacts of historical non-native introductions in Lake Erie are evident in many forms. Sea Lamprey Petromyzon marinus presumably entered Lake Erie and spread to the upper Great Lakes by means of the Welland Canal (Aron and Smith 1971). Ecological and economic impacts from the lamprey invasion have been well documented as losses in commercial and recreational fishing income, as well as costs associated with control measures (Smith and Tibbles 1980; Jones 2007). Zebra mussels Dreissena polymorpha and Quagga mussels D. bugensis have altered trophic dynamics by concentrating energy resources into benthos, oligotrophication, competing for resources with native bivalves, and by promoting conditions favorable to harmful algal blooms (Vanderploeg et al. 2002). The introduction of Rainbow Smelt has caused declines of recruitment in native planktivores such as Lake Whitefish Coregonus clupeaformis and Lake Herring Coregonus artedi (Evans and Loftus 1987), and the subsequent spread of Alewife has been linked to reproductive failures in Lake Trout Salvelinus namaycush and Atlantic Salmon Salmo salar (Fisher et al. 1996). The Great Lakes continue to face threats from potential new invaders. Some invaders have been documented as present but are not yet abundant, while others are not present but pose a high risk of invasion. Grass Carp Ctenopharyngodon idella have been captured at isolated locations within Lake Erie but are not known to be abundant (USGS 2016; Baerwaldt et al. 2013). Nonetheless, natural reproduction of grass carp has recently been documented within the Lake Erie watershed (Chapman et al. 2013). This species feeds on submerged aquatic macrophytes and may threaten coastal wetlands which are important spawning and rearing habitats for many species (Chapman et al. 2013). Populations of Silver Carp Hypophthalmichthys molitrix and Bighead Carp Hypophthalmichthys nobilis have rapidly expanded in the Mississippi River and the Illinois River and are moving closer towards Lake Michigan (Chick and Pegg 2001). Asian carp Hypophthalmichthys spp. are large, planktivorous fish that have been reported to dominate fish assemblages (represent as much as 97% of total fish biomass in portions of the Mississippi River basin; MICRA 2002) and alter the structure and species composition of native plankton communities (Laws and Weisburd 1990; Vörös et al. 1997; Stone et al. 2000). Furthermore, many additional species have been identified as posing a high risk of introduction through ballast water, the aquarium trade, and other vectors outside of immediately connected waterways (Kolar
8
and Lodge 2002; GLANSIS Watchlist). Minimizing additional introductions of non-native species to the Great Lakes has become increasingly important given their significant impacts to this ecosystem. Preventing the transfer of a new species to an ecosystem is ultimately the most effective tool to keep non-native species from becoming invasive. When complete prevention is not possible, the next most effective option is monitoring for the arrival of new species and controlling their spread before they become widespread (USEPA 2008; Trebitz et al. 2009). The U.S. Fish and Wildlife Service developed a strategic framework for the early detection of non-native fishes and select benthic macroinvertebrates in the Great Lakes (USFWS 2014c). Fish and Wildlife Conservation Offices (FWCOs) throughout the Great Lakes lead and coordinate this program. This report describes the efforts devoted to the early detection of non-native fishes at four high risk locations across the Lake Erie Basin from 2013 to 2015.
STUDY AREAS
Lake Erie study areas were chosen through the use of a vector risk analysis for species at risk to become introduced into the Great Lakes. Study areas, sampling gears, and sampling targets were identified in the Lake Erie Implementation Plan for the Early Detection of Non-Native Fishes and Select Benthic Macroinvertebrates (USFWS 2014a). Four study areas across two USFWS regions, the Midwest and Northeast, were sampled each year during 2013-2015. These locations were identified as high risk locations for introduction of non-native species and included the Detroit River, Maumee Bay, Sandusky Bay, and the Buffalo/upper Niagara River (Figure 1). Detroit River, Michigan/Ontario—The Detroit River is the lower part of a connecting channel between Lakes Huron and Erie and serves as the international border between the United States (Michigan) and Canada (Ontario) along its entire 44km length. The Detroit-Windsor area is densely populated with a large amount of recreational angling and boating. The Detroit River is also a major shipping port and the surrounding area is highly industrialized. The river is an important navigational shipping route connecting lakes Michigan, Huron, and Superior (the upper Great Lakes) with lakes Erie and Ontario (the lower Great Lakes) and the St. Lawrence Seaway. The Detroit River was designated an Area of Concern (AOC) as part of the Great Lakes Water Quality Agreement of 1987 due to pollution. Sections of the Detroit River contain critical fish and wildlife habitat. In 2001, the Detroit River International Wildlife Refuge was founded to protect some of these important habitats. Recently many agencies have focused their efforts on restoring the biological integrity of the river. The study area encompasses both U.S. and Canadian waters and extends the length of the river.
9
Maumee Bay, Michigan/Ohio—Maumee Bay is located in the southwest corner of Lake Erie’s western basin near the city of Toledo, Ohio, and covers both Michigan and Ohio waters of Lake Erie. Toledo, the fourth largest city in Ohio, is a major commercial shipping port receiving high levels of ballast water transfer. Maumee Bay supports tourism, including recreational boating and fishing. The Maumee River, the largest tributary to Lake Erie, was named an AOC as part of the Great Lakes Water Quality Agreement of 1987 due to sediment contamination and agricultural runoff. The river originates at the confluence of the St. Joseph and St. Mary’s rivers near Fort Wayne, Indiana, and represents a potential pathway for non-native species to enter Lake Erie from the Mississippi River basin via Eagle Marsh (GLMRIS 2011). In an effort to help prevent the spread of non-native species between these basins, a berm was constructed at Eagle Marsh in 2015. The study area starts in the Maumee River approximately 1 km upstream from the river mouth in Maumee Bay, and extends northeast approximately 26 km to a parallel boundary extending north from the outer boundary of Cedar Point National Wildlife Refuge northwest to Grand View, Michigan. The total surface area of the survey location is approximately 9,200 ha. Sandusky Bay, Ohio—Sandusky Bay is located in northern Ohio on Lake Erie near the cities of Sandusky and Port Clinton. The bay is shallow and fed by the Sandusky River. A hydrologic connection to the Mississippi River basin via Grand Lake-St. Mary’s River makes this a high risk pathway for introductions of non-native species to Lake Erie (GLMRIS 2011). Maritime commerce in the port of Sandusky is considered to be at a lower risk among ports that receive high frequency and volume of ballast water exchange, even so this remains a likely pathway for non-native species given the significance of the maritime commerce vector for species introductions. The study area starts at the eastern boundary of Muddy Creek Bay at Peach Island and Canvasback Point, and extends east approximately 24 km to the easternmost boundary of Cedar Point. The total surface area of the survey location is approximately 13,500 ha. Buffalo/upper Niagara River, New York—Buffalo, New York and its surrounding waterways are industrialized areas that have historically been important to shipping within the Great Lakes. While commercial shipping traffic has declined over the past few decades, Buffalo remains the second-largest city in New York State and continues to see a large amount of tourism, recreational boating, and subsistence and recreational fishing. Both the Buffalo and Niagara rivers were named AOCs as part of the Great Lakes Water Quality Agreement of 1987. The upper Niagara River is defined as the portion of river above Niagara Falls. The Erie Canal, a known vector for invasive species, connects to the Great Lakes in the upper Niagara River, increasing this area’s vulnerability to invasion. The study area is located in the easternmost part of Lake Erie at Buffalo and encompasses the Small Boat Harbor, south along approximately 16 km of shoreline, north to the Canadian border, as well as all New York waters of the upper Niagara River to Buckhorn Island. The total surface area of the survey location is approximately 21,560 ha. The aquatic habitat varies considerably among sample locations within the survey
10
area. The harbor consists of dredged channels with soft substrate, often with large expanses of submerged vegetation. Submerged riprap and/or sheet pilings dominate the shoreline within the harbor. The upper Niagara River consists of clear water with considerable flow in most locations and the substrate is dominated by a combination of clay and cobble, with submerged vegetation. The open lake area outside of the harbor and south to the westernmost shoreline boundary consisted of mainly clear water with medium to large cobble/hard substrate dominated by Dreissena spp. colonies.
METHODS Individual sampling sites within survey areas were selected using the Create Random Points function in ArcGIS 10.1/10.2 constrained by location specific polygon shapefiles. Due to lack of available bathymetric data for many of the areas to be sampled (shallow, nearshore, outside of dredged areas), shape files were modified for estimated depth ranges specific to gear type. Gear utilization was based on recommendations from Trebitz et al. (2009) and USFWS (2014b). When a randomly selected point was unable to be sampled (e.g., wrong depth, inaccessibility), an alternate site was selected from a list of previously allocated randomized alternate locations. All fish were identified to species level. When a fish could not be identified in the field, it was either preserved in 95% ethanol or frozen and brought back for identification in the lab. Starting in 2014, tissue samples were taken on select fish whose identification was questionable, usually in addition to preserving the whole specimen for lab identification. Tissue samples were taken by clipping a small portion of a fin and either preserving it in an individual 2 mL vial with 95% ethanol or placing it in a scale envelope and dried. Tissue samples are pending genetic barcoding analysis by the U.S. Environmental Protection Agency (USEPA) National Exposure Research Laboratory in Cincinnati, Ohio. All species of fish, other than Round Gobies, were released unharmed, and Round Gobies were euthanized in accordance with state regulations and the terms of scientific collection permits. Water quality data was collected at each site and included surface temperature (°C), secchi depth (m), dissolved oxygen (mg/l), and conductivity (µS/cm; at electrofishing sites).
Fish Sampling Paired fyke net units with 4.69 mm (3/16” delta) stretch mesh netting were designed by attaching two 0.91 m x 1.22 m fyke nets to a 15 m x 0.91 m lead. Individual nets consisted of two rectangular frames 0.91 m x 1.22 m, followed by four circular rings 0.91 m in diameter. Fyke net units were set parallel to the shoreline or in “weed pockets” in water depths of 1.0-2.0 m. Nets were set during the day, remaining in the water overnight for a period of 12-24 hours. Electrofishing was conducted from a boat during both day and night hours, in water depths of 1-3 m. A pulsed DC current 60 Hz electrical unit was used with sufficient power to induce taxis in
11
fish. Electrofishing power is dependent upon water conductivity and level of boat-hull oxidation. Electrofishing near a predetermined randomly selected waypoint occurred within an area of 0.25 km2 or along the shoreline, for a total electrofishing time of 600 s per sampling location. Benthic trawling was conducted using a Marinovich design trawl with a 4.9 m head rope, 3.8 cm stretch mesh body, and a 3.125 mm stretch mesh cod end. Trawl tows were performed at depths greater than 2 m, along contours at a speed of ~4 km/h, and for 5 minutes in duration. After 2013, it was recognized that bottom trawling was not feasible in the Detroit River and an alternate gear, minnow trap arrays, was substituted. Gee’s minnow traps were used for sampling and consisted of a conical design (42 mm x 23 mm) of 0.6 mm galvanized steel mesh. Each end had a 25.4 mm funnel shaped entrance to the trap. Traps were baited and set on the bottom in an array of 5 traps per line. Traps were set overnight for a period of 12-24 hours.
Data Analysis Species Accumulation Curves Species accumulation curves were used to facilitate comparisons of the rate of species detection among gear types and gear types combined. Curves were generated in R (version 3.2.1) for each location using the number of sampling events and the species abundance data from 2013-2015, and represent the mean of 10,000 random permutations. The species accumulation curve rises steeply at first as common species are detected over the course of a low number of sampling events, and then the curve rises more slowly as species low in abundance are detected more rarely. Ultimately the curve approaches an asymptote when few or no new species are detected following a number of sampling events. Rarefaction Rarefaction analysis was used to estimate species richness and sampling efficiency (efficiency at which species are detected) at each sampling location for individual gear types and for all gear types combined. Sample-based rarefaction and extrapolation were conducted using EstimateS (Colwell 2013, version 9.1.0) software and species abundance data (randomized pooling of data) from 2013-2015 for 10,000 sample extrapolations. Estimated species richness is the asymptote of the extrapolated rarefaction curve. The effort required to detect 95% of species present was calculated by multiplying the estimated number of species by 0.95. The resulting number of species corresponded to a number of samples (i.e., effort required for 95% detection) on the rarefaction curve by which we determined how many samples are needed to detect 95% of the species. Sampling efficacy was calculated as the actual number of species collected (observed species richness) by the estimated species richness (asymptote of the rarefaction curve).
12
RESULTS
During monitoring efforts conducted from 2013-2015, surveillance crews collected a total of 10,413 fish representing 53 species in the Detroit River; a total of 37,879 fish representing 42 species in Maumee Bay; a total of 24,253 fish representing 37 species in Sandusky Bay; and a total of 23,951 total fish that represent 58 species in Buffalo Harbor/upper Niagara River. Results for each sampling year and location follow.
2013
Detroit River, MI/ON—
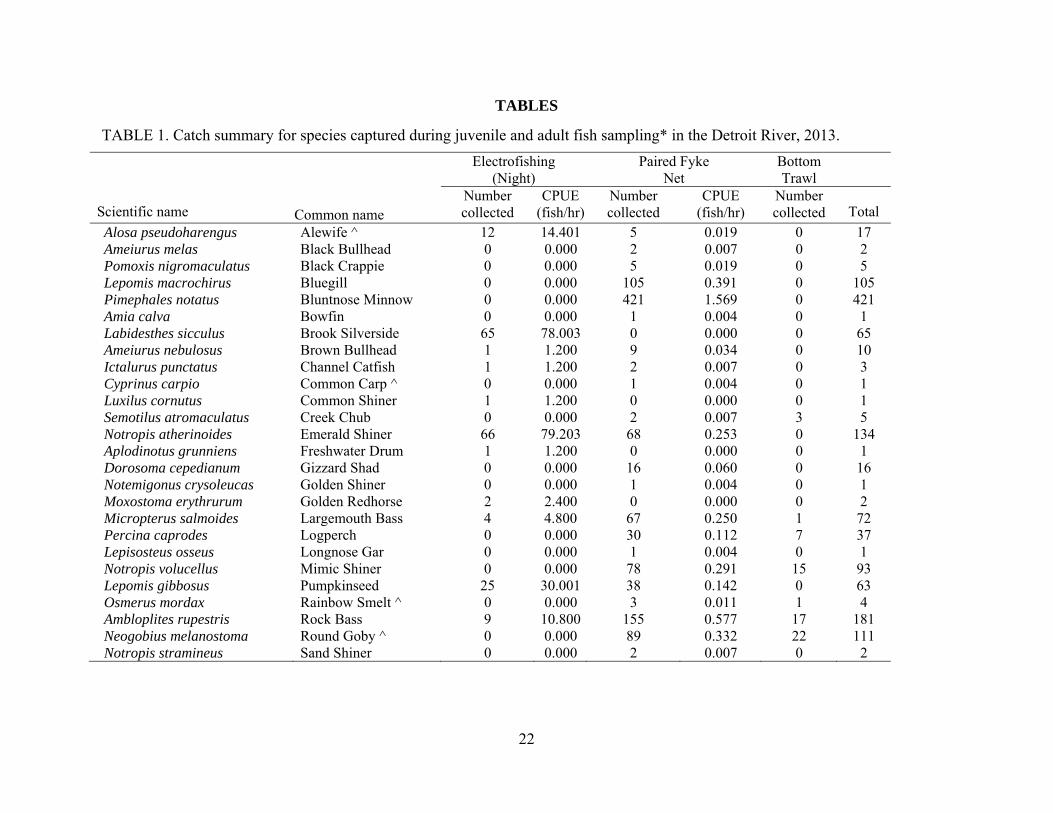
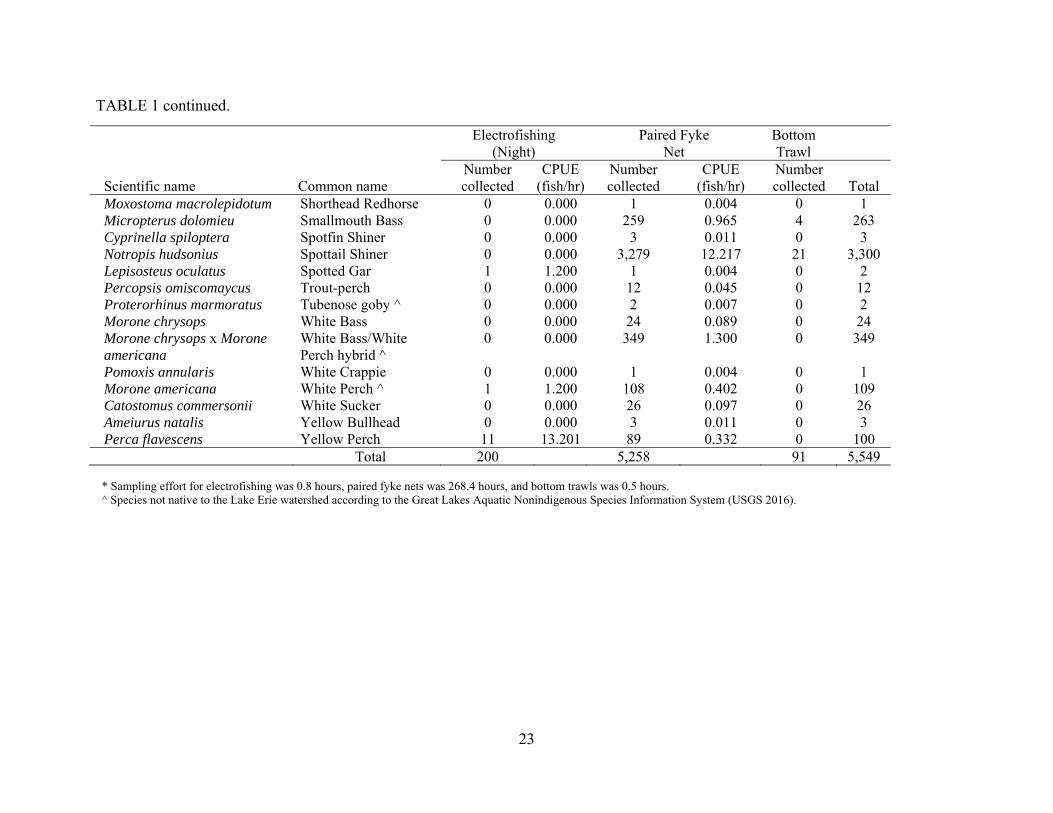
A total of 5,549 fish representing 40 species were collected (Table 1, Figure 2). No new non-native species were identified; however a number of existing invasive species were collected including Alewife, Common Carp, Rainbow Smelt, Round Goby, and Tubenose Goby. A total of 5,258 fish representing 36 species were collected using fyke nets. The most abundant species encountered was Spottail Shiner Notropis hudsonius (62% of total catch). Using electrofishing, 200 fish representing 14 species were collected. The most abundant species collected were Emerald Shiner (33% of total catch), Brook Silverside Labidesthes sicculus (33% of total catch), and Pumpkinseed Lepomis gibbosus (13% of total catch). A total of 91 fish representing 9 species were collected using the bottom trawl. The most abundant species collected with the bottom trawl were Round Goby (24% of total catch), Spottail Shiner (23% of total catch), Rock Bass Ambloplites rupestris (19% of total catch), and Mimic Shiner Notropis volucellus (16% of total catch).
Maumee Bay, MI/OH—
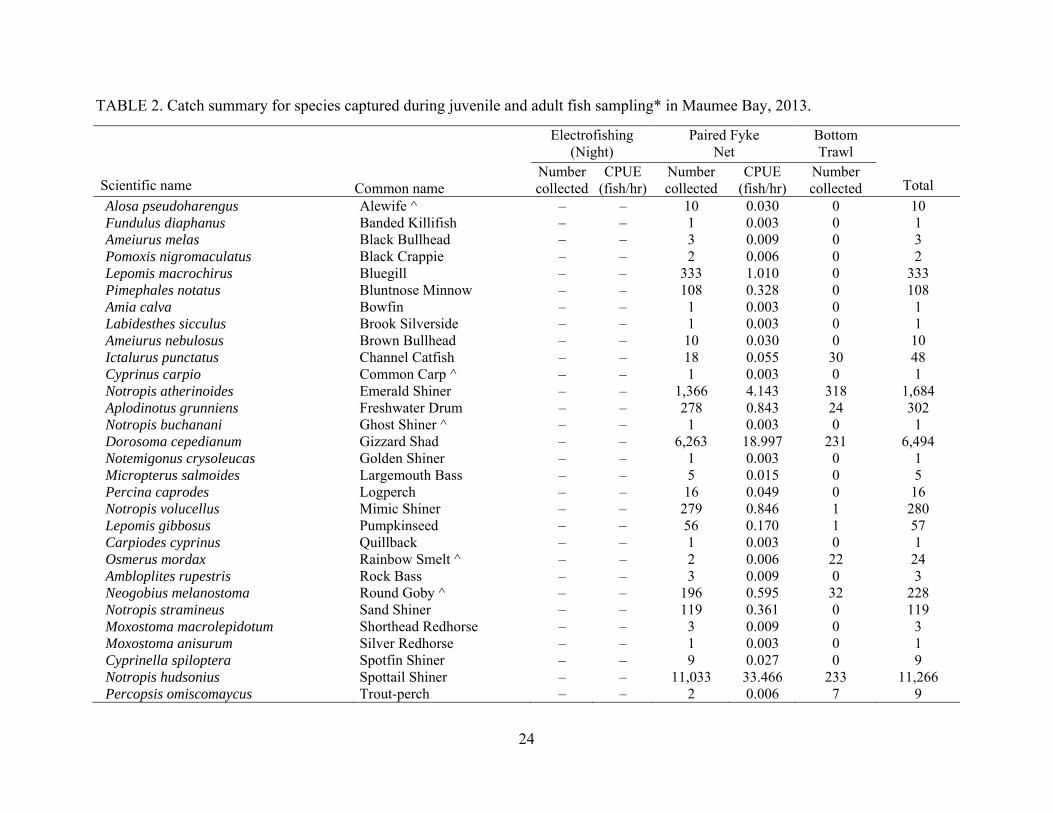
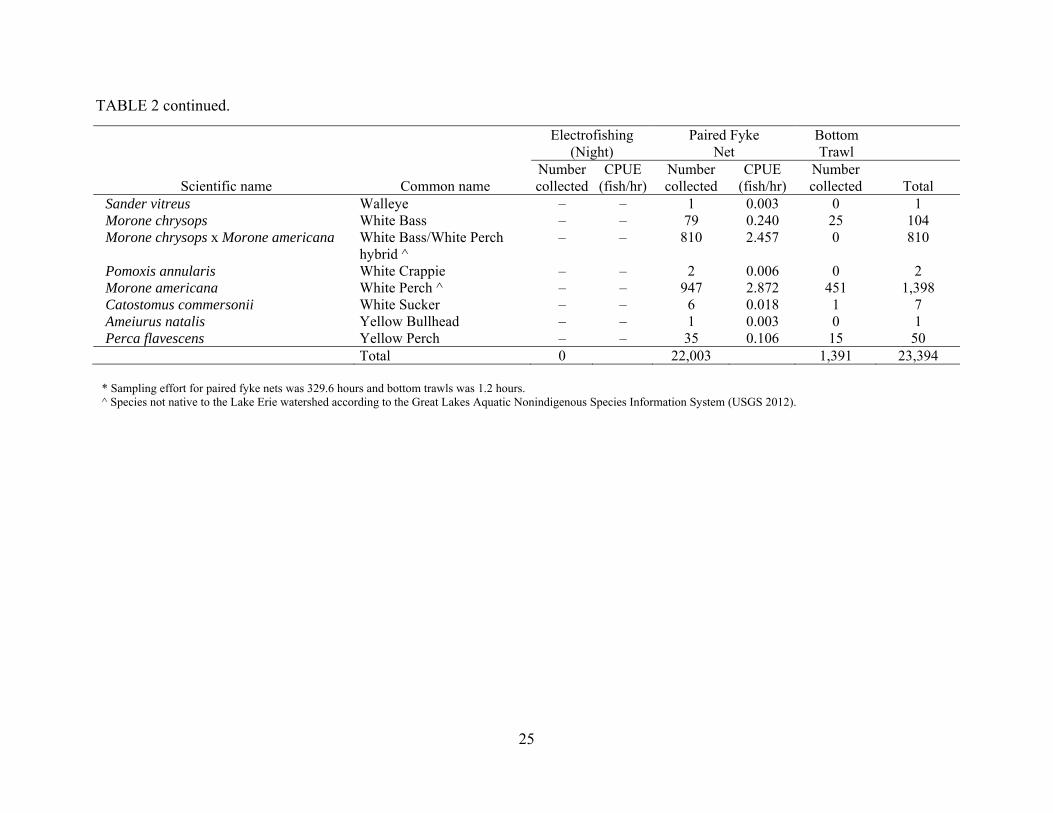
A total of 23,394 fish were collected, representing 38 species (Table 2, Figure 3). No new non-native species were identified; however a number of existing invasive species were collected including Alewife, Common Carp, Rainbow Smelt, and Round Goby. A total of 22,003 fish representing 38 species were collected using fyke nets. The most abundant species captured were Spottail Shiner (50% of total catch) and Gizzard Shad Dorosoma cepedianum (28% of total catch). A total of 1,391 fish representing 14 species were collected using the bottom trawl. The most abundant species encountered were White Perch (32% of total catch), Emerald Shiner (23% of total catch), Spottail Shiner (17% of total catch), and Gizzard Shad (17% of total catch).
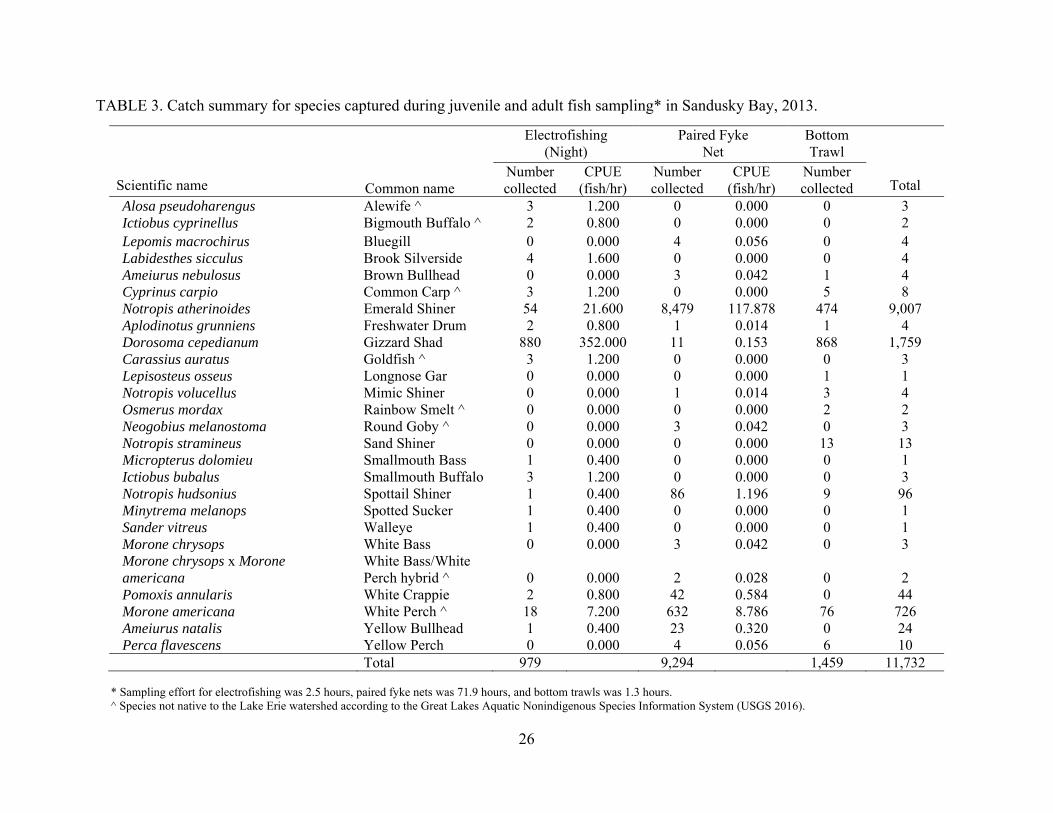
Sandusky Bay, OH—
A total of 11,732 fish representing 26 species were collected (Table 3, Figure 4). No new non-
13
native species were identified; however a number of existing invasive species were collected including Alewife, Bigmouth Buffalo, Common Carp, Goldfish, Rainbow Smelt, and Round Goby. A total of 9,294 fish representing 14 species were collected using fyke nets. The most abundant species was Emerald Shiner (91% of total catch). A total of 979 fish representing 16 species were collected using electrofishing. The most abundant species was Gizzard Shad (90% of total catch). A total of 1,459 fish representing 12 species were collected using the bottom trawl. The most abundant species encountered were Gizzard Shad (59% of total catch) and Emerald Shiner (32% of total catch).
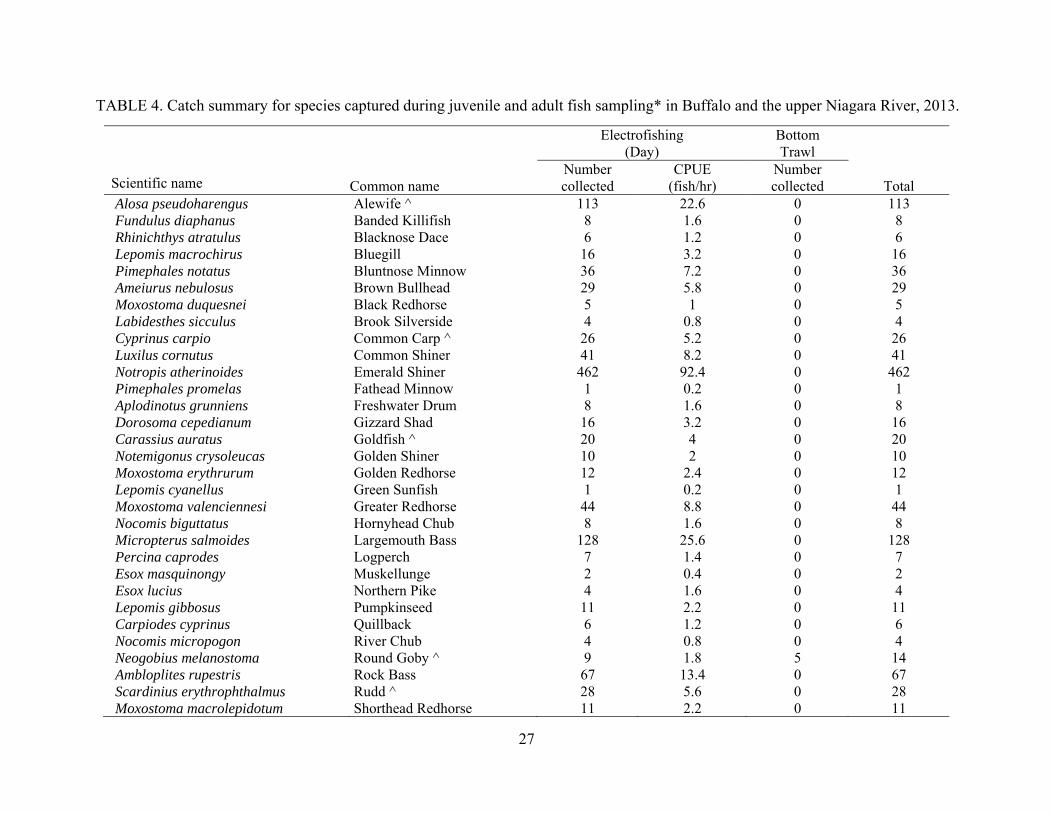
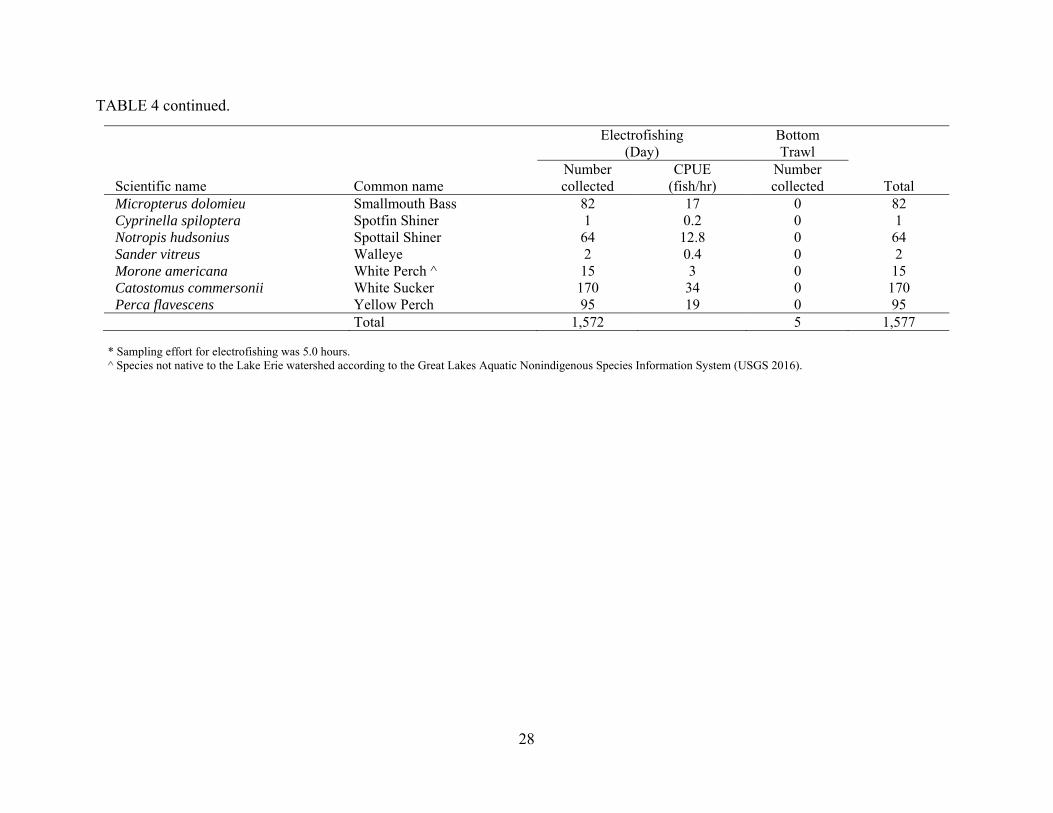
Buffalo/upper Niagara River, NY—
A total of 1,581fish representing 38 species were collected (Table 4, Figure 5). No new non-native species were identified; however a number of existing invasive species were collected including Alewife, Common Carp, Goldfish, Round Goby, Rudd, and White Perch. A total of 1,576 fish representing 38 species were collected using electrofishing. The most common species encountered were Emerald Shiner (29% of total catch), White Sucker Catostomus commersoni (11% of total catch), Largemouth Bass Micropterus salmoides (8% of total catch), and Alewife (7% of total catch). A total of 5 fish were collected using the bottom trawl, the only species being Round Goby.
2014
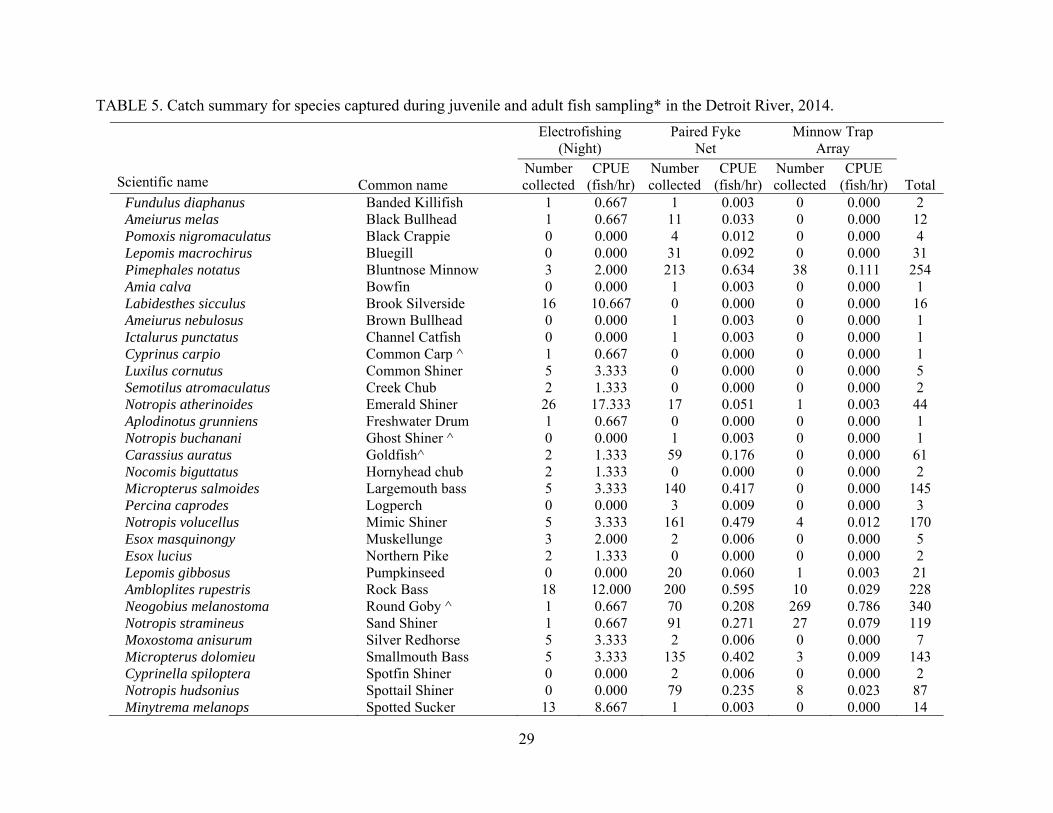
Detroit River, MI/ON—
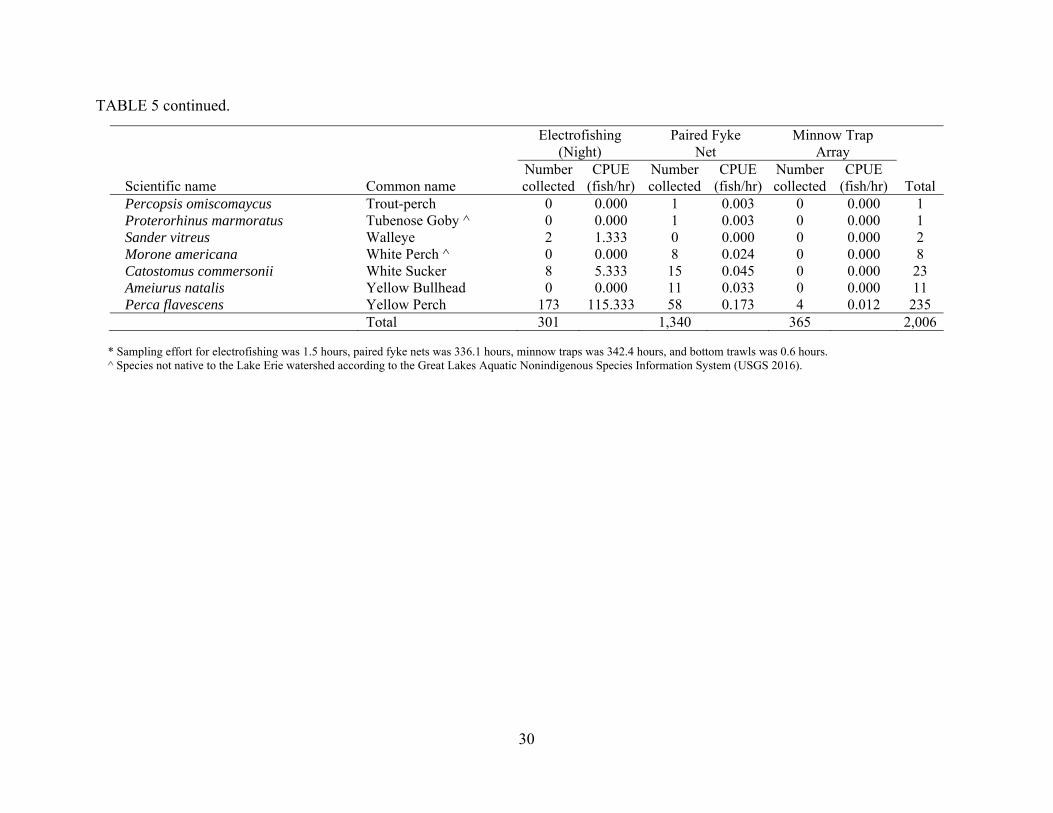
A total of 2,006 fish representing 38 species were collected (Table 5, Figure 6). No new non-native species were identified; however a number of existing invasive species were collected including Common Carp, Goldfish, Round Goby, and Tubenose Goby. A total of 1,340 fish representing 30 species were collected using fyke nets. The most abundant species were Bluntnose Minnow Pimephales notatus (16% of total catch), Rock Bass (15% of total catch), Mimic Shiner (12% of total catch), Largemouth Bass (10% of total catch), and Smallmouth Bass Micropterus dolomieu (10% of total catch). A total of 301 fish representing 24 species were collected using electrofishing (night time). The most abundant species was Yellow Perch Perca flavescens (57% of total catch). A total of 365 fish representing 9 species were collected using minnow traps. The most abundant species encountered were Round Goby (74% of total catch) and Bluntnose Minnow (10% of total catch).
14
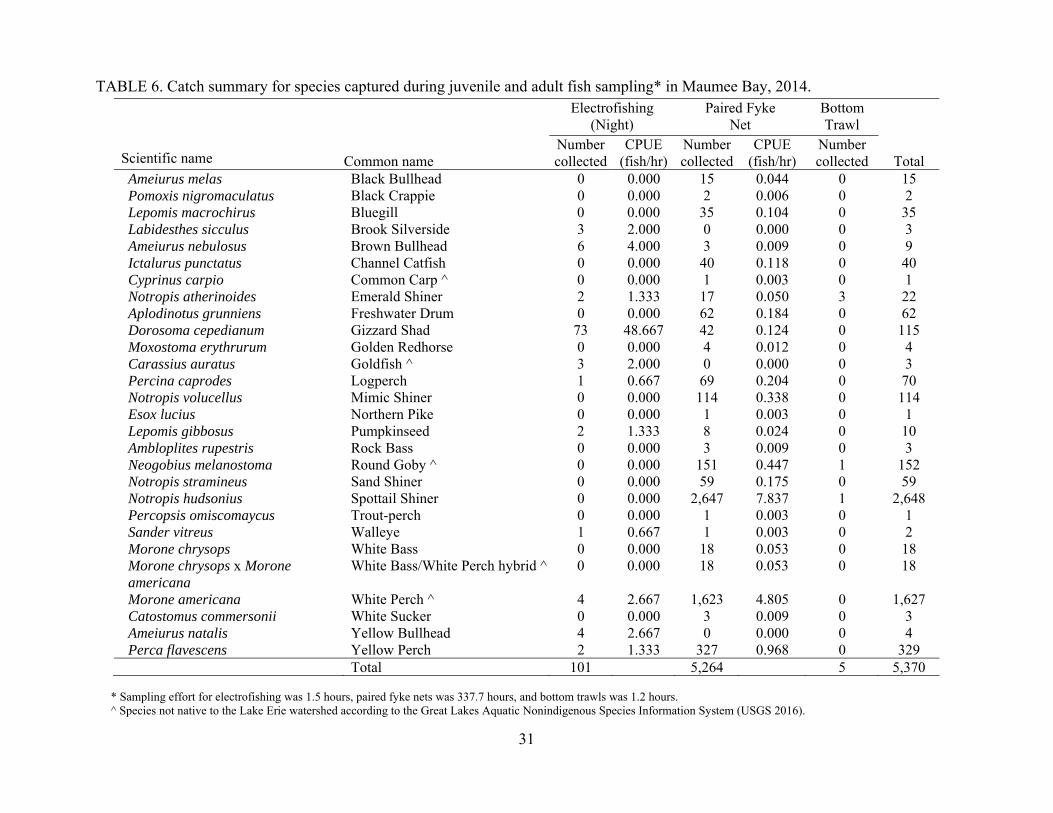
Maumee Bay, MI/OH—
A total of 5,370 fish representing 28 species were collected (Table 6, Figure 7). No new non-native species were identified; however a number of existing invasive species were collected including Common Carp, Goldfish, and Round Goby. A total of 5,264 fish representing 25 species were collected using fyke nets. The most abundant species were Spottail Shiner (50% total catch) and White Perch (31% of total catch). A total of 101 fish representing 11 species were collected using electrofishing (night time). The most abundant species was Gizzard Shad (72% of total catch). A total of 5 fish representing 3 species were collected using the bottom trawl. Those species were Emerald Shiner, Round Goby, and Spottail Shiner.
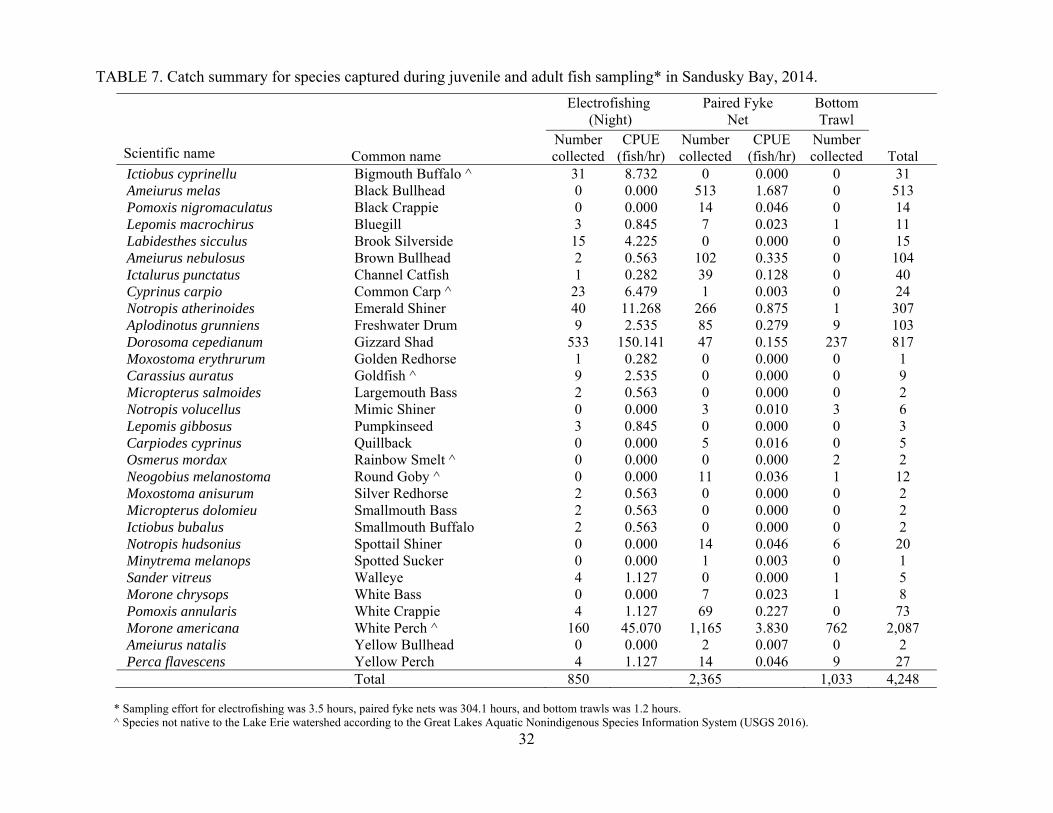
Sandusky Bay, OH—
A total of 4,248 fish representing 30 species were collected (Table 7, Figure 8). No new non-native species were identified; however a number of existing invasive species were collected including Common Carp, Goldfish, Rainbow Smelt, and Round Goby. A total of 2,365 fish representing 19 species were collected using fyke nets. The most abundant species captured were White Perch (49% of total catch), Black Bullhead Ameiurus melas (22% of total catch), and Emerald Shiner (11 % of total catch). A total of 850 fish representing 20 species were collected using electrofishing (night time). The most abundant species were Gizzard Shad (63% of total catch) and White Perch (19% of total catch). A total of 1,033 fish representing 12 species were collected using the bottom trawl. The most abundant species encountered were White Perch (74% of total catch) and Gizzard Shad (23% of total catch).
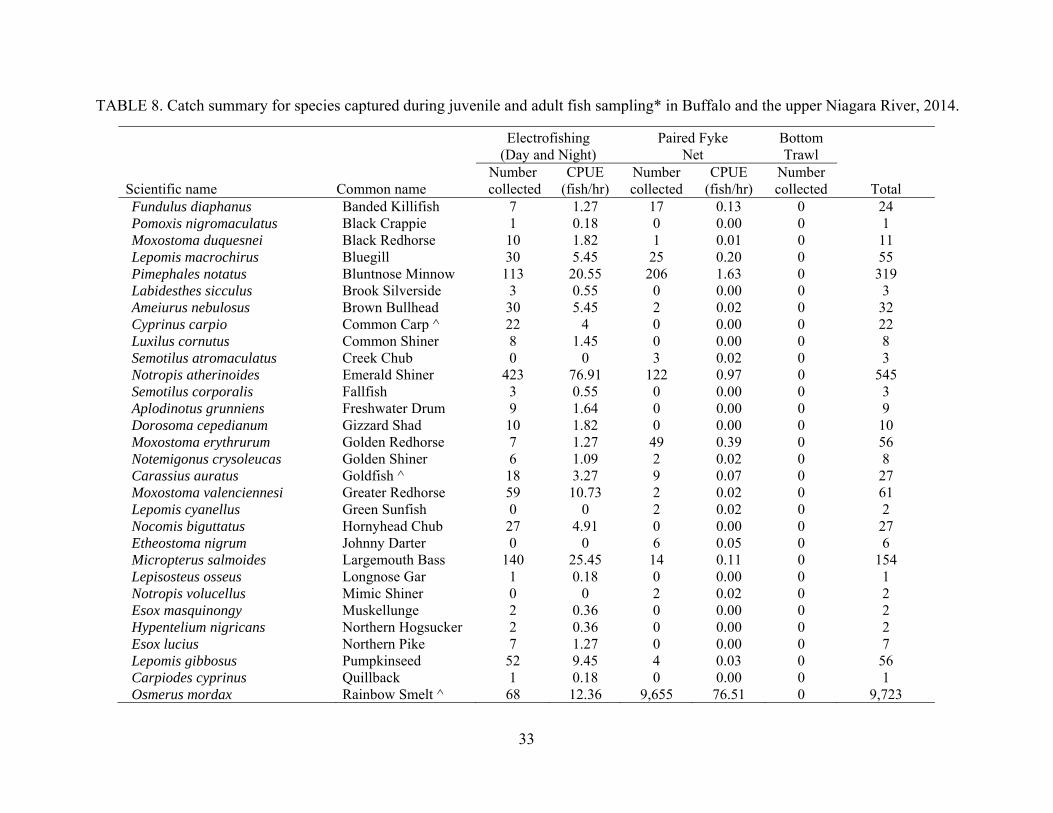
Buffalo/upper Niagara River, NY—
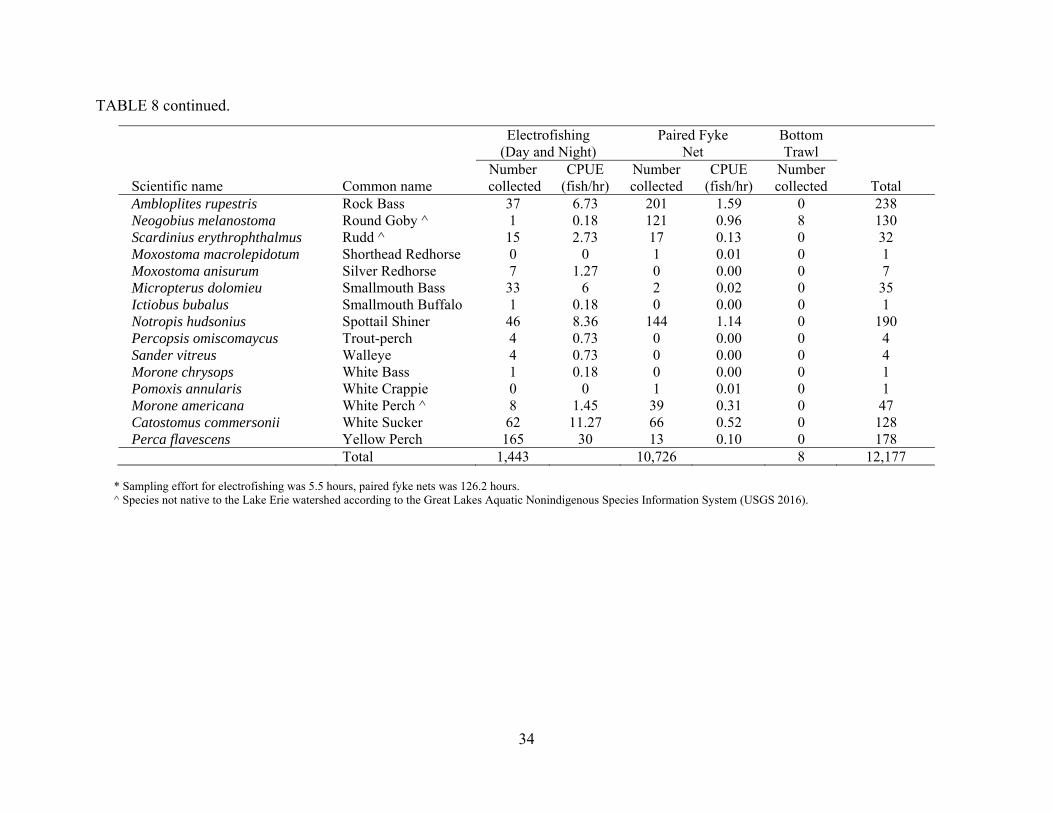
A total of 12,227 fish representing 46 species were collected (Table 8, Figure 9). No new non-native species were identified; however a number of existing invasive species were collected including Common Carp, Goldfish, Rainbow Smelt, Round Goby, Rudd, and White Perch. A total of 10,726 fish representing 27 species were collected using fyke nets. The most abundant species captured were Rainbow Smelt (90% of total catch), Bluntnose Minnow (2% of total catch), Rock Bass (2% of total catch), and Emerald Shiner (1% of total catch). A total of 1,443 fish representing 39 species were collected using electrofishing. The most common species encountered were Emerald Shiner (29% of total catch), Rainbow Smelt (5% of total catch), Bluntnose Minnow (8% of total catch), and Largemouth Bass (10% of total catch). A total of 8 fish were collected using the bottom trawl, the only species being Round Goby.
15
2015 Detroit River, MI/ON—
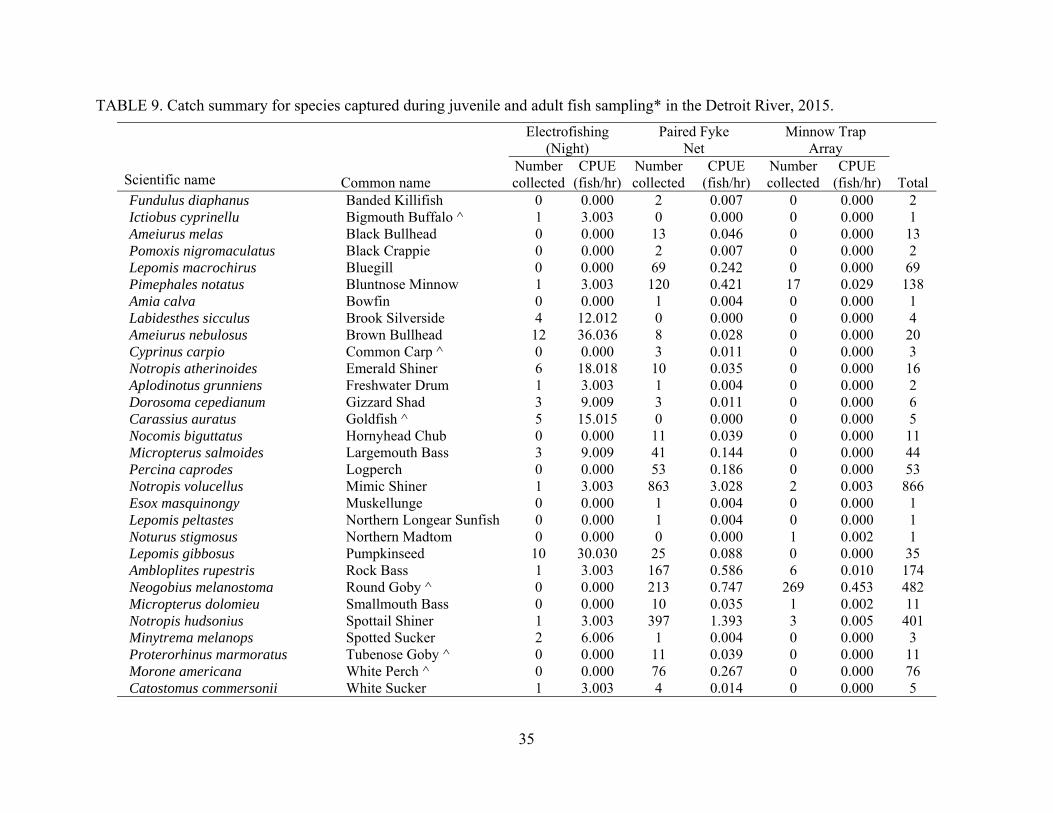
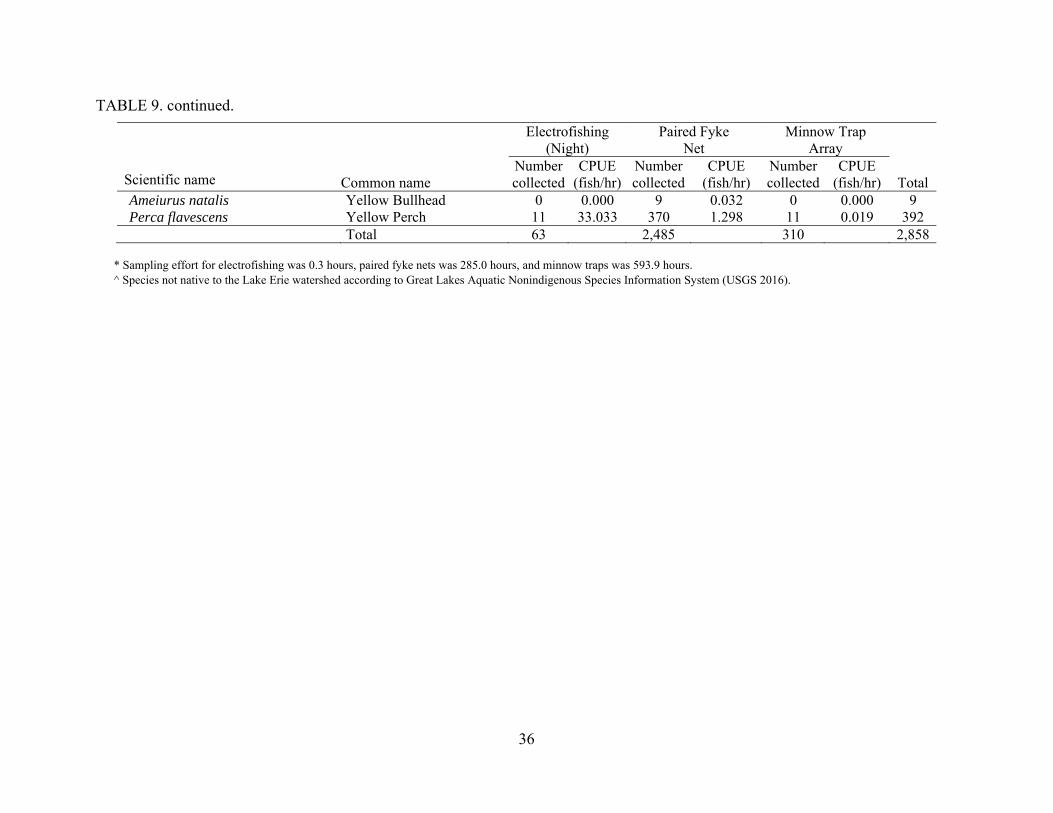
A total of 2,858 fish representing 32 species were collected (Table 9, Figure 10). No new non-native species were identified; however a number of existing invasive species were collected including Bigmouth Buffalo, Common Carp, Goldfish, Round Goby, and Tubenose Goby. A total of 2,485 fish representing 28 species were collected. The most abundant species were Mimic Shiner (35% of total catch), Spottail Shiner (16% of total catch), and Yellow Perch (15% of total catch). A total of 63 fish representing 16 species were collected using electrofishing (night time). The most abundant species were Brown Bullhead Ameiurus nebulosus (19% of total catch), Yellow Perch (17% of total catch), and Pumpkinseed (16% of total catch). A total of 310 fish representing 8 species were collected using minnow traps. The most abundant species was Round Goby (87% of total catch).
Maumee Bay, MI/OH—
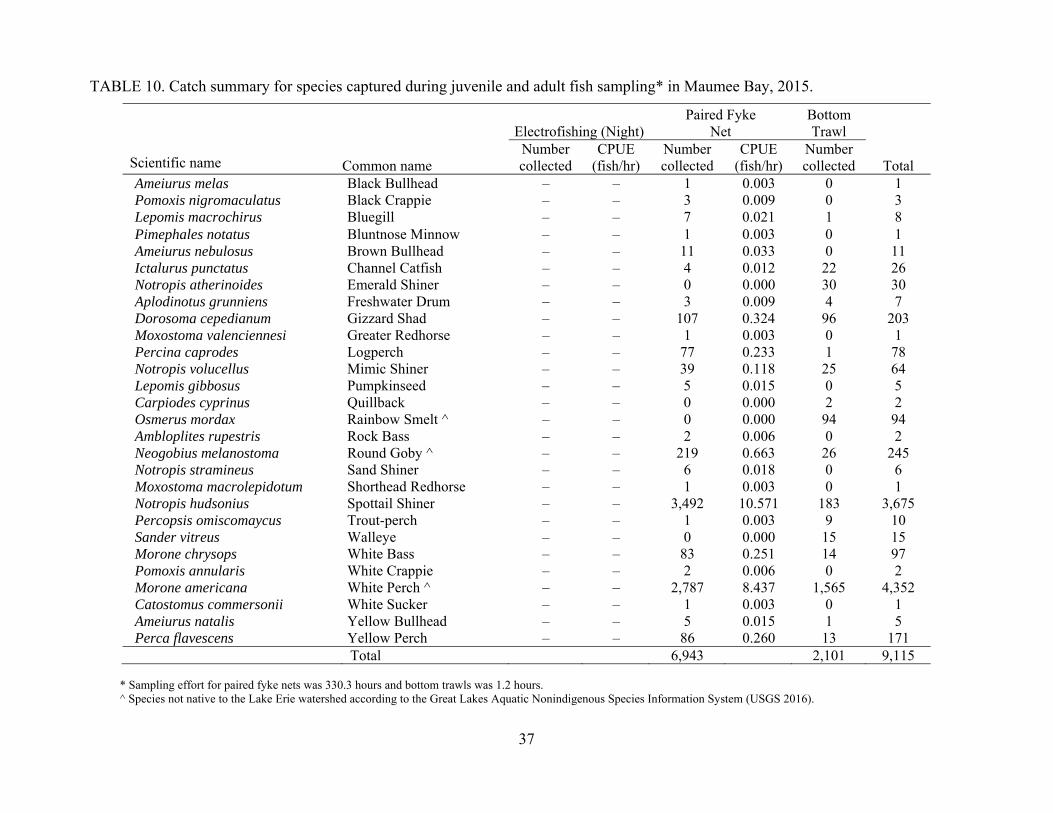
A total of 9,115 fish representing 29 species were collected (Table 10, Figure 11). No new non-native species were identified; however a number of existing invasive species were collected including Rainbow Smelt and Round Goby. A total of 6,943 fish representing 24 species were captured. The most abundant species were Spottail Shiner (50% of total catch) and White Perch (40% of total catch). A total of 2,101 fish representing 17 species were collected using the bottom trawl. The most abundant species was White perch (74% of total catch).
Sandusky Bay, OH—
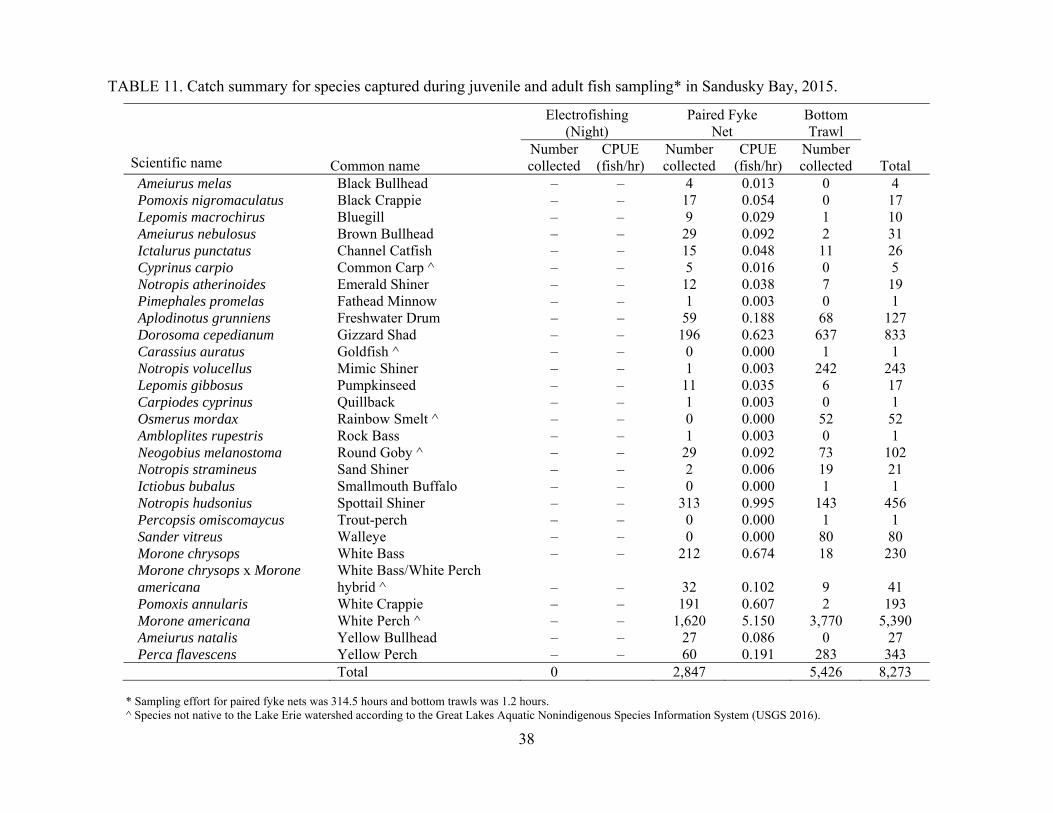
A total of 8,273 fish representing 28 species were collected (Table 11, Figure 12). No new non-native species were identified; however a number of existing invasive species were collected including Common Carp, Goldfish, Rainbow Smelt, and Round Goby. A total of 2,847 fish representing 23 species were collected. The most abundant species was White Perch (57% of total catch). A total of 5,426 fish representing 21 species were collected using the bottom trawl. The most abundant species was White Perch (69% of total catch).
Buffalo/upper Niagara River, NY—
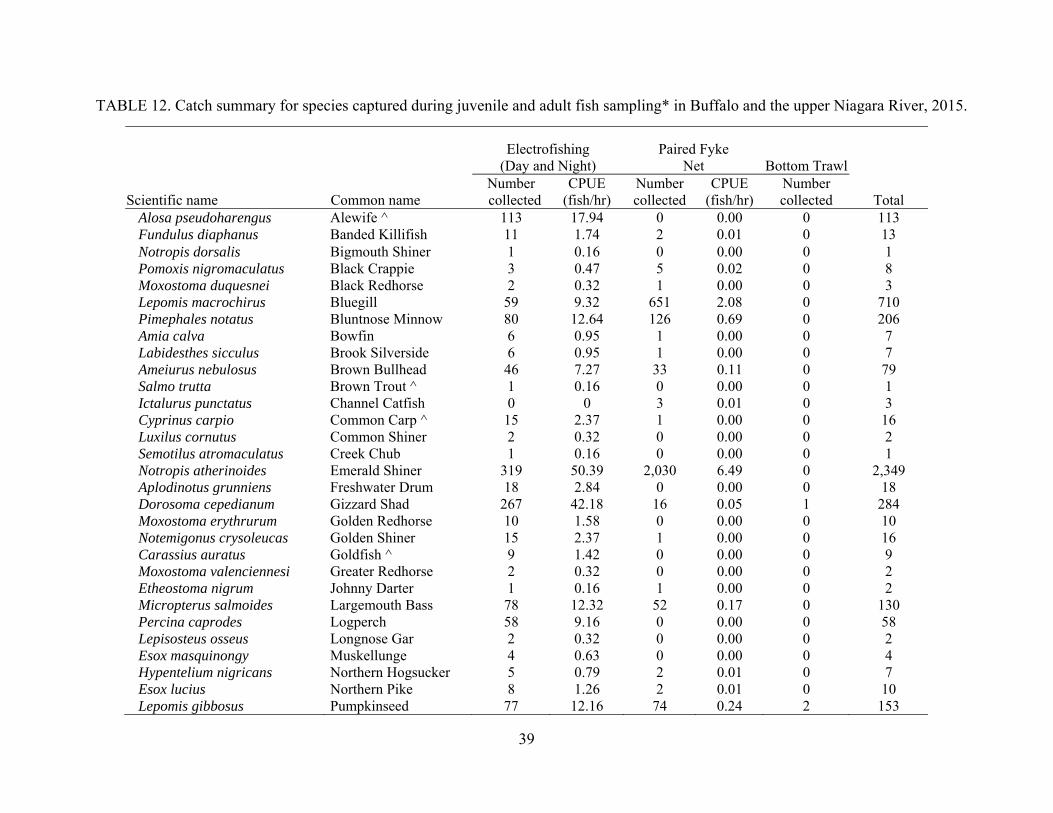
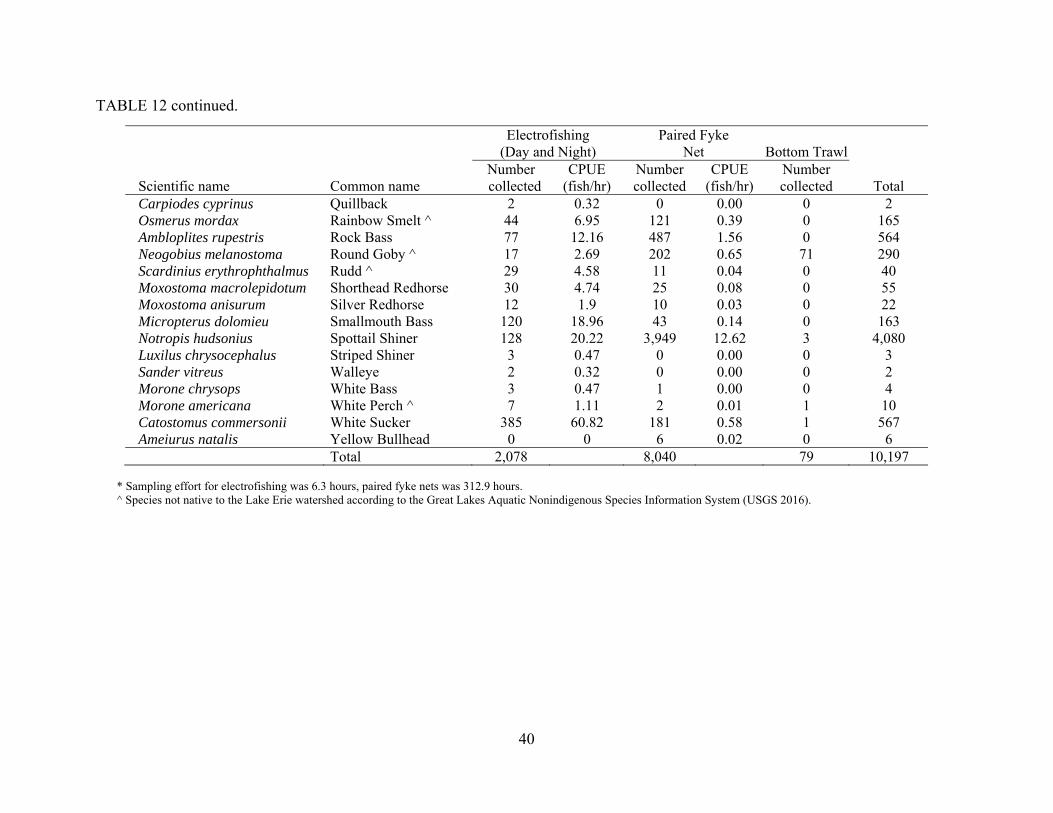
A total of 10,197 fish representing 46 species were collected (Table 12, Figure 13). No new non-native species were identified; however a number of existing invasive species were collected including Alewife, Common Carp, Goldfish, Rainbow Smelt, Round Goby, Rudd, and White Perch.
16
A total of 8,444 fish representing 31 species were collected using fyke nets. The most abundant species were Spottail Shiner (47% of total catch), Emerald Shiner (24% of total catch), Bluegill Lepomis macrochirus (8% of total catch), and Rock Bass (6% of total catch). A total of 2,184 fish representing 44 species were collected using electrofishing. The most abundant species encountered were White Sucker (18% of total catch), Yellow Perch (10% of total catch), Largemouth Bass (4% of total catch), and Rock Bass (4 % of total catch). A total of 95 fish representing 7 species were collected using the bottom trawl. The most abundant species were Round Goby (78% of total catch), Yellow Perch (17% of total catch), Spottail Shiner (3% of total catch), and Pumpkinseed (2% of total catch).
Species Accumulation Curves and Rarefaction
The efficacy for juvenile and adult fish sampling gears was generated for all Lake Erie sampling locations (Table 13). The highest combined gear sampling efficiency was observed at Maumee Bay (91% of species detected), and lowest at Sandusky Bay and Buffalo/Upper Niagara (82%.of species detected). Fyke netting gear was most consistent at species detection and ranged from 85% to 92% of species, whereas bottom trawling gear was the most variable and ranged from 47% to 96%. Based on rarefaction estimates, the range of samples needed to detect 95% of species present was lowest for Maumee Bay (131-132 samples needed) and highest at Buffalo/upper Niagara River (390-391 samples needed). Species accumulation curves were generated for all Lake Erie sampling locations with gears combined (Figure 14) and for each individual location by gear type (Figures 15-18). Results by sampling location follow. Detroit River, MI/ON— An estimated 61 species are present as a result of 2013-2015 data analysis; while 53 species were captured using all gears (Figure 14). To reach 95% detection of all species present (58 species), 176 samples will be required (Table 13). Sampling efficacy was 87%. Paired fyke nets had the highest sampling efficacy at 85%, and electrofishing was the lowest at 57% sampling efficacy. Bottom trawling was only completed in 2013 and had a 63% sampling efficacy. Minnow traps were used instead of trawling from 2014-2015 demonstrating a 72% sampling efficacy (Figure 15). Maumee Bay, MI/OH— An estimated 46 species are present as a result of 2013-2015 data analysis; while 42 species were captured using all gears (Figure 14). To reach 95 % detection of all species present (42 species), 132 samples will be required (Table 13). Sampling efficacy was 91%. Electrofishing had the highest sampling efficacy at 97%, but electrofishing was completed only in 2014. Paired fyke net sampling had the lowest sampling efficacy at 86%. Bottom trawling had a 96% sampling efficacy (Figure 16).
17
Sandusky Bay, OH— An estimated 45 species are present as a result of 2013-2015 data analysis; while 37 species were captured using all gears (Figure 14). To reach 95 % detection of all species present (43 species), 269 samples will be required (Table 13). Sampling efficacy was 82%. Paired fyke nets had the highest sampling efficacy at 93%, while bottom trawling had the lowest sampling efficacy at 72%. Electrofishing was only completed in 2013-2014 and had an 88% sampling efficacy (Figure 17). Buffalo/Upper Niagara River— An estimated 70 species are present as a result of 2013-2015 data analysis; while 58 species were captured using all gears (Figure 14). To reach 95% detection of all species present (67 species), 391 samples will be required (Table 13). Sampling efficacy was 82 %. Paired fyke nets had the highest sampling efficacy at 89%, while bottom trawling had the lowest at 47% sampling efficacy. Electrofishing had a 68% sampling efficacy (Figure 18).
DISCUSSION
The 2015 field season was the third year of sampling for the early detection of non-native species at Lake Erie locations using a vector based risk analysis (USFWS 2014a). A large number of juvenile and adult fish species (both native and non-native) were collected with an assortment of gears during 2013-2015. No new, undocumented, non-native species were captured. Targeting juvenile and adult fish can be challenging due to fish behavior, refined habitat requirements, and gear avoidance. Non-native species at low abundances can be difficult to detect as juveniles or adults using traditional sampling gear. To account for this, multiple gear types were used to target juveniles and adults. Greater than 80% of species were detected at all sampling locations. However, the detection efficiency was below the designated 95% threshold required to detect rare species (i.e., non-native species at first introduction; Hoffman et al. 2011). Rarefaction analysis indicated a considerable increase in sampling effort will be required to detect species at low abundances using the current sampling regime. Paired fyke nets generally had the highest efficiency among gear types, and were more effective at catching both greater numbers of individuals and unique species. The larger sample size for paired fyke nets (compared to electrofishing) may strengthen this observation, although these results are confirmed by the rarefaction analysis which controls for unequal sample sizes. Despite high overall performance of paired fyke nets, it is recognized that a single sampling gear approach only provides a partial representation of the juvenile and adult fish assemblage (Murphy and Willis 1996), and multi-gear approaches are required to adequately characterize fish communities (e.g., Jackson and Harvey 1997; Eggleton et al. 2010; Hoffman et al. 2011; Ruetz et al. 2007).
18
Non-native species may be introduced via a variety of pathways including larvae present in ballast water, juvenile stages mixed with live bait, or adult fish released as unwanted pets. Therefore, it is critical for early detection monitoring of non-native species to target all life stages because eradication and control efforts are most effective when implemented early (Hulme 2006). In addition to the sampling reported here, we collected ichthyoplankton at Maumee Bay, Sandusky Bay, and Buffalo/upper Niagara River locations; and benthos at Maumee Bay and Buffalo/upper Niagara River locations. Results are pending for these efforts and will be reported when available. Designing a long-term monitoring program is challenging due to the need to balance detection efficiency with available resources (Trebitz et al. 2009). These challenges become exacerbated when considering early detection monitoring for newly introduced non-native species because of the exorbitant amounts of effort and high survey efficiency (≥95% species detection) required. It is therefore beneficial to use results from previous sampling as a guide to adapt future survey design and improve overall sampling efficiency and effectiveness. For example, in Duluth-Superior Harbor, Lake Superior, Hoffman et al. (2011) used a re-sampling approach and found that using a targeted sampling design (i.e., resampled areas with high species richness) resulted in greater species richness and detected non-native species with a significantly higher probability than a spatially balanced random design (also see Trebitz et al. 2009). Although the effort required to detect rare (i.e., non-natives at first introduction) species remained large. Non-Metric Multi-Dimensional Scaling analysis could also be used to determine whether gear types are capturing complementary or redundant species assemblage data (cf. Ruetz et al. 2007; Frances et al. 2014). For example, if two gear types capture redundant assemblages then the least efficient gear (according to the ability to catch unique species) could be eliminated, focusing additional effort towards the most efficient gear types, and thereby increase survey effort and theoretically sampling efficiency. In closing, the early detection and monitoring program for non-native species will continue in Lake Erie during 2016. All four locations will be sampled with the same amount of effort and gear types. Monitoring data from efforts in 2016 will increase the collective sampling efficiency (2013-2016) to > 95% of species detected. Survey design will be critically re-evaluated following the 2016 field season. All available options for increasing sampling efficiency to provide the most comprehensive early detection and monitoring program for non-native species will be considered.

19
REFERENCES
Aron, W. I., and S. H. Smith. 1971. Ship canals and aquatic ecosystems. Science 174:13-20. Baerwaldt, K., A. Benson, and K. Irons. 2013. Asian Carp distribution in North America. Report to the Asian Carp Regional Coordinating Committee, April 2013. Chapman, D. C., J. J. Davis, J. A. Jenkins, P. M. Kocovsky, J. G. Miner, J. Farver, and P. R. Jackson. 2013. First evidence of Grass Carp recruitment in the Great Lakes Basin. Journal of Great Lakes Research 39:547-554. Chick, J. H., and M. A. Pegg. 2001. Invasive carp in the Mississippi River Basin. Science 292:2250-2251. Colwell, R. K. 2013. EstimateS: statistical estimation of species richness and shared species from samples. Version 9. Available: http://purl.oclc.org/estimates. Eggleton, M. A., J. R Jackson, and B. J. Lubinski. 2010. Comparison of gears for sampling littoral-zone fishes in floodplain lakes of the Lower White River, Arkansas. North American Journal of Fisheries Management 30(4):928-939. Evans, D. O., and D. H. Loftus. 1987. Colonization of inland lakes in the Great Lakes region by Rainbow Smelt, Osmerus mordax: their freshwater niche and effects on indigenous fishes. Canadian Journal of Fisheries and Aquatic Sciences 44:249-266. Fisher, J. P., J. D. Fitzsimmons, G. F. Combs, and J. M. Spitsbergen. 1996. Naturally occurring thiamine deficiency causing reproductive failure in Finger Lakes Atlantic Salmon and Great Lakes Lake Trout. Transactions of the American Fisheries Society 125:167-178. Frances, J. T., J. A. Chiotti, J. C. Boase, M. V. Thomas, B. A. Manny, and E. F. Roseman. 2014. A description of the nearshore fish communities in the Huron-Erie Corridor using multiple gear types. Journal of Great Lakes Research 40:52-61. GLMRIS (Great Lakes Mississippi River Interbasin Study). 2011. Non-native species of concern and dispersal risk for the Great Lakes and Mississippi River Interbasin Study. GLRI (Great Lakes Restoration Initiative). 2014. Great Lakes Restoration Initiative Action Plan II. Available: http://greatlakesrestoration.us/actionplan/pdfs/glri-action-plan-2.pdf. (March 2016). Great Lakes Water Quality Agreement. 1987. Protocol Amending the Agreement between Canada and The United States of America on Great Lakes water quality, 1978, as amended on October 16, 1983 and on November 18, 1987. Hoffman, J. C., J. R. Kelly, A. S. Trebitz, G. S. Peterson, and C. W. West. 2011. Effort and potential efficiencies for aquatic non-native species early detection. Canadian Journal of Fisheries and Aquatic Sciences 68:2064-2079.

20
Hulme, P. E. 2006. Beyond control: wider implications for the management of biological invasions. Journal of Applied Ecology 43:835-847. Jackson, D. A., and H. H. Harvey. 1997. Qualitative and quantitative sampling of lake fish communities. Canadian Journal of Fisheries and Aquatic Sciences 54:2807-2813. Jones, M. L. 2007. Toward improved assessment of Sea Lamprey population dynamics in support of cost-effective Sea Lamprey management. International Association of Great Lakes Research 33:35-47. Kolar, C. S., and D. M. Lodge. 2002. Ecological predictions and risk assessment for alien fishes in North America. Science 298:1233-1236. Laws, E. A., and R. S. J. Weisburd. 1990. Use of silver carp to control algal biomass in aquaculture ponds. Progressive Fish-Culturist 52:1-8. MICRA (Mississippi Interstate Cooperative Resource Association). 2002. Asian carp threat to the Great Lakes. River Crossings: The Newsletter of the Mississippi Interstate Cooperative Resource Association 11(3):1-2. Mills, E. L., J. H. Leach, J. T. Carlton, and C. L. Secor. 1993. Exotic species in the Great Lakes: a history of biotic crises and anthropogenic introductions. International Association of Great Lakes Research 19:1-54. Mills, E. L., J. H. Leach, J. T. Carlton, and C. L. Secor. 1994. Exotic species and the integrity of the Great Lakes: lessons from the past. Bioscience 44:666-676. Murphy, B. R., and D. W. Willis, editors. 1996. Fisheries Techniques, 2nd edition. American Fisheries Society, Bethesda, Maryland. NOAA (National Oceanic and Atmospheric Administration). 2016. Great Lakes Aquatic Nonindigenous Species Information System. Available: http://www.glerl.noaa.gov/res/Programs/ glansis/glansis.html. (March 2016). Ruetz, C. R. III, D. G. Uzarski, D. M. Kreuger, and E. S. Rutherford. 2007. Sampling a littoral fish assemblage: comparison of small-mesh fyke netting and boat electrofishing. North American Journal of Fisheries Management 2793:825-831. Smith, B. R., and J. J. Tibbles. 1980. Sea Lamprey (Petromyzon marinus) in Lakes Huron, Michigan, and Superior: history of invasion and control 1936-78. Canadian Journal of Fisheries and Aquatic Sciences 37:1780-1808. Stone, N. C., E. D. Heikes, and D. Freeman. 2000. Bighead Carp. Southern Regional Aquaculture Center (SRAC), Stoneville, Mississippi, September 2000. Southern Regional Aquaculture Center Publication 438.

21
Trebitz, A. S., J. R. Kelly, J. C. Hoffman, G. S. Peterson, and C. W. West. 2009. Exploiting habitat and gear patterns for efficient detection of rare and non-native benthos and fish in Great Lakes coastal ecosystems. Aquatic Invasions 4:651-667. USEPA (U.S. Environmental Protection Agency). 2008. Predicting future introductions of nonindigenous species to the Great Lakes. EPA/600/R-08/066F. National Center for Environmental Assessment, Washington, DC,. Available: http://www.epa.gov/ncea. USFWS (U.S. Fish and Wildlife Service). 2014a. Lake Erie implementation plan for the early detection of non-native fishes and select benthic macroinvertebrates. U.S. Fish and Wildlife Service, Alpena Fish and Wildlife Conservation Office, Alpena, Michigan and Lower Great Lakes Fish and Wildlife Conservation Office, Basom, New York. Available: http://www.fws.gov/midwest/alpena/documents/2014-LakeErie-EDIP-5-15-2014.pdf. USFWS. 2014b. Recommended sampling gear types and standard operating procedures for the early detection of non-native fishes and select benthic macroinvertebrates in the Great Lakes. USFWS. 2014c. Strategic framework for the early detection in monitoring of non-native fishes and select benthic macroinvertebrates in the Great Lakes. Great Lakes Comprehensive Aquatic Invasive Species Early Detection Monitoring Plan. USGS (U.S. Geological Survey). 2016. Nonindigenous Aquatic Species Database, Gainesville, Florida. Available: http://nas.er.usgs.gov. (March 2016). Vanderploeg, H. A., T. F. Nalepa, D. J. Jude, E. L. Mills, K. T. Holeck, J. R. Liebig, I. A. Grigorovich, and H. Ojaveer. 2002. Dispersal and emerging ecological impacts of Ponto-Caspian species in the Laurentian Great Lakes. Canadian Journal of Fisheries and Aquatic Sciences 59:1209-1228. Vörös, L., I. Oldal, M. Présing, and K. V. Balogh. 1997. Size-selective filtration and taxon specific digestion of plankton algae by Silver Carp (Hypophthalmichthys molitrix Val.). Hydrobiologia 342/343:223-228.
22
TABLES
TABLE 1. Catch summary for species captured during juvenile and adult fish sampling* in the Detroit River, 2013.
Common name
Electrofishing (Night)
Paired Fyke Net
Bottom Trawl
Scientific name Number collected
CPUE (fish/hr)
Number collected
CPUE (fish/hr)
Number collected Total
Alosa pseudoharengus Alewife ^ 12 14.401 5 0.019 0 17 Ameiurus melas Black Bullhead 0 0.000 2 0.007 0 2 Pomoxis nigromaculatus Black Crappie 0 0.000 5 0.019 0 5 Lepomis macrochirus Bluegill 0 0.000 105 0.391 0 105 Pimephales notatus Bluntnose Minnow 0 0.000 421 1.569 0 421 Amia calva Bowfin 0 0.000 1 0.004 0 1 Labidesthes sicculus Brook Silverside 65 78.003 0 0.000 0 65 Ameiurus nebulosus Brown Bullhead 1 1.200 9 0.034 0 10 Ictalurus punctatus Channel Catfish 1 1.200 2 0.007 0 3 Cyprinus carpio Common Carp ^ 0 0.000 1 0.004 0 1 Luxilus cornutus Common Shiner 1 1.200 0 0.000 0 1 Semotilus atromaculatus Creek Chub 0 0.000 2 0.007 3 5 Notropis atherinoides Emerald Shiner 66 79.203 68 0.253 0 134 Aplodinotus grunniens Freshwater Drum 1 1.200 0 0.000 0 1 Dorosoma cepedianum Gizzard Shad 0 0.000 16 0.060 0 16 Notemigonus crysoleucas Golden Shiner 0 0.000 1 0.004 0 1 Moxostoma erythrurum Golden Redhorse 2 2.400 0 0.000 0 2 Micropterus salmoides Largemouth Bass 4 4.800 67 0.250 1 72 Percina caprodes Logperch 0 0.000 30 0.112 7 37 Lepisosteus osseus Longnose Gar 0 0.000 1 0.004 0 1 Notropis volucellus Mimic Shiner 0 0.000 78 0.291 15 93 Lepomis gibbosus Pumpkinseed 25 30.001 38 0.142 0 63 Osmerus mordax Rainbow Smelt ^ 0 0.000 3 0.011 1 4 Ambloplites rupestris Rock Bass 9 10.800 155 0.577 17 181 Neogobius melanostoma Round Goby ^ 0 0.000 89 0.332 22 111 Notropis stramineus Sand Shiner 0 0.000 2 0.007 0 2
23
TABLE 1 continued.
Scientific name Common name
Electrofishing (Night)
Paired Fyke Net
Bottom Trawl
Number collected
CPUE (fish/hr)
Number collected
CPUE (fish/hr)
Number collected Total
Moxostoma macrolepidotum Shorthead Redhorse 0 0.000 1 0.004 0 1 Micropterus dolomieu Smallmouth Bass 0 0.000 259 0.965 4 263 Cyprinella spiloptera Spotfin Shiner 0 0.000 3 0.011 0 3 Notropis hudsonius Spottail Shiner 0 0.000 3,279 12.217 21 3,300 Lepisosteus oculatus Spotted Gar 1 1.200 1 0.004 0 2 Percopsis omiscomaycus Trout-perch 0 0.000 12 0.045 0 12 Proterorhinus marmoratus Tubenose goby ^ 0 0.000 2 0.007 0 2 Morone chrysops White Bass 0 0.000 24 0.089 0 24 Morone chrysops x Morone americana
White Bass/White Perch hybrid ^
0 0.000 349 1.300 0 349
Pomoxis annularis White Crappie 0 0.000 1 0.004 0 1 Morone americana White Perch ^ 1 1.200 108 0.402 0 109 Catostomus commersonii White Sucker 0 0.000 26 0.097 0 26 Ameiurus natalis Yellow Bullhead 0 0.000 3 0.011 0 3 Perca flavescens Yellow Perch 11 13.201 89 0.332 0 100
Total 200 5,258 91 5,549 * Sampling effort for electrofishing was 0.8 hours, paired fyke nets was 268.4 hours, and bottom trawls was 0.5 hours. ^ Species not native to the Lake Erie watershed according to the Great Lakes Aquatic Nonindigenous Species Information System (USGS 2016).
24
TABLE 2. Catch summary for species captured during juvenile and adult fish sampling* in Maumee Bay, 2013.
Common name
Electrofishing (Night)
Paired Fyke Net
Bottom Trawl
Scientific name Number collected
CPUE (fish/hr)
Number collected
CPUE (fish/hr)
Number collected Total
Alosa pseudoharengus Alewife ^ – – 10 0.030 0 10 Fundulus diaphanus Banded Killifish – – 1 0.003 0 1 Ameiurus melas Black Bullhead – – 3 0.009 0 3 Pomoxis nigromaculatus Black Crappie – – 2 0.006 0 2 Lepomis macrochirus Bluegill – – 333 1.010 0 333 Pimephales notatus Bluntnose Minnow – – 108 0.328 0 108 Amia calva Bowfin – – 1 0.003 0 1 Labidesthes sicculus Brook Silverside – – 1 0.003 0 1 Ameiurus nebulosus Brown Bullhead – – 10 0.030 0 10 Ictalurus punctatus Channel Catfish – – 18 0.055 30 48 Cyprinus carpio Common Carp ^ – – 1 0.003 0 1 Notropis atherinoides Emerald Shiner – – 1,366 4.143 318 1,684 Aplodinotus grunniens Freshwater Drum – – 278 0.843 24 302 Notropis buchanani Ghost Shiner ^ – – 1 0.003 0 1 Dorosoma cepedianum Gizzard Shad – – 6,263 18.997 231 6,494 Notemigonus crysoleucas Golden Shiner – – 1 0.003 0 1 Micropterus salmoides Largemouth Bass – – 5 0.015 0 5 Percina caprodes Logperch – – 16 0.049 0 16 Notropis volucellus Mimic Shiner – – 279 0.846 1 280 Lepomis gibbosus Pumpkinseed – – 56 0.170 1 57 Carpiodes cyprinus Quillback – – 1 0.003 0 1 Osmerus mordax Rainbow Smelt ^ – – 2 0.006 22 24 Ambloplites rupestris Rock Bass – – 3 0.009 0 3 Neogobius melanostoma Round Goby ^ – – 196 0.595 32 228 Notropis stramineus Sand Shiner – – 119 0.361 0 119 Moxostoma macrolepidotum Shorthead Redhorse – – 3 0.009 0 3 Moxostoma anisurum Silver Redhorse – – 1 0.003 0 1 Cyprinella spiloptera Spotfin Shiner – – 9 0.027 0 9 Notropis hudsonius Spottail Shiner – – 11,033 33.466 233 11,266 Percopsis omiscomaycus Trout-perch – – 2 0.006 7 9
25
TABLE 2 continued.
Scientific name Common name
Electrofishing (Night)
Paired Fyke Net
Bottom Trawl
Number collected
CPUE (fish/hr)
Number collected
CPUE (fish/hr)
Number collected Total
Sander vitreus Walleye – – 1 0.003 0 1 Morone chrysops White Bass – – 79 0.240 25 104 Morone chrysops x Morone americana White Bass/White Perch
hybrid ^ – – 810 2.457 0 810
Pomoxis annularis White Crappie – – 2 0.006 0 2 Morone americana White Perch ^ – – 947 2.872 451 1,398 Catostomus commersonii White Sucker – – 6 0.018 1 7 Ameiurus natalis Yellow Bullhead – – 1 0.003 0 1 Perca flavescens Yellow Perch – – 35 0.106 15 50 Total 0 22,003 1,391 23,394
* Sampling effort for paired fyke nets was 329.6 hours and bottom trawls was 1.2 hours. ^ Species not native to the Lake Erie watershed according to the Great Lakes Aquatic Nonindigenous Species Information System (USGS 2012).
26
TABLE 3. Catch summary for species captured during juvenile and adult fish sampling* in Sandusky Bay, 2013.
Common name
Electrofishing (Night)
Paired Fyke Net
Bottom Trawl
Scientific name Number collected
CPUE (fish/hr)
Number collected
CPUE (fish/hr)
Number collected Total
Alosa pseudoharengus Alewife ^ 3 1.200 0 0.000 0 3 Ictiobus cyprinellus Bigmouth Buffalo ^ 2 0.800 0 0.000 0 2 Lepomis macrochirus Bluegill 0 0.000 4 0.056 0 4 Labidesthes sicculus Brook Silverside 4 1.600 0 0.000 0 4 Ameiurus nebulosus Brown Bullhead 0 0.000 3 0.042 1 4 Cyprinus carpio Common Carp ^ 3 1.200 0 0.000 5 8 Notropis atherinoides Emerald Shiner 54 21.600 8,479 117.878 474 9,007 Aplodinotus grunniens Freshwater Drum 2 0.800 1 0.014 1 4 Dorosoma cepedianum Gizzard Shad 880 352.000 11 0.153 868 1,759 Carassius auratus Goldfish ^ 3 1.200 0 0.000 0 3 Lepisosteus osseus Longnose Gar 0 0.000 0 0.000 1 1 Notropis volucellus Mimic Shiner 0 0.000 1 0.014 3 4 Osmerus mordax Rainbow Smelt ^ 0 0.000 0 0.000 2 2 Neogobius melanostoma Round Goby ^ 0 0.000 3 0.042 0 3 Notropis stramineus Sand Shiner 0 0.000 0 0.000 13 13 Micropterus dolomieu Smallmouth Bass 1 0.400 0 0.000 0 1 Ictiobus bubalus Smallmouth Buffalo 3 1.200 0 0.000 0 3 Notropis hudsonius Spottail Shiner 1 0.400 86 1.196 9 96 Minytrema melanops Spotted Sucker 1 0.400 0 0.000 0 1 Sander vitreus Walleye 1 0.400 0 0.000 0 1 Morone chrysops White Bass 0 0.000 3 0.042 0 3 Morone chrysops x Morone americana
White Bass/White Perch hybrid ^ 0 0.000 2 0.028 0 2
Pomoxis annularis White Crappie 2 0.800 42 0.584 0 44 Morone americana White Perch ^ 18 7.200 632 8.786 76 726 Ameiurus natalis Yellow Bullhead 1 0.400 23 0.320 0 24 Perca flavescens Yellow Perch 0 0.000 4 0.056 6 10 Total 979 9,294 1,459 11,732
* Sampling effort for electrofishing was 2.5 hours, paired fyke nets was 71.9 hours, and bottom trawls was 1.3 hours. ^ Species not native to the Lake Erie watershed according to the Great Lakes Aquatic Nonindigenous Species Information System (USGS 2016).
27
TABLE 4. Catch summary for species captured during juvenile and adult fish sampling* in Buffalo and the upper Niagara River, 2013.
Common name
Electrofishing (Day)
Bottom Trawl
Total Scientific name Number collected
CPUE (fish/hr)
Number collected
Alosa pseudoharengus Alewife ^ 113 22.6 0 113 Fundulus diaphanus Banded Killifish 8 1.6 0 8 Rhinichthys atratulus Blacknose Dace 6 1.2 0 6 Lepomis macrochirus Bluegill 16 3.2 0 16 Pimephales notatus Bluntnose Minnow 36 7.2 0 36 Ameiurus nebulosus Brown Bullhead 29 5.8 0 29 Moxostoma duquesnei Black Redhorse 5 1 0 5 Labidesthes sicculus Brook Silverside 4 0.8 0 4 Cyprinus carpio Common Carp ^ 26 5.2 0 26 Luxilus cornutus Common Shiner 41 8.2 0 41 Notropis atherinoides Emerald Shiner 462 92.4 0 462 Pimephales promelas Fathead Minnow 1 0.2 0 1 Aplodinotus grunniens Freshwater Drum 8 1.6 0 8 Dorosoma cepedianum Gizzard Shad 16 3.2 0 16 Carassius auratus Goldfish ^ 20 4 0 20 Notemigonus crysoleucas Golden Shiner 10 2 0 10 Moxostoma erythrurum Golden Redhorse 12 2.4 0 12 Lepomis cyanellus Green Sunfish 1 0.2 0 1 Moxostoma valenciennesi Greater Redhorse 44 8.8 0 44 Nocomis biguttatus Hornyhead Chub 8 1.6 0 8 Micropterus salmoides Largemouth Bass 128 25.6 0 128 Percina caprodes Logperch 7 1.4 0 7 Esox masquinongy Muskellunge 2 0.4 0 2 Esox lucius Northern Pike 4 1.6 0 4 Lepomis gibbosus Pumpkinseed 11 2.2 0 11 Carpiodes cyprinus Quillback 6 1.2 0 6 Nocomis micropogon River Chub 4 0.8 0 4 Neogobius melanostoma Round Goby ^ 9 1.8 5 14 Ambloplites rupestris Rock Bass 67 13.4 0 67 Scardinius erythrophthalmus Rudd ^ 28 5.6 0 28 Moxostoma macrolepidotum Shorthead Redhorse 11 2.2 0 11
28
TABLE 4 continued.
Scientific name Common name
Electrofishing (Day)
Bottom Trawl
Number collected
CPUE (fish/hr)
Number collected Total
Micropterus dolomieu Smallmouth Bass 82 17 0 82 Cyprinella spiloptera Spotfin Shiner 1 0.2 0 1 Notropis hudsonius Spottail Shiner 64 12.8 0 64 Sander vitreus Walleye 2 0.4 0 2 Morone americana White Perch ^ 15 3 0 15 Catostomus commersonii White Sucker 170 34 0 170 Perca flavescens Yellow Perch 95 19 0 95 Total 1,572 5 1,577
* Sampling effort for electrofishing was 5.0 hours. ^ Species not native to the Lake Erie watershed according to the Great Lakes Aquatic Nonindigenous Species Information System (USGS 2016).
29
TABLE 5. Catch summary for species captured during juvenile and adult fish sampling* in the Detroit River, 2014.
Common name
Electrofishing (Night)
Paired Fyke Net
Minnow Trap Array
Total Scientific name Number collected
CPUE (fish/hr)
Number collected
CPUE (fish/hr)
Number collected
CPUE (fish/hr)
Fundulus diaphanus Banded Killifish 1 0.667 1 0.003 0 0.000 2 Ameiurus melas Black Bullhead 1 0.667 11 0.033 0 0.000 12 Pomoxis nigromaculatus Black Crappie 0 0.000 4 0.012 0 0.000 4 Lepomis macrochirus Bluegill 0 0.000 31 0.092 0 0.000 31 Pimephales notatus Bluntnose Minnow 3 2.000 213 0.634 38 0.111 254 Amia calva Bowfin 0 0.000 1 0.003 0 0.000 1 Labidesthes sicculus Brook Silverside 16 10.667 0 0.000 0 0.000 16 Ameiurus nebulosus Brown Bullhead 0 0.000 1 0.003 0 0.000 1 Ictalurus punctatus Channel Catfish 0 0.000 1 0.003 0 0.000 1 Cyprinus carpio Common Carp ^ 1 0.667 0 0.000 0 0.000 1 Luxilus cornutus Common Shiner 5 3.333 0 0.000 0 0.000 5 Semotilus atromaculatus Creek Chub 2 1.333 0 0.000 0 0.000 2 Notropis atherinoides Emerald Shiner 26 17.333 17 0.051 1 0.003 44 Aplodinotus grunniens Freshwater Drum 1 0.667 0 0.000 0 0.000 1 Notropis buchanani Ghost Shiner ^ 0 0.000 1 0.003 0 0.000 1 Carassius auratus Goldfish^ 2 1.333 59 0.176 0 0.000 61 Nocomis biguttatus Hornyhead chub 2 1.333 0 0.000 0 0.000 2 Micropterus salmoides Largemouth bass 5 3.333 140 0.417 0 0.000 145 Percina caprodes Logperch 0 0.000 3 0.009 0 0.000 3 Notropis volucellus Mimic Shiner 5 3.333 161 0.479 4 0.012 170 Esox masquinongy Muskellunge 3 2.000 2 0.006 0 0.000 5 Esox lucius Northern Pike 2 1.333 0 0.000 0 0.000 2 Lepomis gibbosus Pumpkinseed 0 0.000 20 0.060 1 0.003 21 Ambloplites rupestris Rock Bass 18 12.000 200 0.595 10 0.029 228 Neogobius melanostoma Round Goby ^ 1 0.667 70 0.208 269 0.786 340 Notropis stramineus Sand Shiner 1 0.667 91 0.271 27 0.079 119 Moxostoma anisurum Silver Redhorse 5 3.333 2 0.006 0 0.000 7 Micropterus dolomieu Smallmouth Bass 5 3.333 135 0.402 3 0.009 143 Cyprinella spiloptera Spotfin Shiner 0 0.000 2 0.006 0 0.000 2 Notropis hudsonius Spottail Shiner 0 0.000 79 0.235 8 0.023 87 Minytrema melanops Spotted Sucker 13 8.667 1 0.003 0 0.000 14
30
TABLE 5 continued.
Scientific name Common name
Electrofishing (Night)
Paired Fyke Net
Minnow Trap Array
Number collected
CPUE (fish/hr)
Number collected
CPUE (fish/hr)
Number collected
CPUE (fish/hr) Total
Percopsis omiscomaycus Trout-perch 0 0.000 1 0.003 0 0.000 1 Proterorhinus marmoratus Tubenose Goby ^ 0 0.000 1 0.003 0 0.000 1 Sander vitreus Walleye 2 1.333 0 0.000 0 0.000 2 Morone americana White Perch ^ 0 0.000 8 0.024 0 0.000 8 Catostomus commersonii White Sucker 8 5.333 15 0.045 0 0.000 23 Ameiurus natalis Yellow Bullhead 0 0.000 11 0.033 0 0.000 11 Perca flavescens Yellow Perch 173 115.333 58 0.173 4 0.012 235 Total 301 1,340 365 2,006
* Sampling effort for electrofishing was 1.5 hours, paired fyke nets was 336.1 hours, minnow traps was 342.4 hours, and bottom trawls was 0.6 hours. ^ Species not native to the Lake Erie watershed according to the Great Lakes Aquatic Nonindigenous Species Information System (USGS 2016).
31
TABLE 6. Catch summary for species captured during juvenile and adult fish sampling* in Maumee Bay, 2014.
Common name
Electrofishing (Night)
Paired Fyke Net
Bottom Trawl
Total Scientific name Number collected
CPUE (fish/hr)
Number collected
CPUE (fish/hr)
Number collected
Ameiurus melas Black Bullhead 0 0.000 15 0.044 0 15 Pomoxis nigromaculatus Black Crappie 0 0.000 2 0.006 0 2 Lepomis macrochirus Bluegill 0 0.000 35 0.104 0 35 Labidesthes sicculus Brook Silverside 3 2.000 0 0.000 0 3 Ameiurus nebulosus Brown Bullhead 6 4.000 3 0.009 0 9 Ictalurus punctatus Channel Catfish 0 0.000 40 0.118 0 40 Cyprinus carpio Common Carp ^ 0 0.000 1 0.003 0 1 Notropis atherinoides Emerald Shiner 2 1.333 17 0.050 3 22 Aplodinotus grunniens Freshwater Drum 0 0.000 62 0.184 0 62 Dorosoma cepedianum Gizzard Shad 73 48.667 42 0.124 0 115 Moxostoma erythrurum Golden Redhorse 0 0.000 4 0.012 0 4 Carassius auratus Goldfish ^ 3 2.000 0 0.000 0 3 Percina caprodes Logperch 1 0.667 69 0.204 0 70 Notropis volucellus Mimic Shiner 0 0.000 114 0.338 0 114 Esox lucius Northern Pike 0 0.000 1 0.003 0 1 Lepomis gibbosus Pumpkinseed 2 1.333 8 0.024 0 10 Ambloplites rupestris Rock Bass 0 0.000 3 0.009 0 3 Neogobius melanostoma Round Goby ^ 0 0.000 151 0.447 1 152 Notropis stramineus Sand Shiner 0 0.000 59 0.175 0 59 Notropis hudsonius Spottail Shiner 0 0.000 2,647 7.837 1 2,648 Percopsis omiscomaycus Trout-perch 0 0.000 1 0.003 0 1 Sander vitreus Walleye 1 0.667 1 0.003 0 2 Morone chrysops White Bass 0 0.000 18 0.053 0 18 Morone chrysops x Morone americana
White Bass/White Perch hybrid ^ 0 0.000 18 0.053 0 18
Morone americana White Perch ^ 4 2.667 1,623 4.805 0 1,627 Catostomus commersonii White Sucker 0 0.000 3 0.009 0 3 Ameiurus natalis Yellow Bullhead 4 2.667 0 0.000 0 4 Perca flavescens Yellow Perch 2 1.333 327 0.968 0 329 Total 101 5,264 5 5,370
* Sampling effort for electrofishing was 1.5 hours, paired fyke nets was 337.7 hours, and bottom trawls was 1.2 hours. ^ Species not native to the Lake Erie watershed according to the Great Lakes Aquatic Nonindigenous Species Information System (USGS 2016).
32
TABLE 7. Catch summary for species captured during juvenile and adult fish sampling* in Sandusky Bay, 2014.
Common name
Electrofishing (Night)
Paired Fyke Net
Bottom Trawl
Total Scientific name
Number collected
CPUE (fish/hr)
Number collected
CPUE (fish/hr)
Number collected
Ictiobus cyprinellu Bigmouth Buffalo ^ 31 8.732 0 0.000 0 31 Ameiurus melas Black Bullhead 0 0.000 513 1.687 0 513 Pomoxis nigromaculatus Black Crappie 0 0.000 14 0.046 0 14 Lepomis macrochirus Bluegill 3 0.845 7 0.023 1 11 Labidesthes sicculus Brook Silverside 15 4.225 0 0.000 0 15 Ameiurus nebulosus Brown Bullhead 2 0.563 102 0.335 0 104 Ictalurus punctatus Channel Catfish 1 0.282 39 0.128 0 40 Cyprinus carpio Common Carp ^ 23 6.479 1 0.003 0 24 Notropis atherinoides Emerald Shiner 40 11.268 266 0.875 1 307 Aplodinotus grunniens Freshwater Drum 9 2.535 85 0.279 9 103 Dorosoma cepedianum Gizzard Shad 533 150.141 47 0.155 237 817 Moxostoma erythrurum Golden Redhorse 1 0.282 0 0.000 0 1 Carassius auratus Goldfish ^ 9 2.535 0 0.000 0 9 Micropterus salmoides Largemouth Bass 2 0.563 0 0.000 0 2 Notropis volucellus Mimic Shiner 0 0.000 3 0.010 3 6 Lepomis gibbosus Pumpkinseed 3 0.845 0 0.000 0 3 Carpiodes cyprinus Quillback 0 0.000 5 0.016 0 5 Osmerus mordax Rainbow Smelt ^ 0 0.000 0 0.000 2 2 Neogobius melanostoma Round Goby ^ 0 0.000 11 0.036 1 12 Moxostoma anisurum Silver Redhorse 2 0.563 0 0.000 0 2 Micropterus dolomieu Smallmouth Bass 2 0.563 0 0.000 0 2 Ictiobus bubalus Smallmouth Buffalo 2 0.563 0 0.000 0 2 Notropis hudsonius Spottail Shiner 0 0.000 14 0.046 6 20 Minytrema melanops Spotted Sucker 0 0.000 1 0.003 0 1 Sander vitreus Walleye 4 1.127 0 0.000 1 5 Morone chrysops White Bass 0 0.000 7 0.023 1 8 Pomoxis annularis White Crappie 4 1.127 69 0.227 0 73 Morone americana White Perch ^ 160 45.070 1,165 3.830 762 2,087 Ameiurus natalis Yellow Bullhead 0 0.000 2 0.007 0 2 Perca flavescens Yellow Perch 4 1.127 14 0.046 9 27 Total 850 2,365 1,033 4,248
* Sampling effort for electrofishing was 3.5 hours, paired fyke nets was 304.1 hours, and bottom trawls was 1.2 hours.
^ Species not native to the Lake Erie watershed according to the Great Lakes Aquatic Nonindigenous Species Information System (USGS 2016).
33
TABLE 8. Catch summary for species captured during juvenile and adult fish sampling* in Buffalo and the upper Niagara River, 2014.
Electrofishing (Day and Night)
Paired Fyke Net
Bottom Trawl
Scientific name Common name Number
collected CPUE
(fish/hr) Number collected
CPUE (fish/hr)
Number collected Total
Fundulus diaphanus Banded Killifish 7 1.27 17 0.13 0 24 Pomoxis nigromaculatus Black Crappie 1 0.18 0 0.00 0 1 Moxostoma duquesnei Black Redhorse 10 1.82 1 0.01 0 11 Lepomis macrochirus Bluegill 30 5.45 25 0.20 0 55 Pimephales notatus Bluntnose Minnow 113 20.55 206 1.63 0 319 Labidesthes sicculus Brook Silverside 3 0.55 0 0.00 0 3 Ameiurus nebulosus Brown Bullhead 30 5.45 2 0.02 0 32 Cyprinus carpio Common Carp ^ 22 4 0 0.00 0 22 Luxilus cornutus Common Shiner 8 1.45 0 0.00 0 8 Semotilus atromaculatus Creek Chub 0 0 3 0.02 0 3 Notropis atherinoides Emerald Shiner 423 76.91 122 0.97 0 545 Semotilus corporalis Fallfish 3 0.55 0 0.00 0 3 Aplodinotus grunniens Freshwater Drum 9 1.64 0 0.00 0 9 Dorosoma cepedianum Gizzard Shad 10 1.82 0 0.00 0 10 Moxostoma erythrurum Golden Redhorse 7 1.27 49 0.39 0 56 Notemigonus crysoleucas Golden Shiner 6 1.09 2 0.02 0 8 Carassius auratus Goldfish ^ 18 3.27 9 0.07 0 27 Moxostoma valenciennesi Greater Redhorse 59 10.73 2 0.02 0 61 Lepomis cyanellus Green Sunfish 0 0 2 0.02 0 2 Nocomis biguttatus Hornyhead Chub 27 4.91 0 0.00 0 27 Etheostoma nigrum Johnny Darter 0 0 6 0.05 0 6 Micropterus salmoides Largemouth Bass 140 25.45 14 0.11 0 154 Lepisosteus osseus Longnose Gar 1 0.18 0 0.00 0 1 Notropis volucellus Mimic Shiner 0 0 2 0.02 0 2 Esox masquinongy Muskellunge 2 0.36 0 0.00 0 2 Hypentelium nigricans Northern Hogsucker 2 0.36 0 0.00 0 2 Esox lucius Northern Pike 7 1.27 0 0.00 0 7 Lepomis gibbosus Pumpkinseed 52 9.45 4 0.03 0 56 Carpiodes cyprinus Quillback 1 0.18 0 0.00 0 1 Osmerus mordax Rainbow Smelt ^ 68 12.36 9,655 76.51 0 9,723
34
TABLE 8 continued.
Scientific name Common name
Electrofishing (Day and Night)
Paired Fyke Net
Bottom Trawl
Number collected
CPUE (fish/hr)
Number collected
CPUE (fish/hr)
Number collected Total
Ambloplites rupestris Rock Bass 37 6.73 201 1.59 0 238 Neogobius melanostoma Round Goby ^ 1 0.18 121 0.96 8 130 Scardinius erythrophthalmus Rudd ^ 15 2.73 17 0.13 0 32 Moxostoma macrolepidotum Shorthead Redhorse 0 0 1 0.01 0 1 Moxostoma anisurum Silver Redhorse 7 1.27 0 0.00 0 7 Micropterus dolomieu Smallmouth Bass 33 6 2 0.02 0 35 Ictiobus bubalus Smallmouth Buffalo 1 0.18 0 0.00 0 1 Notropis hudsonius Spottail Shiner 46 8.36 144 1.14 0 190 Percopsis omiscomaycus Trout-perch 4 0.73 0 0.00 0 4 Sander vitreus Walleye 4 0.73 0 0.00 0 4 Morone chrysops White Bass 1 0.18 0 0.00 0 1 Pomoxis annularis White Crappie 0 0 1 0.01 0 1 Morone americana White Perch ^ 8 1.45 39 0.31 0 47 Catostomus commersonii White Sucker 62 11.27 66 0.52 0 128 Perca flavescens Yellow Perch 165 30 13 0.10 0 178 Total 1,443 10,726 8 12,177
* Sampling effort for electrofishing was 5.5 hours, paired fyke nets was 126.2 hours. ^ Species not native to the Lake Erie watershed according to the Great Lakes Aquatic Nonindigenous Species Information System (USGS 2016).
35
TABLE 9. Catch summary for species captured during juvenile and adult fish sampling* in the Detroit River, 2015.
Common name
Electrofishing (Night)
Paired Fyke Net
Minnow Trap Array
Total Scientific name
Number collected
CPUE (fish/hr)
Number collected
CPUE (fish/hr)
Number collected
CPUE (fish/hr)
Fundulus diaphanus Banded Killifish 0 0.000 2 0.007 0 0.000 2 Ictiobus cyprinellu Bigmouth Buffalo ^ 1 3.003 0 0.000 0 0.000 1 Ameiurus melas Black Bullhead 0 0.000 13 0.046 0 0.000 13 Pomoxis nigromaculatus Black Crappie 0 0.000 2 0.007 0 0.000 2 Lepomis macrochirus Bluegill 0 0.000 69 0.242 0 0.000 69 Pimephales notatus Bluntnose Minnow 1 3.003 120 0.421 17 0.029 138 Amia calva Bowfin 0 0.000 1 0.004 0 0.000 1 Labidesthes sicculus Brook Silverside 4 12.012 0 0.000 0 0.000 4 Ameiurus nebulosus Brown Bullhead 12 36.036 8 0.028 0 0.000 20 Cyprinus carpio Common Carp ^ 0 0.000 3 0.011 0 0.000 3 Notropis atherinoides Emerald Shiner 6 18.018 10 0.035 0 0.000 16 Aplodinotus grunniens Freshwater Drum 1 3.003 1 0.004 0 0.000 2 Dorosoma cepedianum Gizzard Shad 3 9.009 3 0.011 0 0.000 6 Carassius auratus Goldfish ^ 5 15.015 0 0.000 0 0.000 5 Nocomis biguttatus Hornyhead Chub 0 0.000 11 0.039 0 0.000 11 Micropterus salmoides Largemouth Bass 3 9.009 41 0.144 0 0.000 44 Percina caprodes Logperch 0 0.000 53 0.186 0 0.000 53 Notropis volucellus Mimic Shiner 1 3.003 863 3.028 2 0.003 866 Esox masquinongy Muskellunge 0 0.000 1 0.004 0 0.000 1 Lepomis peltastes Northern Longear Sunfish 0 0.000 1 0.004 0 0.000 1 Noturus stigmosus Northern Madtom 0 0.000 0 0.000 1 0.002 1 Lepomis gibbosus Pumpkinseed 10 30.030 25 0.088 0 0.000 35 Ambloplites rupestris Rock Bass 1 3.003 167 0.586 6 0.010 174 Neogobius melanostoma Round Goby ^ 0 0.000 213 0.747 269 0.453 482 Micropterus dolomieu Smallmouth Bass 0 0.000 10 0.035 1 0.002 11 Notropis hudsonius Spottail Shiner 1 3.003 397 1.393 3 0.005 401 Minytrema melanops Spotted Sucker 2 6.006 1 0.004 0 0.000 3 Proterorhinus marmoratus Tubenose Goby ^ 0 0.000 11 0.039 0 0.000 11 Morone americana White Perch ^ 0 0.000 76 0.267 0 0.000 76 Catostomus commersonii White Sucker 1 3.003 4 0.014 0 0.000 5
36
TABLE 9. continued.
Common name
Electrofishing (Night)
Paired Fyke Net
Minnow Trap Array
Total Scientific name
Number collected
CPUE (fish/hr)
Number collected
CPUE (fish/hr)
Number collected
CPUE (fish/hr)
Ameiurus natalis Yellow Bullhead 0 0.000 9 0.032 0 0.000 9 Perca flavescens Yellow Perch 11 33.033 370 1.298 11 0.019 392 Total 63 2,485 310 2,858
* Sampling effort for electrofishing was 0.3 hours, paired fyke nets was 285.0 hours, and minnow traps was 593.9 hours. ^ Species not native to the Lake Erie watershed according to Great Lakes Aquatic Nonindigenous Species Information System (USGS 2016).
37
TABLE 10. Catch summary for species captured during juvenile and adult fish sampling* in Maumee Bay, 2015.
Common name
Electrofishing (Night) Paired Fyke
Net Bottom Trawl
Total Scientific name Number collected
CPUE (fish/hr)
Number collected
CPUE (fish/hr)
Number collected
Ameiurus melas Black Bullhead – – 1 0.003 0 1 Pomoxis nigromaculatus Black Crappie – – 3 0.009 0 3 Lepomis macrochirus Bluegill – – 7 0.021 1 8 Pimephales notatus Bluntnose Minnow – – 1 0.003 0 1 Ameiurus nebulosus Brown Bullhead – – 11 0.033 0 11 Ictalurus punctatus Channel Catfish – – 4 0.012 22 26 Notropis atherinoides Emerald Shiner – – 0 0.000 30 30 Aplodinotus grunniens Freshwater Drum – – 3 0.009 4 7 Dorosoma cepedianum Gizzard Shad – – 107 0.324 96 203 Moxostoma valenciennesi Greater Redhorse – – 1 0.003 0 1 Percina caprodes Logperch – – 77 0.233 1 78 Notropis volucellus Mimic Shiner – – 39 0.118 25 64 Lepomis gibbosus Pumpkinseed – – 5 0.015 0 5 Carpiodes cyprinus Quillback – – 0 0.000 2 2 Osmerus mordax Rainbow Smelt ^ – – 0 0.000 94 94 Ambloplites rupestris Rock Bass – – 2 0.006 0 2 Neogobius melanostoma Round Goby ^ – – 219 0.663 26 245 Notropis stramineus Sand Shiner – – 6 0.018 0 6 Moxostoma macrolepidotum Shorthead Redhorse – – 1 0.003 0 1 Notropis hudsonius Spottail Shiner – – 3,492 10.571 183 3,675 Percopsis omiscomaycus Trout-perch – – 1 0.003 9 10 Sander vitreus Walleye – – 0 0.000 15 15 Morone chrysops White Bass – – 83 0.251 14 97 Pomoxis annularis White Crappie – – 2 0.006 0 2 Morone americana White Perch ^ – – 2,787 8.437 1,565 4,352 Catostomus commersonii White Sucker – – 1 0.003 0 1 Ameiurus natalis Yellow Bullhead – – 5 0.015 1 5 Perca flavescens Yellow Perch – – 86 0.260 13 171 Total 6,943 2,101 9,115
* Sampling effort for paired fyke nets was 330.3 hours and bottom trawls was 1.2 hours. ^ Species not native to the Lake Erie watershed according to the Great Lakes Aquatic Nonindigenous Species Information System (USGS 2016).
38
TABLE 11. Catch summary for species captured during juvenile and adult fish sampling* in Sandusky Bay, 2015.
Common name
Electrofishing (Night)
Paired Fyke Net
Bottom Trawl
Total Scientific name Number collected
CPUE (fish/hr)
Number collected
CPUE (fish/hr)
Number collected
Ameiurus melas Black Bullhead – – 4 0.013 0 4 Pomoxis nigromaculatus Black Crappie – – 17 0.054 0 17 Lepomis macrochirus Bluegill – – 9 0.029 1 10 Ameiurus nebulosus Brown Bullhead – – 29 0.092 2 31 Ictalurus punctatus Channel Catfish – – 15 0.048 11 26 Cyprinus carpio Common Carp ^ – – 5 0.016 0 5 Notropis atherinoides Emerald Shiner – – 12 0.038 7 19 Pimephales promelas Fathead Minnow – – 1 0.003 0 1 Aplodinotus grunniens Freshwater Drum – – 59 0.188 68 127 Dorosoma cepedianum Gizzard Shad – – 196 0.623 637 833 Carassius auratus Goldfish ^ – – 0 0.000 1 1 Notropis volucellus Mimic Shiner – – 1 0.003 242 243 Lepomis gibbosus Pumpkinseed – – 11 0.035 6 17 Carpiodes cyprinus Quillback – – 1 0.003 0 1 Osmerus mordax Rainbow Smelt ^ – – 0 0.000 52 52 Ambloplites rupestris Rock Bass – – 1 0.003 0 1 Neogobius melanostoma Round Goby ^ – – 29 0.092 73 102 Notropis stramineus Sand Shiner – – 2 0.006 19 21 Ictiobus bubalus Smallmouth Buffalo – – 0 0.000 1 1 Notropis hudsonius Spottail Shiner – – 313 0.995 143 456 Percopsis omiscomaycus Trout-perch – – 0 0.000 1 1 Sander vitreus Walleye – – 0 0.000 80 80 Morone chrysops White Bass – – 212 0.674 18 230 Morone chrysops x Morone americana
White Bass/White Perch hybrid ^ – – 32 0.102 9 41
Pomoxis annularis White Crappie – – 191 0.607 2 193 Morone americana White Perch ^ – – 1,620 5.150 3,770 5,390 Ameiurus natalis Yellow Bullhead – – 27 0.086 0 27 Perca flavescens Yellow Perch – – 60 0.191 283 343 Total 0 2,847 5,426 8,273
* Sampling effort for paired fyke nets was 314.5 hours and bottom trawls was 1.2 hours. ^ Species not native to the Lake Erie watershed according to the Great Lakes Aquatic Nonindigenous Species Information System (USGS 2016).
39
TABLE 12. Catch summary for species captured during juvenile and adult fish sampling* in Buffalo and the upper Niagara River, 2015.
Electrofishing
(Day and Night) Paired Fyke
Net Bottom Trawl
Scientific name Common name Number
collected CPUE
(fish/hr) Number collected
CPUE (fish/hr)
Number collected Total
Alosa pseudoharengus Alewife ^ 113 17.94 0 0.00 0 113 Fundulus diaphanus Banded Killifish 11 1.74 2 0.01 0 13 Notropis dorsalis Bigmouth Shiner 1 0.16 0 0.00 0 1 Pomoxis nigromaculatus Black Crappie 3 0.47 5 0.02 0 8 Moxostoma duquesnei Black Redhorse 2 0.32 1 0.00 0 3 Lepomis macrochirus Bluegill 59 9.32 651 2.08 0 710 Pimephales notatus Bluntnose Minnow 80 12.64 126 0.69 0 206 Amia calva Bowfin 6 0.95 1 0.00 0 7 Labidesthes sicculus Brook Silverside 6 0.95 1 0.00 0 7 Ameiurus nebulosus Brown Bullhead 46 7.27 33 0.11 0 79 Salmo trutta Brown Trout ^ 1 0.16 0 0.00 0 1 Ictalurus punctatus Channel Catfish 0 0 3 0.01 0 3 Cyprinus carpio Common Carp ^ 15 2.37 1 0.00 0 16 Luxilus cornutus Common Shiner 2 0.32 0 0.00 0 2 Semotilus atromaculatus Creek Chub 1 0.16 0 0.00 0 1 Notropis atherinoides Emerald Shiner 319 50.39 2,030 6.49 0 2,349 Aplodinotus grunniens Freshwater Drum 18 2.84 0 0.00 0 18 Dorosoma cepedianum Gizzard Shad 267 42.18 16 0.05 1 284 Moxostoma erythrurum Golden Redhorse 10 1.58 0 0.00 0 10 Notemigonus crysoleucas Golden Shiner 15 2.37 1 0.00 0 16 Carassius auratus Goldfish ^ 9 1.42 0 0.00 0 9 Moxostoma valenciennesi Greater Redhorse 2 0.32 0 0.00 0 2 Etheostoma nigrum Johnny Darter 1 0.16 1 0.00 0 2 Micropterus salmoides Largemouth Bass 78 12.32 52 0.17 0 130 Percina caprodes Logperch 58 9.16 0 0.00 0 58 Lepisosteus osseus Longnose Gar 2 0.32 0 0.00 0 2 Esox masquinongy Muskellunge 4 0.63 0 0.00 0 4 Hypentelium nigricans Northern Hogsucker 5 0.79 2 0.01 0 7 Esox lucius Northern Pike 8 1.26 2 0.01 0 10 Lepomis gibbosus Pumpkinseed 77 12.16 74 0.24 2 153
40
TABLE 12 continued.
Scientific name Common name
Electrofishing (Day and Night)
Paired Fyke Net Bottom Trawl
Number collected
CPUE (fish/hr)
Number collected
CPUE (fish/hr)
Number collected Total
Carpiodes cyprinus Quillback 2 0.32 0 0.00 0 2 Osmerus mordax Rainbow Smelt ^ 44 6.95 121 0.39 0 165 Ambloplites rupestris Rock Bass 77 12.16 487 1.56 0 564 Neogobius melanostoma Round Goby ^ 17 2.69 202 0.65 71 290 Scardinius erythrophthalmus Rudd ^ 29 4.58 11 0.04 0 40 Moxostoma macrolepidotum Shorthead Redhorse 30 4.74 25 0.08 0 55 Moxostoma anisurum Silver Redhorse 12 1.9 10 0.03 0 22 Micropterus dolomieu Smallmouth Bass 120 18.96 43 0.14 0 163 Notropis hudsonius Spottail Shiner 128 20.22 3,949 12.62 3 4,080 Luxilus chrysocephalus Striped Shiner 3 0.47 0 0.00 0 3 Sander vitreus Walleye 2 0.32 0 0.00 0 2 Morone chrysops White Bass 3 0.47 1 0.00 0 4 Morone americana White Perch ^ 7 1.11 2 0.01 1 10 Catostomus commersonii White Sucker 385 60.82 181 0.58 1 567 Ameiurus natalis Yellow Bullhead 0 0 6 0.02 0 6 Total 2,078 8,040 79 10,197
* Sampling effort for electrofishing was 6.3 hours, paired fyke nets was 312.9 hours. ^ Species not native to the Lake Erie watershed according to the Great Lakes Aquatic Nonindigenous Species Information System (USGS 2016).
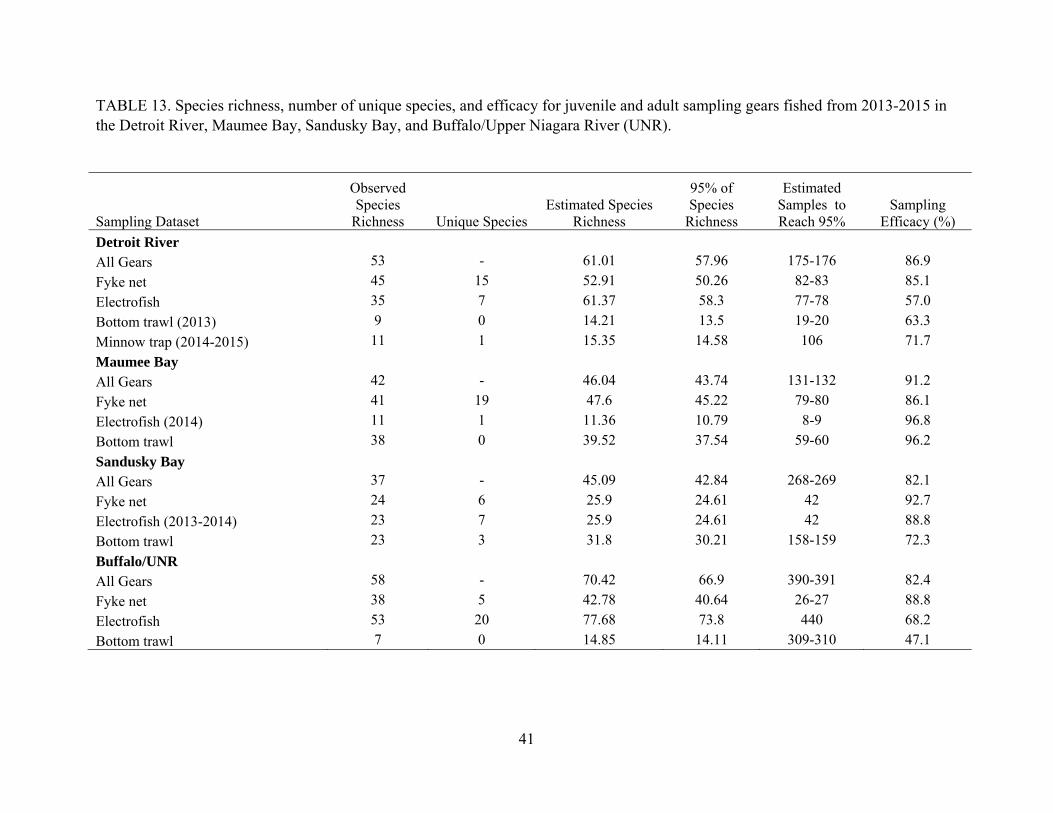
41
TABLE 13. Species richness, number of unique species, and efficacy for juvenile and adult sampling gears fished from 2013-2015 in the Detroit River, Maumee Bay, Sandusky Bay, and Buffalo/Upper Niagara River (UNR).
Sampling Dataset
Observed Species
Richness Unique Species
Estimated Species Richness
95% of Species
Richness
Estimated Samples to Reach 95%
Sampling Efficacy (%)
Detroit River All Gears 53 - 61.01 57.96 175-176 86.9
Fyke net 45 15 52.91 50.26 82-83 85.1
Electrofish 35 7 61.37 58.3 77-78 57.0
Bottom trawl (2013) 9 0 14.21 13.5 19-20 63.3
Minnow trap (2014-2015) 11 1 15.35 14.58 106 71.7
Maumee Bay All Gears 42 - 46.04 43.74 131-132 91.2
Fyke net 41 19 47.6 45.22 79-80 86.1
Electrofish (2014) 11 1 11.36 10.79 8-9 96.8
Bottom trawl 38 0 39.52 37.54 59-60 96.2
Sandusky Bay All Gears 37 - 45.09 42.84 268-269 82.1
Fyke net 24 6 25.9 24.61 42 92.7
Electrofish (2013-2014) 23 7 25.9 24.61 42 88.8
Bottom trawl 23 3 31.8 30.21 158-159 72.3
Buffalo/UNR All Gears 58 - 70.42 66.9 390-391 82.4
Fyke net 38 5 42.78 40.64 26-27 88.8
Electrofish 53 20 77.68 73.8 440 68.2
Bottom trawl 7 0 14.85 14.11 309-310 47.1
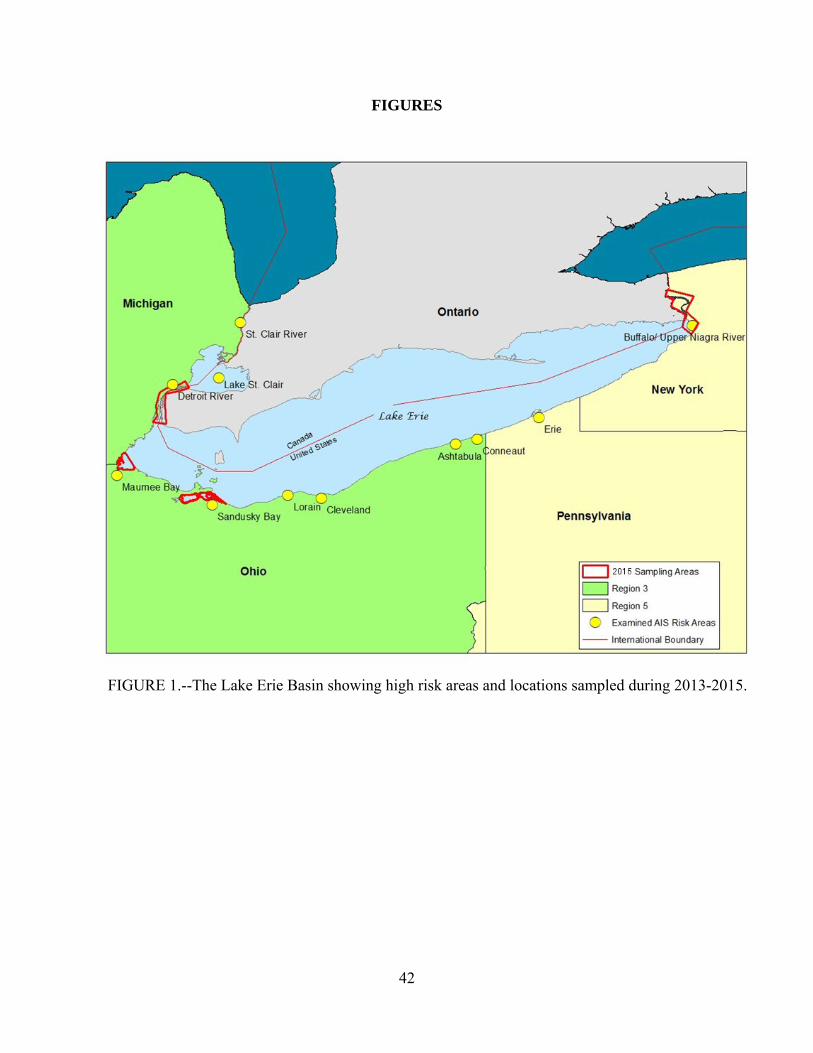
42
FIGURES
FIGURE 1.--The Lake Erie Basin showing high risk areas and locations sampled during 2013-2015.
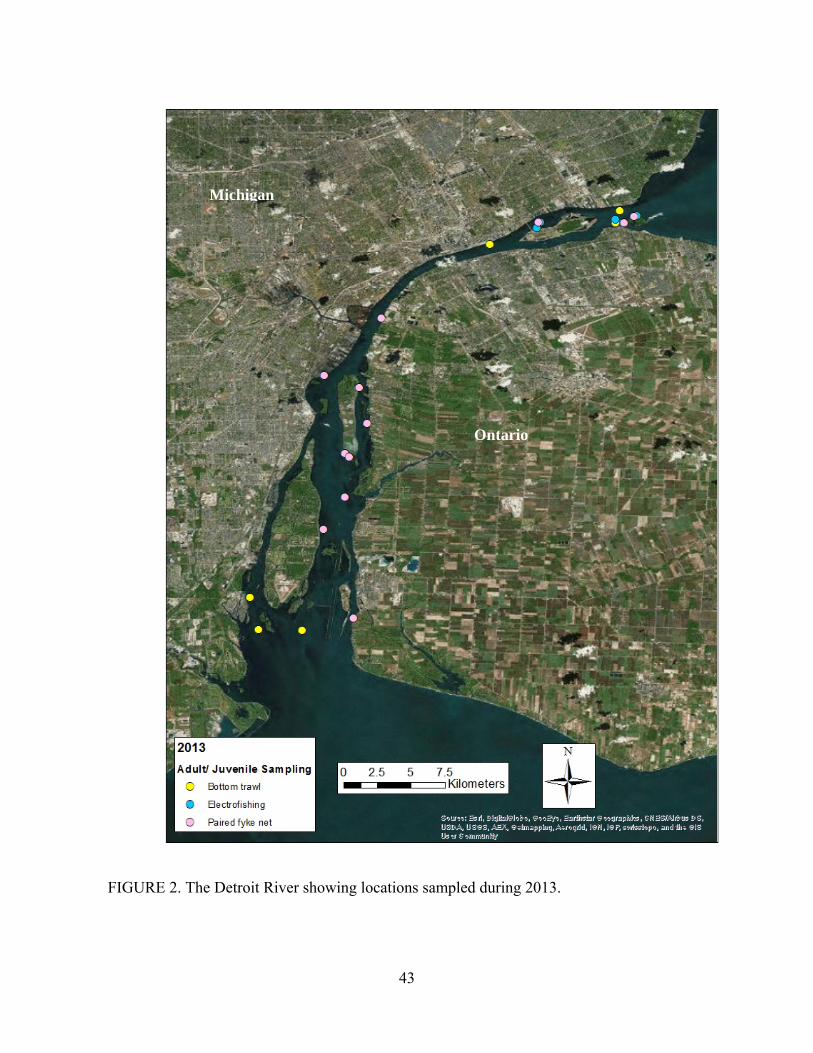
43
FIGURE 2. The Detroit River showing locations sampled during 2013.
Ontario
Michigan
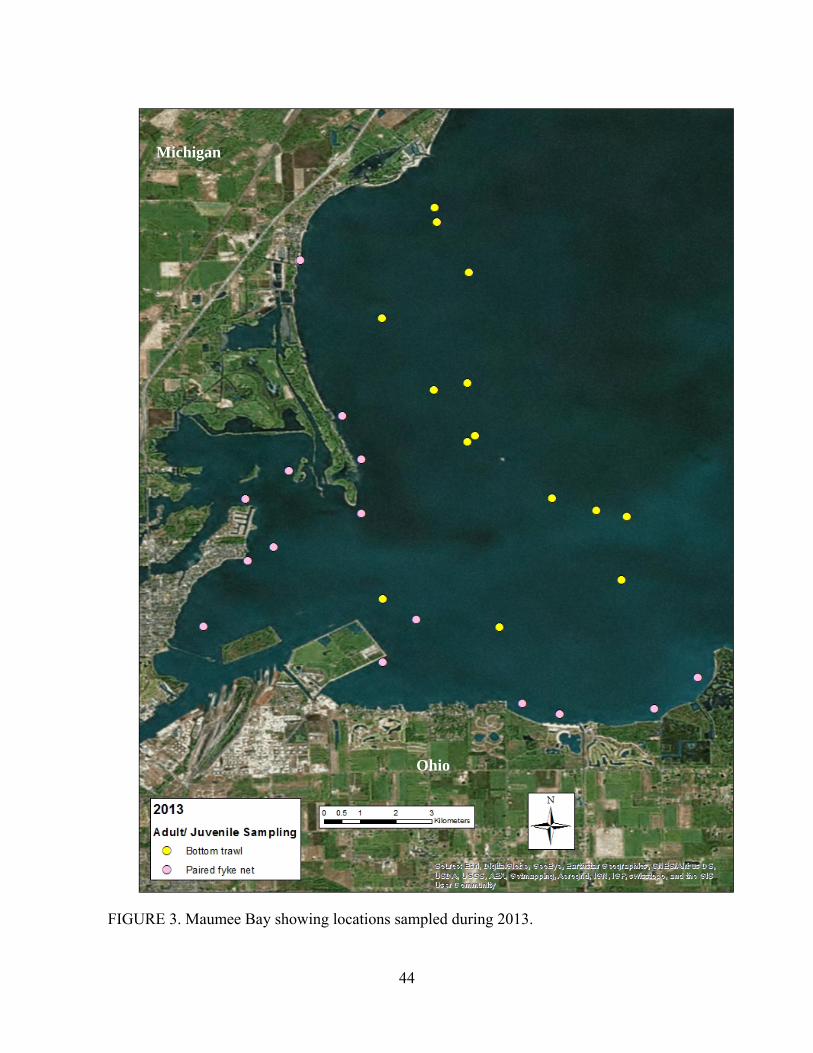
44
FIGURE 3. Maumee Bay showing locations sampled during 2013.
Michigan
Ohio

45
FIGURE 4. Sandusky Bay showing locations sampled during 2013.
Ohio
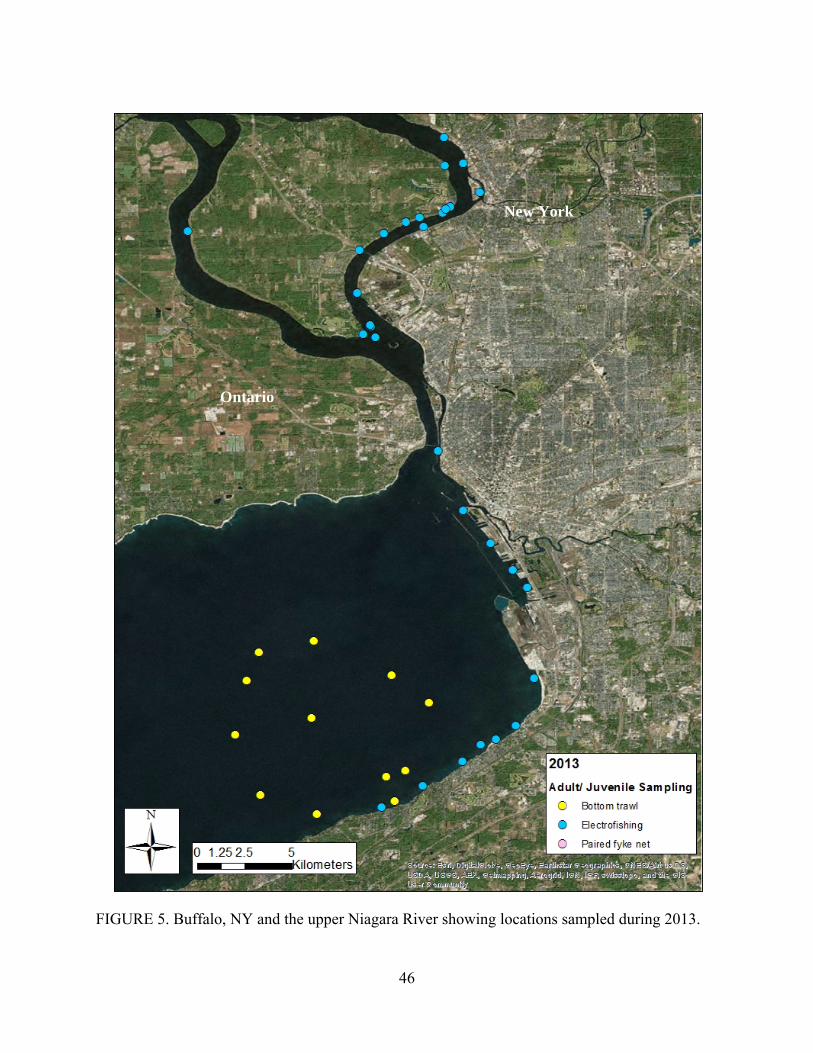
46
FIGURE 5. Buffalo, NY and the upper Niagara River showing locations sampled during 2013.
New York
Ontario

47
FIGURE 6. The Detroit River showing locations sampled during 2014.
Michigan
Ontario
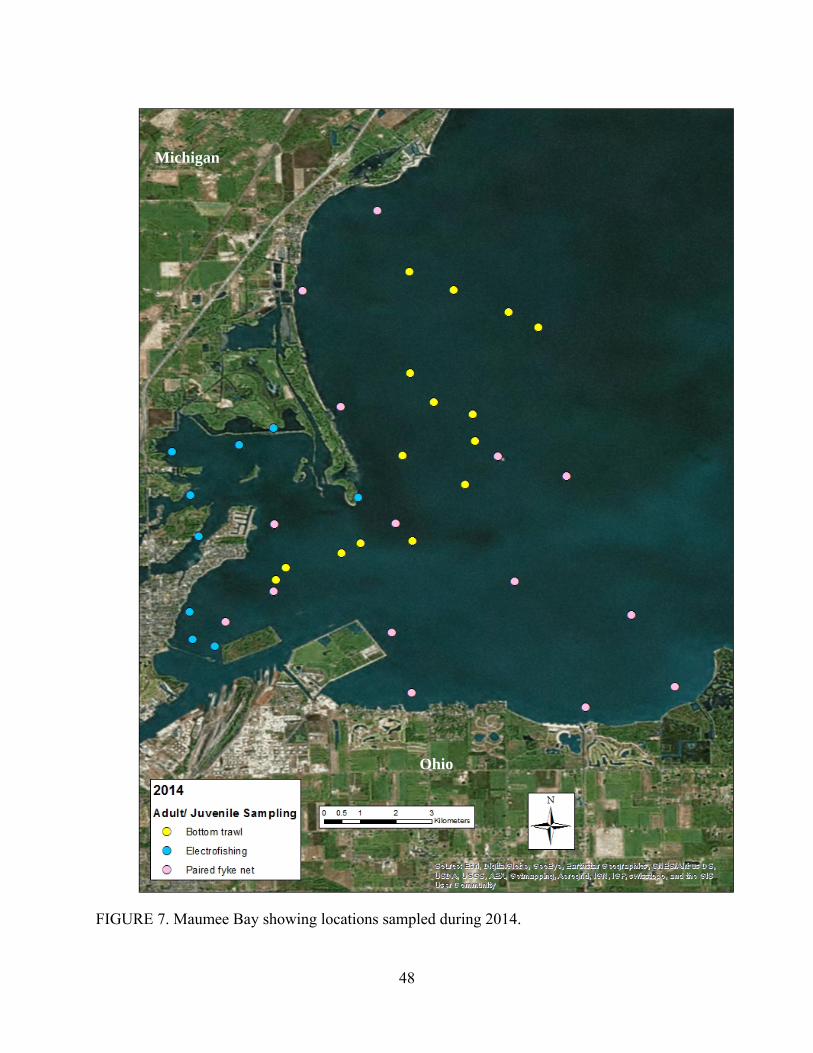
48
FIGURE 7. Maumee Bay showing locations sampled during 2014.
Michigan
Ohio
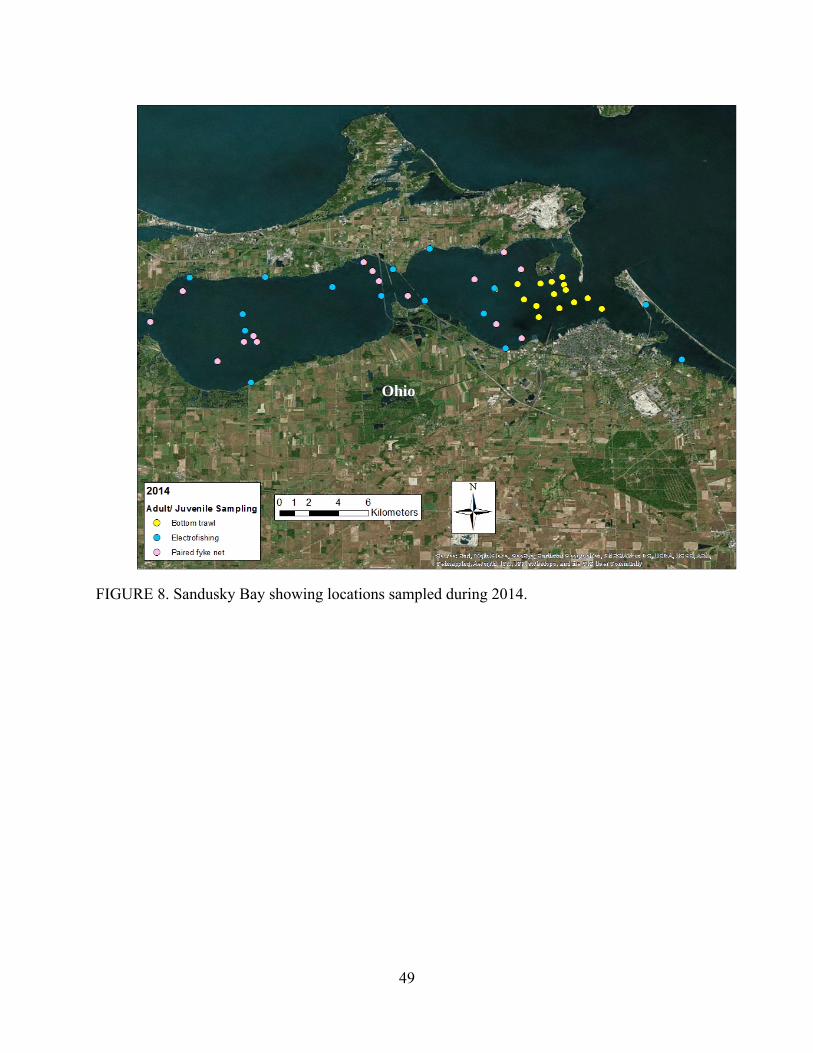
49
FIGURE 8. Sandusky Bay showing locations sampled during 2014.
Ohio
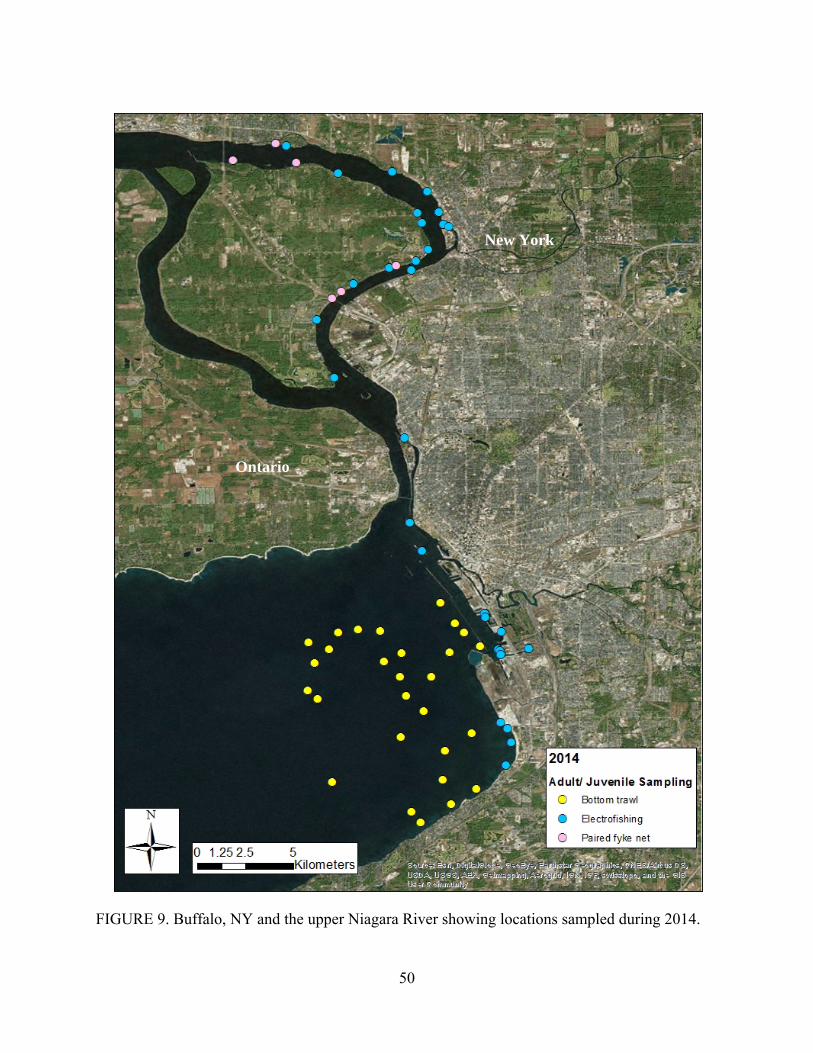
50
FIGURE 9. Buffalo, NY and the upper Niagara River showing locations sampled during 2014.
New York
Ontario
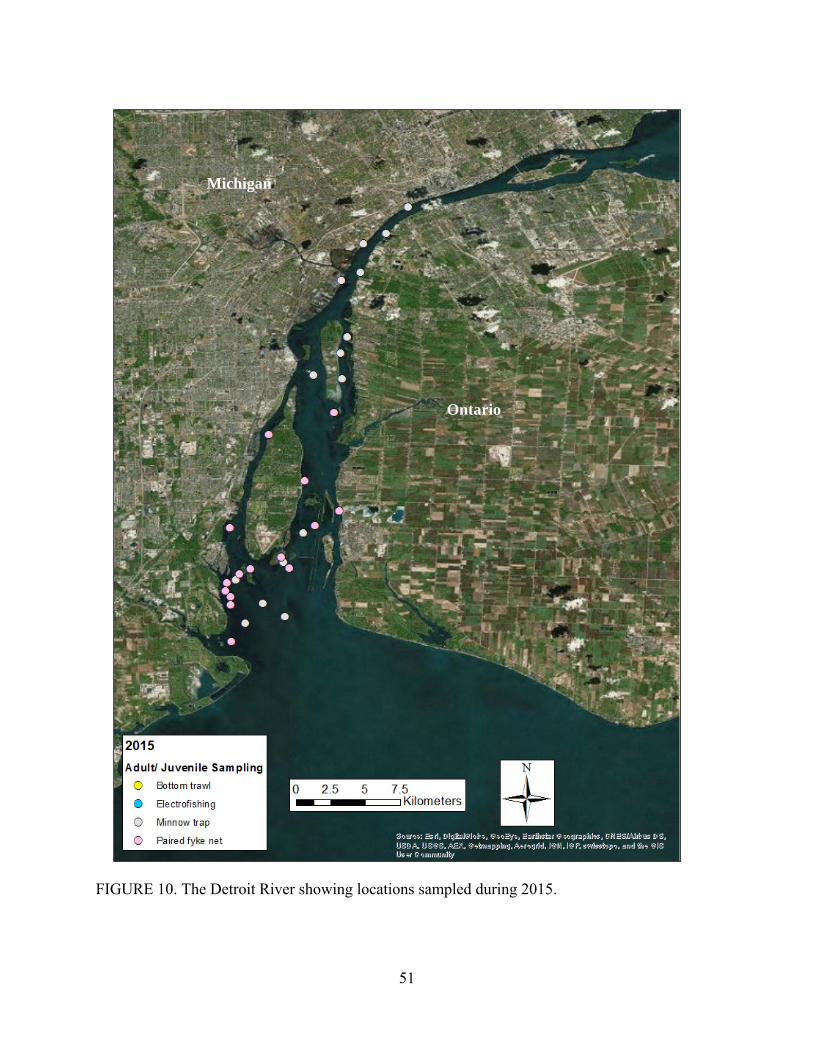
51
FIGURE 10. The Detroit River showing locations sampled during 2015.
Ontario
Michigan
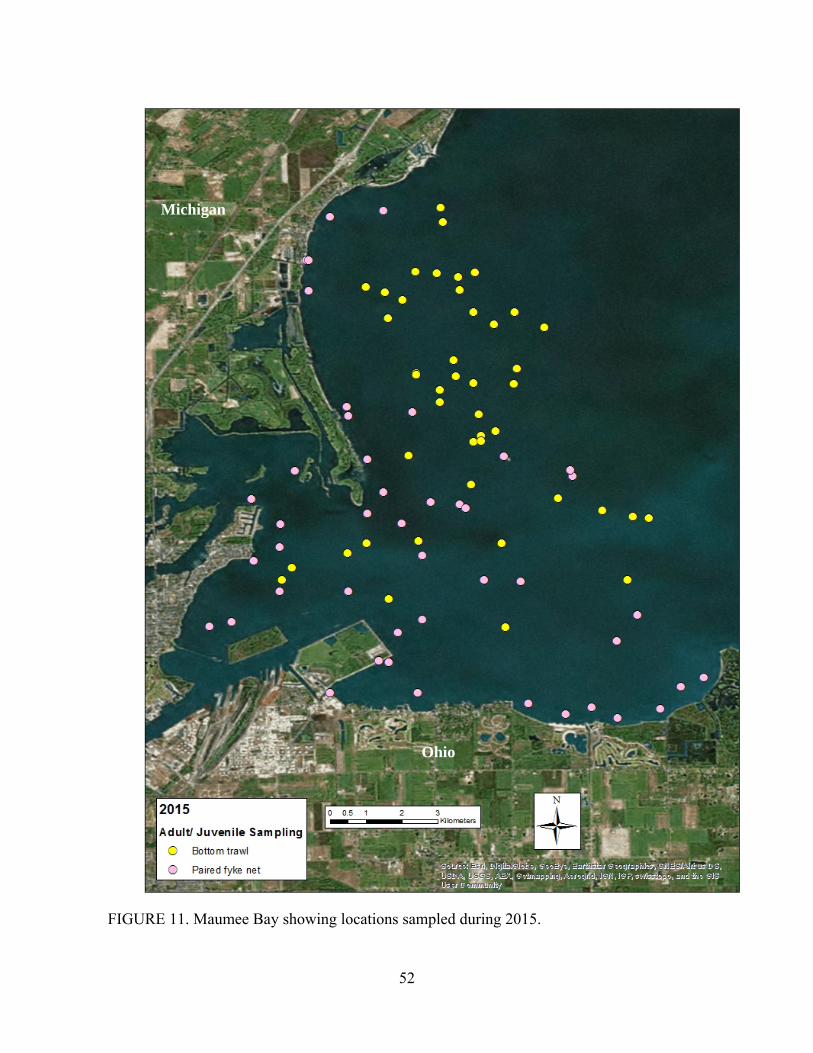
52
FIGURE 11. Maumee Bay showing locations sampled during 2015.
Michigan
Ohio
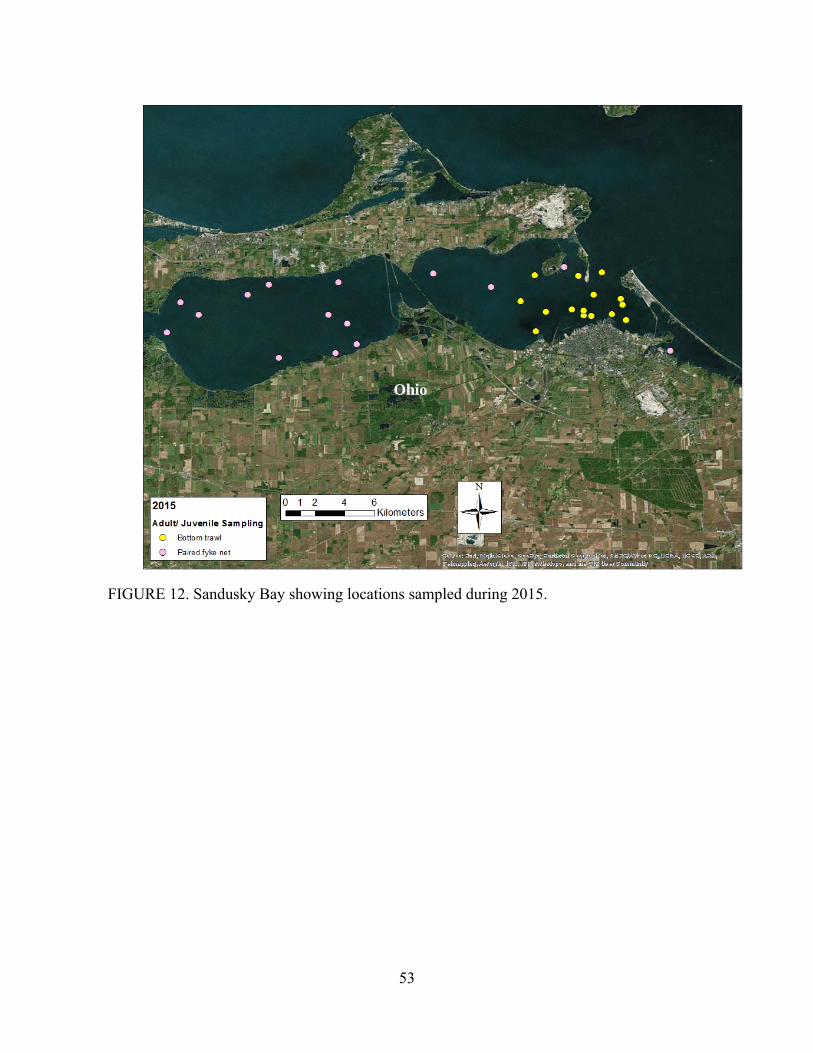
53
FIGURE 12. Sandusky Bay showing locations sampled during 2015.
Ohio
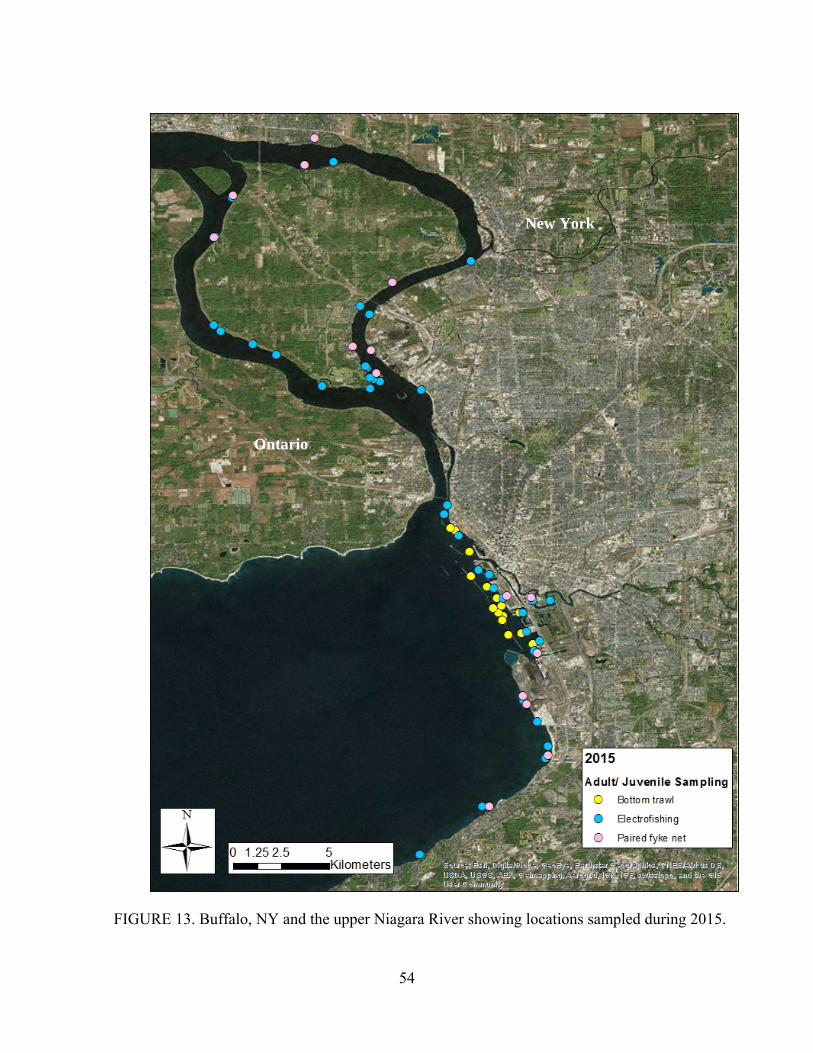
54
FIGURE 13. Buffalo, NY and the upper Niagara River showing locations sampled during 2015.
Ontario
New York
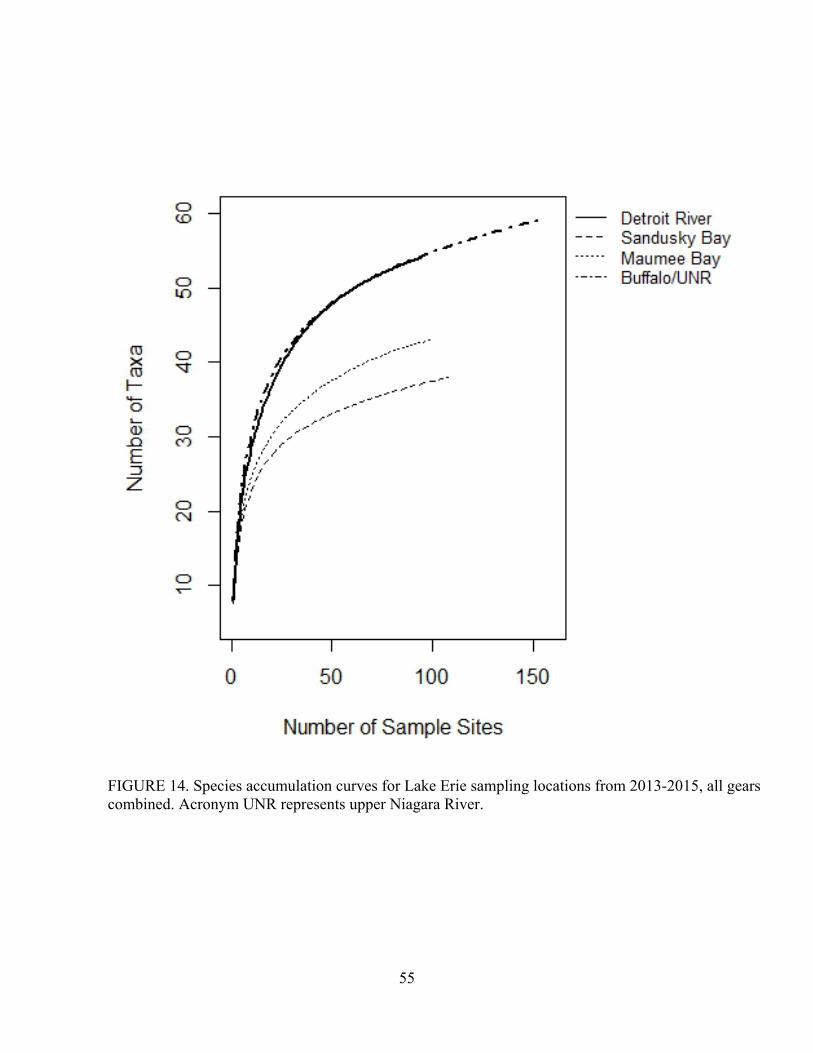
55
FIGURE 14. Species accumulation curves for Lake Erie sampling locations from 2013-2015, all gears combined. Acronym UNR represents upper Niagara River.
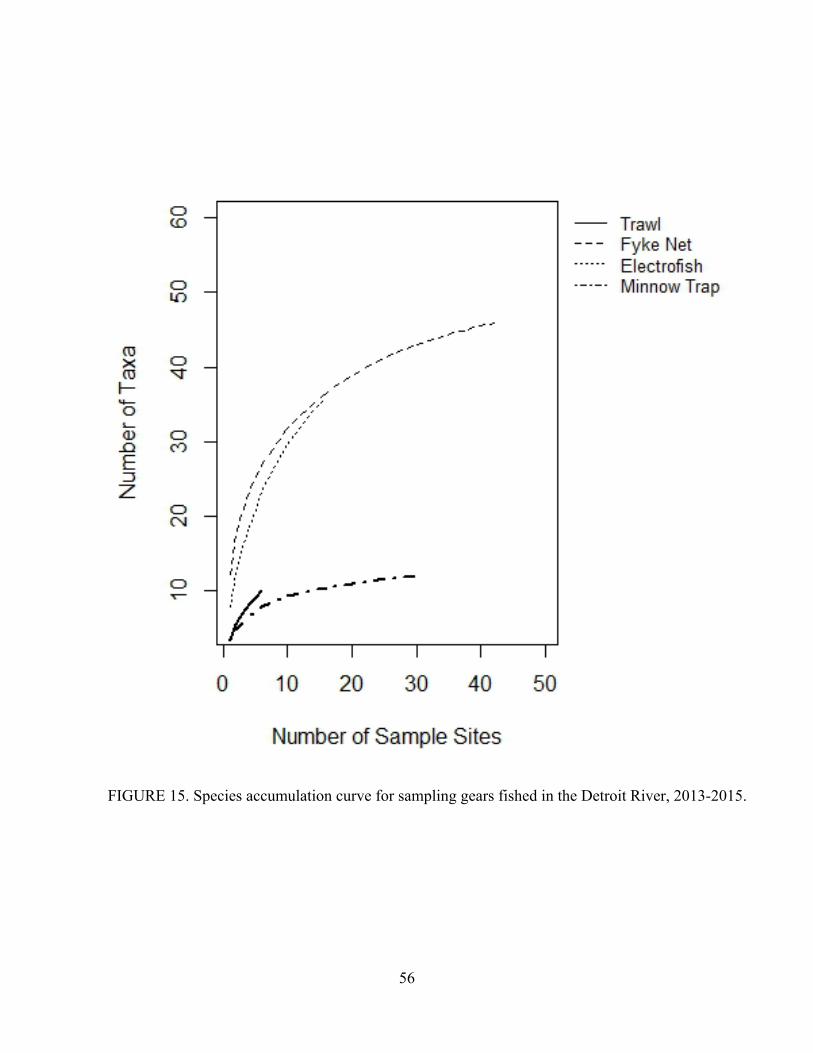
56
FIGURE 15. Species accumulation curve for sampling gears fished in the Detroit River, 2013-2015.
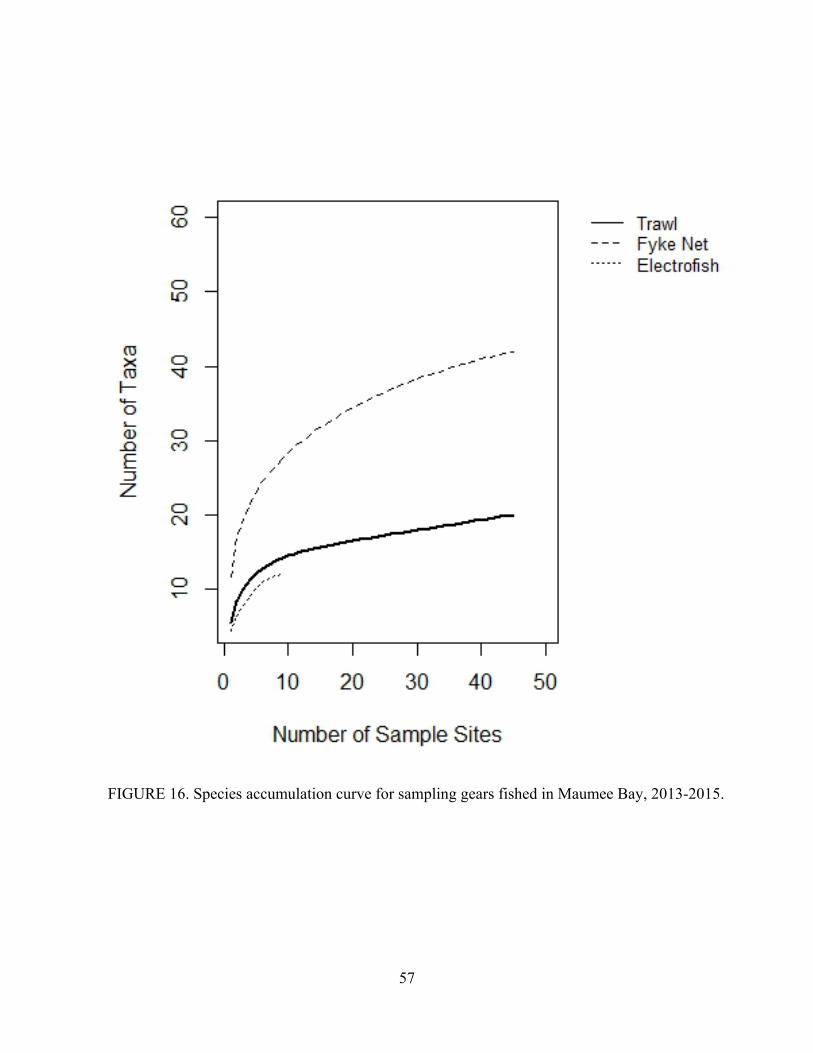
57
FIGURE 16. Species accumulation curve for sampling gears fished in Maumee Bay, 2013-2015.
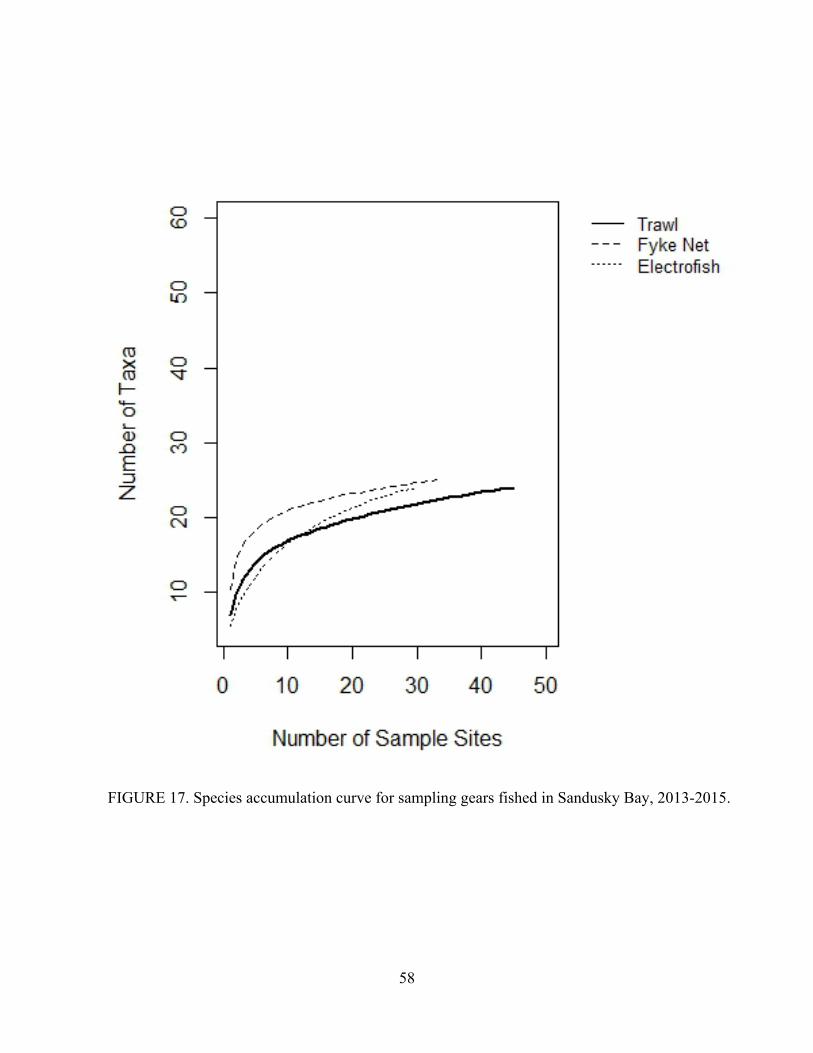
58
FIGURE 17. Species accumulation curve for sampling gears fished in Sandusky Bay, 2013-2015.
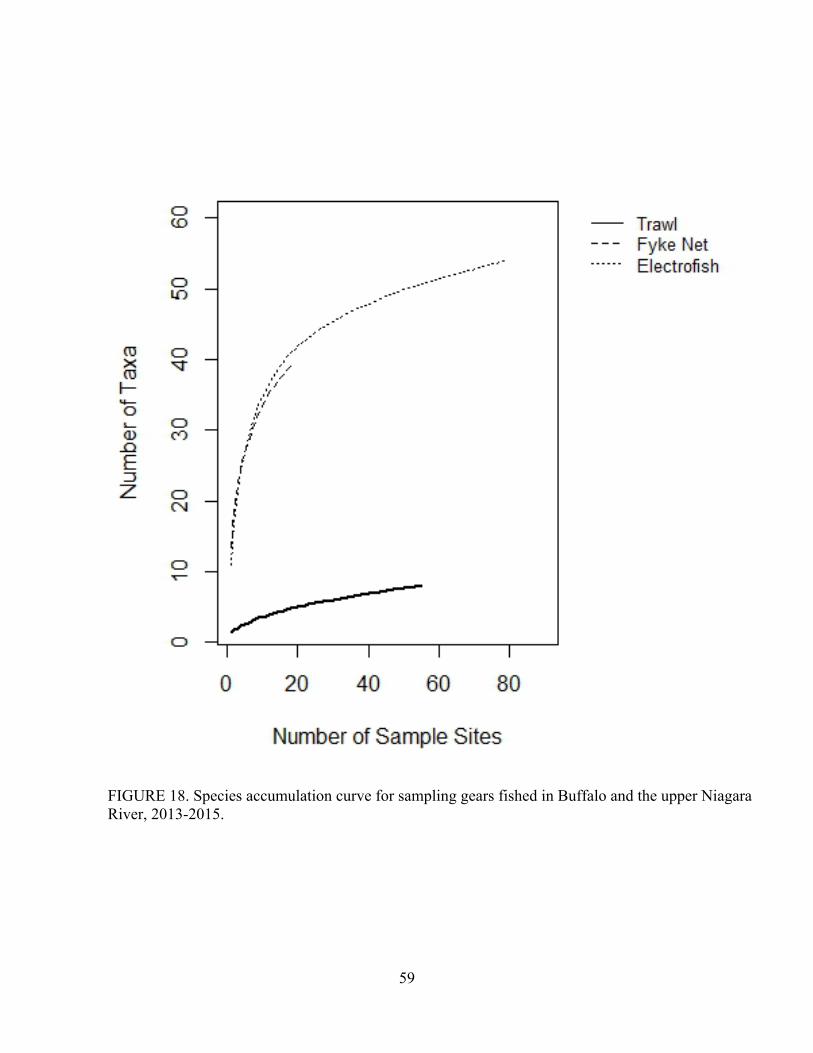
59
FIGURE 18. Species accumulation curve for sampling gears fished in Buffalo and the upper Niagara River, 2013-2015.


