UNIVERSITÀ DI PISA
Electromagnetic RadiationsElectromagnetic Radiationsd Bi l i l I id Bi l i l I iand Biological Interactionsand Biological Interactions
“Laurea Magistrale” in “Laurea Magistrale” in BiomedicalBiomedical EngineeringEngineeringFirst First semestersemester (6 (6 creditscredits), ), academicacademic yearyear 2011/122011/12
Prof. Paolo Prof. Paolo NepaNepa
Exposure systems
[email protected]@iet.unipi.it
Exposure systems
1
EditedEdited byby Dr. Dr. AndaAnda GuraliucGuraliuc15/12/2011
Lecture ContentLecture Content
Biological effectsBiological effectsExposure systems
TEM cell/GTEM cellRack Loop Antenna ArrayHorn antenna & dielectric lensWPC cellShorted waveguideShorted waveguideFerris‐Wheel exposure system
215/12/2011
IntroductionIntroduction
The electromagnetic field source expansion, such as antennas for mobile phones andwireless communication systems, has increased the human exposure levels to EM fieldsd d h i f d i kand generated the perception of damage risk.
Despite a large amount of research works, more than thousands of publications, thescientific community is still involved in studying the interaction mechanism betweeny y gelectromagnetic waves and living matter, because there is no complete and definitiveunderstanding of the biological effects of EM fields.
To study the EM fields biological tissue effects different experiments can be required: ininTo study the EM fields biological tissue effects different experiments can be required: ininvivovivo (on rats, mice etc.) and inin vitrovitro (on biological tissues).
15/12/2011 3
EM field EM field –– Biological system interaction Biological system interaction
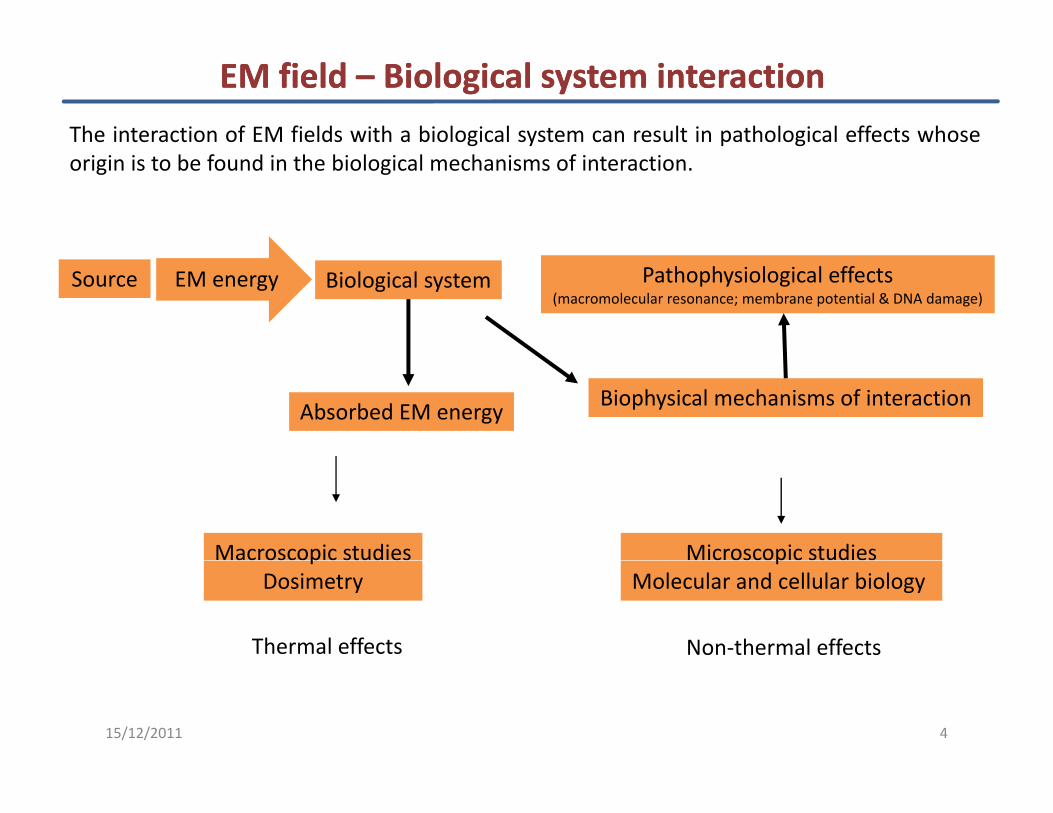
The interaction of EM fields with a biological system can result in pathological effects whoseorigin is to be found in the biological mechanisms of interaction.
Source EM energy Biological system Pathophysiological effects(macromolecular resonance; membrane potential & DNA damage)
Absorbed EM energyBiophysical mechanisms of interaction
Microscopic studiesMacroscopic studies pMolecular and cellular biology
pDosimetry
Thermal effects Non‐thermal effects
15/12/2011 4
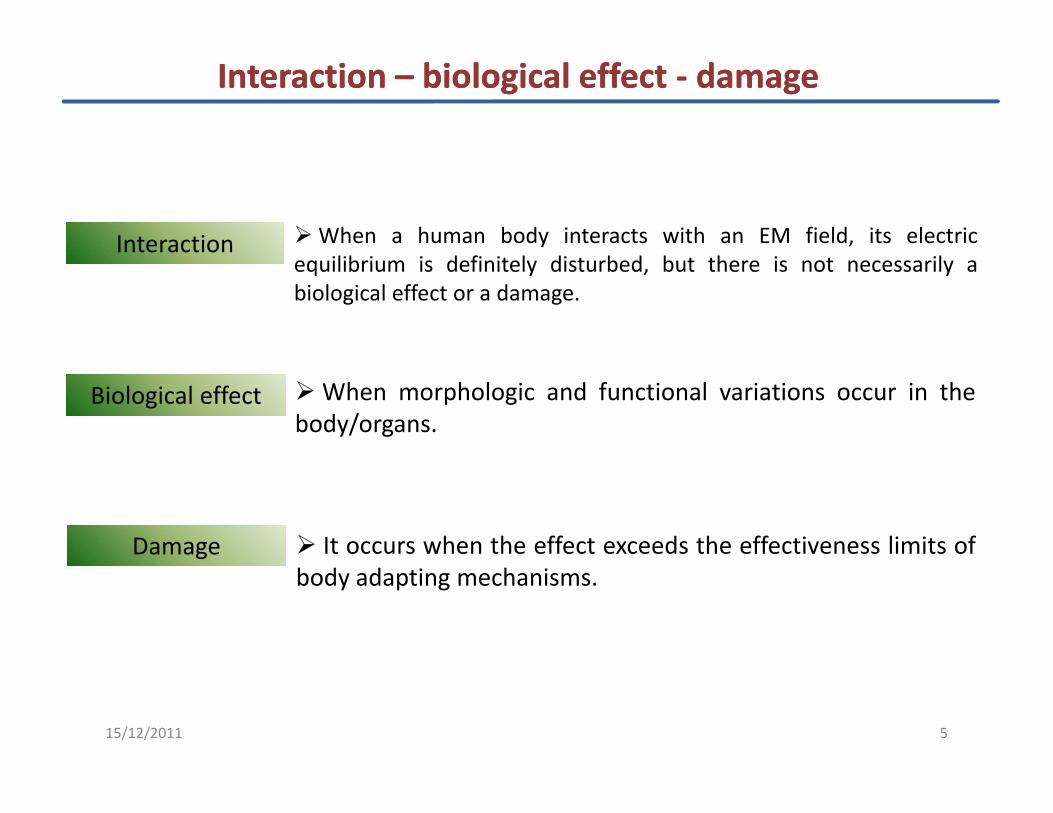
Interaction Interaction –– biological effect biological effect ‐‐ damage damage
When a human body interacts with an EM field, its electricInteractionInteractionequilibrium is definitely disturbed, but there is not necessarily abiological effect or a damage.
When morphologic and functional variations occur in thebody/organs.
Biological effectBiological effect
It occurs when the effect exceeds the effectiveness limits ofDamageDamagebody adapting mechanisms.
15/12/2011 5
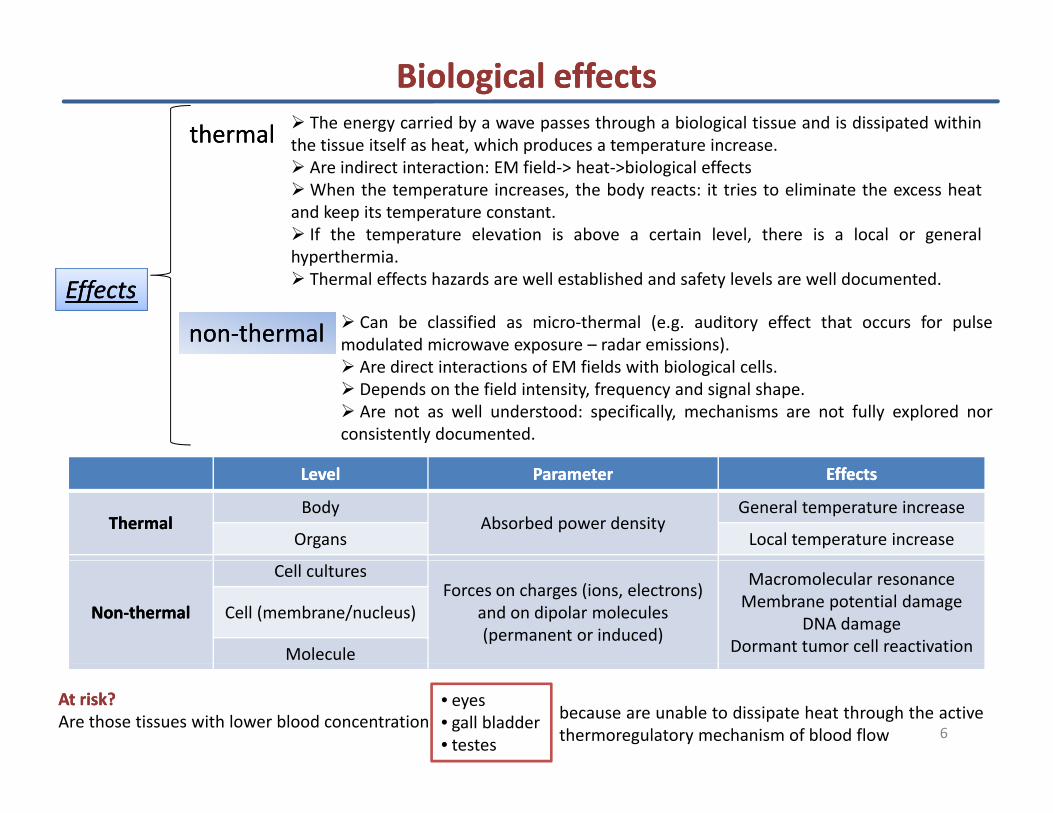
Biological effectsBiological effects
thermalthermal The energy carried by a wave passes through a biological tissue and is dissipated withinthe tissue itself as heat, which produces a temperature increase.the tissue itself as heat, which produces a temperature increase.Are indirect interaction: EM field‐> heat‐>biological effectsWhen the temperature increases, the body reacts: it tries to eliminate the excess heat
and keep its temperature constant.If the temperature elevation is above a certain level, there is a local or general
h th i
EffectsEffects
nonnon‐‐thermalthermal
hyperthermia.Thermal effects hazards are well established and safety levels are well documented.
Can be classified as micro‐thermal (e.g. auditory effect that occurs for pulsemodulated microwave exposure – radar emissions).Are direct interactions of EM fields with biological cells.Depends on the field intensity, frequency and signal shape.Are not as well understood: specifically, mechanisms are not fully explored nor
consistently documented.
LevelLevel ParameterParameter EffectsEffects
ThermalThermalBody
Absorbed power densityGeneral temperature increase
Organs Local temperature increase
NonNon‐‐thermalthermal
Cell culturesForces on charges (ions, electrons)
and on dipolar molecules (permanent or induced)
Macromolecular resonanceMembrane potential damage
DNA damageDormant tumor cell reactivation
Cell (membrane/nucleus)
Molecule
6
AtAt risk?risk?Are those tissues with lower blood concentration:
• eyes• gall bladder• testes
because are unable to dissipate heat through the activethermoregulatory mechanism of blood flow
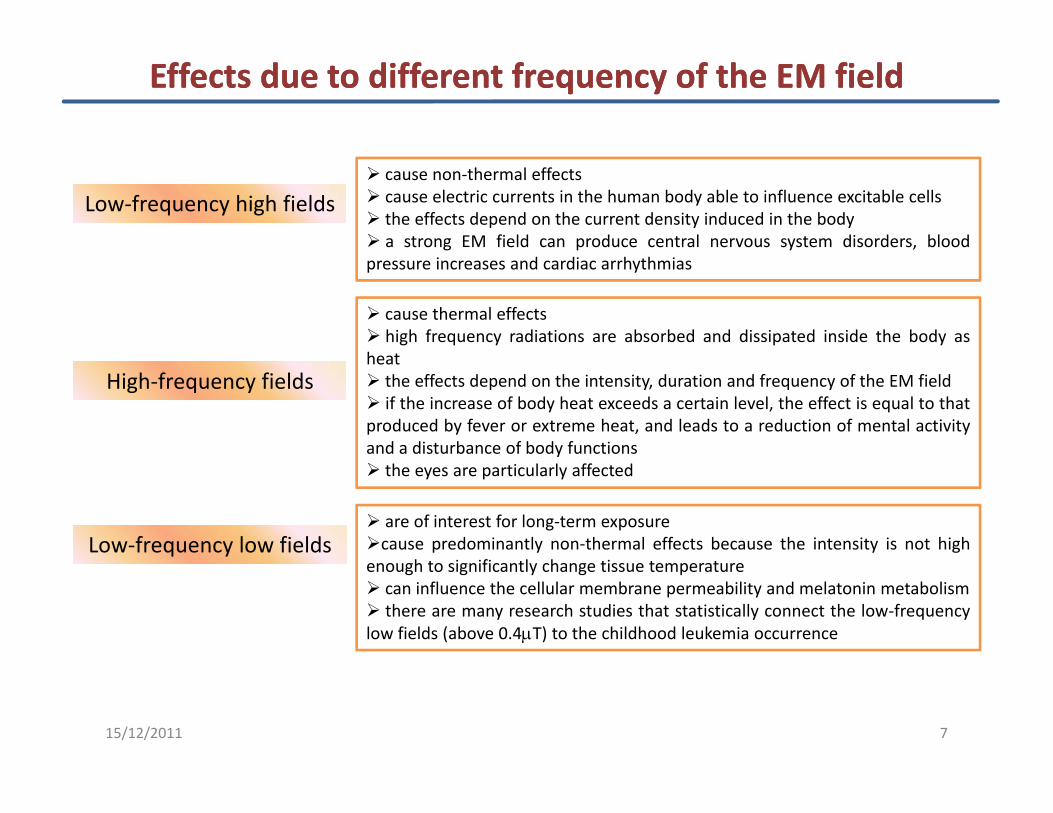
Effects due to different frequency of the EM fieldEffects due to different frequency of the EM field
cause non‐thermal effectscause electric currents in the human body able to influence excitable cellsthe effects depend on the current density induced in the bodya strong EM field can produce central nervous system disorders, blood
Low‐frequency high fieldsLow‐frequency high fields
pressure increases and cardiac arrhythmias
cause thermal effectshigh frequency radiations are absorbed and dissipated inside the body as
h theatthe effects depend on the intensity, duration and frequency of the EM fieldif the increase of body heat exceeds a certain level, the effect is equal to that
produced by fever or extreme heat, and leads to a reduction of mental activityand a disturbance of body functions
High‐frequency fieldsHigh‐frequency fields
the eyes are particularly affected
Low‐frequency low fieldsLow‐frequency low fieldsare of interest for long‐term exposurecause predominantly non‐thermal effects because the intensity is not high
h i ifi l h ienough to significantly change tissue temperaturecan influence the cellular membrane permeability and melatonin metabolismthere are many research studies that statistically connect the low‐frequency
low fields (above 0.4µT) to the childhood leukemia occurrence
15/12/2011 7
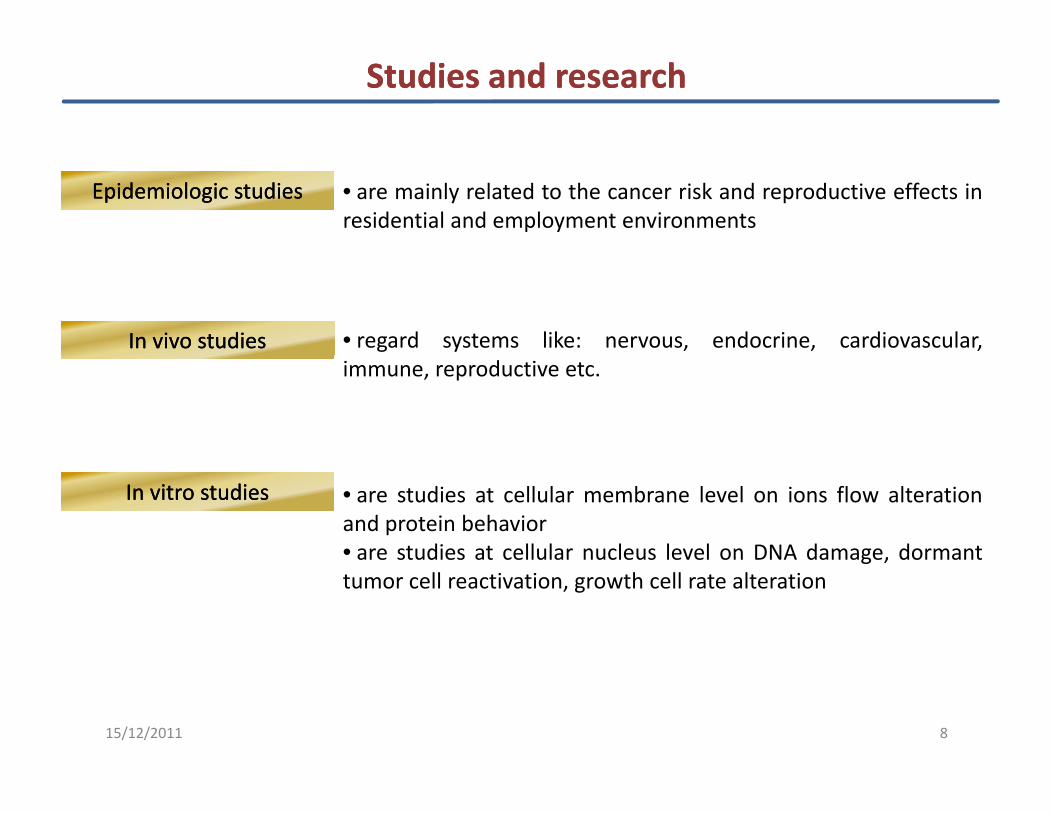
Studies and researchStudies and research
Epidemiologic studiesEpidemiologic studiesEpidemiologic studiesEpidemiologic studies • are mainly related to the cancer risk and reproductive effects inresidential and employment environments
In vivo studiesIn vivo studiesIn vivo studiesIn vivo studies • regard systems like: nervous, endocrine, cardiovascular,immune, reproductive etc.
In vitro studiesIn vitro studiesIn vitro studiesIn vitro studies • are studies at cellular membrane level on ions flow alterationand protein behavior• are studies at cellular nucleus level on DNA damage, dormantg ,tumor cell reactivation, growth cell rate alteration
15/12/2011 8
Epidemiologic studiesEpidemiologic studiesEpidemiologyEpidemiology is the study of health‐event, health‐characteristic, or health‐determinant patterns in apopulationpopulation.EpidemiologyEpidemiology is a study designed to investigate hypothesized causal relationships; tries to determine whydisease is occurring and is based on tests hypothesis.
The quality indicators for the epidemiological studies are:• Good definition of the study population• Representative control group of the population which generated the cases• High rates of participation and not associated with disease state and /or exposure• Complete, accurate and precise information on exposure and disease
The quality indicators for the epidemiological studies are:
p p p• Appropriate methods of analysis with information on accuracy and variability of the relative risk estimations
The exposure estimation is particularly difficult in the epidemiology of electromagnetic fields for thefollowing reasons:following reasons:
• the exposure is imperceptible due to multiple sources highly variable over time and over short distances• the relevant exposure period is prior to the period when it can be realistically measured• the appropriate exposure metric is unknown, and there are no reference biological data about it
In the absence of experimental evidence, and given the methodological uncertainties inthe epidemiological literature there is currently no chronic disease for which a stable connection with EM
15/12/2011 9
the epidemiological literature, there is currently no chronic disease for which a stable connection with EMfields exposure can be established.
Exposure systemsExposure systems
Exposure systems are mostly used in bioelectromagnetic experiments to study thebiological effects of electromagnetic fields.
One key aspect in the study of the biological effects of EM field exposure conditions isOne key aspect in the study of the biological effects of EM field exposure conditions isto create the exposure conditions: known, controlled and repeatable. These will allow tocorrelate the biological effect to the cause that produce it.
The characteristics and effectiveness of an exposure system depends on:
• nature and size of the exposed object• experiment duration• frequency• power• micro‐clime conditions
1015/12/2011
Exposure systemsExposure systems
Exposure systems classification:Exposure systems classification:
• propagating systems: TEM/GTEM cells and various waveguides (rectangular, circular,radial coplanar) Their advantage is versatility and RF field uniformityradial, coplanar). Their advantage is versatility and RF field uniformity.
• radiating systems: consists of commercial or ad hoc antennas, like horn, microstripantennas, loop antennas, generally exposing samples in the far field region. They allowsimultaneous sample exposure, but have low uniformity of dose among samples andreduced efficiency in terms of SAR per unit of input power.
• resonant systems: shorted‐waveguide Are closed and compact are easily placed in anresonant systems: shorted‐waveguide. Are closed and compact, are easily placed in anincubator for environmental conditions control. The positioning of the sample is criticaldue to extremely localized region of field uniformity.
• special resonant systems: wire patch cell based on patch antenna, with the samplesplaced between two patches short‐circuited by metallic rods
1115/12/2011
Exposure systems Exposure systems –– TEM cellTEM cellIs a typical exposure system used for inin vitrovitro experiments, characterized by:
• generation of uniform field or a homogeneous plane wave• it has an usable cell volume to place biological samples• it is shielded from electromagnetic influence both from outside and inside• it operates over a wide frequency bandfi ld t th b t d f di f t lli th h th ll• field strength can be computed from radiofrequency power travelling through the cell
• TEM cell shows cavity effects, like resonances at frequencies at which the celldimensions are about half the wavelength. Absorbing materials can be used to minimizeresonances and reflections.
Transverse Electromagnetic (TEM) cell consists of a rectangular coaxial transmissionline with large cross section, continued at both ends with pyramidal sections thatmake transition to 50 ohms coaxial standard connectors. Its walls are metallic, usuallyaluminum.
To calculate its dimensions two end points need to be taken into account: desiredoperation frequency and the needed volume to expose samples (animals).
Cross‐section dimensions depend on the cut‐off frequency while its length is 4λ toCross section dimensions depend on the cut off frequency, while its length is 4λ toallow a good reconstruction of the TEM mode in the presence of biological samplesplaced longitudinally.
In a transversal plane, the electric field distribution presents two uniform field regionsh ll l h bi l i l l ( i l ) i h i ifi l h i h
15/12/2011 12
that allow to place the biological samples (animals) without significantly changing thefield distribution.
Exposure systems Exposure systems –– TEM cell TEM cell ‐‐ exampleexample
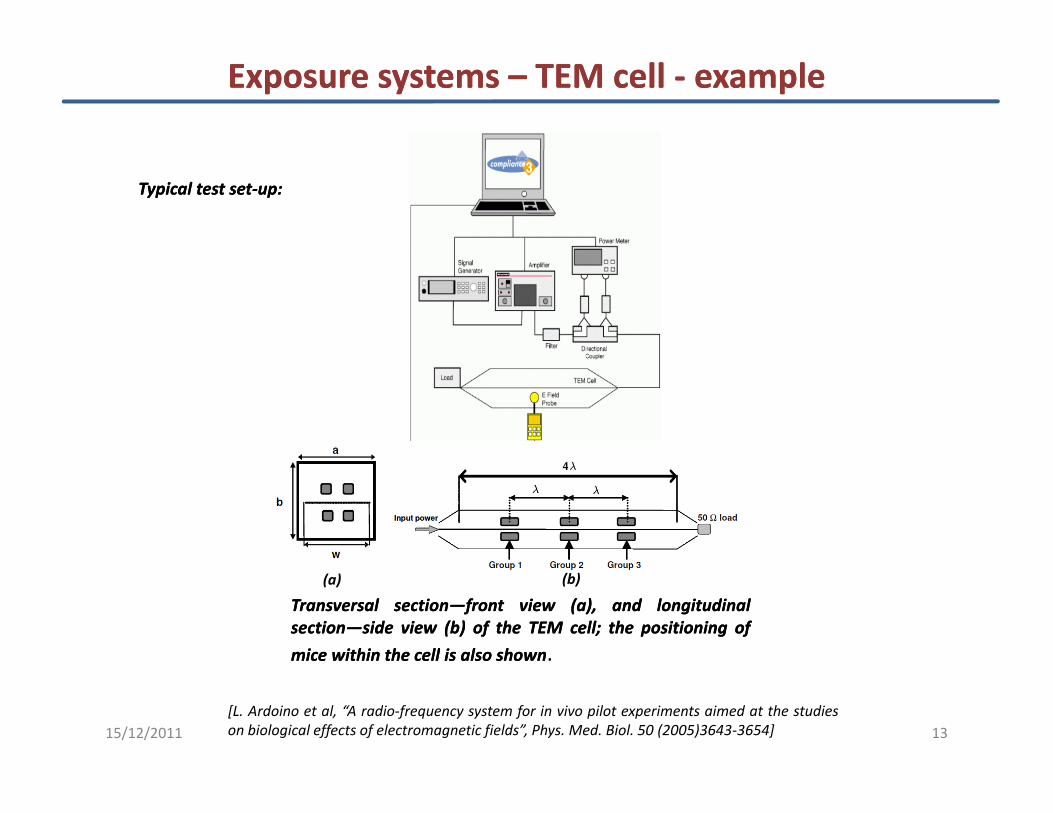
Typical test setTypical test set‐‐up:up:
TransversalTransversal sectionsection——frontfront viewview (a),(a), andand longitudinallongitudinalsectionsection——sideside viewview (b)(b) ofof thethe TEMTEM cellcell;; thethe positioningpositioning ofof
micemice withinwithin thethe cellcell isis alsoalso shownshown.
(a) (b)
15/12/2011 13[L. Ardoino et al, “A radio‐frequency system for in vivo pilot experiments aimed at the studieson biological effects of electromagnetic fields”, Phys. Med. Biol. 50 (2005)3643‐3654]
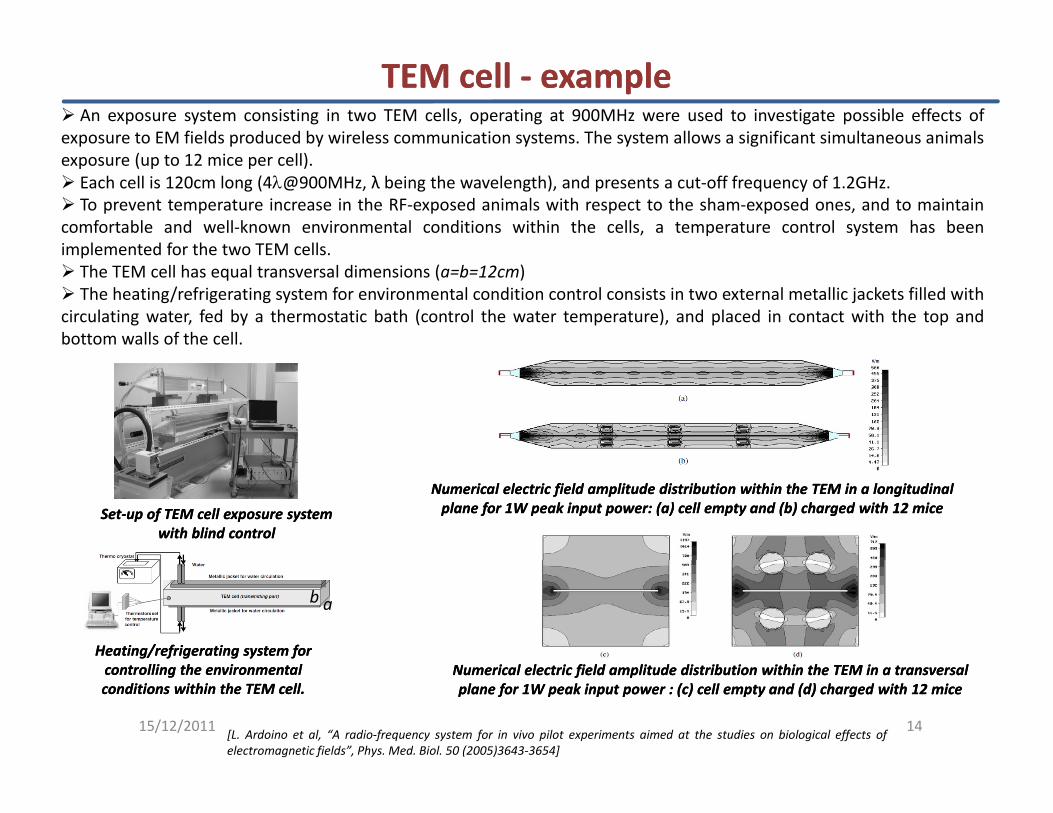
TEM cell TEM cell ‐‐ exampleexampleAn exposure system consisting in two TEM cells, operating at 900MHz were used to investigate possible effects of
exposure to EM fields produced by wireless communication systems. The system allows a significant simultaneous animalsexposure (up to 12 mice per cell).Each cell is 120cm long (4λ@900MHz, λ being the wavelength), and presents a cut‐off frequency of 1.2GHz.To prevent temperature increase in the RF‐exposed animals with respect to the sham‐exposed ones, and to maintain
comfortable and well‐known environmental conditions within the cells, a temperature control system has beenimplemented for the two TEM cellsimplemented for the two TEM cells.The TEM cell has equal transversal dimensions (a=b=12cm)The heating/refrigerating system for environmental condition control consists in two external metallic jackets filled with
circulating water, fed by a thermostatic bath (control the water temperature), and placed in contact with the top andbottom walls of the cell.
SetSet‐‐up of TEM cell exposure system up of TEM cell exposure system with blind controlwith blind control
Numerical electric field amplitude distribution within the TEM in a longitudinal Numerical electric field amplitude distribution within the TEM in a longitudinal plane for 1W peak input power: (a) cell empty and (b) charged with 12 miceplane for 1W peak input power: (a) cell empty and (b) charged with 12 mice
Heating/refrigerating system for Heating/refrigerating system for
ab
15/12/2011 14
Numerical electric field amplitude distribution within the TEM in a transversal Numerical electric field amplitude distribution within the TEM in a transversal plane for 1W peak input power : (c) cell empty and (d) charged with 12 miceplane for 1W peak input power : (c) cell empty and (d) charged with 12 mice
controlling the environmental controlling the environmental conditions within the TEM cell.conditions within the TEM cell.
[L. Ardoino et al, “A radio‐frequency system for in vivo pilot experiments aimed at the studies on biological effects ofelectromagnetic fields”, Phys. Med. Biol. 50 (2005)3643‐3654]
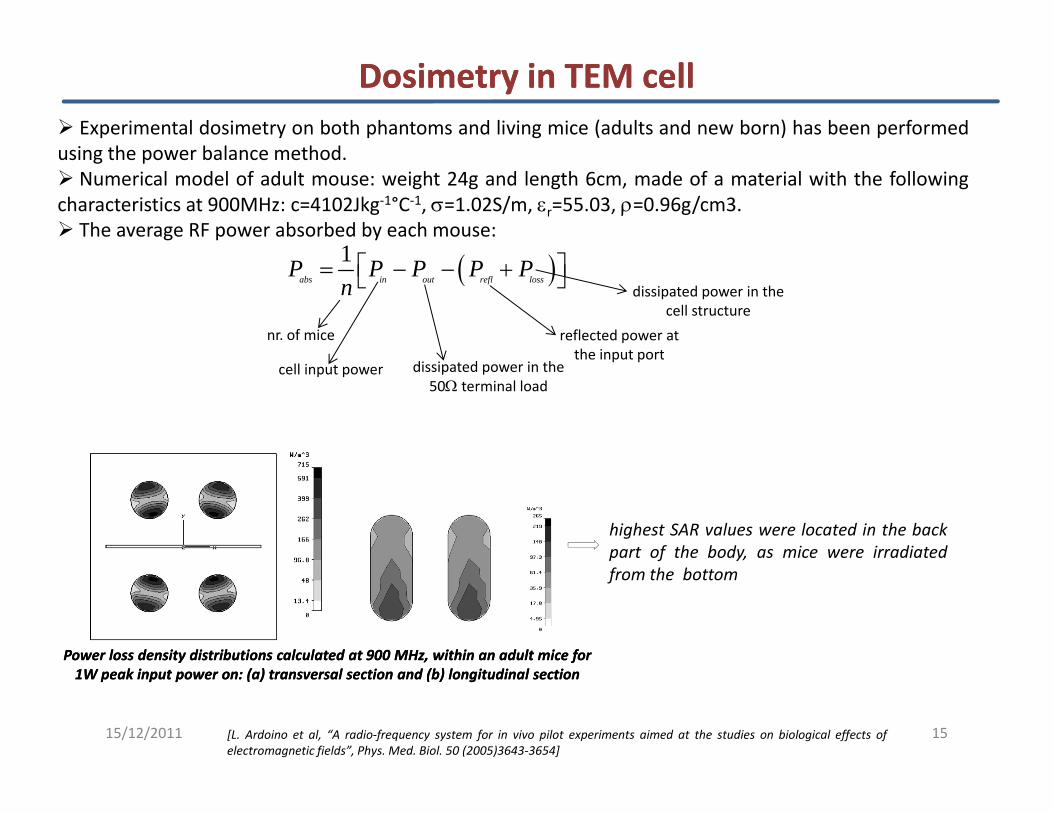
Dosimetry in TEM cellDosimetry in TEM cellExperimental dosimetry on both phantoms and living mice (adults and new born) has been performed
using the power balance methodusing the power balance method.Numerical model of adult mouse: weight 24g and length 6cm, made of a material with the following
characteristics at 900MHz: c=4102Jkg‐1°C‐1, σ=1.02S/m, εr=55.03, ρ=0.96g/cm3.The average RF power absorbed by each mouse:
1 ⎡ ⎤( )1abs in out refl lossP P P P P
n⎡ ⎤= − − +⎣ ⎦
nr. of mice reflected power at the input port
dissipated power in the cell structure
cell input power dissipated power in the 50Ω terminal load
the input port
highest SAR values were located in the backpart of the body, as mice were irradiated
Power loss density distributions calculated at 900 MHz, within an adult mice for Power loss density distributions calculated at 900 MHz, within an adult mice for
p f yfrom the bottom
15/12/2011 15
1W peak input power on: (a) transversal section and (b) longitudinal section1W peak input power on: (a) transversal section and (b) longitudinal section
[L. Ardoino et al, “A radio‐frequency system for in vivo pilot experiments aimed at the studies on biological effects ofelectromagnetic fields”, Phys. Med. Biol. 50 (2005)3643‐3654]
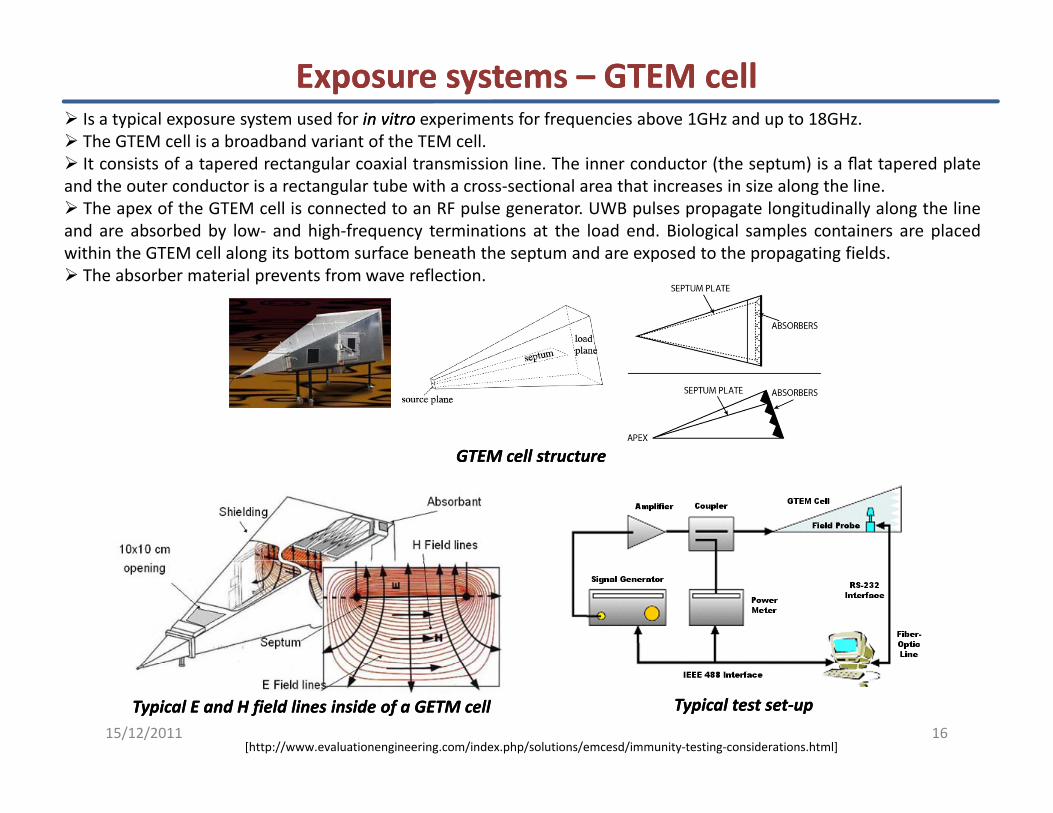
Exposure systems Exposure systems –– GTEM cellGTEM cellIs a typical exposure system used for inin vitrovitro experiments for frequencies above 1GHz and up to 18GHz.The GTEM cell is a broadband variant of the TEM cell.It consists of a tapered rectangular coaxial transmission line. The inner conductor (the septum) is a flat tapered plate
and the outer conductor is a rectangular tube with a cross‐sectional area that increases in size along the line.The apex of the GTEM cell is connected to an RF pulse generator. UWB pulses propagate longitudinally along the line
and are absorbed by low‐ and high‐frequency terminations at the load end. Biological samples containers are placedwithin the GTEM cell along its bottom surface beneath the septum and are exposed to the propagating fieldswithin the GTEM cell along its bottom surface beneath the septum and are exposed to the propagating fields.The absorber material prevents from wave reflection.
GTEM cell structureGTEM cell structureGTEM cell structureGTEM cell structure
15/12/2011 16
Typical test setTypical test set‐‐upupTypical E and H field lines inside of a GETM cellTypical E and H field lines inside of a GETM cell
[http://www.evaluationengineering.com/index.php/solutions/emcesd/immunity‐testing‐considerations.html]
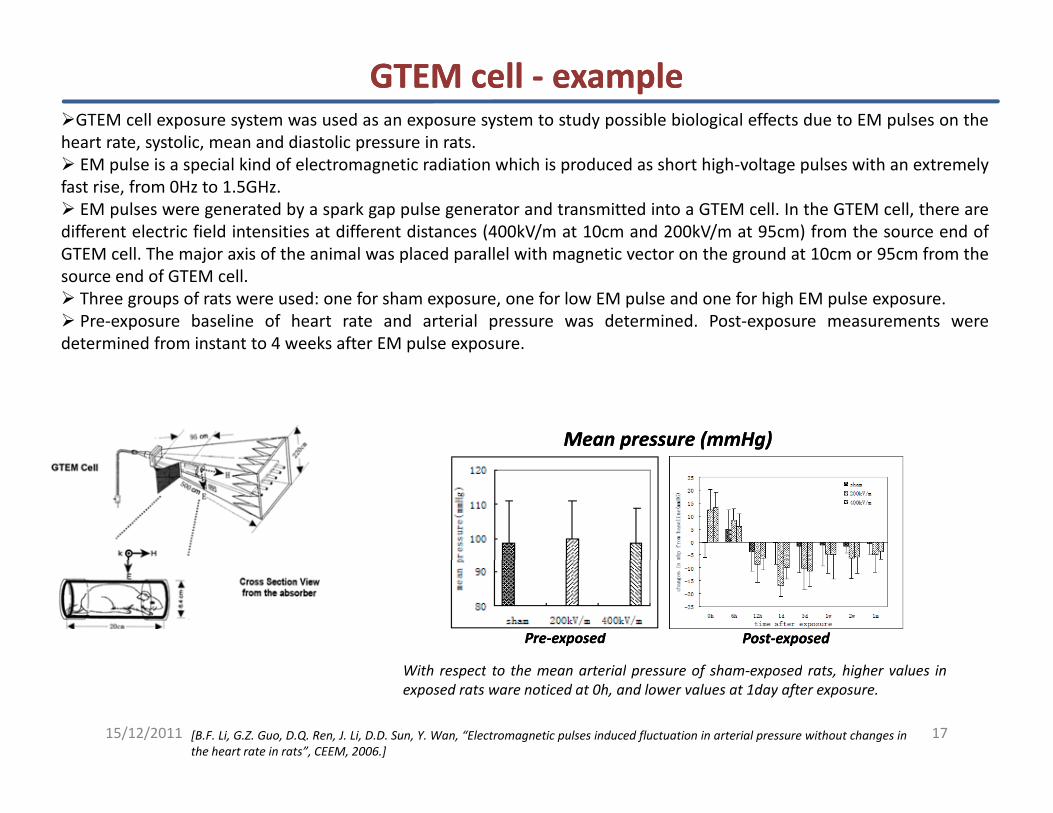
GTEM cell GTEM cell ‐‐ exampleexampleGTEM cell exposure system was used as an exposure system to study possible biological effects due to EM pulses on the
heart rate, systolic, mean and diastolic pressure in rats., y , pEM pulse is a special kind of electromagnetic radiation which is produced as short high‐voltage pulses with an extremely
fast rise, from 0Hz to 1.5GHz.EM pulses were generated by a spark gap pulse generator and transmitted into a GTEM cell. In the GTEM cell, there are
different electric field intensities at different distances (400kV/m at 10cm and 200kV/m at 95cm) from the source end ofGTEM cell The major axis of the animal was placed parallel with magnetic vector on the ground at 10cm or 95cm from theGTEM cell. The major axis of the animal was placed parallel with magnetic vector on the ground at 10cm or 95cm from thesource end of GTEM cell.Three groups of rats were used: one for sham exposure, one for low EM pulse and one for high EM pulse exposure.Pre‐exposure baseline of heart rate and arterial pressure was determined. Post‐exposure measurements were
determined from instant to 4 weeks after EM pulse exposure.
Mean pressure (mmHg)Mean pressure (mmHg)
PrePre‐‐exposed exposed PostPost‐‐exposed exposed
15/12/2011 17[B.F. Li, G.Z. Guo, D.Q. Ren, J. Li, D.D. Sun, Y. Wan, “Electromagnetic pulses induced fluctuation in arterial pressure without changes inthe heart rate in rats”, CEEM, 2006.]
With respect to the mean arterial pressure of sham‐exposed rats, higher values inexposed rats ware noticed at 0h, and lower values at 1day after exposure.
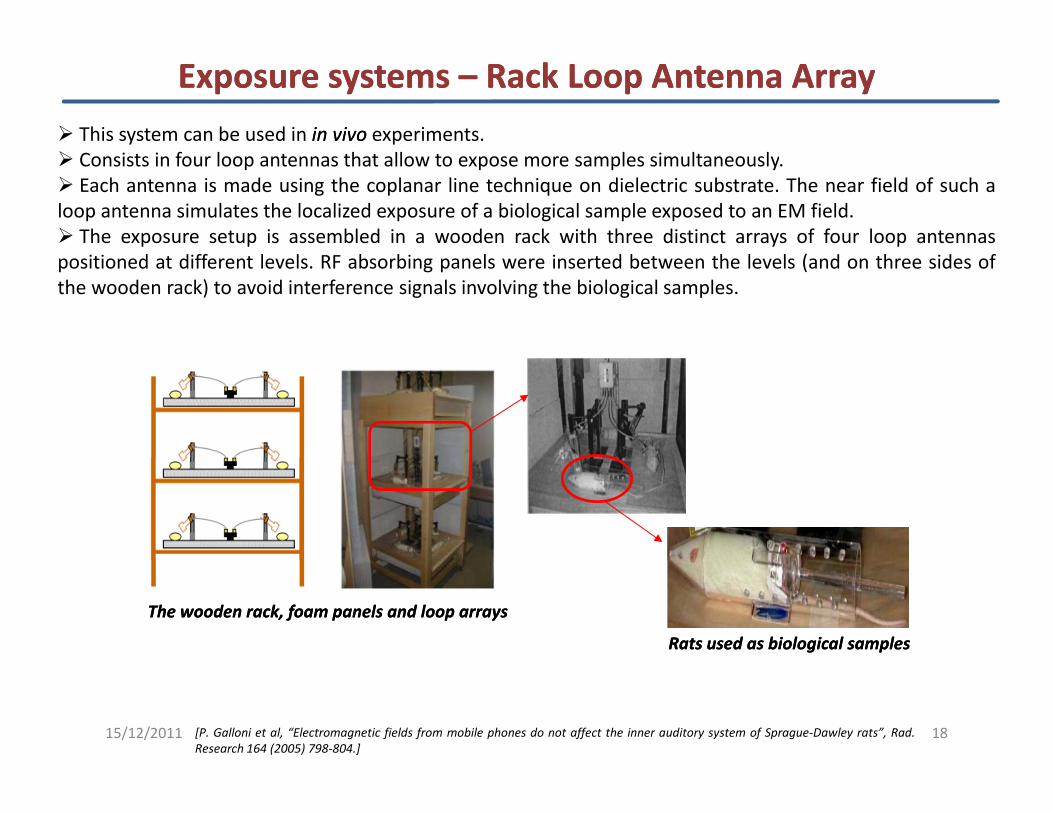
Exposure systems Exposure systems –– Rack Loop Antenna ArrayRack Loop Antenna ArrayThis system can be used in inin vivovivo experiments.Consists in four loop antennas that allow to expose more samples simultaneously.Each antenna is made using the coplanar line technique on dielectric substrate. The near field of such a
loop antenna simulates the localized exposure of a biological sample exposed to an EM field.The exposure setup is assembled in a wooden rack with three distinct arrays of four loop antennas
positioned at different levels. RF absorbing panels were inserted between the levels (and on three sides ofthe wooden rack) to avoid interference signals involving the biological samples.
The wooden rack, foam panels and loop arrays The wooden rack, foam panels and loop arrays
Rats used as biological samplesRats used as biological samples
15/12/2011 18[P. Galloni et al, “Electromagnetic fields from mobile phones do not affect the inner auditory system of Sprague‐Dawley rats”, Rad.Research 164 (2005) 798‐804.]
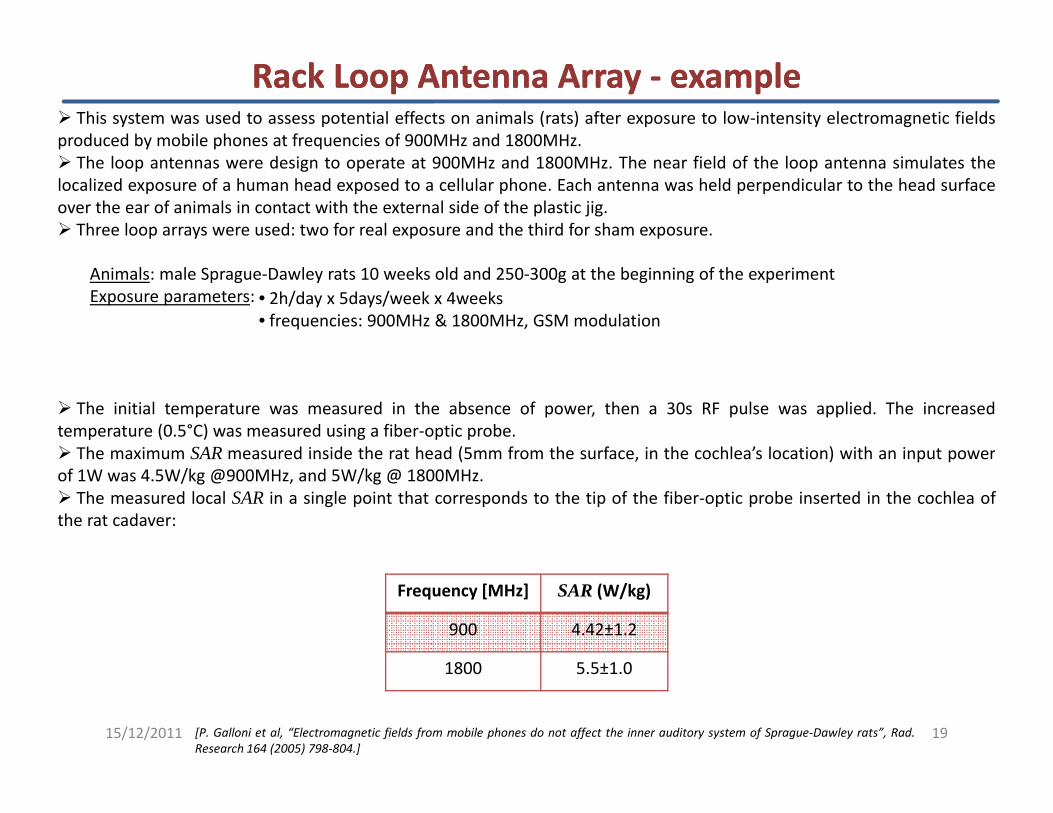
Rack Loop Antenna Array Rack Loop Antenna Array ‐‐ exampleexampleThis system was used to assess potential effects on animals (rats) after exposure to low‐intensity electromagnetic fields
produced by mobile phones at frequencies of 900MHz and 1800MHz.The loop antennas were design to operate at 900MHz and 1800MHz. The near field of the loop antenna simulates the
localized exposure of a human head exposed to a cellular phone. Each antenna was held perpendicular to the head surfaceover the ear of animals in contact with the external side of the plastic jig.Three loop arrays were used: two for real exposure and the third for sham exposure.
Animals: male Sprague‐Dawley rats 10 weeks old and 250‐300g at the beginning of the experimentExposure parameters: • 2h/day x 5days/week x 4weeks
• frequencies: 900MHz & 1800MHz, GSM modulation
The initial temperature was measured in the absence of power, then a 30s RF pulse was applied. The increasedtemperature (0.5°C) was measured using a fiber‐optic probe.
The maximum SAR measured inside the rat head (5mm from the surface, in the cochlea’s location) with an input powerThe maximum SAR measured inside the rat head (5mm from the surface, in the cochlea s location) with an input powerof 1W was 4.5W/kg @900MHz, and 5W/kg @ 1800MHz.
The measured local SAR in a single point that corresponds to the tip of the fiber‐optic probe inserted in the cochlea ofthe rat cadaver:
Frequency [MHz] SAR (W/kg)
900 4.42±1.2
1800 5 5 1 0
15/12/2011 19
1800 5.5±1.0
[P. Galloni et al, “Electromagnetic fields from mobile phones do not affect the inner auditory system of Sprague‐Dawley rats”, Rad.Research 164 (2005) 798‐804.]
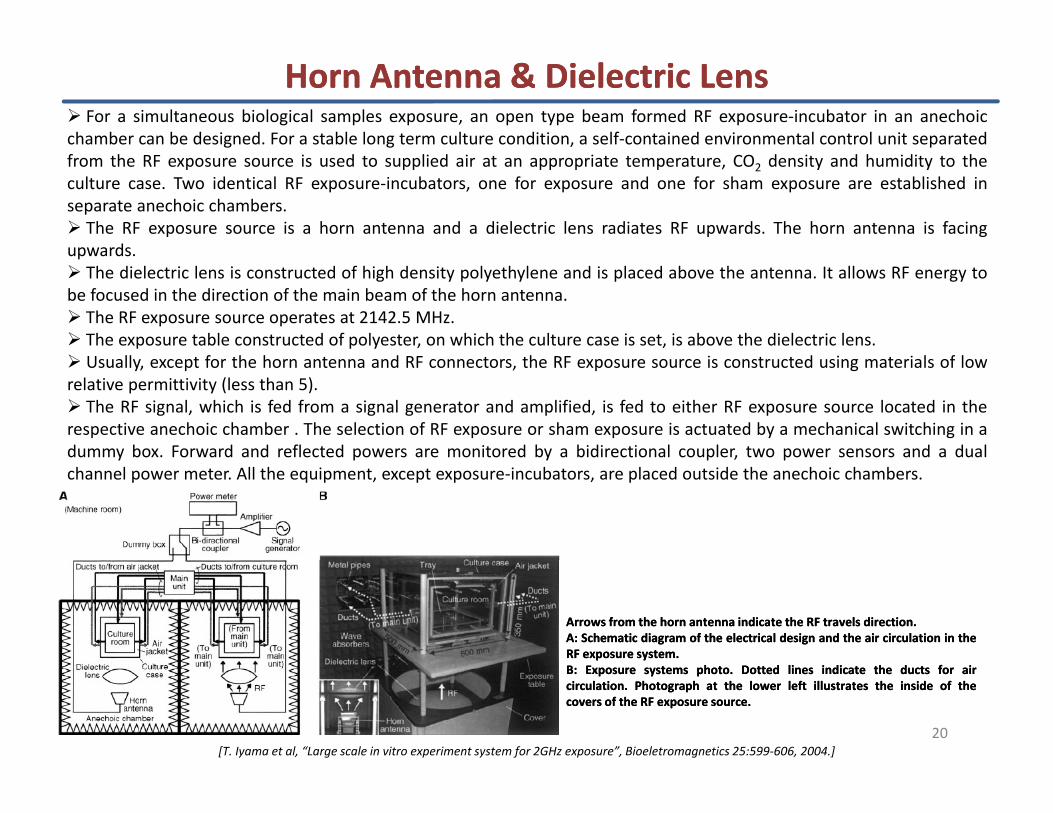
Horn Antenna & Dielectric LensHorn Antenna & Dielectric LensFor a simultaneous biological samples exposure, an open type beam formed RF exposure‐incubator in an anechoic
chamber can be designed. For a stable long term culture condition, a self‐contained environmental control unit separatedfrom the RF exposure source is used to supplied air at an appropriate temperature, CO2 density and humidity to theculture case. Two identical RF exposure‐incubators, one for exposure and one for sham exposure are established inseparate anechoic chambers.
The RF exposure source is a horn antenna and a dielectric lens radiates RF upwards. The horn antenna is facingupwardsupwards.
The dielectric lens is constructed of high density polyethylene and is placed above the antenna. It allows RF energy tobe focused in the direction of the main beam of the horn antenna.The RF exposure source operates at 2142.5 MHz.The exposure table constructed of polyester, on which the culture case is set, is above the dielectric lens.
ll f h h d h d l f lUsually, except for the horn antenna and RF connectors, the RF exposure source is constructed using materials of lowrelative permittivity (less than 5).
The RF signal, which is fed from a signal generator and amplified, is fed to either RF exposure source located in therespective anechoic chamber . The selection of RF exposure or sham exposure is actuated by a mechanical switching in adummy box. Forward and reflected powers are monitored by a bidirectional coupler, two power sensors and a dualy p y p , pchannel power meter. All the equipment, except exposure‐incubators, are placed outside the anechoic chambers.
ArrowsArrows fromfrom thethe hornhorn antennaantenna indicateindicate thethe RFRF travelstravels directiondirection..AA:: SchematicSchematic diagramdiagram ofof thethe electricalelectrical designdesign andand thethe airair circulationcirculation inin thetheRFRF exposureexposure systemsystem..
20
BB:: ExposureExposure systemssystems photophoto.. DottedDotted lineslines indicateindicate thethe ductsducts forfor airaircirculationcirculation.. PhotographPhotograph atat thethe lowerlower leftleft illustratesillustrates thethe insideinside ofof thethecoverscovers ofof thethe RFRF exposureexposure sourcesource..
[T. Iyama et al, “Large scale in vitro experiment system for 2GHz exposure”, Bioeletromagnetics 25:599‐606, 2004.]
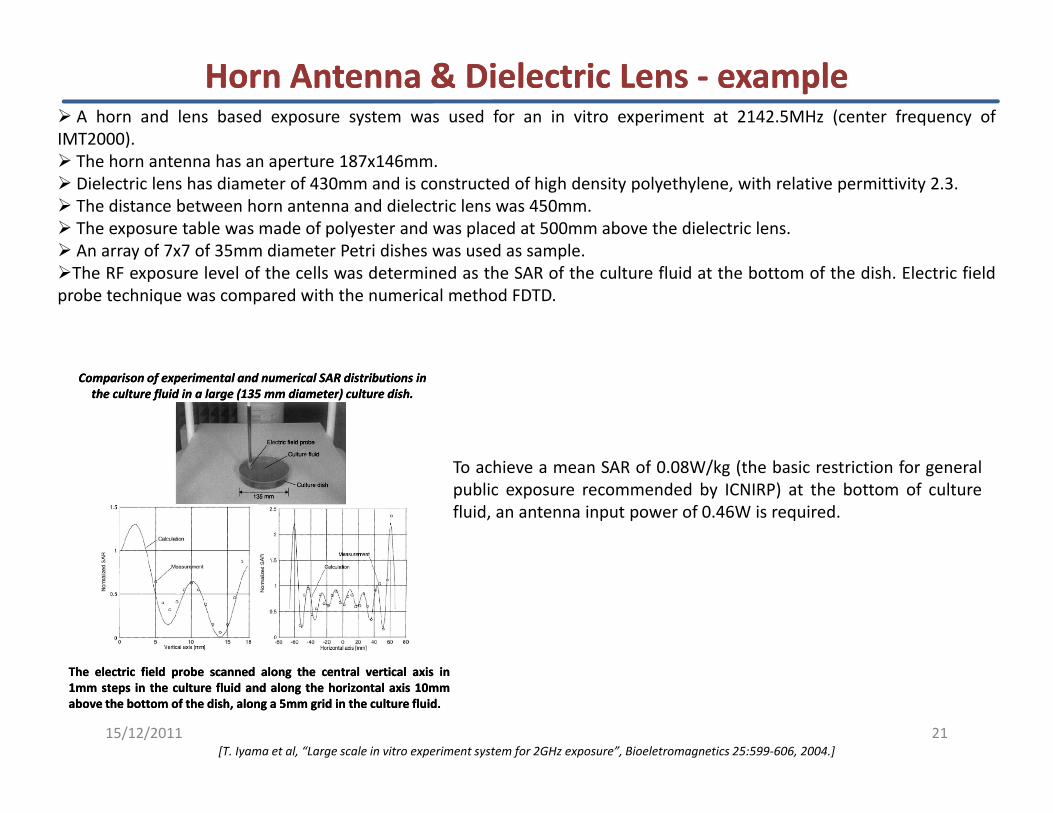
Horn Antenna & Dielectric Lens Horn Antenna & Dielectric Lens ‐‐ exampleexampleA horn and lens based exposure system was used for an in vitro experiment at 2142.5MHz (center frequency of
IMT2000).The horn antenna has an aperture 187x146mm.Dielectric lens has diameter of 430mm and is constructed of high density polyethylene, with relative permittivity 2.3.The distance between horn antenna and dielectric lens was 450mm.The exposure table was made of polyester and was placed at 500mm above the dielectric lens.An array of 7x7 of 35mm diameter Petri dishes was used as sampleAn array of 7x7 of 35mm diameter Petri dishes was used as sample.The RF exposure level of the cells was determined as the SAR of the culture fluid at the bottom of the dish. Electric field
probe technique was compared with the numerical method FDTD.
Comparison of experimental and numerical SAR distributions in Comparison of experimental and numerical SAR distributions in the culture fluid in a large the culture fluid in a large (135 mm (135 mm diameterdiameter) culture ) culture dishdish..
To achieve a mean SAR of 0.08W/kg (the basic restriction for generalpublic exposure recommended by ICNIRP) at the bottom of culturefluid, an antenna input power of 0.46W is required.
15/12/2011 21
TheThe electricelectric fieldfield probeprobe scannedscanned alongalong thethe centralcentral verticalvertical axisaxis inin11mmmm stepssteps inin thethe cultureculture fluidfluid andand alongalong thethe horizontalhorizontal axisaxis 1010mmmmaboveabove thethe bottombottom ofof thethe dish,dish, alongalong aa 55mmmm gridgrid inin thethe cultureculture fluidfluid..
[T. Iyama et al, “Large scale in vitro experiment system for 2GHz exposure”, Bioeletromagnetics 25:599‐606, 2004.]
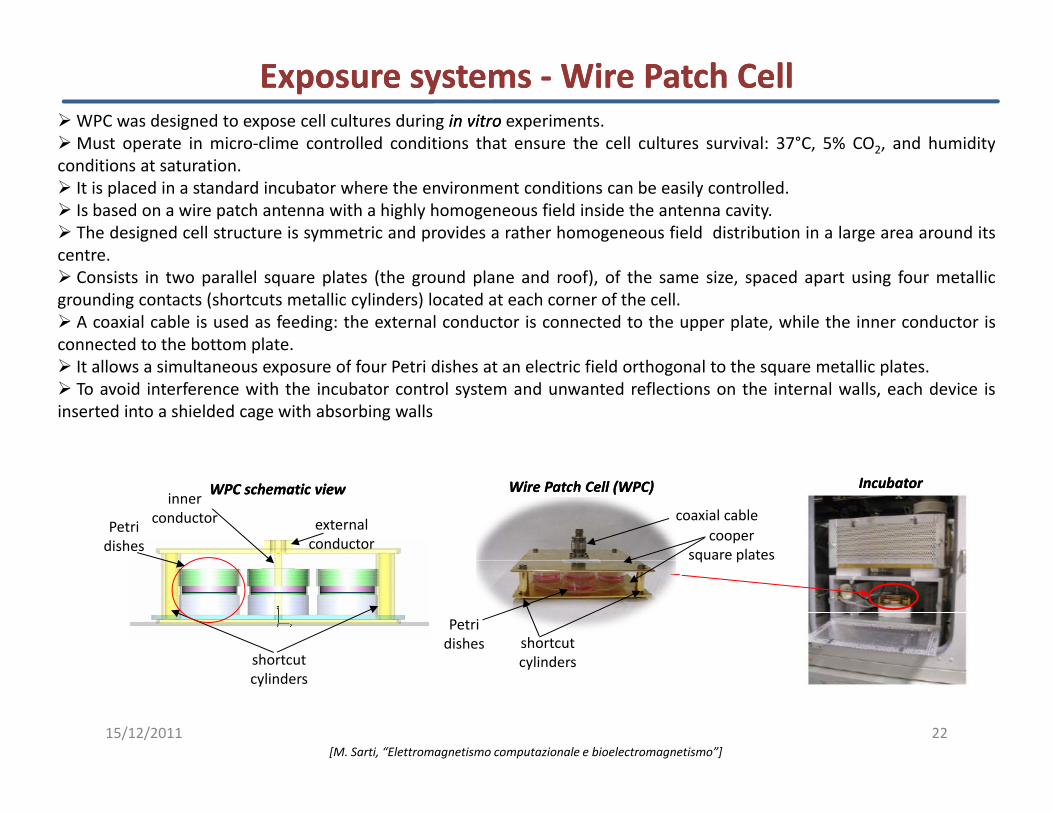
WPC was designed to expose cell cultures during inin vitrovitro experiments.Must operate in micro‐clime controlled conditions that ensure the cell cultures survival: 37°C, 5% CO2, and humidity
Exposure systems Exposure systems ‐‐Wire Patch CellWire Patch Cell
p , 2, yconditions at saturation.It is placed in a standard incubator where the environment conditions can be easily controlled.Is based on a wire patch antenna with a highly homogeneous field inside the antenna cavity.The designed cell structure is symmetric and provides a rather homogeneous field distribution in a large area around its
centrecentre.Consists in two parallel square plates (the ground plane and roof), of the same size, spaced apart using four metallic
grounding contacts (shortcuts metallic cylinders) located at each corner of the cell.A coaxial cable is used as feeding: the external conductor is connected to the upper plate, while the inner conductor is
connected to the bottom plate.It allows a simultaneous exposure of four Petri dishes at an electric field orthogonal to the square metallic plates.To avoid interference with the incubator control system and unwanted reflections on the internal walls, each device is
inserted into a shielded cage with absorbing walls
IncubatorIncubatorWire Patch Cell (WPC)Wire Patch Cell (WPC)
cooper square plates
coaxial cableinner
conductor external conductor
WPC schematic viewWPC schematic view
Petri dishes q p
shortcut cylinders
Petri dishes
shortcut
15/12/2011 22[M. Sarti, “Elettromagnetismo computazionale e bioelectromagnetismo”]
cylindersshortcut cylinders
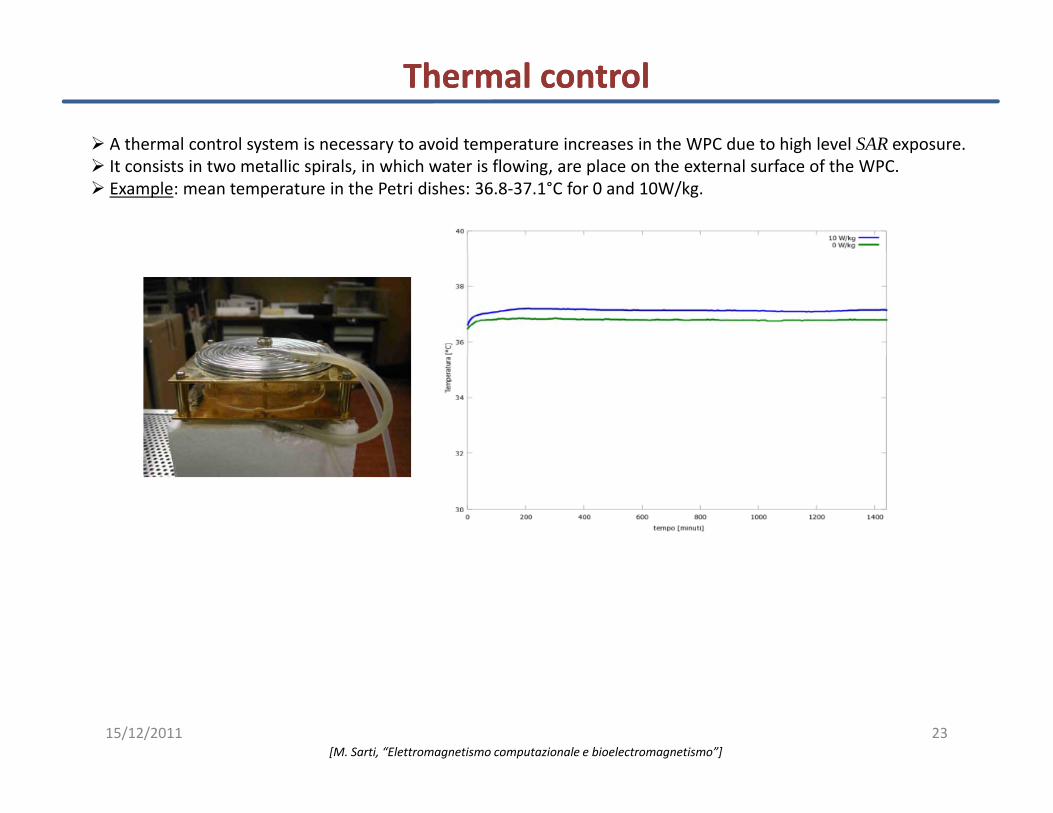
Thermal controlThermal control
A thermal control system is necessary to avoid temperature increases in the WPC due to high level SAR exposure. y y p g pIt consists in two metallic spirals, in which water is flowing, are place on the external surface of the WPC.Example: mean temperature in the Petri dishes: 36.8‐37.1°C for 0 and 10W/kg.
15/12/2011 23[M. Sarti, “Elettromagnetismo computazionale e bioelectromagnetismo”]
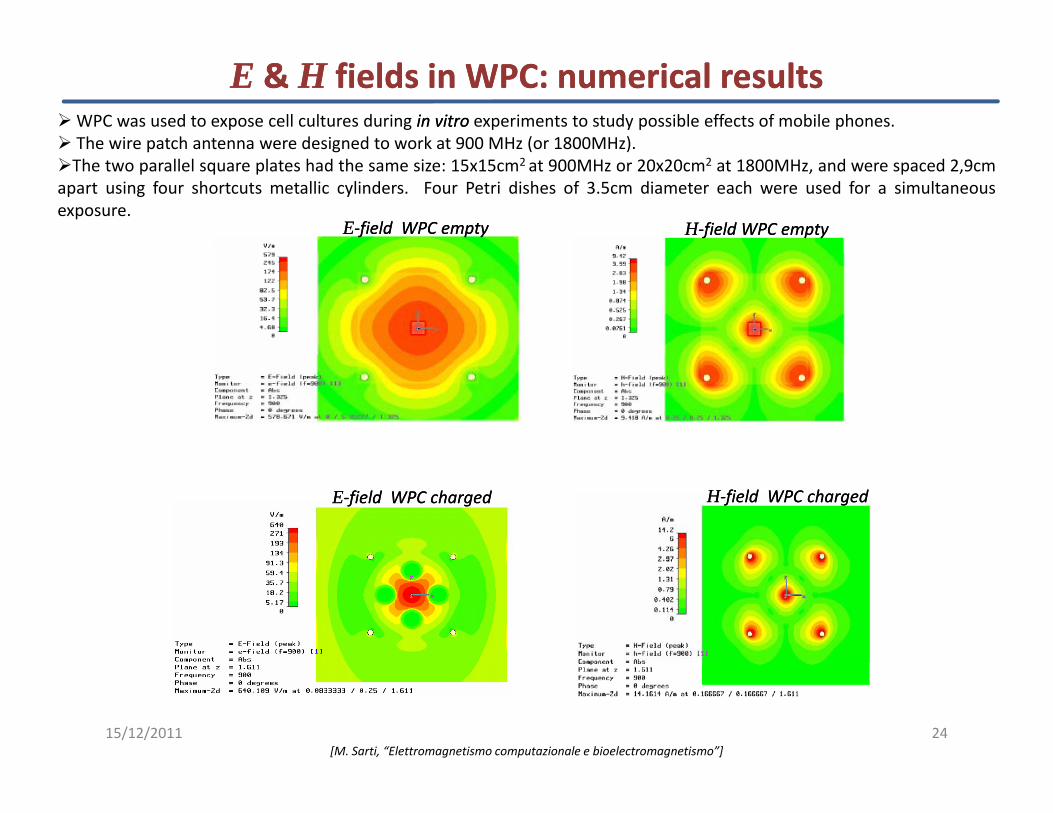
EE & & HH fields in WPC: numerical resultsfields in WPC: numerical resultsWPC was used to expose cell cultures during inin vitrovitro experiments to study possible effects of mobile phones.The wire patch antenna were designed to work at 900 MHz (or 1800MHz).p g ( )The two parallel square plates had the same size: 15x15cm2 at 900MHz or 20x20cm2 at 1800MHz, and were spaced 2,9cm
apart using four shortcuts metallic cylinders. Four Petri dishes of 3.5cm diameter each were used for a simultaneousexposure.
EE‐‐field WPC emptyfield WPC empty HH‐‐field WPC empty field WPC empty
EE‐‐field WPC chargedfield WPC charged HH‐‐field WPC chargedfield WPC charged
15/12/2011 24[M. Sarti, “Elettromagnetismo computazionale e bioelectromagnetismo”]
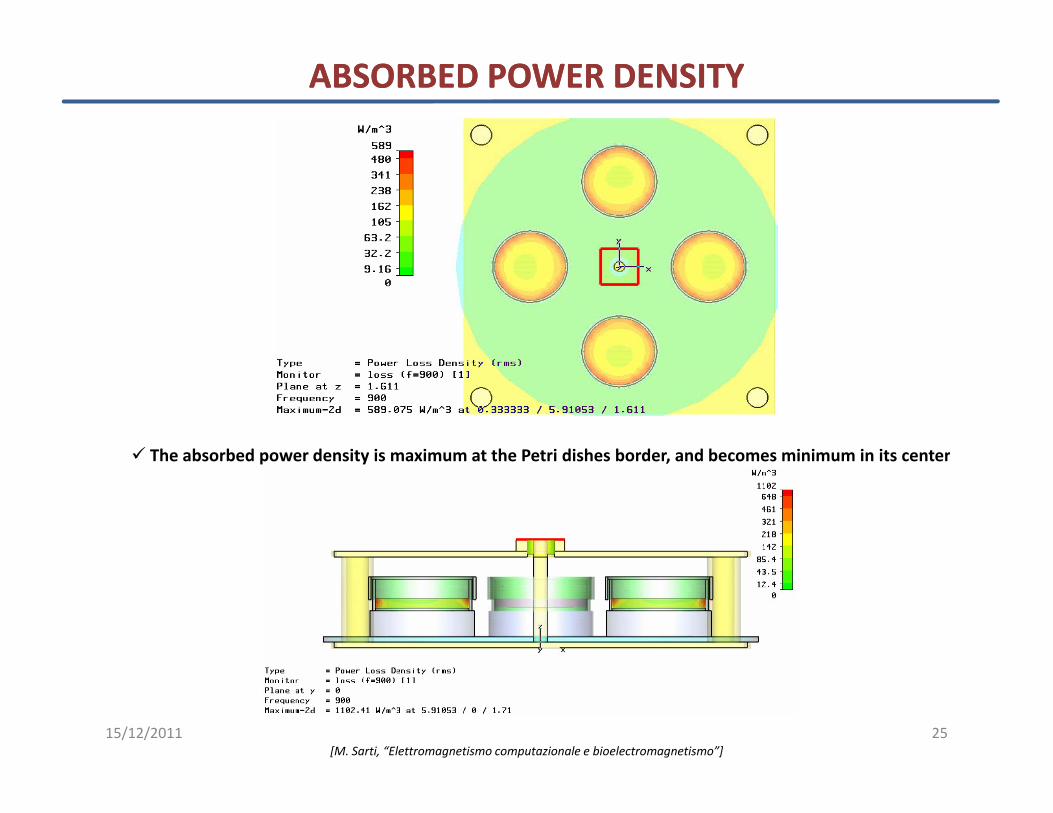
ABSORBED POWER DENSITY ABSORBED POWER DENSITY
The absorbed power density is maximum at the Petri dishes border and becomes minimum in its centerThe absorbed power density is maximum at the Petri dishes border, and becomes minimum in its center
15/12/2011 25[M. Sarti, “Elettromagnetismo computazionale e bioelectromagnetismo”]
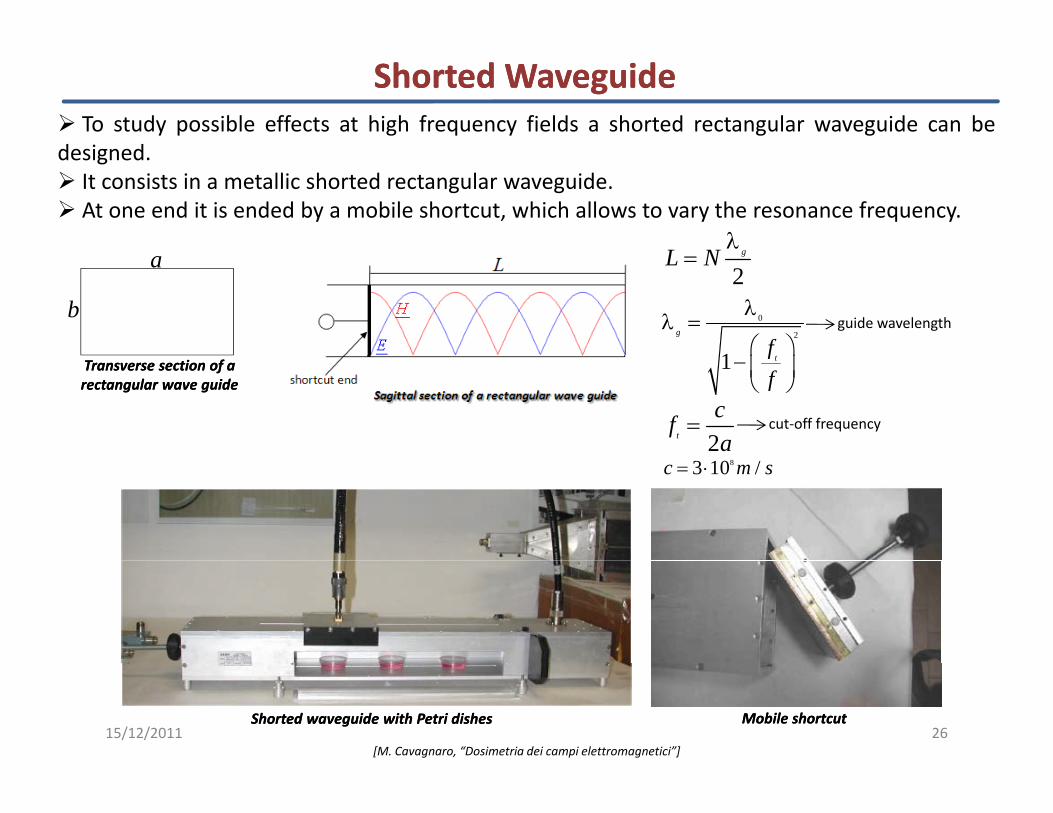
Shorted Waveguide Shorted Waveguide To study possible effects at high frequency fields a shorted rectangular waveguide can be
designeddesigned.It consists in a metallic shorted rectangular waveguide.At one end it is ended by a mobile shortcut, which allows to vary the resonance frequency.
gL Nλ
a
b2
gL N=
0
2
1g
f
λλ =
⎛ ⎞⎜ ⎟
guide wavelength
Transverse section of a Transverse section of a rectangular wave guiderectangular wave guide
1 tff
⎛ ⎞− ⎜ ⎟⎝ ⎠
2t
cfa
= cut‐off frequency
83 10 /c m s= ⋅
15/12/2011 26Shorted waveguide with Petri dishesShorted waveguide with Petri dishes Mobile shortcutMobile shortcut
[M. Cavagnaro, “Dosimetria dei campi elettromagnetici”]
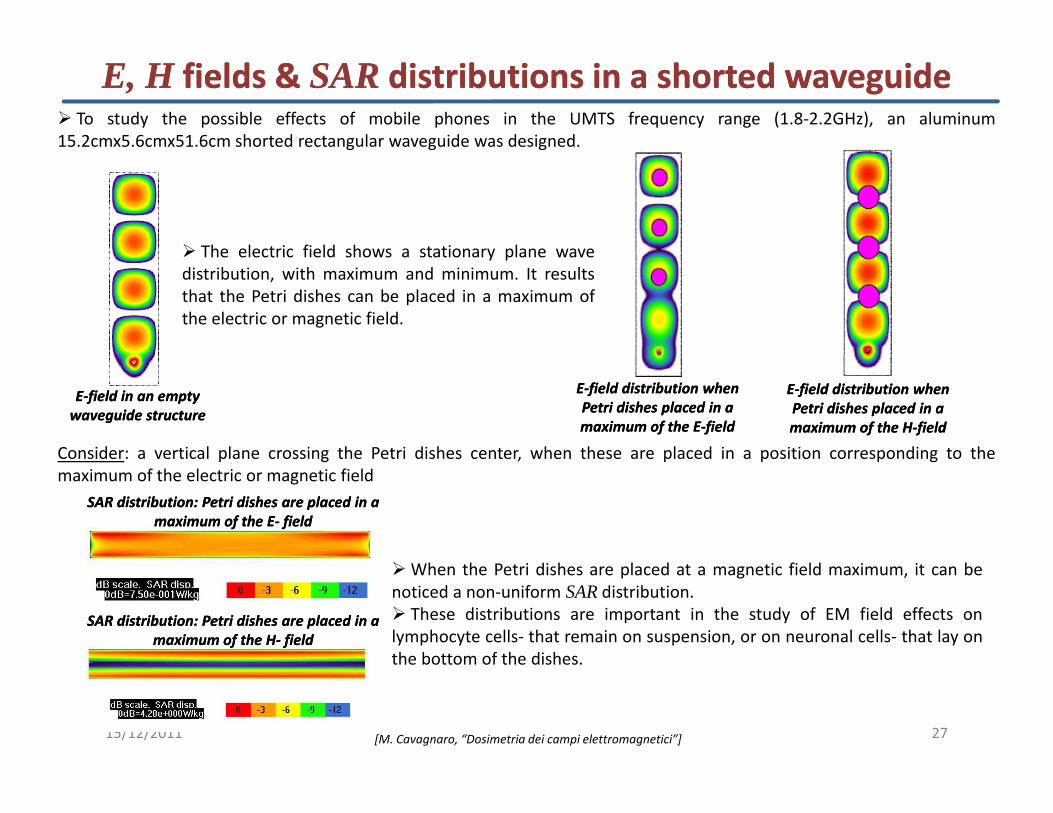
To study the possible effects of mobile phones in the UMTS frequency range (1.8‐2.2GHz), an aluminum15.2cmx5.6cmx51.6cm shorted rectangular waveguide was designed.
E, HE, H fields & fields & SARSAR distributions in a shorted waveguidedistributions in a shorted waveguide
The electric field shows a stationary plane waveThe electric field shows a stationary plane wavedistribution, with maximum and minimum. It resultsthat the Petri dishes can be placed in a maximum ofthe electric or magnetic field.
EE‐‐field in an empty field in an empty waveguide structurewaveguide structure
EE‐‐field distribution when field distribution when Petri dishes placed in a Petri dishes placed in a maximum of the Emaximum of the E‐‐fieldfield
EE‐‐field distribution when field distribution when Petri dishes placed in a Petri dishes placed in a maximum of the Hmaximum of the H‐‐fieldfield
Consider: a vertical plane crossing the Petri dishes center, when these are placed in a position corresponding to theConsider: a vertical plane crossing the Petri dishes center, when these are placed in a position corresponding to themaximum of the electric or magnetic field
SAR distribution: Petri dishes are placed in a SAR distribution: Petri dishes are placed in a maximum of the Emaximum of the E‐‐ fieldfield
SAR distribution: Petri dishes are placed in a SAR distribution: Petri dishes are placed in a maximum of the Hmaximum of the H‐‐ fieldfield
When the Petri dishes are placed at a magnetic field maximum, it can benoticed a non‐uniform SAR distribution.
These distributions are important in the study of EM field effects onlymphocyte cells‐ that remain on suspension, or on neuronal cells‐ that lay onthe bottom of the dishes.
15/12/2011 27[M. Cavagnaro, “Dosimetria dei campi elettromagnetici”]
the bottom of the dishes.
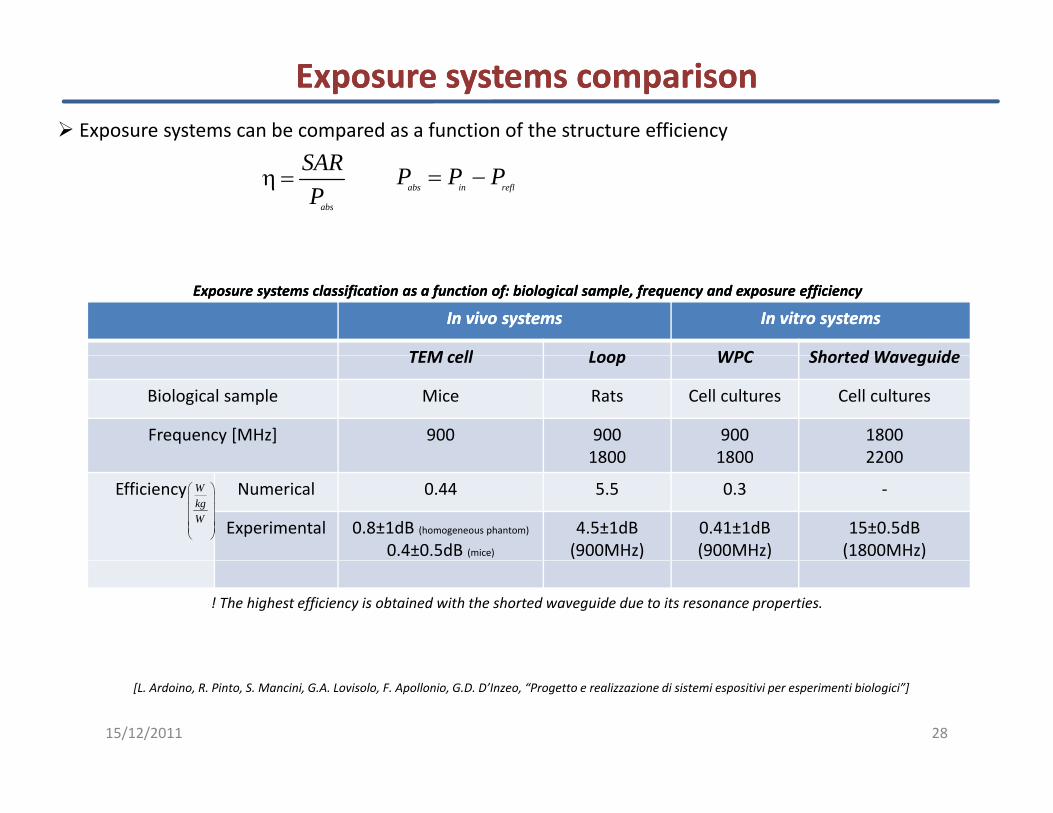
Exposure systems comparisonExposure systems comparisonExposure systems can be compared as a function of the structure efficiency
abs
SARP
η = abs in reflP P P= −
In vivo systemsIn vivo systems In vitro systemsIn vitro systems
TEM cell Loop WPC Shorted Waveguide
Exposure systems classification as a function of: biological sample, frequency and exposure efficiencyExposure systems classification as a function of: biological sample, frequency and exposure efficiency
TEM cell Loop WPC Shorted Waveguide
Biological sample Mice Rats Cell cultures Cell cultures
Frequency [MHz] 900 9001800
9001800
180022001800 1800 2200
Efficiency Numerical 0.44 5.5 0.3 ‐
Experimental 0.8±1dB (homogeneous phantom)
0.4±0.5dB (mice)
4.5±1dB (900MHz)
0.41±1dB (900MHz)
15±0.5dB (1800MHz)
WkgW
⎛ ⎞⎜ ⎟⎜ ⎟⎜ ⎟⎜ ⎟⎝ ⎠
! The highest efficiency is obtained with the shorted waveguide due to its resonance properties.
15/12/2011 28
[L. Ardoino, R. Pinto, S. Mancini, G.A. Lovisolo, F. Apollonio, G.D. D’Inzeo, “Progetto e realizzazione di sistemi espositivi per esperimenti biologici”]
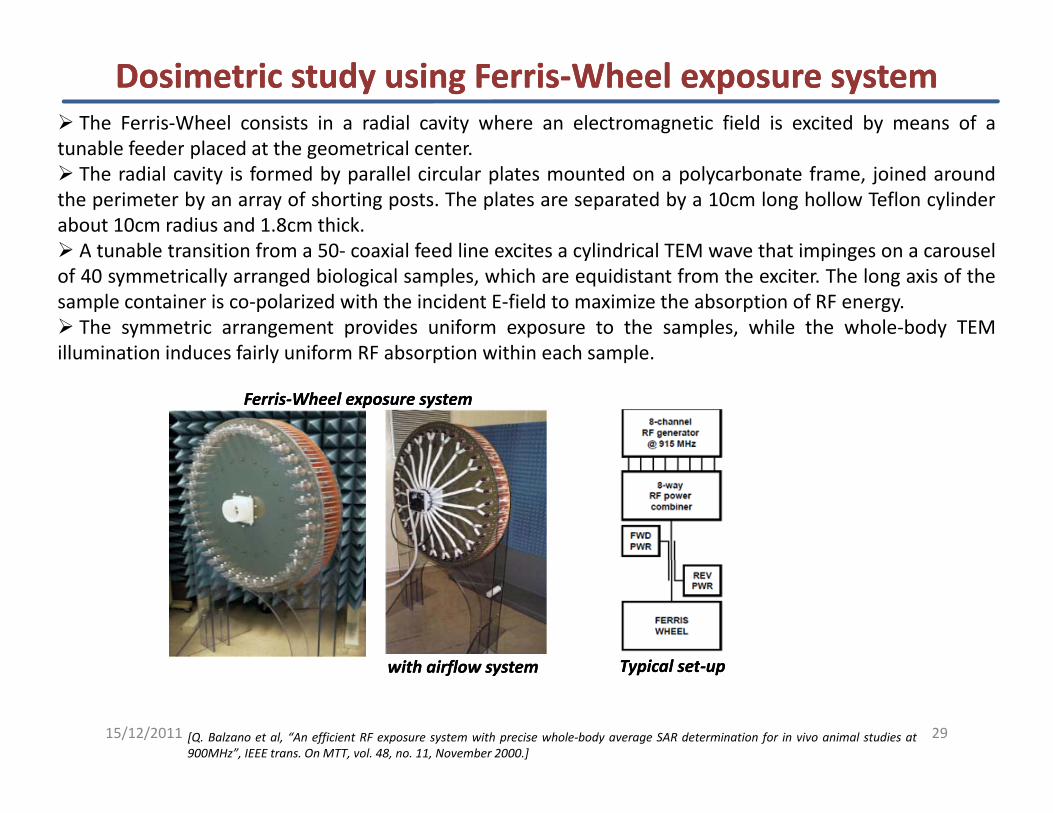
DosimetricDosimetric study using Ferrisstudy using Ferris‐‐Wheel exposure systemWheel exposure systemThe Ferris‐Wheel consists in a radial cavity where an electromagnetic field is excited by means of a
tunable feeder placed at the geometrical centertunable feeder placed at the geometrical center.The radial cavity is formed by parallel circular plates mounted on a polycarbonate frame, joined around
the perimeter by an array of shorting posts. The plates are separated by a 10cm long hollow Teflon cylinderabout 10cm radius and 1.8cm thick.
A tunable transition from a 50‐ coaxial feed line excites a cylindrical TEM wave that impinges on a carouselA tunable transition from a 50 coaxial feed line excites a cylindrical TEM wave that impinges on a carouselof 40 symmetrically arranged biological samples, which are equidistant from the exciter. The long axis of thesample container is co‐polarized with the incident E‐field to maximize the absorption of RF energy.
The symmetric arrangement provides uniform exposure to the samples, while the whole‐body TEMillumination induces fairly uniform RF absorption within each sampleillumination induces fairly uniform RF absorption within each sample.
FerrisFerris‐‐Wheel exposure systemWheel exposure system
ith i fl tith i fl t T pical setT pical set pp
15/12/2011 29
with airflow systemwith airflow system Typical setTypical set‐‐upup
[Q. Balzano et al, “An efficient RF exposure system with precise whole‐body average SAR determination for in vivo animal studies at900MHz”, IEEE trans. On MTT, vol. 48, no. 11, November 2000.]
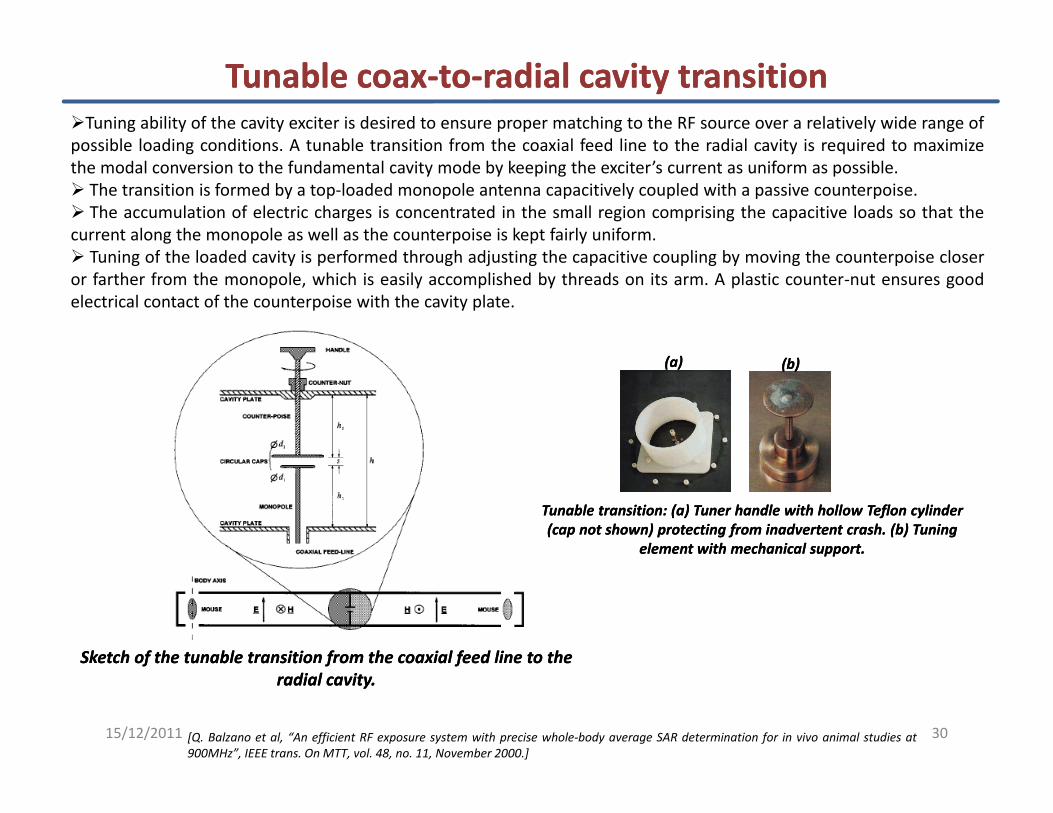
Tuning ability of the cavity exciter is desired to ensure proper matching to the RF source over a relatively wide range ofpossible loading conditions. A tunable transition from the coaxial feed line to the radial cavity is required to maximize
Tunable coaxTunable coax‐‐toto‐‐radial cavity transitionradial cavity transition
possible loading conditions. A tunable transition from the coaxial feed line to the radial cavity is required to maximizethe modal conversion to the fundamental cavity mode by keeping the exciter’s current as uniform as possible.The transition is formed by a top‐loaded monopole antenna capacitively coupled with a passive counterpoise.The accumulation of electric charges is concentrated in the small region comprising the capacitive loads so that the
current along the monopole as well as the counterpoise is kept fairly uniform.T i f th l d d it i f d th h dj ti th iti li b i th t i lTuning of the loaded cavity is performed through adjusting the capacitive coupling by moving the counterpoise closer
or farther from the monopole, which is easily accomplished by threads on its arm. A plastic counter‐nut ensures goodelectrical contact of the counterpoise with the cavity plate.
(a) (a) (b) (b)
Tunable transition: (a) Tuner handle with hollow Teflon cylinderTunable transition: (a) Tuner handle with hollow Teflon cylinder(cap not shown) protecting from inadvertent crash. (b) Tuning (cap not shown) protecting from inadvertent crash. (b) Tuning
element with mechanical support.element with mechanical support.
Sketch of the tunable transition from the coaxial feed line to the Sketch of the tunable transition from the coaxial feed line to the
15/12/2011 30
S etc of t e tu ab e t a s t o f o t e coa a feed e to t eS etc of t e tu ab e t a s t o f o t e coa a feed e to t eradial cavity.radial cavity.
[Q. Balzano et al, “An efficient RF exposure system with precise whole‐body average SAR determination for in vivo animal studies at900MHz”, IEEE trans. On MTT, vol. 48, no. 11, November 2000.]
DosimetricDosimetric study using Ferrisstudy using Ferris‐‐Wheel exposure systemWheel exposure system
The Ferris‐Wheel dosimetry results can be used to estimate RF exposure levels experienced by the mice over longtime exposure period.1200 mice were exposed to pulsed RF energy at 900MHz.Twin‐well calorimetry was employed to measure the SARWB of mice for three body masses: 23g, 32g and 36g.A differential twin‐well calorimeter technique was used to determine the SARWBAV . The twin‐well calorimeter allows
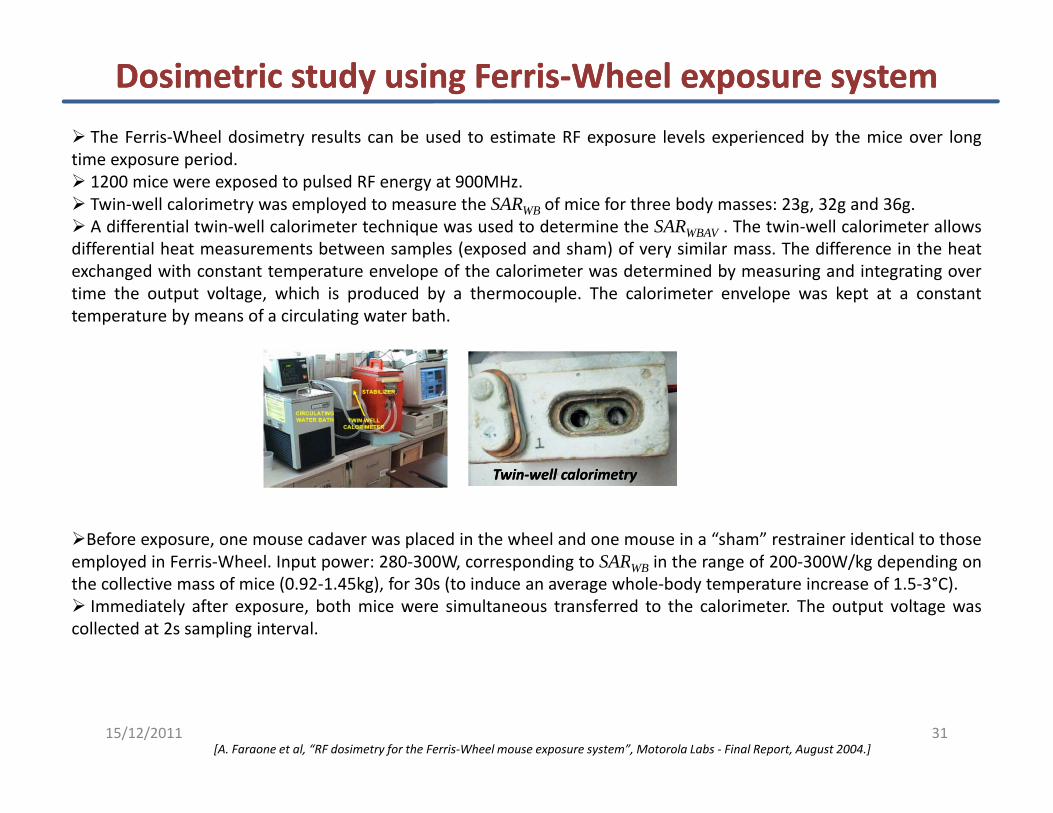
differential heat measurements between samples (exposed and sham) of very similar mass. The difference in the heatdifferential heat measurements between samples (exposed and sham) of very similar mass. The difference in the heatexchanged with constant temperature envelope of the calorimeter was determined by measuring and integrating overtime the output voltage, which is produced by a thermocouple. The calorimeter envelope was kept at a constanttemperature by means of a circulating water bath.
Before exposure, one mouse cadaver was placed in the wheel and one mouse in a “sham” restrainer identical to thoseemployed in Ferris Wheel Input power: 280 300W corresponding to SAR in the range of 200 300W/kg depending on
TwinTwin‐‐well well calorimetrycalorimetry
employed in Ferris‐Wheel. Input power: 280‐300W, corresponding to SARWB in the range of 200‐300W/kg depending onthe collective mass of mice (0.92‐1.45kg), for 30s (to induce an average whole‐body temperature increase of 1.5‐3°C).
Immediately after exposure, both mice were simultaneous transferred to the calorimeter. The output voltage wascollected at 2s sampling interval.
15/12/2011 31[A. Faraone et al, “RF dosimetry for the Ferris‐Wheel mouse exposure system”, Motorola Labs ‐ Final Report, August 2004.]
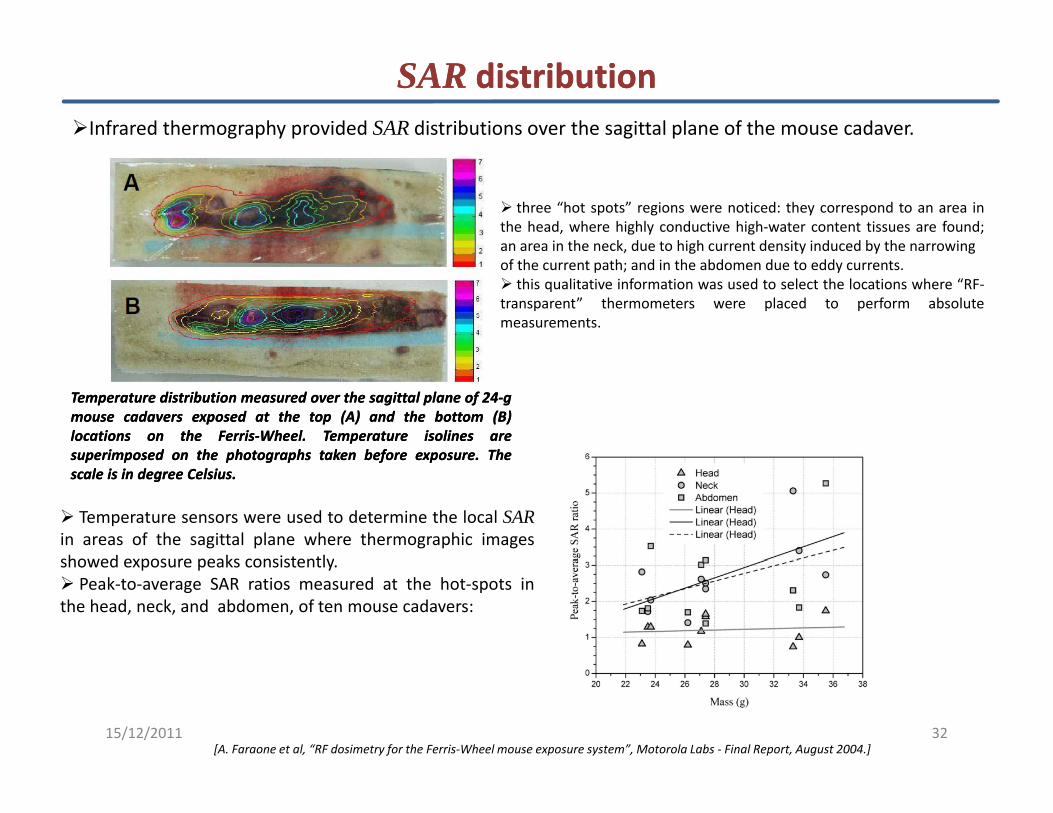
Infrared thermography provided SAR distributions over the sagittal plane of the mouse cadaver.
SARSAR distributiondistribution
three “hot spots” regions were noticed: they correspond to an area inthe head, where highly conductive high‐water content tissues are found;an area in the neck, due to high current density induced by the narrowing, g y y gof the current path; and in the abdomen due to eddy currents.
this qualitative information was used to select the locations where “RF‐transparent” thermometers were placed to perform absolutemeasurements.
TemperatureTemperature distributiondistribution measuredmeasured overover thethe sagittalsagittal planeplane ofof 2424‐‐ggmousemouse cadaverscadavers exposedexposed atat thethe toptop (A)(A) andand thethe bottombottom (B)(B)locationslocations onon thethe FerrisFerris‐‐WheelWheel.. TemperatureTemperature isolinesisolines arearesuperimposedsuperimposed onon thethe photographsphotographs takentaken beforebefore exposureexposure.. TheThesuperimposedsuperimposed onon thethe photographsphotographs takentaken beforebefore exposureexposure.. TheThescalescale isis inin degreedegree CelsiusCelsius..
Temperature sensors were used to determine the local SARin areas of the sagittal plane where thermographic imagesshowed exposure peaks consistentlyshowed exposure peaks consistently.
Peak‐to‐average SAR ratios measured at the hot‐spots inthe head, neck, and abdomen, of ten mouse cadavers:
15/12/2011 32[A. Faraone et al, “RF dosimetry for the Ferris‐Wheel mouse exposure system”, Motorola Labs ‐ Final Report, August 2004.]
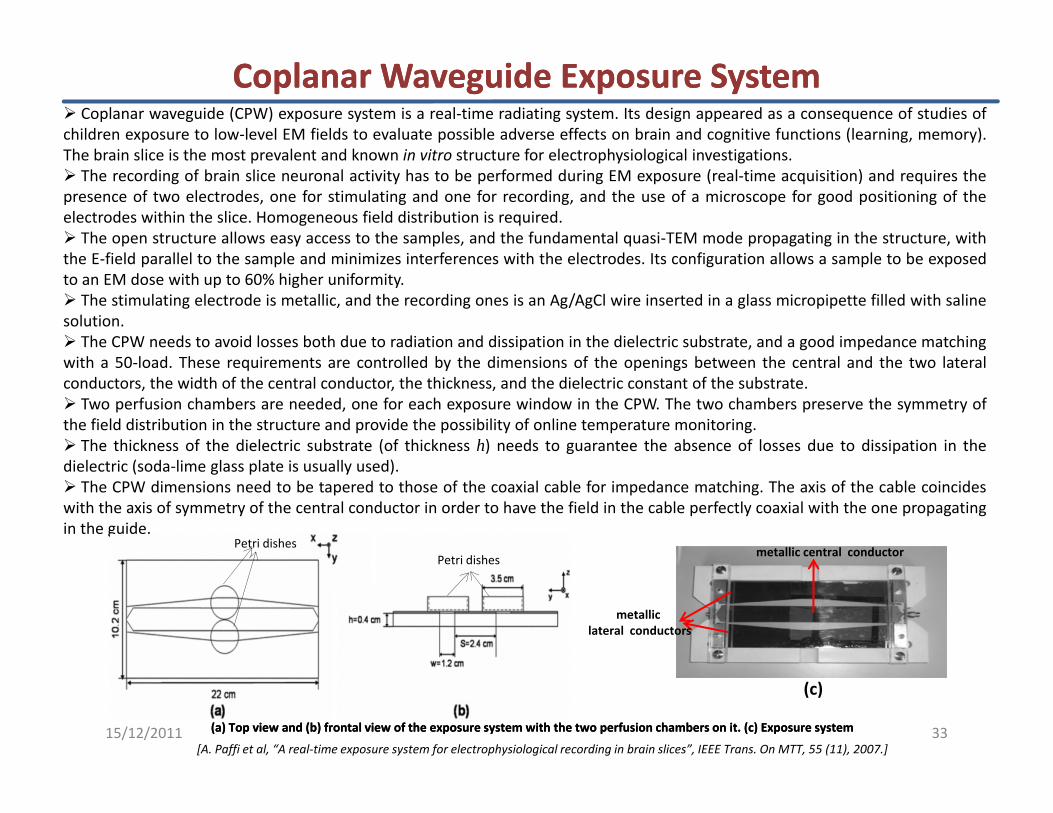
Coplanar Waveguide Exposure SystemCoplanar Waveguide Exposure SystemCoplanar waveguide (CPW) exposure system is a real‐time radiating system. Its design appeared as a consequence of studies of
children exposure to low‐level EM fields to evaluate possible adverse effects on brain and cognitive functions (learning, memory).Th b i li i th t l t d k i it t t f l t h i l i l i ti tiThe brain slice is the most prevalent and known in vitro structure for electrophysiological investigations.
The recording of brain slice neuronal activity has to be performed during EM exposure (real‐time acquisition) and requires thepresence of two electrodes, one for stimulating and one for recording, and the use of a microscope for good positioning of theelectrodes within the slice. Homogeneous field distribution is required.
The open structure allows easy access to the samples, and the fundamental quasi‐TEM mode propagating in the structure, withh fi ld ll l h l d i i i i f i h h l d fi i ll l b dthe E‐field parallel to the sample and minimizes interferences with the electrodes. Its configuration allows a sample to be exposedto an EM dose with up to 60% higher uniformity.
The stimulating electrode is metallic, and the recording ones is an Ag/AgCl wire inserted in a glass micropipette filled with salinesolution.
The CPW needs to avoid losses both due to radiation and dissipation in the dielectric substrate, and a good impedance matchingwith a 50‐load. These requirements are controlled by the dimensions of the openings between the central and the two lateralconductors, the width of the central conductor, the thickness, and the dielectric constant of the substrate.
Two perfusion chambers are needed, one for each exposure window in the CPW. The two chambers preserve the symmetry ofthe field distribution in the structure and provide the possibility of online temperature monitoring.
The thickness of the dielectric substrate (of thickness h) needs to guarantee the absence of losses due to dissipation in thedielectric (soda‐lime glass plate is usually used).
The CPW dimensions need to be tapered to those of the coaxial cable for impedance matching. The axis of the cable coincideswith the axis of symmetry of the central conductor in order to have the field in the cable perfectly coaxial with the one propagatingin the guide.
metallic central conductorPetri dishes
Petri dishes
metallic lateral conductors
Petri dishes
15/12/2011 33[A. Paffi et al, “A real‐time exposure system for electrophysiological recording in brain slices”, IEEE Trans. On MTT, 55 (11), 2007.]
(a) Top view and (b) frontal view of the exposure system with the two perfusion chambers on it. (c) Exposure system(a) Top view and (b) frontal view of the exposure system with the two perfusion chambers on it. (c) Exposure system
(c)
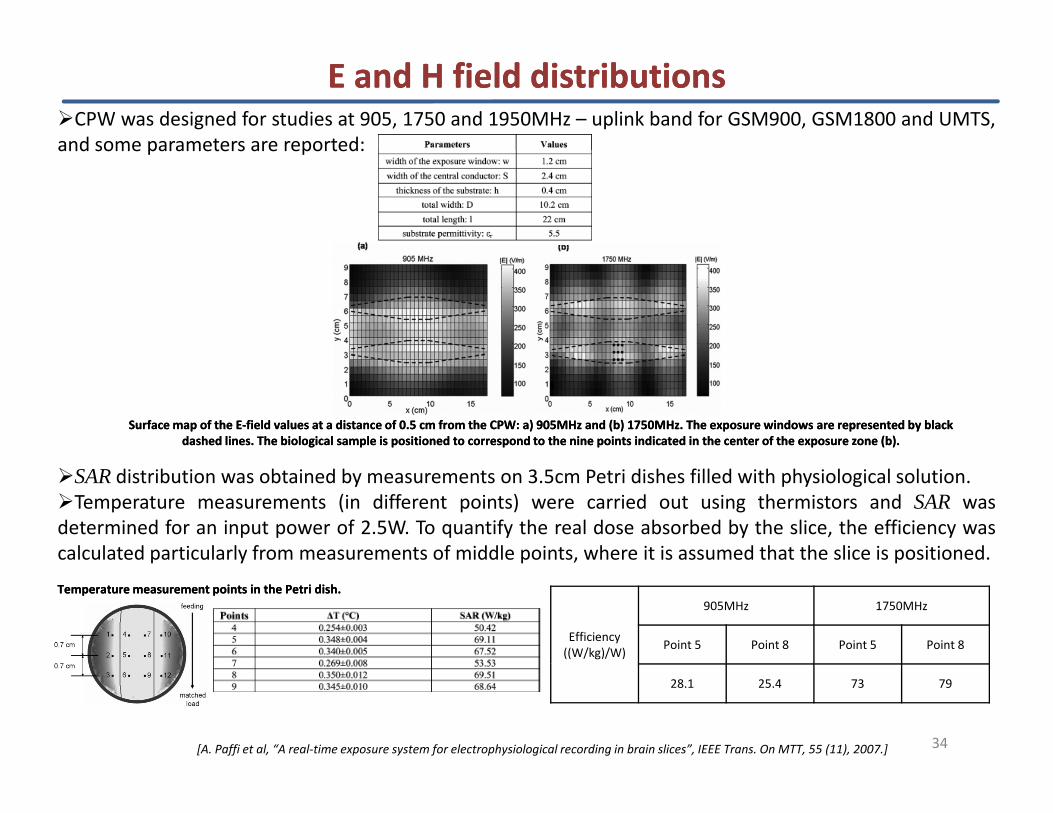
CPW was designed for studies at 905, 1750 and 1950MHz – uplink band for GSM900, GSM1800 and UMTS,and some parameters are reported:
E and H field distributionsE and H field distributions
and some parameters are reported:
Surface map of the ESurface map of the E‐‐field values at a distance of 0.5 cm from the CPW: a) 905MHz and (b) 1750MHz. The exposure windows are reprfield values at a distance of 0.5 cm from the CPW: a) 905MHz and (b) 1750MHz. The exposure windows are represented by black esented by black dashed lines. The biological sample is positioned to correspond to the nine points indicated in the center of the exposure zodashed lines. The biological sample is positioned to correspond to the nine points indicated in the center of the exposure zone ne (b).(b).
SAR distribution was obtained by measurements on 3.5cm Petri dishes filled with physiological solution.Temperature measurements (in different points) were carried out using thermistors and SAR was
determined for an input power of 2.5W. To quantify the real dose absorbed by the slice, the efficiency wascalculated particularly from measurements of middle points, where it is assumed that the slice is positioned.
Efficiency ((W/kg)/W)
905MHz 1750MHz
Point 5 Point 8 Point 5 Point 8
p y p , p
Temperature measurement points in the Petri dish.Temperature measurement points in the Petri dish.
28.1 25.4 73 7915/12/2011
34[A. Paffi et al, “A real‐time exposure system for electrophysiological recording in brain slices”, IEEE Trans. On MTT, 55 (11), 2007.]
ReferencesReferences1. D. Andreuccetti, M. Bini, A. Checcucci, A. Ignesti, L. Millanta, R. Olmi, N. Rubino, “Protezione dai campi elettromagnetici non
ionizzanti”, 3a Edizione, IROE “Nello Carrara” CNR, Firenze 2001.2 d i S i i i i G i l “ di f f i i il i2. L. Ardoino, V. Lopresto, S. Mancini, C. Marino, R. Pinto, G.A. Lovisolo, “A radio‐frequency system for in vivo pilot experiments
aimed at the studies on biological effects of electromagnetic fields”, Phys. Med. Biol., vol. 50, pp. 3643‐3654, 2005.3. B.F. Li, G.Z. Guo, D.Q. Ren, J. Li, D.D. Sun, Y. Wan, “Electromagnetic pulses induced fluctuation in arterial pressure without
changes in the heart rate in rats”, CEEM, 2006.4. P. Galloni, M. Parazzini, M. Piscitelli, R. Pinto, G.A. Lovisolo, G. Tognola, C. Marino, P. Ravazzani, “Electromagnetic fields from
mobile phones do not affect the inner auditory system of Sprague‐Dawley rats”, Rad. Research, vol 164, pp. 798‐804, 2005.5. M. S. Lozo, K. Malaric, “Use of GTEM‐cell and Wire Patch Cell in calculating thermal and non‐thermal biological effects of
electromagentic fields”, (“Advanced Microwave and Millimeter Wave Technologies Semiconductor Devices Circuits andSystems”), InTech, Chapter 28, pp. 573‐588, March 2010.
6. “Potential Adverse effects of GSM cellular phones on haring”‐GUARD Project (http://ec.europa.eu/research/quality‐of‐life/ka4/pdf/report_guard_en.pdf)
7. T. Iyama, H. Ebara, Y. Tarusawa, S. Uebayashi, M. Sekijima, T. Nojima, J. Miyakoshi, “Large scale in vitro experiment system for2GHz exposure”, Bioelectromagnetics, vol. 25, pp. 599‐606, 2004.
8. M. Sarti, “Elettromagnetismo computazionale e bioelectromagnetismo”9. M. Cavagnaro, “Dosimetria dei campi elettromagnetici”10. L. Ardoino, R. Pinto, S. Mancini, G.A. Lovisolo, F. Apollonio, G.D. D’Inzeo, “Progetto e realizzazione di sistemi espositivi per
esperimenti biologici”11. G.A. Lovisolo, R. Pinto, L. Ardoino, S. Mancini, “Dosimetria sperimentale: banco di test per dispositivi radiomobili e
caratterizzazione di sistemi espositivi per sperimentazione biologica”.12. Q. Balzano, C.K. Chou, R. Cicchetti, A. Faraone, R.Y.S. Tay, “An efficient RF exposure system with precise whole‐body average SAR
determination for in vivo animal studies at 900MHz”, IEEE trans. On MTT, vol. 48, no. 11, November 2000.13. A. Faraone, M. Ballen, G. Bit‐Babik, A.V. Gessner, M.Y. Kanda, M.L. Swicord, C.K. Chou, W. Luengas, S. Chebrolu, T. Babij, “RF
dosimetry for the Ferris‐Wheel mouse exposure system”,Motorola Labs ‐ Final Report, August 2004.14. A. Paffi, M. Pellegrino, R. Beccherelli, F. Apollonio, M. Liberti, D. Platano, G. Aicardi, G. D’Inzeo, “A real‐time exposure system
for electrophysiological recording in brain slices”, IEEE Trans on MTT, vol. 55, no.11, November 2007.
35
p y g g , , , ,15.15. AA.. PaffiPaffi,, FF.. ApollonioApollonio,, GG..AA.. LovisoloLovisolo,, CC.. Marino,Marino, RR.. Pinto,Pinto, MM.. RepacholiRepacholi,, MM.. LibertiLiberti,, “Considerations“Considerations forfor developingdeveloping anan RFRF
exposureexposure systemsystem:: AA reviewreview forfor inin vitrovitro biologicalbiological experiments”,experiments”, IEEEIEEE transtrans.. OnOn MTTMTT,, volvol.. 5858,, nono.. 1010,, OctoberOctober 20102010..
15/12/2011


