
Delivering energyresponsiblyCorporate Responsibility Report 2017
TRANSCANADA MAP
TABLE OF CONTENTS
CEO’S MESSAGE
WHO WE ARE
ABOUT THIS REPORT
WHAT CR MEANS TO US
A HEALTHY AND SAFE ENVIRONMENT AND COMMUNITY
AN ENGAGED COMMUNITY
A THRIVING ECONOMY
CAUTIONARY NOTE
APPENDIX
GRI G4 INDEX

CANADA
UNITED STATES
MEXICO
CALGARY
TORONTO
CHARLESTON
MEXICO CITY
HOUSTONNuclear Power Generation
Natural Gas Power Generation
Wind Power Generation
Under Construction
Liquids Tank Terminal
Regulated Natural Gas Storage
Liquids Pipeline
In Development/Construction
Natural Gas Pipeline
In Development/Construction
Unregulated Natural Gas Storage
April 2018
TransCanada today TRANSCANADA MAP
TABLE OF CONTENTS
CEO’S MESSAGE
WHO WE ARE
ABOUT THIS REPORT
WHAT CR MEANS TO US
A HEALTHY AND SAFE ENVIRONMENT AND COMMUNITY
AN ENGAGED COMMUNITY
A THRIVING ECONOMY
CAUTIONARY NOTE
APPENDIX
GRI G4 INDEX
TransCanada Corporate Responsibility Report 2017 02
TransCanada Corporate Responsibility Report 2017 03
CEO’S MESSAGE 04
WHO WE ARE 06
Our business at a glance 07
Our people 09
ABOUT THIS REPORT 10
Our priorities 11
Our approach to disclosure 15
Report profile 16
WHAT CORPORATE RESPONSIBILITY MEANS TO US 17
Our commitment 18
Our approach 19
Our impact 24
A HEALTHY AND SAFE ENVIRONMENT AND COMMUNITY 27
Integrity of pipelines and facilities 28
Emergency preparedness and response 36
Health and safety of communities, employees and contractors 39
Climate change and greenhouse gas emissions 42
AN ENGAGED COMMUNITY 47
Stakeholder engagement 48
Indigenous relations 50
Working with landowners 53
Employee attraction, retention and development 55
Community investment 57
A THRIVING ECONOMY 61
Financial performance 62
Economic benefits of development 65
Access to markets 68
CAUTIONARY NOTE 70
APPENDIX 72
GLOBAL REPORTING INITIATIVE G4 INDEX 75
Table of contents
Forward-looking statements
This Corporate Responsibility Report contains forward-looking statements and non-GAAP financial measures and includes information for the 2017 calendar year as well as relevant information up to December 31, 2017. Please see the “Cautionary note” for the statement regarding forward-looking information.
Our report also has links to websites owned and operated by third parties. When clicking on those links, users will leave our website. These links are provided for additional information and convenience only. TransCanada is not responsible for these websites or their content.
On the cover
Cover photo: Near Cushing, Oklahoma. As an energy infrastructure company with operations in three countries, we’re proud of the relationships we’ve built with close to 100,000 landowners across our pipeline and asset network. Learn more about our approach to working with landowners on our website.
TRANSCANADA MAP
TABLE OF CONTENTS
CEO’S MESSAGE
WHO WE ARE
ABOUT THIS REPORT
WHAT CR MEANS TO US
A HEALTHY AND SAFE ENVIRONMENT AND COMMUNITY
AN ENGAGED COMMUNITY
A THRIVING ECONOMY
CAUTIONARY NOTE
APPENDIX
GRI G4 INDEX

TransCanada Corporate Responsibility Report 2017 04
At TransCanada we have always strived to be a leader when it comes to safely delivering the energy millions of people rely on in an environmentally and socially responsible manner. We continued to build on this foundation in 2017, which was an exciting and challenging year for our company. We achieved record performance, while this past winter put our abilities to the test with extreme temperatures and record snowfall gripping communities across North America. I am pleased to say that our talented employees and contractors overcame the obstacles presented by the weather, reminding us of the important role they play in keeping the lights on, buildings warm and society moving forward.
As a trusted energy infrastructure company, we take our job very seriously. And with assets that traverse thousands of kilometres that have been in place for generations, we do more than just transport the energy products we all use every day. We also support jobs and generate long-term economic benefits across North America, while our thousands of employees and contractors play an active role in building healthy, vibrant and prosperous communities where we live and work.
I am pleased to share our 2017 Corporate Responsibility Report. It describes our performance in the areas that matter most to you, including safety, environmental protection, community investment and stakeholder engagement. We recognize that the continued success of our company depends on following through on the commitments we make to our neighbours, partners and communities. Part of how we achieve that is by listening to those who are involved with or affected by our business, and communicating candidly about our performance.
Preparing this report has helped us hold ourselves accountable for our performance, as well as identifying the work that still needs to be done. This edition of our report includes enhanced disclosure on key economic, social and environmental objectives and reflects input from Indigenous groups, landowners, employees, customers, environmental organizations, investors and community leaders on issues they are most interested. These include:
• Ensuring our pipelines and facilities operate safely every day.
• Minimizing our environmental footprint, addressing climate change and management of our greenhouse gas emissions.
• Fostering trust and respect through engagement and consultation with stakeholders, Indigenous groups and landowners where we propose projects and operate assets, creating long-term employment opportunities and economic benefits for their communities.
This is our second year producing a report that follows the Global Reporting Initiative’s (GRI) G4 core requirements, the most widely used comprehensive sustainability reporting standard in the world. Aligning our report with the GRI G4 core requirements helps to enhance our transparency and produce an effective, meaningful report.
We are proud to be recognized by respected third-party agencies for considering business decisions through the lens of sustainability. We were named to the Dow Jones Sustainability Index (DJSI) World Index for the 16th year in a row and earned a place on DJSI’s North American Sustainability Index for the fourth year in a row. Also, for the seventh consecutive year, we were listed among Canada’s Best 50 Corporate Citizens by Corporate Knights magazine and we have been acknowledged as a leader when it comes to enhancing gender equality and
CEO’s message
Russ Girling,President and Chief Executive Officer
TRANSCANADA MAP
TABLE OF CONTENTS
CEO’S MESSAGE
WHO WE ARE
ABOUT THIS REPORT
WHAT CR MEANS TO US
A HEALTHY AND SAFE ENVIRONMENT AND COMMUNITY
AN ENGAGED COMMUNITY
A THRIVING ECONOMY
CAUTIONARY NOTE
APPENDIX
GRI G4 INDEX

TransCanada Corporate Responsibility Report 2017 05
diversity throughout the organization. Our efforts to create a gender equal work environment was also recognized by the inaugural Bloomberg Gender Equality Index, where TransCanada was one of two energy companies to be named to the list. We were also recognized by CDP (formerly the Carbon Disclosure Project) for our actions to disclose carbon emissions and mitigate the business risks of climate change.
Safety is the first of our four core values and underpins everything we do. While we continue to achieve occupational and facility safety performance that is among the best in the industry, we fell short of the high standard we set for ourselves last year. In October we experienced the ultimate safety failure, an employee fatality. This is unacceptable and we are conducting a full investigation to determine the cause of this tragedy as well as to identify any and all steps we can take to prevent such incidents in the future. We remain committed to achieving our goal of zero incidents and ensuring that all of our employees and contractors return home safely every day. Parts of our company have achieved zero incidents for decades and we are focused on achieving that level of performance across every department and region in our organization.
What makes me most proud to be a member of TransCanada is how our employees come together, year after year, to help make a difference in the communities where we operate. In 2017, our team set a new company record for volunteer hours and financial contributions through our annual employee giving campaign. TransCanada employees rallied around their colleagues and the communities hit by natural disasters in parts of Canada, the U.S. and Mexico. They also continued to demonstrate our commitment to protecting the environment by working on many initiatives such as our work to restore natural habitat for the monarch butterfly across its migratory path between Mexico and Canada. With help from the Save Our Monarchs Foundation, our employees and
community volunteers gathered on TransCanada property in Michigan to plant thousands of native wildflowers across 1,600 hectares (4,000 acres) to attract monarchs and other pollinators. More sites are being planned for protection and restoration throughout 2018.
Looking forward, the world’s demand for energy is expected to continue to grow. Through the commitment of our team to living by our values of safety, integrity, responsibility and collaboration, we are well-positioned to be a preferred partner in the safe, reliable and sustainable delivery of that energy for decades to come.
Thank you for taking the time to learn more about our company. We are proud of the positive relationships we have made across North America, and we are committed to listening to what matters most to you. As you read through this report, we welcome you to ask us questions, tell us how we’re doing and let us know how we can improve.
Sincerely,
Russ Girling President and Chief Executive Officer
CEO’s messageTRANSCANADA MAP
TABLE OF CONTENTS
CEO’S MESSAGE
WHO WE ARE
ABOUT THIS REPORT
WHAT CR MEANS TO US
A HEALTHY AND SAFE ENVIRONMENT AND COMMUNITY
AN ENGAGED COMMUNITY
A THRIVING ECONOMY
CAUTIONARY NOTE
APPENDIX
GRI G4 INDEX

TransCanada Corporate Responsibility Report 2017 06
TRANSCANADA MAP
TABLE OF CONTENTS
CEO’S MESSAGE
WHO WE ARE
Our business at a glance
Our people
ABOUT THIS REPORT
WHAT CR MEANS TO US
A HEALTHY AND SAFE ENVIRONMENT AND COMMUNITY
AN ENGAGED COMMUNITY
A THRIVING ECONOMY
CAUTIONARY NOTE
APPENDIX
GRI G4 INDEX
Who we are
Guided by our values of safety, integrity, responsibility and collaboration, our people are deeply rooted in their communities and ensure that we develop and operate our facilities safely, reliably and with minimal impact on the environment.
TransCanada head office, Calgary, Alberta.

TransCanada Corporate Responsibility Report 2017 07
For over 65 years, TransCanada has proudly delivered the energy that millions of North Americans rely on to power their lives and fuel industry. Guided by our values of safety, integrity, responsibility and collaboration, our people are deeply rooted in their communities and ensure that we develop and operate our facilities safely, reliably and with minimal impact on the environment. We are committed to listening to our neighbours and working with all of our stakeholders to develop better project plans and create long-term opportunities and economic benefits in the communities where we operate across Canada, the U.S. and Mexico.
Three complementary energy infrastructure businesses
NATURAL GAS PIPELINES
Our 91,900-kilometre (57,100-mile) portfolio of natural gas pipelines transports more than 25 per cent of North America’s supply of clean-burning natural gas. This pipeline network strategically connects growing supply in the most prolific and lowest cost basins on the continent to key markets across Canada, the U.S. and Mexico. We also operate the continent’s largest natural gas storage business, with more than 650 billion cubic feet (Bcf) of regulated and unregulated storage capacity.
LIQUIDS PIPELINES
Our 4,900-kilometre (3,000-mile) liquids pipeline system connects growing continental oil supplies to key markets and refineries. The Keystone Pipeline System has long-term contracts to ship 555,000 barrels of crude oil per day (bbl/d) and delivers approximately 20 per cent of western Canadian exports to key refinery markets in the U.S. Midwest and Gulf Coast, where it is converted into fuel and other useful petroleum products. Keystone has delivered more than 1.6 billion barrels since it began operation in June 2010.
ENERGY
TransCanada owns or has interests in 11 power generation facilities with combined capacity of 6,100 megawatts (MW) – enough to power more than six million homes. More than one-half of the power we provide is generated from emission-less sources including nuclear and wind and we are leaders in the development and operation of high-efficiency, natural gas-fired power facilities.
Power Generation Mix
The information listed above on TransCanada’s three businesses is current as of December 31, 2017.
For further details about our business, including additional details on the scope, size and strategy of our operations, please refer to our 2017 Annual Report and our Business at a glance. TransCanada is traded on the TSX and NYSE.
Who we are
Our business at a glance
Our missionTo provide reliable supplies of energy across the continent—safely and responsibly. We are proud that millions of North Americans can depend on us for the energy they need.
Our visionTo be the leading energy infrastructure company in North America, focusing on pipeline and power generation opportunities where we have, or can develop, a significant competitive advantage.
Our valuesValues guide how we work, treat one another and interact with our stakeholders every single day. Our values are safety, integrity, responsibility and collaboration.
Wind 6%
Nuclear 51%
Natural Gas 43%6,100MW
TRANSCANADA MAP
TABLE OF CONTENTS
CEO’S MESSAGE
WHO WE ARE
Our business at a glance
Our people
ABOUT THIS REPORT
WHAT CR MEANS TO US
A HEALTHY AND SAFE ENVIRONMENT AND COMMUNITY
AN ENGAGED COMMUNITY
A THRIVING ECONOMY
CAUTIONARY NOTE
APPENDIX
GRI G4 INDEX

TransCanada Corporate Responsibility Report 2017 08
Our supply chain
We recognize that our supply chain plays a key role in our commitment to responsibility and we aim to build collaborative relationships with high-quality developers and suppliers. Our supply chain team identifies opportunities to strategically manage TransCanada’s spend and executes supply chain solutions that deliver total life cycle value.
We utilize contractors in all aspects of our business and work with thousands of suppliers across North America—from large international companies to small, local businesses. Our suppliers provide a wide range of materials and services, including manufacturing, construction, engineering, environmental programs, distribution and consulting, but a majority of our annual supply chain spend is for pipe manufacturing, construction, maintaining the fitness of our systems, and pipe integrity.
CHANGES TO OUR ASSET PORTFOLIO AND OPERATIONS IN 2017
Acquisitions and divestitures
In 2017 we achieved record financial performance as our base businesses performed well along with the successful integration of CPG assets and employees into our organization. We continue to build on a robust, low-risk strategy that generates significant value and provides a strong foundation for us to continue delivering results for our shareholders, our customers, our communities and our employees.
Other key developments to prudently finance our growth and deliver long-term shareholder value included the following:
• We placed approximately $5 billion in new facilities into service.
• We sold our 76-MW Ontario solar portfolio for $541 million, maximizing shareholder value by recycling capital into our growth portfolio.
• We sold our U.S. Northeast power generation assets, which included TC Hydro, Ravenswood, Ironwood, Ocean State Power and Kibby Wind, for total proceeds of US$3.1 billion, greatly reducing our exposure to the merchant power market.
Our capital program consists of approximately $23 billion of near-term projects and approximately $24 billion of commercially secured medium-to longer-term projects. This portfolio includes the US$8.3 billion Keystone XL and Keystone Hardisty Terminal projects, the $4.8 billion Coastal GasLink project to supply natural gas to LNG Canada’s proposed terminal facility in Kitimat, British Columbia and a $5.3 billion investment in the Bruce Power Life Extension Agreement post-2020. All of these projects are underpinned by long-term contracts.
Key operational changes
There were no key operational changes to our management systems in 2017.
Please see our Code of Business Ethics for more information about our commitment to the highest standards of ethics and corporate governance.
Who we are
Our business at a glanceTRANSCANADA MAP
TABLE OF CONTENTS
CEO’S MESSAGE
WHO WE ARE
Our business at a glance
Our people
ABOUT THIS REPORT
WHAT CR MEANS TO US
A HEALTHY AND SAFE ENVIRONMENT AND COMMUNITY
AN ENGAGED COMMUNITY
A THRIVING ECONOMY
CAUTIONARY NOTE
APPENDIX
GRI G4 INDEX

TransCanada Corporate Responsibility Report 2017 09
We attribute our success to more than 6,700 employees and 3,200 contract professionals who work on our behalf. From the corporate head office to our field operations, we actively seek out a wide range of candidates for all positions. Diverse backgrounds, culture, opinions, expertise and skills are what drives innovation and strengthens our teams.
Our commitment to an inclusive workforce is demonstrated with women, Indigenous groups, persons with disabilities, visible minorities and veterans being represented throughout the organization.
For information about our employee attraction, retention and development activities, including information about employee turnover, please refer to the Employee attraction, retention and development section. For a detailed breakdown of employee diversity numbers, please refer to the 2017 Corporate Responsibility Report Data Sheet.
Who we are
Our people
Employee breakdown 2013 2014 2015 2016 2017
Full-time employees (#) 5,437 6,059 5,512 7,147 6,771Canada 3,487 4,010 3,603 3,374 3,390U.S. 1,859 1,914 1,757 3,563 3,112Mexico 91 135 152 210 269
Contract professionals (#) 2,525 2,930 2,453 3,586 3,252
Employees represented by independent trade unions or covered by collective bargaining agreements (%) 4.5 4.3 4.7 5.1 4.6
Women in workforce (%) 29.5 31.5 30.5 27.5 28.0
Canada Diversity1 Analysis (%)Women 35.3 37.3 36.6 36.5 36.3Indigenous 2.0 1.8 2.5 2.4 2.4Persons with disabilities 1.6 2.0 3.4 3.2 3.1Visible minorities (excl. Indigenous) 15.8 18.7 20.6 20.6 21.7
U.S. Diversity1 Analysis (%)Women 18.6 19.3 18.3 18.7 18.7Minorities (incl. American Indians/Alaska Natives) 19.7 19.0 19.6 13.5 13.1Individuals with disabilities 0.8 1.2 3.1 2.1 2.1Veterans 9.4 9.7 10.5 7.1 6.4
Mexico Diversity1 Analysis (%)Women – 29.5 28.3 30.1 27.5
Note: This indicator is inclusive of all TransCanada assets where TransCanada has majority operating control, including CPG assets as of July 1, 2016. Employees represented by independent trade unions/bargaining agreements are inclusive of all TransCanada operations, except for CPG assets. 1 Diversity data is categorized by protected groups as defined by regional compliance requirements: in Canada under the Employment Equity Act and in the U.S. as a condition of the Office of Federal Contract Compliance Programs. There are no such compliance requirements in Mexico, however do we track and voluntarily report Mexico gender workforce representation.
TRANSCANADA MAP
TABLE OF CONTENTS
CEO’S MESSAGE
WHO WE ARE
Our business at a glance
Our people
ABOUT THIS REPORT
WHAT CR MEANS TO US
A HEALTHY AND SAFE ENVIRONMENT AND COMMUNITY
AN ENGAGED COMMUNITY
A THRIVING ECONOMY
CAUTIONARY NOTE
APPENDIX
GRI G4 INDEX

TransCanada Corporate Responsibility Report 2017 10
About this reportTRANSCANADA MAP
TABLE OF CONTENTS
CEO’S MESSAGE
WHO WE ARE
ABOUT THIS REPORT
Our priorities
Our approach to disclosure
Report profile
WHAT CR MEANS TO US
A HEALTHY AND SAFE ENVIRONMENT AND COMMUNITY
AN ENGAGED COMMUNITY
A THRIVING ECONOMY
CAUTIONARY NOTE
APPENDIX
GRI G4 INDEX We continue to build on a robust, low-risk strategy that generates significant value and provides a strong foundation for future growth.

TransCanada Corporate Responsibility Report 2017 11
This report—produced since 2001—provides us with the opportunity to comprehensively and transparently report on our economic, social and environmental performance. We define corporate responsibility (CR) as our “commitment to operating in an economically, socially and environmentally sustainable manner while recognizing the interests of our stakeholders.”
A key element of our corporate responsibility reporting process is the concept of materiality. We define materiality in the context of corporate responsibility reporting as the economic, environmental and social issues most important to our stakeholders. This is different from financial materiality, which is the threshold for influencing the economic decisions of investors. Material corporate sustainability topics are not limited to issues that could affect an investor’s decision to invest in TransCanada if information pertaining to the issue was omitted or misstated.
We conducted our first materiality analysis in 2012. Because our business strategy, the energy landscape and stakeholder expectations have shifted since then, we conducted another refreshed materiality analysis in 2016 to ensure we are focused on those topics most important to our business and stakeholders.
Based on this analysis, we refreshed our top 10 material topics that are grouped into three key corporate responsibility pillars: a healthy and safe environment and community, an engaged community, and a thriving economy.
The following table details TransCanada’s scope (the range of material topics) and boundaries (where impacts occur and our involvement with the impacts), and their alignment to our corporate responsibility pillars:
Material topic
Integrity of pipelines and facilities
Emergency preparedness and response
Health and safety of communities, employees and contractors
Climate change and greenhouse gas emissions
TransCanada’s definition
Our ability to construct and operate our pipelines and facilities safely and reliably every day.
Our ability to plan, practise and collaborate to respond to incidents and unplanned events quickly and efficiently.
Our promotion and implementation of a culture and actions that prevent safety incidents that impact people.
Our approach to climate change and management of our own greenhouse gas emissions.
Management approach: scope and boundary1 inside the organization
All TransCanada assets where TransCanada has direct operating control in Canada, the U.S. and Mexico
All TransCanada assets where TransCanada has direct operating control in Canada, the U.S. and Mexico
All TransCanada assets where TransCanada has direct operating control in Canada, the U.S. and Mexico
All TransCanada assets where TransCanada has direct operating control in Canada, the U.S. and Mexico
Scope and boundary2 outside the organization Community residentsLandownersContract and service providersRegulators Customers
Emergency respondersRegulatorsLandowners
Contract and service providers RegulatorsCommunity residents
RegulatorsGovernmentIndigenous groupsPublic
1 Please note that this scope and boundary is applicable to the management of the material topic only. Data for specific performance indicators may omit certain asset types or locations; footnotes are provided in these instances.2 Material topics can be impacted by organizations and individuals that are not included in TransCanada’s consolidated financial statements, including participants in TransCanada’s value chain.
About this report
Our priorities
CR pillar A healthy and safe environment and community
TRANSCANADA MAP
TABLE OF CONTENTS
CEO’S MESSAGE
WHO WE ARE
ABOUT THIS REPORT
Our priorities
Our approach to disclosure
Report profile
WHAT CR MEANS TO US
A HEALTHY AND SAFE ENVIRONMENT AND COMMUNITY
AN ENGAGED COMMUNITY
A THRIVING ECONOMY
CAUTIONARY NOTE
APPENDIX
GRI G4 INDEX

TransCanada Corporate Responsibility Report 2017 12
About this report
Our priorities
TransCanada’s definition
Our ability to foster mutual trust and respect through engagement and consultation with stakeholders where we propose projects and operate assets.
Our ability to foster mutual trust and respect through engagement and consultation with Indigenous groups where we propose projects and operate assets.
Our ability to engage with landowners in a positive and consistent manner.
Our ability to demonstrate the value of investing in and giving back to the communities where we live, work and operate.
Our ability to foster a diverse and inclusive workplace and maintain the talent, skills and expertise of our people required today and in the future.
Management approach: scope and boundary1 inside the organization
All TransCanada assets where TransCanada has direct operating control in Canada, the U.S. and Mexico
All TransCanada assets where TransCanada has direct operating control in Canada, the U.S. and Mexico
All TransCanada assets where TransCanada has direct operating control in Canada, the U.S. and Mexico
All TransCanada assets where TransCanada has direct operating control in Canada, the U.S. and Mexico
All TransCanada assets where TransCanada has direct operating control in Canada, the U.S. and Mexico
Scope and boundary 2 outside the organization Community residents Indigenous groups Landowners Regulators
Community residents Indigenous groups Landowners Regulators
Community residents Indigenous groups Landowners Regulators
Landowners Indigenous groups Community residents Community investment partners
Contract and service providers Community residents
Material topic
Stakeholder engagement
Indigenous relations
Working with landowners
Community investment
Employee attraction, retention and development
CR Pillar An engaged community
1 Please note that this scope and boundary is applicable to the management of the material topic only. Data for specific performance indicators may omit certain asset types or locations; footnotes are provided in these instances.2 Material topics can be impacted by organizations and individuals that are not included in TransCanada’s consolidated financial statements, including participants in TransCanada’s value chain.
TRANSCANADA MAP
TABLE OF CONTENTS
CEO’S MESSAGE
WHO WE ARE
ABOUT THIS REPORT
Our priorities
Our approach to disclosure
Report profile
WHAT CR MEANS TO US
A HEALTHY AND SAFE ENVIRONMENT AND COMMUNITY
AN ENGAGED COMMUNITY
A THRIVING ECONOMY
CAUTIONARY NOTE
APPENDIX
GRI G4 INDEX

TransCanada Corporate Responsibility Report 2017 13
About this report
Our priorities
TransCanada’s definition
Our ability to manage the long-term financial stability, competitiveness and return expected by our shareholders in consideration of business risks and opportunities.
Our ability to bring job opportunities and financial benefits to communities across North America.
Our ability to construct and operate new pipeline assets to enhance access to markets for our customers, which contributes to North American energy security.
Management approach: scope and boundary1 inside the organization
All TransCanada assets where TransCanada has direct operating control in Canada, the US and Mexico
All TransCanada assets where TransCanada has direct operating control in Canada, the U.S. and Mexico
All liquids and natural gas pipeline assets in Canada where TransCanada has direct operating control
Scope and boundary2 outside the organization Shareholders Customers
Contract and service providers Community residents Local businesses Government
Customers Regulators Government NGOs Indigenous groups Media
Material topic
Financial performance
Economic benefits of development
Access to markets
CR Pillar A thriving economy
1 Please note that this scope and boundary is applicable to the management of the material topic only. Data for specific performance indicators may omit certain asset types or locations; footnotes are provided in these instances.2 Material topics can be impacted by organizations and individuals that are not included in TransCanada’s consolidated financial statements, including participants in TransCanada’s value chain.
Outside of our top 10 material topics, we continue to identify, monitor, manage and communicate on other corporate responsibility issues—such as biodiversity, water protection, regulatory compliance, ethics, governance and diversity—that are important to our stakeholders and business. Our performance on
some of these issues is included in this report, and we provide further details on our website at www.transcanada.com. For example, details about our commitment and approach to protecting water along a proposed pipeline route are available in our online Crossing water safely fact sheet.
TRANSCANADA MAP
TABLE OF CONTENTS
CEO’S MESSAGE
WHO WE ARE
ABOUT THIS REPORT
Our priorities
Our approach to disclosure
Report profile
WHAT CR MEANS TO US
A HEALTHY AND SAFE ENVIRONMENT AND COMMUNITY
AN ENGAGED COMMUNITY
A THRIVING ECONOMY
CAUTIONARY NOTE
APPENDIX
GRI G4 INDEX

TransCanada Corporate Responsibility Report 2017 14
Materiality analysis
By conducting materiality analyses, we are able to better identify and prioritize the issues that matter most to our business and stakeholders.
Our materiality analysis process follows the recommended practices outlined by the GRI and largely focuses on prioritizing the following:
• Topics that TransCanada has an impact on due to the nature and location of activities.
• Topics that influence stakeholders’ perceptions of or actions toward TransCanada.
• Topics that could have a positive or negative impact on TransCanada’s ability to generate short- and long-term value.
Since conducting our first materiality analysis in 2012, we have regularly reviewed our material topics and updated them to reflect any notable changes.
Our analysis also included direct engagement with select external stakeholders to find out what matters most to them about corporate responsibility and how to effectively communicate our performance on corporate responsibility topics. These stakeholders included landowners, community investment partners,
community leaders, suppliers, peers and customers as well as representatives from Indigenous groups who were invited to share their perspectives through interviews and surveys. We also asked employees to participate in a survey and conducted interviews with select senior leadership and board members to further understand those corporate responsibility topics that are most important to them and pose the greatest risks and opportunities for our business.
Our goal is to conduct a materiality assessment every two to three years.
Materiality Process
About this report
Our priorities
VALIDATE RESEARCH
INTERVIEWSIDENTIFY
SURVEYS
MATERIALITY PROCESS
Research and stakeholder identification
Interviews with internal and external stakeholders
Surveys with internal and external stakeholders
Top 10 material issues identified
Validate material issues with stakeholders
TRANSCANADA MAP
TABLE OF CONTENTS
CEO’S MESSAGE
WHO WE ARE
ABOUT THIS REPORT
Our priorities
Our approach to disclosure
Report profile
WHAT CR MEANS TO US
A HEALTHY AND SAFE ENVIRONMENT AND COMMUNITY
AN ENGAGED COMMUNITY
A THRIVING ECONOMY
CAUTIONARY NOTE
APPENDIX
GRI G4 INDEX

TransCanada Corporate Responsibility Report 2017 15
One of the key findings from our latest materiality analysis is that our reporting needs to be more focused and meaningful to our stakeholders. In 2017 we engaged an external third party to analyze sections of our 2016 Corporate Social Responsibility (CSR) report and identify opportunities to better align our reporting with the GRI’s G4 guidelines. These guidelines place a greater emphasis on the most critical corporate responsibility impacts and issues, resulting in a clearer and more strategic, balanced, transparent and reliable report that better meets the needs and expectations of stakeholders.
This is the second year we are reporting based on the GRI’s G4 core option guidelines, including the disclosures in the oil and gas sector supplement. We have improved the quality of the report by enhancing our management approach disclosure on the topic of climate change and greenhouse gases (GHGs) and including new information on topics like supply chain and working with landowners.
This year we also engaged more extensively with internal subject matter experts to select more informative performance indicators—qualitative or quantitative information about results or outcomes—and enhanced documentation of our performance data. TransCanada’s work to continuously improve our reporting is ongoing.
While these improvements are designed to make our Corporate Responsibility Report a more meaningful communications tool for all audiences, we will continue to engage key stakeholders, Indigenous groups and landowners through a number of avenues to gather feedback about our performance on our material and other corporate responsibility topics. These include community open houses and town halls, regulatory meetings, investor meetings and our website, which provides timely access to the latest news and information on TransCanada.
To help us continually improve, we invite all stakeholders and interested parties to provide feedback on this report or any other facet of our performance. Please email us at [email protected] or visit the Contact page on our website for additional ways to reach out to us.
About this report
Our approach to disclosureTRANSCANADA MAP
TABLE OF CONTENTS
CEO’S MESSAGE
WHO WE ARE
ABOUT THIS REPORT
Our priorities
Our approach to disclosure
Report profile
WHAT CR MEANS TO US
A HEALTHY AND SAFE ENVIRONMENT AND COMMUNITY
AN ENGAGED COMMUNITY
A THRIVING ECONOMY
CAUTIONARY NOTE
APPENDIX
GRI G4 INDEX
As part of our commitment to responsible development, we continue to engage key stakeholders, Indigenous groups and landowners through a number of mediums—such as open houses—to gather feedback about our performance and discuss issues that matter the most to them.

TransCanada Corporate Responsibility Report 2017 16
About this report
Report profile
INDICATOR: Throughout this report, this icon references performance indicators related to our material topics. GRI G4 indicators (e.g., G4-EN24) are referenced, where applicable. All other indicators are TransCanada-specific performance indicators.
Report profile
This report covers our management of material topics for the 2017 calendar year for assets where TransCanada has direct operating control. We include climate change and GHG emissions information and data for the Bruce Power nuclear power generation facility, which is a non-operated asset. However, we do not include Bruce Power information for any other material topics because the management of these assets is not under our direct operational control.
TransCanada reports our performance on an annual basis. This report covers performance for the 2017 calendar year and has been re-titled ‘Corporate Responsibility Report’ to better reflect reporting that covers the full range of environmental, social, and economic issues addressed by our work. The production cycle for this year’s report was accelerated to better align our sustainability reporting schedule with annual financial reporting. Content collection and review for this report occurred between January and February, followed by development—in consultation with subject matter experts—through March, and ending with management and executive review in April.
Performance data for specific indicators may not be inclusive of all assets. Footnotes are included to note any data and material disclosures that vary from this report’s scope, boundary or reporting period.
All financial figures are expressed in Canadian dollars unless otherwise noted.
Under the GRI G4 core option guidelines, we disclose specific standard disclosures related to our identified material topics and disclosures on management approach and/or indictors. Indicators are noted throughout the report and in our companion document for stakeholders, the 2017 Corporate Responsibility Report Data Sheet. The GRI Index states which disclosures we are reporting on and our data sheet includes details on our performance.
Limited external assurance will be provided on some GHG emissions data available in our 2017 CDP report. Other indicators that have been externally assured are noted in the footnotes. TransCanada does not have a policy for assurance of the data included in this report.
In 2017, there were two corrections to data reporting. Investments as a percentage of total revenue were misstated due to a typographical error in TransCanada’s 2016 CSR Report. The number of reportable gas releases were also misstated due to a calculation error. Accurate values were reported in TransCanada’s 2016 CSR Data Sheet and have been corrected in the 2017 Corporate Responsibility report. The effect of this re-statement is not considered material.
All documents referenced throughout this report and copies of our previous Corporate Responsibility Reports can be found on our website.
TRANSCANADA MAP
TABLE OF CONTENTS
CEO’S MESSAGE
WHO WE ARE
ABOUT THIS REPORT
Our priorities
Our approach to disclosure
Report profile
WHAT CR MEANS TO US
A HEALTHY AND SAFE ENVIRONMENT AND COMMUNITY
AN ENGAGED COMMUNITY
A THRIVING ECONOMY
CAUTIONARY NOTE
APPENDIX
GRI G4 INDEX

TRANSCANADA MAP
TABLE OF CONTENTS
CEO’S MESSAGE
WHO WE ARE
ABOUT THIS REPORT
WHAT CR MEANS TO US
Our commitment
Our approach
Our impact
A HEALTHY AND SAFE ENVIRONMENT AND COMMUNITY
AN ENGAGED COMMUNITY
A THRIVING ECONOMY
CAUTIONARY NOTE
APPENDIX
GRI G4 INDEX
What corporate responsibility means to us
TransCanada Corporate Responsibility Report 2017 17
It’s not just what we do that’s important, it’s how we do it. We know that long-term success depends on our ability to balance safety, profitability and social and environmental responsibility. When we get that balance right, the communities where we operate benefit from our presence.
Keystone Pipeline right-of-way, Oklahoma, USA.

TransCanada Corporate Responsibility Report 2017 18
Surveying the right-of-way for the Northern Courier Pipeline, near Fort McMurray, Alberta.Our approach helps us to responsibly manage and minimize our environmental footprint in everything we do. That means we are always working to reduce our land disturbance, carbon intensity, energy consumption and water use throughout the life cycle of our assets.
What corporate responsibility means to us
Our commitment
We strive to safely deliver the energy society needs in an economically, socially and environmentally sustainable manner, while recognizing the interests of our stakeholders. Everything we do, from planning new pipelines to understanding community concerns, to investing in a balanced and sustainable energy future reflects our core values of safety, integrity, responsibility and collaboration.
Even though the energy landscape is changing, our facilities are in place for generations and we are unwavering in our commitment to:
• The safety of our workplace, communities and our assets.
• Protecting land, air, water and wildlife.
• Building relationships in the communities where we work.
• Respecting Indigenous groups, traditions and lands.
We also comply with all federal, provincial and state laws and regulations governing the management of health and safety, environment, land use and other material parts of our business. Pipelines are subject to strict regulations by a number of regulating bodies. We operate in one of the world’s most transparent and robust regulatory environments that provides stringent regulations for the entire life cycle of an energy infrastructure asset.
By engaging stakeholders, Indigenous groups and landowners early and often, listening, providing accurate information, and responding to inquiries in a prompt and consistent manner we can better understand what matters most to our stakeholders throughout the life cycle of our assets.
TRANSCANADA MAP
TABLE OF CONTENTS
CEO’S MESSAGE
WHO WE ARE
ABOUT THIS REPORT
WHAT CR MEANS TO US
Our commitment
Our approach
Our impact
A HEALTHY AND SAFE ENVIRONMENT AND COMMUNITY
AN ENGAGED COMMUNITY
A THRIVING ECONOMY
CAUTIONARY NOTE
APPENDIX
GRI G4 INDEX

TransCanada Corporate Responsibility Report 2017 19
We work to manage both strategic and operational risks linked to our material topics.
To better understand these risks and improve our approach to managing them, we build risk assessments into our decision-making process at all levels, listen to our stakeholders’ concerns and collaborate with our industry peers. This holistic approach reflects our corporate values of safety, integrity, responsibility and collaboration, and is central to our ability to make important decisions about our business and operations as well as to manage our impacts on the environment and communities where we work.
THE ROLE OF STRATEGIC RISK MANAGEMENT
Through risk identification and assessment, we are able to better understand our risk exposure, make more informed business decisions, and develop strategies for monitoring, mitigating and preventing impacts on people, communities and our organization.
For more information about our governance of and approach to risk management, please refer to page 83 of our 2017 Annual Report.
THE ROLE OF A MANAGEMENT SYSTEM
TransCanada’s Operational Management System (TOMS) provides a framework for how our assets are designed, constructed, operated and decommissioned to ensure the safety, security and protection of our people, property, physical assets and the environment. This approach assures that the principles and requirements that drive consistent, effective and efficient business results are followed and that company policy and regulatory requirements are met.
TOMS is modelled after international standards, such as ISO 14001 and OHSAS 18001, conforms to external industry consensus standards and voluntary programs, and complies with applicable legislative requirements. Through the “plan, do, check, act” cycle of our management system, we can improve our day-to-day activities and achieve performance requirements and targets. The TOMS continual improvement cycle enables us to:
• Comprehensively assess the operational risks of our businesses.
• Develop programs, standards and procedures to address those risks.
• Identify appropriate goals, objectives and targets for risk reduction or performance improvement.
• Periodically report on performance, incidents and non-conformances.
• Identify root causes and corrective actions to prevent recurrences of incidents and non-conformances.
• Further refine our management system over time.
What corporate responsibility means to us
Our approachTRANSCANADA MAP
TABLE OF CONTENTS
CEO’S MESSAGE
WHO WE ARE
ABOUT THIS REPORT
WHAT CR MEANS TO US
Our commitment
Our approach
Our impact
A HEALTHY AND SAFE ENVIRONMENT AND COMMUNITY
AN ENGAGED COMMUNITY
A THRIVING ECONOMY
CAUTIONARY NOTE
APPENDIX
GRI G4 INDEX

TransCanada Corporate Responsibility Report 2017 20
CONTINUALIMPROVEMENT
The management system will continue to change and evolve, ensuring we stay relevant while driving business value.
GOVERNANCE
How the organization is directed and monitored to assure its core purpose.
ELEMENTSNine foundational elements set the common principles and requirements that must be addressed, driving consistent and better business results.
1 Leadership Commitment & Strategy
2 Risk Management
3 Operational Controls
4 Roles, Responsibilities & Competency
5 Management of Change
6 Information Management
7 Compliance
8 Incident & Nonconformance Management
9 Performance Monitoring, Audit & Management Review
TOMS
Con
tinua
l Im
prov
emen
t
Continual Improvement
GO
VE
RN
AN
CE
SAFE, RELIABLE & RESPONSIBLE
OPERATIONS
CONSTRUCT OPERATE DECOMMISSIONDESIGN
Centralized technical requirements, standards, and assurance functions and services.
BUSINESS UNITS
CO
RP
OR
AT
E P
OL
ICIE
S &
CO
MM
ITM
EN
T S
TAT
EM
EN
TS
PLAN
DOACT
CHECK
TECHNICAL CENTRE & PROJECTS
ENERGY
CORPSERVICES
LIQUIDS
GAS
1 2 3 4 5 6 7 8 9
ELEMENTSM
AN
DA
TED
PR
OG
RA
MS
STA
ND
AR
DS
SPEC
IFIC
ATI
ON
S
PR
OC
ED
UR
ES
What corporate responsibility means to us
Our approachTRANSCANADA MAP
TABLE OF CONTENTS
CEO’S MESSAGE
WHO WE ARE
ABOUT THIS REPORT
WHAT CR MEANS TO US
Our commitment
Our approach
Our impact
A HEALTHY AND SAFE ENVIRONMENT AND COMMUNITY
AN ENGAGED COMMUNITY
A THRIVING ECONOMY
CAUTIONARY NOTE
APPENDIX
GRI G4 INDEX
Framework of TOMS, our single management system

TransCanada Corporate Responsibility Report 2017 21
What corporate responsibility means to us
Our approach
Health, Safety and Environment (HSE) governance and assurance activities
Our governance structure guides us to make the decisions about how our business operates. Accountability for our Health, Safety and Environment Commitment Statement lies with our CEO and is supported by our board through the HSE Committee.
Notable 2017 activities
Of the 231,515 Tier 1 Regulatory Preventive Maintenance activities planned for completion in 2017, 99.56 per cent were completed on time. The remaining 0.44 per cent were reviewed by management to understand the potential impact. All were determined to be low risk.
There were 939 Tier 2 inspections scheduled in 2017, and 100 per cent were completed.
No activities were planned or conducted in 2017.
One audit was planned and executed by QMI-SAI Canada (a third party) to evaluate HSE programs across TransCanada’s gas, liquids and energy business throughout North America. In addition, the National Energy Board (NEB) planned and conducted an audit of the Emergency Management Program on the Keystone assets in Canada.
HSE tier Tier 1 activities: These are the foundation of our HSE governance and entail fundamental workplace safety activities conducted by field and/or office employees on a daily, weekly and monthly basis. Examples are site facility and equipment inspections, and routine general maintenance tasks.
Tier 2 activities: Planned workplace and facility inspections to identify hazards—including physical conditions of the workplace—and review documents, records and compliance with applicable regulations.
Tier 3 internal audits: Triennial assessments of TransCanada’s HSE programs across various assets through internal operational audits.
Tier 4 external agencies: Quality assurance and quality control assessment of TransCanada’s HSE governance process through independent regulatory inspections and audits.
To assist TransCanada and its business entities in ensuring that HSE governance and due diligence requirements are monitored, measured, met and modified appropriately, we utilize a four-tier assurance approach:
For further details on our HSE governance, please refer to page 84 of our 2017 Annual Report.
TRANSCANADA MAP
TABLE OF CONTENTS
CEO’S MESSAGE
WHO WE ARE
ABOUT THIS REPORT
WHAT CR MEANS TO US
Our commitment
Our approach
Our impact
A HEALTHY AND SAFE ENVIRONMENT AND COMMUNITY
AN ENGAGED COMMUNITY
A THRIVING ECONOMY
CAUTIONARY NOTE
APPENDIX
GRI G4 INDEX

TransCanada Corporate Responsibility Report 2017 22
Community Investment
Partners
Landowners
Community Residents
Joint Venture Partners
Local Businesses
Contract and Service
Providers
Industry Associations
Customers
Indigenous Groups
Media
Educators
Human Health and Wellness
Providers
Non-Governmental Organizations
Emergency Responders
Government RegulatorsEmployees Shareholders
The role of engagement with stakeholders, Indigenous groups and landowners
We strive to engage stakeholders, Indigenous groups and landowners early and often and we listen to them through both formal and informal engagement. By transparently sharing information and seeking their input on proposed projects, ongoing operations, and our corporate responsibility activities and reporting, we are better equipped to make the right decisions for our business and better manage our material topics.
TransCanada’s stakeholders
An overview of our stakeholders—who we generally define as those people or groups that significantly affect or may be affected by our business activities,
be it directly or indirectly—is detailed in the accompanying graphic. Because Indigenous groups have distinct rights, we consider these groups to be separate from other stakeholders. Our approach to engagement with stakeholders, Indigenous groups and landowners is discussed below.
For further details on our approach, please refer to the Stakeholder engagement, Indigenous relations and Working with landowners sections of the report.
For the discussion covering our engagement with stakeholders to determine our material topics, please refer to the About this report—materiality analysis section.
What corporate responsibility means to us
Our approachTRANSCANADA MAP
TABLE OF CONTENTS
CEO’S MESSAGE
WHO WE ARE
ABOUT THIS REPORT
WHAT CR MEANS TO US
Our commitment
Our approach
Our impact
A HEALTHY AND SAFE ENVIRONMENT AND COMMUNITY
AN ENGAGED COMMUNITY
A THRIVING ECONOMY
CAUTIONARY NOTE
APPENDIX
GRI G4 INDEX
TransCanada Corporate Responsibility Report 2017 23
What corporate responsibility means to us
Our approach
The role of dialogue and participation with policy-makers and industry groups
We work continuously to build and maintain positive and constructive relationships with governments and regulators to obtain and maintain support for our activities and initiatives. We also work closely with industry organizations to improve our performance and to define, share and implement leading safety, environmental and socio-economic practices.
TransCanada engages in the public policy process by participating in direct advocacy before governments, including support of the political process through political contributions where permitted by law. In order to ensure that our advocacy efforts are in compliance with legal requirements and consistent with our core values, we have several policies pertaining to lobbying activities and political contributions, each of which applies to all directors, officers and employees as well as contractors.
Our memberships in industry organizations—such as the Canadian Energy Pipeline Association (CEPA), the Canadian Electricity Association, the Association of Oil Pipelines, and the Interstate Natural Gas Association of America (INGAA)—are primarily for sharing knowledge and discussing technical and industry standards. While these organizations may participate in or lead lobbying activities, our membership does not necessarily signify comprehensive support for all positions undertaken by the organizations.
For information about our 2017 political contributions and further details, please refer to Oversight and policies on lobbying, political contributions and corporate memberships in the Appendix.
The role of technology management
Our pipelines, oil and gas facilities and power plants are some of the most technologically advanced in the industry. We have one of the industry’s largest research and development (R&D) programs and we are among Canada’s top 100 corporate R&D spenders, according to Research Infosource Inc.
Since 2013, we have dedicated approximately $150 million toward technology development to support an internal research program as well as joint partnerships. We collaborate with industry associations and peers, academia, government and non-governmental organizations in Canada, the U.S. and Mexico to enhance the safety, efficiency and reliability of our pipeline construction and operations.
Our R&D activities focus on technology advancements in the areas of in-line inspection, cathodic protection, leak detection and coating technology, as well as methane reduction, remediation, and wildlife conservation. We support research that benefits many areas of our business, such as gas quality, flow efficiency, safety and environment, as well as facilities and measurement.
As a part of our ongoing efforts in supporting R&D and innovation, in 2017 TransCanada committed to invest up to US$25 million in Energy Impact Partners, a collaborative strategic investment firm that invests in innovative technologies, services and products throughout the electricity supply chain from generation to consumption. Our investment provides capital for leading-edge technologies around energy efficiency and moving to a lower carbon economy. Our involvement with Energy Impact Partners will provide us with better understanding of how our industry might be affected by emerging and disruptive technologies and gives us access to real-time feedback on the strategic interest in various technologies from the other partners.
TRANSCANADA MAP
TABLE OF CONTENTS
CEO’S MESSAGE
WHO WE ARE
ABOUT THIS REPORT
WHAT CR MEANS TO US
Our commitment
Our approach
Our impact
A HEALTHY AND SAFE ENVIRONMENT AND COMMUNITY
AN ENGAGED COMMUNITY
A THRIVING ECONOMY
CAUTIONARY NOTE
APPENDIX
GRI G4 INDEX

TransCanada Corporate Responsibility Report 2017 24
What corporate responsibility means to us
Our impact
TransCanada’s pipelines, storage facilities and power generating stations provide the energy that millions of people across Canada, the U.S. and Mexico rely on every day. Guided by our values of safety, integrity, responsibility and collaboration, our people are deeply rooted in their communities and ensure that we develop and operate our facilities safely, reliably and with minimal impact on the environment. We are committed to listening to our neighbours and working with all of our stakeholders to develop better project plans and create long-term opportunities and economic benefits in the communities where we operate. To achieve our vision of being the leading energy infrastructure company in North America, we recognize the importance of operating in a responsible manner while creating value for society.
Our operations are associated with a number of direct and indirect impacts and benefits to communities and the environment, all of which are of interest to our business and our key stakeholders.
Among our positive impacts are job creation, business opportunities for local suppliers, the broader local economic stimulation associated with project development, energy security, benefits such as tax revenue and community investment activities related to our ongoing presence in local communities.
Through our pipelines that deliver natural gas—the cleanest burning fossil fuel—we support the shift from coal to lower-carbon energy sources. In North America, we transport more than 25 per cent of the continent’s growing natural gas supply, and we are playing a key role in developing the growing liquified natural gas (LNG) export industry.
Our position as a leading transporter of North America’s growing crude oil supply was strengthened in 2017 as the Grand Rapids and Northern Courier pipelines came into service, adding 550 kilometres (342 miles) of strategic liquids pipelines in the Athabasca region of Alberta.
Thornbury Pump Station, Grand Rapids Pipeline, northern Alberta.
TRANSCANADA MAP
TABLE OF CONTENTS
CEO’S MESSAGE
WHO WE ARE
ABOUT THIS REPORT
WHAT CR MEANS TO US
Our commitment
Our approach
Our impact
A HEALTHY AND SAFE ENVIRONMENT AND COMMUNITY
AN ENGAGED COMMUNITY
A THRIVING ECONOMY
CAUTIONARY NOTE
APPENDIX
GRI G4 INDEX

TransCanada Corporate Responsibility Report 2017 25
What corporate responsibility means to us
Our impact
We also face challenges and must manage the impacts and risks inherent in our business. Pipelines are the safest and most efficient way to transport large volumes of oil and gas; however, incidents that impact the health and safety of our employees and contractors, communities and the environment can occur. Stakeholders are also concerned about releases that have the potential to impact waterways and land.
In addition, there are broader societal concerns about the impacts that the oil and natural gas we transport have on climate change. We recognize the significance of climate change and the key relationship between this issue and the energy sector, and we acknowledge our role in the larger energy system, including our own emission of GHGs. We are committed to managing our GHG emissions, focusing on our carbon intensity, and we integrate climate considerations in our overall business strategy. The growing demand to transition to lower-carbon energy sources is both a risk and opportunity for our business. We support policy that recognizes the global nature of climate change and promotes the reduction of both GHG intensity and absolute volume, while balancing affordability, reliability, competitiveness and economic growth. Climate change is a significant global issue and we will continue to engage in the dialogue to help our industry fully participate in the North American discussion.
We believe our efforts and ongoing commitment to reduce the GHG intensity of our operations, combined with the substantial and continued investments we have made in lower-emission and emission-less energy, position us well to adapt to and thrive in a lower-carbon economy. Looking forward, the global demand for energy is expected to continue to grow and we are well-positioned to be a preferred partner in the safe, reliable and sustainable delivery of that energy for decades to come.
Our role in the energy value chain
The energy industry is complex and multi-faceted, and is comprised of many different activities. TransCanada works as an intermediary in the oil and gas value chain, moving crude oil and natural gas from their initial supply sources to markets and/or storage facilities. We also are a supplier of power, generating electricity for companies that distribute energy to homes and businesses.
The graphic on the following page illustrates the major stages of the energy value chain and how we provide safe, reliable and affordable fuel transportation and power generation every day.
TRANSCANADA MAP
TABLE OF CONTENTS
CEO’S MESSAGE
WHO WE ARE
ABOUT THIS REPORT
WHAT CR MEANS TO US
Our commitment
Our approach
Our impact
A HEALTHY AND SAFE ENVIRONMENT AND COMMUNITY
AN ENGAGED COMMUNITY
A THRIVING ECONOMY
CAUTIONARY NOTE
APPENDIX
GRI G4 INDEX
We are well positioned to help meet Mexico’s growing need for clean-burning natural gas, with four pipelines operating and three more in development in the country.

TransCanada Corporate Responsibility Report 2017 26
What corporate responsibility means to us
Our impact
ENERGY
Local distributors sell natural gas to consumers
Energy to power homes
Refineries transform crude oil into useful products
Petroleum-based products are distributed by the refinery and enter the market through various avenues
Some petrochemicals are used to create everyday products
Some petroleum products are ultimately burned and used as
fuel for machinery and transportation
Export facilities turnnatural gas into
liquefied natural gas
Power is bought and sold and ultimately transmitted
to consumers
Natural gas-fired powergeneration facilities
Crude oil and natural gas
Windfacilities
Nuclearfacilities
Denotes TransCanada value chain activity
Denotes other activity
CRUDE OIL
ENERGY
NATURAL GAS
Crude oil and natural gas are transported
from their initial supply sources to TransCanada pipelines and/or storage facilities
TransCanada’s value chain
TRANSCANADA MAP
TABLE OF CONTENTS
CEO’S MESSAGE
WHO WE ARE
ABOUT THIS REPORT
WHAT CR MEANS TO US
Our commitment
Our approach
Our impact
A HEALTHY AND SAFE ENVIRONMENT AND COMMUNITY
AN ENGAGED COMMUNITY
A THRIVING ECONOMY
CAUTIONARY NOTE
APPENDIX
GRI G4 INDEX

TransCanada Corporate Responsibility Report 2017 27
TRANSCANADA MAP
TABLE OF CONTENTS
CEO’S MESSAGE
WHO WE ARE
ABOUT THIS REPORT
WHAT CR MEANS TO US
A HEALTHY AND SAFE ENVIRONMENT AND COMMUNITY
Integrity of pipelines and facilities
Emergency preparedness and response
Health and safety of communities, employees and contractors
Climate change and greenhouse gas emissions
AN ENGAGED COMMUNITY
A THRIVING ECONOMY
CAUTIONARY NOTE
APPENDIX
GRI G4 INDEX
A healthy and safe environment and community
The protection of water is of the upmost importance to us. TransCanada is proud to partner with Trout Unlimited Canada and support their goal to connect waterways across Canada by repairing river beds, linking fish to their habitat and improving water quality. Learn more on our website.
Calgary, Alberta.
TransCanada Corporate Responsibility Report 2017 27

TransCanada Corporate Responsibility Report 2017 28
A healthy and safe environment and community
Integrity of pipelines and facilities
Our ability to construct and operate our pipelines and facilities safely and reliably every day.
Operating context
We continually strive to make our operations safer because we believe that every incident can be prevented. The safe and reliable operation of our pipelines and facilities is one of our top priorities and is vital to the ongoing sustainability of our business.
Pipelines are the safest way to transport oil and natural gas. While unlikely to occur, releases of oil or gas are possible and can impact the safety of people and communities and the health of the environment. In a crude oil release, the greatest potential risk to the public or the environment is contamination of water and soil. In a natural gas pipeline release, the greatest potential risk to the public or the environment is the chance of ignition in proximity to the public.
Incidents resulting in a release of oil or gas can be caused by a variety of factors. These can include material corrosion and defects, cracking related to natural or manufacturing processes, exposed pipeline, and the significant threat from third parties conducting unauthorized excavations, encroachments and other activities within a pipeline right-of-way (ROW).
The integrity of our facilities—which include compressor and meter stations, oil terminals and power generation plants—is also very important. We operate and maintain all of our facilities in a safe, responsible manner by adhering to stringent standards and specifications, and abiding by commissioning, operating and maintenance procedures. Our regular review and inspection of our facilities enable us to continuously identify threats and hazards, evaluate risks, execute maintenance work and review the effectiveness of the risk treatments applied.
We verify that safety-critical elements are in place to prevent occurrences and that any major hazards and their effects have been identified and assessed. Application of safe techniques is promoted rigorously and control and mitigation measures are put in place to keep risk levels low or within acceptable levels.
Commitment
TransCanada is committed to ensuring we operate in a safe and reliable manner, and maintaining the integrity of our assets is one of our guiding principles that helps prevent unplanned releases that could result in a major incident. Our commitment is to establish world-class life cycle performance for the safety, integrity and reliability of our assets while maximizing their competitiveness.
Our goal is to ensure our pipelines and facilities operate incident-free and to safeguard our assets to serve the people and communities that rely on energy every day, for years to come. In the rare event of a failure of one of our assets, TransCanada will take full responsibility for emergency response and the impacts associated with an incident, to the extent we are liable. This includes timely remediation and restoration of third-party property or impacts on the environment. The protection of water resources is of the utmost importance to us and protection measures are implemented to avoid or minimize potential adverse effects at waterbody crossings during construction and throughout the life cycle of our pipeline operations.
We are committed to continually improving industry-wide standards and we regularly invest in R&D activities with a focus on technology advancements in the areas of pipeline integrity, including in-line inspection, cathodic protection, leak detection and coating.
To learn more, download our Health, Safety and Environment Commitment Statement.
Approach
Our integrity management programs include requirements and expectations for the integrity of our pipelines and facilities and they are aligned with TOMS to effectively manage risks and enable continual improvement. All assets are designed, constructed and commissioned with full consideration given to safety and integrity. Assets are brought into service only after all necessary requirements have been satisfied.
TRANSCANADA MAP
TABLE OF CONTENTS
CEO’S MESSAGE
WHO WE ARE
ABOUT THIS REPORT
WHAT CR MEANS TO US
A HEALTHY AND SAFE ENVIRONMENT AND COMMUNITY
Integrity of pipelines and facilities
Emergency preparedness and response
Health and safety of communities, employees and contractors
Climate change and greenhouse gas emissions
AN ENGAGED COMMUNITY
A THRIVING ECONOMY
CAUTIONARY NOTE
APPENDIX
GRI G4 INDEX

TransCanada Corporate Responsibility Report 2017 29
A healthy and safe environment and community
Integrity of pipelines and facilities
PIPELINE AND FACILITY INTEGRITY
Our integrity programs govern the processes used to manage the integrity of our assets throughout their life cycle:
• At design, TransCanada sources high quality materials, uses the latest proven technology and applies industry-leading engineering practices.
• During the construction of pipelines, we mandate the highest standards and use highly skilled teams. For example, qualified independent inspectors inspect all welds, and we use radiography and automated ultrasonic testing techniques to check for irregularities before pipelines go into service.
• To sustain and maximize the value of our assets, we manage process safety risks and threats during operation and focus on preventing damage and degradation, detecting irregularities and preventing and minimizing the chances of a leak. To continually improve the integrity and performance of our pipelines we utilize a System Wide Risk Assessment (SWRA) process and other tools annually.
• Our program provides a systematic basis for managing operational risks to the integrity of our assets, with the primary purpose of reducing process safety incidents. Internally, we measure our facility performance and the effectiveness of maintenance measures through metrics, such as the number of facility incidents involving injury or impact on the environment and the mean time between equipment failures.
Our integrity and preventative maintenance programs, monitoring systems, leak detection technologies, aerial patrols, public awareness programs and services to locate underground utilities are among the many management tools we use to help keep our people, communities, and the environment protected.
Detecting irregularities Our Operations Control Centres (OCCs) are staffed 24 hours a day, seven days a week, by trained personnel who use the most sophisticated monitoring equipment and technology available.
We assess the condition of underground pipelines through many programs, including aerial patrols and surveys as well as geotechnical monitoring. We also conduct in-line inspections, called “pigging” that use specialized smart pig
devices that travel through the pipeline to collect data to monitor the condition of the pipeline. The data is analyzed to determine any areas of concern and an investigation is conducted based on the data analysis or other information to determine if and when repairs are required. If an abnormal condition is detected, we activate our emergency response systems and procedures.
In 2017, we launched a project with our peers and the Government of Alberta to pilot a new pipeline monitoring technology on two sections of the Keystone Pipeline System. The innovative system developed by HiFi Engineering uses a fiber optic cable installed along the pipeline to act as a microphone and strain gauge to detect various events and potential leaks with a great amount of sensitivity.
Please see the Emergency preparedness and response section for details about our approach toward reducing any impacts on the environment and communities in the rare event of an incident.
TRANSCANADA MAP
TABLE OF CONTENTS
CEO’S MESSAGE
WHO WE ARE
ABOUT THIS REPORT
WHAT CR MEANS TO US
A HEALTHY AND SAFE ENVIRONMENT AND COMMUNITY
Integrity of pipelines and facilities
Emergency preparedness and response
Health and safety of communities, employees and contractors
Climate change and greenhouse gas emissions
AN ENGAGED COMMUNITY
A THRIVING ECONOMY
CAUTIONARY NOTE
APPENDIX
GRI G4 INDEX
As part of our commitment to innovation, we partnered with HiFi Engineering, Enbridge and the Government of Alberta to pilot new technology that uses fiber optic cable installed along oil pipelines as a highly sensitive vibration sensor, adding another layer to our comprehensive monitoring and leak detection program. Learn more on our website.
Keystone Pipeline Terminal, Houston, Texas.

TransCanada Corporate Responsibility Report 2017 30
A healthy and safe environment and community
Integrity of pipelines and facilities
Leak prevention We employ state-of-the-art construction standards and use cutting-edge leak detection technologies. In the unlikely event of an incident, our pipelines have site-specific Emergency Response Plans (ERPs), which we develop in collaboration with local emergency responders, to ensure a quick response.
Preventing damage Our Public Awareness Program emphasizes the importance of using local “click or call before you dig” services to locate underground utilities and helps mitigate third-party damage threats. We also conduct integrity and preventative maintenance activities on a regular basis.
WORKING WITH INDUSTRY
The CEPA Integrity First Program brings the transmission pipeline industry together to improve pipeline safety and move companies and the industry closer to the goal of zero incidents. In 2017, the focus of CEPA Integrity First was to assess three priority areas—pipeline integrity, control room management and emergency management—the results of which were verified with an independent third-party auditor. TransCanada’s three priority areas all passed the third-party verification and our pipeline integrity’s planning process was verified to be best-in-class.
For more information, visit the CEPA Integrity First website.
Through our participation in industry initiatives such as CEPA Integrity First, as well as with renowned organizations such as the American Society of Mechanical Engineers, the American Petroleum Institute and INGAA, TransCanada is well-positioned to help the pipeline industry raise the bar on safety and improve industry processes to gain the public’s trust and confidence in pipeline transmission operations.
Continuous improvement and performance measurement
To enable continuous improvement and learning from incidents, TransCanada conducts comprehensive failure investigations into pipeline and facility incidents, including large crude oil spills, to make system-wide improvements and prevent similar incidents. We also track and investigate near misses. These investigations identify causal and contributing factors that help us improve our integrity programs and reach our goal of preventing all incidents. In addition, we review publicly released audit and incident reports from external industry pipeline failure incidents to identify applicable recommendations that can be proactively implemented.
Our system-wide response to incidents is designed to apply to pipeline failures (including leaks and ruptures) and any other incidents of interest within the pipeline industry, both internal and external to us. The overall process ensures that the lessons learned from the issue/incident is incorporated into our documentation to continually improve our processes and align with our belief that the goal of zero incidents is achievable.
Our performance in effectively managing pipeline safety and integrity is measured by indicators related to our investment in integrity and preventative maintenance programs, the number and distance of in-line inspections and the number of completed integrity digs. Frequency of inspections, the ability to pig the system, effectiveness of damage prevention methods, severity of features found, number of incidents such as leaks and ruptures baselined to industry performance, quantitative SWRA to risk thresholds and impact on customers, are a few of indicators that are measured.
There were no significant adjustments to our approach to the 2017 reporting period.
For additional details on our approach to pipeline safety and integrity, please refer to Ensuring our pipelines are safe fact sheet.
TRANSCANADA MAP
TABLE OF CONTENTS
CEO’S MESSAGE
WHO WE ARE
ABOUT THIS REPORT
WHAT CR MEANS TO US
A HEALTHY AND SAFE ENVIRONMENT AND COMMUNITY
Integrity of pipelines and facilities
Emergency preparedness and response
Health and safety of communities, employees and contractors
Climate change and greenhouse gas emissions
AN ENGAGED COMMUNITY
A THRIVING ECONOMY
CAUTIONARY NOTE
APPENDIX
GRI G4 INDEX

TransCanada Corporate Responsibility Report 2017 31
Performance
INDICATOR: Total number and volume of significant spills and releases (G4-EN24)
Our liquid pipelines performance improved in 2017, continuing the trend of reductions in the number of reportable spills since 2011. However, spill volume in 2017 increased due to an incident on our Keystone Pipeline System that did not result in any injuries or pose a serious environmental impact or threat to public safety.
On November 16, 2017, we detected a pressure drop in our operating system on the Keystone pipeline, prompting the immediate shut-down of the pipeline and activation of our emergency response procedures. Personnel dispatched to the site quickly confirmed a leak of crude oil had taken place approximately 56 kilometres (35 miles) south of the Ludden pump station in Marshall County, South Dakota. The initial estimated size of the leak reported to National Response Center and the Pipeline and Hazardous Materials Safety Administration (PHMSA) within the first hour of the incident was approximately 5,000 barrels,
Working co-operatively with state and federal authorities, community members and our landowner and Indigenous neighbours, we completed initial cleanup and repair work. We were approved to restart the pipeline on November 28, 2017, and resumed operating at 80 per cent of the pipeline’s maximum operating pressure in the area of the release in accordance with the conditions of a PHMSA Corrective Action Order.
Through our remediation efforts, we determined that the total volume of oil released was approximately 9,700 barrels and that the environmental impact of the leak was temporary, limited in extent to the immediate area, and did not affect groundwater. Impacted soil was removed and disposed of at a licensed facility, and we worked with regulators and the affected landowners to restore the land to its normal condition and provide appropriate compensation for the inconvenience related to our activities.
A healthy and safe environment and community
Integrity of pipelines and facilities
We continue to work with PHMSA on a detailed investigation to determine the exact cause of the leak, which will inform appropriate corrective actions to improve our practices and prevent similar incidents from occurring in the future.
Reportable crude oil spills from liquids pipelines and facilities1 2013 2014 2015 2016 2017
Number of reportable crude oil spills (#) 22 10 1 2 2 Canada 21 9 1 0 1 U.S. 1 1 0 2 1
Volume of reportable crude oil spills (barrels)2 19.69 1.88 14.47 400.12 9,731.45 Canada 19.21 0.38 14.47 0 31.45 U.S. 0.48 1.50 0 400.12 9,700.00
Notes: This indicator is inclusive of all TransCanada liquids pipeline assets where TransCanada has majority operating control. It does not include gas storage, energy assets or leaks from natural gas pipelines. Spills by third-party contractors are not reflective of TransCanada’s integrity performance and are therefore excluded. Data reported in previous TransCanada Corporate Responsibility Reports may differ from the above, as data is updated to reflect finalized incident information. No restatements were required in 2017. 1 The GRI defines a significant spill as a hydrocarbon spill greater than 100 bbl released into the environment and/or a hydrocarbon spill released into a sensitive environment. TransCanada defines a significant spill as a reportable spill. A reportable spill is defined as one that is reportable to a regulatory body, such as a federal or provincial or state regulator. 2 Historical data for 2016 and prior has been converted from litres to barrels. The conversion factor used is 1 litre = 0.006289811 barrel.
TRANSCANADA MAP
TABLE OF CONTENTS
CEO’S MESSAGE
WHO WE ARE
ABOUT THIS REPORT
WHAT CR MEANS TO US
A HEALTHY AND SAFE ENVIRONMENT AND COMMUNITY
Integrity of pipelines and facilities
Emergency preparedness and response
Health and safety of communities, employees and contractors
Climate change and greenhouse gas emissions
AN ENGAGED COMMUNITY
A THRIVING ECONOMY
CAUTIONARY NOTE
APPENDIX
GRI G4 INDEX

TransCanada Corporate Responsibility Report 2017 32
A healthy and safe environment and community
Integrity of pipelines and facilities
Reportable gas releases1 2017
Number of reportable gas releases (#) 37 Canada 22 U.S. 8 Mexico 7
Volume of reportable gas releases (cubic metres) 4,538,083 Canada 265,032 U.S. 4,211,892 Mexico 61,159
Notes: This indicator is inclusive of all TransCanada natural gas pipeline assets where TransCanada has majority operating control, including CPG assets as of July 1, 2016. It does not include liquids pipelines, gas storage, or energy assets. In 2017, TransCanada revised the reporting process to account for both facility and pipeline releases. As a result, 2016 historical data is not fully comparable and has been excluded from this table. In 2016, 31 reportable gas releases occurred, with a total volume of 2,252,447 cubic metres. For further information, please refer to TransCanada’s 2016 CSR Report.1 A reportable release is defined as one that is reportable to an external agency or authority, such as a federal, provincial or state regulator. Thresholds for reporting of gas releases are lower in the U.S. than Canada with respect to the cost of damage to operators and/or adjacent facilities. In the U.S., a release resulting in damages of $50,000 to the operator is considered a reportable release. In Canada, a release resulting in damages of $50,000 is below the reporting threshold for a reportable release.
INDICATOR: Process safety events (G4-OG13)
This is the first year we are reporting process safety events for both our pipelines and facilities. In 2017, our process safety performance improved with overall reductions in the number of liquids and significant natural gas leaks. However, our liquids pipelines experienced one process safety event related to the incident on our Keystone Pipeline System (please see discussion on our number and volume of significant crude oil spills).
Process safety events 2014 2015 2016 2017
Number of pipeline ruptures (#)1 3 1 0 1 Natural gas pipeline ruptures 3 1 0 0 Liquids pipeline ruptures 0 0 0 1
Number of liquid leaks2 of > 5 barrels from pipelines and facilities (#)2 0 0 1 0
Number of significant natural gas leaks from pipelines and facilities (#)3 4 10 7 1
Notes: This indicator is inclusive of all natural gas and liquids pipeline assets and facilities where TransCanada has majority operating control, including CPG assets of January 1, 2017. 1 TransCanada defines a rupture as an unplanned, uncontrolled release of liquid that immediately impacts the serviceability of the pipeline. 2 TransCanada defines a leak as an unplanned, uncontrolled release of liquid that does not immediately impact the serviceability of the pipeline. 3 TransCanada defines a significant natural gas leak as a leak that meets one or more of the following criteria: • Has a direct safety impact on the public, our employees or contractors (e.g., loss of gas service, first
aid, injury or fatality) • Results in an uncontrolled fire • Results in regulatory enforcement • Causes an “other” significant unplanned event not covered by any of the criteria above (e.g.,
significant impact on shippers or industrial customers)
TRANSCANADA MAP
TABLE OF CONTENTS
CEO’S MESSAGE
WHO WE ARE
ABOUT THIS REPORT
WHAT CR MEANS TO US
A HEALTHY AND SAFE ENVIRONMENT AND COMMUNITY
Integrity of pipelines and facilities
Emergency preparedness and response
Health and safety of communities, employees and contractors
Climate change and greenhouse gas emissions
AN ENGAGED COMMUNITY
A THRIVING ECONOMY
CAUTIONARY NOTE
APPENDIX
GRI G4 INDEX

TransCanada Corporate Responsibility Report 2017 33
INDICATOR: Third-party encroachments, unauthorized activities and one-calls
In 2017, unauthorized excavations of our facilities by third-parties increased. A number of conditions in Canada, the U.S. and Mexico contributed to this increase. In Canada, an increase in awareness and training activities related to the NEB Damage Prevention Regulations contributed to an increase in reporting, and in Mexico, regional construction-related encroachments increased. In the U.S. a rise in precipitation in the Great Lakes and Heartland regions resulted in more unauthorized encroachments due to the installation of drainage systems.
In 2017 we experienced an increase in one-calls per kilometre of ROW. Integration of our CPG assets contributed to this increase, due to the location of the assets in densely populated areas and an increase in U.S. construction activity. Additionally, CPG assets have a wider one-call buffer registered with state one-call centres, which drives more notifications compared to similarly situated assets in the system regardless of population density.
Not all encroachments or unauthorized activities result in third-party damage, which we define as impact or exposure resulting in the need to repair an underground facility.
Third-party damage (#) 2013 2014 2015 2016 2017
One-calls per km of ROW1 2.88 2.91 2.76 2.56 5.81 Unauthorized pipeline encroachments per 1,000 km of ROW 2 4.33 3.30 3.90 4.62 3.93 Unauthorized excavations per 1,000 km of ROW 3 1.28 1.34 1.50 1.28 1.68
Notes: This indicator is inclusive of all TransCanada assets where TransCanada has majority operating control, including CPG assets as of January 1, 2017. 1 Local one-call centres field requests to have all underground utilities located and marked free of charge, prior to any commercial or residential project involving digging. These requests are being received via telephone or online. 2 Unauthorized encroachments include activities carried out without authorization from local one-call centres.3 Unauthorized excavations include more serious activities than other encroachments, with greater potential to cause impact or exposure that would result in a need to repair an underground facility.
INDICATOR: Investment in integrity and preventative maintenance programs
Pipeline integrity spending will fluctuate due to annual risk assessments that are conducted of the pipeline system along with evaluating information obtained from recent inspections and maintenance activities.
To effectively manage pipeline safety and integrity, TransCanada invested $1.06 billion in integrity and preventative maintenance programs in 2017, a $252 million increase over 2016. The increase is due to investments toward enhancing our inspection cycle and systems availability.
Investment in integrity and preventative maintenance programs (CAD$ M) 2013 2014 2015 2016 2017
Investment for natural gas and liquids pipelines 376 550 803 809 1,061
Note: This indicator is inclusive of all TransCanada liquids and natural gas pipeline assets where TransCanada has majority operating control, including CPG assets as of July 1, 2016.
A healthy and safe environment and community
Integrity of pipelines and facilities TRANSCANADA MAP
TABLE OF CONTENTS
CEO’S MESSAGE
WHO WE ARE
ABOUT THIS REPORT
WHAT CR MEANS TO US
A HEALTHY AND SAFE ENVIRONMENT AND COMMUNITY
Integrity of pipelines and facilities
Emergency preparedness and response
Health and safety of communities, employees and contractors
Climate change and greenhouse gas emissions
AN ENGAGED COMMUNITY
A THRIVING ECONOMY
CAUTIONARY NOTE
APPENDIX
GRI G4 INDEX

TransCanada Corporate Responsibility Report 2017 34
INDICATOR: In-line inspections
To prevent and detect leaks and irregularities, during 2017 TransCanada conducted in-line inspection (ILI) runs across 21,914 km of pipeline, analyzing 277 runs overall. This increase is driven by an improved ability to conduct inspections on small diameter pipe using enhanced inspection technologies, with a greater number of first-time inspections conducted in 2017.
In-line inspections 2015 2016 2017
Runs analyzed (total #) 146 201 277 Canada Gas 86 87 162 Liquids 4 1 7
U.S. Gas 43 111 93 Liquids 10 2 15
Mexico Gas 3 0 0
In-line inspections (km/mi) 12,968 km/8,056 mi 18,074 km/11,235 mi 21,914 km /13,620 mi Canada Gas 5,243 km/3,257 mi 10,400 km/6,465 mi 11,232 km/6,981 mi Liquids 1,149 km/714 mi 315 km/196 mi 2,074 km/1,289 mi
U.S. Gas 3,759 km/2,335 mi 6,257 km/3,889 mi 4,565 km/2,837 mi Liquids 2,460 km/1,528 mi 1,102 km/685 mi 4,043 km/2,513 mi
Mexico Gas 357 km/222 mi 0 km/0 mi 0 km/0 mi
Note: This indicator is inclusive of all TransCanada liquids and natural gas pipeline assets where TransCanada has majority operating control, including CPG assets as of July 1, 2016. The number of in-line inspections can vary year over year, depending on annual program requirements.
A healthy and safe environment and community
Integrity of pipelines and facilities TRANSCANADA MAP
TABLE OF CONTENTS
CEO’S MESSAGE
WHO WE ARE
ABOUT THIS REPORT
WHAT CR MEANS TO US
A HEALTHY AND SAFE ENVIRONMENT AND COMMUNITY
Integrity of pipelines and facilities
Emergency preparedness and response
Health and safety of communities, employees and contractors
Climate change and greenhouse gas emissions
AN ENGAGED COMMUNITY
A THRIVING ECONOMY
CAUTIONARY NOTE
APPENDIX
GRI G4 INDEX
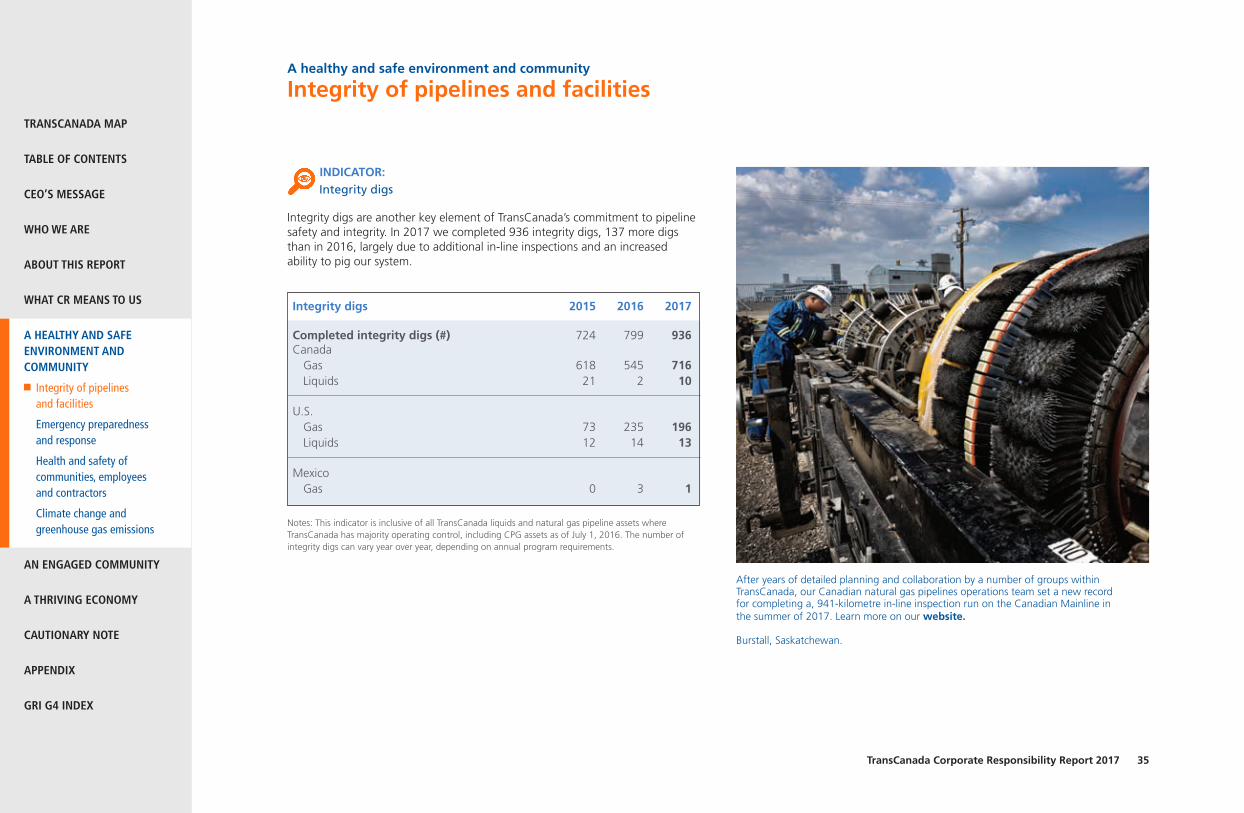
TransCanada Corporate Responsibility Report 2017 35
A healthy and safe environment and community
Integrity of pipelines and facilities
INDICATOR: Integrity digs
Integrity digs are another key element of TransCanada’s commitment to pipeline safety and integrity. In 2017 we completed 936 integrity digs, 137 more digs than in 2016, largely due to additional in-line inspections and an increased ability to pig our system.
Integrity digs 2015 2016 2017
Completed integrity digs (#) 724 799 936 Canada Gas 618 545 716 Liquids 21 2 10
U.S. Gas 73 235 196 Liquids 12 14 13
Mexico Gas 0 3 1
Notes: This indicator is inclusive of all TransCanada liquids and natural gas pipeline assets where TransCanada has majority operating control, including CPG assets as of July 1, 2016. The number of integrity digs can vary year over year, depending on annual program requirements.
After years of detailed planning and collaboration by a number of groups within TransCanada, our Canadian natural gas pipelines operations team set a new record for completing a, 941-kilometre in-line inspection run on the Canadian Mainline in the summer of 2017. Learn more on our website.
Burstall, Saskatchewan.
TRANSCANADA MAP
TABLE OF CONTENTS
CEO’S MESSAGE
WHO WE ARE
ABOUT THIS REPORT
WHAT CR MEANS TO US
A HEALTHY AND SAFE ENVIRONMENT AND COMMUNITY
Integrity of pipelines and facilities
Emergency preparedness and response
Health and safety of communities, employees and contractors
Climate change and greenhouse gas emissions
AN ENGAGED COMMUNITY
A THRIVING ECONOMY
CAUTIONARY NOTE
APPENDIX
GRI G4 INDEX

TransCanada Corporate Responsibility Report 2017 36
A healthy and safe environment and community
Emergency preparedness and response
Our ability to plan, practise and collaborate to respond to incidents and unplanned events quickly and efficiently.
Operating context
TransCanada has an industry-leading safety record and a goal of achieving zero incidents. However, incidents and emergencies involving worker safety, damage to pipelines and facilities, malicious acts and natural disasters can happen. In addition, oil and natural gas can be hazardous under certain conditions. In the unlikely event that an incident occurs, we are ready to respond safely and effectively, in partnership with local first response agencies and regional and national authorities. Responding to environmental and health and safety incidents in an efficient and effective manner enables us to minimize the impact of an event.
Commitment
Being prepared to respond quickly and appropriately in the rare cases when something does go wrong is part of our commitment to the safety of the communities where we operate.
We are committed to implementing and maintaining state-of-the-art emergency preparedness and response systems and capabilities to control, mitigate and minimize the impact of emergency conditions on life safety, property and the environment. We operate our emergency response in partnership with our communities.
Approach
Through alignment to TOMS, our Emergency Management Corporate Program provides a consistent and comprehensive approach to emergency preparedness and response within TransCanada that allows us to activate a quick and appropriate response to emergencies involving any of our assets.
EMERGENCY PREPAREDNESS
We consider emergency preparedness as the foundation that supports our response and so we have established three tiers of ERPs. The tiers include our Corporate Program manual, which describes processes that apply to all lines of business within TransCanada, specific informational resources and site-specific plans that are created for all assets deemed critical. These plans include procedures to ensure we carry out required notifications and response actions as efficiently and safely as possible.
Training and promoting a culture of emergency preparedness are key elements of our approach. We conduct emergency response simulations on a regular basis to allow our own personnel to work with local first responders and to hone our skills and develop communication protocols in the unlikely event of an incident. Our first responders are provided a specialized training course on how to respond to and manage an incident that educates them on the process for conducting proper on-site assessments, how to evaluate tactical response equipment and in some cases, how to stabilize an incident.
Building relationships and partnerships with local first responders, communities and industry members is another important part of our approach. We work collaboratively with emergency responders through face-to-face meetings and invitations to participate in exercises and training. In addition, the Mutual Emergency Assistance Agreement —which was signed by all member companies of CEPA—provides a mechanism for CEPA members to request assistance from one another in the event of an emergency.
For more information about our ERPs or to request a copy of our Emergency Management Corporate Program Manual, please visit our website.
EMERGENCY RESPONSE
In an emergency, local field staff will handle direct response activities such as isolation of the emergency, containment and control, co-ordination of response activities and restoration of service.
TRANSCANADA MAP
TABLE OF CONTENTS
CEO’S MESSAGE
WHO WE ARE
ABOUT THIS REPORT
WHAT CR MEANS TO US
A HEALTHY AND SAFE ENVIRONMENT AND COMMUNITY
Integrity of pipelines and facilities
Emergency preparedness and response
Health and safety of communities, employees and contractors
Climate change and greenhouse gas emissions
AN ENGAGED COMMUNITY
A THRIVING ECONOMY
CAUTIONARY NOTE
APPENDIX
GRI G4 INDEX

TransCanada Corporate Responsibility Report 2017 37
We use the Incident Command System (ICS)—an internationally recognized and standardized on-scene, all-hazard incident management system—to manage the emergency response process. The ICS allows us to adopt a flexible and integrated organizational structure to work jointly with public safety agencies, emergency services responders, regulators and other stakeholders in a manner appropriate to the severity of the incident.
As part of our use of ICS, we maintain an Incident Management Team (IMT) of qualified TransCanada specialists who may be called upon to respond to an incident and mitigate impacts in any location across our lines of business. We provide IMT members with standardized ICS role-specific training to ensure they are capable of working effectively and collaboratively with a team of TransCanada and external response specialists.
For incidents involving a release, we have a number of systems in place to reduce the impact on the environment and communities:
• For liquids pipelines, if an abnormal condition is detected, our Supervisory Control and Data Acquisition system will immediately alert OCC operators to shut down operations along the pipeline, isolating the product in the pipe and limiting potential impacts.
• For gas pipelines, valves spaced at intervals along pipelines are used to stop the flow of gas and allow incidents to be quickly and effectively isolated. If pipeline pressure drops due to a leak, the valves automatically stop the flow of gas. Valves can also be manually closed. We will not restart the pipeline until the issue has been identified and resolved and it is safe to do so.
Our Emergency Operations Centres are designed and equipped to support all personnel and activities at the scene through communications, resource deployment and technical expertise. Our Community Information Centres (CIC) serve as an outreach hub for keeping communities informed during incidents. Built on best practices, our CIC process quickly mobilizes teams to engage with all stakeholders in an impacted community.
Continuous improvement and performance measurement
We review ERPs on an annual basis and document and test our system through annual exercises involving both our employees and the community to ensure that our planning and response remain appropriate for changing business and community conditions and to enable ongoing continuous improvement. Emergency event analyses are completed and updated if there is a significant change in the business practices or facilities.
We measure the effectiveness of our approach by the number of emergency preparedness and response training exercises provided to our employees, and by internal indicators such as emergency response time.
In 2017, we prioritized further development of our IMT by increasing role-specific training for most specialized roles in the ICS organization. Looking forward, we will be focused on offering additional training in an effort to further develop our highly skilled team of specialists capable of responding across our network.
We also enhanced and emphasized our risk-based approach to determine what appropriate strategies and training exercises would be required for effective stakeholder outreach. To further supplement this approach, we established a formal working committee to ensure TransCanada’s public awareness goals and strategies are aligned for responder liaising and education activities.
No significant adjustments to our emergency preparedness approach and response were identified for the 2017 reporting period.
Performance
In 2017 we experienced one emergency response incident related to a spill on our Keystone pipeline. While the incident resulted in the release of approximately 9,700 barrels of crude oil, it did not involve any injuries or pose a significant environmental impact or threat to public safety. Our response efforts were executed effectively and in adherence to our protocols, and the communication, safety and efforts of our staff were commended by local, state, and federal oversight agencies at the incident.
For further details about our response to this spill, please refer to the Integrity of pipelines and facilities—performance section.
A healthy and safe environment and community
Emergency preparedness and response TRANSCANADA MAP
TABLE OF CONTENTS
CEO’S MESSAGE
WHO WE ARE
ABOUT THIS REPORT
WHAT CR MEANS TO US
A HEALTHY AND SAFE ENVIRONMENT AND COMMUNITY
Integrity of pipelines and facilities
Emergency preparedness and response
Health and safety of communities, employees and contractors
Climate change and greenhouse gas emissions
AN ENGAGED COMMUNITY
A THRIVING ECONOMY
CAUTIONARY NOTE
APPENDIX
GRI G4 INDEX

TransCanada Corporate Responsibility Report 2017 38
A healthy and safe environment and community
Emergency preparedness and response
INDICATOR: Emergency preparedness and response exercises
To prepare for emergencies before they happen, we conducted 172 emergency preparedness and response exercises in 2017, an increase over the 117 exercises conducted in 2016. This increase was primarily attributable to emergency preparedness and response exercises conducted for our newly integrated CPG assets.
Emergency preparedness and response exercises (#) 2013 2014 2015 2016 2017
Total exercises completed 104 112 125 117 172 Annual field exercises 23 22 22 22 23 Equipment deployment exercises 10 10 10 10 12 Field tabletop exercises1 66 61 67 64 116 Calgary and Houston support department tabletop exercises 5 19 26 21 21
Note: This indicator is inclusive of all TransCanada assets where TransCanada has majority operating control, including CPG assets as of January 1, 2017. 1 Field tabletop exercises involve key personnel discussing simulated scenarios in an informal setting.
INDICATOR: Emergency preparedness and response training completions
In 2017 we introduced a new training program aimed at equipping TransCanada first responders with the skills and knowledge needed to respond to and manage an incident. A total of 253 employees completed first responder training in the Rocky Mountain and Central region.
Regulations require that personnel exposed to hazardous substances and engaged in cleanup, treatment, storage and disposal of hazardous waste must participate in specific training activities. In 2017, 348 employees completed hazardous waste operations and emergency response (HAZWOPER) training. Course completions vary on a year-over-year basis based on new hires or employee movement between departments.
Emergency preparedness and response training (#) 2013 2014 2015 2016 2017
Regulatory training (HAZWOPER)1 547 532 446 404 348
First Responders training2 – – – – 253
Best practice training on Incident Command System3 1,559 2,576 2,364 2,537 2,548
Notes: This indicator is inclusive of all TransCanada assets where TransCanada has majority operating control, including CPG assets as of January 1, 2017. TransCanada contractors are excluded. Values reported are for new training completions.1 The hazardous waste operations and emergency response standard regulates the safety and health of employees involved in management and cleanup operations at uncontrolled hazardous waste sites, employees engaged in certain hazardous waste sites, and employees engaged in certain hazardous waste.2 First responders are provided a specialized training course on how to respond to and manage an incident that educates them on the process for conducting proper on-site assessments, how to evaluate tactical response equipment and in some cases, how to stabilize an incident.3 Best practice training includes ICS 100 and 200 courses, which provide introductory and basic training designed to describe the history, features and principles, and organization structure of the ICS and enable personnel to operate efficiently during an incident or event.
TRANSCANADA MAP
TABLE OF CONTENTS
CEO’S MESSAGE
WHO WE ARE
ABOUT THIS REPORT
WHAT CR MEANS TO US
A HEALTHY AND SAFE ENVIRONMENT AND COMMUNITY
Integrity of pipelines and facilities
Emergency preparedness and response
Health and safety of communities, employees and contractors
Climate change and greenhouse gas emissions
AN ENGAGED COMMUNITY
A THRIVING ECONOMY
CAUTIONARY NOTE
APPENDIX
GRI G4 INDEX

TransCanada Corporate Responsibility Report 2017 39
A healthy and safe environment and community
Health and safety of communities, employees and contractors
Our promotion and implementation of a culture and actions that prevent safety incidents that impact people.
Operating context
TransCanada’s occupational and facility safety records are among the best in the industry. Our goal is to achieve zero incidents. The safety of our workers and of those who live in the communities where we operate is our top priority and we believe all incidents are preventable.
While pipelines are the safest method of transporting oil and natural gas, worker and community safety concerns include the risks associated with leaks, spills and ruptures. Motor vehicle incidents and working with heavy equipment are among the most significant hazards for our employees and contractors.
Commitment
Being a good neighbour means being a safe neighbour, which is why safety considerations factor into everything we do. We are committed to ensuring that our pipelines and facilities operate safely every day and that the health and safety of people are protected in the unlikely event of an incident involving our assets.
We are committed to fostering a robust and positive safety culture, along with effective processes and systems that are essential in making health, safety and environmental protection a top-of-mind and around-the-clock mindset. By reinforcing a disciplined set of rules and providing rigorous and continuous training, our goal of a zero-incident workplace is integrated into our daily work.
To learn more, download our Health, Safety and Environment Commitment Statement.
Approach
Our approach to operating our pipelines and other facilities safely and reliably is guided by our safety value—which is the first of our four core values.
Through alignment to TOMS, our Safety Program sets expectations, identifies specific roles and responsibilities, and effectively manages hazards and risks to enable our employees to work safely and deliver business results in a manner that protects the public.
These expectations are reinforced through our safety culture, which is the continual modelling and integration of safety through our behaviours and actions. Our Safety 24–7 Program encourages employees to continue to foster this culture away from work by sharing off-the-job incidents, supporting extended family safety training and providing information on a range of everyday safety topics.
To prevent incidents, we mandate specific work practices, policies, programs and procedures that meet or exceed all applicable regulatory requirements related to health and safety.
Our nine Life Saving Rules highlight the high-risk activities that are part of the work we do every day and emphasize the importance of following the risk control measures we have in place to manage them. They guide the way we work and are used to hold each other accountable to the highest possible safety standards. All personnel must adhere to the rules and failure to comply may result in disciplinary action.
Employees are trained in hazardous material handling, first aid/CPR, fire and driver training, and other training and certifications demanded by specific jobs. All employees can report Safety Hazard Awareness Reporting Events—which are proactive incident or issue notifications that focus on Safety 24–7, safe acts and safe observations—via our Incident Management Process.
TRANSCANADA MAP
TABLE OF CONTENTS
CEO’S MESSAGE
WHO WE ARE
ABOUT THIS REPORT
WHAT CR MEANS TO US
A HEALTHY AND SAFE ENVIRONMENT AND COMMUNITY
Integrity of pipelines and facilities
Emergency preparedness and response
Health and safety of communities, employees and contractors
Climate change and greenhouse gas emissions
AN ENGAGED COMMUNITY
A THRIVING ECONOMY
CAUTIONARY NOTE
APPENDIX
GRI G4 INDEX

TransCanada Corporate Responsibility Report 2017 40
A healthy and safe environment and community
Health and safety of communities, employees and contractors
We view our contractors as our extended partners. Our Contractor Safety Management Program ensures that we do business only with organizations that share our values and commitment to maintaining a safe workplace and reducing occupational injuries and illnesses. Each contractor is vetted through a regimented qualification process that confirms their commitment to safety processes and procedures that align with TransCanada standards. We want our contractors to view safety the way we do, and aim to ensure that they uphold our core values and make safety a priority.
Learn more about our Life Saving Rules on our website.
Continuous improvement and performance measurement
In the event of any health or safety incident, we conduct incident response, notification, investigation, documentation and follow-up, and share learnings. These are completed in a uniform, thorough and timely manner and in accordance with our Incident Management Process to promote continuous improvement and to help prevent recurrence.
Part of maintaining a solid safety record is looking for opportunities for continual improvement. Some areas of our business have achieved zero incident records, but we believe a solid safety record is achievable company-wide. To measure our performance, we track industry standard safety performance indicators as well as incidents that have a high potential to injure personnel. In addition, we have continued to advance in the areas of safety performance trending and analysis. As an example of our continuous improvement initiatives, our Environment Health and Safety Module has been further enhanced to allow for the easier entry of incidents and an increase in data available for incident trending and analysis.
No significant adjustments to our approach to managing the health and safety of people were identified for the 2017 reporting period.
Performance
INDICATOR: Type of injury and rates of injury, occupational disease, lost days and absenteeism, and total number of work-related fatalities (G4-LA6)
We are on a continuous journey to reach our goal of zero incidents at our facilities and ensuring everyone makes it home safely. While we continue to achieve occupational and facility safety performance that is among the best in the industry, ultimately no safety-related incidents are acceptable and we did not achieve the high standard we set for ourselves. In October 2017, we experienced an unfortunate event that claimed the life of one of our U.S. employees in Ohio. This is unacceptable and we are conducting a full investigation to determine the cause of this tragedy and to identify any steps we can take to prevent such incidents in the future. Ensuring that our facilities operate safely and that all of our employees and contractors return home safely every day is our top priority, and we remain committed to achieving our goal of zero incidents.
We are proud of our improved record of total recordable case rates for employees and contractors, and high potential incidents rate for employees in 2017. These decreases were primarily attributable to a reduction in total number of injuries and high potential incidents reported, respectively.
Our vehicle incident frequency rate increased in 2017, mainly due to the increase in number of vehicle incidents relative to the reduction in total kilometres travelled. More effective use of reporting systems attributed to our contractor high potential incidents rate increasing in 2017.
To increase our transparency on occupational health and safety, we are reporting types of recordable injuries for employees and contractors for the first time.
To see a breakdown of types of recordable injuries for employees and contractors, please refer to our 2017 Corporate Responsibility Data Sheet.
TRANSCANADA MAP
TABLE OF CONTENTS
CEO’S MESSAGE
WHO WE ARE
ABOUT THIS REPORT
WHAT CR MEANS TO US
A HEALTHY AND SAFE ENVIRONMENT AND COMMUNITY
Integrity of pipelines and facilities
Emergency preparedness and response
Health and safety of communities, employees and contractors
Climate change and greenhouse gas emissions
AN ENGAGED COMMUNITY
A THRIVING ECONOMY
CAUTIONARY NOTE
APPENDIX
GRI G4 INDEX

TransCanada Corporate Responsibility Report 2017 41
Occupational health and safety 2013 2014 2015 2016 2017
Employees Fatalities 0 0 0 0 1 Total recordable case rate2 0.57 0.59 0.61 0.90 0.59 Away from work case rate3 0.14 0.16 0.27 0.25 0.19 Vehicle incident frequency rate4 2.02 1.63 2.01 1.07 2.07 High potential incidents rate5 0.24 0.18 0.11 0.28 0.16 Casual absentee rate1,6 – – – 0.17 0.16 Short term disability absentee rate1,7 – – – 0.19 0.21 Workers’ Compensation Board absentee rate1,8 – – – 0.01 0.008 Average lost days per person9 – – – – 4.25
Contractors Fatalities – – 0 0 0 Total recordable case rate2 1.75 1.32 1.17 1.38 0.95 Away from work case rate3 0.29 0.19 0.15 0.13 0.10 Vehicle incident frequency rate4 2.70 2.51 3.01 2.52 2.45 High potential incidents rate5 0.76 0.47 0.63 0.49 0.55
Note: This indicator is inclusive of TransCanada assets where TransCanada has majority operating control, including CPG assets as of July 1, 2016, with the exception of: N.E. Power assets (as of April 2017). 1 The data for absentee rates includes TransCanada’s core employees only. TransCanada does not currently track contractor absences. 2 TransCanada defines total recordable case rate as the number of recordable cases related to a common exposure base of 100 full-time employees. Recordable cases are all work-related deaths and illnesses, and those work-related injuries that result in a loss of consciousness, restriction of work or motion, transfer to another job or require medical treatment beyond first aid. 3 TransCanada defines away from work case rate as an incident resulting in an injury or illness that prevents an employee from returning to work on the next scheduled shift. The number of away from work cases, where the employee would have worked but could not because of an occupational injury or illness, is related to a common exposure base of 100 full-time workers. This performance indicator is often referred to as the Lost-Time Case Rate. 4 TransCanada defines vehicle incident frequency rate as the number of recordable vehicle incidents related to a common exposure base of 1,000,000 km driven. A recordable vehicle incident (regardless of fault) involves a fleet or rental motor vehicle that results in an injury to any person or damage to any vehicle or property, unless the vehicle was safely and legally parked at the time of the incident.
5 TransCanada defines high potential incidents rate as incidents with a high potential to result in serious, debilitating injury to the worker related to a common exposure base of 100 full-time employees. Examples of high potential incidents include, but are not limited to, high-speed vehicle incidents, vehicle rollovers, high-voltage or high-pressure incidents, injuries to the head, falls from heights. Vehicle incidents involving animal strikes are not included in this indicator and have been removed from this data. 6 TransCanada defines casual absences as absences involving an employee being medically unable to work for up to 36 continuous work hours due to a non-work-related illness or injury. 7 TransCanada defines short-term disability absences as a medical absence lasting more than 36 consecutive hours away from work due to a non-occupational illness or injury. Short-term disability is a company-funded income continuance program from which qualifying employees can derive income replacement for a non-work-related illness or injury from the first day to twenty-six (26) weeks of absence. 8 TransCanada defines Workers’ Compensation Board absences as a work-related illness or injury requiring medical aid and/or medical absence of more than a day, involving a provincial or state Company-sponsored income replacement program operated through the various provincial or state Workers’ Compensation boards or U.S. insurance carriers. 9 TransCanada calculated average lost days per person by combining total lost days in Canada, the U.S., and Mexico, and dividing by the employee head count across all three regions.
A healthy and safe environment and community
Health and safety of communities, employees and contractors TRANSCANADA MAP
TABLE OF CONTENTS
CEO’S MESSAGE
WHO WE ARE
ABOUT THIS REPORT
WHAT CR MEANS TO US
A HEALTHY AND SAFE ENVIRONMENT AND COMMUNITY
Integrity of pipelines and facilities
Emergency preparedness and response
Health and safety of communities, employees and contractors
Climate change and greenhouse gas emissions
AN ENGAGED COMMUNITY
A THRIVING ECONOMY
CAUTIONARY NOTE
APPENDIX
GRI G4 INDEX

TransCanada Corporate Responsibility Report 2017 42
A healthy and safe environment and community
Climate change and greenhouse gas emissions
Our approach to climate change and management of our own greenhouse gas emissions.
Operating context
TransCanada is an industry leader in delivering oil, natural gas and power in the safest, most efficient manner possible. As an energy infrastructure company, we recognize our role in the larger energy system, including the ongoing management of our own GHGs.
As climate change is a global issue, the response must also be global and we support collective actions leading to global emissions reduction. World demand for energy has grown and is expected to continue to grow, and clean, affordable and reliable energy will be critical to improving and maintaining standards of living, economic growth and national and international security. While renewables are the fastest growing form of new power generation, respected authorities such as the International Energy Agency forecast that oil and natural gas will continue to be dominant energy sources and a vital part of the energy mix for decades to come. Our investment in balanced and sustainable energy systems, our current asset portfolio and our future growth plans all reflect the long-term supply and demand forecasts for all forms of energy.
TransCanada’s approach to managing GHGs and the resilience of our business model in a lower carbon economy are of significant interest to our stakeholders. Many of our stakeholders are focused on two key areas: how our pipelines fit into the broader global efforts to address GHG emissions, and how we manage the GHG emissions generated by our facilities and assets.
GHG emissions generated by our facilities and assets are primarily produced through our consumption of natural gas as a fuel source to power operations, intentional engineered releases of natural gas, and infrequent and unintentional releases of natural gas. We also have associated indirect emissions from the electricity purchased to power our facilities.
We own assets and have business interests in a number of regions subject to GHG emissions regulations, including GHG emissions management and carbon pricing policies, and our emissions have a financial impact on our expenses.
For details about the financial implications and other risks and opportunities for the organization’s activities due to climate change, please refer to the Financial performance section.
For more information on the International Energy Association, please visit their website.
Commitment
TransCanada is committed to managing our GHG emissions, focusing on our GHG intensity and continuing to integrate climate considerations into our overall business strategy in areas such as risk management, business development, and competitive advantage.
Our commitment to a balanced energy future includes investing in new energy infrastructure and advancing innovative and economically effective solutions to reduce our GHG emissions.
TransCanada is an industry leader in developing and implementing new practices and technologies to reduce fugitive emissions and reduce the loss of natural gas and associated methane emissions during routine operations and maintenance.
We recognize the need for sensible public policy frameworks focused on managing emissions and will continue to engage in dialogue to help our industry fully participate in the North American discussion on climate change.
We publicly document our response to climate change strategies through the CDP, and voluntarily disclose our performance to the DJSI and Corporate Knights.
In all the jurisdictions where we operate—Canada, the U.S. and Mexico—we employ TransCanada’s operating procedures to inspect and maintain our facilities and we comply with regulatory requirements to track and report our emissions.
We set absolute and intensity-based GHG emissions targets based on regulatory requirements in Alberta, Ontario, Québec, California and certain states in the U.S. Northeast.
Our Alberta natural gas pipeline facilities and energy assets are subject to Alberta’s Carbon Competitiveness Incentives Regulation (CCIR). This regulation establishes annual intensity targets for facilities and/or industry sectors. Options for meeting CCIR targets include operational changes, payments, use of offsets and use of performance credits.
TRANSCANADA MAP
TABLE OF CONTENTS
CEO’S MESSAGE
WHO WE ARE
ABOUT THIS REPORT
WHAT CR MEANS TO US
A HEALTHY AND SAFE ENVIRONMENT AND COMMUNITY
Integrity of pipelines and facilities
Emergency preparedness and response
Health and safety of communities, employees and contractors
Climate change and greenhouse gas emissions
AN ENGAGED COMMUNITY
A THRIVING ECONOMY
CAUTIONARY NOTE
APPENDIX
GRI G4 INDEX

TransCanada Corporate Responsibility Report 2017 43
In California, Ontario and Québec where cap-and-trade programs are in place, we can employ a variety of operational and market mechanisms to obtain emission units and offset credits.
To learn more about our commitment, download our Health, Safety and Environment Commitment Statement.
Approach
Representatives from corporate functional groups and business units continuously review and refine our approach to managing climate change risks and actively pursue opportunities. Updates are provided to executives and the HSE Committee of the Board of Directors. Our president and CEO holds the highest level of responsibility for addressing these issues, and accountability and responsibility from the CEO cascades throughout the organization.
With the Board of Directors’ (the Board) oversight, we manage climate change risks and opportunities and have dedicated resources to this area. Climate-related risks are an important consideration in our strategic priorities and this topic has been included in strategic planning sessions with the Board. In addition, at every scheduled meeting, the Board is provided a briefing on “top-of-mind” business risks that have included the financial, reputational and shareholder impacts of environmental, social and governance issues, and more specifically, risks associated with climate change. TransCanada’s Board is comprised of knowledgeable and experienced directors and we regularly assess the skill set of our Board. We aim to maintain the composition of the Board in a way that provides the best mix of skills and experience to guide our strategy and oversee ongoing business operations.
Through alignment to TOMS, our Environment Program provides a systematic approach to ensure regulatory compliance and effective management of environmental risks, including those related to climate change.
A healthy and safe environment and community
Climate change and greenhouse gas emissions
TAKING ACTION TO REDUCE EMISSIONS
Technological advancements are critical to managing the complex and interrelated issues surrounding GHG emissions. We continuously seek innovative and economically effective solutions to improve system and process efficiencies that help manage emissions. Through the development of world-class technologies, we are working hard to reduce the GHG intensity of our operations, and reduce energy use on our pipelines and other facilities.
We have one of Canada’s largest corporate R&D programs, with a focus on improving the safety and efficiency of our operations. Examples include:
• When conducting natural gas pipeline maintenance we use mobile compressors wherever possible to redirect natural gas into another section of pipeline, thereby reducing the amount of natural gas released into the atmosphere.
• We have a partnership with Rolls-Royce to conduct trials on a new generation of natural gas-powered turbines that move gas through our network with greater efficiency.
• We partner with other energy companies to capture waste heat from our facilities for power generation. For example, in a partnership with Mistral and BC Hydro, our Crowsnest compressor station in southeastern British Columbia uses waste exhaust heat from the facility’s gas turbines to produce up to 6.5 MW of clean electricity—enough to meet the needs of 4,000 households annually.
• We work to prevent leaks and reduce fugitive releases through our Pipeline and Facility Integrity programs. Our Fugitive Emissions Inspection and Leak Repair Program, for example, identifies leaks on pipeline and compressor station components (such as valves), helping reduce releases of natural gas.
• In 2017 we implemented a new technology in Canada to improve the tracking of our natural gas pipeline fugitive emissions data at valve sites, meter stations and compressor stations. The technology will improve operations and regulatory reporting activities resulting in improved ability to plan maintenance and analyze pipeline data.
For more details on our approach to pipeline integrity, please refer to the Integrity of pipelines and facilities section.
TRANSCANADA MAP
TABLE OF CONTENTS
CEO’S MESSAGE
WHO WE ARE
ABOUT THIS REPORT
WHAT CR MEANS TO US
A HEALTHY AND SAFE ENVIRONMENT AND COMMUNITY
Integrity of pipelines and facilities
Emergency preparedness and response
Health and safety of communities, employees and contractors
Climate change and greenhouse gas emissions
AN ENGAGED COMMUNITY
A THRIVING ECONOMY
CAUTIONARY NOTE
APPENDIX
GRI G4 INDEX

TransCanada Corporate Responsibility Report 2017 44
A healthy and safe environment and community
Climate change and greenhouse gas emissions
PROVIDING EMISSION-LESS ENERGY SOURCES AND POWER GENERATION
The power generation business remains a very important part of our portfolio and our long-term strategy. TransCanada owns or has interests in 11 power generation facilities with combined capacity of 6,100 MW —enough to power more than six million homes. More than one-half of the power we provide is generated from emission-less sources including nuclear and wind, and we are leaders in the development and operation of high-efficiency, natural gas-fired power facilities.
Our divestiture of hydro and wind assets in the U.S. Northeast power market was a strategic decision as part of the financing for our acquisition of CPG. These were high quality facilities that served us well, but the fact that they operate in a merchant power market did not align with our focus on assets that are underpinned by long-term contracts or cost-of-service business models that provide stable and predictable revenue streams. Our decision to sell the Ontario Solar facilities in late-2017 was based on the opportunity to maximize the value of this asset as a power facility that was attractive to the market and represented less than two per cent of our generation capacity. The sale of the hydro, solar and some wind assets is not a reflection of the role that renewable energy plays in our strategy.
We continue to pursue growth opportunities in the power business across North America that fit with our business strategy and risk preferences. We believe that billions of dollars of new investment will be required as we shift to electricity sources that have a lower GHG emissions intensity, including renewables, nuclear and natural gas-fired power generation.
WORKING WITH OTHERS ON CLIMATE CHANGE
We also contribute to a unified North American response to climate change through memberships in industry organizations, engagement with government and stakeholder representatives on climate change policy developments and funding research into GHG emissions reduction opportunities.
We continue to engage with policy-makers and industry peers. In 2017:
• We sponsored an independent study that was conducted by the Conference Board of Canada on Canadian Economic and Social Implications of Deep GHG Reductions and provided input to the Government of Canada on its commitment to reduce methane emissions in the oil and gas sector.
• As a founding partner in the U.S. EPA’s Natural Gas STAR Methane Challenge Program, which was launched in 2016, we continue to implement an industry-leading best management practice across our operations within five years, to address emission sources specified by the program.
• We voluntarily provided the EPA with 2016 Natural Gas STAR methane reductions data for our U.S. Gas Operation facilities. TransCanada will continue participation in the program as implementation of these practices supports our commitment to developing innovative and economically effective solutions to reduce our GHG emissions footprint.
No significant adjustments to our approach to climate change and management of our own GHG emissions were identified for the 2017 reporting period.
Further details on our actions to disclose carbon emissions and mitigate the business risk of climate change risks will be available on our 2017 CDP Report, when made available to the public.
TRANSCANADA MAP
TABLE OF CONTENTS
CEO’S MESSAGE
WHO WE ARE
ABOUT THIS REPORT
WHAT CR MEANS TO US
A HEALTHY AND SAFE ENVIRONMENT AND COMMUNITY
Integrity of pipelines and facilities
Emergency preparedness and response
Health and safety of communities, employees and contractors
Climate change and greenhouse gas emissions
AN ENGAGED COMMUNITY
A THRIVING ECONOMY
CAUTIONARY NOTE
APPENDIX
GRI G4 INDEX

TransCanada Corporate Responsibility Report 2017 45
A healthy and safe environment and community
Climate change and greenhouse gas emissions
Performance
INDICATOR: Direct (Scope 1) greenhouse gas emissions (G4-EN15)
In 2017 we reduced our direct GHG emissions by 24 per cent overall compared to 2016. This decrease was primarily attributed to the sale of our U.S. Northeast power assets in April 2017. An increase in emissions from our natural gas pipeline assets is in part due to operation of CPG assets under our control for the first full calendar year.
Greenhouse gas emissions 2013 2014 2015 2016 2017
Direct GHG emissions (millions tCO2e)1 12.2 12.7 13.0 16.2 12.3
Natural gas pipelines 7.1 7.4 7.3 8.3 8.5
Liquids pipelines 0 0 0 0 0
Power 5.1 5.3 5.7 7.8 3.8
Notes: TransCanada’s direct GHG emissions reporting boundary is based on an asset equity share. TransCanada does not track emissions based on an operational control boundary, and thus this information is omitted. However, our 2012 CDP Report, which disclosed 2011 data, used an operational control boundary. This data includes: • Canada, the U.S. (including CPG assets as of July 1, 2016) and Mexico natural gas pipelines • Power assets The following assets are excluded: • Oil and gas storage assets and liquids pipelines – both are below direct GHG regulatory reporting
thresholds. Emissions from pumping operations are low, as pumps are mainly electrically driven and, therefore, have no emissions for normal operation; however, auxiliary power units during power outages can generate some GHG emissions.
• U.S. Northeast power assets, including Ravenswood and Ironwood, which were sold in April 2017 Data reported in previous TransCanada corporate responsibility reports may differ from the above, as the data has been updated to reflect finalized data. The transportation fuel GHG emissions in 2016 has been restated from 180,000 due to a reporting error in the 2016 CSR Report. The impact on TransCanada’s overall emissions profile is immaterial.In 2017, data for transportation fuel associated with aviation and fleet vehicles was not available at time of publication. This data will be available and reported in TransCanada’s CDP response.
1 TransCanada calculates its direct GHG emissions using a combination of methods required by various regulations in different jurisdictions. We report our emissions to British Columbia, Alberta, Ontario, Québec, Environment and Climate Change Canada, the U.S. EPA, California, Oregon, Washington, the Regional Greenhouse Gas Initiative and Mexico’s Ministry of Environment and Natural Resources (SEMARNAT). Due to the sale of U.S. Northeast power assets in 2017, TransCanada did not report full year for the Regional Greenhouse Gas Initiative. These calculation methods can include direct measurement and emission factors in conjunction with operating conditions. Emissions are estimated for vented and fugitive emissions and based on assumptions about operations using experienced staff with direct operational knowledge, including, for example, estimated fuel consumption. • CO2, methane, and nitrous oxide are included in Scope 1 emissions. • CO2 emissions are calculated based on fuel gas measurements at pipeline and power generation facilities. • Methane emissions are calculated using field reports for blowdowns and an extensive in-house set of
emission factors for calculating fugitive emissions. • Nitrous oxide is calculated based on engine-specific emissions factors. The global warming potentials are based on IPCC assessments. An emission factor of 0.0086 for methane combustion at natural gas turbines is based on EPA AP 42, fifth edition.
TRANSCANADA MAP
TABLE OF CONTENTS
CEO’S MESSAGE
WHO WE ARE
ABOUT THIS REPORT
WHAT CR MEANS TO US
A HEALTHY AND SAFE ENVIRONMENT AND COMMUNITY
Integrity of pipelines and facilities
Emergency preparedness and response
Health and safety of communities, employees and contractors
Climate change and greenhouse gas emissions
AN ENGAGED COMMUNITY
A THRIVING ECONOMY
CAUTIONARY NOTE
APPENDIX
GRI G4 INDEX

TransCanada Corporate Responsibility Report 2017 46
A healthy and safe environment and community
Climate change and greenhouse gas emissions
INDICATOR: Greenhouse gas emissions intensities (G4-EN18)
This is our second year reporting GHG intensity data by region. We experienced a consistent decrease in intensities across all regions, except Mexico. This decrease is largely due to the sale of U.S. Northeast power assets in April 2017 and a drop in utilization of our Canadian Mainline.
Greenhouse gas emissions intensity 2013 2014 2015 2016 2017
Natural gas pipelines emissions intensity1 (tCO2e/Bcf) 500 520 560 – – U.S. – – – 293 280 Canada – – – 991 779 Mexico – – – 136 145
Power generation emissions intensity 2 (tCO2e/MWh) 0.17 0.17 0.15 0.19 0.12
Notes: Emissions intensities are calculated based on Scope 1 emissions, excluding Scope 2 and heat products (for power generation emissions intensity). For natural gas pipelines emissions intensity: This data includes: • Natural gas pipeline assets in Canada, the U.S. and Mexico This data does not include: • Oil and gas storage assets and liquids pipelines in Canada, the U.S. and Mexico • Power facilities in Canada, the U.S. and Mexico For power generation emissions intensity: This data includes: • All TransCanada power facilities (excluding U.S. Northeast power assets sold in April 2017)
This data does not include: • Liquids and natural gas pipeline assets in Canada, U.S. and Mexico 1 The relationship between natural gas transmission pipeline GHG emissions and the volume of gas transported is complex. Comparisons of emissions intensities between natural gas transmission pipeline systems must consider the type of pipeline network and the service that it is providing.2 Many of TransCanada’s electricity generating facilities also generate a heat product, which is not accounted for here. Therefore, the emissions intensity presented for this indicator is only partially representative of the company’s true emissions intensity. 2016 Bruce Power generation was used for the 2017 data, as the data was not provided in time for production of the 2017 Corporate Responsibility Report.
TRANSCANADA MAP
TABLE OF CONTENTS
CEO’S MESSAGE
WHO WE ARE
ABOUT THIS REPORT
WHAT CR MEANS TO US
A HEALTHY AND SAFE ENVIRONMENT AND COMMUNITY
Integrity of pipelines and facilities
Emergency preparedness and response
Health and safety of communities, employees and contractors
Climate change and greenhouse gas emissions
AN ENGAGED COMMUNITY
A THRIVING ECONOMY
CAUTIONARY NOTE
APPENDIX
GRI G4 INDEX

TransCanada Corporate Responsibility Report 2017 47
An engaged community
TRANSCANADA MAP
TABLE OF CONTENTS
CEO’S MESSAGE
WHO WE ARE
ABOUT THIS REPORT
WHAT CR MEANS TO US
A HEALTHY AND SAFE ENVIRONMENT AND COMMUNITY
AN ENGAGED COMMUNITY
Stakeholder engagement
Indigenous relations
Working with landowners
Employee attraction, retention and development
Community investment
A THRIVING ECONOMY
CAUTIONARY NOTE
APPENDIX
GRI G4 INDEX
Collaborating with the town of Napanee, Ontario, we helped build a playground to support the needs of the community. We focus our community investment efforts on addressing community-driven needs to help build community capacity, keep communities safe, support a talented workforce and protect and enhance the environment.
TransCanada Corporate Responsibility Report 2017 47

TransCanada Corporate Responsibility Report 2017 48
Our ability to foster mutual trust and respect through engagement and consultation with stakeholders where we propose projects and operate assets.
Operating context
Making sure stakeholders are meaningfully engaged and respected is critical to TransCanada’s success. The strength of these relationships has a direct impact on our ability to competitively build and operate our assets.
Building relationships with local communities helps us understand our potential impacts on the community, mitigate adverse effects and seek opportunities for economic participation and community investments.
Engagement also supports our overarching goal to maintain the safety and integrity of our assets. Local stakeholders are important partners in preventing damage and reporting hazards and risks to pipelines, people and the environment.
For an overview of TransCanada’s stakeholders, please refer to the What corporate responsibility means to us section.
Commitment
TransCanada’s approach to engagement with people and groups who may be affected by our activities is rooted in our core values of safety, integrity, responsibility and collaboration. These values guide us in our interactions with stakeholders. We are committed to working collaboratively with our neighbours to ensure we contribute in a meaningful way. By engaging early with our stakeholders and listening, we create project plans with better outcomes for everyone involved.
While we have built strong relationships with thousands of communities, backed by generations of co-operation and trust, we are also committed to earning public confidence from those communities we have not yet worked with.
We are committed to listening closely to the needs of all our stakeholders, including our opponents, and responding with positive solutions that enable us to meet people’s energy needs in a manner that builds trust. We also acknowledge that building trust takes time and that, in some cases, we may not be able to meet all stakeholder expectations, but we strive to present factual, clear and consistent information to ensure our stakeholders are informed.
Our Stakeholder Engagement Commitment Statement and Health, Safety and Environment Commitment Statement outline our promise to stakeholders and provide guiding principles that employees and contractors are expected to follow.
Approach
TransCanada requires community engagement throughout the life cycle of our assets, from project approval to decommissioning.
Our approach to engagement, from acquisition and new construction to ongoing maintenance and upgrades, is integrated into our Project Delivery Standard.
Prior to and during the project approval process, some of the ways we work to identify potential environmental and socio-economic effects are by hosting local open houses, conducting public presentations with affected stakeholders and having one-on-one discussions. Written materials and other forms of communication, including fact sheets, brochures, websites, email and toll-free telephone lines, supplement our in-person outreach.
Ongoing engagement efforts throughout the life of an asset include helplines and online accounts that enable landowners to reach TransCanada personnel 24 hours a day, as well as integrity initiatives—such as “call and click before you dig”—to educate and raise public awareness about pipelines.
We also participate in industry groups and engage in policy discussions with regulators and government.
An engaged community
Stakeholder engagementTRANSCANADA MAP
TABLE OF CONTENTS
CEO’S MESSAGE
WHO WE ARE
ABOUT THIS REPORT
WHAT CR MEANS TO US
A HEALTHY AND SAFE ENVIRONMENT AND COMMUNITY
AN ENGAGED COMMUNITY
Stakeholder engagement
Indigenous relations
Working with landowners
Employee attraction, retention and development
Community investment
A THRIVING ECONOMY
CAUTIONARY NOTE
APPENDIX
GRI G4 INDEX

TransCanada Corporate Responsibility Report 2017 49
Continuous improvement and performance measurement
To enable continuous improvement, we document lessons learned from engagement activities and share these learnings with project teams and operations staff.
We measure the effectiveness of our engagement approach by tracking and responding to all issues and concerns raised by stakeholder groups. We measure our level of stakeholder engagement by recording the number of meetings attended and the number of new projects partnered on.
In 2017, TransCanada conducted extensive stakeholder engagement on all of our capital projects including ongoing issue management, public awareness and community engagement through our field community relations staff. TransCanada also began reviews and increased internal emphasis of its stakeholder tracker system and community engagement activities to improve systems, processes and tools that will enhance future data accuracy and quality.
Performance
INDICATOR: Percentage of operations with implemented local community engagement, impact assessments and development programs (G4-SO1)
We develop community engagement plans for 100 per cent of our projects, and all operating regions have personnel dedicated to engagement and the ongoing management of issues. Through the impact assessments developed for all projects requiring approval in Canada, the U.S. and Mexico, we identify potential issues and management measures to resolve them. These assessments involve local community engagement, which is complemented by ongoing community engagement activities conducted by our community relations group.
INDICATOR: Community relations engagement with TransCanada stakeholders
In 2017, our engagement activities spanned more than 410 local and regional municipalities in six Canadian provinces, 430 counties in 16 U.S. states and 1,567 communities in 62 regional municipalities across 11 Mexican states. While we reported approximate data for community relations engagement with stakeholders for all TransCanada operations and assets in Mexico and Canada last year, we continue to enhance our performance tracking in the U.S., so we do not present a regional breakdown of performance data in this report.
Notes:• Data includes in person or face-to-face engagement, such as open houses, meetings, presentations,
tours and emergency response engagement. Conference calls are not included. • This data is not wholly reflective of all TransCanada stakeholder engagement activities conducted by
the community relations group in 2017. Additional stakeholder engagement activities are conducted by other TransCanada groups.
• Numbers are approximate and illustrative, as communities and stakeholders engaged across multiple projects may be counted more than once. We are currently working to improve our processes for recording and reporting our stakeholder engagement activities for future reporting years.
An engaged community
Stakeholder engagement
Building relationships with local communities helps us understand our potential impacts on the community, mitigate adverse effects and seek opportunities for economic participation and community investments.
TRANSCANADA MAP
TABLE OF CONTENTS
CEO’S MESSAGE
WHO WE ARE
ABOUT THIS REPORT
WHAT CR MEANS TO US
A HEALTHY AND SAFE ENVIRONMENT AND COMMUNITY
AN ENGAGED COMMUNITY
Stakeholder engagement
Indigenous relations
Working with landowners
Employee attraction, retention and development
Community investment
A THRIVING ECONOMY
CAUTIONARY NOTE
APPENDIX
GRI G4 INDEX

TransCanada Corporate Responsibility Report 2017 50
An engaged community
Indigenous relations
Our ability to foster mutual trust and respect through engagement and consultation with Indigenous groups where we propose projects and operate assets.
Operating Context
TransCanada strives to build co-operative, mutually beneficial and lasting relationships as we seek to establish trust and respect through considerate engagement with Indigenous groups on whose traditional lands we work. Acknowledgement and respect of Indigenous rights and cultures frame TransCanada’s approach.
TransCanada builds and operates in Canada, the U.S. and Mexico, and complies with the laws of each of the three countries, including their guidance on engagement with Indigenous groups.
In Canada, the Aboriginal and treaty rights of Indigenous peoples are constitutionally protected. While federal and provincial governments hold responsibility for consultation, procedural aspects may be delegated to proponents like TransCanada.
In the U.S., Indian Tribes have a government-to-government relationship with federal and state agencies. Section 106 of the National Historic Preservation Act requires federal agencies to consider the effects of their activities on historic properties, including properties of religious and cultural significance to recognized Indian Tribes. Tribal participation may also be directed under the National Environmental Policy Act, the American Indian Religious Freedom Act, the Native American Graves Protection and Repatriation Act and Executive Orders.
In Mexico, the Hydrocarbon Law requires the state to carry on consultation with the communities affected by energy projects. This consultation is conducted by the Secretary of Energy and must be concluded prior to a project’s implementation, including the acquisition of the ROW land and filing of local permits. Once state authorities conclude consultation, TransCanada engages with Indigenous groups to facilitate project-related participation and to deliver opportunities that support our goal of enduring, positive relationships.
Each country’s regulatory requirements are different, and Indigenous rights are subject to ongoing interpretation through legal decisions. TransCanada acknowledges the interests and concerns expressed by Indigenous groups regarding pipelines and other developments through its engagement record.
The Indigenous Relations Program follows TOMS, establishing goals and performance indicators that support TransCanada’s corporate strategy.
Commitment
We recognize Indigenous groups as rights holders who have a distinct relationship to the land. We understand that TransCanada’s business activities have the potential to affect Indigenous groups in tangible ways and we engage early with potentially affected Indigenous groups to understand their interests, identify opportunities, respond to concerns, and facilitate participation in our projects. We strive to earn respect and trust with Indigenous groups through collaboration and open communication, and work on continuously improving our engagement practices to manage risk, and to create opportunities.
Approach
TransCanada’s engagement with Indigenous groups builds on the our Aboriginal Relations and Native American Relations policies. Consideration of the traditional practices of the Indigenous groups in whose territory we operate. We act in accordance with our guiding principles:
• Ensuring meaningful and respectful engagement with Indigenous groups, as early as possible, using a principled approach.
• Achieving regulatory certainty using a pragmatic approach in the jurisdiction where we are building or operating.
• Building innovative project strategies, reflecting engagement and regulatory outcomes that are defensible, commercially reasonable, and community-led.
• Recognizing the unique connection of Indigenous groups to the land and community governance.
TRANSCANADA MAP
TABLE OF CONTENTS
CEO’S MESSAGE
WHO WE ARE
ABOUT THIS REPORT
WHAT CR MEANS TO US
A HEALTHY AND SAFE ENVIRONMENT AND COMMUNITY
AN ENGAGED COMMUNITY
Stakeholder engagement
Indigenous relations
Working with landowners
Employee attraction, retention and development
Community investment
A THRIVING ECONOMY
CAUTIONARY NOTE
APPENDIX
GRI G4 INDEX

TransCanada Corporate Responsibility Report 2017 51
Our Indigenous Relations Strategy is founded on engaging communities, supported by community legacy, and project participation. We work with Indigenous groups and tailor our engagement approach to be responsive to the unique circumstances of each group. Our understanding is informed by region-specific training and workshops, such as the Indigenous Cultural Awareness Program, which outline the history, cultures and protocols of Indigenous groups. These sessions cover TransCanada’s policies and engagement requirements, helping all TransCanada employees and contractors acquire the knowledge and skills needed to engage with Indigenous groups.
TransCanada provides resources to Indigenous groups to support their participation in a project’s regulatory approval process. Through active participation in activities like fieldwork and traditional land use studies, Indigenous groups make their own assessment of a project’s potential effects.
Our community-led Traditional Knowledge (TK) program supports the collection of TK information in Canada, enabling Indigenous groups to identify potential effects on traditional land and resource use from their own perspective. This supports the development of responsive mitigation and informs project planning. TransCanada applied this innovative approach to six projects in 2017, resulting in the completion of 32 community-led TK studies.
In the U.S., TransCanada facilitates the opportunity for Tribes to conduct cultural traditional studies to support project planning and in compliance with Section 106 of the National Historic Preservation Act.
In Mexico, TransCanada works with Indigenous communities to identify, foster and sponsor initiatives that enhance the preservation of their culture and heritage.
We endeavour to reach consent on our projects from Indigenous groups and to avoid or mitigate any project-related effects on Indigenous rights through collaboration and sound environmental and project planning. Some examples include:
• On the McLeod River North project in Canada, an Indigenous group asked to hold a pipe ceremony prior to construction. TransCanada worked with the group and the ceremony occurred before construction began. The outcome
was positive for both TransCanada and the Indigenous group as it displayed our respect for the traditional customs of the Indigenous groups we work with, reinforcing a relationship based on trust and respect.
• When engaging in Mexico on the Tula project, two communities raised concerns about the construction process due to misinformation from opponents of the pipeline. To provide accurate information, TransCanada organized tours of the construction site for members of the Indigenous groups and invited them to see TransCanada’s reclamation work by visiting reforestation sites. This strengthened our relationship with these groups,and provided an opportunity for us to dispel much of the misinformation the groups had heard about our work.
• TransCanada partnered with the Osage Nation on the creation of eight travelling culture trunks. The trunks are filled with Osage artefacts and art for engaged learning of the Osage history and encourage a hands-on interaction with the Osage culture.
TransCanada develops Indigenous project participation plans for Canadian capital expansions, and collaborates with regional operations teams to transition project relationships and commitments. Participation agreements with Indigenous groups affected by our activities are one way we acknowledge the unique governance of Indigenous communities, their relationship to the land and legal standing. Agreements are kept confidential, as part of our commitment to maintaining trust.
We continue to explore opportunities to expand the participation of Indigenous groups in our activities. For example, in the U.S. we invite Tribes on whose land we have assets to attend regional public awareness and damage prevention training. In 2017, we held our first joint emergency response exercise with a Tribal community.
Throughout North America, our engagement team plays an important role in delivering our community legacy investment to Indigenous groups. We look to Indigenous groups to identify their needs and interests for community legacy initiatives.
An engaged community
Indigenous relationsTRANSCANADA MAP
TABLE OF CONTENTS
CEO’S MESSAGE
WHO WE ARE
ABOUT THIS REPORT
WHAT CR MEANS TO US
A HEALTHY AND SAFE ENVIRONMENT AND COMMUNITY
AN ENGAGED COMMUNITY
Stakeholder engagement
Indigenous relations
Working with landowners
Employee attraction, retention and development
Community investment
A THRIVING ECONOMY
CAUTIONARY NOTE
APPENDIX
GRI G4 INDEX

TransCanada Corporate Responsibility Report 2017 52
The Indigenous Relations Program and Strategy formalize our commitment to education and training, and we rely on Indigenous groups to shape and guide these initiatives. We work directly with communities to develop an education and training plan that supports the needs of the Indigenous group. This approach facilitates the planning and implementation of community education and training initiatives in advance of projects to maximize project participation.
We are excited about the response to the launch of the TransCanada Community Scholarships Program which includes the company’s Indigenous Legacy Scholarship, awarded to 50 Indigenous students from communities within TransCanada’s operations and business footprint in Canada and the U.S. Through the scholarship program, TransCanada supported 25 students in Canada from 22 Indigenous groups, and 25 students in the U.S. from 13 Tribes in 2017.
For more details on TransCanada’s Community Scholarships Program, please refer to the Community investment section
Continuous improvement and performance measurement
Our Indigenous Relations Program brings a consistent approach to the delivery of Indigenous Relations engagement, which is fit-for-purpose, and adaptable across geographies. Performance monitoring is one means by which the Indigenous Relations Program assesses its effectiveness, guides continuous improvement, ensures compliance and manages risk. We ensure that lessons learned from previous project-based engagement efforts are applied to future activities wherever possible.
Performance
INDICATOR: Engagement with Indigenous groups
In 2017 TransCanada advanced 157 projects, and engaged with 348 potentially affected Indigenous groups across North America. Our commitment to building respectful, mutually beneficial and lasting relationships is demonstrated by our
regional liaisons’ ongoing work with Indigenous groups. Their engagement reflects the scale and nature of projects as well as the level of Indigenous group interest in ongoing engagement. Operations-related engagement activities are not tracked; engagement statistics are specific to our work on capital projects.
We seek the participation of Indigenous groups in the development of mitigation strategies for environmental, socio-economic and other potential effects. We collaborate with Indigenous groups to identify opportunities for project participation, which may include developing employment and training plans. We believe in supporting local Indigenous groups near our projects and providing opportunities through employment and contracts to local residents and businesses.
INDICATOR: Indigenous relations business engagement
Indigenous Relations Business Engagement is one of our greatest opportunities to build mutually beneficial relationships with Indigenous groups, maximize opportunities for participation of local qualified and competitive Indigenous businesses, and employ people from communities where we operate. TransCanada works with Indigenous groups to identify businesses and individuals who are interested in project-related contracting opportunities. This information informs our Indigenous Relations Business Engagement strategy, which outlines the processes used to make contracting and employment opportunities available to qualified and competitive Indigenous businesses. Indigenous Relations Business Engagement focuses on aligning capacity and capabilities with project requirements. Through our Supplier Diversity and Local Participation Program, we also require contractors to facilitate and report on contracting and employment with Indigenous businesses and people.
In 2017 TransCanada generated more than $75 million in work for Indigenous businesses or their joint-venture partners in Canada and the U.S. through the purchase of goods, contract services and employment on TransCanada projects.
An engaged community
Indigenous relationsTRANSCANADA MAP
TABLE OF CONTENTS
CEO’S MESSAGE
WHO WE ARE
ABOUT THIS REPORT
WHAT CR MEANS TO US
A HEALTHY AND SAFE ENVIRONMENT AND COMMUNITY
AN ENGAGED COMMUNITY
Stakeholder engagement
Indigenous relations
Working with landowners
Employee attraction, retention and development
Community investment
A THRIVING ECONOMY
CAUTIONARY NOTE
APPENDIX
GRI G4 INDEX

TransCanada Corporate Responsibility Report 2017 53
Our ability to engage with landowners in a positive and consistent manner.
Operating context
TransCanada builds, operates and maintains assets that last generations, so we approach our relationships with landowners who may be affected by our activities with the long term in mind.
We are proud of the positive relationships we continue to build and maintain with close to 100,000 landowners across Canada, the U.S. and Mexico and know that these relationships are critical to our success.
Commitment
We are committed to building and maintaining positive relationships with landowners throughout the life of our assets. Our approach to engagement with people and groups who may be affected by our activities is rooted in our core values of safety, integrity, responsibility and collaboration, and our guiding principles for working with landowners.
To learn more, read our Working with Landowners: Our Guiding Principles, the Stakeholder Relations Brochure or download our full Stakeholder Engagement Commitment Statement.
Approach
Our Guiding Principles establish the approach and code of conduct for all our landowner engagement. We believe all TransCanada employees, contractors, agents and representatives are our ambassadors. Each ambassador is responsible for building and maintaining positive relationships with landowners and abiding by these guiding principles throughout the life of our assets:
1. RESPECTFUL AND TRUSTWORTHY
We recognize the importance and value of developing and maintaining relationships with landowners that are based on respect and trust. We seek to understand, document and resolve landowner concerns through collaborative and mutually beneficial means.
2. HONEST
We engage landowners early and often. Engaging means listening, providing accurate information and responding to questions in a prompt and consistent manner. We use honest and transparent business practices to build strong relationships.
3. FAIR
Our goal is to develop mutually beneficial relationships that are fair and reasonable, balancing landowner concerns and perspectives with business needs.
4. ACCOUNTABLE
We fulfil our commitments and take ownership for our actions. We carry out our business activities in compliance with our corporate policies and applicable laws and regulations.
An engaged community
Working with landownersTRANSCANADA MAP
TABLE OF CONTENTS
CEO’S MESSAGE
WHO WE ARE
ABOUT THIS REPORT
WHAT CR MEANS TO US
A HEALTHY AND SAFE ENVIRONMENT AND COMMUNITY
AN ENGAGED COMMUNITY
Stakeholder engagement
Indigenous relations
Working with landowners
Employee attraction, retention and development
Community investment
A THRIVING ECONOMY
CAUTIONARY NOTE
APPENDIX
GRI G4 INDEX

TransCanada Corporate Responsibility Report 2017 54
5. PROFESSIONAL
We conduct ourselves in a professional and courteous manner, remaining open and frank and taking concerns seriously.
6. RESPONSIBLE FOR PROTECTION OF PRIVATE INFORMATION
We recognize that land records are an important asset that must be carefully managed. We use best practices with respect to records management and the protection of private information.
Continuous improvement and performance measurement
TransCanada uses a Land Program to guide the development, communication, implementation, management and assessment of our activities in all three countries in which we operate. The Land Program follows TOMS, establishing goals and performance indicators that support TransCanada’s corporate strategy and measure our relationships with landowners. Performance monitoring is one way the Land Program assesses its effectiveness, guides continuous improvement, ensures compliance, manages risk and achieves objectives. We also ensure lessons learned from previous project-based engagement efforts are applied to future activities. We are proud of the positive feedback we have received from many of the landowners we have worked with and hold ourselves to the highest of standards to continue to grow these relationships.
In 2018 we will be introducing a regular surveying component for our landowners to ensure our engagement with landowners aligns with our guiding principles. This is a way for us to measure our performance against these principles. We know our approach to engagement is successful when a landowner is satisfied with how we have conducted our operations and with our work to minimize disruptions. As we continuously improve on building and enhancing our relationships with landowners, we will continue to identify appropriate performance improvement and reporting of our engagement performance.
As a landowner along our Great Lakes pipeline in Michigan, Skipper Bettis, owner of Two Hats Ranch (left), says he has always had a positive relationship with TransCanada. Learn more about our guiding principles of landowner engagement on our website.
An engaged community
Working with landownersTRANSCANADA MAP
TABLE OF CONTENTS
CEO’S MESSAGE
WHO WE ARE
ABOUT THIS REPORT
WHAT CR MEANS TO US
A HEALTHY AND SAFE ENVIRONMENT AND COMMUNITY
AN ENGAGED COMMUNITY
Stakeholder engagement
Indigenous relations
Working with landowners
Employee attraction, retention and development
Community investment
A THRIVING ECONOMY
CAUTIONARY NOTE
APPENDIX
GRI G4 INDEX

TransCanada Corporate Responsibility Report 2017 55
Our ability to foster a diverse and inclusive workplace and maintain the talent, skills and expertise of our people required today and in the future.
Operating context
We believe our people are our most important asset, and we attribute much of our success to our talented and diverse workforce. Our employees demonstrate our core values and every individual plays a role in ensuring they are upheld in how we work.
To recruit and attract top talent and maintain a competitive edge, TransCanada offers training and development, charitable giving and volunteering opportunities. Providing our people with training and interesting and challenging development opportunities to help them achieve their full potential is an investment in their success and ours.
As a company that operates in three countries, across multiple provincial and state lines, a diverse and inclusive workforce is essential to driving innovation and collaboration and to sustain our growth.
Commitment
We recognize and reward employees for delivering results that meet or exceed our corporate objectives and support our overall strategy.
Our diversity and inclusion vision is “to reflect communities where we live and work and ensure that everyone is respected and feels that they can contribute to their full potential.” TransCanada is an equal opportunity employer. Our commitment to respect the core principles of dignity, independence, integration and equal opportunity goes beyond our employees and extends to new applicants and other people using our services.
For further details on our commitments to employees and applicants, please visit our Careers site.
Approach
EMPLOYEE ATTRACTION AND DEVELOPMENT
We develop and support our people by providing our employees with the opportunity to grow their careers through on-the-job experience, formal training and networking with peers and leaders. Our Total Rewards program offers employees the flexibility, value and choice in programs to meet their needs. The program includes:
• Competitive compensation packages
• Health and dental, disability and insurance benefit options
• Flex cash, time away from work, vacation and educational support
• Competitive and flexible pension and retirement savings programs
• Career milestone awards, a leader and peer recognition program, and reward opportunities for value-driven performance
EMPLOYEE GIVING AND VOLUNTEERING
Our Empower Program supports and encourages our employees and in-house contractors to give back to their communities by matching charitable donations, rewarding volunteer time with charitable contributions, providing volunteer opportunities, and supporting team volunteering and fundraising. Empower enables our people to support causes that resonate with them personally. We also have an annual campaign called “Get Empowered” that encourages giving and volunteering. The month-long campaign includes events and activities to engage employees and contractors, and this year the Company provided a 200 per cent match for all personal donations to a maximum of $2,000. Thanks to the generosity of our people, the “Get Empowered” campaign raised more than $961,744 for registered charities in Canada, the U.S. and Mexico in just one month.
Please visit the Community Investment section of the report for total employee and contractor contributions to the employee giving and volunteering program in 2017.
An engaged community
Employee attraction, retention and developmentTRANSCANADA MAP
TABLE OF CONTENTS
CEO’S MESSAGE
WHO WE ARE
ABOUT THIS REPORT
WHAT CR MEANS TO US
A HEALTHY AND SAFE ENVIRONMENT AND COMMUNITY
AN ENGAGED COMMUNITY
Stakeholder engagement
Indigenous relations
Working with landowners
Employee attraction, retention and development
Community investment
A THRIVING ECONOMY
CAUTIONARY NOTE
APPENDIX
GRI G4 INDEX

TransCanada Corporate Responsibility Report 2017 56
DIVERSITY AND INCLUSION
In 2017, TransCanada approved a new Diversity and Inclusion Strategy based on four pillars: Executive Commitment, Central Repository, Diversity and Inclusion Council and Action Plan, and the Maturity Meter™ (as the new benchmark). In addition, TransCanada implemented two new Diversity and Inclusion-related trainings. The HR Compliance training is required by all TransCanada employees in Canada, the U.S. and Mexico and includes respectful workplace, privacy of information and diversity and inclusion. The HR Diversity Compliance training is applicable to all TransCanada leaders in Canada and the U.S. and provides information on unconscious bias and Equal Employment Opportunity, Affirmative Action and Employment Equity legal requirements, including representation goals for the four designated and protected groups in Canada and the U.S.
We were one of 104 companies included in the 2018 sector-neutral Bloomberg Gender Equality Index, recognized for our underlying gender disclosures and best-in-class policies and practices.
Performance
INDICATOR: Total number and rates of new employee hires and employee turnover by age group, gender and region (G4-LA1)
2017 was the first full calendar year with CPG fully integrated. Due to this and other 2017 growth initiatives, TransCanada added a significant number of new-hire employees. We work to attract the best people across all our operations as we continue to make our operations more effective and efficient.
Total employee turnover rate increased in 2017 due to an increase in both involuntary and voluntary turnovers. The increase in involuntary turnover is attributable in part to the divestitures made in 2017, including the U.S. Northeast power assets sold in April 2017. We aim to be fair and respectful in our staffing decisions and ensure that all employees have access to the tools and support needed to help manage a transition, if applicable.
To see a breakdown of new hires and employee turnover by age group and gender, please refer to our 2017 Corporate Responsibility Data Sheet.
An engaged community
Employee attraction, retention and development
Notes: This indicator is inclusive of all TransCanada operations and assets from 2015 onward, including CPG as of July 1, 2016. Prior to 2017, new hires did not include CPG assets. Prior to 2015, employee turnover rates excluded Mexico.1 Voluntary turnover includes employees who retired or resigned from employment at TransCanada. There was a change in scope for 2017 from 2016; in 2017 voluntary turnover rates no longer include deceased employees.2 Involuntary turnover includes divestitures, severances, discharges and layoffs. There was a change in scope for 2017 from 2016; prior to 2017, involuntary turnover rates did not include divestitures.
Employee hires and turnover 2013 2014 2015 2016 2017
New hire employees (#) 919 927 385 302 751Canada 686 726 226 147 281U.S. 195 154 125 117 385Mexico 38 47 34 38 85
Employee total turnover rate (%) 5.5 7.5 17.4 11.6 15.0Employee voluntary turnover rate1 4.1 4.1 5.1 3.6 4.0Employee involuntary turnover rate2 1.4 3.4 12.3 8.0 11.0
TRANSCANADA MAP
TABLE OF CONTENTS
CEO’S MESSAGE
WHO WE ARE
ABOUT THIS REPORT
WHAT CR MEANS TO US
A HEALTHY AND SAFE ENVIRONMENT AND COMMUNITY
AN ENGAGED COMMUNITY
Stakeholder engagement
Indigenous relations
Working with landowners
Employee attraction, retention and development
Community investment
A THRIVING ECONOMY
CAUTIONARY NOTE
APPENDIX
GRI G4 INDEX

TransCanada Corporate Responsibility Report 2017 57
Our ability to demonstrate the value of investing in and giving back to the communities where we live, work and operate.
Operating context
With operations spanning Canada, the U.S. and Mexico, investing in and giving back to the communities where we operate are important parts of being a good neighbour, a trusted community partner and an employer of choice.
Community investments help to prevent and mitigate potential adverse environmental and social impacts caused by our operations. These investments—particularly ones that are well-designed and align with both our business and communities’ needs—foster long-term relationships based on trust and contribute to building strong and vibrant communities across North America.
Commitment
We focus our community investment efforts on addressing community-driven needs to help build community capacity, keep communities safe, support a talented workforce and protect and enhance the environment. Whether it is partnering with community groups, supporting local initiatives or encouraging employees to be involved in their neighbourhoods, the goal of our Community Investment Program is to help build strong and vibrant communities across North America.
Approach
Our Community Investment and Empower programs guide our approach to supporting local communities.
COMMUNITY INVESTMENTS
Because the needs and priorities of any community are best determined by those who live and work within it, our local staff members play a large role in implementing our Community Investment Program.
We define community investment as a voluntary contribution, in the form of a grant, in-kind donation or sponsorship, on behalf of the Company in support of a not-for-profit, registered charity, or foundation that generates clear and demonstrable value to the communities where we live, work and operate.
We concentrate our investment efforts on the following four focus areas that are most aligned with the interests of the communities where we conduct our business:
SafetyWe support initiatives that enable emergency personnel to respond effectively to local needs, focus on emergency preparedness and promote energy and pipeline safety education.
CommunityWe support organizations and initiatives that bring communities together, develop leadership and engage citizens.
EnvironmentWe work with national and local organizations to conserve important habitats, protect species at risk and educate individuals about the importance of the environment.
Education and TrainingWe deliver support for education and training using a life cycle approach – meaning we invest in initiatives that address a variety of developmental needs. These range from programs that support early childhood development to technical training at post-secondary institutions.
An engaged community
Community investmentTRANSCANADA MAP
TABLE OF CONTENTS
CEO’S MESSAGE
WHO WE ARE
ABOUT THIS REPORT
WHAT CR MEANS TO US
A HEALTHY AND SAFE ENVIRONMENT AND COMMUNITY
AN ENGAGED COMMUNITY
Stakeholder engagement
Indigenous relations
Working with landowners
Employee attraction, retention and development
Community investment
A THRIVING ECONOMY
CAUTIONARY NOTE
APPENDIX
GRI G4 INDEX
TransCanada Corporate Responsibility Report 2017 58
In 2017 we enhanced our Community Investment Program to inform our investments at an operational level in Canada and the U.S. This included the development of regional community investment plans that draw on knowledge held by our local employees to better support community needs and TransCanada’s business priorities. We will continue to look for opportunities to connect community investment to our business, build capacity in communities, and demonstrate the benefits of partnering with TransCanada.
EMPLOYEE GIVING AND VOLUNTEERING
Our Empower giving and volunteering program also incentivizes employees and contractors to volunteer and make donations to registered charities in their communities. With the help of the corporate matching portion of the program, the contribution of employees to charitable organizations can be impactful. In 2017, Empower created internal and external matching campaigns to support natural disaster relief efforts in Canada, the U.S. and Mexico, totalling more than $250,000. These contributions, along with our additional $300,000, provided immediate local support to communities affected by the southern Alberta and British Columbia wildfires, a tornado in Indiana, wildfires along the U.S. West Coast, Hurricane Harvey and the magnitude 7.1 earthquake in Mexico.
Please visit the Employee attraction, retention and development section of the report for a description of the Empower giving and volunteering program.
Continuous improvement and performance measurement
Launched last year in Canada and the U.S., and expanding into Mexico in 2018, the TransCanada Community Scholarships Program offers financial assistance in four categories: Community Leaders Scholarship, Indigenous Legacy Scholarship, Trade Scholarship (Canada and the U.S. only) and Women’s Scholarship (Mexico only). In 2017, we awarded close to 300 scholarships in more than 150 communities and expect to award 350 in 2018.
In 2017 we launched our Pollinator Pathway Initiative in Michigan—the largest monarch butterfly habitat restoration project of its kind on privately owned lands. In collaboration with our non-profit partner, the Save Our Monarchs Foundation, the initiative restored more than 1,600 hectares (4,000) acres as pollinator habitat with plans to restore a total of 4,451 hectares (11,000 acres) over the next three years.
Also in 2017, TransCanada provided the National Institute for Adult Education (INEA) in Mexico with the largest grant in its 36-year history. INEA’s mission is to provide education to millions of Mexicans who never had the opportunity to study and is aligned with our desire to leave a long-lasting positive impact. The equivalent of US$2 million in donated equipment will enhance the lives of thousands of people living in the areas surrounding TransCanada’s gas pipelines across six states—Guanajuato, Hidalgo, Puebla, Querétaro, San Luis Potosí and Veracruz. The mobile units and equipment will support education in remote places and provide new opportunities for people to learn to read and write.
No significant adjustments to our approach to managing community investment and employee giving were identified for the 2017 reporting period.
Performance
We are a member of London Benchmarking Group (LBG) Canada. Our participation in LBG Canada helps us maximize impact and identify best practices in order to continually improve our Community Investment and Empower programs. Each year, we participate in a detailed, line-by-line audit of our program portfolio. The audit helps us understand the total value our community investment and employee giving and volunteering initiatives bring to the local community.
An engaged community
Community investmentTRANSCANADA MAP
TABLE OF CONTENTS
CEO’S MESSAGE
WHO WE ARE
ABOUT THIS REPORT
WHAT CR MEANS TO US
A HEALTHY AND SAFE ENVIRONMENT AND COMMUNITY
AN ENGAGED COMMUNITY
Stakeholder engagement
Indigenous relations
Working with landowners
Employee attraction, retention and development
Community investment
A THRIVING ECONOMY
CAUTIONARY NOTE
APPENDIX
GRI G4 INDEX

TransCanada Corporate Responsibility Report 2017 59
Notes: This indicator is inclusive of all TransCanada operations and assets, with the exception of the CPG Foundation spend, data for which is included within “funds leveraged through outside sources” for 2017 only. As part of our membership with the London Benchmarking Group, this performance data has been assured by an external third party.1 Social investments involve longer-term strategic involvement in community partnerships that address a specific range of social issues and are important to the Company or to company stakeholders.2 Commercial investments are activities in the community that directly support our business objectives or that promote or protect our commercial interests.3 Philanthropic investments are one-off or intermittent donations in response to charity appeals or in support of employee charitable activities.4 TransCanada defines in-kind giving as donations of equipment or resources to support community programs.5 Community investments, including funds leveraged through outside sources, take into consideration contributions to community projects that can be directly linked to TransCanada’s involvement (but are not included in the investment cost), including additional investment generated from other companies, governments and TransCanada employees.6 Investments as a percentage of total revenue were misstated due to a reporting typo in TransCanada’s 2016 CSR Report. Accurate values were reported in TransCanada’s 2016 CSR Data Sheet and have been corrected in the 2017 Corporate Responsibility Report. Therefore, this restatement is not considered material.
Community investment 2013 2014 2015 2016 2017
Community investment – direct only (CAD$ M) 12.7 14.6 14.7 16.6 15.1
Investments by motivation as a percentage of total portfolio %Social investments1 – – 39 48 38Commercial investments2 – – 11 12 8Philanthropic investments3 – – 50 40 54
In-kind giving (CAD$ M)4 – – 0.34 0.14 2.3
Community investment, including funds leveraged through outside sources (CAD$ M)5 14.7 20.6 20.4 21.9 17.0
Investments as a percentage of total revenue (%)6 6.14 0.14 0.15 0.13 0.11
An engaged community
Community investment
INDICATOR: Direct economic value generated and distributed—community investments (G4-EC1, partial)
TransCanada’s direct community investments in 2017 totalled more than $15 million. Changes in investments by motivation are attributed to more accurate reporting, due to better definitions of motivations and more wide-spread use of reporting protocols.
In 2017 we developed a new process to better track in-kind giving, allowing for more visibility into what is being tracked.
Data for community investments leveraged through outside sources is in part gathered through surveys with our valued partners. In 2017, we received a lower than expected response rate to surveys, contributing to a decrease for this indicator.
TRANSCANADA MAP
TABLE OF CONTENTS
CEO’S MESSAGE
WHO WE ARE
ABOUT THIS REPORT
WHAT CR MEANS TO US
A HEALTHY AND SAFE ENVIRONMENT AND COMMUNITY
AN ENGAGED COMMUNITY
Stakeholder engagement
Indigenous relations
Working with landowners
Employee attraction, retention and development
Community investment
A THRIVING ECONOMY
CAUTIONARY NOTE
APPENDIX
GRI G4 INDEX

TransCanada Corporate Responsibility Report 2017 60
An engaged community
Community investment
INDICATOR: Employee giving and volunteering
In 2017 employee and contractor donations – including donations matched by TransCanada – increased to $3.03 million. In particular, our employee and contractor donations increased by 14 per cent, as 2017 saw an increase in the
number of major disasters that affected communities where our people live and work, including earthquakes in Mexico, Hurricane Harvey in Houston, Canadian wildfires and floods.
This also played a part in the increase of volunteer hours by 38 per cent, as we activated and promoted multiple giving campaigns. In addition, our Empower Program continued to mature, with increased awareness across our business and the integration of our Columbia workforce under the program.
Notes: This indicator is inclusive of all TransCanada operations and assets, including the CPG assets as of August 2017.
Employee Giving & Volunteering 2013 2014 2015 2016 2017
Employee and contractor donations (CAD$ M) – – 0.76 0.77 0.88
Company donations matching employee and contractor donations (CAD$ M) – – 1.81 2.03 2.15
Volunteer hours logged by employees and contractors (# of hours) 6,801 11,553 9,151 11,452 15,826During non-paid time – – 7,531 8,666 12,885During paid time – – 1,620 2,786 2,941
Value of volunteer hours during paid work time (CAD$) – – 76,228 131,089 138,385
TRANSCANADA MAP
TABLE OF CONTENTS
CEO’S MESSAGE
WHO WE ARE
ABOUT THIS REPORT
WHAT CR MEANS TO US
A HEALTHY AND SAFE ENVIRONMENT AND COMMUNITY
AN ENGAGED COMMUNITY
Stakeholder engagement
Indigenous relations
Working with landowners
Employee attraction, retention and development
Community investment
A THRIVING ECONOMY
CAUTIONARY NOTE
APPENDIX
GRI G4 INDEX

TransCanada Corporate Responsibility Report 2017 61
A thriving economyTRANSCANADA MAP
TABLE OF CONTENTS
CEO’S MESSAGE
WHO WE ARE
ABOUT THIS REPORT
WHAT CR MEANS TO US
A HEALTHY AND SAFE ENVIRONMENT AND COMMUNITY
AN ENGAGED COMMUNITY
A THRIVING ECONOMY
Financial performance
Economic benefits of development
Access to markets
CAUTIONARY NOTE
APPENDIX
GRI G4 INDEXSkills training supported by TransCanada at Alexander First Nation is one of the ways our operations can generate direct and indirect economic benefits for the communities where we operate.
Alexander First Nation, Alberta.
TransCanada Corporate Responsibility Report 2017 61

TransCanada Corporate Responsibility Report 2017 62
Our ability to manage the long-term financial stability, competitiveness and return expected by our shareholders in consideration of business risks and opportunities.
Operating context
TransCanada has proudly delivered the energy that millions of North Americans rely on to power their lives and fuel industry for over 65 years. Our vision is to be the leading energy infrastructure company in North America, focusing on pipeline and power generation opportunities in regions where we have or can develop a significant competitive advantage. Our opportunities for long-term success and continued performance are driven by our high-quality portfolio, predictable and low-risk businesses, track record of delivering long-term shareholder value and demonstrated commitment to safety and responsible development.
To achieve our vision, we prepare and adapt to the opportunities and challenges that arise operating in an undeniably complex and evolving energy environment. Challenges include the growing global demand for energy, emerging and revised climate change policies that are accelerating the desire to transition to lower-carbon energy sources, and fluctuating commodity prices. Inadequately managing expectations and issues important to stakeholders, including those related to climate change, could affect our reputation and our ability to operate and grow, and continued access to sources of capital.
Commitment
TransCanada will continue to build and enhance our competitive advantage by executing on the following elements of our strategy:
• Maximize the full-life value of our infrastructure assets and commercial positions.
• Commercially develop and build new asset investment programs.
• Cultivate a focused portfolio of high-quality development and investment options.
• Maximize our strengths and core competencies in safety, operational excellence, supply chain management, project execution and stakeholder management.
TransCanada integrates climate change risks and opportunities into our business strategy and considers regulatory developments, exposure of our assets to the physical climate and the influence of changing public opinion in our business planning. We also consider investments in low-carbon infrastructure as an element of our continued capital program.
We have provided a summary of our financial performance and implications of climate change risks and opportunities on our business in the following section.
Please refer to our 2017 Annual Report for further details on our commitments, management approach and performance and page 85 for further information about GHG emissions regulation risks.
A thriving economy
Financial performanceTRANSCANADA MAP
TABLE OF CONTENTS
CEO’S MESSAGE
WHO WE ARE
ABOUT THIS REPORT
WHAT CR MEANS TO US
A HEALTHY AND SAFE ENVIRONMENT AND COMMUNITY
AN ENGAGED COMMUNITY
A THRIVING ECONOMY
Financial performance
Economic benefits of development
Access to markets
CAUTIONARY NOTE
APPENDIX
GRI G4 INDEX

TransCanada Corporate Responsibility Report 2017 63
Performance
INDICATOR: Direct economic value generated (G4-EC1, partial)
In 2017 we achieved record financial performance following the successful integration of CPG. We continue to build on a robust, low-risk strategy that generates significant value and provides a strong foundation for us to continue delivering results for our shareholders, our customers, our communities and our employees.
Our financial results in 2017 reached new heights as our base businesses performed well, we placed approximately $5 billion of new facilities into service and we recorded our first full year of revenue contribution from the CPG assets. Our total revenues were $13.4 billion in 2017.
Comparable earnings per share increased by 11 per cent compared to 2016 to a record $3.09 per share, and comparable funds generated from operations exceeded $5.5 billion for the first time. Based on this strong performance and
our continued growth, our Board of Directors approved the 18th consecutive annual increase in the common share dividend from $2.50 to $2.76 representing an increase of 10.4 per cent for 2018. We were also successful in raising more than $6 billion in capital markets on innovative and attractive terms to help fund our growth program. Shareholders have been rewarded with a 14 per cent average annual total return since 2000.
Looking forward, we are well-positioned to continue delivering strong and growing results. More than 95 per cent of our earnings before interest, taxes, depreciation and amortization (EBITDA) are generated by regulated or long-term contracted assets.
Our focus is on bringing $23 billion in new rate regulated and contracted facilities into service over the next three years. This will drive increased cash flow and earnings per share, which underpins our commitment to growing our common dividend at an average annual rate at the upper end of eight to 10 per cent through 2020 and an additional eight to 10 per cent in 2021.
*Comparable earnings per share, comparable funds from operations and EBITDA are a non-GAAP measures. See “Non-GAAP measures” in the “Cautionary note” of this report for further information.
A thriving economy
Financial performance
1 Denotes a non-GAAP measure.
Please refer to our 2017 Annual Report for further details on economic value generated.
Financial performance (CAD$ M unless otherwise indicated) 2013 2014 2015 2016 2017
Revenues 8,855 10,267 11,353 12,547 13,449
Comparable EBITDA1 4,859 5,521 5,908 6,647 7,377
Net income/(loss) attributable to common shares 1,712 1,743 (1,240) 124 2,997
Net income/(loss) attributable to common shares ($/share) 2.42 2.46 (1.75) 0.16 3.44
Comparable earnings1 1,584 1,715 1,755 2,108 2,690
Comparable earnings per common share ($/share)1 2.24 2.42 2.48 2.78 3.09
Cash dividends paid on common and preferred shares 1,356 1,439 1,538 1,536 1,494
Common dividends declared per share ($/share) 1.84 1.92 2.08 2.26 2.50
TRANSCANADA MAP
TABLE OF CONTENTS
CEO’S MESSAGE
WHO WE ARE
ABOUT THIS REPORT
WHAT CR MEANS TO US
A HEALTHY AND SAFE ENVIRONMENT AND COMMUNITY
AN ENGAGED COMMUNITY
A THRIVING ECONOMY
Financial performance
Economic benefits of development
Access to markets
CAUTIONARY NOTE
APPENDIX
GRI G4 INDEX

TransCanada Corporate Responsibility Report 2017 64
A thriving economy
Financial performance
INDICATOR: Financial implications and other risks and opportunities for the organization’s activities due to climate change (G4-EC2)
There are a variety of new and evolving initiatives in development across North America at the federal, regional, state and provincial level aimed at reducing GHG emissions and we own assets and have business interests in a number of regions subject to GHG emissions regulations. In 2017 we recorded $63 million of expenses under existing carbon pricing programs. There was little change to our emissions-related expenses in 2017. These expenses include regulated carbon pricing programs which cover our natural gas pipelines, power facilities and power trading in California.
We actively monitor and submit comments to regulators as these new and evolving initiatives are undertaken. We support transparent climate change policies that lead to actual results, allowing for sustainable and economically responsible natural resource development, but are appropriately flexible to adapt to economic realities and unintended outcomes. We expect that, over time, most of our assets will be subject to some form of regulation to manage GHG emissions.
We continue to monitor the financial impacts of climate change on our business, which include the following:
• Business interruptions and operational risks, including labour disputes, equipment malfunctions or breakdowns, acts of terror and sabotage, or natural disasters and other catastrophic events, including those related to climate change, could impact revenues and increase operating costs. Losses not covered by insurance could have an adverse effect on operations, cash flow and financial position.
• Significant changes in temperature and other weather events have many effects on our business, ranging from the impact on demand, availability and commodity prices, to efficiency and output capability. Extreme temperatures and weather can affect market demand for power and natural gas and can lead to significant price volatility and can also restrict the availability
of natural gas and power if demand is higher than supply. Seasonal changes in temperature can reduce the efficiency of our natural gas-fired power plants and the amount of power they produce and variable wind speeds can affect earnings from our wind assets.
• Public opinion about crude oil development and production can have an impact on the regulatory processes with which we are required to comply, and this may be influenced by some individuals and interest groups lobbying against the construction of liquids pipelines.
Climate change is an important global issue and we recognize that many countries are committed to transitioning to a lower-carbon future. We support this transition and continue to play a key role in developing a balanced and sustainable energy future through our investment in new pipeline infrastructure, as well as reliable, low-carbon and emission-less energy sources and power generation.
We expect supply and demand for natural gas to continue to grow. Our Canadian, U.S. and Mexican natural gas pipelines are well-positioned to capitalize on this opportunity. We see additional opportunity to develop new low-carbon and emission-less energy sources as consumer behaviour changes and market conditions shift to reflect these behaviours.
TransCanada cannot estimate the potential financial implications of proposed GHG policies on our future consolidated results of operations, financial position or cash flows. Such legislation or regulation could materially increase our operating costs, require material capital expenditures or create additional requirements for permitting, which could delay proposed projects.
Further details on our actions to disclose carbon emissions and mitigate the business risk of climate change risks will be available in our 2017 CDP Report, when made available to the public.
TRANSCANADA MAP
TABLE OF CONTENTS
CEO’S MESSAGE
WHO WE ARE
ABOUT THIS REPORT
WHAT CR MEANS TO US
A HEALTHY AND SAFE ENVIRONMENT AND COMMUNITY
AN ENGAGED COMMUNITY
A THRIVING ECONOMY
Financial performance
Economic benefits of development
Access to markets
CAUTIONARY NOTE
APPENDIX
GRI G4 INDEX

TransCanada Corporate Responsibility Report 2017 65
Our ability to bring job opportunities and financial benefits to communities across North America.
Operating context
TransCanada delivers more than just the energy that powers our lives and economies. Our operations also generate a number of direct and indirect economic benefits for the communities and governments where we operate.
These benefits include cash and property tax payments that support essential government services, such as schools, roads and hospitals, as well as investments in local non-profits and other charitable organizations. Our projects and assets also support thousands of direct and indirect jobs opportunities, and they create business opportunities for local suppliers.
Taken together, these benefits can have a significant and positive impact on the economies where we operate.
Commitment
TransCanada is committed to bringing economic value to our communities by:
• Generating tax revenues for federal, provincial and state governments.
• Providing financial and non-financial support to non-profit organizations in our communities.
• Engaging with a broad range of qualified suppliers.
• Working to enhance the diversity and local participation of suppliers to realize greater economic benefits for local communities.
• Providing employees with a competitive compensation and benefits package.
Approach
We work to support economic development where we operate through our core business activities, community investments, and approach to local employment and business opportunities.
Prior to and during the project approval process, we consult with local stakeholders, Indigenous groups and landowners, to identify early on both positive and negative potential indirect economic and socio-economic impacts. Mitigation and management strategies are developed in cases where TransCanada’s operations are likely to have significant negative socio-economic impacts, such as effects on community infrastructure and services.
No significant adjustments to our approach to managing economic benefits of development were identified for the 2017 reporting period.
For additional details on our approach, please refer to the Stakeholder engagement, Indigenous relations and Working with landowners sections.
Performance
INDICATOR: Significant indirect economic impacts (G4-EC8, partial)
LOCAL SKILLS BUILDING AND EMPLOYMENT
Education and training is integrated into our engagement strategy and incorporated into project planning at the outset of engagement with local communities and Indigenous groups. Working directly with communities to develop an education and training plan ensures the plan supports the needs of the communities. This approach facilitates the planning and implementation of community education and training initiatives in advance of projects and helps to maximize the benefits of Indigenous groups’ project participation.
For details about our financial and non-financial support of communities, please refer to the Community investment section.
For further details on our approach to employee benefits, please refer to the Employee attraction, retention and development section.
A thriving economy
Economic benefits of developmentTRANSCANADA MAP
TABLE OF CONTENTS
CEO’S MESSAGE
WHO WE ARE
ABOUT THIS REPORT
WHAT CR MEANS TO US
A HEALTHY AND SAFE ENVIRONMENT AND COMMUNITY
AN ENGAGED COMMUNITY
A THRIVING ECONOMY
Financial performance
Economic benefits of development
Access to markets
CAUTIONARY NOTE
APPENDIX
GRI G4 INDEX

TransCanada Corporate Responsibility Report 2017 66
LOCAL SUPPLIERS
TransCanada contributes to the social and economic well-being of communities that are adjacent to, or are potentially impacted by, our business. We endeavour to create opportunities for qualified diverse, Indigenous and local suppliers and individuals to benefit from our projects and operations. We established our Supplier Diversity and Local Participation (SDLP) program to realize greater economic benefits for our communities, while meeting our service requirements. This program includes an overarching framework for business policy, processes and tools to enhance supplier diversity, local participation and capacity development opportunities.
We support the development of reciprocal business relationships as part of our work to build and maintain relationships with diverse suppliers reflective of the communities we work in. We engage with Indigenous and community leadership and businesses to understand capacity and capabilities and align these with project requirements. Our Indigenous contracting program designates certain key activities for qualified Indigenous businesses, requirements for general contractors to meaningfully engage with local Indigenous groups and rigorous reporting requirements.
We also work with local suppliers, including businesses and individuals, for potential participation in social and economic opportunities resulting from our projects and operational activities, including employment, contracting, subcontracting and training.
While all potential suppliers are evaluated based on safety, financial, technical, quality, and anti-bribery and anti-corruption criteria during the vendor qualification evaluation, factors such as diversity and local spend are also considered during supplier selection.
TransCanada also earned best in-class standing by the inaugural Bloomberg Gender Equality Index for our comprehensive SDLP Program, which demonstrates our community commitments and compliance to regulations while quantifying our economic impact in communities where we operate. Our spend with local suppliers is tracked and measured within the SDLP.
In 2017 TransCanada generated more than $75 million in work for Indigenous businesses or their joint-venture partners in Canada and the U.S. through the purchase of goods, contract services and employment on TransCanada projects.
For information regarding spend with Indigenous businesses and suppliers, please refer to the Indigenous relations section.
A thriving economy
Economic benefits of development
Our Leach Xpress pipeline began service in early 2018. The project created nearly 5,000 jobs and generated close to $2.3 billion in economic benefits to communities and provides vital links between Appalachian natural gas supply and growing U.S. markets.
TRANSCANADA MAP
TABLE OF CONTENTS
CEO’S MESSAGE
WHO WE ARE
ABOUT THIS REPORT
WHAT CR MEANS TO US
A HEALTHY AND SAFE ENVIRONMENT AND COMMUNITY
AN ENGAGED COMMUNITY
A THRIVING ECONOMY
Financial performance
Economic benefits of development
Access to markets
CAUTIONARY NOTE
APPENDIX
GRI G4 INDEX

TransCanada Corporate Responsibility Report 2017 67
INDICATOR: Direct economic value distributed (G4-EC1, partial)
In 2017, TransCanada’s direct economic contributions included $816 million in cash and property taxes, $1.24 billion in payroll costs and $200 million in employee benefits. An increase in tax payments in Canada and the U.S. contributed to a year over year increase in total value distributed.
A few notable projects that came into service in 2017 contributing to economic value:
• The U.S. natural gas project Leach Xpress is a $1.6 billion investment in Ohio, West Virginia, and Pennsylvania that created or supported nearly 5,000 jobs and generated close to $2.3 billion in economic benefits.
Notes: This indicator is inclusive of all TransCanada operations and assets, including CPG of July 1, 2016, but excluding CPG’s property and cash taxes for 2016 data.1 For total payroll costs and total employee benefits we have applied the 2017 and 2016 average US$ to Cdn$ exchange rates published in the TransCanada Annual Report. We have applied the 2017 and 2016 average Mexican peso to CAN$ exchange rate published by the Bank of Canada.2 Total payroll costs are based on T4, W2, and Constancia de Percepcions for Canadian, U.S., and Mexican core employees, respectively.3 Employee benefit costs include the overall costs for the following programs, where applicable: pension plans, benefits (including medical, dental, vision), stock and savings plans, life and accident insurance, long-term disability, employee-assistance programs and other benefits not included in Total Payroll Cost
Economic benefit to communities1 (millions of dollars unless otherwise indicated) 2013 2014 2015 2016 2017
Property taxes 445 473 517 555 569
Cash income taxes paid 202 109 162 105 247
Total payroll costs2 – – 1,090.6 1,468.3 1,244.2Canada (CAD$) – – 699.9 636.6 688.3U.S. (US$) – – 261.8 604.6 418.0Mexico (MXN peso) – – 368.0 307.0 483.7
Total employee benefits3 – – 180.8 236.8 200.3Canada (CAD$) – – 98.7 84.8 82.7U.S. (USS) – – 58.7 112.5 92.6Mexico (MXN peso) – – 14.1 15.8 26.5
• Our Towerbirch Expansion project supported local employment with more than 750 jobs for workers and businesses in British Columbia and Alberta during construction, generating $75 million in federal and provincial tax revenues. It also will provide $1.5 million per year in property tax revenues that could fund hospitals, schools and public services.
• One of our two Alberta pipelines—Grand Rapids—an important asset connecting the Athabasca region, created more than 235 jobs and generated approximately $4.4 million in property taxes per year.
A thriving economy
Economic benefits of developmentTRANSCANADA MAP
TABLE OF CONTENTS
CEO’S MESSAGE
WHO WE ARE
ABOUT THIS REPORT
WHAT CR MEANS TO US
A HEALTHY AND SAFE ENVIRONMENT AND COMMUNITY
AN ENGAGED COMMUNITY
A THRIVING ECONOMY
Financial performance
Economic benefits of development
Access to markets
CAUTIONARY NOTE
APPENDIX
GRI G4 INDEX

TransCanada Corporate Responsibility Report 2017 68
A thriving economy
Access to markets
Our ability to construct and operate new pipeline assets to enhance access to markets for our customers, which contributes to North American energy security.
Operating context
TransCanada plays a central role in developing and securing North America’s energy future, operating critical infrastructure and providing access to a safe and reliable mix of energy sources that powers our lives.
Our pipelines safely and reliably connect our oil and gas customers to areas where their products are needed most. TransCanada’s record of dependable energy transportation and our respectful, long-standing relationships with the communities where we operate have made us one of North America’s most sought-after partners in energy infrastructure.
We strongly believe that North America is well-positioned to supply the world’s growing demand for safe and affordable energy. We remain dedicated to exploring opportunities to further expand our network of natural gas and liquids pipelines and to working with our customers and regulators to continue to grow much-needed pipeline infrastructure for safe and reliable access to domestic and international markets.
NATURAL GAS PIPELINES
Increased demand for natural gas, coupled with the annual decline rate of 15 per cent to 20 per cent for natural gas production, implies that up to 25 Bcf/d of new production per year will be required to meet current and forecasted demand.
Our natural gas projects provide our customers with increased access to new sources of supply while extending their market reach. Further, we continue to pursue expansions across our existing geographical footprint that are expected to allow for the transport of constrained natural gas production in the Marcellus and Utica producing regions to areas of demand.
Our natural gas pipelines business in Mexico continues to generate stable results and provide a solid platform for future growth. We now have four pipelines operating under long-term contract and three more are expected to enter service in 2018 and 2019, increasing our Mexican portfolio to approximately US$5 billion.
We are well positioned to help meet Mexico’s growing need for clean burning natural gas, with an integrated delivery system that will directly connect U.S. gas supplies to growing power generation and industrial demand in central Mexico.
LIQUIDS PIPELINES
The International Energy Agency projects annual global crude oil demand growth will increase from 94 million bbl/d in 2016 to 105 million bbl/d in 2040, driven primarily by growth in Asia and developing countries. While the markets we currently serve are facing short-term commodity price fluctuations and supply adjustments, we expect global demand for crude oil will continue to grow in the long term, ultimately resulting in the continued growth of North American crude oil supply, production and demand for new pipeline infrastructure as well as a need for shippers to seamlessly connect pipelines that transport crude oil outside of Alberta to the markets where it is needed most.
Oil continues to drive the modern economy, with people’s need for efficient and reliable transportation and products developed from petroleum generating the majority of global crude oil demand. The Keystone Pipeline System, our largest liquids pipelines asset, moves approximately 20 per cent of western Canadian crude oil exports to key refining markets in the U.S. Midwest and the U.S. Gulf Coast. The Grand Rapids and Northern Courier pipelines, two new intra-Alberta liquids pipelines, are recent additions to our portfolio. Both greenfield pipelines provide transportation solutions for producers in northern and western Athabasca regions.
Commitment
When planning new projects, we are committed to engaging stakeholders, Indigenous groups and landowners to understand their concerns and identify any potential social, environmental and economic effects.
Our goal is to ensure all of our projects are placed in service on time and on budget, while also ensuring the safety of our staff, contractors and anyone impacted by the construction and operation of these facilities.
We remain committed to advancing our portfolio of commercially secured projects to connect growing Canadian and U.S. oil and gas supply to key markets, maximizing the value from our existing assets, leveraging existing infrastructure and seeking new opportunities across the pipelines value chain.
TRANSCANADA MAP
TABLE OF CONTENTS
CEO’S MESSAGE
WHO WE ARE
ABOUT THIS REPORT
WHAT CR MEANS TO US
A HEALTHY AND SAFE ENVIRONMENT AND COMMUNITY
AN ENGAGED COMMUNITY
A THRIVING ECONOMY
Financial performance
Economic benefits of development
Access to markets
CAUTIONARY NOTE
APPENDIX
GRI G4 INDEX

TransCanada Corporate Responsibility Report 2017 69
Approach
No significant adjustments to our approach to access to markets were identified for the 2017 reporting period.
For more information about our project design and approval process, please visit our Life Cycle of a Pipeline page on our website.
Performance
INDICATOR: Development and impact of infrastructure investments and services supported (G4-EC7)
We achieved record financial performance in 2017 as our base businesses performed well, we placed approximately $5 billion of new facilities into service, and we completed the integration of the CPG assets.
Examples of capital projects that were brought into service in 2017 and operational initiatives that are expected to enhance access to markets include:
• In November 2017 we began shipping additional volumes of natural gas from the Western Canada Sedimentary Basin to high-demand markets in Eastern Canada and the U.S. under an innovative new tolling agreement that allows customers to utilize existing pipeline capacity on the Canadian Mainline at reduced cost, enabling them to better compete in the North American market.
• Leach Xpress began service on Jan. 1, 2018, transporting approximately 1.5 Bcf/d of natural gas from the heart of the growing Appalachian supply basin to markets in Ohio, West Virginia, and beyond.
• Completion of the Grand Rapids and Northern Courier liquids pipelines in Alberta added 550 km (342 mi) of strategic liquids pipelines in the Athabasca region of the province and strengths our position as a leading transporter of North America’s growing crude oil supply.
We also secured more than #3 billion in new projects in 2017. Our capital program consists of approximately $23 billion in near-term projects and approximately $24 billion of commercially supported medium to longer-term projects, all of which are underpinned by long-term contracts or regulated business models. This portfolio includes the US$8.3-billion Keystone XL and Keystone Hardisty Terminal projects, the $4.8-billion Coastal GasLink project to supply natural gas to LNG Canada’s proposed terminal facility in Kitimat, B.C., and a $5.3-billion investment in the Bruce Power Life Extension Agreement post-2020.
We were also pleased to advance the Keystone XL pipeline project in 2017 with the long-awaited receipt of a Presidential Permit in March, followed by the Nebraska Public Service Commission approving a route for the pipeline through the state in November. We have confirmed the necessary commercial support for Keystone XL to proceed through a successful open season that secured 500,000 bbl/d of firm, 20-year commitments. We are working collaboratively with landowners to acquire necessary easements for the approved route and continue to work through the permitting process in order to begin construction in 2019.
Although we were disappointed to terminate the Energy East pipeline project, we remain optimistic about the prospects for our liquids pipelines business as North American oil production is expected to grow for decades to come and will lead to further opportunities to enhance and expand our system.
For further details on our proposed natural gas and liquids pipeline capital projects, please refer to our 2017 Annual Report. For more information on specific investment initiatives and creation of markets for energy services on a project-by-project basis, please visit our website.
A thriving economy
Access to marketsTRANSCANADA MAP
TABLE OF CONTENTS
CEO’S MESSAGE
WHO WE ARE
ABOUT THIS REPORT
WHAT CR MEANS TO US
A HEALTHY AND SAFE ENVIRONMENT AND COMMUNITY
AN ENGAGED COMMUNITY
A THRIVING ECONOMY
Financial performance
Economic benefits of development
Access to markets
CAUTIONARY NOTE
APPENDIX
GRI G4 INDEX

TransCanada Corporate Responsibility Report 2017 70
This Corporate Responsibility Report contains forward-looking information that is subject to important risks and uncertainties.
Statements that are forward-looking are based on certain assumptions and on what we know and expect today and generally include words like anticipate, expect, believe, may, will, should, estimate or other similar words.
Forward-looking statements in this report include information about the following, among other things:
• planned changes in our business
• our financial and operational performance, including the performance of our subsidiaries
• expectations or projections about strategies and goals for growth and expansion
• expected cash flows and future financing options available to us
• expected dividend growth
• expected costs for planned projects, including projects under construction, under permitting and in development
• expected schedules for planned projects (including anticipated construction and completion dates)
• expected regulatory processes and outcomes
• expected outcomes with respect to legal proceedings, including arbitrations and insurance claims
• expected impact of regulatory outcomes
• expected capital expenditures and contractual obligations
• expected operating and financial results
• the expected impact of future accounting changes, commitments and contingent liabilities
• the expected impact of U.S. Tax Reform
• expected industry, market and economic conditions
Forward-looking statements do not guarantee future performance. Actual events and results could be significantly different because of assumptions, risks or uncertainties related to our business or events that happen after the date of this report.
Our forward-looking information is based on key assumptions and subject to the following risks and uncertainties.
Assumptions
• inflation rates, commodity prices and capacity prices
• nature and scope of hedging
• regulatory decisions and outcomes
• interest, tax and foreign exchange rates, including the impact of U.S. Tax Reform
• planned and unplanned outages and the use of our pipeline and energy assets
• integrity and reliability of our assets
• access to capital markets
• anticipated construction costs, schedules and completion dates
• planned wind-down of our U.S. Northeast power marketing business
Cautionary noteTRANSCANADA MAP
TABLE OF CONTENTS
CEO’S MESSAGE
WHO WE ARE
ABOUT THIS REPORT
WHAT CR MEANS TO US
A HEALTHY AND SAFE ENVIRONMENT AND COMMUNITY
AN ENGAGED COMMUNITY
A THRIVING ECONOMY
CAUTIONARY NOTE
APPENDIX
GRI G4 INDEX

TransCanada Corporate Responsibility Report 2017 71
Risks and Uncertainties
• our ability to successfully implement our strategic initiatives, priorities and whether they will yield the expected benefits
• the operating performance of our pipeline and energy assets
• the amount of capacity sold and rates achieved in our pipelines businesses
• the availability and price of energy commodities
• the amount of capacity payments and revenues we receive from our energy business
• regulatory decisions and outcomes
• outcomes of legal proceedings, including arbitration and insurance claims
• performance and credit risk of our counterparties
• changes in market commodity prices
• changes in the political environment
• changes in environmental and other laws and regulations
• competitive factors in the pipeline and energy sectors
• construction and completion of capital projects
• costs for labour, equipment and materials
• access to capital markets
• interest, tax and foreign exchange rates including the impact of U.S. Tax Reform
• weather
• cyber security
• technological developments
• economic conditions in North America as well as globally
You can read more about these factors and others in reports we have filed with Canadian securities regulators under TransCanada’s profile on SEDAR at www.sedar.com and with the U.S. Securities and Exchange Commission (the SEC) at www.sec.gov, including our most recent Quarterly Report to Shareholders, and 2017 Annual Report.
As actual results could vary significantly from the forward-looking information, you should not put undue reliance on forward-looking information and should not use future-oriented information or financial outlooks for anything other than their intended purpose. We do not update our forward-looking statements due to new information or future events, unless we are required to by law.
This report contains references to TransCanada’s website. These references are for the readers’ convenience only. TransCanada is not incorporating by reference any information posted on www.transcanada.com.
Non-GAAP measures
This report references the following non-GAAP measures:
• comparable earnings
• comparable earnings per share
• comparable funds generated from operations
• comparable EBITDA
These measures do not have any standardized meaning as prescribed by U.S. generally accepted accounting principles (GAAP) and, therefore, are unlikely to be comparable to similar measures presented by other companies. These non-GAAP measures are calculated on a consistent basis from period to period and are adjusted for specific items in each period, as applicable.
For more information on reconciliations of non-GAAP measures to the most closely related GAAP measures, refer to TransCanada’s most recent Quarterly Report to Shareholders and our 2017 Annual Report filed with Canadian securities regulators at www.sedar.com, with the SEC at www.sec.gov and available at www.transcanada.com.
We believe that this report contains information that is accurate, timely and balanced. While the report and the data within have not been externally assured in its entirety, we completed an internal assessment process to review the contents for clarity. We make no warranty, expressed or implied, regarding accuracy, adequacy, completeness, legality, reliability or usefulness of any information.
Cautionary noteTRANSCANADA MAP
TABLE OF CONTENTS
CEO’S MESSAGE
WHO WE ARE
ABOUT THIS REPORT
WHAT CR MEANS TO US
A HEALTHY AND SAFE ENVIRONMENT AND COMMUNITY
AN ENGAGED COMMUNITY
A THRIVING ECONOMY
CAUTIONARY NOTE
APPENDIX
GRI G4 INDEX

TransCanada Corporate Responsibility Report 2017 72
Oversight and policies on lobbying, political contributions and corporate memberships
The Governance committee of the Board of Directors oversees lobbying, political contributions and corporate memberships. It receives a report annually that provides information on our lobbying activities, a complete list of our political contributions and a detailed list of our corporate memberships, including industry associations and policy organizations. TransCanada prides itself on being a company that all our stakeholders can count on to make the right choices and do the right thing.
TransCanada has several policies pertaining to lobbying activities and political contributions, each of which applies to all directors, officers and employees as well as contractors, as summarized in the following:
Avoiding Bribery and Corruption Policy
TransCanada prohibits the payment of bribes and kickbacks, or provision to government officials of gifts, entertainment or something of value, intended to improperly influence a government official’s decisions or actions in the performance of his or her duties. TransCanada also prohibits the offer or provision of facilitation payments. This policy outlines TransCanada’s expectations of personnel regarding integrity-based business practices to avoid the occurrence or even the appearance of improper or illegal conduct and to encourage ethical behaviour in all of TransCanada’s business.
Code of Business Ethics
TransCanada’s Code of Business Ethics (COBE) provides personnel with the expected standards of conduct to ensure TransCanada’s reputation for honesty, integrity and reliability is maintained. COBE states that we respect the political process and only make political contributions and engage in lobbying activities that are legal and transparent. COBE refers our personnel to the Avoiding Bribery and Corruption Policy for more specific guidance on those issues.
Political Activities and Contributions Policy
This policy:
• sets out the role of our government relations department and provides guidance to TransCanada’s personnel to ensure ethical behaviour when dealing with government officials
• outlines expectations around lobbying compliance for both in-house and consultant lobbyists
• outlines the criteria for TransCanada’s contributions to political organizations and candidates for public office
TransCanada is committed to the responsible development of public policy. The company engages in the public policy process by participating in direct advocacy of governments, as well as working with third parties, such as industry associations. As part of this commitment, the company focuses on constructive engagement and support of the political process through contributions to political organizations and political campaigns to the extent permitted by applicable law.
TransCanada is non-partisan and participates in the political process only when permitted by applicable law, in accordance with company policies, and in a responsible and ethical way that serves the best interests of the company and its stakeholders.
In Canada and the United States, TransCanada makes political contributions in regions where TransCanada conducts business that comply with the laws of the respective region. TransCanada does not make political contributions in Mexico. All political contributions are approved by the senior vice-president responsible for public affairs and communications.
AppendixTRANSCANADA MAP
TABLE OF CONTENTS
CEO’S MESSAGE
WHO WE ARE
ABOUT THIS REPORT
WHAT CR MEANS TO US
A HEALTHY AND SAFE ENVIRONMENT AND COMMUNITY
AN ENGAGED COMMUNITY
A THRIVING ECONOMY
CAUTIONARY NOTE
APPENDIX
GRI G4 INDEX

TransCanada Corporate Responsibility Report 2017 73
In the U.S.:
• All non-U.S. personnel are strictly prohibited from having any role, direct or indirect, in making political contributions.
• No corporate funds may be used to make political contributions to candidates and political committees in federal elections.
• Only funds generated from U.S. operations may be used to make political contributions.
In 2017, TransCanada spent approximately $42,000 on political contributions, with C$23,000 contributed in Canada and US$19,000 in the U.S.
Political Action Committees
TransCanada USA Services Inc., a U.S. subsidiary of TransCanada Corporation, established the TransCanada USA Services Inc. Political Action Committee in 2012 to make political contributions in connection with federal, state and local elections in the U.S. using funds voluntarily donated by U.S. citizens and employees with permanent resident status (commonly referred to as “green card holder”) of TransCanada USA Services Inc. The TransCanada USA Services Inc. Political Action Committee is administered in compliance with the restrictions and requirements of the Federal Election Campaign Act of 1971, as amended (FECA), and the rules and regulations of the Federal Election Commission, which administers FECA.
Columbia Pipeline Group Political Action Committee was established under the U.S. federal election law in 2015, which allows employees to contribute to a fund for the purposes of making contributions to candidates for public office. The Columbia Pipeline Group Political Action Committee merged with the TransCanada USA Services Inc. Political Action Committee in 2017. Funds were centralized under the TransCanada USA Services Inc. Political Action Committee.
A total of C$393,000 was disbursed by the two Political Action Committees in 2017. More information on disbursements made by the TransCanada USA Services Inc. Political Action Committee can be found at www.fec.gov.
Lobbying
TransCanada’s business can be significantly impacted by government actions and decisions. The company works continuously to build and maintain positive and constructive relationships with government officials at all levels. This allows TransCanada to gain trust and respect in the public sector, obtain government support for its activities and initiatives, and to contribute to and collaborate with the communities where the company operates.
TransCanada maintains registrations for in-house lobbyists where required by law. Our lobbying activities are registered in various jurisdictions in Canada and the U.S., many of which provide public disclosure with details of registrations. Links to each of the lobbyist registrations, where available, can be found on our website.
In addition, our consultant lobbyists in all jurisdictions are expected to comply with all applicable laws.
Corporate memberships
TransCanada is a member of various trade associations and policy organizations across our lines of business. Our primary purpose for involvement in trade associations is for general business reasons and discussion of technical and industry standards. Trade associations also provide opportunities for our employees to engage in professional development and networking.
While trade associations and policy organizations may use membership fees for lobbying purposes, TransCanada does not direct how membership fees are used and payment of membership fees does not necessarily reflect significant involvement with the trade association or policy organization from a policy perspective. Our participation in a specific trade association or policy organization does not signify comprehensive support for all positions undertaken by the associations. TransCanada’s approval process for membership in these organizations requires vice-president-level approval.
AppendixTRANSCANADA MAP
TABLE OF CONTENTS
CEO’S MESSAGE
WHO WE ARE
ABOUT THIS REPORT
WHAT CR MEANS TO US
A HEALTHY AND SAFE ENVIRONMENT AND COMMUNITY
AN ENGAGED COMMUNITY
A THRIVING ECONOMY
CAUTIONARY NOTE
APPENDIX
GRI G4 INDEX

TransCanada Corporate Responsibility Report 2017 74
Approval of memberships involves consideration of the following:
• the objectives of the association
• the association’s affiliations
• the benefits provided to TransCanada
• the cost of the membership
• whether the membership aligns with TransCanada’s strategic focus
• whether there are other alternatives to membership that would provide the same benefits
The government relations and policy department is responsible for payments and maintains a roster of memberships. This process has been established to ensure TransCanada receives value from its memberships.
In addition, the governance committee of the Board of Directors receives a report annually on our memberships in trade association and policy organizations, including a detailed discussion of our key memberships and their value to TransCanada.
LIST OF MEMBERSHIPS
The most significant corporate memberships that TransCanada maintains from a policy perspective are the following:
• American Petroleum Institute
• Association of Oil Pipe Lines
• Interstate Natural Gas Association of America
• Canadian Energy Pipeline Association
The following is a list of industry associations and policy organizations that received more than $50,000 from us during 2017. We have also included industry associations and policy organizations where we play a significant role in contributing to their policy stance, even if payments did not exceed $50,000.
• Canadian Energy Pipeline Association
• Interstate Natural Gas Association of America
• Electric Power Research Institute
• American Petroleum Institute
• Association of Oil Pipe Lines
• Confederacion Patronal de la Republica Mexicana
• Business Roundtable
• Canadian Gas Association
• Canadian Association of Petroleum Producers
• Asociacion Mexicana de Gas Natural, A.C.
• Ontario Energy Association
• American Gas Association
• National Association of Manufacturers
• Northwest Gas Association
• Canadian Electricity Association
• Business Council of Canada
• Corporate Executive Board
• Canadian Manufacturers and Exporters
• Association of Power Producers of Ontario
• U.S. Common Ground Alliance
• Canadian Energy Partnership for Environmental Innovation
• NorthWest Gas Association
• National Petroleum Council
• Canadian Manufacturers and Exporters
AppendixTRANSCANADA MAP
TABLE OF CONTENTS
CEO’S MESSAGE
WHO WE ARE
ABOUT THIS REPORT
WHAT CR MEANS TO US
A HEALTHY AND SAFE ENVIRONMENT AND COMMUNITY
AN ENGAGED COMMUNITY
A THRIVING ECONOMY
CAUTIONARY NOTE
APPENDIX
GRI G4 INDEX

TransCanada Corporate Responsibility Report 2017 75
GRI G4 index
Standard disclosures
CR Report G4 Indicator Section Title Page Number Additional Sources
Strategy and AnalysisG4-1 CEO’s messages 04
Organizational ProfileG4-3 Who we are – Our business at a glance 07 www.transcanada.comG4-4 Who we are – Our business at a glance 07 www.transcanada.comG4-5 Who we are – Our business at a glance 07 www.transcanada.comG4-6 Who we are – Our business at a glance 07 www.transcanada.comG4-7 Who we are – Our business at a glance 07 www.transcanada.comG4-8 Who we are – Our business at a glance 07 www.transcanada.comG4-9 Who we are – Our business at a glance 07 www.transcanada.com, Annual ReportG4-10 Who we are – Our people 09 www.transcanada.comG4-11 Who we are – Our people 09 www.transcanada.comG4-12 Who we are – Our business at a glance 08 Economic benefits of development – Approach 65G4-13 Who we are – Our business at a glance Changes to our asset portfolio and operations in 2017 08 www.transcanada.com, Annual ReportG4-14 What CR means to us – Our approach 19G4-15 About this report – Our approach to disclosure 15 What CR means to us – Our approach 19G4-16 What CR means to us – Our approach 23
Identified Material Topics and BoundariesG4-17 About this report – Report profile 16 www.transcanada.com, Annual ReportG4-18 About this report – Our priorities – Materiality analysis 14G4-19 About this report – Our priorities 11G4-20 About this report – Our priorities 11G4-21 About this report – Our priorities 11G4-22 About this report – Report profile 16G4-23 Global Reporting Initiative G4 Index 75
TRANSCANADA MAP
TABLE OF CONTENTS
CEO’S MESSAGE
WHO WE ARE
ABOUT THIS REPORT
WHAT CR MEANS TO US
A HEALTHY AND SAFE ENVIRONMENT AND COMMUNITY
AN ENGAGED COMMUNITY
A THRIVING ECONOMY
CAUTIONARY NOTE
APPENDIX
GRI G4 INDEX
Standard disclosures
Specific standard disclosures

TransCanada Corporate Responsibility Report 2017 76
GRI G4 index
Standard disclosures
CR Report G4 Indicator Section Title Page Number Additional Sources
Stakeholder EngagementG4-24 About this report – Our priorities – Materiality analysis 14 What CR means to us – Our approach 22 An engaged community – Stakeholder and Indigenous engagement – Operating context 48G4-25 About this report – Our priorities – Materiality analysis 14 What CR means to us – Our approach 22 An engaged community – Stakeholder and Indigenous engagement – Operating context 48G4-26 About this report – Our priorities – Materiality analysis 14 An engaged community – Stakeholder and Indigenous engagement – Performance 49G4-27 About this report 11 An engaged community – Stakeholder and Indigenous engagement 48
Report ProfileG4-28 About this report – Report profile 16G4-29 About this report – Report profile 16G4-30 About this report – Report profile 16G4-31 About this report – Our approach to disclosure 15G4-32 About this report – Report profile 16 Global Reporting Initiative G4 Index 75G4-33 About this report – Report profile 16
GovernanceG4-34 What CR means to use – Our approach 21 Management Information Circular
EthicsG4-56 Who we are – Our mission, vision, values 7 www.transcanada.com Code of Business Ethics
TRANSCANADA MAP
TABLE OF CONTENTS
CEO’S MESSAGE
WHO WE ARE
ABOUT THIS REPORT
WHAT CR MEANS TO US
A HEALTHY AND SAFE ENVIRONMENT AND COMMUNITY
AN ENGAGED COMMUNITY
A THRIVING ECONOMY
CAUTIONARY NOTE
APPENDIX
GRI G4 INDEX
Standard disclosures
Specific standard disclosures

TransCanada Corporate Responsibility Report 2017 77
GRI G4 index
Specific standard disclosures
Material topics
G4 Indicator
CR Report Page Number
Omissions
Integrity of pipelines and facilities
G4-DMAG4-EN24
G4-OG13
2831
32
–Spills by third-party contractors are not reflective of TransCanada’s integrity management performance and are thus excluded.TransCanada uses the API RP 754 definitions to inform categorization of process safety events, and does not report to Tier 1 and Tier 2 categories.
Emergency preparedness and response
G4-DMA 36 Please note that no GRI Specific Standard Disclosures are available for this topic. Internal performance indicators are reported.
Health and Safety of communities, employees, and contractors
G4-DMAG4-LA6
3940
–TransCanada tracks occupational health and safety performance according to regulatory requirements and industry standards; as a result, indicators may not align fully with GRI requirements. TransCanada does not publicly report OHS performance data by gender, as this is considered private information and therefore not tracked.
Climate change and greenhouse gas emissions
G4-DMAG4-EN15
G4-EN18G4-OG2
4245
46N/A
–Emissions from activities of special interest are not applicable to TransCanada’s business. TransCanada’s direct GHG emissions reporting boundary is based on an asset equity share. TransCanada does not track emissions based on an operational control boundary, and thus this information is omitted. –TransCanada has invested $469 million in renewable energy sources as of December 2017. TransCanada does not track investments as a percentage of capital expenditures and acquisitions. For details about expenditures and divestitures related to renewable energy please see TransCanada’s annual report.
Stakeholder and Indigenous engagement
G4-DMAG4-SO1G4-OG9
484949
––TransCanada does not disclose a complete list of company operations taking place in/adjacent in Indigenous people’s communities and does not share the details of formal plans and agreements because the Company values the importance of confidentiality in respect to the Indigenous groups we work with.
TRANSCANADA MAP
TABLE OF CONTENTS
CEO’S MESSAGE
WHO WE ARE
ABOUT THIS REPORT
WHAT CR MEANS TO US
A HEALTHY AND SAFE ENVIRONMENT AND COMMUNITY
AN ENGAGED COMMUNITY
A THRIVING ECONOMY
CAUTIONARY NOTE
APPENDIX
GRI G4 INDEX
Standard disclosures
Specific standard disclosures

TransCanada Corporate Responsibility Report 2017 78
GRI G4 index
Specific standard disclosures
Material topics
G4 Indicator
CR Report Page Number
Omissions
Community investment, employee giving, and volunteering
G4-DMA G4-EC1 (partial
49
49
– –
Employee attraction, retention, and development
G4-DMAG4-LA1
5556
––
Financial performance G4-DMAG4-EC1 (partial)
G4-EC2
6263
64
–TransCanada does not report economic value generated and distributed at a country, regional, or market level. Please refer to TransCanada’s annual report for further relevant information by region and assets.Please refer to TransCanada’s CDP report for additional detail on risks and opportunities posed by climate change.
Economic benefits of development
G4-DMAG4-EC1 (partial)G4-EC8 (partial)
6567
65
–Payments to host governments are not applicable to TransCanada’s operations. Please refer to TransCanada’s annual report for further detailed information by region and assets. TransCanada does not currently assess the significance of the economic impacts of development in the context of external benchmarks.
Access to markets G4-DMAG4-EC7
68 69
––
TRANSCANADA MAP
TABLE OF CONTENTS
CEO’S MESSAGE
WHO WE ARE
ABOUT THIS REPORT
WHAT CR MEANS TO US
A HEALTHY AND SAFE ENVIRONMENT AND COMMUNITY
AN ENGAGED COMMUNITY
A THRIVING ECONOMY
CAUTIONARY NOTE
APPENDIX
GRI G4 INDEX
Standard disclosures
Specific standard disclosures

TRANSCANADA MAP
TABLE OF CONTENTS
CEO’S MESSAGE
WHO WE ARE
ABOUT THIS REPORT
WHAT CR MEANS TO US
A HEALTHY AND SAFE ENVIRONMENT AND COMMUNITY
AN ENGAGED COMMUNITY
A THRIVING ECONOMY
CAUTIONARY NOTE
APPENDIX
GRI G4 INDEX
We’d like to hear from you
As stakeholders in TransCanada’s business and participants in the energy discussion, we invite you to tell us what you think about our corporate responsibility performance and how we can improve. Email us at [email protected]
TransCanada welcomes questions from shareholders and investors. Email Investor Relations at [email protected]
Follow us on Facebook: Facebook.com/TransCanadaCorporation
Follow us on Twitter: @TransCanada and @TransCanadaJobs
Connect with us on LinkedIn: LinkedIn.com/Company/TransCanada
Subscribe to us on YouTube: YouTube.com/TransCanada
Search Careers: Jobs.TransCanada.com
Read our latest stories: TransCanada.com/Stories
CORPORATE HEAD OFFICE
TransCanada Corporation450 – 1 Street SWCalgary, Alberta, CanadaT2P 5H1 TransCanada.com
Updated as at June 1, 2018

TRANSCANADA MAP
TABLE OF CONTENTS
CEO’S MESSAGE
WHO WE ARE
ABOUT THIS REPORT
WHAT CR MEANS TO US
A HEALTHY AND SAFE ENVIRONMENT AND COMMUNITY
AN ENGAGED COMMUNITY
A THRIVING ECONOMY
CAUTIONARY NOTE
APPENDIX
GRI G4 INDEX


