T
XF
a
ARRA
JOOO
KMHDR
1
pmsfiCfitosneft
ep
C
1d
The Journal of Socio-Economics 40 (2011) 404–411
Contents lists available at ScienceDirect
The Journal of Socio-Economics
journa l homepage: www.e lsev ier .com/ locate /soceco
he welfare impact of microcredit on rural households in China
ia Li1, Christopher Gan ∗, Baiding Hu1
aculty of Commerce, Department of Accounting, Economics and Finance, P.O. Box 84, Lincoln University, Canterbury, New Zealand
r t i c l e i n f o
rticle history:eceived 20 April 2010eceived in revised form 28 February 2011ccepted 6 April 2011
EL classification:101217
a b s t r a c t
Microcredit has gained worldwide acceptance in recent years as a flexible mechanism to expand individ-uals’ (especially the poor’s) access to financial services, which is considered as an efficient way to achievepoverty reduction and other social development. A large number of empirical studies have been doneto examine the welfare effects of microcredit on the borrowers and such effects are well documentedin many other countries such as Bangladesh. However, the impacts of microcredit on China rural house-holds’ livelihood are not well documented. This paper attempts to empirically evaluate the impact ofmicrocredit on household welfare outcomes such as income and consumption in rural China. The esti-mation is based on the difference-in-difference approach which is an increasingly popular method oftackling the selection bias issue in assessing the impacts of microcredit. The study uses a two-year panel
eywords:icrocreditousehold welfareifference-in-differenceural China
dataset, including both primary and secondary data collected through a household survey in rural China.Our empirical results favour the wide belief in the literature that joining microcredit programme helpsimprove households’ welfare such as income and consumption. Despite the optimistic findings on howmicrocredit has changed the rural households’ living conditions, our results show that the vast majorityof the programme participants are non-poor, which casts some doubts on the social potential (such aspoverty reduction) of China’s microcredit programmes.
. Introduction
Like most Asian developing countries, the majority of the pooropulation in China dwell in rural areas and poverty remains oneajor challenge to the society. Inability to acquire formal credit
upport has been often argued as a crucial constraint in expandingarmers’ production, which largely restrains farmers from improv-ng their living conditions in China (e.g., Gale and Collender, 2006;oleman, 1999). The lending terms and conditions set by formalnancial institutions usually exclude the poor farmers who farm onhe non-secured lands and possess little tangible assets that can beffered as collateral for formal loans. As an alternative, poor farmerseek for informal loans to meet their consumption or productioneeds, which are typically offered at higher interest rates. How-ver, the exploitive interest rate of informal loans have exacerbatedarmers’ indebtedness and further kept most of the householdsrapped in poverty.
The failure of formal financial institutions to serve small farm-rs and the great success of the Grameen Bank in Bangladesh inroviding credit service to rural poor have inspired the govern-
∗ Corresponding author. Tel.: +64 3 25 2811; fax: +64 3 325 3847.E-mail addresses: [email protected] (X. Li),
[email protected] (C. Gan), [email protected] (B. Hu).1 Tel.: +64 3 25 2811; fax: +64 3 325 3847.
053-5357/$ – see front matter © 2011 Elsevier Inc. All rights reserved.oi:10.1016/j.socec.2011.04.012
© 2011 Elsevier Inc. All rights reserved.
ments in many low-income countries (LICs) including China toadopt microcredit mechanism to deliver credit at reasonable coststo rural people. Microcredit was introduced into China in the mid-1990s as part of the government’s poverty alleviation strategies inthe mid-1990s, attempting to ameliorate rural poverty through afinancially sustainable approach. Various organisations have beeninvolved in the delivery of microcredit service in China, includingnon-governmental organisations (NGOs), governmental agencies,and rural financial institutions such as the Rural Credit Cooperative(RCC).2 Since implementing microcredit programmes in 2000, theRCC has expanded its microcredit activity with an extensive net-work in rural areas and evolved as the largest microcredit providerin China (Du, 2004; Sun, 2003).
However, unlike other countries such as Bangladesh, where themicrocredit’s potential in reducing poverty has been thoroughlyexamined (see for example, Khandker, 2005; Morduch, 1998; Pittand Khandker, 1998), few attempts have been made in China totest the efficiency of microcredit as a poverty reduction instrument.
Studies on China’s microcredit tend to elaborate the developmentand regulations of microcredit programmes, giving little quanti-tative information on the outcomes of programme participation.2 The RCC programme outperforms both the NGO and government programmesin terms of financial sustainability and programme replicability. For details see Parkand Ren (2001) and Zuo (2001).
cio-Ec
Al
ieewsbTret
2
2a
pawihtiopb(
�
TpiosdwEooduwohPtf
�
wEiH
E
tnpd
X. Li et al. / The Journal of So
s a result, the impacts of microcredit on China rural households’ivelihood are not well documented.
Since the lack of credit is regarded as the crucial constraint inmproving the Chinese rural households’ livelihoods, it is hypoth-sised that microcredit, which targets the rural households for thextension of credit facilities have a positive impact on households’elfare such as increasing the households’ income and/or con-
umption. This paper aims to empirically examine this hypothesisy focusing on the microcredit programme operated by the RCC.he rest of the paper is organised as follows: Section 2 discusses theesearch methodology, followed by data collection in Section 3. Thempirical findings are discussed in Section 4. Section 5 concludeshe paper.
. Methodology to impact assessment
.1. Identifying the impact of microcredit programme –nalytical framework
Assessing the impact of microcredit programmes requires com-aring outcomes (e.g., household income and consumption) whenhousehold participates in the programme to the same outcomeshen he/she does not participate. For example, let wi be a binary
ndicator of programme participation equal one for participation byousehold i and zero for non-participation. Further let Yi1 denotehe value of the outcome of interest when household i participatesn the programme and Yi0 denote the potential value of the sameutcome when it is in the state of non-participation. Thus the truerogramme impact on the outcome of household i, representedy �i, can be quantified by the difference between Yi1 and Yi0, asSarangi, 2007; Perry and Maloney, 2007):
i = Yi1 − Yi0 (1)
wo major problems should be addressed to identify the truerogramme impact: missing data and unobservability. The miss-
ng data problem arises because the same household cannot bebserved in both participation and non-participation states at theame time and thus the true impact of participation in the microcre-it programme on a certain outcome cannot be observed. In otherords, one or the other component of the difference expressed in
q. (1) is missing (Heckman, 1997; Rosenbaum and Rubin, 1983). Tovercome this problem, group statistics such as the ‘average effectf treatment on the treated’ (ATT) is adopted to replace the missingata on individual subject (Heckman, 1997). ATT is the most pop-lar group statistics widely used in impact evaluation literature,hich measures the extent to which the programme change the
utcome of a group of participants compared to what they wouldave experienced in the absence of participation3 (see for example,erry and Maloney, 2007; Nguyen, 2007; Nguyen et al., 2007). Therue programme impact measured by ATT can be expressed by theollowing equation:
= E(Yi1|wi = 1) − E(Yi0|wi = 1) (2)
here E(·) signifies expectation in the population. Specifically,(Yi0|wi = 1) represents the counterfactual outcome for partic-
pants had they not participated (Dehejia and Wahba, 2002;
eckman, 1997).This, however, gives rise to the problem of unobservability,(Yi1|wi = 1) can be estimated while the counterfactual E(Yi0|wi =
3 There are other statistics used in impact assessment, such as local averagereatment effect, marginal treatment effect, or the effect of non-treatment on theon-treated, which measures the impact the programme would have on the non-articipants if they had participated in the programme. See Heckman (1997) foretails.
onomics 40 (2011) 404–411 405
1) cannot. This problem is addressed by constructing ‘counterfac-tuals’ based on a treatment/control framework, where a group ofprogramme non-participants are selected as a control group andthe observed outcomes of this control group are supposed to serveas ‘counterfactuals’ to the observed outcomes of programme partic-ipants (treatment group). Accordingly, the ATT measured with thistreatment/control framework is used to estimate the true impact(�) and the basic idea of this approach is described as follows:
�∗ = E(Yi1|wi = 1) − E(Yj0|wj = 0) (i /= j ∈ N) (3)
where �* is the estimation of � , i, and j denote two differenthouseholds in a chosen sample of N households where household iparticipates in the programme while household j does not; Yi1 is theoutcome investigated of household i and Yj0 is the same outcomeinvestigated of household j (Sarangi, 2007). Specifically, the paperassesses the average welfare impact of microcredit programme bycomparing the average household outcomes (such as income andconsumption) between borrowing households (treatment group)and non-borrowing households (control group).
2.2. Empirical model and estimation strategy
The welfare indicators used in this paper include householdannual income and annual consumption. Household income refersto the total income earned by all household members, whichencompasses the income from all possible sources, such as agri-culture, non-agriculture, self-employment, and wages. Householdconsumption in this paper is measured by the sum of food con-sumption and non-food consumption within a household.
A review of the impact evaluation literature suggests that empir-ical work assessing microcredit’s impact must carefully addressselection bias issue, which otherwise would reduce the reliabil-ity of the impact estimation. Selection bias in microcredit impactevaluation arises when the households’ participation in microcre-dit programme or households’ receipt of microcredit is relatedto unmeasured (or unobserved) factors that simultaneously affectthe outcomes of their credit use but these unobserved factors arenot correctly accounted for in the impact assessment. Two mainsources leading to such selection bias are non-random programmeplacement which is caused by unmeasured village attributes andhouseholds’ self-selection into the programme which stems fromunobserved household characteristics (for details see Islam, 2007;Coleman, 1999; Pitt and Khandker, 1998). It can be argued thatcomparing welfare outcomes between borrowing households andnon-borrowing households without accounting for unobservedheterogeneity (such as unobserved household and village charac-teristics) would produce biased results since it will wrongly ascribethe entire change (improvement or deterioration) in welfare out-comes to the programme impact, which partly arises from theuncontrolled and unobserved factors.
We adopt panel data model to mitigate the potential selectionbias in the impact estimation. The empirical analysis is built uponthe difference-in-difference (DD) method, which is an increasinglypopular technique in economics for identifying causal effects ofprogrammes or treatments in the absence of pure experimentaldata. The DD estimation framework requires that the outcomesinvestigated be observed for two groups over two time periods.The first group, referred as the borrowing group, consists of house-holds who receive microcredit in the period after the start of theprogramme (i.e., post-programme period) but not prior to the ini-
tiation of the programme (i.e., pre-programme period); the secondgroup, called non-borrowing group comprises households who donot receive microcredit during either period (Athey and Imbens,2006; Bertrand et al., 2004).
4 cio-Economics 40 (2011) 404–411
r
Y
wthfphMcb(tgaoiiw
mtidttt
�
wtabadsainuibpa
mdTttnhatthe2
t
Table 1Description of variables used in welfare impact analyses.
Variables Type of variables Description of variables
HAI Continue Log of household annual incomeHAC Continue Log of household annual consumptionAGE Continue Age of household head squaredSCHILD Continue Number of children in school-age in
the householdHHSZ Continue Household sizeEARNER Continue Number of income earners in the
householdYEAR Dummy Year indicator equal to ‘1’ for 2008 and
‘0’ otherwisePARTN Dummy Programme participation indicator
equal to ‘1’ for ‘yes’ and ‘0’ otherwise
06 X. Li et al. / The Journal of So
The standard DD method can be illustrated by the followingegression equation (Angrist and Krueger, 1999; Meyer, 1995):
it = ˇ0 + ı0d2t + ˇ1Pi + �Mit + εit (4)
here Yit is the natural logarithm of household outcome inves-igated (i.e., household annual income or consumption) forousehold i at period t; d2t is a time dummy variable equal to 1
or t = 2 (post-programme period) and 0 for t = 1 (pre-programmeeriod); Pi is a group dummy variable and takes a value of one ifousehold i belongs to the borrowing group and zero otherwise;it is an interaction term of the product of d2t and Pi, which indi-
ates the programme participation and is equal to 1 if household iorrowed money and the observation occurs in the second periodi.e., participating in the programme), and zero otherwise; ı0 cap-ures time influence suffered by both treatment group and controlroup; ˇ1 captures the potential time-invariant difference in over-ll averages between the two groups; � is the primary parameterf interest measuring the average programme impact on borrow-ng (treatment) group; εit is the idiosyncratic error assumed to bendependent and identically distributed over households and time,
ith mean zero at each time period.The key assumption of the standard DD method, also called com-
on trend assumption, is that � would be zero in the absence ofhe programme, or E[εit|Mit] = 0. In other words, the average changen the outcome variables (Yit) would not have been systematicallyifferent between borrowing group and non-borrowing group ifhere were no programme (Abadie, 2005a,b; Meyer, 1995). Underhis assumption, an unbiased estimate of � can be obtained usinghe following equation:
ˆsdd = �YB − �YN = E(Yi,t=2 − Yi,t=1|Pi = 1)
− E(Yi,t=2 − Yi,t=1|Pi = 0) (5)
here “�” denotes the change from t = 1 to t = 2; �sdd signifieshe standard DD estimator of �; the over bar stands for averagescross households; B and N denote borrowing households and non-orrowing households, respectively. As a result of subtracting theverage differences in the non-borrowing group from the averageifferences in the borrowing group in Eq. (5), the DD estimationtrategy ensures two types of estimation bias to be removed: biasrising from cross-sectional comparisons between the two groupsn post-programme period, which could be the result of perma-ent differences between these two groups (captured by ˇ1) butnrelated to the programme, and bias arising from the compar-
sons over the two periods for the borrowing group, which coulde the result of time trends (captured by ı0) but irrelevant to therogramme (Athey and Imbens, 2006; Abadie, 2005a; Ashenfelternd Card, 1985).
The standard DD method is valid if the households’ receipt oficrocredit is random (such as in experimental settings), con-
itional on time and group fixed effects (Bertrand et al., 2004).he randomisation ensures that the pre-programme attributes4
hat might be associated with the outcome variables (Yit) overime are balanced between the two groups. However, given theon-experimental data nature of our study, it is likely that theouseholds in both groups are systematically different and unbal-nced in the pre-programme attributes which are possibly relatedo the outcome variables. Consequently, the pattern of change inhe outcomes could vary systematically across the two groups of
ouseholds if there were no RCC’s programme, leading to biasedstimate of the programme impact (Islam and Harris, 2008; Abadie,005a,b).4 Pre-programme attributes refer to both observable and unobservable charac-eristics of households and villages.
CUMUL Continue Total loan amount borrowed by thehousehold
To improve the result efficiency, we further use adjusted DDmethod to estimate the programme impact. We first include a vec-tor of observable household characteristics in the regression ascontrol variables to adjust for the observed differences between thetwo groups. In addition, fixed effects method is applied to controlfor the unmeasured household and village attributes. As docu-mented in studies by Islam and Harris (2008) and Khandker (2005),household fixed effects estimation, which treats the household-specific component of the error as a parameter to be estimated, canresolve selection bias at both household and village level, includingthe upper level (e.g., township level), based on the assumption thatthe unobserved factors at household and village level are invariantover time. Accordingly, our study employs household fixed effectsestimation to correct for the potential bias. The econometric modelis illustrated by the following two-way fixed effects model:
Yit = ˇ0 + ı0d2t + ˛Xit + �Mit + hi + uit (6)
where Yit, d2t, ı0 are defined similarly in Eq. (5). Xit is a vec-tor of household characteristics (such as age, family size); Mit isthe treatment variable and � is the primary parameter of inter-est that captures the microcredit impact on borrowing households;hi is household fixed effects capturing unobserved, time-constanthousehold attributes that affect Yit; uit is the idiosyncratic errorterm that represents unobserved household factors which changeover time and affect Yit. It should be noted that uit is normalisedto have mean zero for each period and is assumed to be indepen-dent of the programme variable Mit and have the same distributionover time, i.e., uit ⊥ Mit, but it can be correlated with hi (Athey andImbens, 2006; Abadie, 2005b). The inclusion of Xit as regressorsmay help control for confounding trends and improve the effi-ciency of the estimate of � by reducing residual variance (Abadie,2005b; Meyer, 1995). In particular, the treatment variable Mit takestwo different forms: (1) as a continuous variable denoting thetotal credit amount borrowed by household i from RCC microcre-dit programme in period t = 2; and (2) a binary variable equal toone if household i receives loans from the programme in periodt = 2 and equal to zero otherwise. Compared to the binary treat-ment variable, the cumulative borrowing (continuous) variable ismore often used in assessing the impact of microcredit since itbetter represents the extent of a household’s programme partic-ipation (see for example, Nguyen et al., 2007; Nino-Zarazúa, 2007;Khandker, 2005; Alexander, 2001). The parameter � thus measuresthe average programme impact when Mit is a binary treatment vari-able and measures the average programme impact of additionalcredit amount on borrowing households where M represents the
itamount of loans borrowed by the household (Nguyen et al., 2007;Alexander, 2001). The variables used in the welfare impact analysesare listed in Table 1.
cio-Ec
rssbahdpoe
3
3
w2tdasadpfhl
os(Hh2a
3
spcsttithp
pdaas(Rstptha
(13.7%) of the borrowers obtained micro loans with single amountabove 30,000 yuan. In addition, the average total loan amount bor-rowed by the households is 44,012 yuan. Since the average income
X. Li et al. / The Journal of So
The adjusted DD method based on the fixed effects regressionelaxes the stringent restriction (randomisation) made with thetandard DD method and allows the two groups of households to beystematically different. Assuming that the selection bias is causedy the time-invariant unobserved household heterogeneity (hi)nd observed differences between borrowing and non-borrowingouseholds (Xit), the adjusted DD estimate allows for bias on con-ition that the bias exists in both periods and is the same for eacheriod. Then differencing the differences between the two groupsf households can remove the bias and yield the true programmeffect (Islam and Harris, 2008; Perry and Maloney, 2007).
. Data collection
.1. Survey area
Data were collected through a rural household survey whichas personally conducted between November 2008 and January
009 in Hubei Province in China. Hubei is one of the largest agricul-ural provinces in China, where rural households are geographicallyispersed in both plain and mountain areas and engaged in variousgricultural productions, such as crops, aquatic products, and live-tock. However, the frequent occurrence of natural disasters (suchs drought and flood) in the province throughout the year severelyamages the agricultural production especially in the areas withoor farming infrastructure such as irrigation facilities. This leavesarmers as a disadvantaged group in terms of improving their liveli-ood because they depend solely on agriculture as their means of
iving (Hou, 2006).There are a total of 1470 RCC branches located in towns through-
ut Hubei and at least 60% have been engaged in micro-financingince RCC initiated microcredit programme in the Province in 2002RCC Hubei Head office, 2008). According to the statistics from RCCubei Head Office, the amount of micro loans granted to ruralouseholds by RCCs has totalled 10.1 billion yuan as of end of006 and 4.28 million rural households have obtained micro loans,ccounting for 43% of the total rural households in Hubei.
.2. Data sources and data description
Primary data was collected through a survey interview usingtructured questionnaire, which include characteristics of the sam-led households such as age and household size to be used asontrol variables in the impact estimation. In addition, pertinentecondary data of all sampled households were obtained fromhe selected RCC branch offices. The secondary data compriseshe household characteristics (such as age and household size)n pre-programme period; household annual income and annualotal consumption in both pre- and post-programme periods; andousehold accumulative micro-loan amounts in post-programmeeriod only.
Ashenfelter (1978) cautions that estimates of the impact of arogramme on earnings may be biased upward if the period imme-iately prior to participation in the programme is associated withdecline in earnings (also known as ‘Ashenfelter dip’). A standardpproach to solving this problem, when using DD method, is toet the pre-programme time period early enough to avoid the dipPerry and Maloney, 2007). The earliest year in which the selectedCCs began to implement microcredit programme is 2004 (seeample selection in the following section). Therefore, we excludehe year immediately prior to 2004 but used 2002 to collect pre-
rogramme data for empirical analysis. Year 2008 is chosen ashe post-programme period. Specifically, a two-year (2002/2008)ousehold panel dataset is used in the DD model for welfare impactnalysis with income/consumption as welfare measures. Accumu-onomics 40 (2011) 404–411 407
lative loan amounts reflect the extent of the household involvementin microcredit programme, which are primary independent vari-ables of interest used in impact analyses.
3.3. Sample selection
The sampling framework in this study includes two groups ofrural households: a group of households who have borrowed fromRCC microcredit programme, referred as borrowing group; and agroup of households who have never borrowed from RCC’s micro-credit programme, referred as non-borrowing group. A multi-stagestratified random sampling technique is applied to draw the house-hold sample.
In the first stage of sampling process, sample townships wereselected on the basis of the availability of RCC microcredit pro-gramme. A total of 10 townships were selected from the 768townships hosting RCC’s programme. The RCC microcredit pro-gramme has been functioning since 2004 in 3 out of the 10 selectedtownships, while the rest townships have hosted RCC’s programmefor less than 3 years since 2006. In addition, 3 of the 10 selectedtownships are located in mountain areas while the rest are situatedin plain areas. Following the selection of sample townships, sam-ple villages were selected. A total of 5 villages from every selectedtownship were randomly chosen and altogether 50 villages wereincluded. The selection of sample households was accomplishedin the final stage of sampling process. The household selectionincluded two steps: the first step was to select households whohave accessed RCC’s microcredit (namely borrowing group). Basedon the borrower list available from each RCC branch office in theselected township, a total of 328 borrowers were randomly cho-sen to participate in the interview. Following this, another 96households who have never secured RCC’s microcredit (namelynon-borrowing group) were randomly selected from a list of ruralhouseholds obtained from the village committee office in eachselected village. Overall, 424 households were included in the sam-ple for the survey and all respondents are heads of households.5
4. Empirical results and finding discussions
4.1. Characteristics of micro loans
Table 2 summarises the general characteristics of RCC’s microloans. The survey results indicate that the primary lending schemeof the RCC microcredit programme is individual lending since allthe micro loans acquired by the sample households are individualrather than group-based form. This provides a possible reason whysome loans are issued with collateral requirement (only 7.9% of thetotal). In the absence of group-liability which can serve as ‘socialcollateral’ on the loans, individual-based microcredit programmessuch as the one operated by the RCC in our study may use alternativemechanisms such as requiring additional collateral on some riskyborrowers to mitigate credit risks and ensure loan repayment.
With regard to the maximum amount of a loan borrowed, theshares of the borrowers who could borrow no more than 10,000yuan,6 between 10,001 and 20,000 yuan, and between 20,001 and30,000 yuan are almost identical (about 29%). Only a small portion
5 RCC’s micro loans are issued to the households only under the name of householdheads, so all borrower respondents are household heads. In order to elicit informa-tion from similar perceptions, the non-borrower respondents are also heads fromthe non-borrowing household.
6 In March 2010, 1 yuan ≈ 0.1465 USD.
408 X. Li et al. / The Journal of Socio-Ec
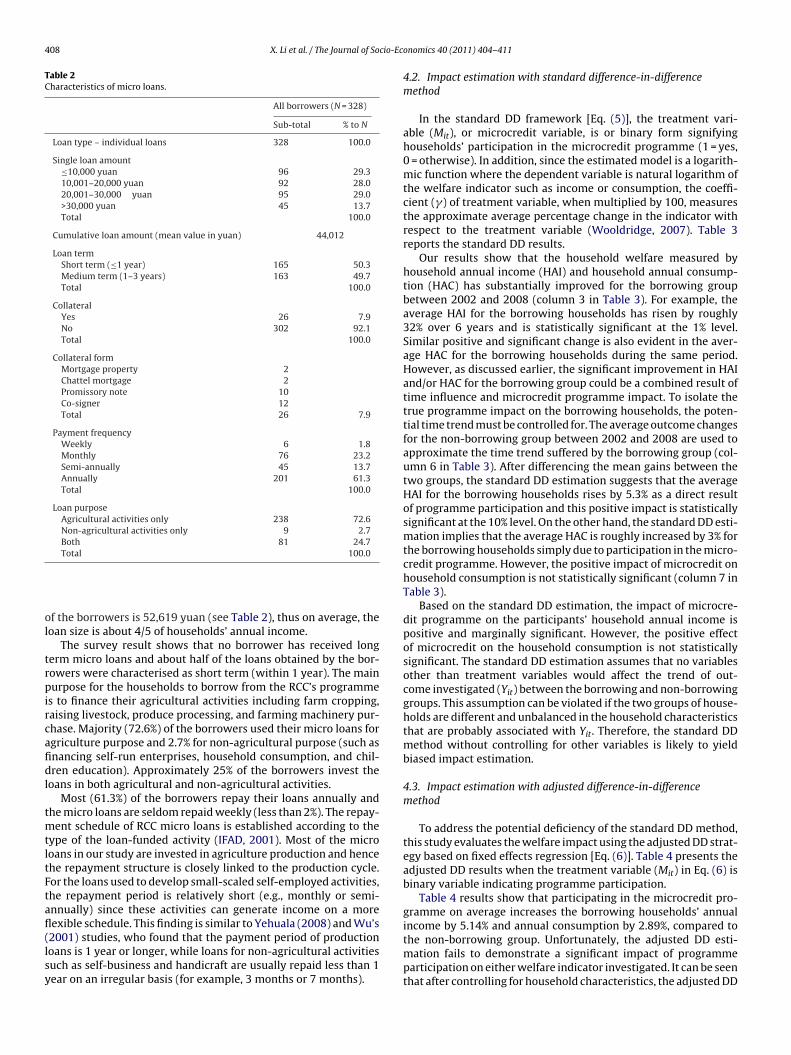
Table 2Characteristics of micro loans.
All borrowers (N = 328)
Sub-total % to N
Loan type – individual loans 328 100.0
Single loan amount≤10,000 yuan 96 29.310,001–20,000 yuan 92 28.020,001–30,000 yuan 95 29.0>30,000 yuan 45 13.7Total 100.0
Cumulative loan amount (mean value in yuan) 44,012
Loan termShort term (≤1 year) 165 50.3Medium term (1–3 years) 163 49.7Total 100.0
CollateralYes 26 7.9No 302 92.1Total 100.0
Collateral formMortgage property 2Chattel mortgage 2Promissory note 10Co-signer 12Total 26 7.9
Payment frequencyWeekly 6 1.8Monthly 76 23.2Semi-annually 45 13.7Annually 201 61.3Total 100.0
Loan purposeAgricultural activities only 238 72.6Non-agricultural activities only 9 2.7Both 81 24.7Total 100.0
ol
trpircafidl
tmtltFtafl(lsy
the non-borrowing group. Unfortunately, the adjusted DD esti-mation fails to demonstrate a significant impact of programme
f the borrowers is 52,619 yuan (see Table 2), thus on average, theoan size is about 4/5 of households’ annual income.
The survey result shows that no borrower has received longerm micro loans and about half of the loans obtained by the bor-owers were characterised as short term (within 1 year). The mainurpose for the households to borrow from the RCC’s programme
s to finance their agricultural activities including farm cropping,aising livestock, produce processing, and farming machinery pur-hase. Majority (72.6%) of the borrowers used their micro loans forgriculture purpose and 2.7% for non-agricultural purpose (such asnancing self-run enterprises, household consumption, and chil-ren education). Approximately 25% of the borrowers invest the
oans in both agricultural and non-agricultural activities.Most (61.3%) of the borrowers repay their loans annually and
he micro loans are seldom repaid weekly (less than 2%). The repay-ent schedule of RCC micro loans is established according to the
ype of the loan-funded activity (IFAD, 2001). Most of the microoans in our study are invested in agriculture production and hencehe repayment structure is closely linked to the production cycle.or the loans used to develop small-scaled self-employed activities,he repayment period is relatively short (e.g., monthly or semi-nnually) since these activities can generate income on a moreexible schedule. This finding is similar to Yehuala (2008) and Wu’s2001) studies, who found that the payment period of productionoans is 1 year or longer, while loans for non-agricultural activities
uch as self-business and handicraft are usually repaid less than 1ear on an irregular basis (for example, 3 months or 7 months).onomics 40 (2011) 404–411
4.2. Impact estimation with standard difference-in-differencemethod
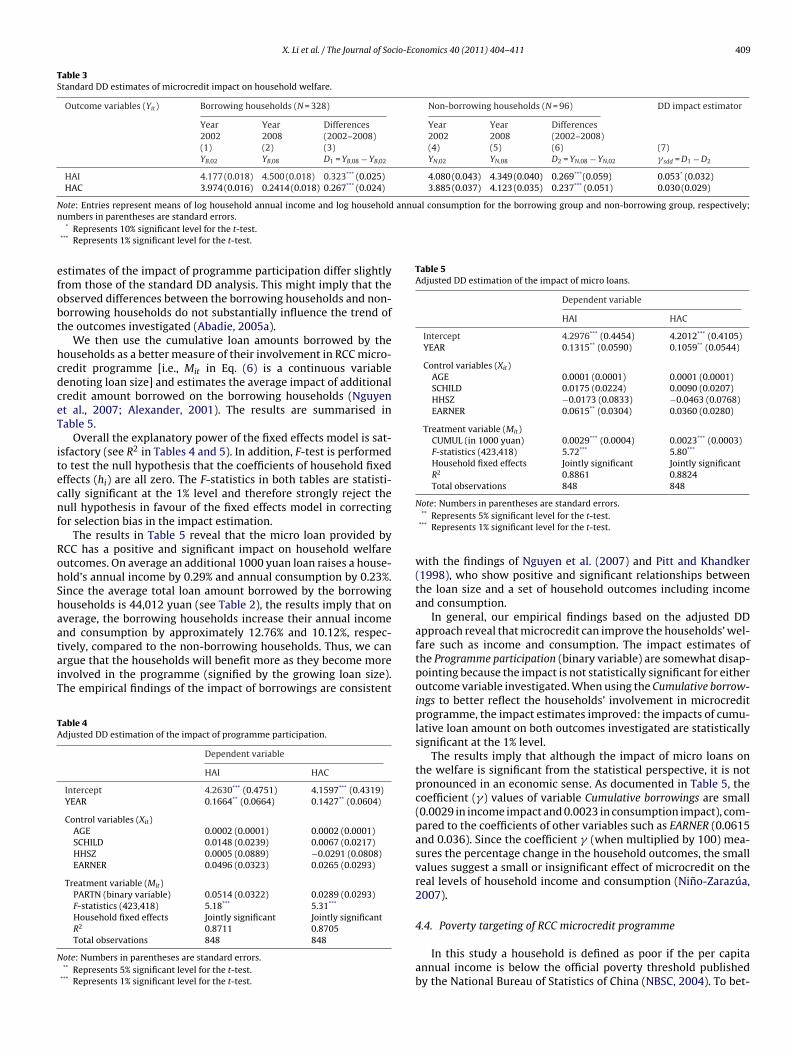
In the standard DD framework [Eq. (5)], the treatment vari-able (Mit), or microcredit variable, is or binary form signifyinghouseholds’ participation in the microcredit programme (1 = yes,0 = otherwise). In addition, since the estimated model is a logarith-mic function where the dependent variable is natural logarithm ofthe welfare indicator such as income or consumption, the coeffi-cient (�) of treatment variable, when multiplied by 100, measuresthe approximate average percentage change in the indicator withrespect to the treatment variable (Wooldridge, 2007). Table 3reports the standard DD results.
Our results show that the household welfare measured byhousehold annual income (HAI) and household annual consump-tion (HAC) has substantially improved for the borrowing groupbetween 2002 and 2008 (column 3 in Table 3). For example, theaverage HAI for the borrowing households has risen by roughly32% over 6 years and is statistically significant at the 1% level.Similar positive and significant change is also evident in the aver-age HAC for the borrowing households during the same period.However, as discussed earlier, the significant improvement in HAIand/or HAC for the borrowing group could be a combined result oftime influence and microcredit programme impact. To isolate thetrue programme impact on the borrowing households, the poten-tial time trend must be controlled for. The average outcome changesfor the non-borrowing group between 2002 and 2008 are used toapproximate the time trend suffered by the borrowing group (col-umn 6 in Table 3). After differencing the mean gains between thetwo groups, the standard DD estimation suggests that the averageHAI for the borrowing households rises by 5.3% as a direct resultof programme participation and this positive impact is statisticallysignificant at the 10% level. On the other hand, the standard DD esti-mation implies that the average HAC is roughly increased by 3% forthe borrowing households simply due to participation in the micro-credit programme. However, the positive impact of microcredit onhousehold consumption is not statistically significant (column 7 inTable 3).
Based on the standard DD estimation, the impact of microcre-dit programme on the participants’ household annual income ispositive and marginally significant. However, the positive effectof microcredit on the household consumption is not statisticallysignificant. The standard DD estimation assumes that no variablesother than treatment variables would affect the trend of out-come investigated (Yit) between the borrowing and non-borrowinggroups. This assumption can be violated if the two groups of house-holds are different and unbalanced in the household characteristicsthat are probably associated with Yit. Therefore, the standard DDmethod without controlling for other variables is likely to yieldbiased impact estimation.
4.3. Impact estimation with adjusted difference-in-differencemethod
To address the potential deficiency of the standard DD method,this study evaluates the welfare impact using the adjusted DD strat-egy based on fixed effects regression [Eq. (6)]. Table 4 presents theadjusted DD results when the treatment variable (Mit) in Eq. (6) isbinary variable indicating programme participation.
Table 4 results show that participating in the microcredit pro-gramme on average increases the borrowing households’ annualincome by 5.14% and annual consumption by 2.89%, compared to
participation on either welfare indicator investigated. It can be seenthat after controlling for household characteristics, the adjusted DD
X. Li et al. / The Journal of Socio-Economics 40 (2011) 404–411 409
Table 3Standard DD estimates of microcredit impact on household welfare.
Outcome variables (Yit) Borrowing households (N = 328) Non-borrowing households (N = 96) DD impact estimator
Year Year Differences Year Year Differences2002 2008 (2002–2008) 2002 2008 (2002–2008)(1) (2) (3) (4) (5) (6) (7)YB,02 YB,08 D1 = YB,08 − YB,02 YN,02 YN,08 D2 = YN,08 − YN,02 � sdd = D1 − D2
HAI 4.177 (0.018) 4.500 (0.018) 0.323*** (0.025) 4.080 (0.043) 4.349 (0.040) 0.269***(0.059) 0.053* (0.032)HAC 3.974 (0.016) 0.2414 (0.018) 0.267*** (0.024) 3.885 (0.037) 4.123 (0.035) 0.237*** (0.051) 0.030 (0.029)
Note: Entries represent means of log household annual income and log household annual consumption for the borrowing group and non-borrowing group, respectively;n
efobt
hcdceT
itecnf
RohShaataiT
TA
N
Table 5Adjusted DD estimation of the impact of micro loans.
Dependent variable
HAI HAC
Intercept 4.2976*** (0.4454) 4.2012*** (0.4105)YEAR 0.1315** (0.0590) 0.1059** (0.0544)
Control variables (Xit)AGE 0.0001 (0.0001) 0.0001 (0.0001)SCHILD 0.0175 (0.0224) 0.0090 (0.0207)HHSZ −0.0173 (0.0833) −0.0463 (0.0768)EARNER 0.0615** (0.0304) 0.0360 (0.0280)
Treatment variable (Mit)CUMUL (in 1000 yuan) 0.0029*** (0.0004) 0.0023*** (0.0003)F-statistics (423,418) 5.72*** 5.80***
Household fixed effects Jointly significant Jointly significantR2 0.8861 0.8824Total observations 848 848
umbers in parentheses are standard errors.* Represents 10% significant level for the t-test.
*** Represents 1% significant level for the t-test.
stimates of the impact of programme participation differ slightlyrom those of the standard DD analysis. This might imply that thebserved differences between the borrowing households and non-orrowing households do not substantially influence the trend ofhe outcomes investigated (Abadie, 2005a).
We then use the cumulative loan amounts borrowed by theouseholds as a better measure of their involvement in RCC micro-redit programme [i.e., Mit in Eq. (6) is a continuous variableenoting loan size] and estimates the average impact of additionalredit amount borrowed on the borrowing households (Nguyent al., 2007; Alexander, 2001). The results are summarised inable 5.
Overall the explanatory power of the fixed effects model is sat-sfactory (see R2 in Tables 4 and 5). In addition, F-test is performedo test the null hypothesis that the coefficients of household fixedffects (hi) are all zero. The F-statistics in both tables are statisti-ally significant at the 1% level and therefore strongly reject theull hypothesis in favour of the fixed effects model in correcting
or selection bias in the impact estimation.The results in Table 5 reveal that the micro loan provided by
CC has a positive and significant impact on household welfareutcomes. On average an additional 1000 yuan loan raises a house-old’s annual income by 0.29% and annual consumption by 0.23%.ince the average total loan amount borrowed by the borrowingouseholds is 44,012 yuan (see Table 2), the results imply that onverage, the borrowing households increase their annual incomend consumption by approximately 12.76% and 10.12%, respec-
ively, compared to the non-borrowing households. Thus, we canrgue that the households will benefit more as they become morenvolved in the programme (signified by the growing loan size).he empirical findings of the impact of borrowings are consistentable 4djusted DD estimation of the impact of programme participation.
Dependent variable
HAI HAC
Intercept 4.2630*** (0.4751) 4.1597*** (0.4319)YEAR 0.1664** (0.0664) 0.1427** (0.0604)
Control variables (Xit)AGE 0.0002 (0.0001) 0.0002 (0.0001)SCHILD 0.0148 (0.0239) 0.0067 (0.0217)HHSZ 0.0005 (0.0889) −0.0291 (0.0808)EARNER 0.0496 (0.0323) 0.0265 (0.0293)
Treatment variable (Mit)PARTN (binary variable) 0.0514 (0.0322) 0.0289 (0.0293)F-statistics (423,418) 5.18*** 5.31***
Household fixed effects Jointly significant Jointly significantR2 0.8711 0.8705Total observations 848 848
ote: Numbers in parentheses are standard errors.** Represents 5% significant level for the t-test.
*** Represents 1% significant level for the t-test.
Note: Numbers in parentheses are standard errors.** Represents 5% significant level for the t-test.
*** Represents 1% significant level for the t-test.
with the findings of Nguyen et al. (2007) and Pitt and Khandker(1998), who show positive and significant relationships betweenthe loan size and a set of household outcomes including incomeand consumption.
In general, our empirical findings based on the adjusted DDapproach reveal that microcredit can improve the households’ wel-fare such as income and consumption. The impact estimates ofthe Programme participation (binary variable) are somewhat disap-pointing because the impact is not statistically significant for eitheroutcome variable investigated. When using the Cumulative borrow-ings to better reflect the households’ involvement in microcreditprogramme, the impact estimates improved: the impacts of cumu-lative loan amount on both outcomes investigated are statisticallysignificant at the 1% level.
The results imply that although the impact of micro loans onthe welfare is significant from the statistical perspective, it is notpronounced in an economic sense. As documented in Table 5, thecoefficient (�) values of variable Cumulative borrowings are small(0.0029 in income impact and 0.0023 in consumption impact), com-pared to the coefficients of other variables such as EARNER (0.0615and 0.036). Since the coefficient � (when multiplied by 100) mea-sures the percentage change in the household outcomes, the smallvalues suggest a small or insignificant effect of microcredit on thereal levels of household income and consumption (Nino-Zarazúa,2007).
4.4. Poverty targeting of RCC microcredit programme
In this study a household is defined as poor if the per capitaannual income is below the official poverty threshold publishedby the National Bureau of Statistics of China (NBSC, 2004). To bet-

410 X. Li et al. / The Journal of Socio-Economics 40 (2011) 404–411
Table 6Poverty status of the sampled households by type and year.
Borrowing households Non-borrowing households Total
Count Share (%) Count Share (%) Count Share (%)
Poor by PL 2008a 0 0 2 2.1 2 0.5Poor by LIL 2008b 0 0 5 5.2 5 1.2Sample size 328 96 424
Poor by PL 2002a 1 0.3 6 6.3 7 1.7Poor by LIL 2002b 6 1.8 9 8.4 15 3.5Sample size 328 96 424
.y.
tp(h
gt(tliiif
hyllhiitlhsp
dmBanctmmCPRiaoc(alco
a The low poverty line in 2008 and 2002 are 786 yuan and 627 yuan, respectivelyb The low income line in 2008 and 2002 are 1067 yuan and 869 yuan, respectivel
er analyse the depth that RCC’s programme reaches the poor, twooverty lines, i.e., the low poverty line (PL) and low income lineLIL), are adopted in this study to identify the poverty status of theouseholds.7
Using the sample data, the poverty targeting of the RCC pro-ramme is shown in Table 6. The upper panel of Table 6 examineshe poverty incidence across the sample in post-programme periodi.e., 2008). It shows slight poverty incidence in the sample: onlywo households (2.1%) are hard-core poor using the low povertyine, or five households (5.2%) live in the relative poverty accord-ng to the low income line. Nevertheless, no borrowing householdn the sample is classified as poor using either poverty line. Thismplies that the RCC microcredit programme does not primarilyocus on the poor population alone.
Nguyen et al. (2007) cautions that using the poverty status ofouseholds in post-programme period can lead to inaccurate anal-sis of the programme targeting. Households who obtained microoans may increase their income and/or consumption, and thusift themselves out of poverty. Therefore, the poverty status of theouseholds in 2002 (i.e., before the programme implementation)
s also examined and the results are reported in the lower paneln Table 6. The results do not show much variation compared tohe poverty examination in 2008. For example, when using theow poverty line, the poor account for only 0.3% of the borrowingouseholds and 6.3% for the non-borrowing households. The resultsuggest that a large proportion of the borrowing households are notoor before they participated in the microcredit programme.
It can be seen that the major participants of China’s microcre-it programmes are non-poor households. This differs from thoseicrocredit programmes implemented in other countries such as
angladesh, where the poor people were effectively targeted. Therere two main reasons why the RCC microcredit programme doesot explicitly target the poor population. First, unlike the micro-redit programmes in other countries such as Bangladesh (e.g.,he Grammen Bank’s programme), which are specifically imple-
ented for poverty alleviation purpose, the main goal of the RCCicrocredit programme is to facilitate the credit accessibility by
hina rural households as required by the PBC. According to theBC (2001), there is no specific client target requirement for theCC and micro loans of RCC are issued to households who are reg-
stered as rural residents and engaged in land farming and othergriculture-related business. Second, the primary lending schemef the RCC microcredit programme is individual lending withoutollateral. Group lending, which is widely adopted in Grameen BankGB) programme or GB-style programmes to overcome informationsymmetry problem and control default risk in the absence of col-
ateral, is however, uncommon in the RCC programme. To mitigateredit risks and ensure loan repayment, the RCC programme centresn the borrower screening process and uses alternative mechanism7 For details of the construction of the two poverty lines, see NBSC (2004).
such as credit rating scheme to select borrowers (see also Yang,2006; Sun, 2003). Although this mechanism is efficient in control-ling for default risks since only households with relatively strongrepayment capacities and satisfactory creditworthiness are grantedloans, it also effectively excludes poor households who are actuallycreditworthy but rated as high risk in repaying loans from access-ing micro loans (as evidenced in this research, non-poor householdsare the primary borrowers of RCC programme). While group-basedmicrocredit programmes effectively target poor people, lending tonon-poor or wealthy people is common in individual-based pro-grammes (see Morduch, 1999; Vigenina and Kritikos, 2004).
5. Conclusions
This paper empirically evaluates the impact of microcrediton the Chinese rural households’ welfare measured by incomeand consumption. Using the difference-in-difference estimationframework, our results confirm the wide belief in microfinanceliterature that participating in microcredit programmes helpsimprove households’ welfare by raising household income and con-sumption. The results further show that the total amounts of microloans obtained by the households have a positive and significantimpact on both welfare outcomes investigated, suggesting that thehouseholds will benefit more as they become more involved inthe microcredit programme (characterised by the growing loansize). As noted earlier, both the treatment group (i.e., borrowergroup) and the control group (i.e., non-borrower group) in our studywere selected from villages where the microcredit programme isavailable for the purpose of minimising the potential non-randomprogramme placement bias. This is, however, likely to yield anunderestimation of the programme impact because the beneficialeffects of the programme may have been passed over to the con-trol group as well. In other words, the true impact of microcreditprogramme on households’ welfare may actually be stronger thanwhat has been found in our study.
In addition, the results show that the main beneficiaries ofChina’s microcredit programmes are non-poor households. There-fore, the significant impacts of microcredit on increasing householdincome and consumption do not necessarily mean that microcre-dit can reduce (material) poverty in China since the programmedoes not target the poor population. It casts some doubts on thesocial potential (such as poverty reduction) of China’s microcreditprogrammes.
Our analysis also reveals that households who are activelyengaged in the microcredit programmes and effectively investthe micro loans in income-generating activities (such as agri-cultural production and self-employment) can improve theirlivelihoods. Since the microcredit borrowers in this study are
generally non-poor households with relatively stronger economicbackground, our findings imply that microcredit programme maynot equally benefit the poor (especially the ultra-poor) who lackincome (or means of repayment) or simply borrow for con-
cio-Ec
sw(pvliga
lpeeapsNmfao
R
A
A
A
A
A
A
A
B
C
D
D
G
H
X. Li et al. / The Journal of So
umption smoothening rather than investment purpose. In otherords, microcredit programme is not appropriate in helping the
extremely) poor who cannot effectively use loans. Instead, the pooreople, especially those living in extreme poverty, should be pro-ided with other forms of support before they can efficiently useoans, which are important in helping the poor build up capital andncrease their repayment capacity. These supports include smallrants, infrastructure improvement, health care, and employmentnd education training.
The significant impact of microcredit on households’ economicife in our study demonstrates the potential influence of microcreditrogrammes on China rural economic development. Policymak-rs should thus be motivated to establish supportive regulatorynvironment where the microfinance sector can achieve sustain-ble development. For example, it would be appropriate to legallyermit non-financial institutions (NFIs) including NGOs to provideome form of financial services including microcredit. This expandsFIs’ ability to raise funds for their microfinance businesses fromultiple sources such as the public deposits and financing support
rom the People’s Bank of China (PBC), and therefore, helps them tochieve sustainable development. This enables NFIs to expand theutreach of their microfinance business.
eferences
badie, A., 2005a. Difference-in-difference estimators. In: Durlauf, S.N., Blume, L.E.(Eds.), The New Palgrave Dictionary of Economics. Palgrave Macmillan, NewYork, pp. 490–492.
badie, A., 2005b. Semiparametric difference-in-difference estimators. Review ofEconomic Studies 72, 1–19.
lexander, G.M., 2001. Essays on the Dynamics of Microfinance. Doctoral Thesis,College Park, University of Maryland. Available at: http://ezproxy.lincoln.ac.nz/login?url=http://proquest.umi.com.ezproxy.lincoln.ac.nz/pqdweb?did=725981441&sid=1&Fmt=2&clientId=18963&RQT=309&VName=PQD (accessed08.03.08).
ngrist, J.D., Krueger, A.B., 1999. Empirical strategies in labor economics. In: Ashen-felter, O., Card, D. (Eds.), Handbook of Labor Economics, vol. 3A. North-Holland,Amsterdam, pp. 1278–1357.
shenfelter, O., 1978. Estimating the effect of training programs on earnings. Reviewof Economics and Statistics 60 (1), 47–57.
shenfelter, O., Card, D., 1985. Using the longitudinal structure of earnings to esti-mate the effect of training programs. Review of Economics and Statistics 67 (4),648–660.
they, S., Imbens, G., 2006. Identification and inference in nonlinear difference-in-differences models. Econometrica 74, 431–497.
ertrand, M., Duflo, E., Mullainathan, S., 2004. How much should we trustdifferences-in-differences estimates? Quarterly Journal of Economics 119,249–275.
oleman, B.E., 1999. The impact of group lending in Northeast Thailand. Journal ofDevelopment Economics 60 (1), 105–141.
ehejia, R.H., Wahba, S., 2002. Propensity score-matching methods for nonexperi-mental causal studies. The Review of Economics and Statistics 84 (1), 151–161.
u, X.S., 2004. Attempts to implement micro-finance in rural China. In: Organisationfor Economic Co-operation and Development (OECD), Centre for Co-operationwith Non-members, Rural Finance and Credit Infrastructure in China. OECDPublications, Paris, pp. 271–284.
ale, F., Collender, R., 2006. New directions in China’s agricultural lending.Electronic Outlook Report (WRS-06-01). Available at: Economic Research
Service United States Department of Agriculture (USDA): www.ers.usda.gov/publications/WRS0601/WRS0601.pdf (accessed 06.06.07).eckman, J., 1997. Instrumental variables: a study of implicit behavioral assump-tions used in making program evaluations. Journal of Human Resources 32 (3),441–462.
onomics 40 (2011) 404–411 411
Hou, W.L., 2006. Population and poverty in Hubei Province. Centre for EconomicDevelopment Research 2006 (1) (in Chinese).
International Fund for Agricultural Development (IFAD), 2001. People’s Republic ofChina: Thematic Study on Rural Financial Services in China (Volume I – MainReport). Rome: IFAD.
Islam, T., 2007. Microcredit and Poverty Alleviation. Ashgate Publishing, Burlington,USA.
Islam, A., Harris, M.N., 2008. Medium and long-term participation in microfinance:an evaluation using a large panel data set from Bangladesh. In: Paper presentedat the 49th Annual Conference of the New Zealand Association of Economists(NZAE) , Wellington, New Zealand.
Khandker, S.R., 2005. Microfinance and poverty: evidence using panel data fromBangladesh. The World Bank Economic Review 19 (22), 263–286.
Meyer, B.D., 1995. Natural and quasi-experiments in economics. Journal of Business& Economic Statistics 13 (2), 151–161.
Morduch, J., 1998. Does microfinance really help the poor? New evidence from flag-ship programs in Bangladesh (Working Paper No. 198). Princeton University,Woodrow Wilson School of Public and International Affairs.
Morduch, J., 1999. The microfinance promise. Journal of Economic Literature XXXVII,1569–1614.
National Bureau of Statistics of China (NBSC), 2004. Statistical Yearbook. Availableat http://www.stats.gov.cn/english/.(accessed 10.07.07).
Nguyen, V.C., 2007. Impact evaluation of multiple overlapping programs undera conditional independence assumption (Discussion Paper No. 36). MansholtGraduate School of Social Sciences, The Netherlands.
Nguyen, V.C., Pham, M.T., Minh, N.P., 2007. Poverty targeting and impact of a gov-ernmental micro-credit program in Vietnam (PMMA Working Paper 2007-29).National Economic University, Hanoi, Vietnam.
Nino-Zarazúa, M.N., 2007. The impact of credit on income poverty in urbanMexico. An endogeneity-corrected estimation (Sheffield Economic ResearchPaper Series, No. 2007005). University of Sheffield, Department of Economics,Sheffield, UK.
Park, A., Ren, C.Q., 2001. Microfinance with Chinese characteristics. World Develop-ment 29 (1), 39–62.
Perry, G., Maloney, T., 2007. Evaluating active labour market programmes in NewZealand. International Journal of Manpower 28 (1), 7–29.
Pitt, M.M., Khandker, S.R., 1998. The impact of group-based credit programmes onpoor households in Bangladesh: does the gender of participants matter? TheJournal of Political Economy 106 (5), 958–996.
Rosenbaum, P.R., Rubin, D.B., 1983. The central role of the propensity score in obser-vational studies for causal effects. Biometrika 70 (1), 41–55.
Rural Credit Cooperative Hubei Head office (RCCHHO), 2008. The Guide on the Man-agement of RCC’s Rural Microcredit in Hubei Province. RCCHHO, Hubei, China(in Chinese).
Sarangi, N., 2007. Microfinance and the rural poor: impact assessment based onfieldwork in Madhya Pradesh, India. In: Paper Presented at the 2007 Conferenceon Sustainable Development & Livelihoods ,. University of Delhi, India.
Sun, R.M. 2003. The development of microfinance in China (final draft). Availableat: http://topics.developmentgateway.org/rc/filedownload.do?itemId=323395(accessed 15.05.07).
The People’s Bank of China, 2001. Guidelines on rural household micro-credit by rural credit cooperatives. Available at: http://www.cgap.org/regsup/docs/law China 04.pdf (accessed 6.08.07).
Vigenina, D., Kritikos, A.S., 2004. The individual micro-lending contract: is it a bet-ter design than joint-liability? Evidence from Georgia. Economic Systems 28,155–176.
Wooldridge, J.M., 2007. Introductory Econometrics: A Modern Approach, 3rd ed.Tsinghua University Press, Beijing, China.
Wu, G.B., 2001. A Study on China’s Microcredit Poverty Reduction. China EconomyPress, Beijing (in Chinese).
Yang, M.J., 2006. The issues in rural microcredit in Western China: a discussion. Xi’anFinance 11, 7–9 (in Chinese).
Yehuala, S., 2008. Determinants of Smallholder Farmers Access to Formal Credit:The Case of Metema Woreda, North Gondar, Ethiopia. Master’s Thesis, Hara-maya University. Available at: http://www.ipmsethiopia.org/content/files/
Documents/publications/MscTheses/Final Thesis SisayYehuala.pdf (accessed5.10.09).Zuo, X.L., 2001. Is the RCC microfinance model sustainable and replicable? In: PBC– DID Microfinance Project Case Study in Luanping, China (Notebook, 17) ,.Développement International Desjardins, Québec, Canada.


