The Legacy of Fortress Europe
Evidence on trade diversion from Nazi Germany's
confidential wartime foreign trade statistics
Tamás Vonyó
University of Groningen
Groningen Growth and Development Centre
The paper is work in progress. Please do not circulate and consult the author prior to
making any reference in published material.
ABSTRACT
The paper investigates trade diversion caused by the political reorganisation of Europe
under Nazi occupation during World War II and its impact on the development of West
German foreign trade after 1950. The confidential trade statistics of the Third Reich report
data on both the geographical and commodity structure of German exports and imports that
can be directly compared with interwar and post-war patterns. I test simple models of trade
diversion for both the interwar and war years and determine econometrically to what extent
and for how long pre-existing patterns of trade shaped the regional distribution of West
German exports and imports during the 1950s and 1960s. In the early 1940s, the German
economy became more eastward oriented with the eastward expansion of the Third Reich
and the eastbound thrust of the German war effort. However, the legacy of Fortress Europe
was short lived, as interwar trade patterns were by and large restored until the mid-1950s.
The establishment of the EEC marked a new structural break in West German trade
expansion. In appendix, I report a new constant-price dataset on the commodity structure of
German/West German exports and imports between 1928 and 1970.
JEL code: N14, N44, F14, F15
1
1. Introduction
World War II represents a watershed in the history of Germany and has long been regarded as an important episode by economic historians. There is a vast literature on the Nazi war economy: on the growth of armaments production, on the reorganisation of labour and resource allocation, and on the financing of Hitler’s preposterous quest for world domination.1 Particular attention has been devoted to the exploitation of occupied lands for their natural resources, their labour and their produce, which was estimated at 210 billion Reichsmark. This sum is 50 percent larger than the average annual GNP of the Third Reich during the war.2 It is another long-established notion that Germany exploited smaller nations in its backwater in South-East Europe through bilateral trade agreements, and tied them increasingly to the German war economy.3 This view was questioned by Ritschl, who argued that the much emphasised eastward shift of Germany’s external trade from the late 1930s onward has been a sheer myth. ‘In spite of all ideological commitment to the contrary, and in spite of the eastbound thrust of the Nazi war effort, the German war economy was in fact westward oriented’.4
A common characteristic of these investigations is that they relied on scattered
quantitative evidence. Until recently, Germany’s external economic relations have been studied
on the basis of the Third Reich’s clearing balances, as the publication of the official foreign
trade statistics was terminated after 1940. The clearing accounts give a good indication to the
extent to which foreign lands were economically exploited by Nazi Germany. However, they do
not provide an accurate picture on the structure and balance of German exports and imports,
mainly due to the fact that the foreign balances incorporated a long list of items other than
commodity trade. Fortunately, the confidential trade statistics of the Third Reich for the years
1941-1944 survived in the archives. They had been compiled for internal use only; their
publication and further distribution was strictly forbidden.5 The quantitative analysis of this
material makes an important contribution to the historiography of the Nazi war economy and
thus constitutes the main task of this paper.
Measuring trade diversion during the war is important also because of its implications
for the development of West German foreign trade after 1950. It is widely agreed that trade
expansion was instrumental in the growth miracles of the post-war Golden Age, particularly in
West Germany, where exports grew twice and three times as fast as industrial production and
national income respectively.6 Thus, the German Wirtschaftswunder has been interpreted by many
as the outcome of an even more extraordinary export miracle.7 The most popular explanations
The following abbreviations are used in footnotes: StDR = Statistik des Deutschen Reichs; Außenhandel = Der Außenhandel der Bundesrepublik Deutschland. References with no speficied author are publications of the Statistisches Bundesamt or Statistisches Reichstamt. 1 See Milward (1965), Zilbert (1981) and Tooze (2006) among others. For an extensive bibliography of the
earlier German literature, see Volkmann (1984). 2 Eichholtz (1978), pp. 150-151. Also see Buchheim (1986). 3 See Hirschman (1945), Ránki (1983), and Grenzebach (1988) among others. 4 Ritschl (2001), p. 340. 5 Der Außenhandel Deutschlands, Ergänzungshefte (1941, 1942, 1943); for 1944, see BArch R 3/1626a, pp.
38-39. In the summer of 1944, aggregate trade statistics were made public at a government press conference and some extracts were later published in Statistisches Handbuch, p. 390 ff.
6 L. von Delhaes-Guenther, (2003), p. 17, and Giersch et al. (1992), p. 164. 7 See Michalski (1970), Boltho (1982), pp. 479-485, and Wallich (1955), pp. 228-229, among others.
2
of the latter can be organised into three camps. The first argues that new international
institutions promoting trade liberalisation and market integration in Europe made conditions
conducive for export-led growth.8 The second assumes that favourable domestic production
costs and monetary protectionism enhanced the competitiveness of West German firms.9 The
third sees the development of Germany’s external trade as path-dependent and, therefore, claims
that both the commodity structure and the regional composition of West German exports
reflected patterns, or followed trends, that had been established long before the post-war Golden
Age.10 Ritschl went even further to argue that the continental division of labour was further
intensified under the Nazi New Order during the war, which laid the foundations for the main
pillars of European market integration in the 1950s.
In this paper, I test simple models of trade diversion to explain both the reorientation of
Germany’s external trade in the course of World War II and to measure how large and persistent
an impact it had on post-war developments. I argue that the German economy actually became
more eastward oriented with the eastward expansion of the Third Reich and the eastbound drive
of the Nazi war effort, contrary to the revisionist view. By contrast, the legacy of Fortress
Europe was rather short lived as the expansion of West German trade in the 1950s by and large
restored the trade patterns of the interwar period. The regional distribution and the commodity
structure of German exports and imports began to deviate from long-established trends only
after the launching of the European Economic Community (EEC). The forceful reorganisation
of intra-European trade after 1940 was not the origin of trade integration in the post-war era.
The paper is structured as follows. Section 2 presents an overview on the geography of
German foreign trade, including a discussion of the confidential wartime statistics. In Section 3,
I test simple models of trade diversion, both for the interwar period and for the early 1940s,
focussing on intra-European trade. In Section 4, I test for alternative causes of trade expansion
in West Germany after 1950, particularly the presence and persistence of a reconstruction
dynamic. I aim to determine econometrically to what extent and for how long the restoration of
pre-existing trade patterns shaped the structure of West German exports and imports and how
large an impact the new trade promoting institutions, especially the European Payments Union
(EPU) and the EEC, generated. Section 5 shifts focus onto the commodity structure of
Germany’s external trade based on a constant-price dataset that I constructed, which is reported
in the Appendix. Section 6 concludes.
2. The geography of German foreign trade: an overview
For the purpose of my analysis, I constructed a dataset on country-shares in total German
exports and imports, based on values expressed in current prices, for several benchmark years
during both the interwar and post-war periods and the actual war years. For 1950, 1955, 1960,
1965 and 1970, data have been drawn from the annual foreign trade statistics.11 The 1950
8 See Milward (1987), Buchheim (1990), and Eichengreen (1995). 9 Carlin (1989), pp. 60-5, and Giersch et al. (1992), pp. 108-16, 176-84. 10 Advocated most strongly in Abelshauser (2001), pp. 510-22, and in Delhaes/Guenther (2003), pp. 85-86. 11 Außenhandel, Teil 1 (1951), pp. 12-13; Ibid (1956), pp. 34-36; Ibid (1961), pp. 32-33; Fachserie G, Teil 1
(1966), pp. 36-37; Ibid (1971), pp. 42-43.
3
volume also reports equivalent figures for 1936 (according to 1936 national borders), which
represents a good benchmark for the post-depression years, but it is not yet too strongly
influenced by war preparations. To demonstrate how much regional patterns of trade were
distorted by the impact of the Great Depression, I also collected data for 1928.12
Unfortunately, we cannot adjust for border changes invoked by the post-war settlement
in Europe, and within that the partition of Germany. The impact of the more substantial
redrawing of maps overseas as a consequence of decolonisation is neutralised by adhering to the
territorial units reported in the interwar trade statistics, which reflect colonial boundaries. As a
result, my dataset includes regions such as the Arab Middle East that covers modern-day
Jordan, Iraq and the countries on the Arab Peninsula, or French, British, Portuguese and Spanish
West Africa, the Union of Rhodesia and the Nyassaland, French Indochina or British Malaya.
This approach is made appropriate by the fact that I aim to test for the impact of multilateral
trade agreements on the structure of actual trade flows. The extent to which the former colonial
possessions of European nations were incorporated into preferential trade zones or currency
blocs was determined primarily by the relationship of their erstwhile masters to the particular
institutional frameworks. Furthermore, it is useful to group several entities together that alone
accounted for negligible shares of Germany’s external trade. These adjustments yielded a
dataset of 95 countries or regions, for which I was able to construct by and large territorially
consistent figures over time.
For the early 1940s, the confidential foreign trade statistics report detailed data on both
the commodity structure and the geographic distribution of exports and imports. The nomenclature
of commodity groups is perfectly compatible with the official peacetime statistics. Regional
data is affected to a large but non-quantifiable extent by the border changes that took effect
between 1938 and 1941. Until 1939, the statistics are based on 1937 national borders. The
wartime data refer to the Greater German Empire that included Austria, the Sudetenland, the
Protectorate of Bohemia and Moravia as well as the annexed territories of Luxembourg,
Malmedy and Eupen, Alsace-Loraine, Posen, Upper Silesia, the city of Danzig, and most of
modern-day Slovenia. Nonetheless, this material constitutes the only source on actual wartime
trade flows that allows for a direct comparison with interwar and post-war patterns.
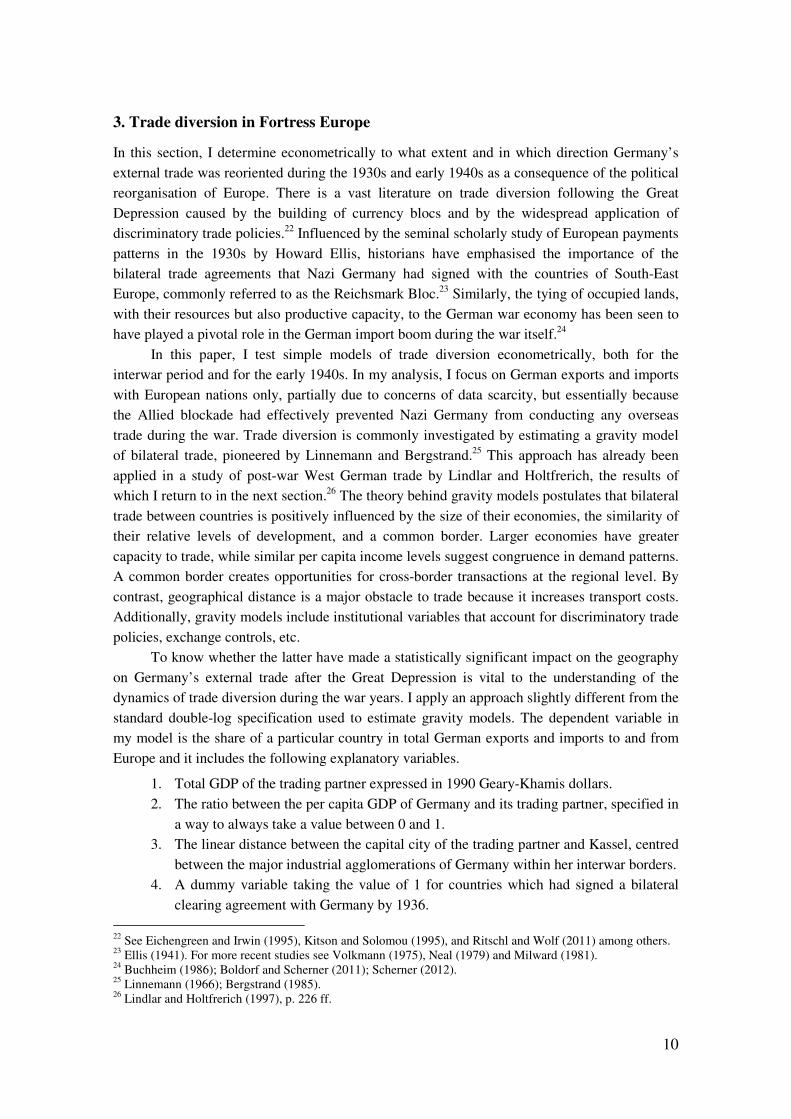
Figures 1 and 2 report the share of continents and the major regions of Europe in
German or West German exports and imports respectively. In order to begin my investigation
from a long-term perspective, I also included figures for 1913.13 The literature has frequently
advocated the view that the development of West German foreign trade during the post-war
Golden Age followed a path established in the first era of globalisation.14 The data demonstrate
that World War I invoked hardly any changes in the regional composition of Germany’s
external trade, particularly on the export side. The structure of imports shows one significant
12 StDR, vol. 366.2 (1929), pp. 4-7. 13 Own calculations based on data from StDR, vol. 366.2 (1929), pp. 4-7. 14 I had to make two adjustments on the 1913 data to assure its comparability with aggregate figures in my
dataset: (1) I assumed that Austria within her post-1919 borders accounted for 25 per cent of German trade with the Austro-Hungarian Empire, which equals her approximate share in GDP, Maddison (2006), pages 426 and 476.; (2) Turkish possessions in the Middle East are assigned 30 per cent of German trade with the Ottoman Empire, based on the actual trade patterns in the interwar period.
4
shift: the sharp decline in agricultural imports from Russia, replaced mainly by imports from the
Netherlands. The relative weight of intra-European trade remained exactly the same. There is
clearly no need to incorporate pre-1914 data to demonstrate the influence of long-established
patterns on Germany’s external trade, since the former had survived World War I ‘unwounded’.
The volume of export and imports declined considerably after 1914, but their regional
composition remained remarkably stable.
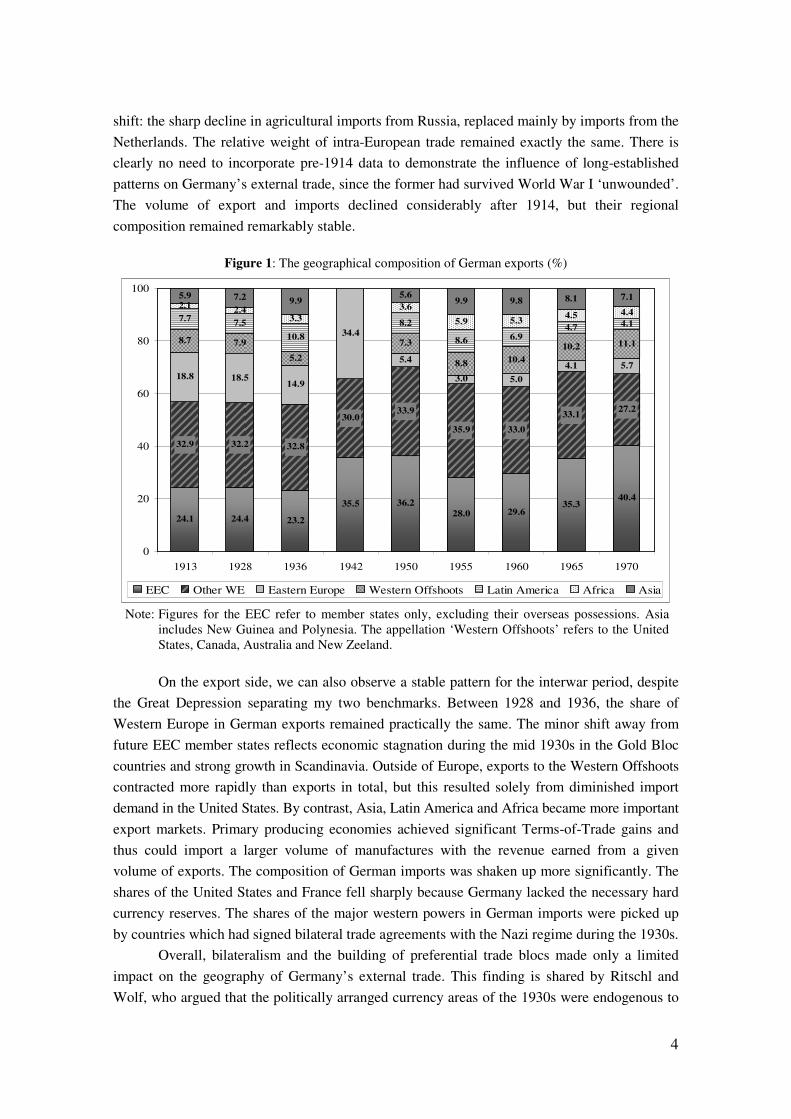
Figure 1: The geographical composition of German exports (%)
Note: Figures for the EEC refer to member states only, excluding their overseas possessions. Asia
includes New Guinea and Polynesia. The appellation ‘Western Offshoots’ refers to the United States, Canada, Australia and New Zeeland.
On the export side, we can also observe a stable pattern for the interwar period, despite
the Great Depression separating my two benchmarks. Between 1928 and 1936, the share of
Western Europe in German exports remained practically the same. The minor shift away from
future EEC member states reflects economic stagnation during the mid 1930s in the Gold Bloc
countries and strong growth in Scandinavia. Outside of Europe, exports to the Western Offshoots
contracted more rapidly than exports in total, but this resulted solely from diminished import
demand in the United States. By contrast, Asia, Latin America and Africa became more important
export markets. Primary producing economies achieved significant Terms-of-Trade gains and
thus could import a larger volume of manufactures with the revenue earned from a given
volume of exports. The composition of German imports was shaken up more significantly. The
shares of the United States and France fell sharply because Germany lacked the necessary hard
currency reserves. The shares of the major western powers in German imports were picked up
by countries which had signed bilateral trade agreements with the Nazi regime during the 1930s.
Overall, bilateralism and the building of preferential trade blocs made only a limited
impact on the geography of Germany’s external trade. This finding is shared by Ritschl and
Wolf, who argued that the politically arranged currency areas of the 1930s were endogenous to
24.1 24.4 23.2
35.5 36.2
28.0 29.635.3
40.4
32.9 32.2 32.8
30.033.9
35.9 33.0
33.127.2
18.8 18.514.9
34.4
5.4
3.0 5.0
4.1 5.7
7.9
5.2
7.3
8.8 10.4
10.2 11.1
7.77.5 8.2
8.6 6.94.7 4.1
2.12.4
3.3
3.6
5.9 5.34.5 4.4
5.9 7.2 5.69.9 9.8 8.1 7.1
8.7 10.8
9.9
0
20
40
60
80
100
1913 1928 1936 1942 1950 1955 1960 1965 1970
EEC Other WE Eastern Europe Western Offshoots Latin America Africa Asia
5
pre-existing patterns of trade.15 A much more significant diversion of German export and
imports can be observed during the war, when the Nazi state gradually lost access to its overseas
markets. Trade with the British colonies and dominions was shut down in 1939. Albeit in small
volumes, exports to and imports from the Americas and Asia, particularly Japan and her
possessions, continued until 1941. After the United States had declared war on Germany, the
African colonies of France, Italy, Spain and Portugal remained the only accessible trade partners
outside of Europe. Even the latter were lost in 1943, with the exception of Spanish West Africa,
when the Allies conquered North Africa.
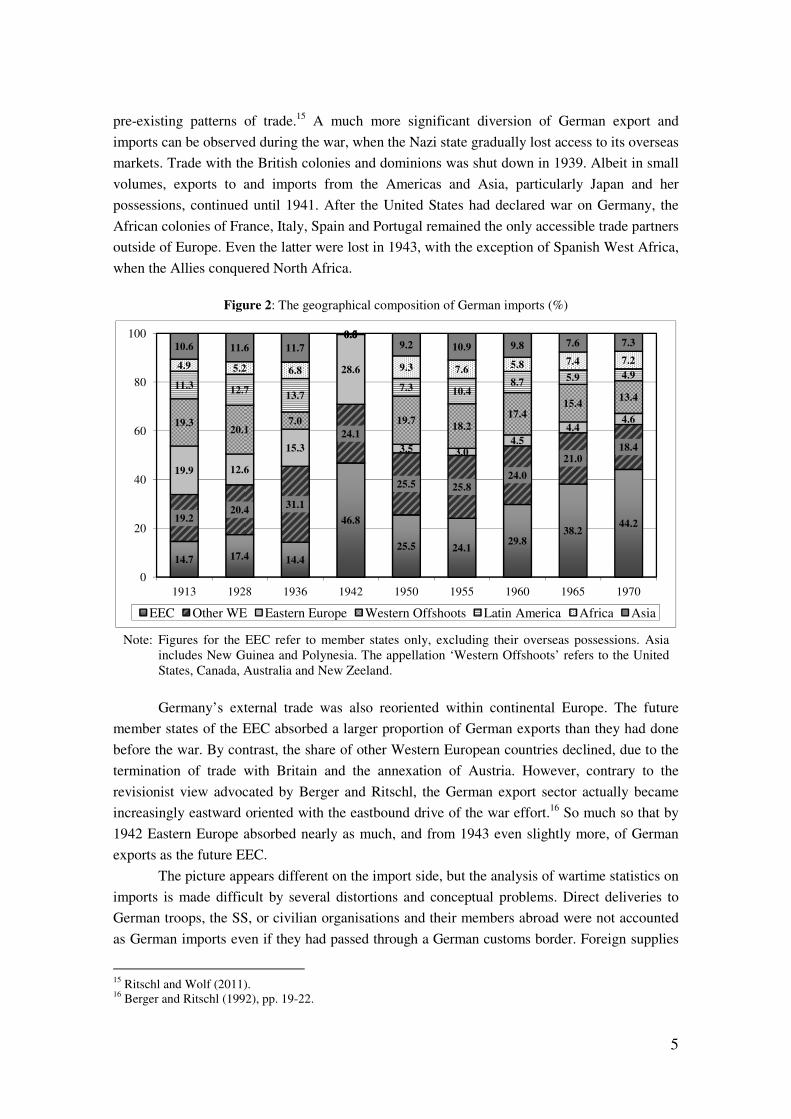
Figure 2: The geographical composition of German imports (%)
Note: Figures for the EEC refer to member states only, excluding their overseas possessions. Asia
includes New Guinea and Polynesia. The appellation ‘Western Offshoots’ refers to the United States, Canada, Australia and New Zeeland.
Germany’s external trade was also reoriented within continental Europe. The future
member states of the EEC absorbed a larger proportion of German exports than they had done
before the war. By contrast, the share of other Western European countries declined, due to the
termination of trade with Britain and the annexation of Austria. However, contrary to the
revisionist view advocated by Berger and Ritschl, the German export sector actually became
increasingly eastward oriented with the eastbound drive of the war effort.16 So much so that by
1942 Eastern Europe absorbed nearly as much, and from 1943 even slightly more, of German
exports as the future EEC.
The picture appears different on the import side, but the analysis of wartime statistics on
imports is made difficult by several distortions and conceptual problems. Direct deliveries to
German troops, the SS, or civilian organisations and their members abroad were not accounted
as German imports even if they had passed through a German customs border. Foreign supplies
15 Ritschl and Wolf (2011). 16 Berger and Ritschl (1992), pp. 19-22.
14.7 17.4 14.4
46.8
25.5 24.129.8
38.244.2
19.220.4
31.1
24.1
25.5 25.824.0
21.018.4
19.9 12.6
15.3
28.6
3.5 3.04.5
4.44.619.3
20.17.0
0.0
19.718.2
17.415.4
13.411.3 12.7
13.7
0.0
7.3 10.48.7 5.9 4.9
4.9 5.2 6.8
0.5
9.3 7.65.8 7.4 7.2
10.6 11.6 11.7 9.2 10.9 9.8 7.6 7.3
0
20
40
60
80
100
1913 1928 1936 1942 1950 1955 1960 1965 1970
EEC Other WE Eastern Europe Western Offshoots Latin America Africa Asia
6
of both civilian goods and war material transported into the Third Reich were to be included in
the import statistics, if they were not labelled as Wehrmacht supplies, regardless whether they
were final or intermediary products destined for further processing within Germany.17 In a
recent study, Scherner has documented numerous flaws in the official statistics, which the
authorities were increasingly aware of.18 There is plenty of evidence that a large proportion of
foreign goods actually consumed by German firms and households were entered as Wehrmacht
supplies, including black-market purchases by occupying forces, which were transported to
Germany. Additionally, a vast share of foreign food and fuel transports to German troops on the
Eastern Front never passed through German customs borders. The re-estimation of German
imports on the basis of payments transactions, the foreign purchases of the armed forces and the
accounts of the occupation authorities results in much larger numbers than the official statistics,
especially from occupied lands.
Scherner’s new estimates, however, are difficult to interpret in the present framework.
The purpose of his study was not to provide import data according to a conventional definition
of imports, but to reconstruct how Nazi Germany had used different financial means to extract
resources from foreign lands. Imports were defined as goods produced in a given country and
purchased by Germany for consumption anywhere outside the country of origin. The Third
Reich had three means to finance its imports: (a) revenue earned from exports, (b) clearing
credits received from foreign countries and (c) the occupation tributes. Wehrmacht supplies, in
particular, were purchased through means (b) and (c) which, however, Germany never repaid to
the countries it had occupied during the war. Therefore, these supplies are better classified as
bounty, or war contributions, rather than conventional imports.
Additionally, increased imports from occupied territories did not reflect the expansion of
production capacities, but simply the diversion of local output from domestic to foreign military
consumption. By contrast, it was difficult to secure imports from neutral states or nations allied
with Germany, as their productive potential was focussed on equipping their own expanding
armies and on maintaining domestic consumption. In particular, Germany had to grant its allies
in the East substantial and increasing provisions of intermediate inputs and manufactures
(mostly coal, metals and machine tools) to sustain their military effort and, at the same time, to
secure the essential raw-material imports, which until 1939 had been purchased overseas. The
redirection of German exports to East and South-East Europe clearly demonstrates that Nazi
Germany had made real efforts to reorient its war economy eastwards.
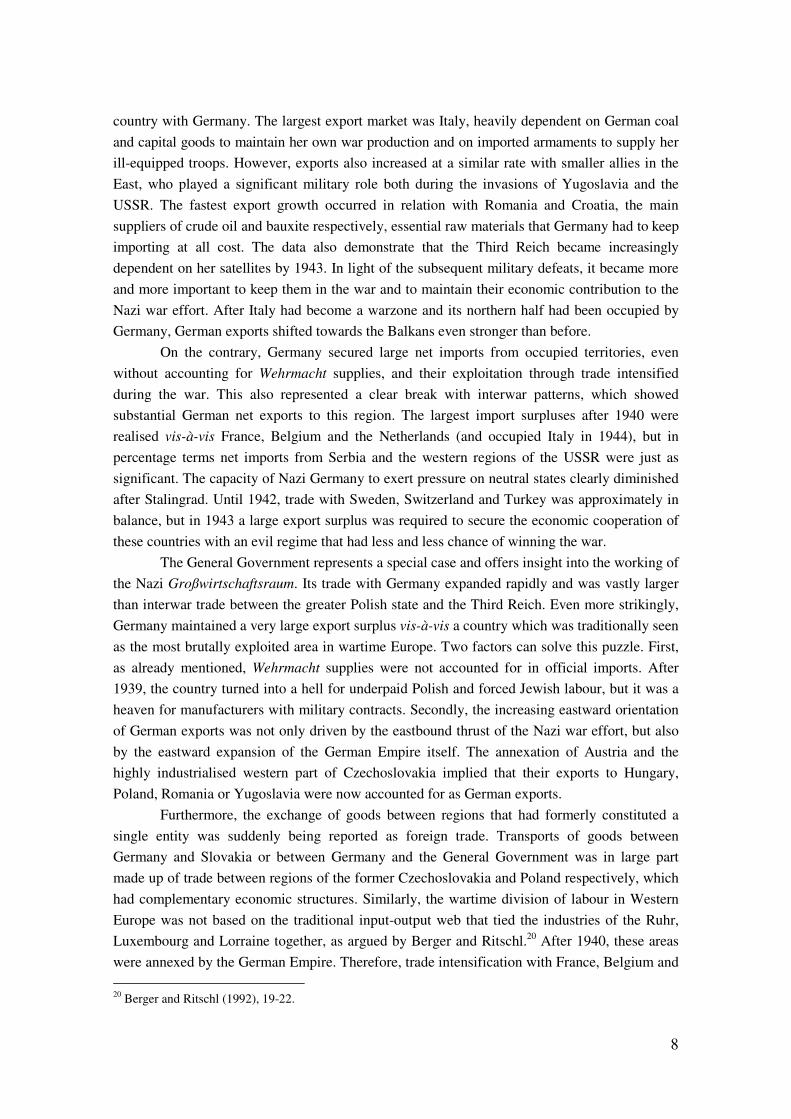
Table 1 reports wartime exports and imports according to country of destination and of
origin, expressed in current prices and based on official statistics. I only list European states
which continued to trade with the Third Reich in notable volumes at least until 1943.19 German
trade expanded noticeably with all countries in continental Europe between 1936 and the early
1940s. However, the trade balance shifted differently depending on the relation of the particular
17 Der Außenhandel Deutschlands. Ergänzungsheft 1941, p. 3. 18 Scherner (2012). Forthcoming publication, referenced with the permission of the author. 19 Small quantities of German manufactures were exported to Iceland, the temporarily occupied British
Channel Islands and North Africa, from where some raw-material imports had also been secured, but they were negligible from the perspective of the big picture.
7
Ta
ble
1: G
erm
an tr
ade
wit
h co
ntin
enta
l Eur
ope
duri
ng W
orld
War
II
in m
illi
on R
M (
curr
ent p
rice
s)
Co
un
trie
s 1
93
6
19
40
1
94
1
19
42
19
43
19
44
Imp
orts
E
xp
ort
s Im
po
rts
E
xp
ort
s Im
po
rts
Ex
po
rts
Im
po
rts
Ex
po
rts
Im
po
rts
Ex
po
rts
Imp
orts
E
xp
ort
s
Gen
eral
Gov
ernm
ent
57
.9
53.0
91
.4
238.
6 87
.2
312.
3 22
4.3
468.
3 25
7.7
558.
7 19
6 37
1 B
elgi
um
138.
6 21
1.5
227.
9 11
7.2
562.
0 38
4.6
705.
0 29
2.5
681.
4 30
8.1
434
184
Bul
gari
a 57
.6
47.6
17
6.8
162.
2 13
7.4
260.
4 28
6.1
289.
1 29
2.8
367.
4 36
8 49
9 D
enm
ark
154.
3 18
2.3
494.
5 32
4.9
410.
2 43
1.9
314.
0 36
3.7
420.
9 37
7.3
522
401
Fin
land
46
.1
40.5
79
.2
82.8
14
4.9
252.
9 14
9.0
371.
3 27
1.5
404.
4 24
6 47
1 F
ranc
e 98
.9
254.
5 22
4.0
13.3
75
1.8
315.
3 1
404.
0 54
6.3
1 41
6.1
559.
9 10
06
260
Gre
ece
68.4
63
.5
90.3
63
.3
81.2
10
.5
130.
0 58
.6
103.
5 75
.6
25
71
Ital
y 20
8.5
240.
6 50
7.9
724.
3 93
7.8
1 19
2.4
1 02
2.0
1 30
4.7
780.
9 95
0.5
1145
40
0 A
lban
ia &
Mon
tene
gro
0.0
0.9
0.1
2.0
0.1
4.1
0.5
5.0
0.5
3.5
0 2
Cro
atia
--
---
----
- --
---
----
- 35
.0
54.8
74
.7
175.
0 10
4.2
319.
4 69
84
1 Y
ugos
lavi
a 75
.2
77.2
23
9.7
317.
1 83
.8
90.9
--
---
----
- --
---
----
- --
---
----
- N
ethe
rlan
ds, T
he
168.
5 39
5.5
406.
4 44
0.0
640.
1 69
4.7
857.
7 53
3.7
824.
5 42
7.3
601
250
Nor
way
87
.9
91.3
14
1.8
192.
3 28
0.4
430.
1 23
9.4
369.
5 22
8.3
500.
4 22
3 28
2 P
ortu
gal
21.7
29
.8
4.3
3.9
33.7
31
.0
120.
8 48
.6
120.
3 52
.7
39
45
Rom
ania
92
.3
103.
6 42
7.1
350.
1 34
6.6
430.
5 42
8.7
716.
1 32
3.4
994.
9 28
6 77
3 S
wed
en
191.
7 23
0.4
346.
0 40
3.0
476.
9 45
5.2
410.
3 42
3.5
386.
0 47
9.2
240
437
Sw
itze
rlan
d 10
6.2
225.
5 16
6.1
272.
7 31
4.7
414.
3 42
4.4
398.
4 29
7.7
332.
3 19
6 26
4 S
erbi
a --
---
----
- --
---
----
- 43
.7
13.2
12
0.8
44.0
19
2.9
70.4
13
6 70
S
lova
kia
111.
9 86
.3
199.
7 21
6.0
214.
6 25
7.9
282.
2 30
6.7
265.
4 32
1.0
227
273
Spa
in
97.7
69
.3
20.0
23
.2
146.
1 56
.6
165.
7 11
8.6
219.
7 19
1.6
115
184
Tur
key
118.
5 79
.4
51.1
13
.0
81.8
25
.8
100.
3 10
9.4
161.
5 24
9.1
138
77
Hun
gary
93
.4
83.0
20
7.3
298.
3 35
1.2
349.
9 54
0.9
430.
8 61
5.3
672.
0 59
5 63
6 U
SS
R
149.
2 18
2.3
545.
2 34
9.4
325.
5 27
1.7
482.
7 15
6.6
243.
6 18
2.7
----
- --
---
N
ote:
F
igur
es a
re n
ot a
djus
ted
for
bord
er c
hang
es d
urin
g th
e w
ar. F
or 1
936,
fig
ures
for
the
Gen
eral
Gov
ernm
ent r
efer
to P
olan
d an
d th
ose
for
Slo
vaki
a to
Cze
chos
lova
kia.
F
igur
es f
or Y
ugos
lavi
a re
fer
to th
e pe
riod
unt
il th
e in
vasi
on o
f th
e co
untr
y in
Apr
il 1
941.
S
ourc
es:
For
194
0, d
ata
is r
epor
ted
in S
tati
stis
ch
es
Ja
hrb
uch
(19
41/4
2),
p. 3
22.
For
194
1-19
44 s
ee D
er
Au
ßen
ha
nd
el
Deu
tsch
lan
ds:
Erg
änzu
ngsh
efte
(19
41,
1942
, 19
43),
and
BA
rch
R 3
/162
6a, p
p. 3
8-39
.
8
country with Germany. The largest export market was Italy, heavily dependent on German coal
and capital goods to maintain her own war production and on imported armaments to supply her
ill-equipped troops. However, exports also increased at a similar rate with smaller allies in the
East, who played a significant military role both during the invasions of Yugoslavia and the
USSR. The fastest export growth occurred in relation with Romania and Croatia, the main
suppliers of crude oil and bauxite respectively, essential raw materials that Germany had to keep
importing at all cost. The data also demonstrate that the Third Reich became increasingly
dependent on her satellites by 1943. In light of the subsequent military defeats, it became more
and more important to keep them in the war and to maintain their economic contribution to the
Nazi war effort. After Italy had become a warzone and its northern half had been occupied by
Germany, German exports shifted towards the Balkans even stronger than before.
On the contrary, Germany secured large net imports from occupied territories, even
without accounting for Wehrmacht supplies, and their exploitation through trade intensified
during the war. This also represented a clear break with interwar patterns, which showed
substantial German net exports to this region. The largest import surpluses after 1940 were
realised vis-à-vis France, Belgium and the Netherlands (and occupied Italy in 1944), but in
percentage terms net imports from Serbia and the western regions of the USSR were just as
significant. The capacity of Nazi Germany to exert pressure on neutral states clearly diminished
after Stalingrad. Until 1942, trade with Sweden, Switzerland and Turkey was approximately in
balance, but in 1943 a large export surplus was required to secure the economic cooperation of
these countries with an evil regime that had less and less chance of winning the war.
The General Government represents a special case and offers insight into the working of
the Nazi Großwirtschaftsraum. Its trade with Germany expanded rapidly and was vastly larger
than interwar trade between the greater Polish state and the Third Reich. Even more strikingly,
Germany maintained a very large export surplus vis-à-vis a country which was traditionally seen
as the most brutally exploited area in wartime Europe. Two factors can solve this puzzle. First,
as already mentioned, Wehrmacht supplies were not accounted for in official imports. After
1939, the country turned into a hell for underpaid Polish and forced Jewish labour, but it was a
heaven for manufacturers with military contracts. Secondly, the increasing eastward orientation
of German exports was not only driven by the eastbound thrust of the Nazi war effort, but also
by the eastward expansion of the German Empire itself. The annexation of Austria and the
highly industrialised western part of Czechoslovakia implied that their exports to Hungary,
Poland, Romania or Yugoslavia were now accounted for as German exports.
Furthermore, the exchange of goods between regions that had formerly constituted a
single entity was suddenly being reported as foreign trade. Transports of goods between
Germany and Slovakia or between Germany and the General Government was in large part
made up of trade between regions of the former Czechoslovakia and Poland respectively, which
had complementary economic structures. Similarly, the wartime division of labour in Western
Europe was not based on the traditional input-output web that tied the industries of the Ruhr,
Luxembourg and Lorraine together, as argued by Berger and Ritschl.20 After 1940, these areas
were annexed by the German Empire. Therefore, trade intensification with France, Belgium and
20 Berger and Ritschl (1992), 19-22.

9
the Netherlands was partly due to the fact that their transactions with Luxembourg and Alsace-
Loraine now contributed to German exports and imports.
The increasing eastward orientation of German exports during the war marks a clear
break with the geographic patterns prevailing both in the interwar and post-war periods. In
1950, Eastern Europe absorbed 5 per cent of West German exports and its share in imports was
even smaller. By contrast, the weight of Western Europe remained far larger than what it had
been in the interwar period, especially for exports. Cold-war tensions are mainly to blame for this
reorientation of West German trade. With the establishment of COCOM in November 1949, a
large proportion of internationally traded goods, labelled as ‘strategic products’, was excluded
from East-West trade. Although the embargoes were eased during the 1960s, by that time,
structural differences made eastern trade unattractive for producers on the western side of the
Iron Curtain.21 Additionally, the decline of trade with the Soviet bloc was just as much the
consequence of the post-war territorial settlements that dismantled the eastern half of Hitler’s
empire as the growth of German trade with Eastern Europe during the war had resulted from the
eastward expansion of the Third Reich between 1938 and 1941.
Trade with the Americas and Africa recovered quickly after the war, but there was a
marked shift between North and Latin America, where governments pursued a policy of import
substitution. Exports to Asia remained below interwar standards, primarily due to the
communist takeover in China and sluggish import demand in Japan, where reconstruction
efforts were still in their infancy. The geographic distribution of West German trade that had
evolved by the interwar period was, by and large, restored until 1955, except for the fact that the
share of Eastern Europe hit an all-time low. On the export side, the latter was offset by the
increased share of overseas markets. By contrast, agricultural imports from Eastern Europe were
replaced once again mainly by rising Dutch food exports to Germany.
Despite the establishment of the European Coal and Steel Community (ECSC), the
relative importance of its member states for German exports compared with the rest of Western
Europe was remarkably similar to what it had been during the interwar period. In the second
half of the 1950s, the geographic distribution of exports and imports remained fairly stable. The
share of the EEC and Eastern Europe increased marginally at the expense of the rest of the
continent. Only after 1960 did the EEC begin to absorb significantly larger proportions of West
German trade, at the expense of both overseas markets and state-trading economies, but also of
other countries in Western Europe. The completion of the European customs union in the late
1960s was a particularly important threshold on the export side.
Overall, the data indicates that the strong westward orientation of Germany’s external
trade after 1950 corresponded to interwar rather than wartime patterns. In the second half of the
1950s, this restored regional pattern of trade was conserved. It was only after the EEC had
created a more discriminatory trading bloc that the share of Western Europe in German exports
and imports was propelled to unprecedented heights. In the 1960s the share of western
industrialised nations in Germany’s external trade also began to expand at the expense of less
developed markets, which signals the rising importance of intra-industry trade.
21 Neebe (1989), pp. 58-61.
10
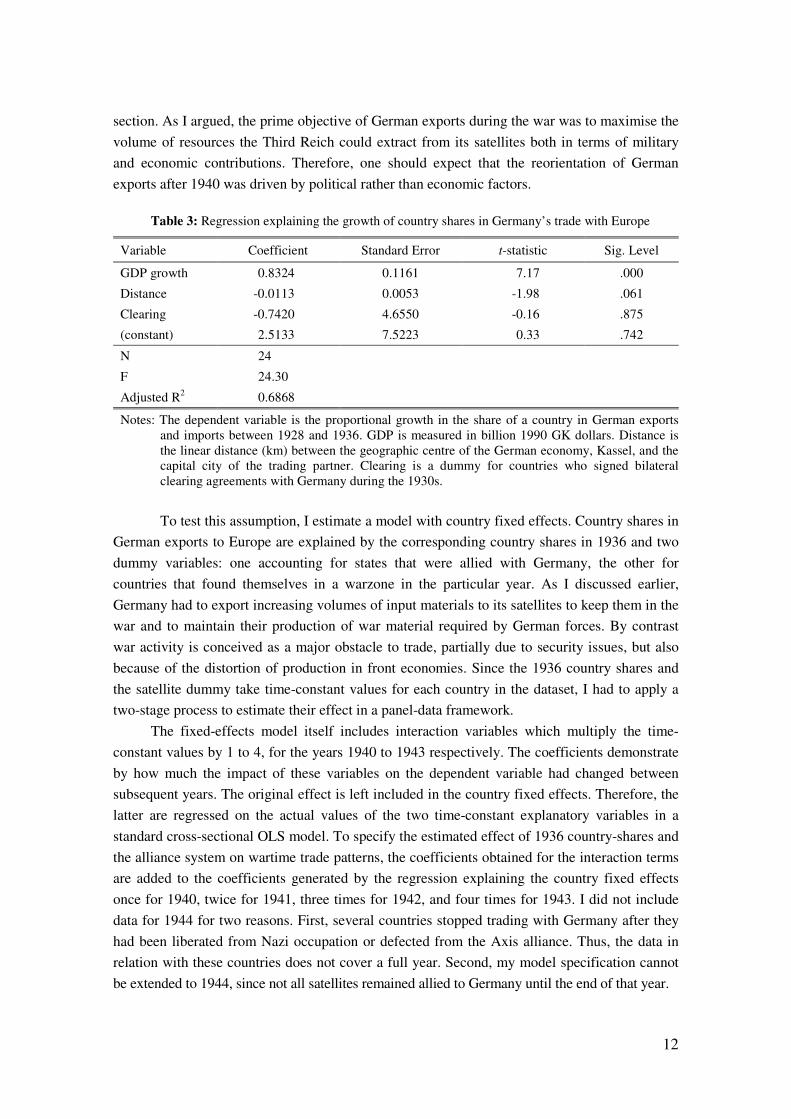
3. Trade diversion in Fortress Europe
In this section, I determine econometrically to what extent and in which direction Germany’s external trade was reoriented during the 1930s and early 1940s as a consequence of the political reorganisation of Europe. There is a vast literature on trade diversion following the Great Depression caused by the building of currency blocs and by the widespread application of discriminatory trade policies.22 Influenced by the seminal scholarly study of European payments patterns in the 1930s by Howard Ellis, historians have emphasised the importance of the bilateral trade agreements that Nazi Germany had signed with the countries of South-East Europe, commonly referred to as the Reichsmark Bloc.23 Similarly, the tying of occupied lands, with their resources but also productive capacity, to the German war economy has been seen to have played a pivotal role in the German import boom during the war itself.24
In this paper, I test simple models of trade diversion econometrically, both for the interwar period and for the early 1940s. In my analysis, I focus on German exports and imports with European nations only, partially due to concerns of data scarcity, but essentially because the Allied blockade had effectively prevented Nazi Germany from conducting any overseas trade during the war. Trade diversion is commonly investigated by estimating a gravity model of bilateral trade, pioneered by Linnemann and Bergstrand.25 This approach has already been applied in a study of post-war West German trade by Lindlar and Holtfrerich, the results of which I return to in the next section.26 The theory behind gravity models postulates that bilateral trade between countries is positively influenced by the size of their economies, the similarity of their relative levels of development, and a common border. Larger economies have greater capacity to trade, while similar per capita income levels suggest congruence in demand patterns. A common border creates opportunities for cross-border transactions at the regional level. By contrast, geographical distance is a major obstacle to trade because it increases transport costs. Additionally, gravity models include institutional variables that account for discriminatory trade policies, exchange controls, etc.
To know whether the latter have made a statistically significant impact on the geography on Germany’s external trade after the Great Depression is vital to the understanding of the dynamics of trade diversion during the war years. I apply an approach slightly different from the standard double-log specification used to estimate gravity models. The dependent variable in my model is the share of a particular country in total German exports and imports to and from Europe and it includes the following explanatory variables.
1. Total GDP of the trading partner expressed in 1990 Geary-Khamis dollars. 2. The ratio between the per capita GDP of Germany and its trading partner, specified in
a way to always take a value between 0 and 1. 3. The linear distance between the capital city of the trading partner and Kassel, centred
between the major industrial agglomerations of Germany within her interwar borders. 4. A dummy variable taking the value of 1 for countries which had signed a bilateral
clearing agreement with Germany by 1936. 22 See Eichengreen and Irwin (1995), Kitson and Solomou (1995), and Ritschl and Wolf (2011) among others. 23 Ellis (1941). For more recent studies see Volkmann (1975), Neal (1979) and Milward (1981). 24 Buchheim (1986); Boldorf and Scherner (2011); Scherner (2012). 25 Linnemann (1966); Bergstrand (1985). 26 Lindlar and Holtfrerich (1997), p. 226 ff.
11
I do not include a dummy for countries that shared a common border with the Reich. This
variable would strongly correlate with distance, which would, in turn, make the coefficients
unstable due to multi-collinearity. The model is estimated with robust standard errors for a
cross-section of 24 European countries separately for 1928 and 1936.
Table 2: Regressions explaining country shares in Germany’s trade with Europe
Variable 1928 (I) 1928 (II) 1936 (I) 1936 (II)
GDP 0.0349** 0.0337** 0.0209** 0.0225** (7.65) (9.72) (4.12) (4.79) GDP p.c. ratio 0.7901 2.6526 (0.37) (1.51) Distance -0.0034* -0.0037** -0.0020* -0.0028** (-2.85) (-4.62) (-2.35) (-3.92) Clearing 0.4490 1.7423* 2.0117** (0.51) (2.54) (2.95) (constant) 5.3478* 6.4131** 2.5075 4.6681** (2.30) (5.63) (1.62) (5.15) N 24 24 24 24 F 30.08 66.16 11.25 13.24 R2 0.8086 0.7854 0.7198 0.6662
Notes: GDP is expressed in billion 1990 GK dollars. GDP p.c. ratio is the ratio between the per capita GDP of Germany and its trading partner and always takes a value between 0 and 1. Distance is the linear distance (km) between Kassel and the capital city of the trading partner. Clearing is a dummy for countries who signed bilateral trade agreements with Germany during the 1930s.
Despite the small number of observations, we obtain statistically significant results.
Variety in the size of the different economies and in their geographical distance from the heart
of the Reich can almost fully explain the regional composition of Germany’s external trade. By
contrast, the similarity of per capita income levels does not seem to have been an influential
factor. Although countries who had signed a bilateral trade agreement with the Third Reich
carved out, on average, a two percentage-point larger share in German trade than other European
nations by 1936, we still obtain highly significant coefficients for the standard variables of the
gravity model. This result confirms that the geographical composition of Germany’s external
trade was not strongly distorted by bilateralism and the building of currency blocs after the Great
Depression. In other words, prior to World War II, trade diversion in Europe was not driven by
Hitler’s geo-political aspirations.
This argument receives further support from the results reported in Table 3. The growth
of country shares in German exports and imports between 1928 and 1936 is regressed on the
corresponding rate of real GDP growth, geographical distance, and the dummy for bilateral
clearing. The coefficients suggest a clear conclusion: the restructuring of German’s external
trade was largely driven by shifts in the relative size of different European economies, and not
by their trade agreements signed with the Nazi State.
To model the reorientation of German trade during World War II, I constructed a panel
dataset representing the 21 European countries that traded with the Third Reich in every year
during the period 1940-1943. My analysis focuses on the geographical distribution of German
exports only, due to the serious concerns related to import statistics discussed in the previous
12
section. As I argued, the prime objective of German exports during the war was to maximise the
volume of resources the Third Reich could extract from its satellites both in terms of military
and economic contributions. Therefore, one should expect that the reorientation of German
exports after 1940 was driven by political rather than economic factors.
Table 3: Regression explaining the growth of country shares in Germany’s trade with Europe
Variable Coefficient Standard Error t-statistic Sig. Level
GDP growth 0.8324 0.1161 7.17 .000
Distance -0.0113 0.0053 -1.98 .061
Clearing -0.7420 4.6550 -0.16 .875
(constant) 2.5133 7.5223 0.33 .742
N 24
F 24.30
Adjusted R2 0.6868
Notes: The dependent variable is the proportional growth in the share of a country in German exports and imports between 1928 and 1936. GDP is measured in billion 1990 GK dollars. Distance is the linear distance (km) between the geographic centre of the German economy, Kassel, and the capital city of the trading partner. Clearing is a dummy for countries who signed bilateral clearing agreements with Germany during the 1930s.
To test this assumption, I estimate a model with country fixed effects. Country shares in
German exports to Europe are explained by the corresponding country shares in 1936 and two
dummy variables: one accounting for states that were allied with Germany, the other for
countries that found themselves in a warzone in the particular year. As I discussed earlier,
Germany had to export increasing volumes of input materials to its satellites to keep them in the
war and to maintain their production of war material required by German forces. By contrast
war activity is conceived as a major obstacle to trade, partially due to security issues, but also
because of the distortion of production in front economies. Since the 1936 country shares and
the satellite dummy take time-constant values for each country in the dataset, I had to apply a
two-stage process to estimate their effect in a panel-data framework.
The fixed-effects model itself includes interaction variables which multiply the time-
constant values by 1 to 4, for the years 1940 to 1943 respectively. The coefficients demonstrate
by how much the impact of these variables on the dependent variable had changed between
subsequent years. The original effect is left included in the country fixed effects. Therefore, the
latter are regressed on the actual values of the two time-constant explanatory variables in a
standard cross-sectional OLS model. To specify the estimated effect of 1936 country-shares and
the alliance system on wartime trade patterns, the coefficients obtained for the interaction terms
are added to the coefficients generated by the regression explaining the country fixed effects
once for 1940, twice for 1941, three times for 1942, and four times for 1943. I did not include
data for 1944 for two reasons. First, several countries stopped trading with Germany after they
had been liberated from Nazi occupation or defected from the Axis alliance. Thus, the data in
relation with these countries does not cover a full year. Second, my model specification cannot
be extended to 1944, since not all satellites remained allied to Germany until the end of that year.
13
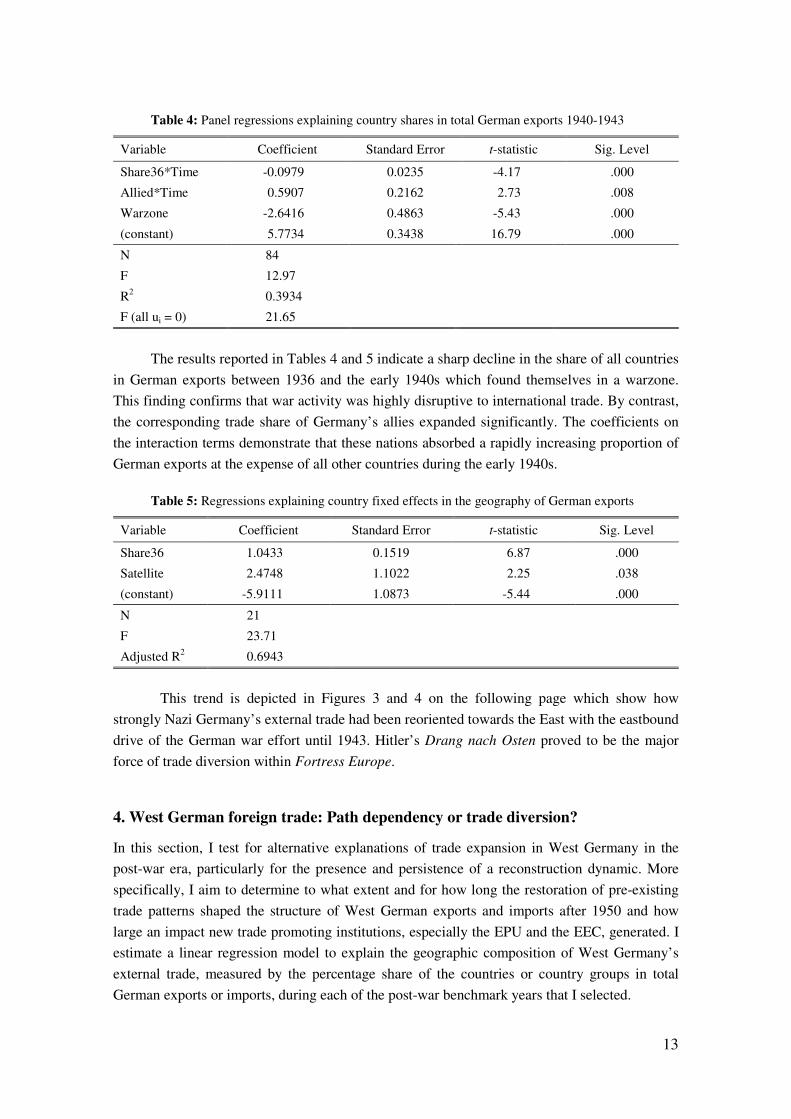
Table 4: Panel regressions explaining country shares in total German exports 1940-1943
Variable Coefficient Standard Error t-statistic Sig. Level
Share36*Time -0.0979 0.0235 -4.17 .000
Allied*Time 0.5907 0.2162 2.73 .008
Warzone -2.6416 0.4863 -5.43 .000
(constant) 5.7734 0.3438 16.79 .000
N 84
F 12.97
R2 0.3934
F (all ui = 0) 21.65
The results reported in Tables 4 and 5 indicate a sharp decline in the share of all countries
in German exports between 1936 and the early 1940s which found themselves in a warzone.
This finding confirms that war activity was highly disruptive to international trade. By contrast,
the corresponding trade share of Germany’s allies expanded significantly. The coefficients on
the interaction terms demonstrate that these nations absorbed a rapidly increasing proportion of
German exports at the expense of all other countries during the early 1940s.
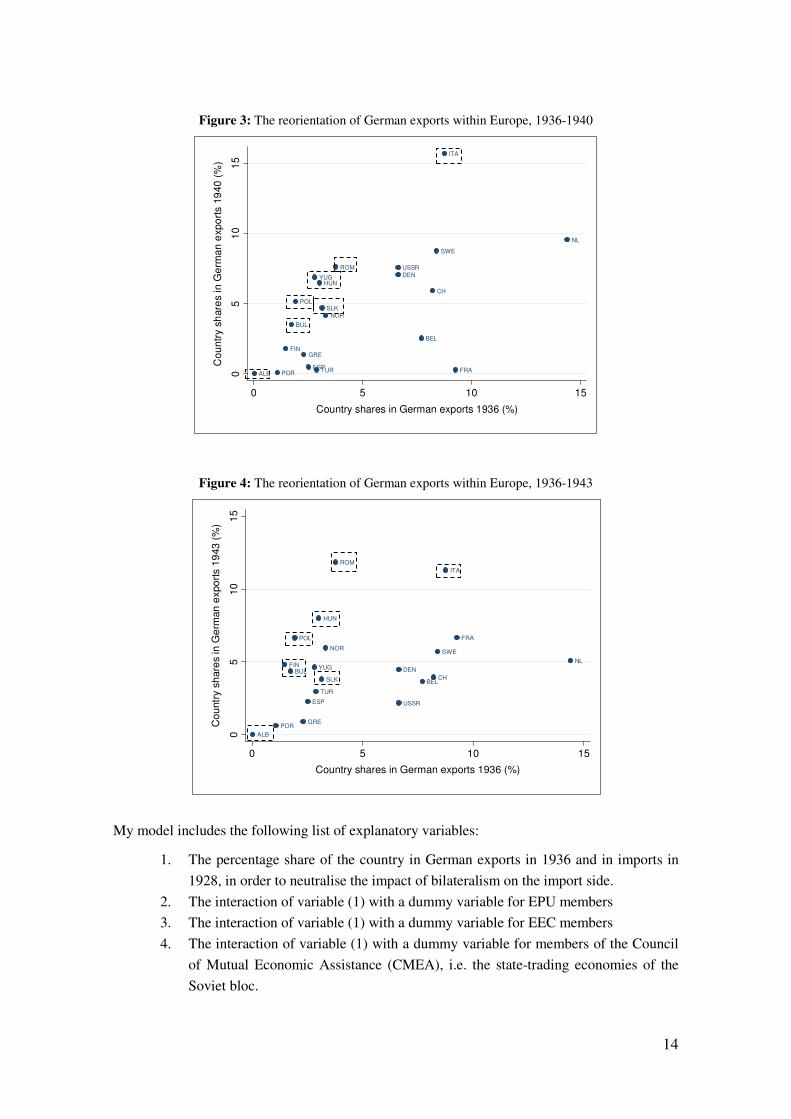
Table 5: Regressions explaining country fixed effects in the geography of German exports
Variable Coefficient Standard Error t-statistic Sig. Level
Share36 1.0433 0.1519 6.87 .000
Satellite 2.4748 1.1022 2.25 .038
(constant) -5.9111 1.0873 -5.44 .000
N 21
F 23.71
Adjusted R2 0.6943
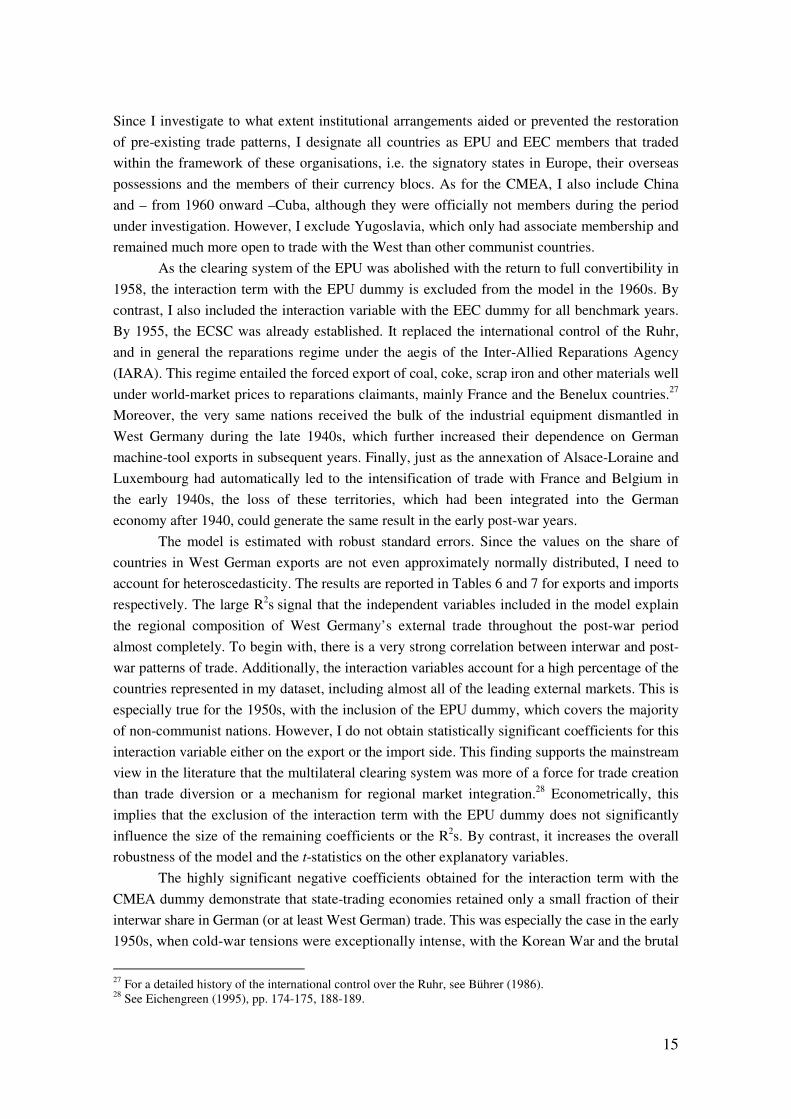
This trend is depicted in Figures 3 and 4 on the following page which show how
strongly Nazi Germany’s external trade had been reoriented towards the East with the eastbound
drive of the German war effort until 1943. Hitler’s Drang nach Osten proved to be the major
force of trade diversion within Fortress Europe.
4. West German foreign trade: Path dependency or trade diversion?
In this section, I test for alternative explanations of trade expansion in West Germany in the
post-war era, particularly for the presence and persistence of a reconstruction dynamic. More
specifically, I aim to determine to what extent and for how long the restoration of pre-existing
trade patterns shaped the structure of West German exports and imports after 1950 and how
large an impact new trade promoting institutions, especially the EPU and the EEC, generated. I
estimate a linear regression model to explain the geographic composition of West Germany’s
external trade, measured by the percentage share of the countries or country groups in total
German exports or imports, during each of the post-war benchmark years that I selected.
14
Figure 3: The reorientation of German exports within Europe, 1936-1940
Figure 4: The reorientation of German exports within Europe, 1936-1943
My model includes the following list of explanatory variables:
1. The percentage share of the country in German exports in 1936 and in imports in
1928, in order to neutralise the impact of bilateralism on the import side.
2. The interaction of variable (1) with a dummy variable for EPU members
3. The interaction of variable (1) with a dummy variable for EEC members
4. The interaction of variable (1) with a dummy variable for members of the Council
of Mutual Economic Assistance (CMEA), i.e. the state-trading economies of the
Soviet bloc.
POL
BEL
BUL
DEN
FIN
FRA
GRE
ITA
ALB
YUG
NL
NOR
POR
ROM
SWE
CH
SLK
ESPTUR
HUN
USSR
05
10
15
Co
un
try s
hare
s in
Ge
rma
n e
xp
ort
s 1
940
(%
)
0 5 10 15
Country shares in German exports 1936 (%)
POL
BEL
BUL DENFIN
FRA
GRE
ITA
ALB
YUGNL
NOR
POR
ROM
SWE
CHSLK
ESP
TUR
HUN
USSR
05
10
15
Cou
ntr
y s
hare
s in G
erm
an
expo
rts 1
943
(%
)
0 5 10 15
Country shares in German exports 1936 (%)
15
Since I investigate to what extent institutional arrangements aided or prevented the restoration
of pre-existing trade patterns, I designate all countries as EPU and EEC members that traded
within the framework of these organisations, i.e. the signatory states in Europe, their overseas
possessions and the members of their currency blocs. As for the CMEA, I also include China
and – from 1960 onward –Cuba, although they were officially not members during the period
under investigation. However, I exclude Yugoslavia, which only had associate membership and
remained much more open to trade with the West than other communist countries.
As the clearing system of the EPU was abolished with the return to full convertibility in
1958, the interaction term with the EPU dummy is excluded from the model in the 1960s. By
contrast, I also included the interaction variable with the EEC dummy for all benchmark years.
By 1955, the ECSC was already established. It replaced the international control of the Ruhr,
and in general the reparations regime under the aegis of the Inter-Allied Reparations Agency
(IARA). This regime entailed the forced export of coal, coke, scrap iron and other materials well
under world-market prices to reparations claimants, mainly France and the Benelux countries.27
Moreover, the very same nations received the bulk of the industrial equipment dismantled in
West Germany during the late 1940s, which further increased their dependence on German
machine-tool exports in subsequent years. Finally, just as the annexation of Alsace-Loraine and
Luxembourg had automatically led to the intensification of trade with France and Belgium in
the early 1940s, the loss of these territories, which had been integrated into the German
economy after 1940, could generate the same result in the early post-war years.
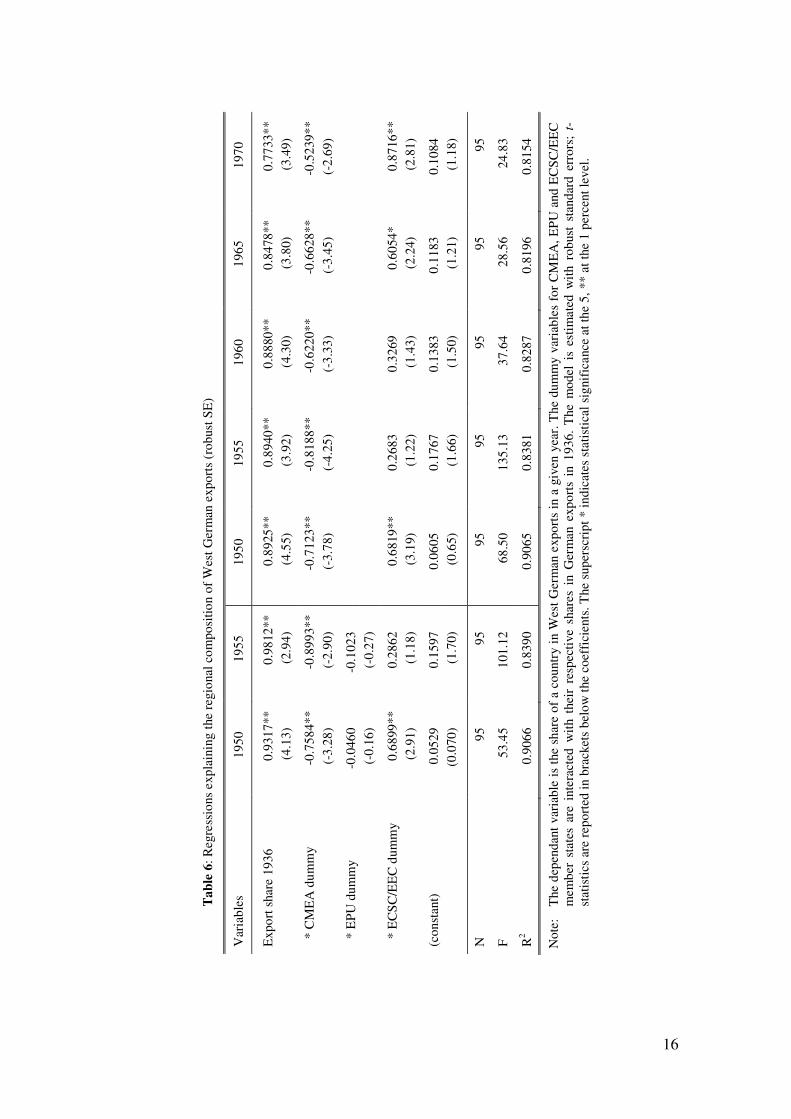
The model is estimated with robust standard errors. Since the values on the share of
countries in West German exports are not even approximately normally distributed, I need to
account for heteroscedasticity. The results are reported in Tables 6 and 7 for exports and imports
respectively. The large R2s signal that the independent variables included in the model explain
the regional composition of West Germany’s external trade throughout the post-war period
almost completely. To begin with, there is a very strong correlation between interwar and post-
war patterns of trade. Additionally, the interaction variables account for a high percentage of the
countries represented in my dataset, including almost all of the leading external markets. This is
especially true for the 1950s, with the inclusion of the EPU dummy, which covers the majority
of non-communist nations. However, I do not obtain statistically significant coefficients for this
interaction variable either on the export or the import side. This finding supports the mainstream
view in the literature that the multilateral clearing system was more of a force for trade creation
than trade diversion or a mechanism for regional market integration.28 Econometrically, this
implies that the exclusion of the interaction term with the EPU dummy does not significantly
influence the size of the remaining coefficients or the R2s. By contrast, it increases the overall
robustness of the model and the t-statistics on the other explanatory variables.
The highly significant negative coefficients obtained for the interaction term with the
CMEA dummy demonstrate that state-trading economies retained only a small fraction of their
interwar share in German (or at least West German) trade. This was especially the case in the early
1950s, when cold-war tensions were exceptionally intense, with the Korean War and the brutal
27 For a detailed history of the international control over the Ruhr, see Bührer (1986). 28 See Eichengreen (1995), pp. 174-175, 188-189.
16
Ta
ble
6: R
egre
ssio
ns e
xpla
inin
g th
e re
gion
al c
ompo
sitio
n of
Wes
t Ger
man
exp
orts
(ro
bust
SE
)
Var
iabl
es
1950
19
55
1950
19
55
1960
19
65
1970
Exp
ort s
hare
193
6 0.
9317
**
0.98
12**
0.
8925
**
0.89
40**
0.
8880
**
0.84
78**
0.
7733
**
(4
.13)
(2
.94)
(4
.55)
(3
.92)
(4
.30)
(3
.80)
(3
.49)
* C
ME
A d
umm
y -0
.758
4**
-0.8
993*
* -0
.712
3**
-0.8
188*
* -0
.622
0**
-0.6
628*
* -0
.523
9**
(-
3.28
) (-
2.90
) (-
3.78
) (-
4.25
) (-
3.33
) (-
3.45
) (-
2.69
)
* E
PU
dum
my
-0.0
460
-0.1
023
(-0.
16)
(-0.
27)
* E
CS
C/E
EC
dum
my
0.68
99**
0.
2862
0.
6819
**
0.26
83
0.32
69
0.60
54*
0.87
16**
(2.9
1)
(1.1
8)
(3.1
9)
(1.2
2)
(1.4
3)
(2.2
4)
(2.8
1)
(con
stan
t)
0.05
29
0.15
97
0.06
05
0.17
67
0.13
83
0.11
83
0.10
84
(0
.070
) (1
.70)
(0
.65)
(1
.66)
(1
.50)
(1
.21)
(1
.18)
N
95
95
95
95
95
95
95
F 53
.45
101.
12
68.5
0 13
5.13
37
.64
28.5
6 24
.83
R2
0.90
66
0.83
90
0.90
65
0.83
81
0.82
87
0.81
96
0.81
54
Not
e:
The
dep
enda
nt v
aria
ble
is t
he s
hare
of
a co
untr
y in
Wes
t Ger
man
exp
orts
in a
giv
en y
ear.
The
dum
my
vari
able
s fo
r C
ME
A, E
PU
and
EC
SC
/EE
C
mem
ber
stat
es a
re i
nter
acte
d w
ith
thei
r re
spec
tive
sha
res
in G
erm
an e
xpor
ts i
n 19
36.
The
mod
el i
s es
tim
ated
wit
h ro
bust
sta
ndar
d er
rors
; t-
stat
isti
cs a
re r
epor
ted
in b
rack
ets
belo
w th
e co
effi
cien
ts. T
he s
uper
scri
pt *
indi
cate
s st
atis
tica
l sig
nifi
canc
e at
the
5, *
* at
the
1 pe
rcen
t lev
el.
17
Ta
ble
7: R
egre
ssio
ns e
xpla
inin
g th
e re
gion
al c
ompo
sitio
n of
Wes
t Ger
man
impo
rts
(rob
ust S
E)
Var
iabl
es
1950
19
55
1950
19
55
1960
19
65
1970
Impo
rt s
hare
192
8 0.
9338
**
0.86
74**
0.
9181
**
0.85
39**
0.
7826
**
0.70
39**
0.
6021
**
(5
.31)
(4
.16)
(6
.02)
(4
.87)
(5
.50)
(4
.39)
(4
.96)
* C
ME
A d
umm
y -0
.797
1**
-0.7
613*
* -0
.775
7**
-0.7
429*
* -0
.532
6**
-0.4
794*
* -0
.392
8**
(-
4.42
) (-
3.66
) (-
5.25
) (-
4.63
) (-
3.60
) (-
2.92
) (-
3.39
)
* E
PU
dum
my
-0.0
738
-0.0
636
(-0.
31)
(-0.
28)
* E
CS
C/E
EC
dum
my
0.64
05*
0.65
72**
0.
5861
0.
6303
**
0.91
69**
1.
4432
**
1.89
42**
(2.0
1)
(3.6
5)
(1.8
9)
(3.2
7)
(6.8
0)
(7.3
9)
(12.
64)
(con
stan
t)
0.11
91
0.15
97
0.10
36
0.15
85*
0.14
50
0.11
80
0.12
36
(0
.060
) (1
.70)
(1
.09)
(2
.12)
(1
.72)
(1
.35)
(1
.65)
N
95
95
95
95
95
95
95
F 19
.70
49.2
5 20
.58
58.0
2 84
.27
94.5
2 20
7.06
R2
0.83
35
0.80
28
0.81
28
0.80
21
0.86
00
0.87
12
0.91
45
Not
e: T
he d
epen
dant
var
iabl
e is
the
sha
re o
f a
coun
try
in W
est
Ger
man
im
port
s in
a g
iven
yea
r. T
he d
umm
y va
riab
les
for
CM
EA
, EP
U a
nd E
CS
C/E
EC
m
embe
r st
ates
are
inte
ract
ed w
ith
thei
r re
spec
tive
shar
es in
Ger
man
im
port
s in
192
8. T
he m
odel
is e
stim
ated
wit
h ro
bust
sta
ndar
d er
rors
; t-s
tatis
tics
ar
e re
port
ed in
bra
cket
s be
low
the
coef
fici
ents
. The
sup
ersc
ript
* in
dica
tes
stat
istic
al s
igni
fica
nce
at th
e 5,
**
at th
e 1
perc
ent l
evel
18
suppression of the popular uprising in East Berlin in June 1953. The actual trade data confirms
that the relations of the Federal Republic deteriorated with all state-trading countries, not just
with a few important members of the Soviet bloc.
From the perspective of the regional dynamics of trade expansion in West Germany, the
most important explanatory variable in my model is the interaction term with the ECSC/EEC
dummy. Here the coefficients depict a slightly different story on the two sides of Germany’s
external trade. As for exports, the impact of wartime trade integration and the Inter-Allied
reparations regime was still felt strongly in 1950, but vanished until 1955. The share of ECSC
member states in West German exports did not differ significantly from their corresponding
weight in the mid 1930s. This result and the fact that the coefficient on the 1936 country-shares
is closer to 1 for 1955 than for 1950 confirms that the development of West German exports
during the early phase of post-war reconstruction was itself driven by a reconstruction dynamic.
In the late 1950s, the regional distribution of German exports was largely conserved. However,
this trend changed markedly during the 1960s, when the member states of the EEC absorbed a
rapidly expanding proportion of West German exports, which by 1965 was already much higher
than it had been in the interwar period. This shift in the development of regional trade patterns
was particularly momentous in the late 1960s. In 1970, the EEC accounted for a 65 percent
larger share of German exports than its constituents had done in 1936. The corresponding share
of other non-communist countries was, on average, 23 percent smaller.
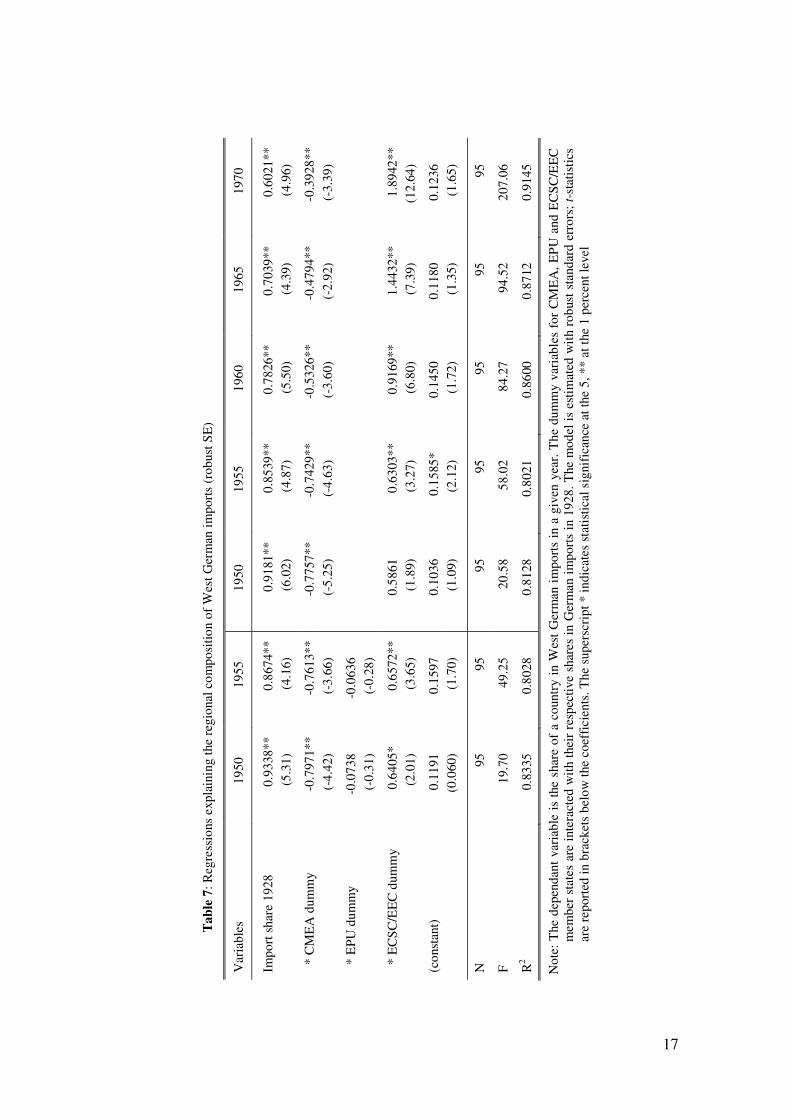
By contrast, the relative importance of the ECSC and EEC member states as sources of
West German imports was substantially greater already in the first half of the 1950s than what it
had been in the interwar period. It was mostly due to the replacement of East and South-East
Europe as Germany’s main source of food imports by countries in the western half of the
continent, particularly the Netherlands. In theory, the establishment of the ECSC was also
expected to increase the share of its member states in German iron-ore imports, but the leading
steelmakers of the Ruhr continued to prefer higher quality ores imported from Sweden. Despite
these differences, the launching of the EEC proved to be just as important a threshold as it was
on the export side. By the end of the period under investigation, the Common Market supplied
almost two-and-a-half times the proportion of total German imports that its constituents had
done in 1928. This meant that the corresponding share of other nations in the non-communist
world shrank, on average, by as much as 40 per cent.
The econometric results reported in this section do not accord with the findings of
Lindlar and Holtfrerich, who estimated a gravity model of West German foreign trade with over
70 countries in the post-war period.29 They found that cross-country variation in the value of
German exports and imports can be largely explained by the three standard variables: GDP,
GDP per capita, and distance from the geographical centre of the West German economy. The
authors confirmed the state-trading countries as outliers, but did not obtain significant coefficients
for the dummy variable accounting for EEC member states, even after the completion of the
customs union in the late 1960s. Their results were distorted by strong multi-collinearity, more
specifically a correlation between the EEC dummy and the distance of the capital city of the
trading partner from Frankfurt. The big jumps they obtained in the size of the coefficient on
29 Lindlar and Holtfrerich (1997), pp. 226-228.
19
distance between the early 1950s and the early 1960s, as well as between the latter and the early
1970s, effectively picked up the impact of trade integration within the EEC. It is highly unlikely
that distance-related trade costs increased significantly during this period.
My findings so far suggest that the understanding of West German trade expansion
during the 1950s and 1960s requires different explanations at different stages. The largely
mono-causal interpretations discussed in the introduction are complementary rather than
exclusive to one another. The impact of forced economic integration in Western Europe within
the Nazi Großwirtschaftsraum during the war and under the aegis of the IARA thereafter
persisted into the early 1950s. In subsequent years, the expansion of West German exports was
driven by the restoration of the regional trade patterns which had been established in the
interwar period. Even on the import side, the moderate diversion we can observe was generated
by a very clear geographical shift in agricultural imports. The only countries distorting this
general trend were the state-trading economies of Eastern Europe that pursued a policy of
national and bloc autarchy. During the 1960s, West Germany’s external trade could continue to
expand at a remarkably high rate due the trade-creating effect of regional market integration
within the EEC and, as a consequence of that, the enhanced importance of intra-industry trade.
5. Shifts in the commodity structure of German exports and imports
The conclusions drawn from the above results can only be confirmed, if we can observe similar
developments in the commodity structure of West German trade. The restoration of the pre-
existing geographical patterns of German exports and imports during the early 1950s can only
be viewed as the product of a reconstruction dynamic, if such a dynamic also manifested itself
in the commodity structure of Germany’s external trade. Similarly, the establishment of the
EEC could only constitute a structural break in the development of West German exports, if it
brought about marked shifts in the commodity structure between the 1950s and the 1960s, and
especially during the late 1960s when the customs union was completed. More precisely, we
need to see significant changes in the areas of specialisation for German exporters. Otherwise,
the EEC can be considered as merely a mechanism that conserved and, at most, deepened a
natural trading bloc. The same argument can be made about wartime trade diversion, which we
would expect to have produced strong shifts in the structure of both imports and exports in
accordance with the needs and productive capacity of the German war economy.
To investigate these hypotheses, I constructed a constant-price dataset on German/West
German commodity trade in 60 product categories for the benchmark years I have studied in the
previous sections. Currently, there is no alternative dataset available at any similar level of
disaggregation that covers the whole period under focus. Therefore, it is reported in its entirety
in the Appendix, including a detailed list of my statistical sources, for the aid of future research.
The construction of this dataset required several adjustments. First, the product nomenclature of
the foreign trade statistics was altered substantially between the 1920s and the 1930s, and – to a
lesser extent – also after 1945. I aggregated the industrial commodity groups, which numbered
at least 148 from 1936 onwards, into 56 categories of goods and classified foodstuffs into 4
groups. This approach allowed me to aggregate several closely related commodities that alone
20
would have accounted for negligible shares in German exports and imports. My dataset also
makes it easier for researchers to analyse structural developments, as the official statistics
disaggregated machinery into twelve, chemicals into over twenty branches.
The total volume of exports declined substantially between 1928 and 1936, but was
maintained at close to peacetime levels during the early 1940s, albeit on an enlarged territorial
basis. From the post-war nadir of slightly over 8 billion DM, exports grew rapidly, and by 1955
reached the volume they had attained before the Great Depression. In the subsequent ten years,
the rate of expansion fell back somewhat, but increased again during the late 1960s. By 1970,
the volume of German commodity exports was five times as large as it had been in 1928. The
development of imports showed a similar pattern, although their volume also increased marginally
during the war and it expanded faster than exports from the late 1950s onward. That West
German still managed to widen its export surplus was solely due to substantial improvements in
her commodity Terms of Trade throughout the post-war Golden Age.30
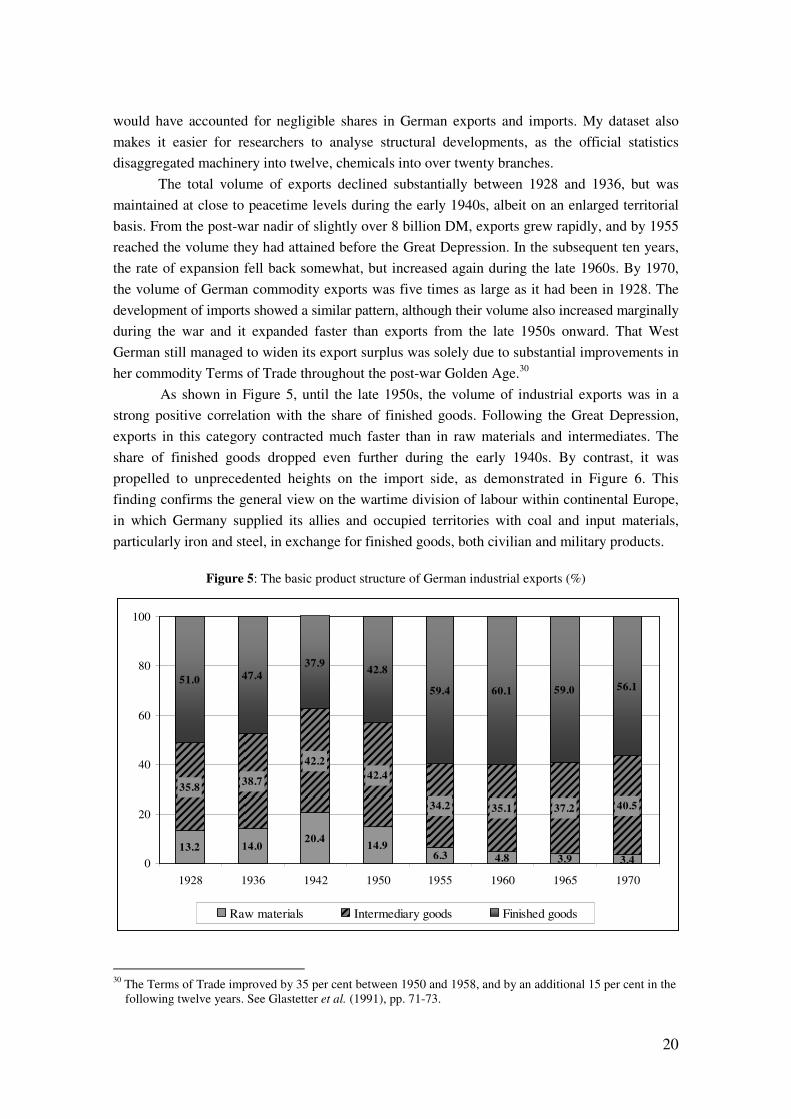
As shown in Figure 5, until the late 1950s, the volume of industrial exports was in a
strong positive correlation with the share of finished goods. Following the Great Depression,
exports in this category contracted much faster than in raw materials and intermediates. The
share of finished goods dropped even further during the early 1940s. By contrast, it was
propelled to unprecedented heights on the import side, as demonstrated in Figure 6. This
finding confirms the general view on the wartime division of labour within continental Europe,
in which Germany supplied its allies and occupied territories with coal and input materials,
particularly iron and steel, in exchange for finished goods, both civilian and military products.
Figure 5: The basic product structure of German industrial exports (%)
30 The Terms of Trade improved by 35 per cent between 1950 and 1958, and by an additional 15 per cent in the
following twelve years. See Glastetter et al. (1991), pp. 71-73.
13.2 14.020.4
14.96.3 4.8 3.9 3.4
35.838.7
42.2
42.4
34.2 35.1 37.2 40.5
51.0 47.437.9
42.8
59.4 60.1 59.0 56.1
0
20
40
60
80
100
1928 1936 1942 1950 1955 1960 1965 1970
Raw materials Intermediary goods Finished goods
21
The data do not provide evidence for the argument that the outsourcing of war production from
the Third Reich was facilitated by machinery exports. The share of machine-tools and steel
constructions in total industrial exports had already been very low in 1936, but declined even
further in the early 1940s. It needs to be emphasised, however, that shifts in the commodity
structure of German trade, especially imports, during the war were partially driven by border
changes. In particular, the annexation of Moravia, Upper Silesia, Luxembourg and Loraine
substantially enhanced the country’s reserves of hard coal and iron ore as well as its production
capacity in ferrous metals. While this increased the share of the above goods in industrial
exports, their corresponding weight on the import side diminished, and German machine-tool
producers found substantially increased demand for their products within the borders of an
enlarged empire.
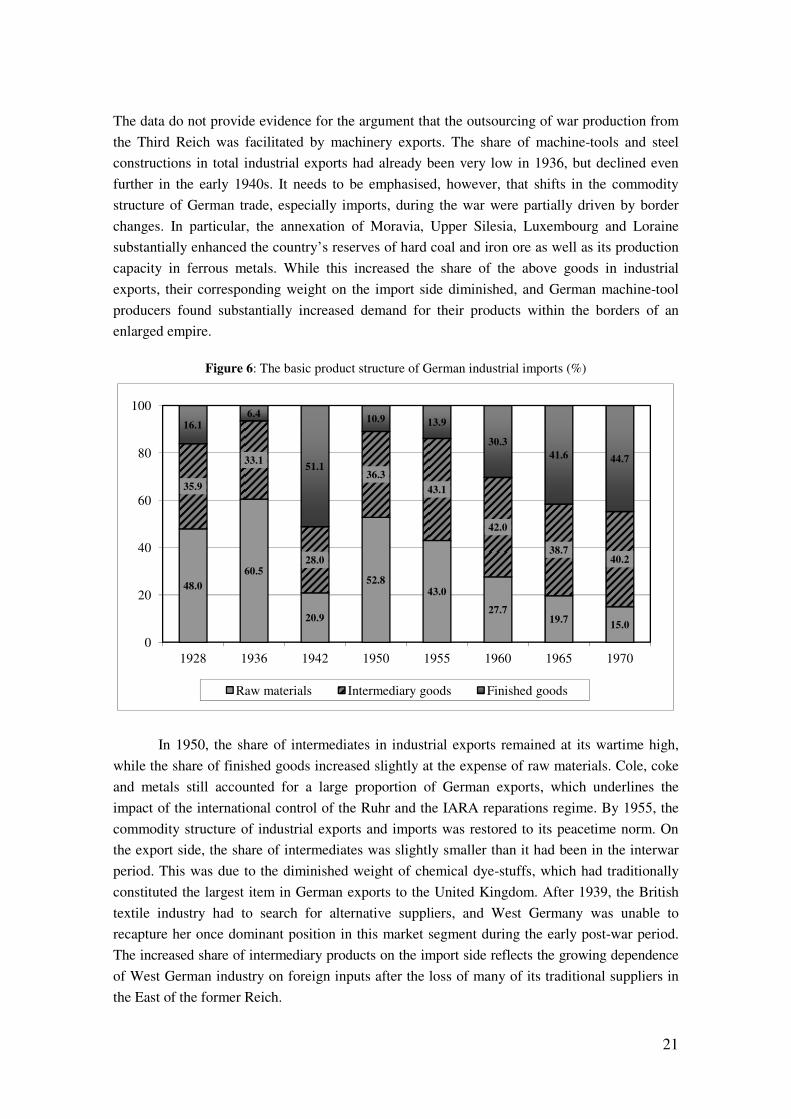
Figure 6: The basic product structure of German industrial imports (%)
In 1950, the share of intermediates in industrial exports remained at its wartime high,
while the share of finished goods increased slightly at the expense of raw materials. Cole, coke
and metals still accounted for a large proportion of German exports, which underlines the
impact of the international control of the Ruhr and the IARA reparations regime. By 1955, the
commodity structure of industrial exports and imports was restored to its peacetime norm. On
the export side, the share of intermediates was slightly smaller than it had been in the interwar
period. This was due to the diminished weight of chemical dye-stuffs, which had traditionally
constituted the largest item in German exports to the United Kingdom. After 1939, the British
textile industry had to search for alternative suppliers, and West Germany was unable to
recapture her once dominant position in this market segment during the early post-war period.
The increased share of intermediary products on the import side reflects the growing dependence
of West German industry on foreign inputs after the loss of many of its traditional suppliers in
the East of the former Reich.
48.0
60.5
20.9
52.843.0
27.719.7
15.0
35.9
33.1
28.0
36.3
43.1
42.0
38.740.2
16.16.4
51.1
10.9 13.9
30.3
41.6 44.7
0
20
40
60
80
100
1928 1936 1942 1950 1955 1960 1965 1970
Raw materials Intermediary goods Finished goods
22
With the technology-driven switch away from coal to hydrocarbons, the share of raw materials
in West German industrial exports continued to decline in the late 1950s. After 1960, however,
the share of finished goods also began to decline, despite the continued expansion in the volume
of exports, signalling a structural break in the trend which had manifested itself since the late
19th century. By contrast, the share of finished goods in industrial imports jumped markedly
between the 1950s and 1960s, mainly at the expense of raw materials but, to a lesser extent, also
of intermediates. The increasing weight of intermediate inputs in West German exports and that
of finished products in imports demonstrate the intensification of intra-industry trade within the
EEC, as input-output networks transcended national borders more than ever before.
Furthermore, they also mark a clear shift in regional specialisation patterns.
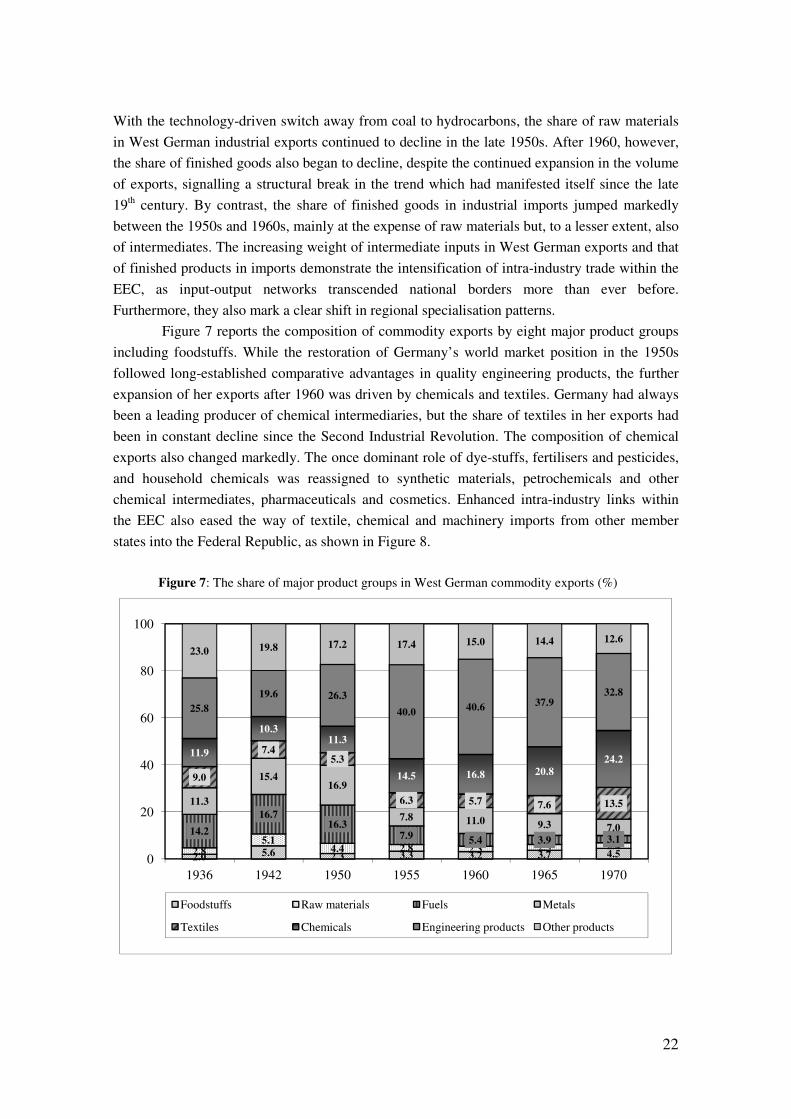
Figure 7 reports the composition of commodity exports by eight major product groups
including foodstuffs. While the restoration of Germany’s world market position in the 1950s
followed long-established comparative advantages in quality engineering products, the further
expansion of her exports after 1960 was driven by chemicals and textiles. Germany had always
been a leading producer of chemical intermediaries, but the share of textiles in her exports had
been in constant decline since the Second Industrial Revolution. The composition of chemical
exports also changed markedly. The once dominant role of dye-stuffs, fertilisers and pesticides,
and household chemicals was reassigned to synthetic materials, petrochemicals and other
chemical intermediates, pharmaceuticals and cosmetics. Enhanced intra-industry links within
the EEC also eased the way of textile, chemical and machinery imports from other member
states into the Federal Republic, as shown in Figure 8.
Figure 7: The share of major product groups in West German commodity exports (%)
2.0 5.6 2.3 3.3 3.2 3.7 4.52.85.1
4.4 2.8 2.3 2.5 2.4
14.2
16.716.3
7.9 5.4 3.9 3.1
11.3
15.416.9
7.8 11.0 9.3 7.0
9.0
7.45.3
6.3 5.7 7.6 13.5
11.9
10.311.3
14.5 16.8 20.8
24.2
25.8
19.6 26.3
40.040.6 37.9
32.8
23.0 19.8 17.2 17.4 15.0 14.4 12.6
0
20
40
60
80
100
1936 1942 1950 1955 1960 1965 1970
Foodstuffs Raw materials Fuels Metals
Textiles Chemicals Engineering products Other products
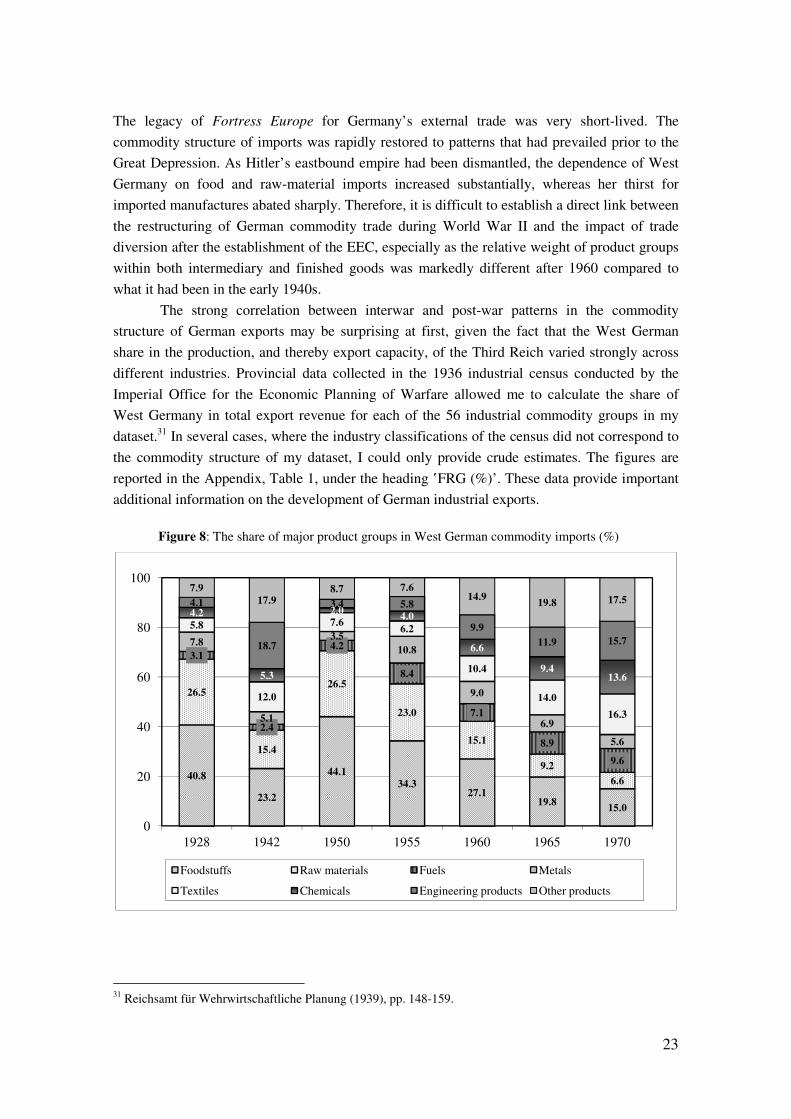
23
The legacy of Fortress Europe for Germany’s external trade was very short-lived. The
commodity structure of imports was rapidly restored to patterns that had prevailed prior to the
Great Depression. As Hitler’s eastbound empire had been dismantled, the dependence of West
Germany on food and raw-material imports increased substantially, whereas her thirst for
imported manufactures abated sharply. Therefore, it is difficult to establish a direct link between
the restructuring of German commodity trade during World War II and the impact of trade
diversion after the establishment of the EEC, especially as the relative weight of product groups
within both intermediary and finished goods was markedly different after 1960 compared to
what it had been in the early 1940s.
The strong correlation between interwar and post-war patterns in the commodity
structure of German exports may be surprising at first, given the fact that the West German
share in the production, and thereby export capacity, of the Third Reich varied strongly across
different industries. Provincial data collected in the 1936 industrial census conducted by the
Imperial Office for the Economic Planning of Warfare allowed me to calculate the share of
West Germany in total export revenue for each of the 56 industrial commodity groups in my
dataset.31 In several cases, where the industry classifications of the census did not correspond to
the commodity structure of my dataset, I could only provide crude estimates. The figures are
reported in the Appendix, Table 1, under the heading ‛FRG (%)’. These data provide important
additional information on the development of German industrial exports.
Figure 8: The share of major product groups in West German commodity imports (%)
31 Reichsamt für Wehrwirtschaftliche Planung (1939), pp. 148-159.
40.8
23.2
44.134.3
27.119.8
15.0
26.5
15.4
26.5
23.0
15.1
9.2
6.6
3.1
2.4
4.2
8.4
7.1
8.9
9.6
7.8
5.1
3.5
10.8
9.0
6.9
5.6
5.8
12.0
7.66.2
10.4
14.0
16.3
4.2
5.3
2.04.0
6.6
9.413.6
4.1
18.7
3.4 5.8
9.9
11.9 15.7
7.9
17.98.7 7.6
14.919.8 17.5
0
20
40
60
80
100
1928 1942 1950 1955 1960 1965 1970
Foodstuffs Raw materials Fuels Metals
Textiles Chemicals Engineering products Other products
24
West Germany had a relatively small share in total German exports of finished goods. Thus, raw
materials and intermediates carved out a larger slice from West German exports in 1950 than
from German exports during the interwar period. The restoration of traditional patterns during
the early 1950s was only possible after West German firms had recovered the former export
markets of their counterparts in East Germany, which had practically withdrawn from
international trade outside the CMEA. This phenomenon was particularly important in electrical
and precision engineering, the glass and the pottery industries, paper processing and the printing
industry, textiles and the clothing industry, which all concentrated strongly in Berlin and/or in
Saxony until 1945.
Table 8: Correlations explaining the commodity structure of West German industrial exports
1950 1955 1960 1965 1970
Germany 1936 0.881 0.901 0.885 0.831 0.720
West Germany 1936 0.914 0.809 0.796 0.742 0.612
Note: All coefficients are significant at the 1 percent level. Hard-coal and motor vehicles are excluded from the dataset, as they would otherwise drive the results. The number of observations (N) is 54.
Table 8 reports correlations between the commodity structure of West German industrial
exports during the post-war period and that of German or West German industrial exports in
1936. The share of commodity groups in total West German industrial exports in 1936 are
computed as the product of their share in total German industrial exports and the share of West
Germany in the exports of the particular groups. The comparison of the two sets of coefficients
shows that restoring the regional composition of German exports after 1950 required the
reconstruction of the commodity structure that had prevailed in Germany as a whole, not in her
western half in particular. This finding is a novel addition to the historiography of the West
German export miracle in the early post-war era.
6. Conclusions
During World War II, Nazi Germany reorganised intra-European trade in order to maximise her
war production and to maintain her war effort. The confidential foreign trade statistics of the
Third Reich demonstrate that the German economy became more eastward oriented with the
eastward expansion of the Third Reich and the eastbound drive of the Nazi war effort. Germany
had to increase her exports to her allies constantly to keep them in the war and to secure the
necessary raw-material supplies they were able to provide. Hitler’s Drang nach Osten proved to
be the major force of trade diversion during the early 1940s. This finding confirms traditional
accounts and is in contrast with the revisionist view advocated by Ritschl among others.
The legacy of Fortress Europe, however, was rather short lived. The expansion of West
German trade in the early phase of post-war reconstruction also demonstrated a reconstruction
dynamic which, by and large, restored the trade patterns of the interwar period. The post-war
settlement and the new institutions of a new international order didn’t play a major role in
shaping Germany’s external trade during the 1950s, except for the sharp contraction in trade
25
with Eastern Europe. The regional distribution and the commodity structure of German exports
and imports only began to deviate from long-established trends after the EEC treaty had come
into effect. Trade expansion in West Germany during the 1950s and 1960s requires different
explanations at different stages. The largely mono-causal interpretations introduced in the first
section of the paper are complementary rather than exclusive to one another, once we realise
that the dynamics of trade expansion also changed over time.
Footnote references
ABELSHAUSER, W. (2001). Umbruch und Persistenz: Das deutsche Produktionsregime in historischer Perspektive. Geschichte und Gesellschaft, 27 (4): 503-23.
BArch R 3/1626a. K. Hunscha, Eidesstaatliches Gutachten: Die wirtschaftlichen und finanziellen Beziehungen Deutschlands zu den von ihm besetzten Ländern Kontinentaleuropas 1940-1944, unpublished documents.
BERGER, H. and RITSCHL, A. O. (1992). Germany and the Political Economy of the Marshall Plan,
1947-1952: A Re-Revisionist View. Discussion Paper 1992-97. Department of Economics, Ludwig-Maximillians University Munich.
BOLDORF, M. and SCHERNER, J. (2011). France’s occupation cost and the war in the East: The contribution to the German war economy, 1940-1944. Journal of Contemporary History, forthcoming.
BOLTHO, A. (1982). The European Economy: Growth and Crisis. Oxford: OUP.
BUCHHEIM, C. (1990). Die Wiedereingliederung Westdeutschlands in die Weltwirtschaft 1945-1958. Munich: Oldenburg Verlag.
—— (1986). Die besetzten Länder im Dienste der deutschen Kriegswirtschaft während des Zweiten Weltkriegs: Ein Bericht der Forschungsstelle für Wehrwirtschaft. Vierteljahrshefte für Zeitgeschichte, 34(1): 117-145.
BÜHRER, W. (1986). Ruhrstahl und Europa: Die Wirtschaftsvereinigung Eisen- und Stahlindustrie und
die Anfänge der europäischen Integration 1945-1952. Munich: Oldenburg Verlag.
CARLIN, W. (1989). Economic reconstruction in Western Germany, 1945-55: The displacement of a ‘vegetative control’. In I. D. Turner (ed.), Reconstruction in Post-War Germany: British Occupation
Policy and the Western Zones, 1945-55. Oxford/NY/Munich: Berg.
DELHAES-GUENTHER, L. von (2003). Erfolgsfaktoren des westdeutschen Exports in den 1950er und
1960er Jahren. Dortmund: Gesellschaft für westfälische Wirtschaftsgeschichte.
EICHENGREEN, B. (1995). The European Payments Union: An efficient mechanism for rebuilding Europe’s Trade. In Idem (ed.), Europe’s Post-War Recovery. Cambridge: Cambridge University Press.
——and IRWIN, D. A. (1995). Trade blocs, currency blocs, and the reorientation of world trade in the 1930s. Journal of International Economics, 38(1): 1-24.
EICHHOLTZ, D. (1978). Kriegswirtschaftliche Resultate der Okkupationspolitik des faschistischen deutschen Imperialismus 1939-1944. Militärgeschichte, 17(2): 133-151.
ELLIS, H. S. (1941). Exchange Control in Central Europe. Cambridge, MA: Harvard University Press.
GIERSCH, H., PAQUÉ, K. and SCHMIEDING, H. (1992). The Fading Miracle: Four Decades of
Market Economy in Germany. Cambridge: CUP.
GLASTETTER, W., HÖGEMANN, G. and MARQUARDT, R. (1991). Die wirtschaftliche Entwicklung
in der BRD 1950-1989. New York/Frankfurt: Campus Verlag.
GRENZEBACH, W. S. (1988). Germany’s Informal Empire in East Central Europe: German Economic
Policy toward Yugoslavia and Rumania, 1933-1939. Stuttgart: Steiner.
26
HIRSCHMAN, A. O. (1945). National Power and the Structure of Foreign Trade. Berkeley: California University Press.
KITSON, M. and SOLOMOU, S. (1995). Bilateralism in the interwar world economy. Bulletin of
Economic Research, 47(3): 197-219.
Länderrat des Amerikanischen Besatzungsgebiets (1949). Statistisches Handbuch von Deutschland 1928-
1944. Münich: F. Ehrenwirth.
LINDLAR, L and HOLTFRERICH, C. (1997). Geography, exchange rates and trade structures: Germany’s export performance in the 1950s. European Review of Economic History, 1 (2): 217-246.
MADDISON, A. (2006). The World Economy. Vol. II.: Historical Statistics. Paris: OECD.
MICHALSKI, W. (1970). Export und Wirtschaftswachstum: Schlussfolgerungen aus der Nachkriegszeit
in der Bundesrepublik Deutschland. Hamburg: Verlag Weltarchiv.
MILWARD, A. S. (1987). Reconstruction in Western Europe 1945-1951. London: Metheun & Co.
—— (1981). The Reichsmark Bloc and the international economy. In G. Hirschfeld and L. Kettenacker (eds.), The ‘Führer State’: Myth and Reality: Studies on the Structure and Politics of the Third
Reich. Stuttgart: Klett-Cotta.
—— (1965). The German Economy at War. London: University of London, Athlone Press.
NEAL, L. (1979). The economics and finance of bilateral clearing agreements: Germany, 1934-1938. Economic History Review, 2nd Series, 23(2): 391-404.
NEEBE, R. (1989). Technologietransfer und Außenhandel in den Anfangsjahren der Bundesrepublik Deutschland. Vierteljahrsschrift für Sozial- und Wirtschaftsgeschichte, 76(1): 49-75.
RÁNKI, G. (1983). Economy and Foreign Policy: The Struggle of the Great Powers for Hegemony in the
Danube Valley, 1919-1939. New York: Columbia University Press.
Reichsamt für Wehrwirtschaftliche Planung (1939). Die deutsche Industrie: Gesamtergebnisse der
amtlichen Produktionsstatistik. Berlin: Verlag für Sozialpolitik, Wirtschaft und Statistik.
RITSCHL, A. O. (2001). Nazi economic imperialism and the exploitation of the small: evidence from Germany’s secret foreign balances, 1938-1940. The Economic History Review, 54(2): 324-345.
—— and WOLF, N. (2011). Endogeneity of Currency Areas and Trade Blocs: Evidence from the Interwar-Period. Kyklos, 64(2): 291-312.
SCHERNER, J. (2011). Der deutsche Importboom während des Zweiten Weltkriegs: Neue Ergebnisse zur Struktur der Ausbeutung des besetzten Europas auf der Grundlage einer Neuschätzung der deutschen Handelsbilanz. Historische Zeitschrift, 294(1): forthcoming.
Statistisches Bundesamt, Der Außenhandel der Bundesrepublik Deutschland, Teil 1: Zusammenfassende Übersichten. Jahrgang 1950, Jahresheft (1951).
—— Der Außenhandel der Bundesrepublik Deutschland, Teil 1: Zusammenfassende Übersichten. Jahrgang 1955, Jahresheft (1956).
—— Der Außenhandel der Bundesrepublik Deutschland, Teil 1: Zusammenfassende Übersichten. Jahrgang 1960, Jahresheft (1961).
—— Fachserie G: Außenhandel, Reihe 1. Zusammenfassende Übersichten: Jahrgang 1965, Jahresheft (1966).
—— Fachserie G: Außenhandel, Reihe 1. Zusammenfassende Übersichten: Jahrgang 1970, Jahresheft (1971).
Statistisches Reichsamt, Der Außenhandel Deutschlands. Sondernachweis. Ergänzungsheft 1941: Der deutsche Außenhandel nach Ländern. Classified document No. 13.
—— Der Außenhandel Deutschlands. Sondernachweis. Ergänzungsheft 1942: Der deutsche Außenhandel nach Ländern. Classified document No. 70.
—— Der Außenhandel Deutschlands. Sondernachweis. Ergänzungsheft 1943: Der deutsche Außenhandel nach Ländern. Classified document No. 20.
27
—— Statistik des Deutschen Reichs, vol. 366.2. Der Auswärtige Handel Deutschlands im Jahre 1928 verglichen mit den Jahren 1926 und 1927: Spezialhandel nach Erdteilen und Ländern und Anteil der einzelnen Länder (1929).
—— Statistik des Deutschen Reichs, vol. 383.1. Der Auswärtige Handel Deutschlands im Jahre 1929: Spezialhandel einschließlich der Reparations-Sachlieferungen (1930).
—— Statistisches Jahrbuch für das Deutsche Reich, 1941-42.
TOOZE, A. (2006). The Wages of Destruction: The Making and Breaking of the Nazi Economy. London: Allen Lane.
VOLKMANN, H. E., Ed. (1984). Wirtschaft im Dritten Reich: Eine Bibliographie. Vol. 2: 1939-1945. München: Bernard & Grafe.
—— (1975). Außenhandel und Aufrüstung in Deutschland 1933 bis 1939. In F. Forstmeier and H. E. Volkmann (eds.), Wirtschaft und Rüstung am Vorabend des Zweiten Weltkriegs. Düsseldorf: Droste.
WALLICH, H. C. (1955). Mainsprings of the German Revival. New Haven: Yale University Press.
ZILBERT, E. R. (1981). Albert Speer and the Nazi Ministry of Arms: Economic Institutions and
Industrial Production in the German War Economy. London: Associated University Presses.
28
Appendix: The commodity structure of German exports and imports, 1928-1970
This appendix reports a constant-price dataset on German/West German commodity exports and imports in Table 1 and Table 2 respectively. The dataset has been constructed on the basis of the following sources.
• Figures for 1950 and 1955 are drawn directly from Außenhandel, Teil 1 (1951), pp. 6-11 and Ibid (1956), pp. 19-21.
• The values for 1960, 1965 and 1970 were computed by linking different constant price datasets reported in Außenhandel, Teil 1 (1961), pp. 19-21; Fachserie G, Teil 1 (1966), pp. 19-21 and Ibid (1970), pp. 21-23.
• Figures for 1928, 1936, 1941 and 1942 were converted into 1950 DM prices based on the ratio of export/import weights reported in StDR, vol. 383.1 (1930), pp. 10-13; Der
Außenhandel Deutschlands, Ergänzungsheft 1941, pp. 10-14; Ibid 1942, pp. 8-12; and Außenhandel, Teil 1 (1951), pp. 7-11. For water vessels, the sources report numbers instead of weights.
• From 1936 onward, the original sources report at least 148 commodity groups. I summarised the data into 56 commodity groups to make the 1928 figures compatible with the later benchmarks and to aggregate closely related commodity groups, which alone accounted for very small fractions of German commodity trade. The conversion of figures into 1950 DM prices was made for all 148 commodity groups, in order to account for differences in unit values between the aggregated groups.
• The share of the later Federal Republic in German industrial exports in 1936 was computed on the basis of provincial data reported in Reichsamt für Wehrwirtschaftliche Planung (1939), pp. 148-159. The census only reports data on industrial production. Therefore, I had to assume that West Germany had exactly the same share in the export of non-food agricultural raw materials, such as wool and furs, cocoon and textile plant, as well as animal and vegetable fats, as in the exports of the sub-branches which processed them. This approach can be justified on the ground that material-intensive industries tend to locate to their domestic raw-material reserves, if the latter exist.
I also had to assume equal shares for all types of chemicals, which is realistic because the German chemical industry had long been dominated by giant firms operating in concentrated locations, such as Bayer in Leverkusen or BASF in Ludwigshafen. Finally, I estimated the West German share in the miscellaneous commodity groups of raw materials, intermediaries and finished goods based on census data reported for the sub-branches that did not correspond to any of the commodity groups in my dataset.
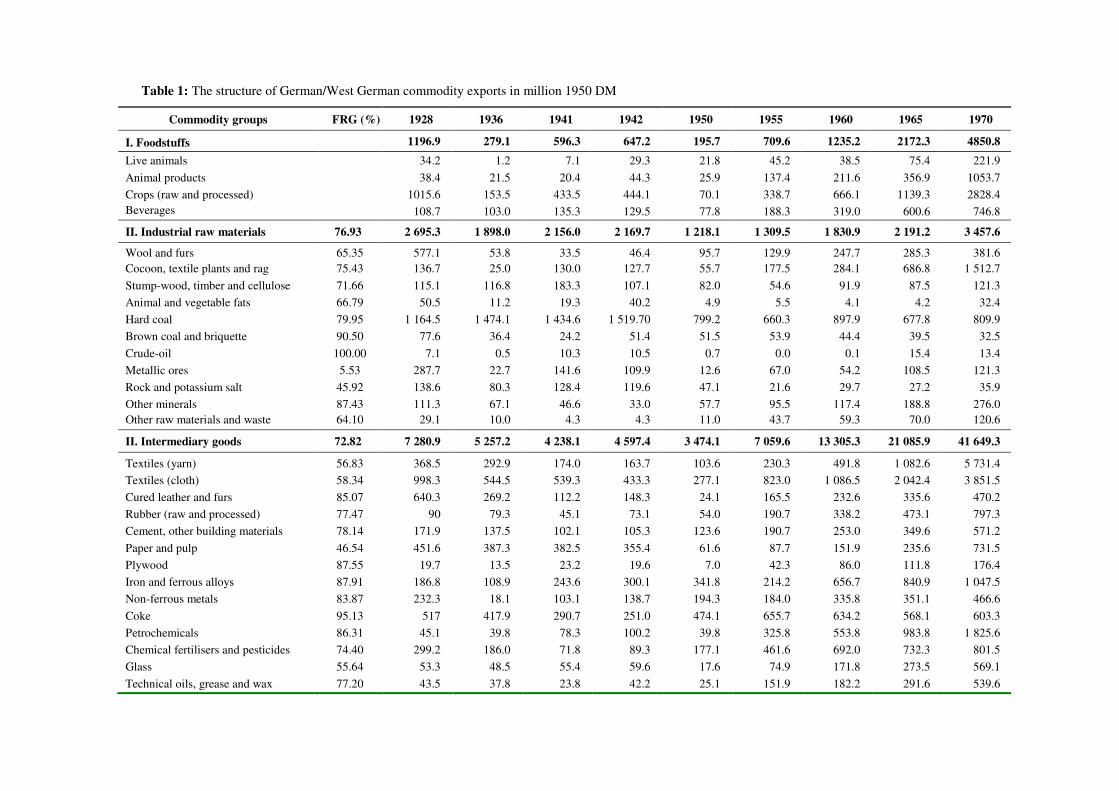
282
Table 1: The structure of German/West German commodity exports in million 1950 DM
Commodity groups FRG (%) 1928 1936 1941 1942 1950 1955 1960 1965 1970
I. Foodstuffs 1196.9 279.1 596.3 647.2 195.7 709.6 1235.2 2172.3 4850.8
Live animals 34.2 1.2 7.1 29.3 21.8 45.2 38.5 75.4 221.9
Animal products 38.4 21.5 20.4 44.3 25.9 137.4 211.6 356.9 1053.7
Crops (raw and processed) 1015.6 153.5 433.5 444.1 70.1 338.7 666.1 1139.3 2828.4 Beverages 108.7 103.0 135.3 129.5 77.8 188.3 319.0 600.6 746.8
II. Industrial raw materials 76.93 2 695.3 1 898.0 2 156.0 2 169.7 1 218.1 1 309.5 1 830.9 2 191.2 3 457.6
Wool and furs 65.35 577.1 53.8 33.5 46.4 95.7 129.9 247.7 285.3 381.6 Cocoon, textile plants and rag 75.43 136.7 25.0 130.0 127.7 55.7 177.5 284.1 686.8 1 512.7
Stump-wood, timber and cellulose 71.66 115.1 116.8 183.3 107.1 82.0 54.6 91.9 87.5 121.3
Animal and vegetable fats 66.79 50.5 11.2 19.3 40.2 4.9 5.5 4.1 4.2 32.4
Hard coal 79.95 1 164.5 1 474.1 1 434.6 1 519.70 799.2 660.3 897.9 677.8 809.9
Brown coal and briquette 90.50 77.6 36.4 24.2 51.4 51.5 53.9 44.4 39.5 32.5
Crude-oil 100.00 7.1 0.5 10.3 10.5 0.7 0.0 0.1 15.4 13.4
Metallic ores 5.53 287.7 22.7 141.6 109.9 12.6 67.0 54.2 108.5 121.3
Rock and potassium salt 45.92 138.6 80.3 128.4 119.6 47.1 21.6 29.7 27.2 35.9
Other minerals 87.43 111.3 67.1 46.6 33.0 57.7 95.5 117.4 188.8 276.0 Other raw materials and waste 64.10 29.1 10.0 4.3 4.3 11.0 43.7 59.3 70.0 120.6
II. Intermediary goods 72.82 7 280.9 5 257.2 4 238.1 4 597.4 3 474.1 7 059.6 13 305.3 21 085.9 41 649.3
Textiles (yarn) 56.83 368.5 292.9 174.0 163.7 103.6 230.3 491.8 1 082.6 5 731.4
Textiles (cloth) 58.34 998.3 544.5 539.3 433.3 277.1 823.0 1 086.5 2 042.4 3 851.5
Cured leather and furs 85.07 640.3 269.2 112.2 148.3 24.1 165.5 232.6 335.6 470.2
Rubber (raw and processed) 77.47 90 79.3 45.1 73.1 54.0 190.7 338.2 473.1 797.3
Cement, other building materials 78.14 171.9 137.5 102.1 105.3 123.6 190.7 253.0 349.6 571.2
Paper and pulp 46.54 451.6 387.3 382.5 355.4 61.6 87.7 151.9 235.6 731.5
Plywood 87.55 19.7 13.5 23.2 19.6 7.0 42.3 86.0 111.8 176.4
Iron and ferrous alloys 87.91 186.8 108.9 243.6 300.1 341.8 214.2 656.7 840.9 1 047.5
Non-ferrous metals 83.87 232.3 18.1 103.1 138.7 194.3 184.0 335.8 351.1 466.6
Coke 95.13 517 417.9 290.7 251.0 474.1 655.7 634.2 568.1 603.3
Petrochemicals 86.31 45.1 39.8 78.3 100.2 39.8 325.8 553.8 983.8 1 825.6
Chemical fertilisers and pesticides 74.40 299.2 186.0 71.8 89.3 177.1 461.6 692.0 732.3 801.5
Glass 55.64 53.3 48.5 55.4 59.6 17.6 74.9 171.8 273.5 569.1
Technical oils, grease and wax 77.20 43.5 37.8 23.8 42.2 25.1 151.9 182.2 291.6 539.6
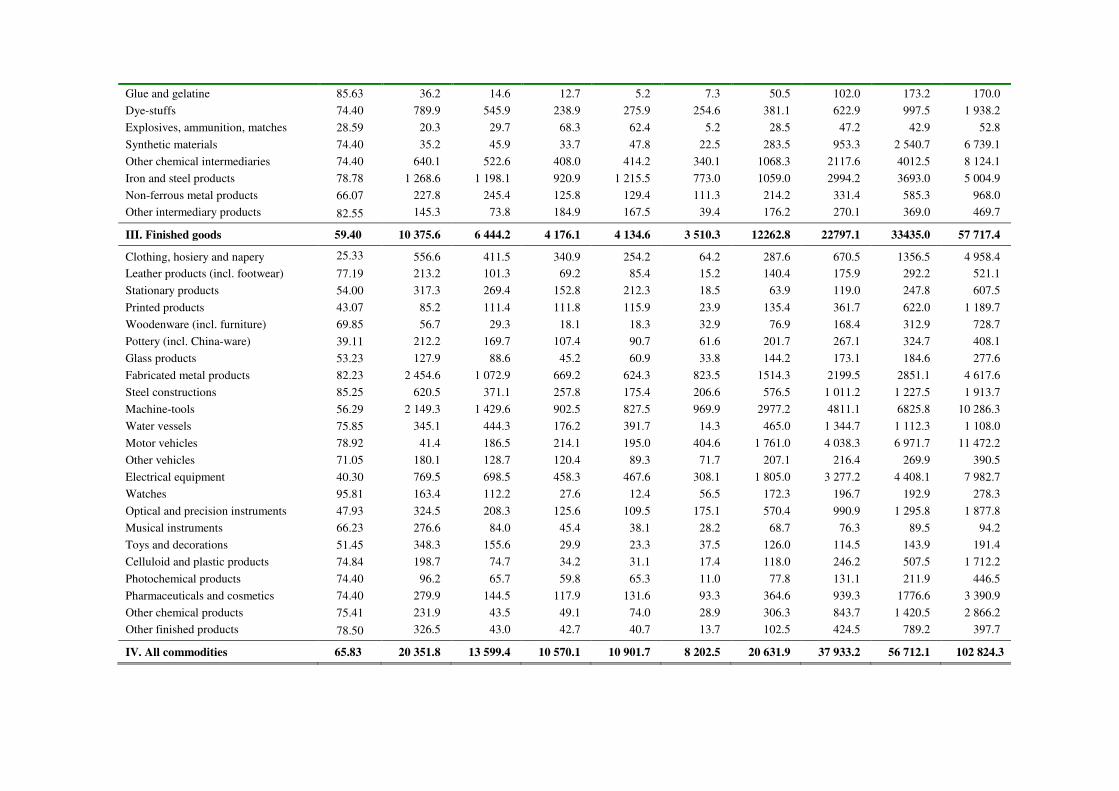
283
Glue and gelatine 85.63 36.2 14.6 12.7 5.2 7.3 50.5 102.0 173.2 170.0
Dye-stuffs 74.40 789.9 545.9 238.9 275.9 254.6 381.1 622.9 997.5 1 938.2
Explosives, ammunition, matches 28.59 20.3 29.7 68.3 62.4 5.2 28.5 47.2 42.9 52.8
Synthetic materials 74.40 35.2 45.9 33.7 47.8 22.5 283.5 953.3 2 540.7 6 739.1
Other chemical intermediaries 74.40 640.1 522.6 408.0 414.2 340.1 1068.3 2117.6 4012.5 8 124.1
Iron and steel products 78.78 1 268.6 1 198.1 920.9 1 215.5 773.0 1059.0 2994.2 3693.0 5 004.9
Non-ferrous metal products 66.07 227.8 245.4 125.8 129.4 111.3 214.2 331.4 585.3 968.0
Other intermediary products 82.55 145.3 73.8 184.9 167.5 39.4 176.2 270.1 369.0 469.7
III. Finished goods 59.40 10 375.6 6 444.2 4 176.1 4 134.6 3 510.3 12262.8 22797.1 33435.0 57 717.4
Clothing, hosiery and napery 25.33 556.6 411.5 340.9 254.2 64.2 287.6 670.5 1356.5 4 958.4
Leather products (incl. footwear) 77.19 213.2 101.3 69.2 85.4 15.2 140.4 175.9 292.2 521.1
Stationary products 54.00 317.3 269.4 152.8 212.3 18.5 63.9 119.0 247.8 607.5
Printed products 43.07 85.2 111.4 111.8 115.9 23.9 135.4 361.7 622.0 1 189.7
Woodenware (incl. furniture) 69.85 56.7 29.3 18.1 18.3 32.9 76.9 168.4 312.9 728.7
Pottery (incl. China-ware) 39.11 212.2 169.7 107.4 90.7 61.6 201.7 267.1 324.7 408.1
Glass products 53.23 127.9 88.6 45.2 60.9 33.8 144.2 173.1 184.6 277.6
Fabricated metal products 82.23 2 454.6 1 072.9 669.2 624.3 823.5 1514.3 2199.5 2851.1 4 617.6
Steel constructions 85.25 620.5 371.1 257.8 175.4 206.6 576.5 1 011.2 1 227.5 1 913.7
Machine-tools 56.29 2 149.3 1 429.6 902.5 827.5 969.9 2977.2 4811.1 6825.8 10 286.3
Water vessels 75.85 345.1 444.3 176.2 391.7 14.3 465.0 1 344.7 1 112.3 1 108.0
Motor vehicles 78.92 41.4 186.5 214.1 195.0 404.6 1 761.0 4 038.3 6 971.7 11 472.2
Other vehicles 71.05 180.1 128.7 120.4 89.3 71.7 207.1 216.4 269.9 390.5
Electrical equipment 40.30 769.5 698.5 458.3 467.6 308.1 1 805.0 3 277.2 4 408.1 7 982.7
Watches 95.81 163.4 112.2 27.6 12.4 56.5 172.3 196.7 192.9 278.3
Optical and precision instruments 47.93 324.5 208.3 125.6 109.5 175.1 570.4 990.9 1 295.8 1 877.8
Musical instruments 66.23 276.6 84.0 45.4 38.1 28.2 68.7 76.3 89.5 94.2
Toys and decorations 51.45 348.3 155.6 29.9 23.3 37.5 126.0 114.5 143.9 191.4
Celluloid and plastic products 74.84 198.7 74.7 34.2 31.1 17.4 118.0 246.2 507.5 1 712.2
Photochemical products 74.40 96.2 65.7 59.8 65.3 11.0 77.8 131.1 211.9 446.5
Pharmaceuticals and cosmetics 74.40 279.9 144.5 117.9 131.6 93.3 364.6 939.3 1776.6 3 390.9
Other chemical products 75.41 231.9 43.5 49.1 74.0 28.9 306.3 843.7 1 420.5 2 866.2
Other finished products 78.50 326.5 43.0 42.7 40.7 13.7 102.5 424.5 789.2 397.7
IV. All commodities 65.83 20 351.8 13 599.4 10 570.1 10 901.7 8 202.5 20 631.9 37 933.2 56 712.1 102 824.3
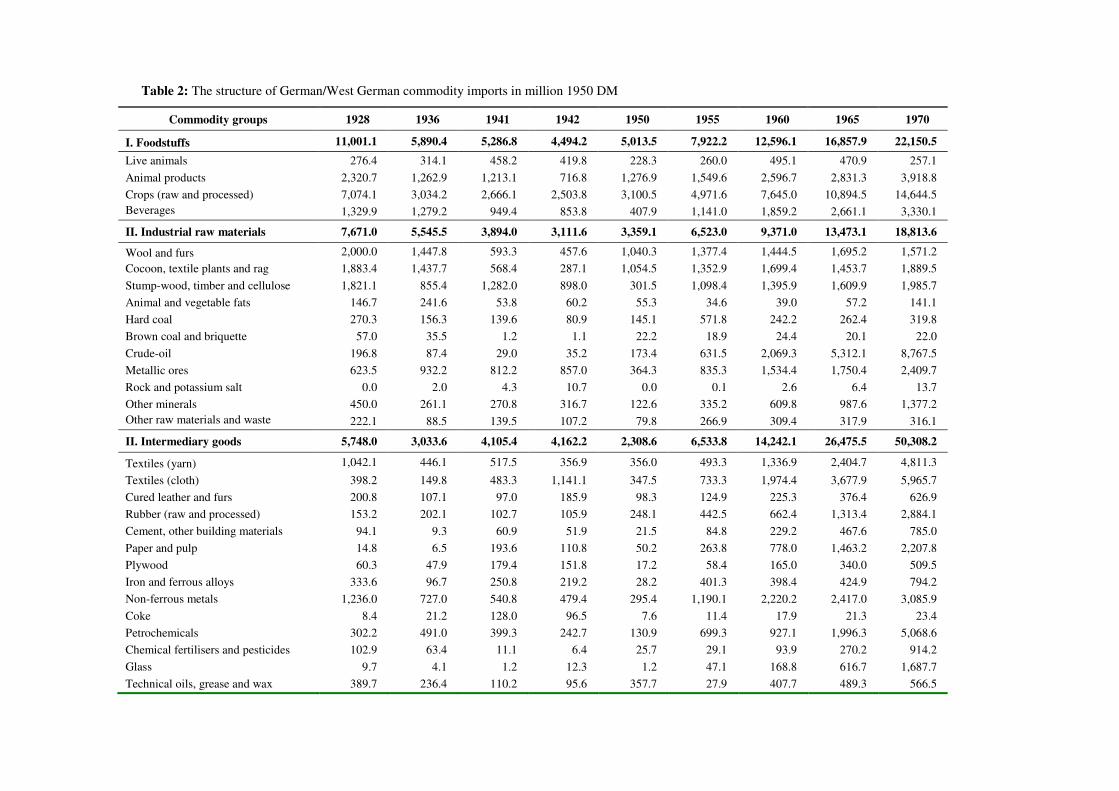
284
Table 2: The structure of German/West German commodity imports in million 1950 DM
Commodity groups 1928 1936 1941 1942 1950 1955 1960 1965 1970
I. Foodstuffs 11,001.1 5,890.4 5,286.8 4,494.2 5,013.5 7,922.2 12,596.1 16,857.9 22,150.5
Live animals 276.4 314.1 458.2 419.8 228.3 260.0 495.1 470.9 257.1
Animal products 2,320.7 1,262.9 1,213.1 716.8 1,276.9 1,549.6 2,596.7 2,831.3 3,918.8
Crops (raw and processed) 7,074.1 3,034.2 2,666.1 2,503.8 3,100.5 4,971.6 7,645.0 10,894.5 14,644.5 Beverages 1,329.9 1,279.2 949.4 853.8 407.9 1,141.0 1,859.2 2,661.1 3,330.1
II. Industrial raw materials 7,671.0 5,545.5 3,894.0 3,111.6 3,359.1 6,523.0 9,371.0 13,473.1 18,813.6
Wool and furs 2,000.0 1,447.8 593.3 457.6 1,040.3 1,377.4 1,444.5 1,695.2 1,571.2
Cocoon, textile plants and rag 1,883.4 1,437.7 568.4 287.1 1,054.5 1,352.9 1,699.4 1,453.7 1,889.5
Stump-wood, timber and cellulose 1,821.1 855.4 1,282.0 898.0 301.5 1,098.4 1,395.9 1,609.9 1,985.7
Animal and vegetable fats 146.7 241.6 53.8 60.2 55.3 34.6 39.0 57.2 141.1
Hard coal 270.3 156.3 139.6 80.9 145.1 571.8 242.2 262.4 319.8
Brown coal and briquette 57.0 35.5 1.2 1.1 22.2 18.9 24.4 20.1 22.0
Crude-oil 196.8 87.4 29.0 35.2 173.4 631.5 2,069.3 5,312.1 8,767.5
Metallic ores 623.5 932.2 812.2 857.0 364.3 835.3 1,534.4 1,750.4 2,409.7
Rock and potassium salt 0.0 2.0 4.3 10.7 0.0 0.1 2.6 6.4 13.7
Other minerals 450.0 261.1 270.8 316.7 122.6 335.2 609.8 987.6 1,377.2 Other raw materials and waste 222.1 88.5 139.5 107.2 79.8 266.9 309.4 317.9 316.1
II. Intermediary goods 5,748.0 3,033.6 4,105.4 4,162.2 2,308.6 6,533.8 14,242.1 26,475.5 50,308.2
Textiles (yarn) 1,042.1 446.1 517.5 356.9 356.0 493.3 1,336.9 2,404.7 4,811.3
Textiles (cloth) 398.2 149.8 483.3 1,141.1 347.5 733.3 1,974.4 3,677.9 5,965.7
Cured leather and furs 200.8 107.1 97.0 185.9 98.3 124.9 225.3 376.4 626.9
Rubber (raw and processed) 153.2 202.1 102.7 105.9 248.1 442.5 662.4 1,313.4 2,884.1
Cement, other building materials 94.1 9.3 60.9 51.9 21.5 84.8 229.2 467.6 785.0
Paper and pulp 14.8 6.5 193.6 110.8 50.2 263.8 778.0 1,463.2 2,207.8
Plywood 60.3 47.9 179.4 151.8 17.2 58.4 165.0 340.0 509.5
Iron and ferrous alloys 333.6 96.7 250.8 219.2 28.2 401.3 398.4 424.9 794.2
Non-ferrous metals 1,236.0 727.0 540.8 479.4 295.4 1,190.1 2,220.2 2,417.0 3,085.9
Coke 8.4 21.2 128.0 96.5 7.6 11.4 17.9 21.3 23.4
Petrochemicals 302.2 491.0 399.3 242.7 130.9 699.3 927.1 1,996.3 5,068.6
Chemical fertilisers and pesticides 102.9 63.4 11.1 6.4 25.7 29.1 93.9 270.2 914.2
Glass 9.7 4.1 1.2 12.3 1.2 47.1 168.8 616.7 1,687.7
Technical oils, grease and wax 389.7 236.4 110.2 95.6 357.7 27.9 407.7 489.3 566.5
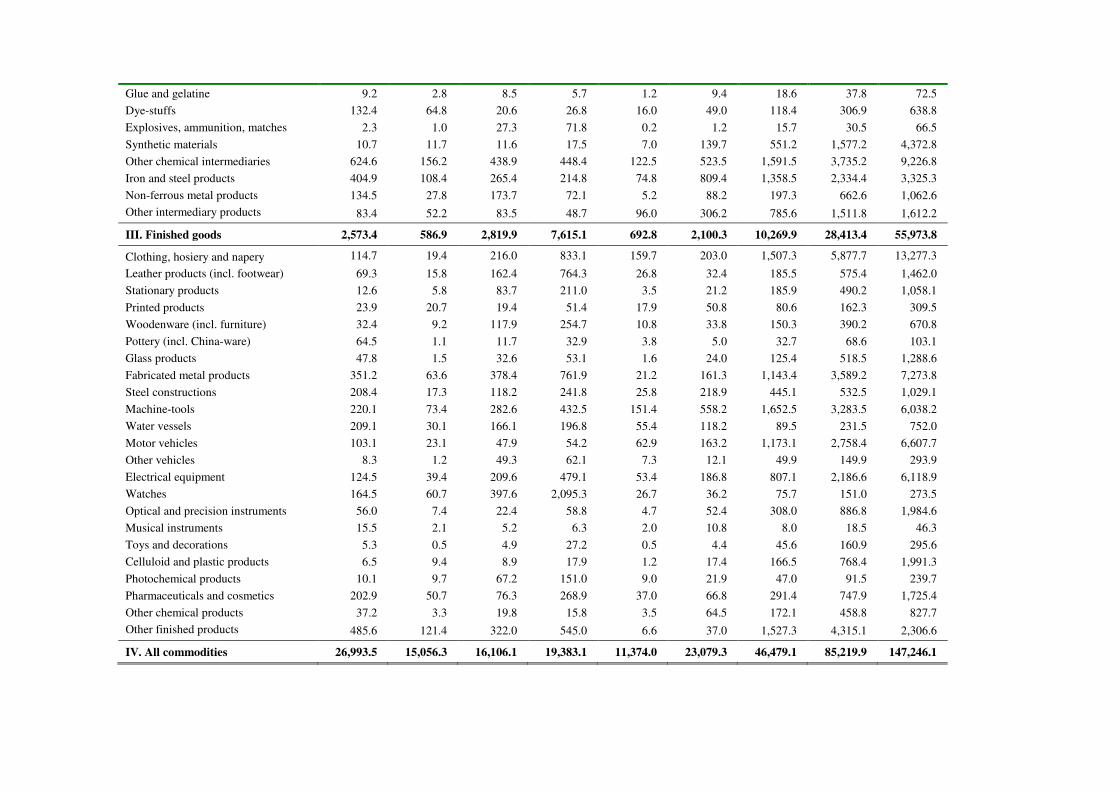
285
Glue and gelatine 9.2 2.8 8.5 5.7 1.2 9.4 18.6 37.8 72.5
Dye-stuffs 132.4 64.8 20.6 26.8 16.0 49.0 118.4 306.9 638.8
Explosives, ammunition, matches 2.3 1.0 27.3 71.8 0.2 1.2 15.7 30.5 66.5
Synthetic materials 10.7 11.7 11.6 17.5 7.0 139.7 551.2 1,577.2 4,372.8
Other chemical intermediaries 624.6 156.2 438.9 448.4 122.5 523.5 1,591.5 3,735.2 9,226.8
Iron and steel products 404.9 108.4 265.4 214.8 74.8 809.4 1,358.5 2,334.4 3,325.3
Non-ferrous metal products 134.5 27.8 173.7 72.1 5.2 88.2 197.3 662.6 1,062.6
Other intermediary products 83.4 52.2 83.5 48.7 96.0 306.2 785.6 1,511.8 1,612.2
III. Finished goods 2,573.4 586.9 2,819.9 7,615.1 692.8 2,100.3 10,269.9 28,413.4 55,973.8
Clothing, hosiery and napery 114.7 19.4 216.0 833.1 159.7 203.0 1,507.3 5,877.7 13,277.3
Leather products (incl. footwear) 69.3 15.8 162.4 764.3 26.8 32.4 185.5 575.4 1,462.0
Stationary products 12.6 5.8 83.7 211.0 3.5 21.2 185.9 490.2 1,058.1
Printed products 23.9 20.7 19.4 51.4 17.9 50.8 80.6 162.3 309.5
Woodenware (incl. furniture) 32.4 9.2 117.9 254.7 10.8 33.8 150.3 390.2 670.8
Pottery (incl. China-ware) 64.5 1.1 11.7 32.9 3.8 5.0 32.7 68.6 103.1
Glass products 47.8 1.5 32.6 53.1 1.6 24.0 125.4 518.5 1,288.6
Fabricated metal products 351.2 63.6 378.4 761.9 21.2 161.3 1,143.4 3,589.2 7,273.8
Steel constructions 208.4 17.3 118.2 241.8 25.8 218.9 445.1 532.5 1,029.1
Machine-tools 220.1 73.4 282.6 432.5 151.4 558.2 1,652.5 3,283.5 6,038.2
Water vessels 209.1 30.1 166.1 196.8 55.4 118.2 89.5 231.5 752.0
Motor vehicles 103.1 23.1 47.9 54.2 62.9 163.2 1,173.1 2,758.4 6,607.7
Other vehicles 8.3 1.2 49.3 62.1 7.3 12.1 49.9 149.9 293.9
Electrical equipment 124.5 39.4 209.6 479.1 53.4 186.8 807.1 2,186.6 6,118.9
Watches 164.5 60.7 397.6 2,095.3 26.7 36.2 75.7 151.0 273.5
Optical and precision instruments 56.0 7.4 22.4 58.8 4.7 52.4 308.0 886.8 1,984.6
Musical instruments 15.5 2.1 5.2 6.3 2.0 10.8 8.0 18.5 46.3
Toys and decorations 5.3 0.5 4.9 27.2 0.5 4.4 45.6 160.9 295.6
Celluloid and plastic products 6.5 9.4 8.9 17.9 1.2 17.4 166.5 768.4 1,991.3
Photochemical products 10.1 9.7 67.2 151.0 9.0 21.9 47.0 91.5 239.7
Pharmaceuticals and cosmetics 202.9 50.7 76.3 268.9 37.0 66.8 291.4 747.9 1,725.4
Other chemical products 37.2 3.3 19.8 15.8 3.5 64.5 172.1 458.8 827.7
Other finished products 485.6 121.4 322.0 545.0 6.6 37.0 1,527.3 4,315.1 2,306.6
IV. All commodities 26,993.5 15,056.3 16,106.1 19,383.1 11,374.0 23,079.3 46,479.1 85,219.9 147,246.1


![Introduction - Augsburg Fortress · Introduction - Augsburg Fortress ... ,d] ] ]](https://cdn.vdocuments.site/doc/165x107/5d6044f688c993a17a8bdfc8/introduction-augsburg-introduction-augsburg-fortress-d-.jpg)


