WITH SUPPORT FROM
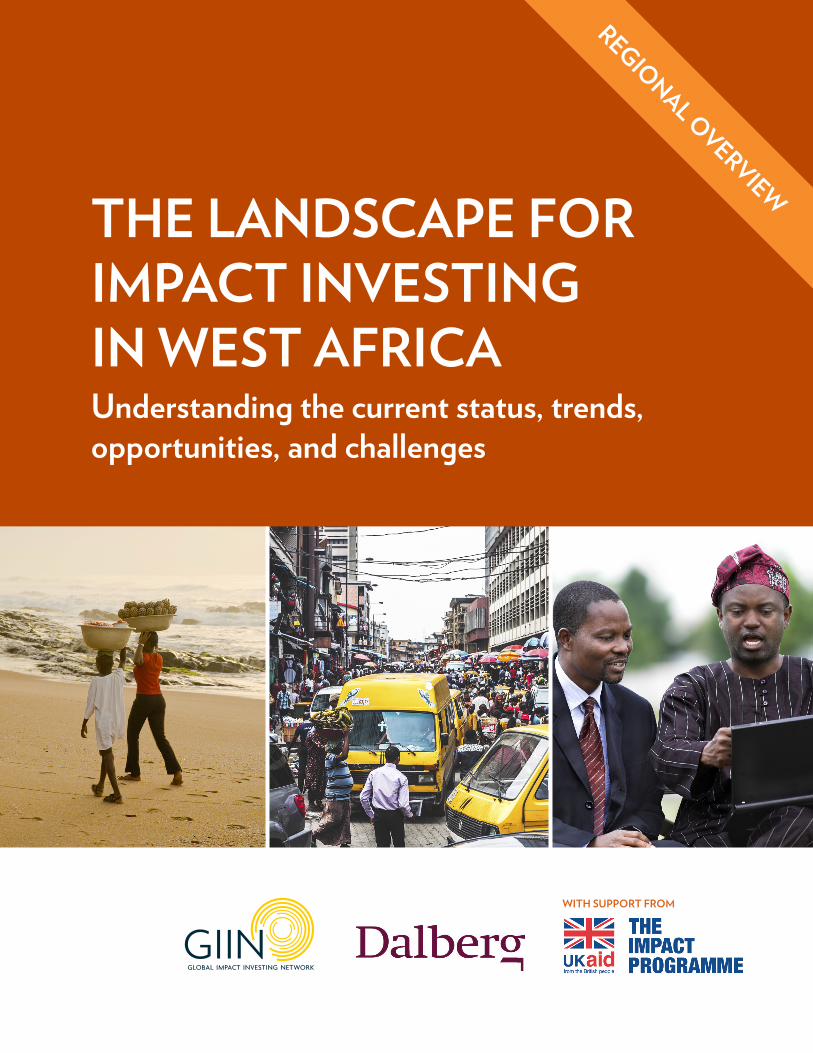
REGIONAL OVERVIEWTHE LANDSCAPE FOR IMPACT INVESTING IN WEST AFRICAUnderstanding the current status, trends, opportunities, and challenges
ACKNOWLEDGMENTSThis project was funded with UK aid from the UK Government though the Department for International Development’s Impact Programme. The Impact Programme aims to catalyze the market for impact investment in sub-Saharan Africa and South Asia.
www.theimpactprogramme.org.uk
This report was made possible through the generous contributions of many individuals, both within and outside West Africa. In particular, we would like to thank all the interviewees that gave generously of their time, expertise, company and data during the course of this study. Your insights were tremendously helpful in bringing a measure of clarity to an unwieldy topic. Further, we would like to thank the GIIN Advisory Team for invaluable input, debate, and guidance during the preparation of this report. Finally, we would like to thank Jessica Johnson and Aida Ndiaye for valuable assistance in research and data collection.
GIIN Advisory TeamAmit Bouri, [email protected] Balloch, [email protected] Mudaliar, [email protected] Schiff, [email protected] Gustafson, [email protected]
Dalberg Editorial TeamNaoko Koyama, [email protected] Nouwen, [email protected] Matthew MacDevette, [email protected] Shen, [email protected] Bazley, [email protected] Burke, [email protected]
DECEMBER 2015
LIST OF COMMON TERMS AND ACRONYMS
ADEPME Agence de Développement et d’Encadrement des Petites et Moyennes Enterprises
AfDB African Development Bank
AMSCO African Management Services Company
APC All Progressives Congress
APIX Agence de Promotion des Investissements et des Grands Travaux
AUM Assets Under Management
BCEAO Banque Centrale des Etats de l’Afrique de l’Ouest
BIO Belgian Investment Company for Developing Countries
BMN Bureau de Mise à Niveau
BOAD Banque Ouest Africaine de Développement
BoP Base of the Pyramid
CACS Commercial Agriculture Credit Scheme
CNCAS Caisse Nationale de Crédit Agricole du Sénégal
CTIC Conseil en Technologies de l’Information et de la Communication
DEG German Investment and Development Corporation
DFI Development Finance Institution
ECOWAS Economic Community of West African States
ESG Environment, Social, and Governance
FCFA Franc Communauté Financière Africaine
FDI Foreign Direct Investment
FinTech Financial Technology
FMO Netherlands Development Finance Company
FONGIP Fonds de Garantie des Investissements Prioritaires
FONSIS Fonds Souverain d’Investissement Stratégiques
GAIN Ghana Angel Investor Network
GDP Gross Domestic Product
GIIN Global Impact Investing Network
GIMPA Ghana Institute of Management and Public Administration
GIPC Ghana Investment Promotion Center
GVEP Global Village Energy Partnership
HDI Human Development Index
HNWI High-Net-Worth Individuals
HR Human Resources
I&P Investisseurs et Partenaires
ICT Information and Communications Technology
IEA International Energy Agency
IFC International Finance Corporation
IFU Danish Investment Fund for Developing Countries
IMF International Monetary Fund
IPO Initial Public Offering
IPRES Institution de Prévoyance Retraite du Sénégal
IRR Internal Rate of Return
LAN Lagos Angel Network
MENA Middle East and North Africa
MEST Meltwater Entrepreneurial School of Technology
MFI Microfinance Institution
MIS Management Information System
NFSP National Food Security Program
NGO Non-Governmental Organization
OHADA Organization for the Harmonization of Business Law in Africa
OIC Organization of the Islamic Conference
OPIC Overseas Private Investment Corporation
PE Private Equity
PSE Plan Sénégal Emergent
R&D Research and Development
SME Small and Medium-sized Enterprise
SMEDAN Small and Medium Enterprises Development Agency of Nigeria
SSA Sub-Saharan Africa
TA Technical Assistance
UNDP United Nations Development Program
VC Venture Capital
WAEMU West African Economic and Monetary Union

IV • THE LANDSCAPE FOR IMPACT INVESTING IN WEST AFRICA
FOREWORDDEAR READERS,
The Global Impact Investing Network (GIIN) is pleased to publish The Landscape for Impact Investing in West Africa, in partnership with Dalberg Global Development Advisors and with support from UK aid from the UK Government through the Department for International Development’s Impact Programme.
The third regional market landscape report developed by the GIIN, this report provides an analysis of the impact investing industry covering fifteen countries in the West Africa region, including dedicated chapters on Nigeria, Ghana, and Senegal. The GIIN previously published regional landscape reports on South Asia and East Africa, which can be found on thegiin.org. Through these landscaping studies, the GIIN aims to generate more data on impact investing in emerging economies.
Our partnership with Dalberg Global Development Advisors, a global advisory firm with a local presence in the region, enabled us to conduct a detailed analysis of the current state of impact investing in West Africa. The report examines the volume of capital deployed to date, the challenges facing investors as well as the opportunities, the needs of enterprises in the region and their barriers to accessing capital, and the regulatory ecosystem.
West Africa is the second fastest growing regional economy in Africa, fuelled by growth in Nigeria and Ghana. These two countries have received more than half of the impact investing capital deployed in the region. Additionally, Senegal and Cote d’Ivoire are likely to continue gaining investors’ attention due to high levels of political stability and strong growth, respectively. However, the region remains underdeveloped, offering impact investors an opportunity to have significant impact through capital deployment. Investors noted a number of sectors that are attractive for investment, particularly energy, financial technologies, and agriculture.
We hope this report will accelerate interest, innovation, and investment in the region. There is substantial opportunity to make investments in West Africa that can generate returns and improve lives, such as investments that expand power generation or develop the agricultural sector. Other market actors can address the clear need for a strengthened support ecosystem—such as incubators, technical assistance providers, local industry associations, and others—to help businesses become investment ready.
Ultimately, by providing the much-needed information on the impact investing market in West Africa, we hope to strengthen flows of capital that will benefit the environment and the communities of this region.
Sincerely,
Amit BouriCEO, The Global Impact Investing Network
REGIONAL OVERVIEW
REGIONAL OVERVIEW • 1
TABLE OF CONTENTSEXECUTIVE SUMMARY . . . . . . . . . . . . . . . . . . . . . . . . . . . . . . . . . . . . . . . . . . . . . . . . . . . . . . 2
1. INTRODUCTION, DEFINITIONS, AND METHODOLOGY . . . . . . . . 6Introduction . . . . . . . . . . . . . . . . . . . . . . . . . . . . . . . . . . . . . . . . . . . . . . . . . . . . . . . . . . . . . . . . . . . . . . . . 6Definitions . . . . . . . . . . . . . . . . . . . . . . . . . . . . . . . . . . . . . . . . . . . . . . . . . . . . . . . . . . . . . . . . . . . . . . . . . 7Methodology . . . . . . . . . . . . . . . . . . . . . . . . . . . . . . . . . . . . . . . . . . . . . . . . . . . . . . . . . . . . . . . . . . . . . . 9
2. REGIONAL OVERVIEW . . . . . . . . . . . . . . . . . . . . . . . . . . . . . . . . . . . . . . . . . . . . . . . . . . . 10Brief Historical and Political Context . . . . . . . . . . . . . . . . . . . . . . . . . . . . . . . . . . . . . . . . . . . 10Economic Performance and Structure. . . . . . . . . . . . . . . . . . . . . . . . . . . . . . . . . . . . . . . . . . 11Investment Climate and Drivers of Foreign Direct Investment . . . . . . . . . . . . . 13Interest Rates and Inflation . . . . . . . . . . . . . . . . . . . . . . . . . . . . . . . . . . . . . . . . . . . . . . . . . . . . . . 14Ease of Doing Business . . . . . . . . . . . . . . . . . . . . . . . . . . . . . . . . . . . . . . . . . . . . . . . . . . . . . . . . . . . 15
3. SUPPLY OF IMPACT INVESTING CAPITAL . . . . . . . . . . . . . . . . . . . . . . . . . . . 16Estimate of Impact Capital Deployed . . . . . . . . . . . . . . . . . . . . . . . . . . . . . . . . . . . . . . . . . . 16Main Barriers and Opportunities in Deploying Impact Capital . . . . . . . . . . . . . 32Beyond Impact Investing . . . . . . . . . . . . . . . . . . . . . . . . . . . . . . . . . . . . . . . . . . . . . . . . . . . . . . . . . 36
4. DEMAND FOR IMPACT INVESTING CAPITAL . . . . . . . . . . . . . . . . . . . . . . 37Development Context . . . . . . . . . . . . . . . . . . . . . . . . . . . . . . . . . . . . . . . . . . . . . . . . . . . . . . . . . . . 37Types and Distribution of Demand Actors . . . . . . . . . . . . . . . . . . . . . . . . . . . . . . . . . . . . 39Challenges Faced by Demand Actors . . . . . . . . . . . . . . . . . . . . . . . . . . . . . . . . . . . . . . . . . 41
5. ECOSYSTEM FOR IMPACT INVESTING . . . . . . . . . . . . . . . . . . . . . . . . . . . . . . 42Policies and Regulations . . . . . . . . . . . . . . . . . . . . . . . . . . . . . . . . . . . . . . . . . . . . . . . . . . . . . . . . . . 42Efforts to Support the Impact Investment Market . . . . . . . . . . . . . . . . . . . . . . . . . . . . 43Main Constraints and Opportunities . . . . . . . . . . . . . . . . . . . . . . . . . . . . . . . . . . . . . . . . . . . 44
CONCLUSION: OPPORTUNITIES FOR INTERVENTION . . . . . . . . . . . . 45
ANNEX: LIST OF INTERVIEWEES . . . . . . . . . . . . . . . . . . . . . . . . . . . . . . . . . . . . . . . . . 48
CALLOUT BOXESBox 1. Impact Investing in WAEMU and Non-WAEMU Countries . . . . . . . 21Box 2. Sierra Leone . . . . . . . . . . . . . . . . . . . . . . . . . . . . . . . . . . . . . . . . . . . . . . . . . . . . . . . . . . . . . . . 24Box 3. Cote d’Ivoire . . . . . . . . . . . . . . . . . . . . . . . . . . . . . . . . . . . . . . . . . . . . . . . . . . . . . . . . . . . . . . 28Box 4. Togo and Benin . . . . . . . . . . . . . . . . . . . . . . . . . . . . . . . . . . . . . . . . . . . . . . . . . . . . . . . . . . . 31
2 • THE LANDSCAPE FOR IMPACT INVESTING IN WEST AFRICA
EXECUTIVE SUMMARYABOUT THIS REPORT
This report provides much-needed information on the impact investing market in West Africa. It contains four chapters—one outlining regional findings and three outlining specific findings in Nigeria, Ghana, and Senegal—each organized into four sections:
1. “Overview” provides a high-level outline of the political, economic, and investment climate of the region or country.
2. “Supply” outlines findings related to the volume of impact investing capital deployed to date—broken down by sector, instrument, and deal size. It describes the key barriers and opportunities identified by impact investors interviewed for this study and outlines impact measurement and reporting practices.
3. “Demand” describes the characteristics of impact investment recipients, as well as their needs for, and the perceived barriers to, accessing capital.
4. “Ecosystem” describes the regulatory environment for impact investing and the key actors involved in enterprise and investor support.
In addition to our primary countries of Nigeria, Ghana, and Senegal, information on four additional countries is included in boxes throughout the regional chapter (Sierra Leone, Cote d’Ivoire, Togo, and Benin).
The Landscape for Impact Investing in West Africa is the third in a series of regional market landscaping studies published by the Global Impact Investing Network (GIIN) that seek to address the lack of data available on impact investing in emerging economies. The first such report focused on South Asia, the second examined East Africa, while a forthcoming report will examine Southern Africa.
OVERVIEW OF THE REGION
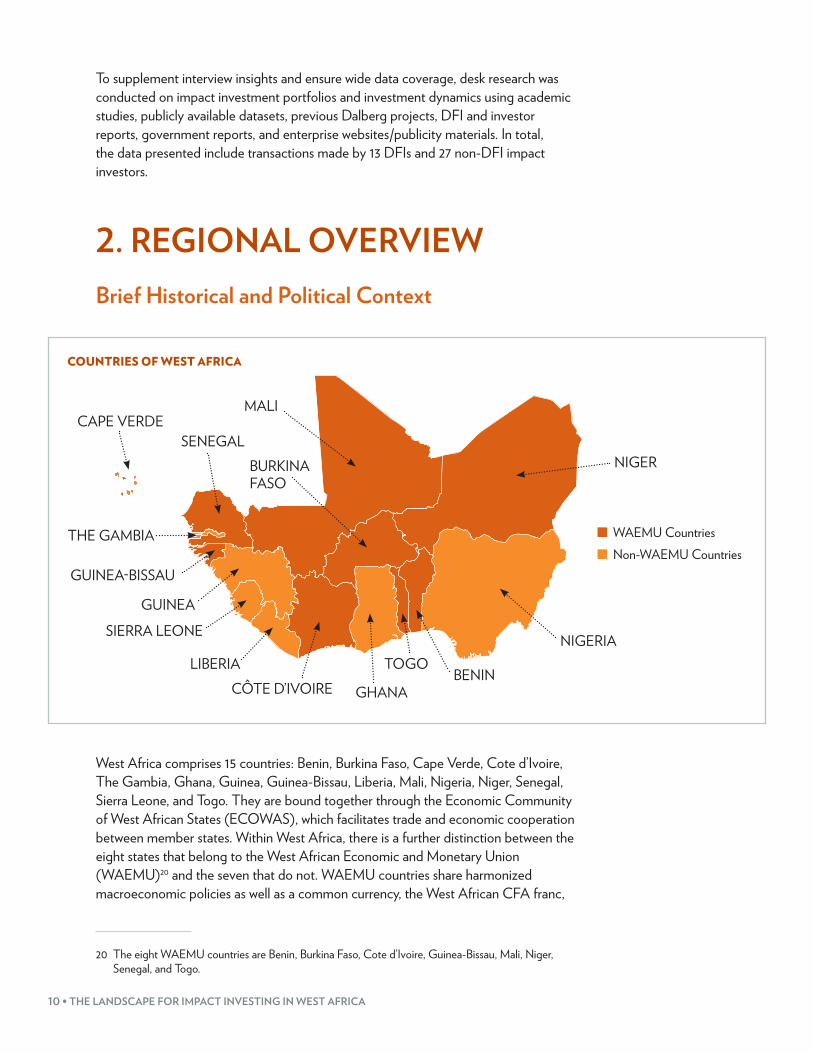
West Africa comprises 15 countries: Benin, Burkina Faso, Cape Verde, Cote d’Ivoire, The Gambia, Ghana, Guinea, Guinea-Bissau, Liberia, Mali, Nigeria, Niger, Senegal, Sierra Leone, and Togo. They are bound together through the Economic Community of West African States (ECOWAS), with a further distinction between the eight states that belong to the West African Economic and Monetary Union (WAEMU)1, which share a common currency pegged to the euro, and the seven states that do not.
Political stability varies between countries, but is improving. Senegal, Ghana, Benin, Burkina Faso, Cape Verde, The Gambia, and Togo have enjoyed relative political stability and freedom from violence over the past decade; Liberia, Sierra Leone, and Cote d’Ivoire are emerging from recent civil war; and Mali, Niger, Guinea, Guinea-Bissau, and Nigeria face ongoing security risks either from political violence or terrorism.
1 The eight WAEMU countries are Benin, Burkina Faso, Cote d’Ivoire, Guinea-Bissau, Mali, Niger, Senegal, and Togo.
REGIONAL OVERVIEW • 3
West Africa is the second fastest growing regional economy in Africa, having experienced Gross Domestic Product (GDP) growth of 6% in 2014.2 While Nigeria and Ghana have anchored this growth to date, countries such as Cote d’Ivoire, Burkina Faso, Niger, and Liberia are expected to play an increasingly important role, with Cote d’Ivoire expected to be the third fastest growing economy in Africa by 2016.3
West Africa is not an easy region in which to do business, but is improving in this regard. Large gaps in energy provision and infrastructure hamper mobility and productivity; human capital limitations make it difficult to hire qualified local staff; and high costs of living—especially in Nigeria—make maintaining a local presence costly. However, performance on key indicators related to ease of doing business has been improving over the last several years.4
SUPPLY OF IMPACT INVESTING CAPITAL
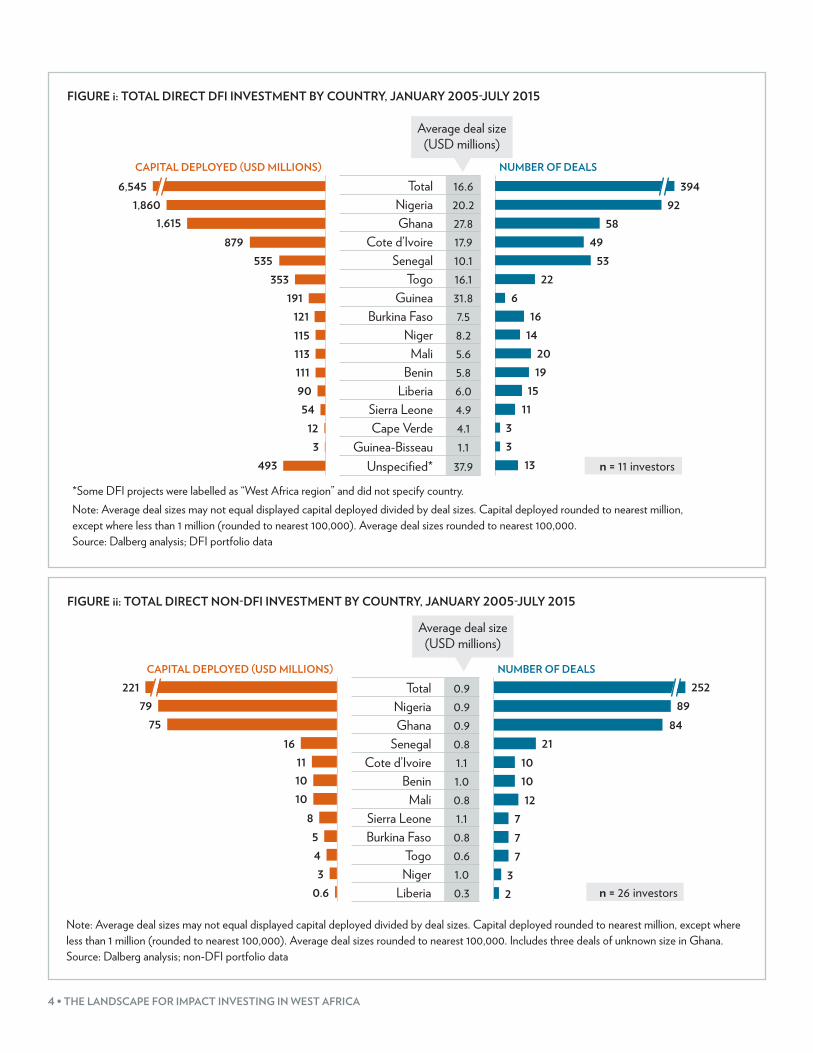
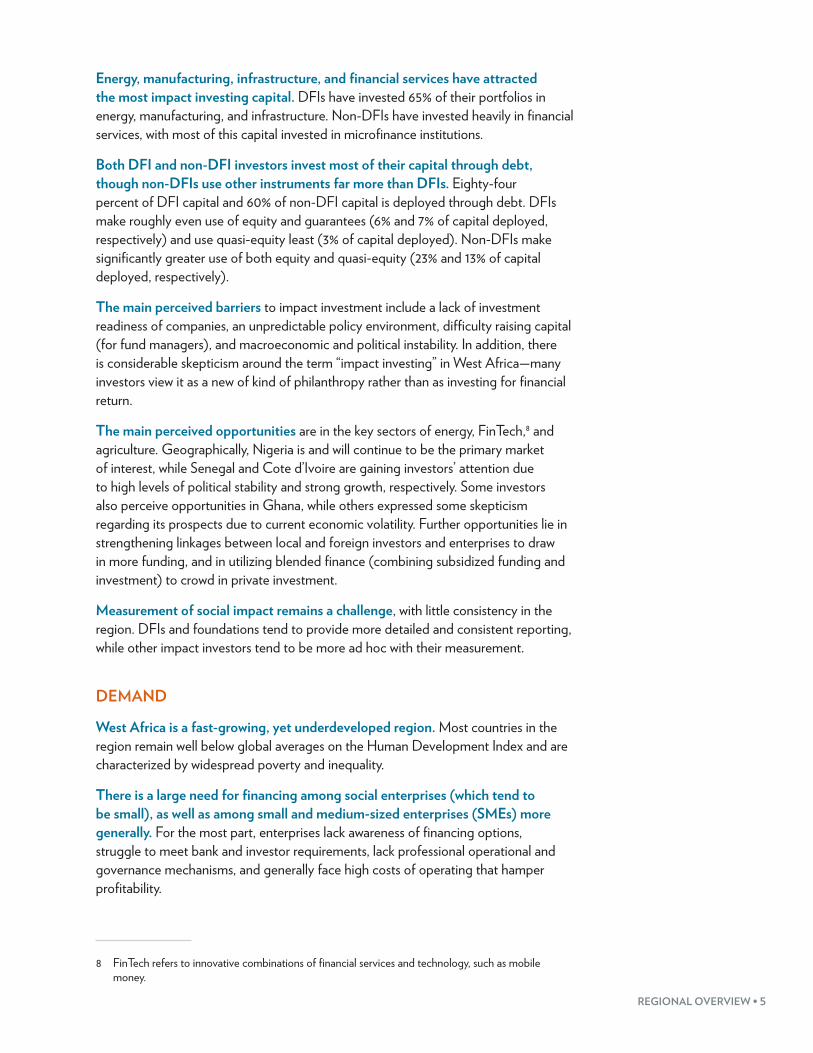
The impact investing industry in West Africa is small, but growing. Forty impact investors are active in the region, including 13 development finance institutions (DFIs)5 and 27 other investors. This study includes information on direct impact investments made by 11 DFIs and 26 non-DFIs in the region totaling USD 6.8 billion between 2005 and mid-2015 (Figures i and ii). This is small relative to East Africa, the only other African region for which impact investment data is currently available. East Africa received a total of USD 9.3 billion in impact investment over a similar period,6 despite the region’s gross domestic product (GDP) being less than half that of West Africa.7 DFIs have deployed 97% of the total impact investing capital in West Africa. Since 2005, DFI investment has increased at a compound annual growth rate of 18%, from USD 190 million in 2005 to USD 852 million in 2014.
More than half (54%) of all impact capital deployed in the region is in Nigeria and Ghana. Nigeria, accounting for 80% of the region’s GDP, has received the largest amount of impact capital (29%) as investors seek to service a large and growing addressable market. Ghana has received nearly as large a share of impact investment (25%) despite only accounting for 5% of West Africa’s GDP, reflecting its business-friendly policies. Senegal and Cote d’Ivoire together account for a further 21% of impact capital deployed.
2 “African Economic Outlook 2015: Regional development and spatial inclusion,” African Economic Outlook (2015). Available at: http://www.africaneconomicoutlook.org/fileadmin/uploads/aeo/2015/PDF_Chapters/Overview_AEO2015_EN-web.pdf.
3 Statistics, African Economic Outlook (2015). Available at: http://www.africaneconomicoutlook.org/en/statistics.
4 “Doing Business: Measuring Business Regulations,” World Bank (2015). Available at: http://www.doingbusiness.org/rankings.
5 Due to the unique nature and large size of development finance institutions (DFIs), the authors of this report analyzed their activity separately from those of other types of impact investors (“non-DFI”), and present this separate analysis when appropriate.
6 “The impact investing landscape in East Africa,” Global Impact Investing Network (2015). Available at: http://www.thegiin.org/cgi-bin/iowa/resources/research/698.html.
7 “World Development Indicators,” World Bank (2015). Available at: http://data.worldbank.org/data-catalog/world-development-indicators.
4 • THE LANDSCAPE FOR IMPACT INVESTING IN WEST AFRICA
FIGURE i: TOTAL DIRECT DFI INVESTMENT BY COUNTRY, JANUARY 2005-JULY 2015
*Some DFI projects were labelled as “West Africa region” and did not specify country. Note: Average deal sizes may not equal displayed capital deployed divided by deal sizes. Capital deployed rounded to nearest million, except where less than 1 million (rounded to nearest 100,000). Average deal sizes rounded to nearest 100,000. Source: Dalberg analysis; DFI portfolio data
CAPITAL DEPLOYED (USD MILLIONS) NUMBER OF DEALS
Total 16.6Nigeria 20.2Ghana 27.8
Cote d’Ivoire 17.9Senegal 10.1
Togo 16.1Guinea 31.8
Burkina Faso 7.5Niger 8.2
Mali 5.6Benin 5.8
Liberia 6.0Sierra Leone 4.9Cape Verde 4.1
Guinea-Bisseau 1.1Unspecified* 37.9
Average deal size (USD millions)
6,5451,860
1,615879
535353
1911211151131119054
123
493
39492
5849
5322
616
142019
1511
33
13 n = 11 investors
FIGURE ii: TOTAL DIRECT NON-DFI INVESTMENT BY COUNTRY, JANUARY 2005-JULY 2015
n = 26 investors
CAPITAL DEPLOYED (USD MILLIONS) NUMBER OF DEALS
Total 0.9Nigeria 0.9Ghana 0.9
Senegal 0.8Cote d’Ivoire 1.1
Benin 1.0Mali 0.8
Sierra Leone 1.1Burkina Faso 0.8
Togo 0.6Niger 1.0
Liberia 0.3
25289
8421
101012
777
32
22179
7516
111010
8543
0.6
Average deal size (USD millions)
Note: Average deal sizes may not equal displayed capital deployed divided by deal sizes. Capital deployed rounded to nearest million, except where less than 1 million (rounded to nearest 100,000). Average deal sizes rounded to nearest 100,000. Includes three deals of unknown size in Ghana. Source: Dalberg analysis; non-DFI portfolio data
REGIONAL OVERVIEW • 5
Energy, manufacturing, infrastructure, and financial services have attracted the most impact investing capital. DFIs have invested 65% of their portfolios in energy, manufacturing, and infrastructure. Non-DFIs have invested heavily in financial services, with most of this capital invested in microfinance institutions.
Both DFI and non-DFI investors invest most of their capital through debt, though non-DFIs use other instruments far more than DFIs. Eighty-four percent of DFI capital and 60% of non-DFI capital is deployed through debt. DFIs make roughly even use of equity and guarantees (6% and 7% of capital deployed, respectively) and use quasi-equity least (3% of capital deployed). Non-DFIs make significantly greater use of both equity and quasi-equity (23% and 13% of capital deployed, respectively).
The main perceived barriers to impact investment include a lack of investment readiness of companies, an unpredictable policy environment, difficulty raising capital (for fund managers), and macroeconomic and political instability. In addition, there is considerable skepticism around the term “impact investing” in West Africa—many investors view it as a new of kind of philanthropy rather than as investing for financial return.
The main perceived opportunities are in the key sectors of energy, FinTech,8 and agriculture. Geographically, Nigeria is and will continue to be the primary market of interest, while Senegal and Cote d’Ivoire are gaining investors’ attention due to high levels of political stability and strong growth, respectively. Some investors also perceive opportunities in Ghana, while others expressed some skepticism regarding its prospects due to current economic volatility. Further opportunities lie in strengthening linkages between local and foreign investors and enterprises to draw in more funding, and in utilizing blended finance (combining subsidized funding and investment) to crowd in private investment.
Measurement of social impact remains a challenge, with little consistency in the region. DFIs and foundations tend to provide more detailed and consistent reporting, while other impact investors tend to be more ad hoc with their measurement.
DEMAND
West Africa is a fast-growing, yet underdeveloped region. Most countries in the region remain well below global averages on the Human Development Index and are characterized by widespread poverty and inequality.
There is a large need for financing among social enterprises (which tend to be small), as well as among small and medium-sized enterprises (SMEs) more generally. For the most part, enterprises lack awareness of financing options, struggle to meet bank and investor requirements, lack professional operational and governance mechanisms, and generally face high costs of operating that hamper profitability.
8 FinTech refers to innovative combinations of financial services and technology, such as mobile money.
6 • THE LANDSCAPE FOR IMPACT INVESTING IN WEST AFRICA
ECOSYSTEM
While regulatory barriers are not the most serious concern for investors, there are some worth noting. Regulatory barriers include high levels of policy uncertainty, inadequate bankruptcy regulation, and restrictions on institutional investment into private equity.
The ecosystem of enterprise and investor support organizations is growing, but remains underdeveloped. While strong growth and investment in ecosystem actors such as incubators, accelerators, associations, and technical assistance providers is evident over recent years, the ecosystem is not at sufficient scale to service the needs of the region, and is hampered by a lack of awareness among both investors and enterprises of the value of ecosystem support. Investors cite underdeveloped enterprise business systems as a large barrier to deploying capital, so increasing the number of incubators, in particular, will be crucial to supporting the growth of the impact investing industry.
1. INTRODUCTION, DEFINITIONS, AND METHODOLOGYIntroductionImpact investing is growing in popularity due to both its focus on meeting critical development challenges and its recognition that such challenges often represent significant investment opportunities in underserved markets.
West Africa is a perfect example of a region where challenges and opportunities collide. The region faces significant challenges related to poverty, health, education, and nutrition. Poverty rates in the region are more than three times the global average,9 while under-five mortality rates are almost double that of the global average.10 And yet, West Africa is also the second fastest-growing regional economy in Africa, after East Africa, with an annual GDP growth of 6% in 2014.11
9 An average of 46% percent of the population across West African countries lives on less than USD 1.25/day compared to a global average of 15%. Latest available data used for each country. “World Development Indicators,” World Bank (2015). Available at: http://data.worldbank.org/data-catalog/world-development-indicators.
10 The West Africa under-five mortality rate is 93 per 1,000 live births compared to a global average of 46. “World Development Indicators,” World Bank (2015). Available at: http://data.worldbank.org/data-catalog/world-development-indicators.
11 “African Economic Outlook 2015: Regional development and spatial inclusion,” African Economic Outlook (2015). Available at: http://www.africaneconomicoutlook.org/fileadmin/uploads/aeo/2015/PDF_Chapters/Overview_AEO2015_EN-web.pdf.
Impact investments are investments made into companies, organizations, and funds with the intention to generate social and environmental impact alongside a financial return.
THE GLOBAL IMPACT INVESTING NETWORK, WWW.THEGIIN.ORG
REGIONAL OVERVIEW • 7
It is home to Africa’s largest and most populous economy, Nigeria.12 Further, gaps in areas such as energy, agricultural production, and infrastructure are creating large demands for investment and innovation.13
Given this combination of challenges and opportunities, West Africa represents an attractive target for impact investors looking to generate sustainable social and environmental impact alongside financial return. Still, it is difficult for such investors to deploy capital in the region. Some of the difficulty is structural—for example, major infrastructure and energy needs raise business operating costs while political uncertainty and regulatory barriers complicate the process of investing. But lack of information is also a major contributing factor. West Africa is not an easy place to understand, as cultural, religious, economic, and political dynamics vary widely between and within countries, and there is little data available on the current state and potential of impact investment in the region.
This report was written to address this lack of information. It provides much-needed data on how much impact investment is being deployed in West Africa, which countries and sectors it is targeting, and which instruments are being used to deploy it. Further, it outlines the challenges and opportunities faced by impact investors operating in the region, as well as the characteristics and perspectives of investees and actors involved in supporting the industry.
DefinitionsSUPPLY SIDE
The GIIN defines impact investments as “investments made into companies, organizations, and funds with the intention to generate social and environmental impact alongside a financial return.”14 Additionally, impact investors are defined as those having the following three characteristics:
1. Expectation of financial return: Expectation of a positive financial return over the life of the investment.
2. Intention to create impact: Stated intention to create positive social or environmental impact.
3. Commitment to measure impact: Commitment to measure and track social and/or environmental impact.
Impact investments are made across a large variety of sectors and investment instruments. A broad range of investor types are active in the impact investing sector in West Africa, including DFIs,15 foundations, family offices, banks, institutional investors, and fund managers.
12 “World Development Indicators,” World Bank (2015). Available at: http://data.worldbank.org/data-catalog/world-development-indicators.
13 “Investing and Doing Business in West Africa: Key Drivers and Perspectives,” Ecobank (2012). Available at: http://www.ecobank.com/upload/201310070945043375138jvpXfC2pg.pdf.
14 The Global Impact Investing Network website, www.thegiin.org.15 DFIs are defined as government-backed financial institutions that provide finance to the private (and
in some cases public) sector for investments that promote development.
8 • THE LANDSCAPE FOR IMPACT INVESTING IN WEST AFRICA
A NOTE ON DFI PORTFOLIOS
The definition of impact investing used in this study is based on investor intent to create positive impact. However, the authors recognize that intent can manifest itself in a range of different investment strategies. In particular, due to the unique nature and large size of DFIs, the authors of this report analyzed their activity separately from the activity of other types of impact investors (“non-DFI”), and present this separate analysis when appropriate. (As this report focuses on private sector development, finance provided directly to governments by DFIs is excluded.)
While there is value in attempting to segment DFI portfolios into “impact investments” and “other” types of investments, doing so was not feasible for this study. In the case of DFIs, there is continued evolution in how they are thinking about their portfolios. Some consider everything they do to be impact investing while others have begun to segment their activities into buckets. However, most do not publicly indicate which of their investments they consider impact investments and, given that there are many ways to achieve social and/or environmental impact, it would be inappropriate for the research team to segment portfolios for this study. Instead, we segment our analysis so readers are able to more easily interpret numbers in context.
Impact investors invest both directly into enterprises and projects and indirectly through financial intermediaries (e.g., fund managers). To avoid double counting, since an unknown proportion of indirect investment acts as a source of direct investment, and due to severe data limitations on the nature of indirect investments, this report focuses on direct investments. Indirect investments are, however, discussed in more detail in Section 3 of this chapter.
Only capital deployed has been considered for inclusion in this study. Funds that have been committed but not yet deployed have been excluded from the data. All references to “capital deployed” and “impact capital” refer to impact investment unless otherwise stipulated. Available data fall within the period 2005 to mid-2015; all references to “capital deployed to date” refer to this period.
DEMAND FOR IMPACT INVESTING CAPITAL
Impact investors target a range of enterprises, both large and small. DFIs tend to favor larger enterprises due to their ability to absorb the large amounts of capital DFIs are able to provide. This section focuses on two aspects of the demand landscape: social enterprises and the broader landscape of SMEs,16 the latter of which account for 90% of all businesses in the region.
16 Social enterprises in West Africa are almost exclusively SMEs.
REGIONAL OVERVIEW • 9
For the purposes of this report, social enterprises are defined as those that:
• articulate a core objective of generating a positive social or environmental impact, and
• seek to grow to financial viability and sustainability.
The precise definition of small and medium-sized enterprises varies by country, but typically refers to enterprises with fewer than 250 employees.17 Interviewees did not specify revenue or employee numbers when discussing SMEs. Note that many social enterprises are also SMEs.
Both social enterprises and SMEs with no explicit social impact objectives are potential recipients of impact capital due to their role in creating employment and providing goods and services to underserved populations; however, they face significantly greater obstacles to accessing finance and driving growth than do large enterprises. The experiences of these enterprises therefore illustrate the main obstacles to accessing and deploying impact capital.
ECOSYSTEM ACTORS
For the purposes of this report, actors in the impact investing ecosystem are defined as those that are active in either investor or enterprise support. These include the following types of organizations:
• Incubators/accelerators18 • Technical assistance providers (including advisory service providers) • Credit ratings services• Industry associations and networks• Research institutions• Business plan competitions
MethodologyThis research relies on more than 50 in-person and telephonic interviews with impact investors, ecosystem actors, entrepreneurs, and business managers operating in West Africa. In-person interviews were conducted in the primary focus countries of Nigeria, Ghana, and Senegal, while telephonic interviews were used with those either situated outside of the region or operating across other West African countries.19 A full list of interviewees is provided in the annex.
17 “Micro, Small, and Medium Enterprises Around the World: How Many Are There, and What Affects the Count?” International Finance Corporation (2010). Available at: http://www.ifc.org/wps/wcm/connect/9ae1dd80495860d6a482b519583b6d16/MSME-CI-AnalysisNote.pdf?MOD=AJPERES.
18 Incubators and accelerators help SMEs establish themselves and grow through a combination of business development services (e.g., mentoring, coaching, and training in accounts management), funding, and access to physical space and/or machinery. Incubators usually focus on seed- and early-stage SMEs, while accelerators usually focus on growth-stage SMEs.
19 Cote d’Ivoire, Liberia, Sierra Leone, Benin, Burkina Faso, Cape Verde, The Gambia, Guinea, Guinea Bissau, Mali, Niger, and Togo.
10 • THE LANDSCAPE FOR IMPACT INVESTING IN WEST AFRICA
To supplement interview insights and ensure wide data coverage, desk research was conducted on impact investment portfolios and investment dynamics using academic studies, publicly available datasets, previous Dalberg projects, DFI and investor reports, government reports, and enterprise websites/publicity materials. In total, the data presented include transactions made by 13 DFIs and 27 non-DFI impact investors.
2. REGIONAL OVERVIEWBrief Historical and Political Context
COUNTRIES OF WEST AFRICA
MALI
NIGER
NIGERIA
BENINTOGO
GHANACÔTE D’IVOIRELIBERIA
SIERRA LEONE
GUINEA
GUINEA-BISSAU
THE GAMBIA
SENEGALBURKINA FASO
WAEMU CountriesNon-WAEMU Countries
CAPE VERDE
West Africa comprises 15 countries: Benin, Burkina Faso, Cape Verde, Cote d’Ivoire, The Gambia, Ghana, Guinea, Guinea-Bissau, Liberia, Mali, Nigeria, Niger, Senegal, Sierra Leone, and Togo. They are bound together through the Economic Community of West African States (ECOWAS), which facilitates trade and economic cooperation between member states. Within West Africa, there is a further distinction between the eight states that belong to the West African Economic and Monetary Union (WAEMU)20 and the seven that do not. WAEMU countries share harmonized macroeconomic policies as well as a common currency, the West African CFA franc,
20 The eight WAEMU countries are Benin, Burkina Faso, Cote d’Ivoire, Guinea-Bissau, Mali, Niger, Senegal, and Togo.
REGIONAL OVERVIEW • 11
which is pegged to the euro. Language is split roughly along WAEMU/non-WAEMU lines: WAEMU countries are primarily Francophone;21 non-WAEMU countries are primarily Anglophone.22
West Africa contains an extremely diverse set of countries. Apart from divergent linguistic, religious, and cultural dynamics both between and within countries, political and security risks differ widely across the region. Senegal, Ghana, Benin, Burkina Faso, Cape Verde, The Gambia and Togo have enjoyed relative political stability and freedom from violence over the past decade. Liberia, Sierra Leone, and Cote d’Ivoire are emerging from recent civil wars. Mali, Togo, Niger, Guinea, Guinea-Bissau, and Nigeria face ongoing security risks either from political violence or terrorism.
West Africa faces large development challenges, and recent events have not made tackling these any easier. In 2014, West Africa suffered the largest Ebola epidemic in history. Guinea, Sierra Leone, and Liberia were particularly hard hit, contending with approximately 28,000 cases of Ebola and over 11,000 deaths.23 While the epidemic has had devastating human costs and significantly impaired the ability of affected countries’ already fragile health and governance systems to operate effectively, it has also catalyzed significant investment into the region. For example, a recent collaboration between NetHope—a consortium of international humanitarian organizations—and Facebook is focusing on building internet connectivity infrastructure to aid Ebola responders in Sierra Leone, Liberia, and Guinea.24 In bringing to light the large service delivery gaps in the region and catalyzing solutions to solve them, the epidemic has offered an unlikely area of opportunity to build stronger, more resilient healthcare and technological infrastructure.
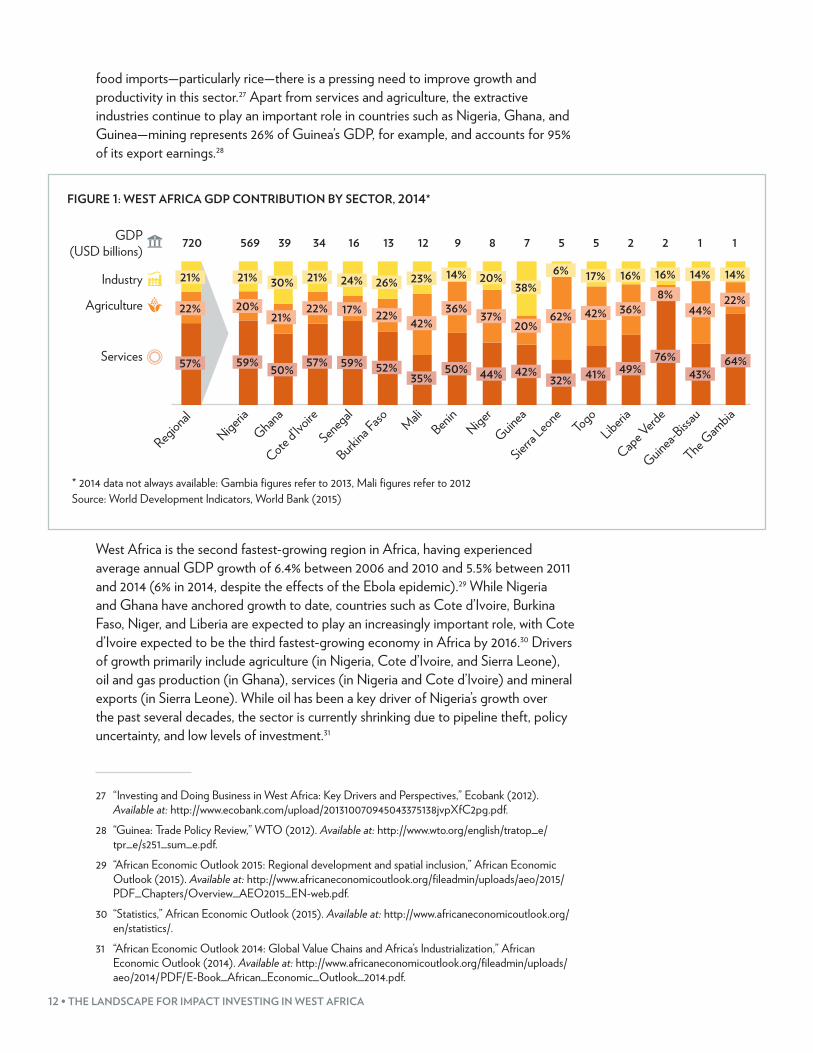
Economic Performance and StructureNigeria dominates West Africa’s economy, accounting for almost 80% of the region’s GDP. Of the remaining 20%, Ghana and Cote d’Ivoire account for 5.4% and 4.8% of regional GDP, respectively, while a variety of smaller economies account for between 2.2% of regional GDP (Senegal) and 0.11% (The Gambia).25
The regional economy is driven by the services sector, which accounts for almost 60% of GDP (Figure 1). Agriculture does, however, feature heavily in the economies of many countries—Sierra Leone, Mali, Togo, and Guinea-Bissau, especially—and is the largest provider of employment.26 Given the region’s significant reliance on
21 Except for Guinea-Bissau, which speaks Portuguese.22 Except for Cape Verde, which speaks Portuguese.23 “2014 Ebola outbreak in West Africa: Case counts,” Center for Disease Control (2015). Available at:
http://www.cdc.gov/vhf/ebola/outbreaks/2014-west-africa/case-counts.html.24 “Partnership expands ICT support for Ebola fight in West Africa,” NetHope (2015). Available at:
http://nethope.org/media/press-room/partnership-expands-ict-support-for-ebola-fight-in-west-africa.
25 “World Development Indicators,” World Bank (2015). Available at: http://data.worldbank.org/data-catalog/world-development-indicators.
26 “Regional Agricultural Policy for West Africa,” ECOWAS (2008). Available at: http://www.diplomatie.gouv.fr/fr/IMG/pdf/01_ANG-ComCEDEAO.pdf.
12 • THE LANDSCAPE FOR IMPACT INVESTING IN WEST AFRICA
food imports—particularly rice—there is a pressing need to improve growth and productivity in this sector.27 Apart from services and agriculture, the extractive industries continue to play an important role in countries such as Nigeria, Ghana, and Guinea—mining represents 26% of Guinea’s GDP, for example, and accounts for 95% of its export earnings.28
FIGURE 1: WEST AFRICA GDP CONTRIBUTION BY SECTOR, 2014*
RegionalNigeria
Ghana
Cote d’Ivo
ire
Senegal
Burkina F
aso MaliBenin
Niger
Guinea
Sierra L
eoneTogo
Liberia
Cape Verd
e
Guinea-Bissa
u
The Gam
bia
720 569 39 34 16 13 12 9 8 7 5 5 2 2 1 1GDP (USD billions)
Industry
Agriculture
Services 57% 59% 50% 57% 59% 52%35%
50% 44% 42%32% 41% 49%
76%43%
64%
22% 20%21%
22% 17% 22%42%
36%37%
20%62% 42% 36%
8%44%
22%
21%21% 30% 21% 24% 26% 23% 14% 6% 14%14%16%16%17%38%
20%
* 2014 data not always available: Gambia figures refer to 2013, Mali figures refer to 2012 Source: World Development Indicators, World Bank (2015)
West Africa is the second fastest-growing region in Africa, having experienced average annual GDP growth of 6.4% between 2006 and 2010 and 5.5% between 2011 and 2014 (6% in 2014, despite the effects of the Ebola epidemic).29 While Nigeria and Ghana have anchored growth to date, countries such as Cote d’Ivoire, Burkina Faso, Niger, and Liberia are expected to play an increasingly important role, with Cote d’Ivoire expected to be the third fastest-growing economy in Africa by 2016.30 Drivers of growth primarily include agriculture (in Nigeria, Cote d’Ivoire, and Sierra Leone), oil and gas production (in Ghana), services (in Nigeria and Cote d’Ivoire) and mineral exports (in Sierra Leone). While oil has been a key driver of Nigeria’s growth over the past several decades, the sector is currently shrinking due to pipeline theft, policy uncertainty, and low levels of investment.31
27 “Investing and Doing Business in West Africa: Key Drivers and Perspectives,” Ecobank (2012). Available at: http://www.ecobank.com/upload/201310070945043375138jvpXfC2pg.pdf.
28 “Guinea: Trade Policy Review,” WTO (2012). Available at: http://www.wto.org/english/tratop_e/tpr_e/s251_sum_e.pdf.
29 “African Economic Outlook 2015: Regional development and spatial inclusion,” African Economic Outlook (2015). Available at: http://www.africaneconomicoutlook.org/fileadmin/uploads/aeo/2015/PDF_Chapters/Overview_AEO2015_EN-web.pdf.
30 “Statistics,” African Economic Outlook (2015). Available at: http://www.africaneconomicoutlook.org/en/statistics/.
31 “African Economic Outlook 2014: Global Value Chains and Africa’s Industrialization,” African Economic Outlook (2014). Available at: http://www.africaneconomicoutlook.org/fileadmin/uploads/aeo/2014/PDF/E-Book_African_Economic_Outlook_2014.pdf.
REGIONAL OVERVIEW • 13
It is important to note that a significant portion of West Africa’s economy is informal,32 a facet that is not captured by the above data. While information on the sector is difficult to obtain, indications are that informal enterprises—both large and small—are at least as numerous as formal enterprises, and contribute a significant share of the region’s productivity and employment.33 In Senegal, for example, it is estimated that approximately 40% of the nation’s GDP lies in the informal sector.34
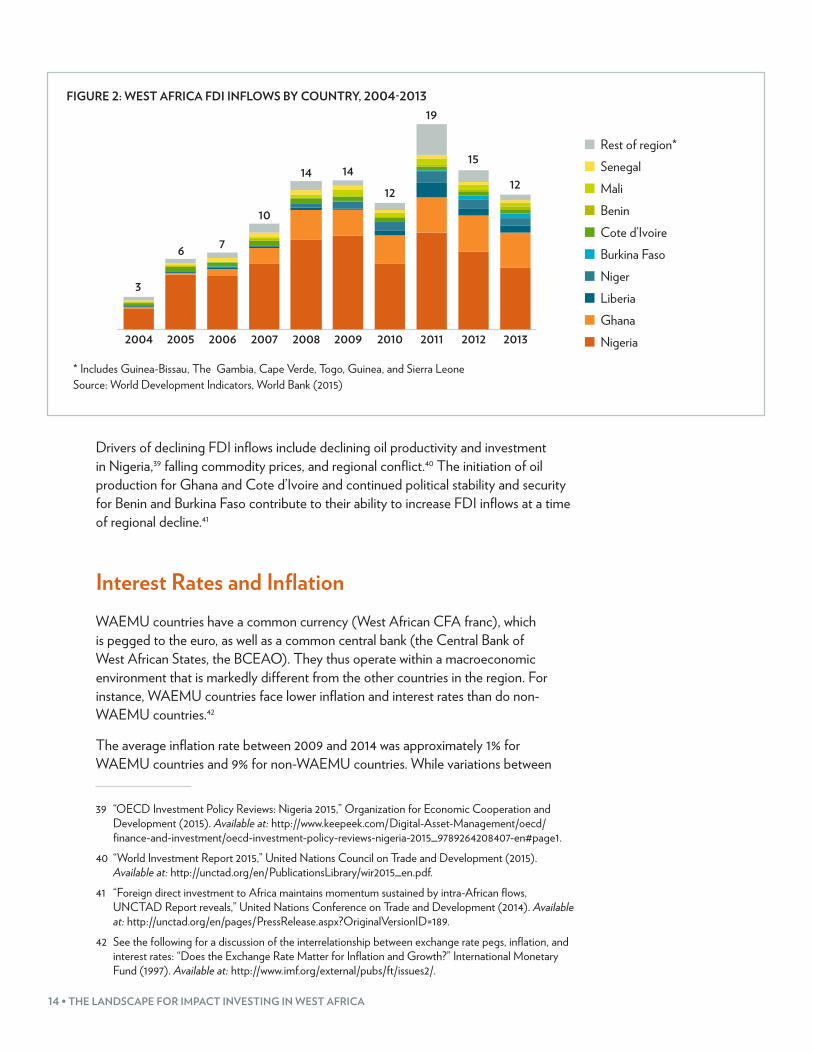
Investment Climate and Drivers of Foreign Direct InvestmentWest Africa accounts for a significant share of sub-Saharan Africa’s (SSA’s) foreign direct investment (FDI), attracting an average of 35% of FDI inflow in SSA between 2004 and 2013.35 Nigeria accounts for approximately half of this, and is currently the third largest recipient of FDI in SSA (behind South Africa and Maritius).36
While FDI increased more than sixfold between 2004 and 2011,37 from USD 3 billion to USD 19 billion, it has markedly declined since then—by 37% between 2011 and 2013, from USD 19 billion to USD 12 billion (Figure 2). Much of this decline is being driven by Nigeria’s decrease in FDI inflows, though FDI in almost all countries in the region decreased between 2011 and 2013 (with the exception of Benin, Burkina Faso, Cote d’Ivoire, and Ghana).38
32 The informal economy consists of businesses and economic activities that are not registered with or taxed by government.
33 “The Informal Sector in Francophone Africa: Firm size, productivity and institutions,” World Bank (2012). Available at: https://openknowledge.worldbank.org/bitstream/handle/10986/9364/699350PUB0Publ067869B09780821395370.pdf?sequence=1.
34 “Skills for Employability: The Informal Economy,” Dalberg and Results for Development (2012). Available at http://www.resultsfordevelopment.org/sites/resultsfordevelopment.org/files/resources/Skills%20for%20Employability%20in%20the%20Informal%20Economy.pdf.
35 “World Development Indicators,” World Bank (2015). Available at: http://data.worldbank.org/data-catalog/world-development-indicators.
36 Ibid. Latest data from 2013.37 The dip in 2009 and 2010 can likely be attributed to the after-effects of the 2008 economic crisis.38 “World Development Indicators,” World Bank (2015). Available at: http://data.worldbank.org/data-
catalog/world-development-indicators.
14 • THE LANDSCAPE FOR IMPACT INVESTING IN WEST AFRICA
FIGURE 2: WEST AFRICA FDI INFLOWS BY COUNTRY, 2004-2013
Rest of region*SenegalMaliBeninCote d’IvoireBurkina FasoNigerLiberiaGhanaNigeria2004 2005 2006 2007 2008 2009 2010 2011 2012 2013
3
6 7
10
14 14
12
19
15
12
* Includes Guinea-Bissau, The Gambia, Cape Verde, Togo, Guinea, and Sierra Leone Source: World Development Indicators, World Bank (2015)
Drivers of declining FDI inflows include declining oil productivity and investment in Nigeria,39 falling commodity prices, and regional conflict.40 The initiation of oil production for Ghana and Cote d’Ivoire and continued political stability and security for Benin and Burkina Faso contribute to their ability to increase FDI inflows at a time of regional decline.41
Interest Rates and InflationWAEMU countries have a common currency (West African CFA franc), which is pegged to the euro, as well as a common central bank (the Central Bank of West African States, the BCEAO). They thus operate within a macroeconomic environment that is markedly different from the other countries in the region. For instance, WAEMU countries face lower inflation and interest rates than do non-WAEMU countries.42
The average inflation rate between 2009 and 2014 was approximately 1% for WAEMU countries and 9% for non-WAEMU countries. While variations between
39 “OECD Investment Policy Reviews: Nigeria 2015,” Organization for Economic Cooperation and Development (2015). Available at: http://www.keepeek.com/Digital-Asset-Management/oecd/finance-and-investment/oecd-investment-policy-reviews-nigeria-2015_9789264208407-en#page1.
40 “World Investment Report 2015,” United Nations Council on Trade and Development (2015). Available at: http://unctad.org/en/PublicationsLibrary/wir2015_en.pdf.
41 “Foreign direct investment to Africa maintains momentum sustained by intra-African flows, UNCTAD Report reveals,” United Nations Conference on Trade and Development (2014). Available at: http://unctad.org/en/pages/PressRelease.aspx?OriginalVersionID=189.
42 See the following for a discussion of the interrelationship between exchange rate pegs, inflation, and interest rates: “Does the Exchange Rate Matter for Inflation and Growth?” International Monetary Fund (1997). Available at: http://www.imf.org/external/pubs/ft/issues2/.
REGIONAL OVERVIEW • 15
WAEMU countries are small, non-WAEMU countries’ inflation rates vary widely—from a 2009-2014 average of 1.9% in Cape Verde to 13% in Guinea. Interest rates paint a similar picture.43 The average WAEMU interbank rate between 2009 and 2014 was approximately 4%,44 compared to 18% for non-WAEMU countries.45
While it is difficult to generalize between countries, it is fair to say that, in general, WAEMU countries face a more consistent and stable macroeconomic climate but lower growth. Average real GDP growth between 2010 and 2014 ranged from 1.9% - 5% in WAEMU countries, for example, while the range was 1.2%-9.4% for non-WAEMU countries.46
Ease of Doing BusinessWest Africa is not an easy region in which to do business. Large gaps in energy provision and infrastructure hamper mobility and productivity, human capital limitations make it difficult to hire qualified local staff, and high costs of living—especially in Nigeria—make maintaining a local presence expensive.
The region’s average rank in the World Bank’s Doing Business index, which ranks 189 countries along various categories related to ease of business operation, is 152. While Ghana ranks in the top 100 (70), the rest of the region’s ranks range from 122 (Cape Verde) to 179 (Guinea-Bissau).47 These poor results are primarily driven by problems in paying taxes (including high taxation rates and administrative burdens related to paying taxes), getting electricity, obtaining construction permits, and registering property. Interviewees also noted high levels of policy uncertainty and ambiguity, which make it difficult to know which regulations apply to investors or when they will change.
The region is, however, improving rapidly. Eight countries in the region have registered improvements in their ease of doing business score between 2013 and 2014,48 with four of these improving their rank by more than ten places.49 Four of sub-Saharan Africa’s top five most improved countries are in West Africa (the fifth is Mozambique).50
43 “World Development Indicators,” World Bank (2015). Available at: http://data.worldbank.org/data-catalog/world-development-indicators.
44 “West African Economic and Monetary Union: Staff report on common policies for member countries,” International Monetary Fund (2014). Available at: https://www.imf.org/external/pubs/ft/scr/2014/cr1484.pdf.
45 “World Development Indicators,” World Bank (2015). Available at: http://data.worldbank.org/data-catalog/world-development-indicators.
46 Ibid.47 “Doing Business: Measuring Business Regulations,” World Bank (2015). Available at: http://www.
doingbusiness.org/rankings. 48 The Gambia, Sierra Leone, Cote d’Ivoire, Togo, Benin, Senegal, Guinea, and Nigeria.49 Cote d’Ivoire, Togo, Benin, and Senegal.50 “Doing Business: Measuring Business Regulations,” World Bank (2015). Available at: http://www.
doingbusiness.org/rankings.
16 • THE LANDSCAPE FOR IMPACT INVESTING IN WEST AFRICA
Initiatives such as the Organization for the Harmonization of Business Law in Africa (OHADA), which seeks to improve the regulatory environment for investors in West and Central Africa51 and includes nine West African states,52 as well as the large investments by DFIs aimed at tackling gaps in energy and infrastructure (discussed below), bode well for further improvement in the region.
3. SUPPLY OF IMPACT INVESTING CAPITALEstimate of Impact Capital Deployed
OVERVIEW AND GROWTH
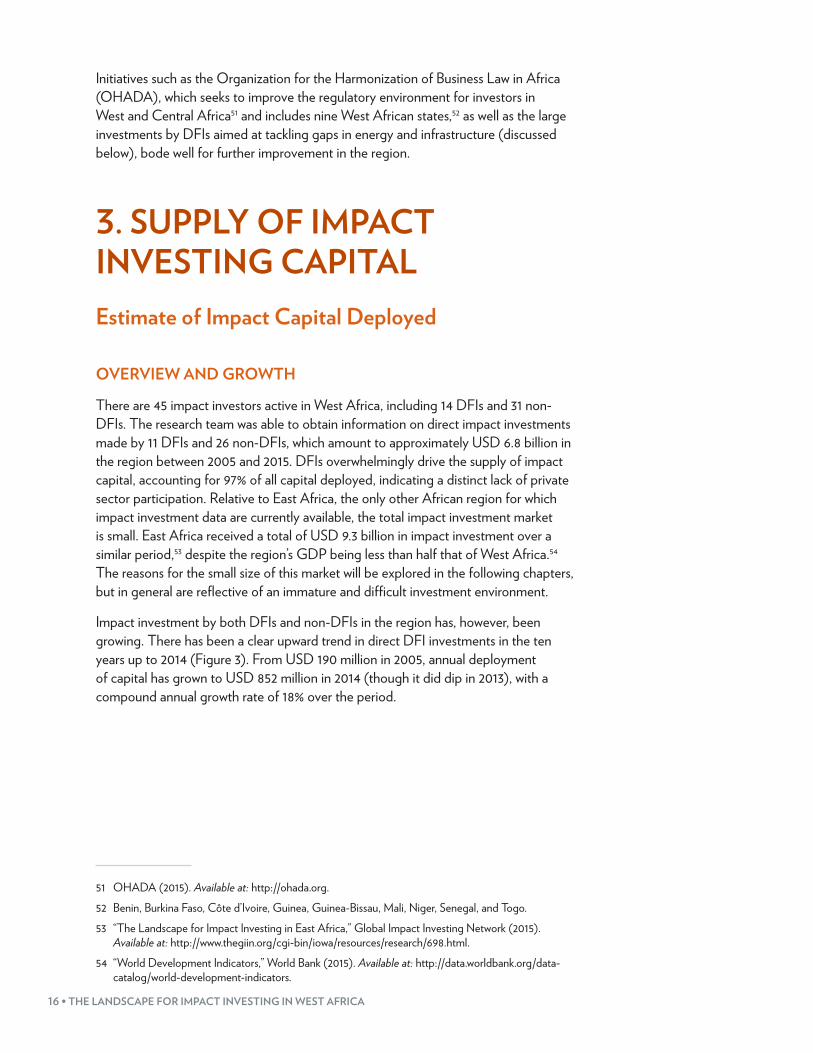
There are 45 impact investors active in West Africa, including 14 DFIs and 31 non-DFIs. The research team was able to obtain information on direct impact investments made by 11 DFIs and 26 non-DFIs, which amount to approximately USD 6.8 billion in the region between 2005 and 2015. DFIs overwhelmingly drive the supply of impact capital, accounting for 97% of all capital deployed, indicating a distinct lack of private sector participation. Relative to East Africa, the only other African region for which impact investment data are currently available, the total impact investment market is small. East Africa received a total of USD 9.3 billion in impact investment over a similar period,53 despite the region’s GDP being less than half that of West Africa.54 The reasons for the small size of this market will be explored in the following chapters, but in general are reflective of an immature and difficult investment environment.
Impact investment by both DFIs and non-DFIs in the region has, however, been growing. There has been a clear upward trend in direct DFI investments in the ten years up to 2014 (Figure 3). From USD 190 million in 2005, annual deployment of capital has grown to USD 852 million in 2014 (though it did dip in 2013), with a compound annual growth rate of 18% over the period.
51 OHADA (2015). Available at: http://ohada.org.52 Benin, Burkina Faso, Côte d’Ivoire, Guinea, Guinea-Bissau, Mali, Niger, Senegal, and Togo.53 “The Landscape for Impact Investing in East Africa,” Global Impact Investing Network (2015).
Available at: http://www.thegiin.org/cgi-bin/iowa/resources/research/698.html.54 “World Development Indicators,” World Bank (2015). Available at: http://data.worldbank.org/data-
catalog/world-development-indicators.
REGIONAL OVERVIEW • 17
FIGURE 3: DIRECT DFI INVESTMENTS IN WEST AFRICA BY YEAR, 2005-2014
2005 2006 2007 2008 2009 2010 2011 2012 2013 2014
21.1 10.9 12.8 14.8 18.7 24.0 14.6 16.9 16.0 15.8
5550454035302520151050
900800700600500400300200100
0
190
316
435385
748816
670
894800
852
AVERAGE DEAL SIZE
(USD MILLIONS)
CAPITAL DEPLOYED (USD MILLIONS)
NUMBER OF DEALSn = 11 investors
Total capitalNumber of deals
Notes: Unknown investments (USD 408.6 million) and January-July 2015 investments (USD 20.5 million) excluded. Average deal sizes may not equal displayed capital deployed divided by deal sizes. Capital deployed rounded to nearest million, except where less than 1 million (rounded to nearest 100,000). Average deal sizes rounded to nearest 100,000. Source: DFI portfolio data; Dalberg analysis
Available data on non-DFI investments by year are limited, especially for recent deals that may not yet have been reported by investors. Still, available data do indicate a broad trend of growth—from USD 0.2 million deployed in 2008 to USD 17 million deployed in 201355—which aligns well with interviewee comments. The past five years have seen an emergence of fund managers in the region, most notably in Nigeria. Sahel Capital Partners and Doreo Partners are two such examples that have emerged since 2010; only Alitheia Capital has been active in West Africa for longer.
Another trend is the growing prominence of foundations as significant providers of impact capital. Interviewees reported that foundations are becoming more involved in the space in two ways. First, an increasing number of foundations are investing in West Africa. Second, existing foundations are playing an important role in demonstrating investment opportunities in markets perceived as high risk by mainstream investors. Many foundations are mandated to operate in fragile economies and are increasingly looking beyond grants to provide market-based solutions to local issues. As they increasingly include impact investing in their development toolkits, these foundations aim to reduce risk in markets perceived as dangerous or unviable by other investors. For example, the Lundin Foundation’s focus on underserved markets has driven its investments in Niger and Burkina Faso, while Cordaid’s mission to alleviate poverty in post-conflict and post-epidemic states has led it to invest in Sierra Leone and seek to
55 Data by year for 2014 and 2015 are severely limited. Though estimates indicate a decline in capital deployed from USD 18 million to USD 13 million in 2014, interviewees noted that this was not reflective of reality and that non-DFI impact investments had grown over the past two years.
18 • THE LANDSCAPE FOR IMPACT INVESTING IN WEST AFRICA
expand into Liberia and Guinea. Beyond foundations, some other non-DFI actors are also committing to high-risk frontier markets. Broad Cove, an impact investor in Liberia and Ghana, seeks to build housing and associated infrastructure in line with its mandate of operating in “un-investable” markets.
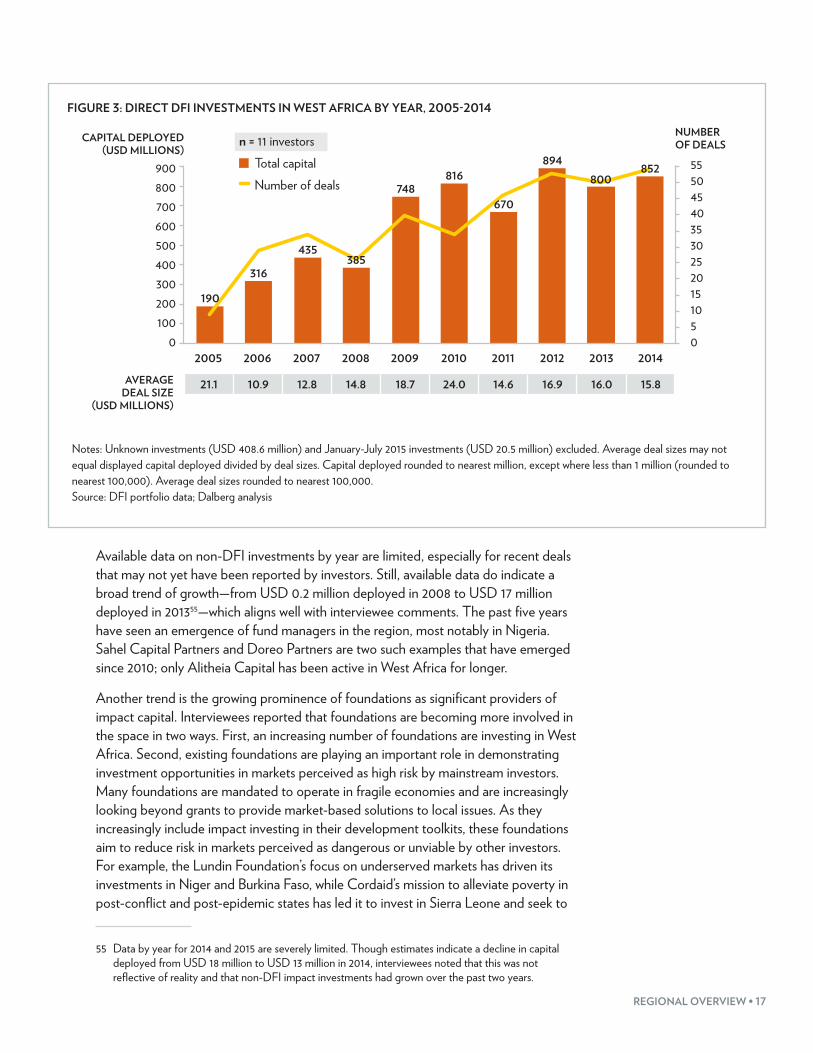
LOCAL PRESENCE AND SOURCES OF FUNDING
In terms of local presence, impact investors cluster in Senegal (10 offices), Nigeria (eight offices), and Ghana (seven offices; see Figure 4). The Banque Ouest Africaine de Développement (BOAD)56 and African Development Bank (AfDB) are the largest regional investors and maintain the most offices in West Africa, (seven and 12 country offices, respectively), but are headquartered instead in Togo (BOAD) and Cote d’Ivoire (AfDB). Twenty-six investors, nine of which are DFIs, have no permanent physical presence in the region.
FIGURE 4. IMPACT INVESTOR TYPES AND LOCAL PRESENCE IN WEST AFRICA, JULY 2015
Impact Investor Locations
Impact Investor Types
With local presence
With no local presence Total
DFIs 5 9 14Non-DFIs 14 17 31• Fund Managers 24• Foundations 6• Institutional Investors 1
45 Impact Investors
19with local presence
26with no
local presence
Mali2 0
Nigeria3 5
Ghana4 3
Benin2 0
Togo2 0
Guinea2 0
Siera Leone2 0
Liberia2 0
Guinea Bissau2 0
Cote d’Ivoire4 0
Senegal5 5
Burkina Faso2 0
Niger1 0
# Number of DFIs with local presence in country
# Number of non-DFI impact investors with local presence in country
Note: Country numbers will not equal totals as some investors have presence in multiple countries. Source: Dalberg analysis
As the overwhelming majority of investment comes from DFIs, the largest source of impact capital is foreign governments. Within the DFIs, the majority of direct capital deployed is from global and regional actors. The International Finance Corporation (IFC), BOAD, and AfDB combined account for USD 4.8 billion—74% of DFI investment in West Africa. Non-DFIs also rely on funds from abroad. Foundations, relying on capital from sources such as high-net-worth individuals (HWNIs) and
56 West African Development Bank.
REGIONAL OVERVIEW • 19
corporations, are primarily headquartered outside the region. Fund managers (which account for the majority of non-DFI investors) both based within and outside the region source capital primarily from investors in developed markets. As explored more fully below, fund managers based in West African countries report great difficulty in accessing local capital, and instead are reliant on DFIs, foundations, and other regional actors as sources of funding.
COUNTRY DISTRIBUTION
Within West Africa, impact investing is highly concentrated in Nigeria and Ghana, which together account for more than 50% of capital deployed in the region. Both DFIs and non-DFIs deploy the largest proportion of their capital in Nigeria (Figures 5 and 6). In terms of both DFI and non-DFI investment as a proportion of GDP, Ghana is by far the leading impact investment destination.
Of the USD 6.5 billion direct DFI capital deployed, Nigeria accounts for USD 1.9 billion (28% of total capital deployed) across 92 direct investments, with Ghana receiving USD 1.6 billion (25% of total capital deployed) across 58 direct investments. While Nigeria leads in terms of absolute impact investments, Ghana is the largest recipient relative to its GDP. Impact capital deployed in 2014 accounts for 0.07% of Nigeria’s GDP and 0.27% of Ghana’s. This is likely due to Ghana’s positioning itself as politically stable and investor friendly.
The next highest recipients in the region are the two francophone powerhouses of Cote d’Ivoire and Senegal, which account for a combined 22% of DFI impact capital deployed. This reflects the large size and greater sophistication of these countries’ economies relative to the rest of the region and, in the case of Senegal, its positioning as a convenient air and sea entry point to Francophone West Africa.
As mentioned, non-DFI direct impact investments are minor compared to DFI flows, accounting for just 3% of impact capital deployed. Interestingly, Ghana almost matches Nigeria in attracting this type of capital, with both receiving close to USD 80 million. The reasons for this result are more comprehensively covered in the country chapters, and relate to Ghana’s significantly lower costs of doing business and more stable political climate.

20 • THE LANDSCAPE FOR IMPACT INVESTING IN WEST AFRICA
FIGURE 5: TOTAL DIRECT DFI INVESTMENT BY COUNTRY, JANUARY 2005-JULY 2015
*Some DFI projects were labelled as “West Africa region” and did not specify country. Note: Average deal sizes may not equal displayed capital deployed divided by deal sizes. Capital deployed rounded to nearest million, except where less than 1 million (rounded to nearest 100,000). Average deal sizes rounded to nearest 100,000. Source: Dalberg analysis; DFI portfolio data
CAPITAL DEPLOYED (USD MILLIONS) NUMBER OF DEALS
Total 16.6Nigeria 20.2Ghana 27.8
Cote d’Ivoire 17.9Senegal 10.1
Togo 16.1Guinea 31.8
Burkina Faso 7.5Niger 8.2
Mali 5.6Benin 5.8
Liberia 6.0Sierra Leone 4.9Cape Verde 4.1
Guinea-Bisseau 1.1Unspecified* 37.9
Average deal size (USD millions)
6,5451,860
1,615879
535353
1911211151131119054
123
493
39492
5849
5322
616
142019
1511
33
13 n = 11 investors
FIGURE 6: TOTAL DIRECT NON-DFI INVESTMENT BY COUNTRY, JANUARY 2005-JULY 2015
n = 26 investors
CAPITAL DEPLOYED (USD MILLIONS) NUMBER OF DEALS
Total 0.9Nigeria 0.9Ghana 0.9
Senegal 0.8Cote d’Ivoire 1.1
Benin 1.0Mali 0.8
Sierra Leone 1.1Burkina Faso 0.8
Togo 0.6Niger 1.0
Liberia 0.3
25289
8421
101012
777
32
22179
7516
111010
8543
0.6
Average deal size (USD millions)
Note: Average deal sizes may not equal displayed capital deployed divided by deal sizes. Capital deployed rounded to nearest million, except where less than 1 million (rounded to nearest 100,000). Average deal sizes rounded to nearest 100,000. Includes three deals of unknown size in Ghana. Source: Dalberg analysis; non-DFI portfolio data
REGIONAL OVERVIEW • 21
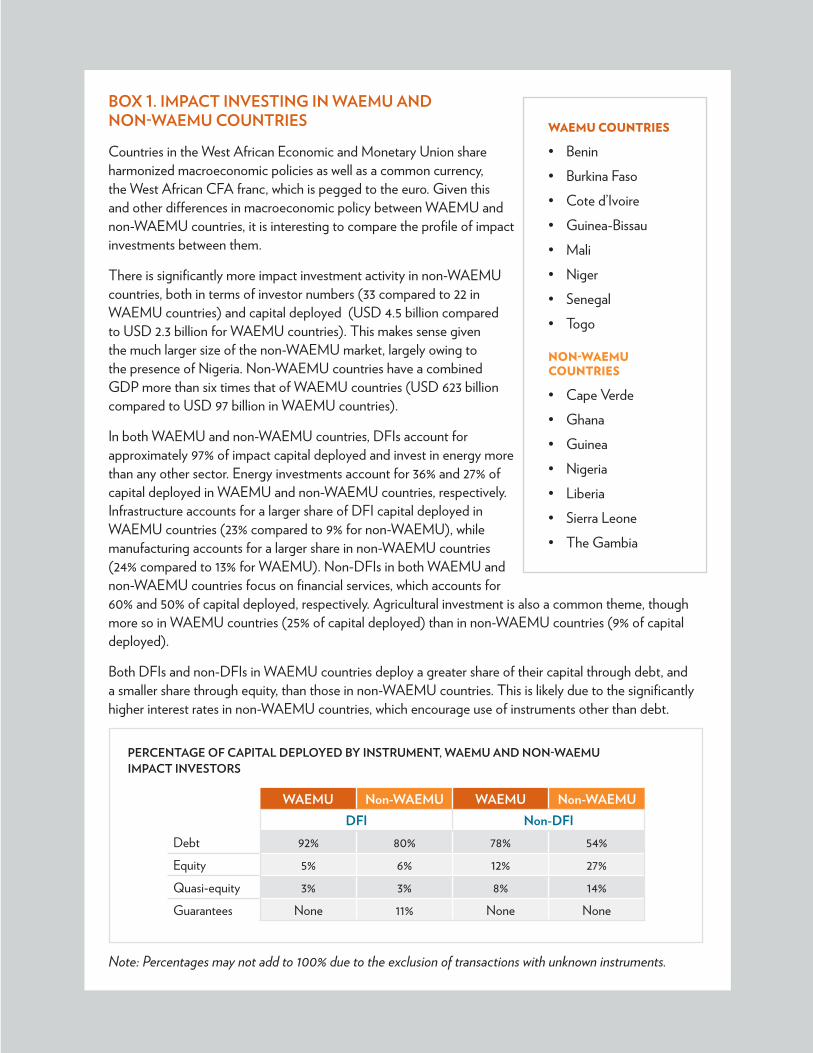
BOX 1. IMPACT INVESTING IN WAEMU AND NON-WAEMU COUNTRIES
Countries in the West African Economic and Monetary Union share harmonized macroeconomic policies as well as a common currency, the West African CFA franc, which is pegged to the euro. Given this and other differences in macroeconomic policy between WAEMU and non-WAEMU countries, it is interesting to compare the profile of impact investments between them.
There is significantly more impact investment activity in non-WAEMU countries, both in terms of investor numbers (33 compared to 22 in WAEMU countries) and capital deployed (USD 4.5 billion compared to USD 2.3 billion for WAEMU countries). This makes sense given the much larger size of the non-WAEMU market, largely owing to the presence of Nigeria. Non-WAEMU countries have a combined GDP more than six times that of WAEMU countries (USD 623 billion compared to USD 97 billion in WAEMU countries).
In both WAEMU and non-WAEMU countries, DFIs account for approximately 97% of impact capital deployed and invest in energy more than any other sector. Energy investments account for 36% and 27% of capital deployed in WAEMU and non-WAEMU countries, respectively. Infrastructure accounts for a larger share of DFI capital deployed in WAEMU countries (23% compared to 9% for non-WAEMU), while manufacturing accounts for a larger share in non-WAEMU countries (24% compared to 13% for WAEMU). Non-DFIs in both WAEMU and non-WAEMU countries focus on financial services, which accounts for 60% and 50% of capital deployed, respectively. Agricultural investment is also a common theme, though more so in WAEMU countries (25% of capital deployed) than in non-WAEMU countries (9% of capital deployed).
Both DFIs and non-DFIs in WAEMU countries deploy a greater share of their capital through debt, and a smaller share through equity, than those in non-WAEMU countries. This is likely due to the significantly higher interest rates in non-WAEMU countries, which encourage use of instruments other than debt.
PERCENTAGE OF CAPITAL DEPLOYED BY INSTRUMENT, WAEMU AND NON-WAEMU IMPACT INVESTORS
WAEMU Non-WAEMU WAEMU Non-WAEMUDFI Non-DFI
Debt 92% 80% 78% 54%Equity 5% 6% 12% 27%Quasi-equity 3% 3% 8% 14%Guarantees None 11% None None
Note: Percentages may not add to 100% due to the exclusion of transactions with unknown instruments.
WAEMU COUNTRIES
• Benin• Burkina Faso• Cote d’Ivoire• Guinea-Bissau• Mali• Niger• Senegal• Togo
NON-WAEMU COUNTRIES
• Cape Verde• Ghana• Guinea• Nigeria• Liberia• Sierra Leone• The Gambia
22 • THE LANDSCAPE FOR IMPACT INVESTING IN WEST AFRICA
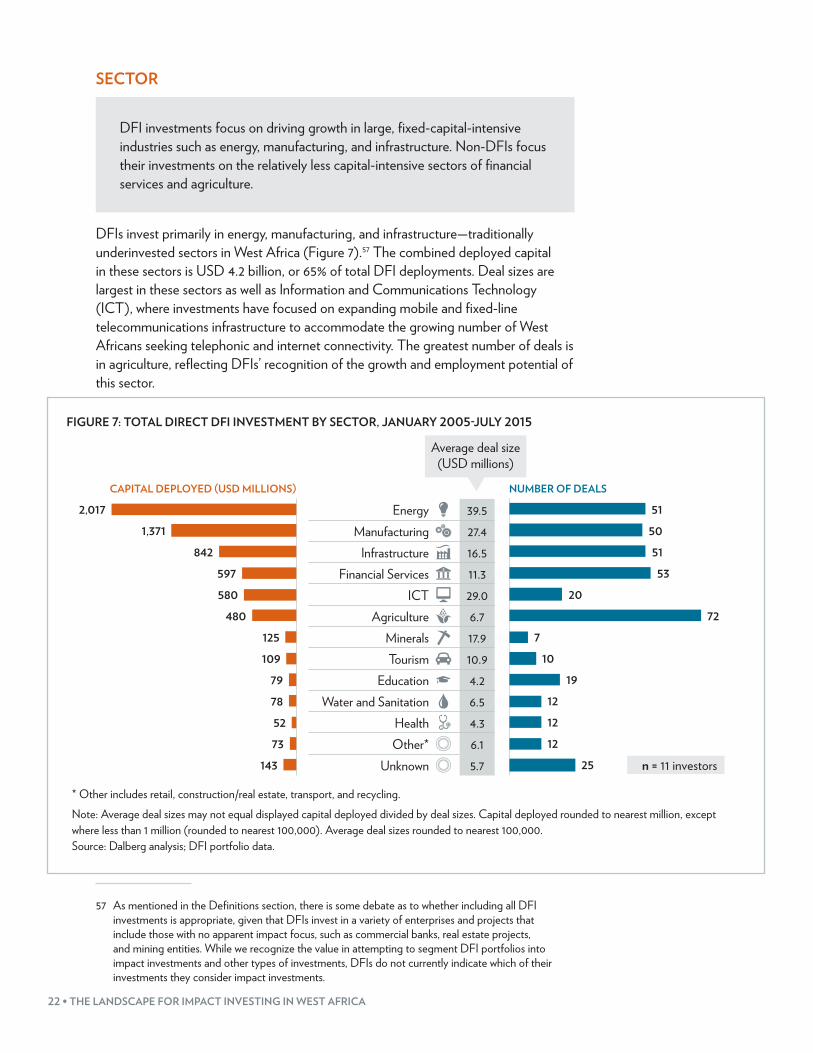
SECTOR
DFI investments focus on driving growth in large, fixed-capital-intensive industries such as energy, manufacturing, and infrastructure. Non-DFIs focus their investments on the relatively less capital-intensive sectors of financial services and agriculture.
DFIs invest primarily in energy, manufacturing, and infrastructure—traditionally underinvested sectors in West Africa (Figure 7).57 The combined deployed capital in these sectors is USD 4.2 billion, or 65% of total DFI deployments. Deal sizes are largest in these sectors as well as Information and Communications Technology (ICT), where investments have focused on expanding mobile and fixed-line telecommunications infrastructure to accommodate the growing number of West Africans seeking telephonic and internet connectivity. The greatest number of deals is in agriculture, reflecting DFIs’ recognition of the growth and employment potential of this sector.
FIGURE 7: TOTAL DIRECT DFI INVESTMENT BY SECTOR, JANUARY 2005-JULY 2015
CAPITAL DEPLOYED (USD MILLIONS) NUMBER OF DEALS
Energy 39.5Manufacturing 27.4
Infrastructure 16.5Financial Services 11.3
ICT 29.0Agriculture 6.7
Minerals 17.9Tourism 10.9
Education 4.2Water and Sanitation 6.5
Health 4.3Other* 6.1
Unknown 5.7
Average deal size (USD millions)
51
51
53
20
7
10
19
12
12
12
25
72
50
2,017
1,371
842
597
580
480
125
109
79
78
52
73
143 n = 11 investors
* Other includes retail, construction/real estate, transport, and recycling.Note: Average deal sizes may not equal displayed capital deployed divided by deal sizes. Capital deployed rounded to nearest million, except where less than 1 million (rounded to nearest 100,000). Average deal sizes rounded to nearest 100,000. Source: Dalberg analysis; DFI portfolio data.
57 As mentioned in the Definitions section, there is some debate as to whether including all DFI investments is appropriate, given that DFIs invest in a variety of enterprises and projects that include those with no apparent impact focus, such as commercial banks, real estate projects, and mining entities. While we recognize the value in attempting to segment DFI portfolios into impact investments and other types of investments, DFIs do not currently indicate which of their investments they consider impact investments.
REGIONAL OVERVIEW • 23
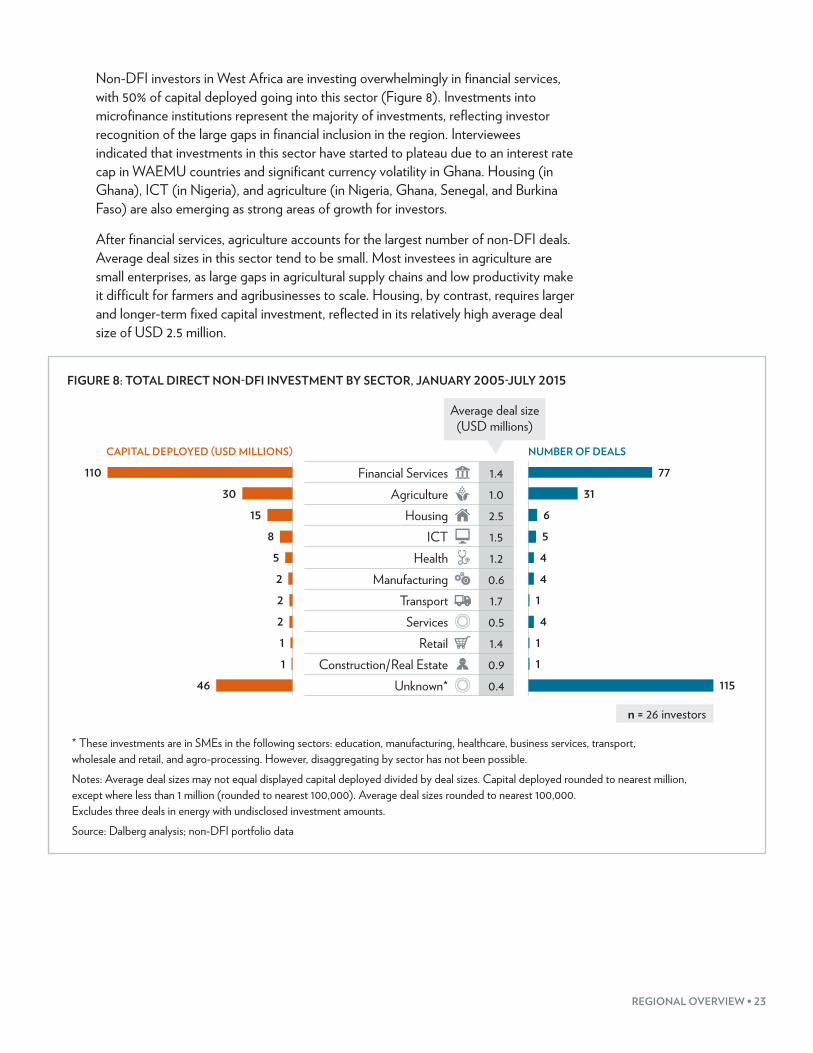
Non-DFI investors in West Africa are investing overwhelmingly in financial services, with 50% of capital deployed going into this sector (Figure 8). Investments into microfinance institutions represent the majority of investments, reflecting investor recognition of the large gaps in financial inclusion in the region. Interviewees indicated that investments in this sector have started to plateau due to an interest rate cap in WAEMU countries and significant currency volatility in Ghana. Housing (in Ghana), ICT (in Nigeria), and agriculture (in Nigeria, Ghana, Senegal, and Burkina Faso) are also emerging as strong areas of growth for investors.
After financial services, agriculture accounts for the largest number of non-DFI deals. Average deal sizes in this sector tend to be small. Most investees in agriculture are small enterprises, as large gaps in agricultural supply chains and low productivity make it difficult for farmers and agribusinesses to scale. Housing, by contrast, requires larger and longer-term fixed capital investment, reflected in its relatively high average deal size of USD 2.5 million.
FIGURE 8: TOTAL DIRECT NON-DFI INVESTMENT BY SECTOR, JANUARY 2005-JULY 2015
CAPITAL DEPLOYED (USD MILLIONS) NUMBER OF DEALS
Financial Services 1.4Agriculture 1.0
Housing 2.5ICT 1.5
Health 1.2Manufacturing 0.6
Transport 1.7Services 0.5
Retail 1.4Construction/Real Estate 0.9
Unknown* 0.4
Average deal size (USD millions)
n = 26 investors
110
30
15
8
5
2
2
2
1
1
46
77
31
6
5
4
4
1
4
1
1
115
* These investments are in SMEs in the following sectors: education, manufacturing, healthcare, business services, transport, wholesale and retail, and agro-processing. However, disaggregating by sector has not been possible.Notes: Average deal sizes may not equal displayed capital deployed divided by deal sizes. Capital deployed rounded to nearest million, except where less than 1 million (rounded to nearest 100,000). Average deal sizes rounded to nearest 100,000. Excludes three deals in energy with undisclosed investment amounts.Source: Dalberg analysis; non-DFI portfolio data
24 • THE LANDSCAPE FOR IMPACT INVESTING IN WEST AFRICA
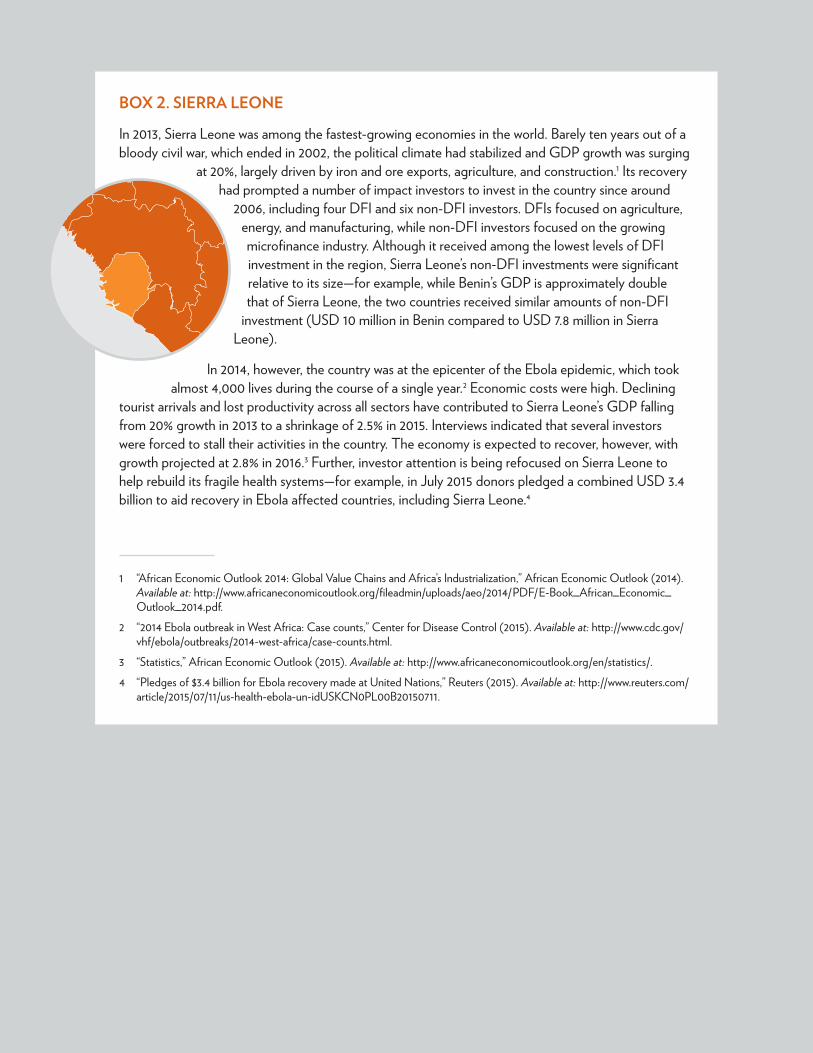
BOX 2. SIERRA LEONE
In 2013, Sierra Leone was among the fastest-growing economies in the world. Barely ten years out of a bloody civil war, which ended in 2002, the political climate had stabilized and GDP growth was surging
at 20%, largely driven by iron and ore exports, agriculture, and construction.1 Its recovery had prompted a number of impact investors to invest in the country since around
2006, including four DFI and six non-DFI investors. DFIs focused on agriculture, energy, and manufacturing, while non-DFI investors focused on the growing microfinance industry. Although it received among the lowest levels of DFI investment in the region, Sierra Leone’s non-DFI investments were significant relative to its size—for example, while Benin’s GDP is approximately double that of Sierra Leone, the two countries received similar amounts of non-DFI
investment (USD 10 million in Benin compared to USD 7.8 million in Sierra Leone).
In 2014, however, the country was at the epicenter of the Ebola epidemic, which took almost 4,000 lives during the course of a single year.2 Economic costs were high. Declining
tourist arrivals and lost productivity across all sectors have contributed to Sierra Leone’s GDP falling from 20% growth in 2013 to a shrinkage of 2.5% in 2015. Interviews indicated that several investors were forced to stall their activities in the country. The economy is expected to recover, however, with growth projected at 2.8% in 2016.3 Further, investor attention is being refocused on Sierra Leone to help rebuild its fragile health systems—for example, in July 2015 donors pledged a combined USD 3.4 billion to aid recovery in Ebola affected countries, including Sierra Leone.4
1 “African Economic Outlook 2014: Global Value Chains and Africa’s Industrialization,” African Economic Outlook (2014). Available at: http://www.africaneconomicoutlook.org/fileadmin/uploads/aeo/2014/PDF/E-Book_African_Economic_Outlook_2014.pdf.
2 “2014 Ebola outbreak in West Africa: Case counts,” Center for Disease Control (2015). Available at: http://www.cdc.gov/vhf/ebola/outbreaks/2014-west-africa/case-counts.html.
3 “Statistics,” African Economic Outlook (2015). Available at: http://www.africaneconomicoutlook.org/en/statistics/.4 “Pledges of $3.4 billion for Ebola recovery made at United Nations,” Reuters (2015). Available at: http://www.reuters.com/
article/2015/07/11/us-health-ebola-un-idUSKCN0PL00B20150711.
REGIONAL OVERVIEW • 25
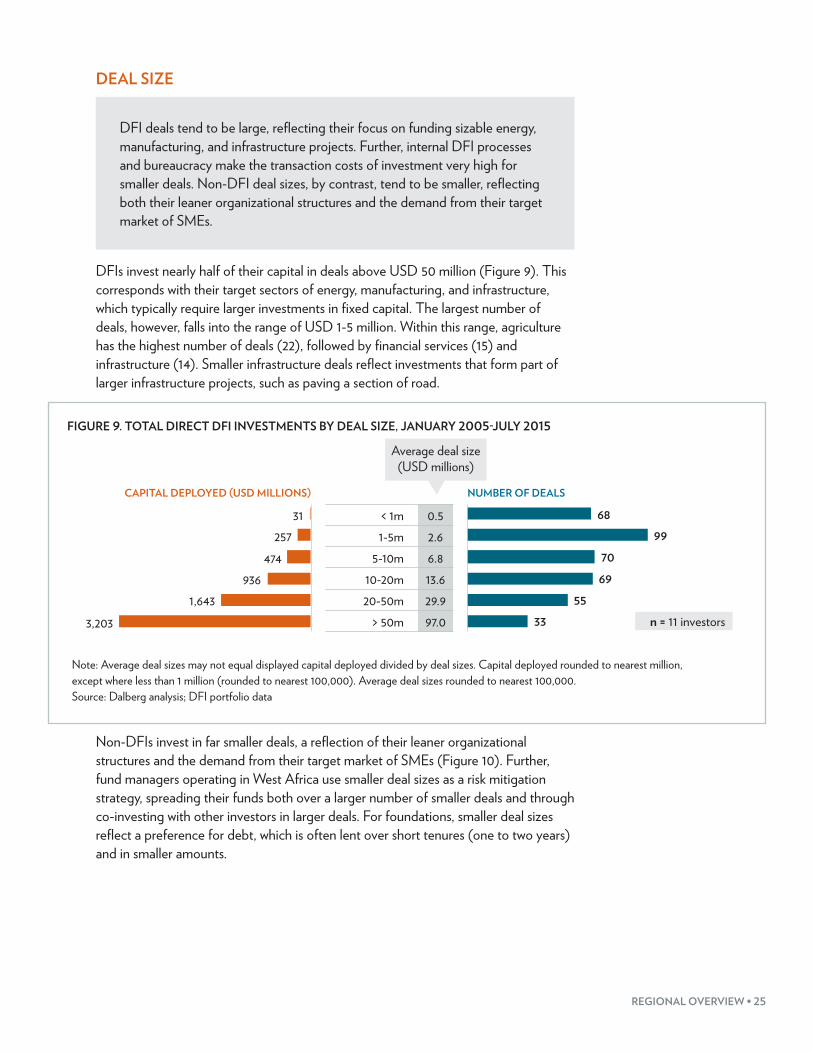
DEAL SIZE
DFI deals tend to be large, reflecting their focus on funding sizable energy, manufacturing, and infrastructure projects. Further, internal DFI processes and bureaucracy make the transaction costs of investment very high for smaller deals. Non-DFI deal sizes, by contrast, tend to be smaller, reflecting both their leaner organizational structures and the demand from their target market of SMEs.
DFIs invest nearly half of their capital in deals above USD 50 million (Figure 9). This corresponds with their target sectors of energy, manufacturing, and infrastructure, which typically require larger investments in fixed capital. The largest number of deals, however, falls into the range of USD 1-5 million. Within this range, agriculture has the highest number of deals (22), followed by financial services (15) and infrastructure (14). Smaller infrastructure deals reflect investments that form part of larger infrastructure projects, such as paving a section of road.
FIGURE 9. TOTAL DIRECT DFI INVESTMENTS BY DEAL SIZE, JANUARY 2005-JULY 2015
CAPITAL DEPLOYED (USD MILLIONS) NUMBER OF DEALS
< 1m 0.51-5m 2.6
5-10m 6.810-20m 13.620-50m 29.9
> 50m 97.0
68
99
70
69
55
33
31257
474936
1,6433,203
Average deal size (USD millions)
n = 11 investors
Note: Average deal sizes may not equal displayed capital deployed divided by deal sizes. Capital deployed rounded to nearest million, except where less than 1 million (rounded to nearest 100,000). Average deal sizes rounded to nearest 100,000. Source: Dalberg analysis; DFI portfolio data
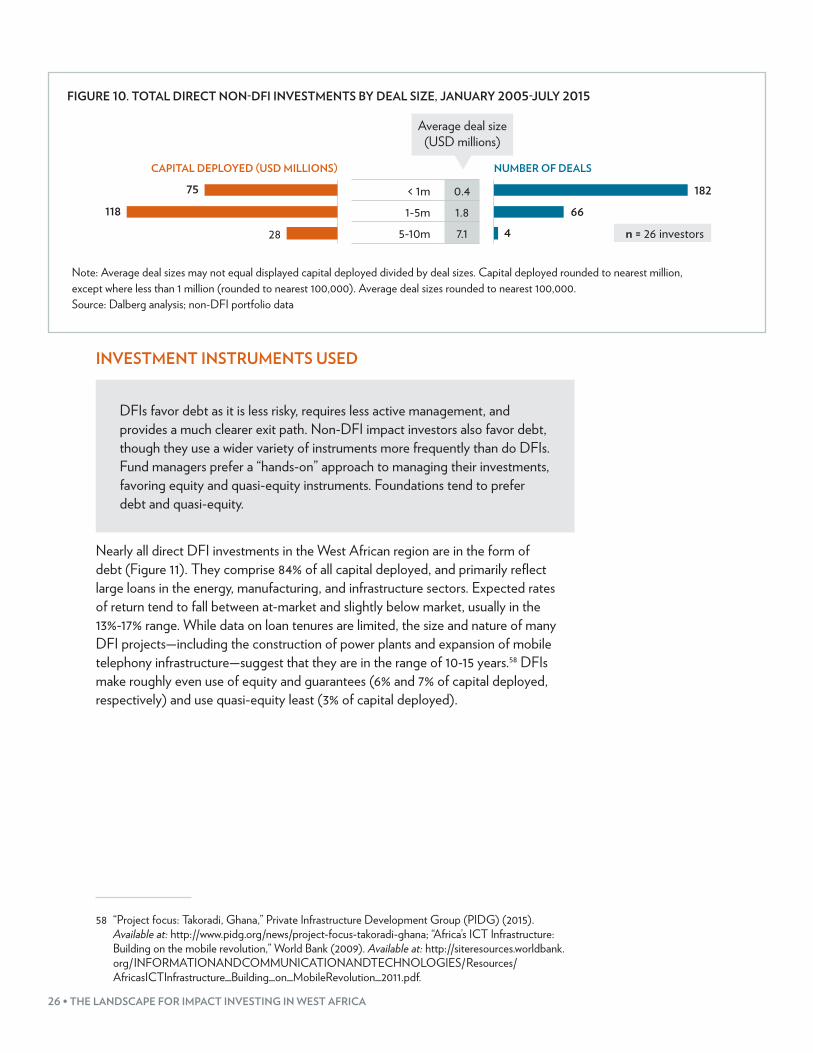
Non-DFIs invest in far smaller deals, a reflection of their leaner organizational structures and the demand from their target market of SMEs (Figure 10). Further, fund managers operating in West Africa use smaller deal sizes as a risk mitigation strategy, spreading their funds both over a larger number of smaller deals and through co-investing with other investors in larger deals. For foundations, smaller deal sizes reflect a preference for debt, which is often lent over short tenures (one to two years) and in smaller amounts.
26 • THE LANDSCAPE FOR IMPACT INVESTING IN WEST AFRICA
FIGURE 10. TOTAL DIRECT NON-DFI INVESTMENTS BY DEAL SIZE, JANUARY 2005-JULY 2015
CAPITAL DEPLOYED (USD MILLIONS) NUMBER OF DEALS
< 1m 0.41-5m 1.8
5-10m 7.1
182
66
4
75
118
28
Average deal size (USD millions)
n = 26 investors
Note: Average deal sizes may not equal displayed capital deployed divided by deal sizes. Capital deployed rounded to nearest million, except where less than 1 million (rounded to nearest 100,000). Average deal sizes rounded to nearest 100,000. Source: Dalberg analysis; non-DFI portfolio data
INVESTMENT INSTRUMENTS USED
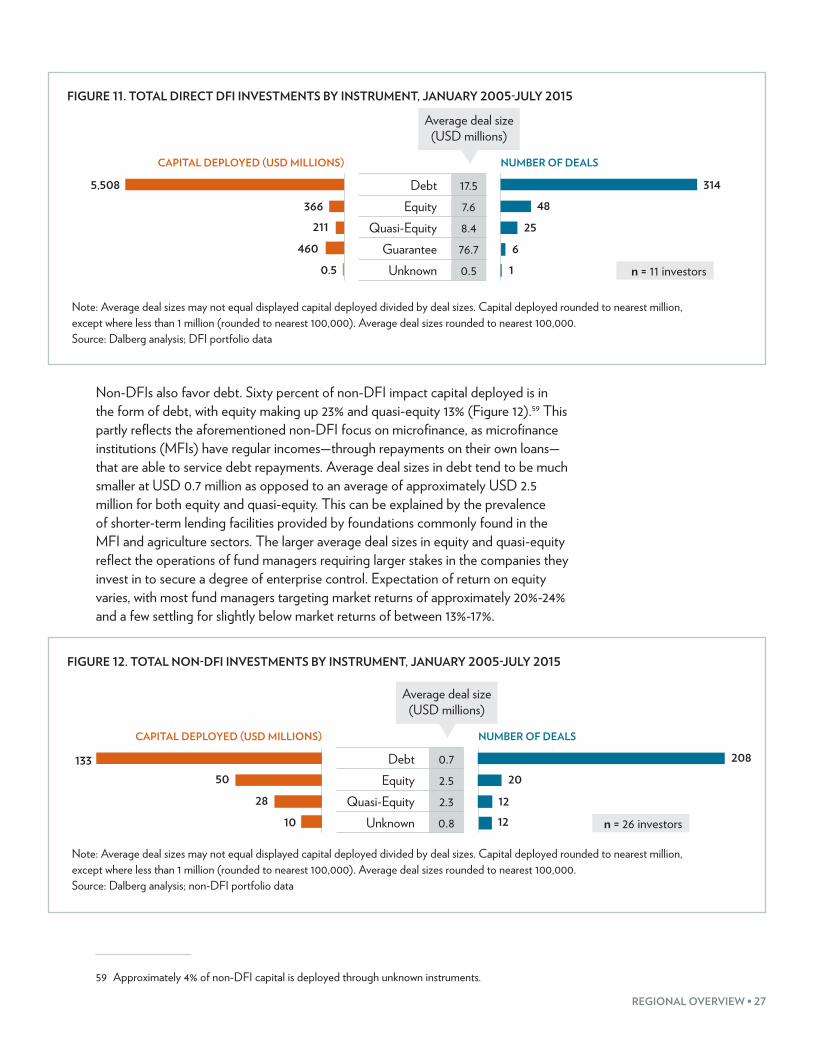
DFIs favor debt as it is less risky, requires less active management, and provides a much clearer exit path. Non-DFI impact investors also favor debt, though they use a wider variety of instruments more frequently than do DFIs. Fund managers prefer a “hands-on” approach to managing their investments, favoring equity and quasi-equity instruments. Foundations tend to prefer debt and quasi-equity.
Nearly all direct DFI investments in the West African region are in the form of debt (Figure 11). They comprise 84% of all capital deployed, and primarily reflect large loans in the energy, manufacturing, and infrastructure sectors. Expected rates of return tend to fall between at-market and slightly below market, usually in the 13%-17% range. While data on loan tenures are limited, the size and nature of many DFI projects—including the construction of power plants and expansion of mobile telephony infrastructure—suggest that they are in the range of 10-15 years.58 DFIs make roughly even use of equity and guarantees (6% and 7% of capital deployed, respectively) and use quasi-equity least (3% of capital deployed).
58 “Project focus: Takoradi, Ghana,” Private Infrastructure Development Group (PIDG) (2015). Available at: http://www.pidg.org/news/project-focus-takoradi-ghana; “Africa’s ICT Infrastructure: Building on the mobile revolution,” World Bank (2009). Available at: http://siteresources.worldbank.org/INFORMATIONANDCOMMUNICATIONANDTECHNOLOGIES/Resources/AfricasICTInfrastructure_Building_on_MobileRevolution_2011.pdf.
REGIONAL OVERVIEW • 27
FIGURE 11. TOTAL DIRECT DFI INVESTMENTS BY INSTRUMENT, JANUARY 2005-JULY 2015
CAPITAL DEPLOYED (USD MILLIONS) NUMBER OF DEALS
Debt 17.5Equity 7.6
Quasi-Equity 8.4Guarantee 76.7
Unknown 0.5
314
48
25
6
1
5,508
366
211
460
0.5
Average deal size (USD millions)
n = 11 investors
Note: Average deal sizes may not equal displayed capital deployed divided by deal sizes. Capital deployed rounded to nearest million, except where less than 1 million (rounded to nearest 100,000). Average deal sizes rounded to nearest 100,000. Source: Dalberg analysis; DFI portfolio data
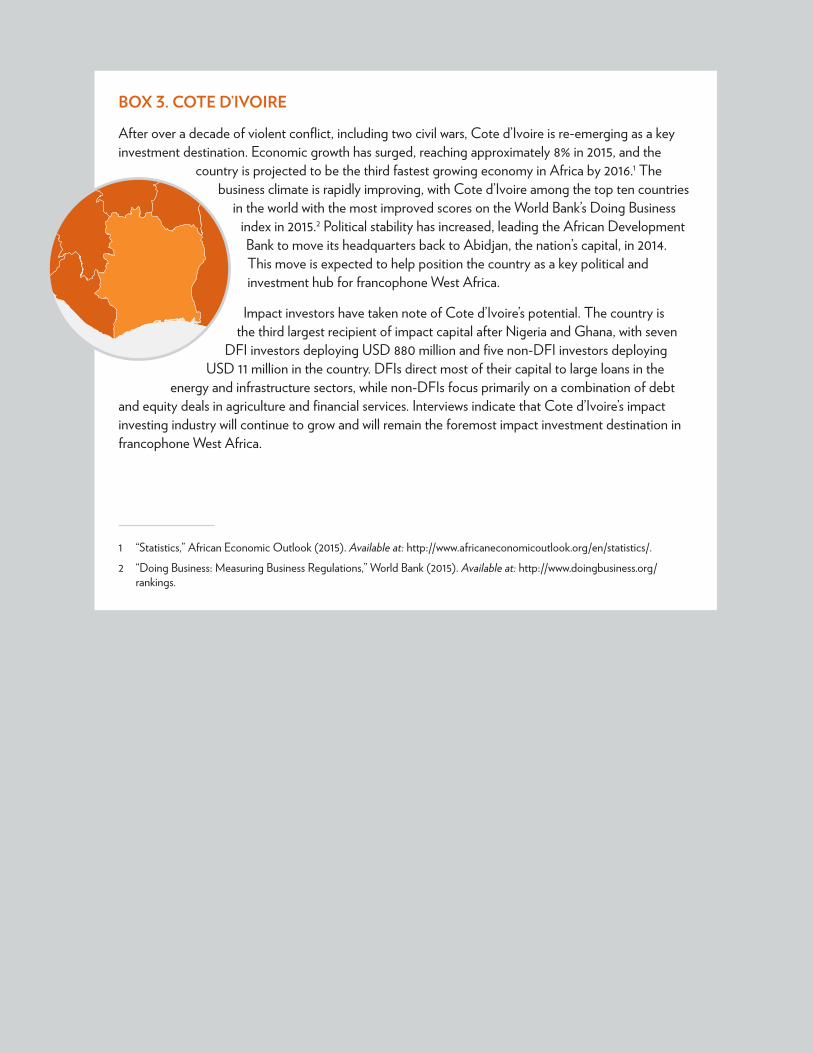
Non-DFIs also favor debt. Sixty percent of non-DFI impact capital deployed is in the form of debt, with equity making up 23% and quasi-equity 13% (Figure 12).59 This partly reflects the aforementioned non-DFI focus on microfinance, as microfinance institutions (MFIs) have regular incomes—through repayments on their own loans—that are able to service debt repayments. Average deal sizes in debt tend to be much smaller at USD 0.7 million as opposed to an average of approximately USD 2.5 million for both equity and quasi-equity. This can be explained by the prevalence of shorter-term lending facilities provided by foundations commonly found in the MFI and agriculture sectors. The larger average deal sizes in equity and quasi-equity reflect the operations of fund managers requiring larger stakes in the companies they invest in to secure a degree of enterprise control. Expectation of return on equity varies, with most fund managers targeting market returns of approximately 20%-24% and a few settling for slightly below market returns of between 13%-17%.
FIGURE 12. TOTAL NON-DFI INVESTMENTS BY INSTRUMENT, JANUARY 2005-JULY 2015
CAPITAL DEPLOYED (USD MILLIONS) NUMBER OF DEALS
Debt 0.7Equity 2.5
Quasi-Equity 2.3Unknown 0.8
208
20
12
12
13350
28
10
Average deal size (USD millions)
n = 26 investors
Note: Average deal sizes may not equal displayed capital deployed divided by deal sizes. Capital deployed rounded to nearest million, except where less than 1 million (rounded to nearest 100,000). Average deal sizes rounded to nearest 100,000. Source: Dalberg analysis; non-DFI portfolio data
59 Approximately 4% of non-DFI capital is deployed through unknown instruments.
28 • THE LANDSCAPE FOR IMPACT INVESTING IN WEST AFRICA
BOX 3. COTE D’IVOIRE
After over a decade of violent conflict, including two civil wars, Cote d’Ivoire is re-emerging as a key investment destination. Economic growth has surged, reaching approximately 8% in 2015, and the
country is projected to be the third fastest growing economy in Africa by 2016.1 The business climate is rapidly improving, with Cote d’Ivoire among the top ten countries
in the world with the most improved scores on the World Bank’s Doing Business index in 2015.2 Political stability has increased, leading the African Development Bank to move its headquarters back to Abidjan, the nation’s capital, in 2014. This move is expected to help position the country as a key political and investment hub for francophone West Africa.
Impact investors have taken note of Cote d’Ivoire’s potential. The country is the third largest recipient of impact capital after Nigeria and Ghana, with seven
DFI investors deploying USD 880 million and five non-DFI investors deploying USD 11 million in the country. DFIs direct most of their capital to large loans in the
energy and infrastructure sectors, while non-DFIs focus primarily on a combination of debt and equity deals in agriculture and financial services. Interviews indicate that Cote d’Ivoire’s impact investing industry will continue to grow and will remain the foremost impact investment destination in francophone West Africa.
1 “Statistics,” African Economic Outlook (2015). Available at: http://www.africaneconomicoutlook.org/en/statistics/.2 “Doing Business: Measuring Business Regulations,” World Bank (2015). Available at: http://www.doingbusiness.org/
rankings.
REGIONAL OVERVIEW • 29
In addition to investments made with the expectation of financial return, both DFIs and non-DFI impact investors often included either technical assistance grants or subsidies as a part of their investment strategies, though non-DFIs were more likely to provide technical assistance informally through in-kind business support and guidance than as grants. Technical assistance is provided primarily to build the business systems and governance capacity of target investees, and is seen as a necessary part of investing in the region. In the words of one investor, “If I were to raise an impact investing fund without a technical assistance facility, I probably wouldn’t do it.”
EXITS
There is very limited information available on equity exits—where investor equity stakes in enterprises are sold in order to recoup investment—especially for non-DFI impact investors. While a total of 49 exits from deals worth an original USD 684 million were identified during the course of this study—46 DFI exits worth USD 665 million and 6 non-DFI exits worth USD 19 million—interviewees noted that this is likely to be a significant underestimate. Most DFI exits have taken place in Ghana and Nigeria in the manufacturing and financial services sectors, while non-DFI exits have all taken place in Ghana in the financial services and housing sectors.
INDIRECT INVESTMENTS
Indirect investments occur when investors deploy capital into intermediaries (e.g., fund managers and commercial banks) that then use the capital to invest directly in enterprises or projects. An unknown proportion of indirect investment acts as a source of capital for direct investment. Therefore, to avoid double counting (and due to severe data limitations on the nature of indirect investments), indirect investments have been excluded from the above analysis. Still, given that they account for a significant proportion of investment, especially for DFIs, it is helpful to examine them to the extent that data allow.
Indirect investments made by DFIs amount to USD 3.3 billion and account for 34% of total deployed capital (Figure 13). For non-DFIs, indirect investments amount to USD 29 million, representing 12% of total deployed capital (Figure 14). While data on indirect investments are limited, two trends are apparent:
• DFIs commonly focus indirect investments on commercial banks for the purposes of on-lending to SMEs, as well as on impact fund managers and private equity funds. The focus on commercial banks reflects DFI attempts to strengthen the commercial banking system and enhance its ability to on-lend to underserved customers (like SMEs). The presence of private equity firms in DFI investment portfolios, meanwhile, is partly due to the limited number of impact investment fund managers in the region. It is also due to DFIs’ recognition that, as the African Development Bank puts it, “Active and growing private equity players on the [African] continent will be a significant contributor to its economic and social development.”60
60 “Private equity investments,” African Development Bank (AfDB) (2015). Available at: http://www.afdb.org/en/topics-and-sectors/sectors/private-sector/areas-of-focus/private-equity-investments.
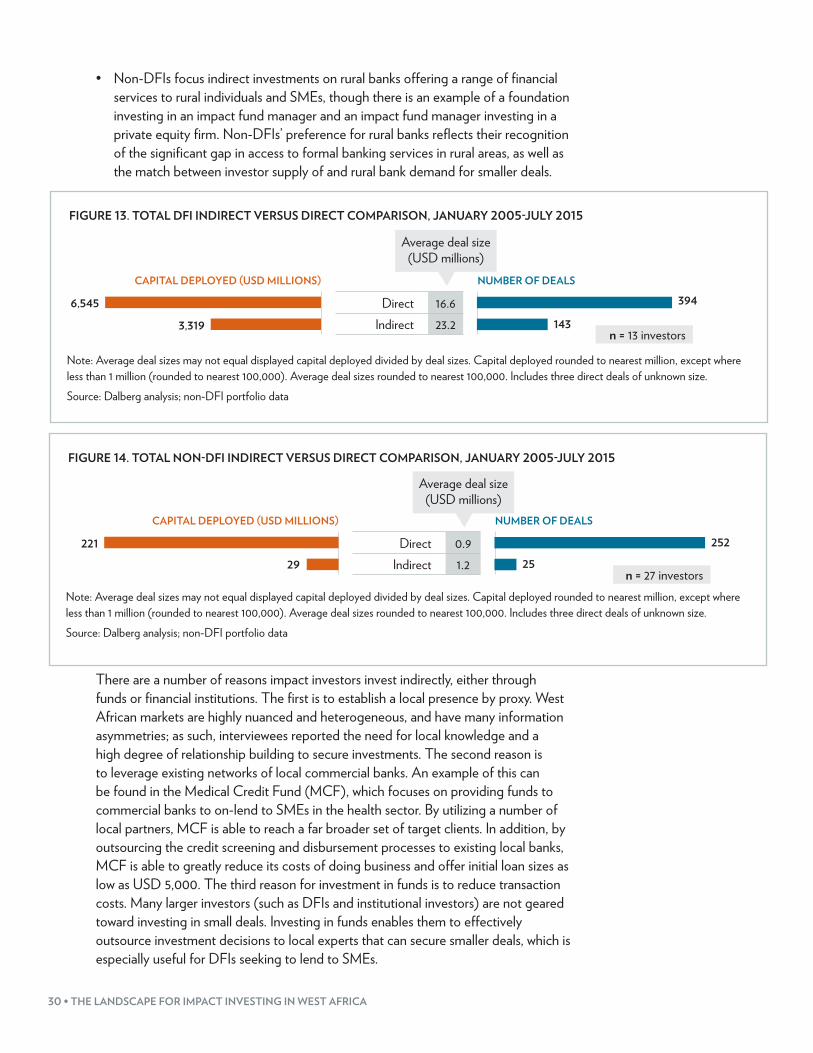
30 • THE LANDSCAPE FOR IMPACT INVESTING IN WEST AFRICA
• Non-DFIs focus indirect investments on rural banks offering a range of financial services to rural individuals and SMEs, though there is an example of a foundation investing in an impact fund manager and an impact fund manager investing in a private equity firm. Non-DFIs’ preference for rural banks reflects their recognition of the significant gap in access to formal banking services in rural areas, as well as the match between investor supply of and rural bank demand for smaller deals.
FIGURE 13. TOTAL DFI INDIRECT VERSUS DIRECT COMPARISON, JANUARY 2005-JULY 2015
CAPITAL DEPLOYED (USD MILLIONS) NUMBER OF DEALS
Direct 16.6Indirect 23.2
394
143
6,545
3,319
Average deal size (USD millions)
n = 13 investors
Note: Average deal sizes may not equal displayed capital deployed divided by deal sizes. Capital deployed rounded to nearest million, except where less than 1 million (rounded to nearest 100,000). Average deal sizes rounded to nearest 100,000. Includes three direct deals of unknown size.Source: Dalberg analysis; non-DFI portfolio data
FIGURE 14. TOTAL NON-DFI INDIRECT VERSUS DIRECT COMPARISON, JANUARY 2005-JULY 2015
CAPITAL DEPLOYED (USD MILLIONS) NUMBER OF DEALS
Direct 0.9Indirect 1.2
252
25
221
29
Average deal size (USD millions)
n = 27 investorsNote: Average deal sizes may not equal displayed capital deployed divided by deal sizes. Capital deployed rounded to nearest million, except where less than 1 million (rounded to nearest 100,000). Average deal sizes rounded to nearest 100,000. Includes three direct deals of unknown size.Source: Dalberg analysis; non-DFI portfolio data
There are a number of reasons impact investors invest indirectly, either through funds or financial institutions. The first is to establish a local presence by proxy. West African markets are highly nuanced and heterogeneous, and have many information asymmetries; as such, interviewees reported the need for local knowledge and a high degree of relationship building to secure investments. The second reason is to leverage existing networks of local commercial banks. An example of this can be found in the Medical Credit Fund (MCF), which focuses on providing funds to commercial banks to on-lend to SMEs in the health sector. By utilizing a number of local partners, MCF is able to reach a far broader set of target clients. In addition, by outsourcing the credit screening and disbursement processes to existing local banks, MCF is able to greatly reduce its costs of doing business and offer initial loan sizes as low as USD 5,000. The third reason for investment in funds is to reduce transaction costs. Many larger investors (such as DFIs and institutional investors) are not geared toward investing in small deals. Investing in funds enables them to effectively outsource investment decisions to local experts that can secure smaller deals, which is especially useful for DFIs seeking to lend to SMEs.
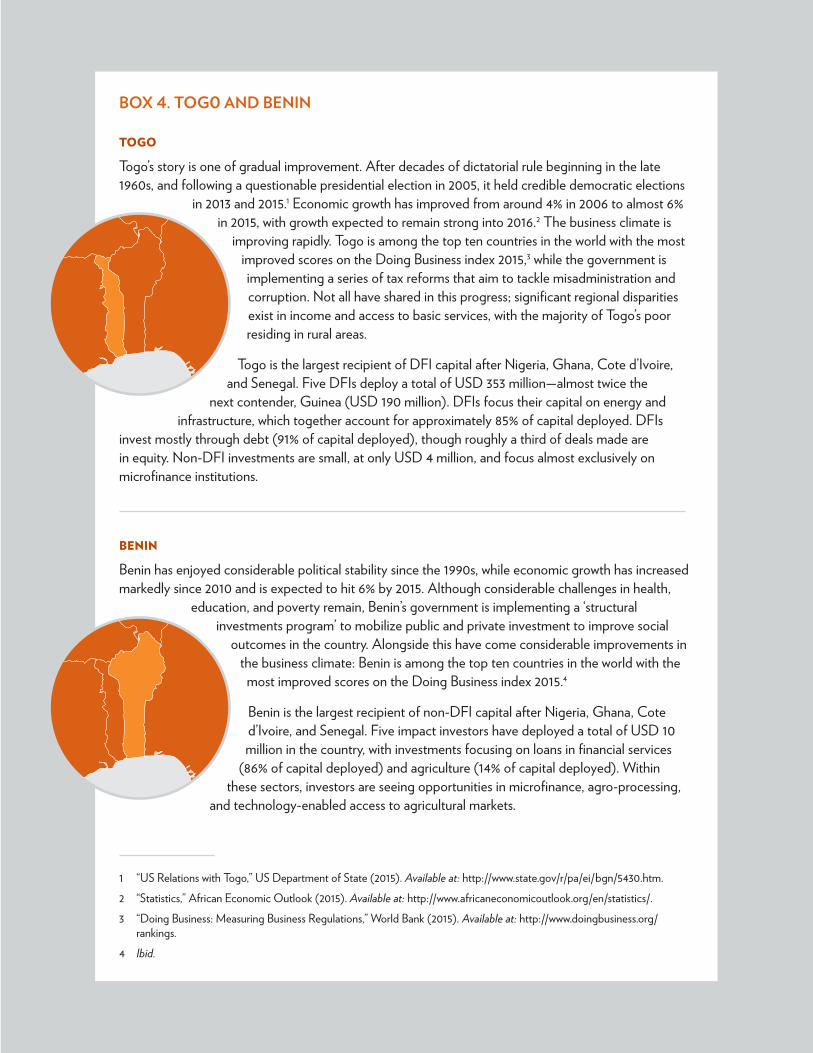
REGIONAL OVERVIEW • 31
BOX 4. TOG0 AND BENIN
TOGO
Togo’s story is one of gradual improvement. After decades of dictatorial rule beginning in the late 1960s, and following a questionable presidential election in 2005, it held credible democratic elections
in 2013 and 2015.1 Economic growth has improved from around 4% in 2006 to almost 6% in 2015, with growth expected to remain strong into 2016.2 The business climate is
improving rapidly. Togo is among the top ten countries in the world with the most improved scores on the Doing Business index 2015,3 while the government is implementing a series of tax reforms that aim to tackle misadministration and corruption. Not all have shared in this progress; significant regional disparities exist in income and access to basic services, with the majority of Togo’s poor residing in rural areas.
Togo is the largest recipient of DFI capital after Nigeria, Ghana, Cote d’Ivoire, and Senegal. Five DFIs deploy a total of USD 353 million—almost twice the
next contender, Guinea (USD 190 million). DFIs focus their capital on energy and infrastructure, which together account for approximately 85% of capital deployed. DFIs
invest mostly through debt (91% of capital deployed), though roughly a third of deals made are in equity. Non-DFI investments are small, at only USD 4 million, and focus almost exclusively on microfinance institutions.
BENIN
Benin has enjoyed considerable political stability since the 1990s, while economic growth has increased markedly since 2010 and is expected to hit 6% by 2015. Although considerable challenges in health,
education, and poverty remain, Benin’s government is implementing a ‘structural investments program’ to mobilize public and private investment to improve social
outcomes in the country. Alongside this have come considerable improvements in the business climate: Benin is among the top ten countries in the world with the
most improved scores on the Doing Business index 2015.4
Benin is the largest recipient of non-DFI capital after Nigeria, Ghana, Cote d’Ivoire, and Senegal. Five impact investors have deployed a total of USD 10 million in the country, with investments focusing on loans in financial services
(86% of capital deployed) and agriculture (14% of capital deployed). Within these sectors, investors are seeing opportunities in microfinance, agro-processing,
and technology-enabled access to agricultural markets.
1 “US Relations with Togo,” US Department of State (2015). Available at: http://www.state.gov/r/pa/ei/bgn/5430.htm.2 “Statistics,” African Economic Outlook (2015). Available at: http://www.africaneconomicoutlook.org/en/statistics/.3 “Doing Business: Measuring Business Regulations,” World Bank (2015). Available at: http://www.doingbusiness.org/
rankings.4 Ibid.
32 • THE LANDSCAPE FOR IMPACT INVESTING IN WEST AFRICA
Main Barriers and Opportunities in Deploying Impact Capital
MAIN PERCEIVED BARRIERS FOR DEPLOYING IMPACT CAPITAL
West Africa poses significant challenges for investors looking to deploy capital. The industry is nascent, with few impact investors operating at scale in the region. Major barriers include the following:
• Investment readiness of target investees. Numerous interviewees listed a lack of investment readiness among enterprises as a crucial constraint to investment. This includes several elements. First, governance and management skills are lacking. For example, interviewees reported observing the appointment of relatives of entrepreneurs to board and senior management positions rather than appropriately trained and skilled personnel. It is also difficult to source adequately skilled personnel, which leads to gaps in management. Second, enterprises lack robust business systems related to financial, human resource, and operational management, which makes it difficult for investors to gauge their profitability or sustainability. These shortcomings are more prevalent in smaller SMEs and in rural areas, and therefore impact investors targeting underserved rural communities face the largest gaps. Third, many enterprises are resistant to change, and are reluctant to alter their structures and practices to what they see as artificially imposed standards of investors.
• Difficulty sourcing capital. Relative to global standards, West Africa is characterized by shallow capital markets and low levels of domestic financing. Local fund managers reported raising domestic capital to be a significant challenge to their operations. Instead, they rely almost solely on foreign capital from DFIs and foundations, which can be more difficult to identify given that several international funders have no presence in the region (as discussed above). In addition, obtaining working capital funding from commercial banks was reported to be a challenge for their investees, even with strengthened balance sheets post-investment.
• Difficulty exiting equity investments. As is typical of frontier and emerging markets with shallow financial markets, exits remain an issue for equity and quasi-equity investors. Very few examples of successful equity investment exits were found during the course of this study, with the notable exception of ExpressLife in Ghana, which Leapfrog Investments sold to Prudential in 2013. As there are no secondary markets61 in most of West Africa, alternative solutions have been explored. In addition to management buyouts, interviewees were experimenting with royalty- or fee-based arrangements, where enterprises would pay either a percentage of annual revenue (royalty) or a set annual fee in return for investment.
61 Secondary markets involve the trading of existing investments into a given enterprise.
REGIONAL OVERVIEW • 33
• Macroeconomic and political instability. West Africa has been subject to considerable economic and political instability over the last several decades. While much progress has been made and substantial political stability achieved, several issues remain. First, currency volatility, particularly in Ghana, has increased uncertainty. A tension has emerged between international investors’ preference to lend in US dollars or euros and enterprises’ desire for local currency funding to avoid devaluation and currency risks. Second, security issues remain a concern for investors, notably in Nigeria due to the ongoing conflict with Boko Haram in the country’s northern regions. Last, fragility in post-epidemic economies poses challenges. As mentioned, the aftermath of the Ebola epidemic has had major effects on commerce in the region, significantly affecting the post-conflict countries of Sierra Leone and Liberia.
• Unpredictable regulation. For the most part, interviewees cited few serious regulatory barriers to investment in the region. Instead of prohibitive regulation, interviewees were more concerned about a general lack of clear, up-to-date legislation and about the difficulties in predicting policy direction. Liberia is characterized by competing political factions espousing different policies, while interviewees complained of Sierra Leone’s outdated commercial laws from the 1960s, which lack alignment with modern business practices. Interviewees did, however, cite sector-specific regulatory barriers, particularly in reference to the microfinance industry in francophone West Africa. MFIs in this area are regulated like formal banks, placing onerous conditions on them and curbing industry growth. Further, the Central Bank of West Africa States (BCEAO) decreased the WAEMU interest rate cap from 27% to 24% in 2014. While restricting exploitative lending behavior, this cap also places strain on MFIs lending in high-risk, often rural areas.
• Perception challenges. Some locally based fund managers resisted the association with the term “impact investor,” even though their funds complied with our criteria of intention to create impact and a commitment to measuring such impact. This was largely due to a perception that impact investment implies low financial returns,62 and is not significantly different from philanthropy. With skepticism currently surrounding new investment platforms—pension funds in the region are reluctant to invest in private equity, for example, partly due to a lack of understanding and trust in its potential and aims63—impact investing is struggling to gain credibility. Notably, a number of regional non-DFI actors expressed concern that the expectation that impact investing will achieve market and above-market returns, which has been fostered in the industry, is further eroding trust. These actors felt that experiences of high returns from impact investing were heavily context specific and, given the challenges and high transaction costs associated with investing in the region, should not be expected as typical.
62 A recent study released by the GIIN and Cambridge Associates showed financial returns of 51 private equity impact investing funds to be largely in line with a comparative universe of private equity funds with no impact intent. See the report at: http://www.thegiin.org/knowledge/publication/introducing-the-impact-investing-benchmark.
63 “Pension Funds and Private Equity: Unlocking Africa’s Potential,” Emerging Markets Private Equity Association (EMPEA) (2014). Available at: http://empea.org/newsroom/empea-news/pension-funds-and-private-equity-unlocking-africas-potential.
34 • THE LANDSCAPE FOR IMPACT INVESTING IN WEST AFRICA
MAIN PERCEIVED OPPORTUNITIES FOR DEPLOYING IMPACT CAPITAL
Despite these challenges, interviewees identified several opportunities for the growth and expansion of impact investing in West Africa. Specific perceived opportunities include the following:
• Key sectors: energy, financial services, and agriculture. As market failures in the provision of public goods, utilities, and financial access remain in the region, there are many opportunities for intervention by impact investors. Energy will remain a key focus for both DFIs and non-DFIs, with DFIs focusing on large projects underpinning national electrification and non-DFIs keenly interested in smaller scale, off-grid energy solutions. Investors are also becoming increasingly interested in innovative combinations of technology and financial services (‘FinTech’) such as mobile money. They are also interested in expanding ‘micro’ offerings into areas beyond microfinance—for example, micro-insurance that protects smallholder farmers against crop failure. Finally, agriculture remains a large, underexploited opportunity in the minds of investors. West Africa has large tracts of land available for agricultural production, but suffers major gaps in agricultural productivity. Agro-processing, in particular, is seen as a key opportunity to introduce mechanization and scale to the sector and broaden access to both domestic and international markets.
• Geographies: Nigeria, Cote d’Ivoire, Senegal, Liberia, and Sierra Leone. Nigeria remains a “sleeping giant” for investors that, though difficult to understand and work in, has potential for both impact and financial return that is unsurpassed on the continent. Paradoxically, and as mentioned, post-Ebola countries are expected to attract an increasing share of capital as development agencies seek to utilize impact investing in their toolkits for rebuilding healthcare, telecommunications, and governance infrastructure. While macroeconomic challenges in Ghana remain a concern for investors, Senegal and Cote d’Ivoire are increasingly receiving attention due to their improving fundamentals and strong growth. The African Development Bank returned to its headquarters in Abidjan, Cote d’Ivoire in 2014; its presence is expected to play a major role in increasing investor confidence and catalyzing development activity in that country.
• Linking local and foreign actors. Expanding partnerships between local and foreign actors will be key to growing impact investing in West Africa. For foreign enterprises, partnerships with local enterprises can unlock foreign capital. For example, Broad Cove is acting as a US partner to local organizations in Ghana and Liberia to access Overseas Private Investment Corporation (OPIC) funding. For foreign investors, partnerships with local investors can expand the reach of impact investments and lower transaction costs associated with sourcing deals (as discussed in the “Indirect Investments” section above).
• Blended capital. The tactical provision of blended capital—the complementary use of subsidized and market-rate-seeking funding—can crowd in private investment by reducing the high risks associated with fragile and frontier markets. Foundations that seek below-market returns can partner with investors seeking market-rate returns, for example, and use their lower return expectations to
REGIONAL OVERVIEW • 35
incentivize more commercially minded investors to engage in deals they otherwise would have deemed overly risky. Further, blended capital can help to grow the supply of impact investing fund managers by supporting the costs of management fees. Interviewees noted that funds are generally not viable until they pass the USD 60-70 million mark, yet fund managers struggle to raise funding, as previously mentioned. Raising smaller funds, meanwhile, places pressure on fund managers charging a 2% management fee, and raising the management fee risks pushback from investors. Grant funding from foundations to cover management costs can bridge this gap and catalyze the formation of smaller funds.
IMPACT MEASUREMENT TOOLS AND APPROACHES
For DFIs, impact metrics and measurement frameworks differ widely between actors, but reporting is relatively consistent and conducted through publicly available annual reports. For example, the African Development Bank publishes an Annual Development Effectiveness Review, which summarizes its performance over a number of impact indicators that, since the first Review in 2011, have remained consistent over time.64 DFIs have a preference for gathering impact data from fund managers rather than from enterprises, as this is perceived as considerably simpler.
Non-DFIs vary widely in their approach to measurement and reporting. Large international investors and foundations generally employ robust measuring and reporting. For example, Cordaid provides consistent reporting on its social impact using IRIS,65 the catalogue of standardized metrics managed by the GIIN, while the Medical Credit Fund adheres to the SafeCare66 basic healthcare standards framework, which measures outcomes of the SME health facilities it lends to and allows for comparison across geographies.
In contrast, local fund managers are less consistent, with impact measurement mostly ad hoc and driven by the individual requirements of their investors (e.g., DFIs). The smaller enterprises these fund managers invest in often do not have the capacity to track and report on social in addition to financial metrics, which makes it difficult to collect data. Compounding this, many fund managers lack capacity to collect and aggregate data on the large variety of sectors and enterprises in which they invest. As a result, only a basic set of indicators is usually tracked. Those most commonly cited include number of jobs created, number of clients served, and client incomes.
Improvements have, however, recently been made in non-DFIs’ ability to track and report impact. Investors cited significant advances in management information systems (MIS)—software that aids in the collection, structuring, and reporting of data—over the last five years that are allowing organizations to better track internal metrics, including those on social impact. It is also important to note that some impact investors viewed measurement of social impact as duplicative for investments
64 “Development Effectiveness Reviews,” AfDB (2015). Available at: http://www.afdb.org/en/topics-and-sectors/topics/quality-assurance-results/development-effectiveness-reviews.
65 IRIS is the catalogue of generally accepted metrics managed by the Global Impact Investing Network, available at www.iris.thegiin.org.
66 SafeCare aims to support basic healthcare providers in resource-restricted settings. Available at: http://www.safe-care.org/.
36 • THE LANDSCAPE FOR IMPACT INVESTING IN WEST AFRICA
where impact is inherent to core business activities, such as is the case with—in their opinion—social enterprises, mobile money, and micro-insurance. For such investments, basic tracking of financial indicators was deemed sufficient.
Beyond Impact InvestingMany interviewees noted that, in a region as underdeveloped as West Africa, many commercially minded investors with no stated intention to create social impact could arguably make investments that have impact due to their role in growing local businesses and increasing the flow of capital in the region. Interviewees pointed out that such investment far eclipses non-DFI impact investment. Private equity investment in West Africa, for example, amounted to USD 298 million in 2012 alone—as compared to USD 242 million in Southern Africa67—and is growing rapidly: 84% of all private equity capital invested in the region since 2004 was invested between 2012 and 2014.68
During the course of this study, the research team also encountered several investors that, while falling outside our definition of impact investing due to lack of impact intent and/or measurement, nonetheless can be expected to be driving significant impact in the region. There are several reasons for this. First, they often invest in enterprises that have strong social outcomes. Some, for example, invest in microfinance institutions that can tackle challenges of financial inclusion. Second, they often co-invest with other impact investors. Adlevo Capital, for example, is a co-investor with the Omidyar Network and the Acumen Fund69 in the mobile money operator Paga in Nigeria. Third, they receive investment from impact investors—especially DFIs—that consider them important contributors to building a healthy investment climate in the region.
Available data suggest that the influence of these “peripheral impact investors” is considerable. The deployed capital of just two peripheral investors amounts to USD 138 million, while total non-DFI impact investor capital deployed is USD 221 million (Figure 15). Their investment profile has some overlap with that of non-DFI impact investors. Most investments are in the microfinance and ICT sectors, with quasi-equity the preferred instrument.
67 “East Africa private equity confidence survey,” Deloitte (2015). Available at: http://www2.deloitte.com/content/dam/Deloitte/za/Documents/finance/za_private_equity_confidence_survey_may2015.pdf.
68 Into Africa: the rise of private equity,” Freshfields Bruckhaus Deringer (2014). Available at: http://www.freshfields.com/uploadedFiles/SiteWide/News_Room/News_/01795_MKT_WWW_PE_Growth_In_Africa_INTERACTIVE_AW.PDF.
69 List of investors, Paga (2015). Available at: https://www.mypaga.com/paga-web/customer/static/company/investors.
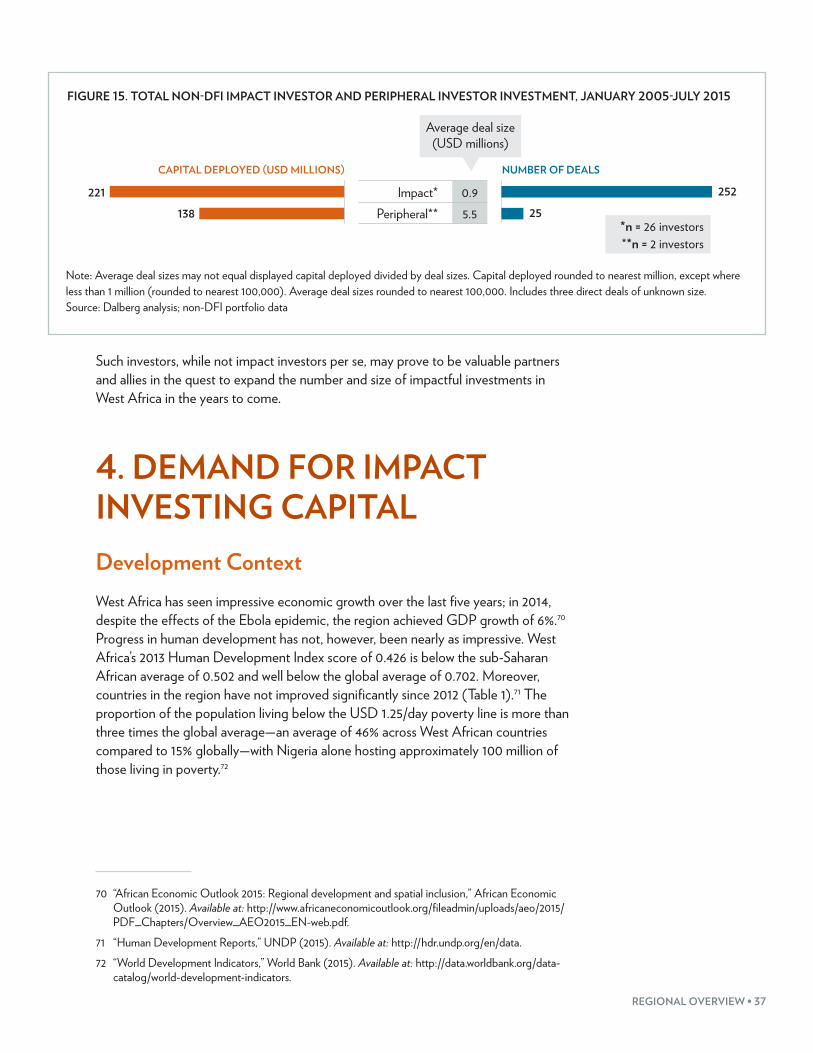
REGIONAL OVERVIEW • 37
FIGURE 15. TOTAL NON-DFI IMPACT INVESTOR AND PERIPHERAL INVESTOR INVESTMENT, JANUARY 2005-JULY 2015
CAPITAL DEPLOYED (USD MILLIONS) NUMBER OF DEALS
Impact* 0.9Peripheral** 5.5
252
25
221
138
Average deal size (USD millions)
*n = 26 investors **n = 2 investors
Note: Average deal sizes may not equal displayed capital deployed divided by deal sizes. Capital deployed rounded to nearest million, except where less than 1 million (rounded to nearest 100,000). Average deal sizes rounded to nearest 100,000. Includes three direct deals of unknown size. Source: Dalberg analysis; non-DFI portfolio data
Such investors, while not impact investors per se, may prove to be valuable partners and allies in the quest to expand the number and size of impactful investments in West Africa in the years to come.
4. DEMAND FOR IMPACT INVESTING CAPITALDevelopment ContextWest Africa has seen impressive economic growth over the last five years; in 2014, despite the effects of the Ebola epidemic, the region achieved GDP growth of 6%.70 Progress in human development has not, however, been nearly as impressive. West Africa’s 2013 Human Development Index score of 0.426 is below the sub-Saharan African average of 0.502 and well below the global average of 0.702. Moreover, countries in the region have not improved significantly since 2012 (Table 1).71 The proportion of the population living below the USD 1.25/day poverty line is more than three times the global average—an average of 46% across West African countries compared to 15% globally—with Nigeria alone hosting approximately 100 million of those living in poverty.72
70 “African Economic Outlook 2015: Regional development and spatial inclusion,” African Economic Outlook (2015). Available at: http://www.africaneconomicoutlook.org/fileadmin/uploads/aeo/2015/PDF_Chapters/Overview_AEO2015_EN-web.pdf.
71 “Human Development Reports,” UNDP (2015). Available at: http://hdr.undp.org/en/data.72 “World Development Indicators,” World Bank (2015). Available at: http://data.worldbank.org/data-
catalog/world-development-indicators.
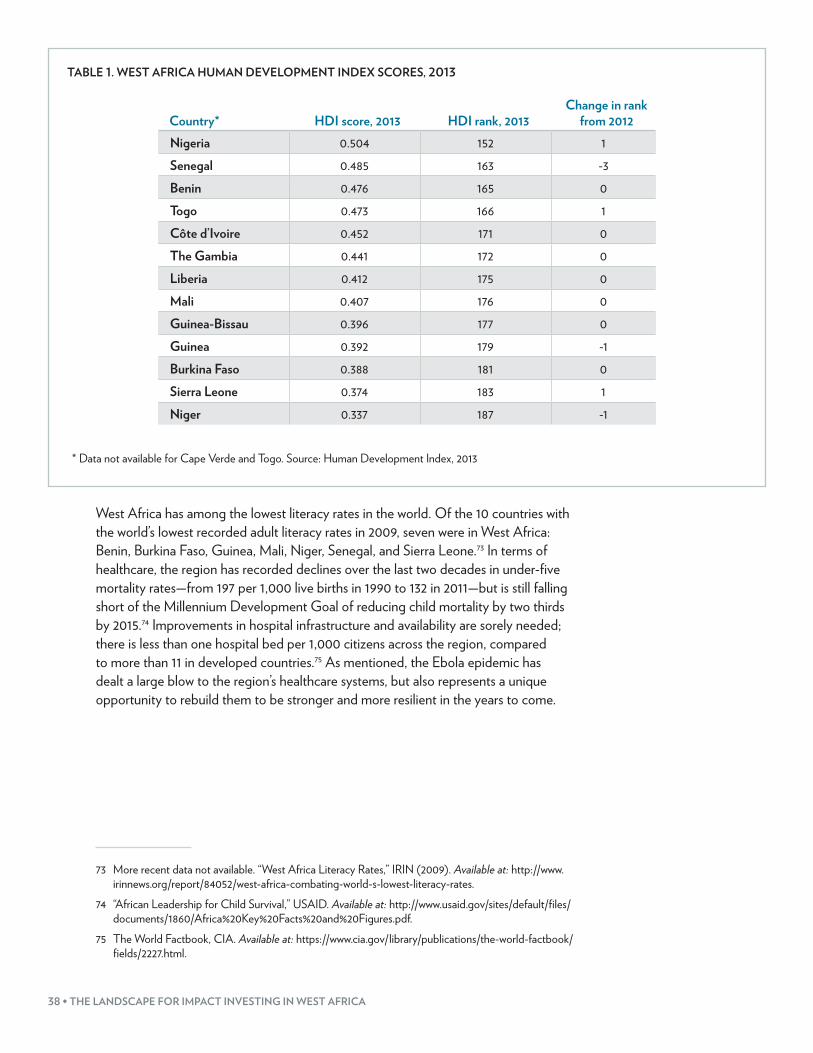
38 • THE LANDSCAPE FOR IMPACT INVESTING IN WEST AFRICA
TABLE 1. WEST AFRICA HUMAN DEVELOPMENT INDEX SCORES, 2013
Country* HDI score, 2013 HDI rank, 2013Change in rank
from 2012Nigeria 0.504 152 1Senegal 0.485 163 -3Benin 0.476 165 0Togo 0.473 166 1Côte d’Ivoire 0.452 171 0The Gambia 0.441 172 0Liberia 0.412 175 0Mali 0.407 176 0Guinea-Bissau 0.396 177 0Guinea 0.392 179 -1Burkina Faso 0.388 181 0Sierra Leone 0.374 183 1Niger 0.337 187 -1
* Data not available for Cape Verde and Togo. Source: Human Development Index, 2013
West Africa has among the lowest literacy rates in the world. Of the 10 countries with the world’s lowest recorded adult literacy rates in 2009, seven were in West Africa: Benin, Burkina Faso, Guinea, Mali, Niger, Senegal, and Sierra Leone.73 In terms of healthcare, the region has recorded declines over the last two decades in under-five mortality rates—from 197 per 1,000 live births in 1990 to 132 in 2011—but is still falling short of the Millennium Development Goal of reducing child mortality by two thirds by 2015.74 Improvements in hospital infrastructure and availability are sorely needed; there is less than one hospital bed per 1,000 citizens across the region, compared to more than 11 in developed countries.75 As mentioned, the Ebola epidemic has dealt a large blow to the region’s healthcare systems, but also represents a unique opportunity to rebuild them to be stronger and more resilient in the years to come.
73 More recent data not available. “West Africa Literacy Rates,” IRIN (2009). Available at: http://www.irinnews.org/report/84052/west-africa-combating-world-s-lowest-literacy-rates.
74 “African Leadership for Child Survival,” USAID. Available at: http://www.usaid.gov/sites/default/files/documents/1860/Africa%20Key%20Facts%20and%20Figures.pdf.
75 The World Factbook, CIA. Available at: https://www.cia.gov/library/publications/the-world-factbook/fields/2227.html.
REGIONAL OVERVIEW • 39
Types and Distribution of Demand ActorsAs mentioned in the Definitions section, this report focuses on two sets of actors in the demand landscape: social enterprises and commercial SMEs. Both sets of actors are potential recipients of impact capital due to their role in creating employment and providing goods and services to underserved populations. Both face significantly greater obstacles to accessing finance and driving growth than do large enterprises. For this reason, they shed light on the main obstacles that stand in the way of channeling impact investment to where it is most needed.
Social enterprises, defined for the purpose of this study as those that both seek to become financially self-sustaining and have an explicit intention to create social/environmental impact, seem ideal targets for impact investment. However, there are few such enterprises in West Africa. Examples identified through interviews include Laiterie du Berger and Nest for All in Senegal, Paga and Andela in Nigeria, Toyola in Ghana (though Toyola also operates in six other West African countries), and Liberty and Justice Apparel in Liberia. A recent landscape of social enterprises in Ghana using a narrower definition of the term (“businesses that exist to address social and environment needs, and focus on reinvesting earnings into the business and/or the community”) identified an additional 24 such enterprises mainly focused on agriculture, education, health, and clean technology.76 The small number of identified social enterprises is partly due to limitations in the available data, but is also related to the fact that the concept of a “social enterprise” is not well known in West Africa. Many enterprises that deliver goods and services similar to social enterprises do not label themselves as such.
Evidence from Ghana indicates that impact investors have yet to play a major role in funding social enterprises. The study mentioned above found that the majority are funded through a combination of donor/foundation grants and contributions from family and friends.77 Interview evidence corroborates this. For example, the founder of an incubator focused on social enterprises in Nigeria remarked that none of the enterprises he had encountered knew what impact investing was, nor that any impact investors existed in the country. Further, a social enterprise founder in Ghana noted that, while he did eventually secure impact investment from an American impact investor, he found this investor only after five years of exploring alternative options: “I was a poor man who wanted to serve poor people and employ poor people to do it... so nobody wanted to give me money.” While well-known and well-publicized social enterprises (e.g., Paga) do attract impact investment, others are either unknown to impact investors or are not considered sufficiently robust to receive investment.
With few social enterprises in the region, commercial SMEs are a large target of impact investment due to their important role in driving economic growth and job creation. In West Africa, SMEs account for approximately 90% of all business and
76 “Social enterprise landscape of Ghana,” Overseas Development Institute (2014). Available at: http://www.britishcouncil.org/sites/britishcouncil.uk2/files/social_enterprise_landscape_in_ghana_report_final.pdf.
77 Ibid.
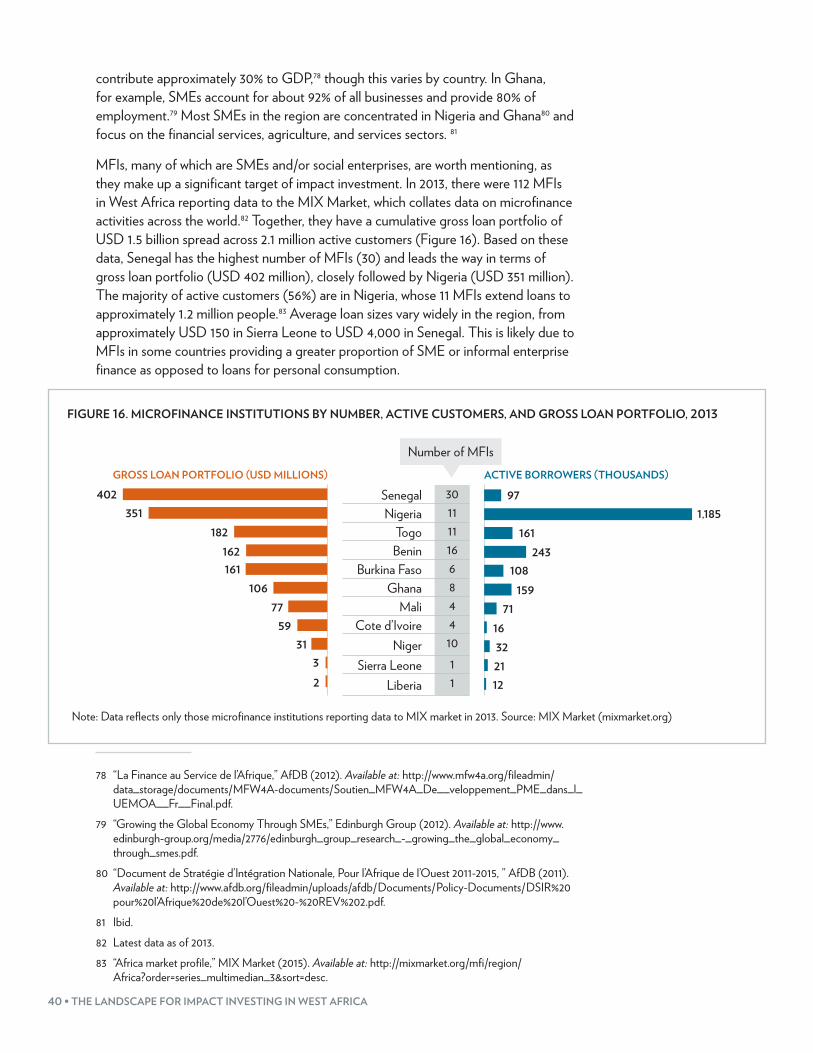
40 • THE LANDSCAPE FOR IMPACT INVESTING IN WEST AFRICA
contribute approximately 30% to GDP,78 though this varies by country. In Ghana, for example, SMEs account for about 92% of all businesses and provide 80% of employment.79 Most SMEs in the region are concentrated in Nigeria and Ghana80 and focus on the financial services, agriculture, and services sectors. 81
MFIs, many of which are SMEs and/or social enterprises, are worth mentioning, as they make up a significant target of impact investment. In 2013, there were 112 MFIs in West Africa reporting data to the MIX Market, which collates data on microfinance activities across the world.82 Together, they have a cumulative gross loan portfolio of USD 1.5 billion spread across 2.1 million active customers (Figure 16). Based on these data, Senegal has the highest number of MFIs (30) and leads the way in terms of gross loan portfolio (USD 402 million), closely followed by Nigeria (USD 351 million). The majority of active customers (56%) are in Nigeria, whose 11 MFIs extend loans to approximately 1.2 million people.83 Average loan sizes vary widely in the region, from approximately USD 150 in Sierra Leone to USD 4,000 in Senegal. This is likely due to MFIs in some countries providing a greater proportion of SME or informal enterprise finance as opposed to loans for personal consumption.
FIGURE 16. MICROFINANCE INSTITUTIONS BY NUMBER, ACTIVE CUSTOMERS, AND GROSS LOAN PORTFOLIO, 2013
GROSS LOAN PORTFOLIO (USD MILLIONS) ACTIVE BORROWERS (THOUSANDS)
Senegal 30Nigeria 11
Togo 11Benin 16
Burkina Faso 6Ghana 8
Mali 4Cote d’Ivoire 4
Niger 10Sierra Leone 1
Liberia 1
971,185
161243
108
15971
16322112
402351
182162161
10677
5931
3
2
Number of MFIs
Note: Data reflects only those microfinance institutions reporting data to MIX market in 2013. Source: MIX Market (mixmarket.org)
78 “La Finance au Service de l’Afrique,” AfDB (2012). Available at: http://www.mfw4a.org/fileadmin/data_storage/documents/MFW4A-documents/Soutien_MFW4A_De__veloppement_PME_dans_l_UEMOA__Fr__Final.pdf.
79 “Growing the Global Economy Through SMEs,” Edinburgh Group (2012). Available at: http://www.edinburgh-group.org/media/2776/edinburgh_group_research_-_growing_the_global_economy_through_smes.pdf.
80 “Document de Stratégie d’Intégration Nationale, Pour l’Afrique de l’Ouest 2011-2015, ” AfDB (2011).Available at: http://www.afdb.org/fileadmin/uploads/afdb/Documents/Policy-Documents/DSIR%20pour%20l’Afrique%20de%20l’Ouest%20-%20REV%202.pdf.
81 Ibid.82 Latest data as of 2013.83 “Africa market profile,” MIX Market (2015). Available at: http://mixmarket.org/mfi/region/
Africa?order=series_multimedian_3&sort=desc.
REGIONAL OVERVIEW • 41
Challenges Faced by Demand ActorsDespite large variation across countries, interviewees identified a relatively common set of challenges that cut across the region. These include:
• Lack of financing options apart from commercial banks. Angel investor, venture capital, and private equity markets are still very small in West Africa. As mentioned above, so, too, is the pool of impact investors active in the region. Given this, enterprises struggle to identify formal sources of financing beyond commercial banks. Where alternative sources do exist, awareness of these is low—especially in smaller countries such as Burkina Faso and Sierra Leone, which have very little market analysis data available. Few enterprises are even aware of the existence of impact investment, even where such investors do exist and are actively looking to broaden their pipeline of investable enterprises. As a result, enterprises view access to capital as largely synonymous with access to commercial bank loans.
• High collateral requirements for loans. Banks in West Africa are very risk averse, and do not tailor their products or services to meet SME or social enterprise needs. They generally grant loans only to clients who can provide large amounts of collateral in the form of assets and savings—which many SMEs and social enterprises do not have. These stringent collateral requirements make it difficult for enterprises to access finance.
• Capacity gaps. Enterprises face large challenges maintaining robust business systems related to financial record keeping, human resource management, governance, and marketing. This makes it difficult for them to meet investor requirements—even in basic areas such as the presentation of sales and revenue figures. Moreover, enterprises find it difficult to source qualified personnel to assist in running and managing operations. One organization active in the region, the African Management Services Company (AMSCO), was set up specifically to address this problem.84
• High cost of doing business. Poorly developed infrastructure in the region makes it difficult to bring products to market. Gaps in road infrastructure, for example, make it difficult to transport goods, while poor telecommunications infrastructure hampers communication and customer outreach. This adds an additional layer of complication for enterprises already struggling to secure customers and expand business, and hampers their ability to generate the profits required to attract investor interest.
• Difficulty conforming to differing investor requirements. Where investors are identified and their interest drawn, they have differing and sometimes cumbersome requirements to satisfy their due diligence activities. While this was not noted as a major barrier, it does raise the cost of seeking investment.
84 AMSCO website: http://www.amsco.org.
42 • THE LANDSCAPE FOR IMPACT INVESTING IN WEST AFRICA
5. ECOSYSTEM FOR IMPACT INVESTINGPolicies and RegulationsWhile some governments in West Africa, such as Nigeria and Ghana, actively promote investment and provide incentives such as “tax holidays” and exemptions on import duties for certain sectors, and while regulatory barriers did not feature prominently in interviews, impact investors did identify the following challenges:
• Limitations on local institutional investors. Regulations in many West African countries restrict institutional investors in those countries such as banks and pension funds from investing in private equity, which has been a strong driver of enterprise strengthening and growth in developed markets.85 Nigeria has recently made progress in allowing pension funds to invest 5% of their assets under management (AUM) in “alternative asset classes” including private equity, but other countries in the region have yet to follow suit.
• Inconsistent regulation. Apart from Nigeria, many other countries in West Africa are quite small. As a result, many international impact investors invest in multiple countries within the region. However, these investors indicate that regulations and business environments differ widely between countries, making it difficult to maintain a diversified investment portfolio. While the nine OHADA countries86 are making progress toward harmonizing business laws, there is little consistency among non-OHADA countries. Policy uncertainty—even within a given country—was noted as a further complicating factor.
• Inadequate and outdated insolvency regulation. Resolving insolvency is a major challenge in West Africa, largely due to deficiencies in bankruptcy laws and the processes involved in implementing them. Such laws are needed to clarify and enforce the processes of repaying creditors and managing assets once an enterprise becomes insolvent. The Resolving Insolvency score in the Doing Business index measures country performance in this important area. West Africa’s performance is poor; the region’s average rank is 136 out of 189 countries. Guinea Bissau and Cape Verde rank last and second-to-last, respectively, and it can take up to five years to resolve insolvency in Niger. Sierra Leone has, however, recently eased the process of solving insolvency by enacting a new Companies Act and implementing a fast-track commercial court in an effort to expedite commercial cases, including insolvency proceedings.87
85 “Pension Funds and Private Equity: Unlocking Africa’s Potential,” EMPEA (2014). Available at: http://empea.org/newsroom/empea-news/pension-funds-and-private-equity-unlocking-africas-potential.
86 Benin, Burkina Faso, Côte d’Ivoire, Guinea, Guinea-Bissau, Mali, Niger, Senegal, and Togo.87 “Doing Business Regional Profile: ECOWAS,” IFC (2014). Available at: http://www.ihk-krefeld.de/de/
media/pdf/international/doing-business/westafrika-doing-business-in-the-economic-community-of-west-african-states-2014.pdf.
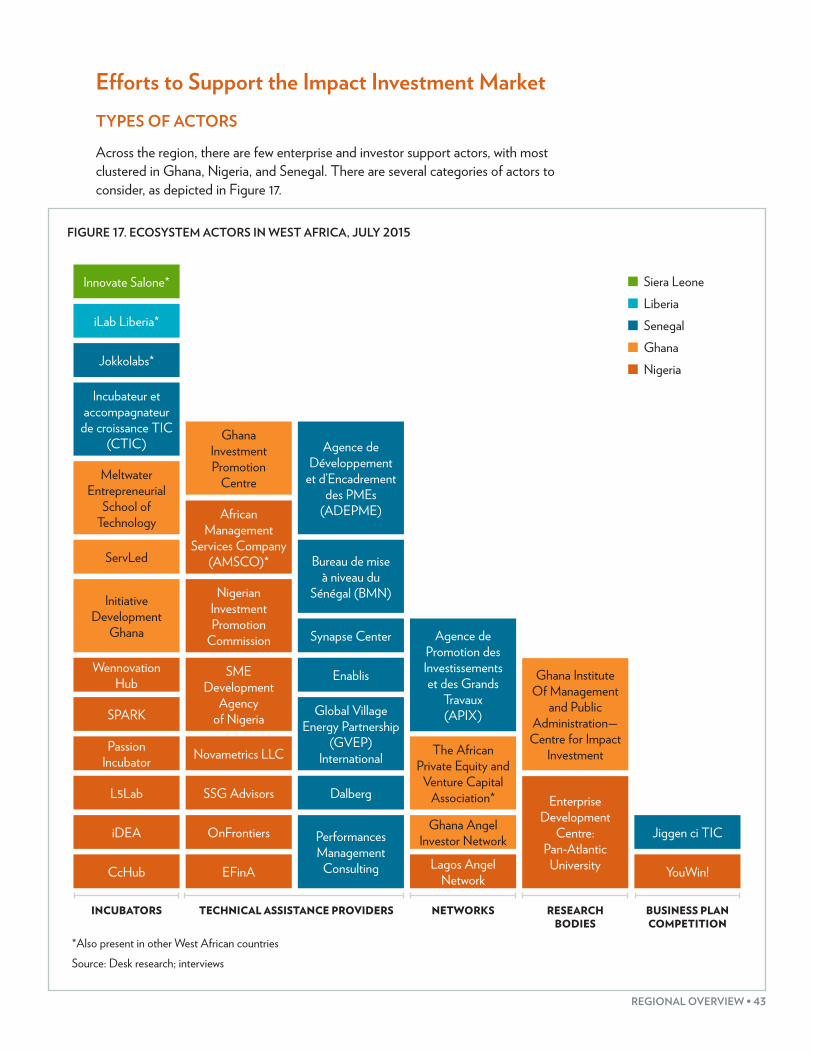
REGIONAL OVERVIEW • 43
Efforts to Support the Impact Investment MarketTYPES OF ACTORS
Across the region, there are few enterprise and investor support actors, with most clustered in Ghana, Nigeria, and Senegal. There are several categories of actors to consider, as depicted in Figure 17.
FIGURE 17. ECOSYSTEM ACTORS IN WEST AFRICA, JULY 2015
*Also present in other West African countriesSource: Desk research; interviews
INCUBATORS TECHNICAL ASSISTANCE PROVIDERS NETWORKS RESEARCH BODIES
BUSINESS PLAN COMPETITION
YouWin!
Jiggen ci TIC
EFinA
OnFrontiers
SSG Advisors
Novametrics LLC
Performances Management
Consulting
Global Village Energy Partnership
(GVEP) International
Bureau de mise à niveau du
Sénégal (BMN)
Agence de Développement
et d’Encadrement des PMEs
(ADEPME)
Agence de Promotion des Investissements et des Grands
Travaux (APIX)
Lagos Angel Network
Enterprise Development
Centre: Pan-Atlantic
University
Ghana Institute Of Management
and Public Administration—
Centre for Impact Investment
CcHub
iDEA
L5Lab
Passion Incubator
SPARK
Wennovation Hub
Initiative Development
Ghana
The African Private Equity and
Venture Capital Association*
Ghana Angel Investor Network
SME Development
Agency of Nigeria
Nigerian Investment Promotion
Commission
African Management
Services Company (AMSCO)*
Ghana Investment Promotion
CentreMeltwater Entrepreneurial
School of Technology
Incubateur et accompagnateur
de croissance TIC (CTIC)
ServLed
Dalberg
Enablis
Synapse Center
Jokkolabs*
iLab Liberia*
Innovate Salone* Siera LeoneLiberiaSenegalGhanaNigeria
44 • THE LANDSCAPE FOR IMPACT INVESTING IN WEST AFRICA
Incubators and technical assistance providers are the most numerous. Incubators have recently increased in number to accommodate the growing number of SMEs that require support. The majority—such as the Co-creation Hub and iDEA in Nigeria and the Meltwater Entrepreneurial School of Technology (MEST) in Ghana—focus on technology. This reflects the growing role of technology—particularly mobile technology—in many aspects of West African life that, along with the low capital costs associated with many technology-based services, is encouraging a surge in tech-focused SMEs in urban centers.
Technical assistance providers are also relatively well represented; they are largely split between government support agencies focused on SME development and investment promotion, and private consulting firms engaged in enterprise and investor advisory. Encouragingly, a small number of networks focused on building the small but growing private equity and angel investor communities have emerged over the past several years. Interviews with these networks indicate that there is a strong willingness among such investors to find new and better ways of collaborating.
Two research organizations were identified: the Ghana Institute of Management and Public Administration (GIMPA) Center for Impact Investing and the Enterprise Development Center (EDC) at Pan Atlantic University in Nigeria. The GIMPA Center aims to provide information on, drive awareness of, and advocate for impact investors in Ghana, and has published several reports on the state of the sector.88 The EDC, meanwhile, conducts research on the enterprise development ecosystem in Nigeria, provides enterprise capacity building, and organizes networking activities to bring investors and enterprises together.
Main Constraints and OpportunitiesThe impact investment ecosystem in the region is still emerging; as a result, actors from research bodies to incubators are limited both in size and scale. Interviewees identified the following challenges:
• Concentration of ecosystem. Actors tend to be located in the major urban centers of Lagos, Accra, and Dakar. This makes sense for investor support organizations, since local investors are mainly situated in such urban centers, while international investors can travel more easily to them. However, there is a dire need for a greater geographic distribution of enterprise support, especially in rural areas. Moreover, there is a need to expand business incubation beyond its current focus on technology.
• Lack of investor awareness of the potential of ecosystem support. As the enterprise and investor support landscape is still developing, it has yet to develop a track record of success in West Africa. This makes it difficult for these actors to gain the credibility needed to act as a robust support structure. For example, one incubator noted that it struggled to engage investors and get them interested in the potential of incubation to generate a pipeline of investable enterprises. An
88 See http://gcii.gimpa.edu.gh for more details.
REGIONAL OVERVIEW • 45
investor support agency, meanwhile, bemoaned the fact that few investors—either local or foreign—were aware of the investment incentives that it publicized. Interviews also indicated that awareness of enterprise support programs—both public and private—is low among enterprises.
• Resource constraints. Given the lack of business systems and professional governance among enterprises, incubating and supporting them is a time-consuming and costly process. Because of this, incubators are only able to take in a limited number of enterprises at a time—a tiny proportion, they note, of those that require some form of support.
Despite these barriers, ecosystem actors were optimistic about the region’s impact investment trajectory. They were careful to note that, as the impact investing industry is still very young, it is natural to encounter gaps and “teething pains.” Like investors, they noted the opportunities in sectors such as agriculture, energy, technology, and financial services. Further, they noted that, as private equity and venture capital markets develop in the region, a virtuous cycle may emerge in the industry—increasing investment incentivizes enterprises to build business systems to meet investor requirements; better business systems make it easier for enterprises to attract capital and investors to find investees, and more investment drives growth and further inflows of capital.
CONCLUSION: OPPORTUNITIES FOR INTERVENTIONWhile several interviewees were optimistic about the future growth prospects of the impact investing industry in West Africa, others were not. As mentioned, there is considerable skepticism regarding the ability of impact investors to generate significant financial return. Moreover, with many in the region viewing “impact” as residing in any form of investment that builds national capacity—even in areas such as oil and gas—impact investors’ commitment to social/environmental impact becomes less of a differentiator.
Given this context, it is important that impact investors and supporting organizations be proactive in building the impact investing industry. Interviews revealed the following as promising interventions:
• Raise awareness of impact investment. Many investors in West Africa either do not know what impact investing is or see it as a new kind of philanthropy—in both cases, the term “impact investment” is not greeted with excitement for those looking to commit money to the region. Raising awareness would help this. This could come in the form of publishing and disseminating more research, developing stronger networks among impact investors to build collective visibility, and outreach by impact investors to commercial investors.
46 • THE LANDSCAPE FOR IMPACT INVESTING IN WEST AFRICA
• Capitalize on African high net-worth individuals and corporations. Related to the above, it is particularly important to reach out to and engage African HNWIs as new sources of funding. Interviews indicated that there are several African HNWIs looking to direct their wealth to more impactful ends.89 Now is the time to engage them on the potential of impact investing to represent a new wave of African philanthropy that is at once impactful and financially sustainable. At the same time, there are many large corporations emerging in the region that could utilize impact investments to develop their supply chains. Interviewees mentioned that, like HNWIs, such corporations lack awareness and understanding of impact investing.
• Strengthen the ecosystem of incubators and accelerators. One of the most consistent messages from investors was that it was extremely difficult to find investable enterprises, while one of the most consistent messages from incubators was that they struggled to engage investors. This is peculiar, since incubators provide the very types of business support that would help build a healthy pipeline of investable enterprises for investors. Clearly, there is a gap in collaboration. In order to bridge this gap, two things need to happen: the incubator ecosystem needs to grow and linkages between investors and incubators need to strengthen. To accomplish these goals, impact investors can:
• Develop relationships with individual incubators to help them understand the types of enterprises they are looking for, the indicators that are most important in deciding whether to invest, and likely future investment pipeline needs.
• Invest in incubators so that incubator numbers and capacities grow.
• Work with incubators to build a stronger network of support associations that link investors and investees and engage governments.
• Educate and engage enterprises on the value of equity through local partnerships. Investors were generally of the opinion that equity investments were more effective at driving enterprise growth than debt, since equity allowed investors to take a more “hands-on” approach and use their expertise to guide the business—often through taking a board seat. However, West African enterprises are hesitant to accept equity investments due to a fear of losing control of their businesses. One of the ways to counteract this is to establish a local presence. interviews indicated that business owners and managers value in-person contact, and are far more likely to trust investors that are both present in and known to their communities. For investors not able to do this, finding local partners or investing indirectly through local fund managers is also a viable option. Those that already have a local presence should, of course, continue to emphasize their role as partners to the enterprises around them.
89 See the following for an interesting debate on the issue: “Are Africa’s wealthiest doing enough to help the continent?” The Africa Report. Available at: http://www.theafricareport.com/The-Question/are-africas-wealthiest-doing-enough-to-help-the-continent.html.
REGIONAL OVERVIEW • 47
Develop a track record of success through more consistent measurement. It is difficult for investors to align on a common set of metrics and impact indicators, not least because they deal with a variety of different enterprises with different impact profiles. Still, better and more consistent internal measurement, coupled with external reporting, can help to identify drivers of both success and failure, ultimately equipping the industry with a clearer growth path. Greater use of MIS could ease the process of tracking internal metrics and make it easier to publicize results.
It is an interesting time for West Africa. A track record of fast economic growth, coupled with the expectation that such growth will continue, has placed it firmly on the agenda of many international and local investors. Impact investors have recently started to turn their attention to the region; though the industry is currently small, there are large opportunities for it to expand. For these opportunities to be realized, however, timely and coordinated effort is needed across the impacting investing industry.
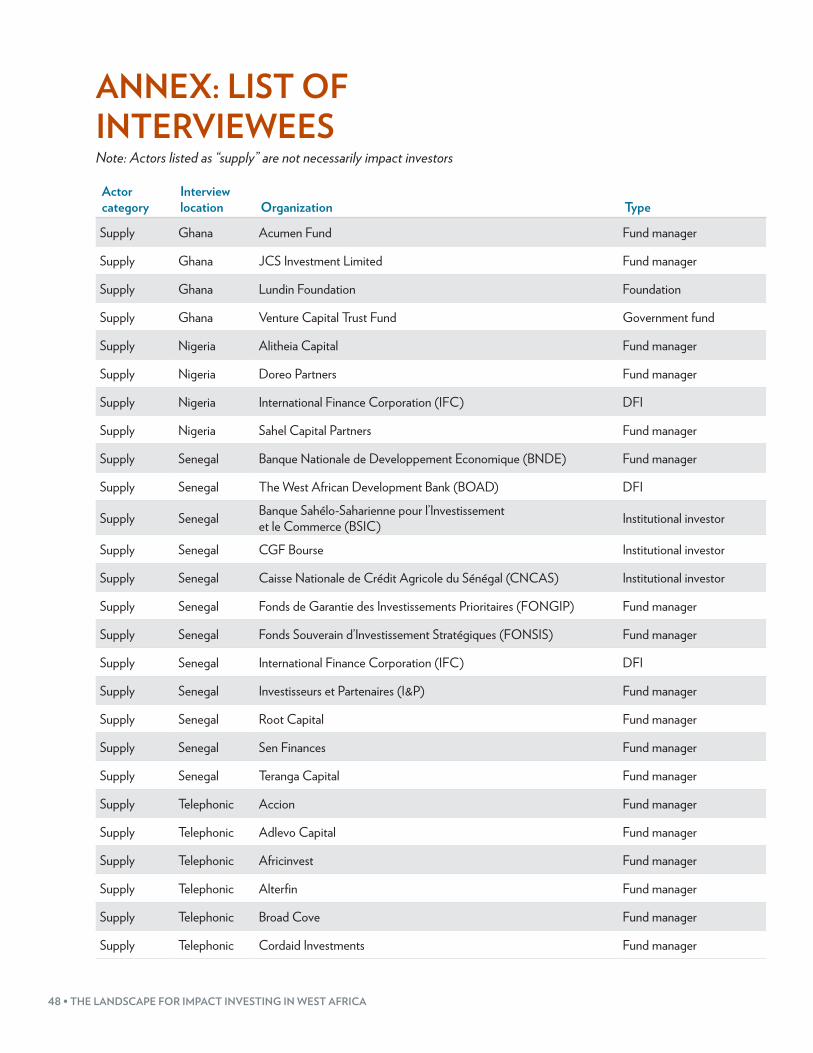
48 • THE LANDSCAPE FOR IMPACT INVESTING IN WEST AFRICA
ANNEX: LIST OF INTERVIEWEESNote: Actors listed as “supply” are not necessarily impact investors
Actor category
Interview location Organization Type
Supply Ghana Acumen Fund Fund manager
Supply Ghana JCS Investment Limited Fund manager
Supply Ghana Lundin Foundation Foundation
Supply Ghana Venture Capital Trust Fund Government fund
Supply Nigeria Alitheia Capital Fund manager
Supply Nigeria Doreo Partners Fund manager
Supply Nigeria International Finance Corporation (IFC) DFI
Supply Nigeria Sahel Capital Partners Fund manager
Supply Senegal Banque Nationale de Developpement Economique (BNDE) Fund manager
Supply Senegal The West African Development Bank (BOAD) DFI
Supply Senegal Banque Sahélo-Saharienne pour l’Investissement et le Commerce (BSIC) Institutional investor
Supply Senegal CGF Bourse Institutional investor
Supply Senegal Caisse Nationale de Crédit Agricole du Sénégal (CNCAS) Institutional investor
Supply Senegal Fonds de Garantie des Investissements Prioritaires (FONGIP) Fund manager
Supply Senegal Fonds Souverain d’Investissement Stratégiques (FONSIS) Fund manager
Supply Senegal International Finance Corporation (IFC) DFI
Supply Senegal Investisseurs et Partenaires (I&P) Fund manager
Supply Senegal Root Capital Fund manager
Supply Senegal Sen Finances Fund manager
Supply Senegal Teranga Capital Fund manager
Supply Telephonic Accion Fund manager
Supply Telephonic Adlevo Capital Fund manager
Supply Telephonic Africinvest Fund manager
Supply Telephonic Alterfin Fund manager
Supply Telephonic Broad Cove Fund manager
Supply Telephonic Cordaid Investments Fund manager
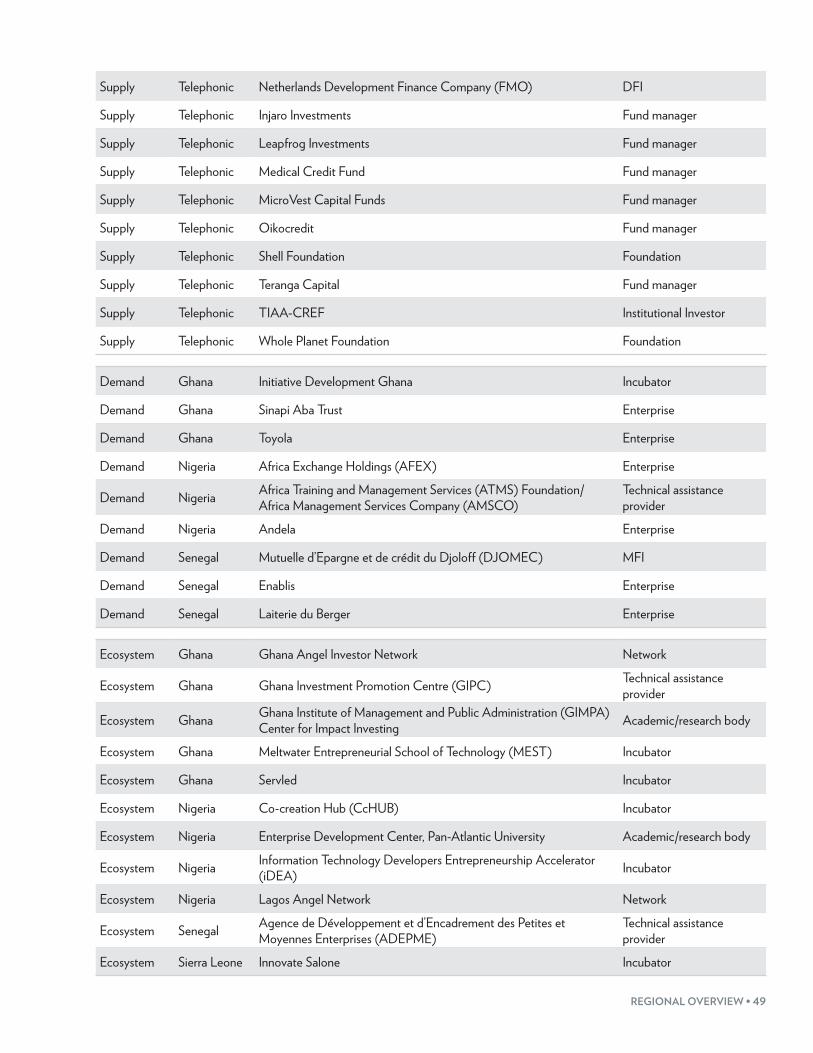
REGIONAL OVERVIEW • 49
Supply Telephonic Netherlands Development Finance Company (FMO) DFI
Supply Telephonic Injaro Investments Fund manager
Supply Telephonic Leapfrog Investments Fund manager
Supply Telephonic Medical Credit Fund Fund manager
Supply Telephonic MicroVest Capital Funds Fund manager
Supply Telephonic Oikocredit Fund manager
Supply Telephonic Shell Foundation Foundation
Supply Telephonic Teranga Capital Fund manager
Supply Telephonic TIAA-CREF Institutional Investor
Supply Telephonic Whole Planet Foundation Foundation
Demand Ghana Initiative Development Ghana Incubator
Demand Ghana Sinapi Aba Trust Enterprise
Demand Ghana Toyola Enterprise
Demand Nigeria Africa Exchange Holdings (AFEX) Enterprise
Demand Nigeria Africa Training and Management Services (ATMS) Foundation/ Africa Management Services Company (AMSCO)
Technical assistance provider
Demand Nigeria Andela Enterprise
Demand Senegal Mutuelle d’Epargne et de crédit du Djoloff (DJOMEC) MFI
Demand Senegal Enablis Enterprise
Demand Senegal Laiterie du Berger Enterprise
Ecosystem Ghana Ghana Angel Investor Network Network
Ecosystem Ghana Ghana Investment Promotion Centre (GIPC) Technical assistance provider
Ecosystem Ghana Ghana Institute of Management and Public Administration (GIMPA) Center for Impact Investing Academic/research body
Ecosystem Ghana Meltwater Entrepreneurial School of Technology (MEST) Incubator
Ecosystem Ghana Servled Incubator
Ecosystem Nigeria Co-creation Hub (CcHUB) Incubator
Ecosystem Nigeria Enterprise Development Center, Pan-Atlantic University Academic/research body
Ecosystem Nigeria Information Technology Developers Entrepreneurship Accelerator (iDEA) Incubator
Ecosystem Nigeria Lagos Angel Network Network
Ecosystem Senegal Agence de Développement et d’Encadrement des Petites et Moyennes Enterprises (ADEPME)
Technical assistance provider
Ecosystem Sierra Leone Innovate Salone Incubator
ABOUT THE GLOBAL IMPACT INVESTING NETWORK
The Global Impact Investing Network (GIIN®) is a nonprofit organization dedicated to increasing the scale and effectiveness of impact investing. The GIIN builds critical infrastructure and supports activities, education, and research that help accelerate the development of a coherent impact investing industry. For more information, see www.thegiin.org.
30 Broad Street, 38th Floor, New York, NY 10004 +1.646.837.7430 | [email protected] | www.thegiin.org


