Pergamon Adv
0273-l 177(95)00844-6
Spcc Rcs. Vol. 18. No. 3, pp. (318~(3)92. 1996 c’opright Gel 1995 COSPAR
Printed in Geat ntam. All nghts resewed 0273-l 177,96 $9.50 + 0.00
THE HIGH LATITUDE D-REGION AND MESOSPHERE REVEALED BY THE EISCAT INCOHERENT SCATTER RADARS DURING SOLAR PROTON EVENTS
P. N. Collis
EISCAT Scientific Association, Box 812, S-981 28 Kiruna. Sweden
ABSTRACT
Energetic protons precipitating into the polar atmosphere during solar proton events cause increased ionisation rates at mesospheric heights, producing a target for incoherent scatter radars at altitudes not normally accessible by that technique. Such measurements fall into two general classes; they am obtained either fortuitously, when the event erupts during an ongoing radar operation, in which case the experiment mode may not be optimal for low altitude studies, or a suitablydesigned experiment is initiated on notification of the event. The main parameters derived from these observations are the electron concentration, spectral width of the backscattered signal (from which aeronomic information may be derived) and Doppler shift (from which neutral winds may be derived). We present a review of the results obtained ftom the EISCAT incoherent scatter radars during solar proton events. Particular emphasis is given to data obtained during the most recent solar cycle maximum when strong events were observed in the years 1989-1991. The review concentrates on the height range 50 to 90 km, and covers topics including the height- and time-variation of election concentmtion and negative ions, wave-like behaviour of the neutral winds, comparisons of measured spectral widths with model calculations, and effective recombination coefficients.
INTRODUCTION
Solar proton events (SPE) erupt with little prior notice but can last for many days. Their probability of occurrence is strongly related to the 1 l-year solar cycle, with very few events being observed near solar minhnum. Incoherent scatter radar (ISR) observations of the associated ionospheric effects ate fortuitous if the radar happened to be operating during the onset of the event. More often, operations have been instigated on notification of such conditions.
The ability to measure the D-region effects of SPEs with ISRs depends on the strength of the event and the sensitivity and capabilities of the radar. Results concerning effective recombination coefficients in the D-region were obtained by combining electron density measurements with the Chatanika radar and proton flux observations by satellite during the extremely strong SPE of August 1972 which occurred in solar cycle 20 /I/. A similar study /2/ was carried out using EISCAT UHF data from February 1984, during the decliing phase of solar cycle 2 1.
The EISCAT system first became operational in 1981, after the maximum of solar cycle 21. However, it is only during the most recent solar cycle 22 maximum (1989-1991) that strong SPEs have been experienced when the EISCAT system has been capable of providing measurements of incoherent scatter spectra from mesospheric heights. Furthermore, the EISCAT VHF radar, which is more appropriate for such observations by virtue of its lower operating frequency, only became available in 1987. To the best of the author’s knowledge, alI the major results in this field in recent years have stemmed from the EISCAT facility. As the next solar mtimum, with its anticipated dearth of events, is now approaching, it is timely to review the advances gained from the EISCAT observations during the past few years.
(3)83
(3)84 P. N. CoIlis
EISCAT AND ITS APPLICATION TO SOLAR PROTON EVENTS
EISCAT, the European Incoherent SCATter radar facility, is located in the aumral zone in northern Scandinavia /3,4/. It is thus well situated to observe the effects of the proton precipitation in the northern polar cap and aurora1 zone during SPEs. The available data fall naturally into two categories: power profile observations of D-region electron density with a height resolution of -3 km during regular ionospheric experiments, and mesospheric spectral measurements with -1 km height resolution from a dedicated experiment mode which was operated specifically for SPEs. No details of these experiment schemes arc given hem, but brief descriptions can be found in /5/.
The spectral observations have more potential than the power profile measurements for scientific studies since they anyway yield backscattered power, from which the electmn density may be derived, but they additionally provide aeronomic information /6/. The Doppler shift of the spectrum is a measure of the line- of-sight ion drift, which is generally assumed to be a tracer of the neutral wind at these heights due to the large ion-neutral collision frequency. For antema directions away from the vertical the Doppler shift is governed almost entirely by the horizontal component of the wind, as this is normally much greater than the vertical component. The spectral width is a function of several parameters, most notably neutral temperature and density, positive ion mass and density of negative ions. One area of promise in this field is the comparison of the observed spectra with those predicted from ion-chemical models /7,8/. Independent information on one or more of these parameters from other ground-based or rocket-borne instruments is especia.lly valuable in interpreting the radar data. In most cases, however, the models used are relatively simple and only gross effects, such as the changes in negative ion density through twilight, can be interpreted easily.
RESULTS FROM ELECTRON DENSITY MEASUREMENTS
Long-term measurements have shown that it is extremely rare for the EISCAT radars to observe ionisation caused by energetic electron precipitation below about 70 km during normal auroral disturbances. Thus SPEs offer the only possibility of using the ISR technique to probe altitudes in the middle and lower mesosphere.
x 1030 -1032 UT "x x 0 1144-1146 UT
x x xx
80 x
xx
60.
log Ne (m-3)
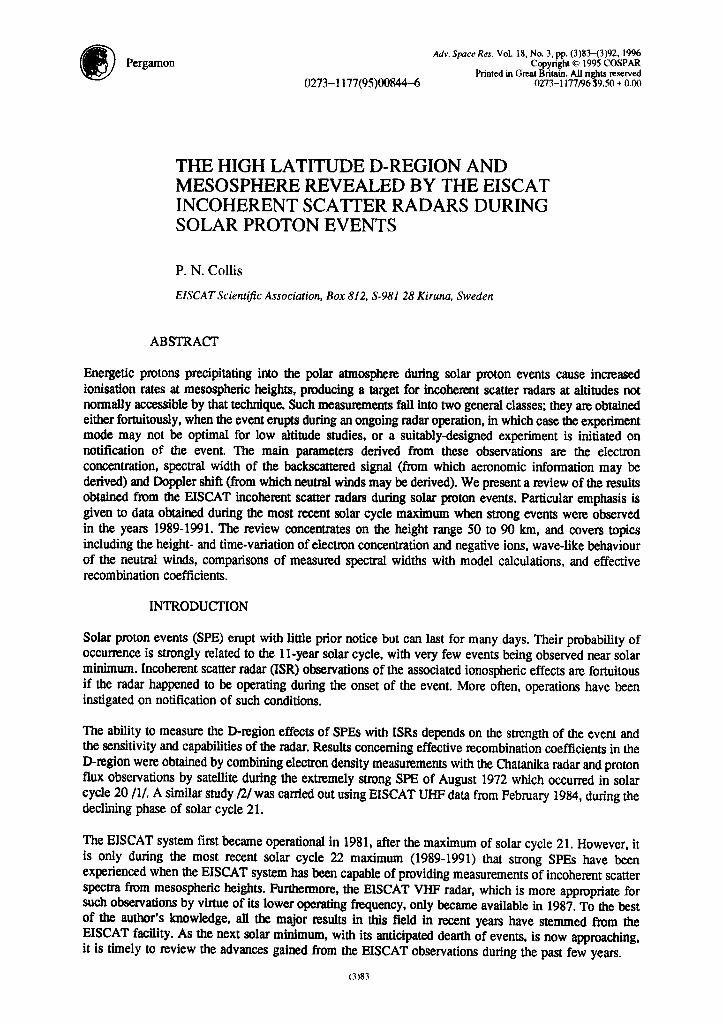
Fig. 1. Two profiles of electron density from different antenna elevation angles near local noon during the EISCAT UHF operation on 20 Ott 1989, from /5/.
500 9.6 10.0 104 108
log Ne (rnT3)
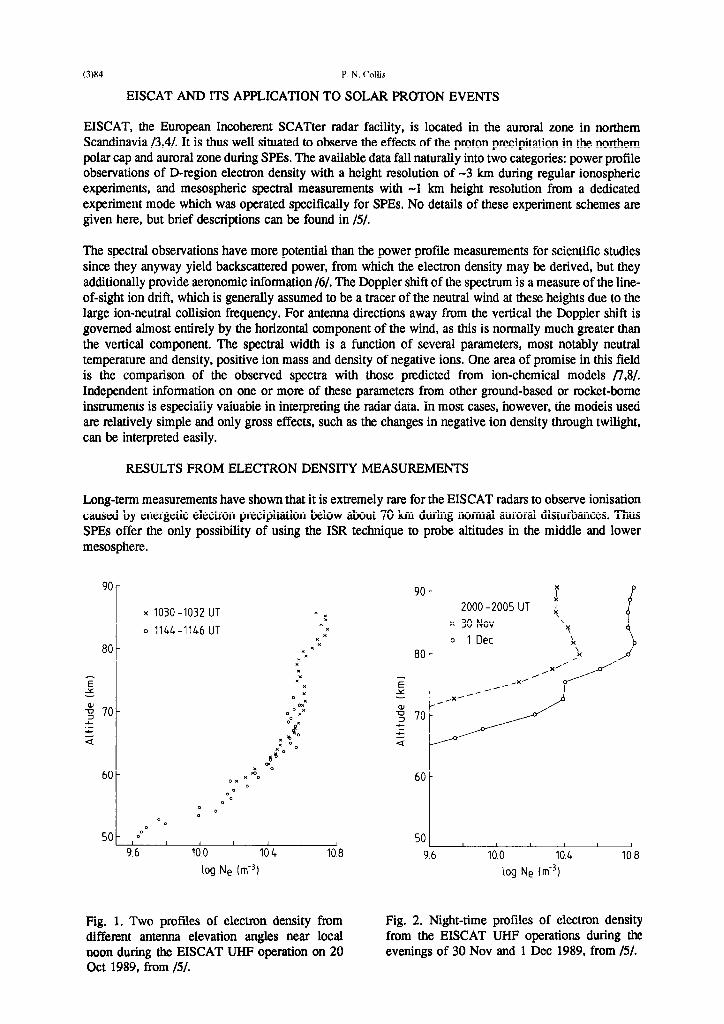
Fig. 2. Night-time profiles of electron density from the EISCAT UHF operations during the evenings of 30 Nov and 1 Dee 1989, from /S/.
High-Latitude D-Region During SOIU Proton EWTB (?)SS
Figure 1 shows two examples of electron density profiles taken by the UHF radar near local noon on 20 Ott 1989 when a particularly strong SPE of ‘_ 24opaDl
pfu was in progress. The unit pfu is proton flux unit, expressed as the integral proton flux cm s- si exceeding some threshold energy, in this case 10 MeV. The two profiles am separated by 74 minutes, but am virtually identical, indicating the constancy of these events. The profiles are even slightly separated in the horizontal direction. as the antenna elevation was lowered for the later one to obtain better definition of the lower boundary of the ionosphere near 50 km at this time.
The large electron densities observed below about 75 km during SPEs in daytime decrease significantly at night, even though the proton precipitation may continue, due to electron attachment onto neutrals to form negative ions. Figure 2 displays two night-time profiles of electron density from 30 Nov and 1 Dee 1989. The proton event was more intense on 1 Dee than on 30 Nov. as revealed by the larger electron densities on that day. The night-time densities on 1 Dee above 80 km were the same as the daytime ones in Figure 1, but with a steep gradient below this height where negative ions formed in the absence of solar illumination.
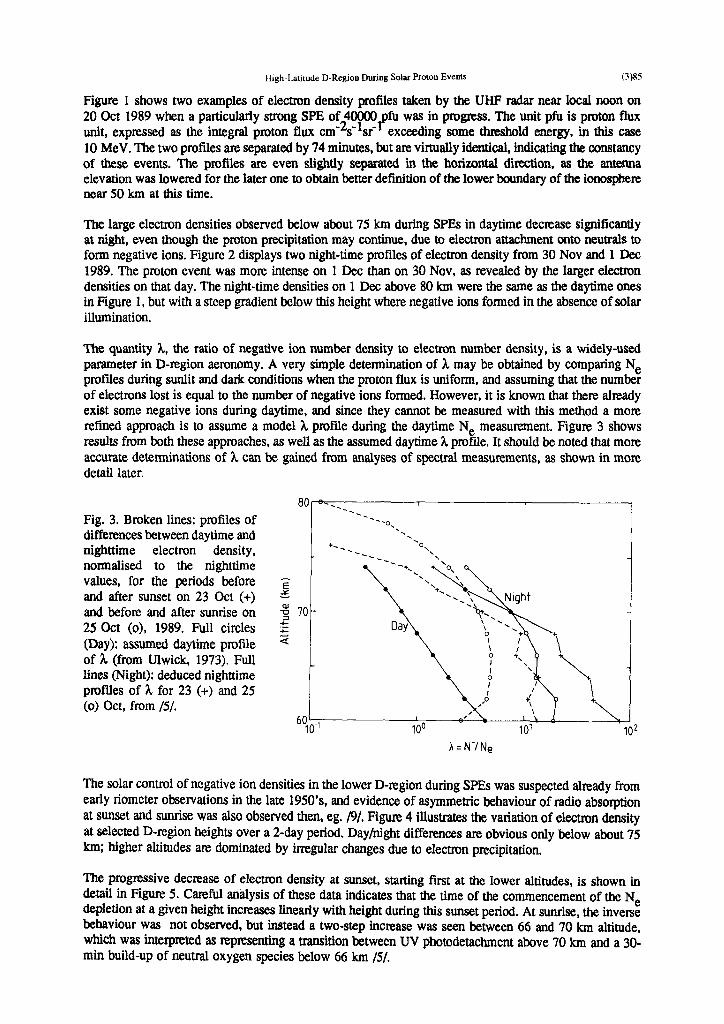
The quantity h, the ratio of negative ion number density to electron number density, is a widely-used parameter in D-region aeronomy. A very simple determination of 5 may be obtained by comparing Ne profiles during sunlit and dark conditions when the proton flux is uniform, and assuming that the number of electrons lost is equal to the number of negative ions formed. However, it is known that them already exist some negative ions during daytime, and since they cannot be measured with this method a mom refined approach is to assume a model h profile during the daytime N, measurement. Figure 3 shows results from both these approaches, as well as the assumed daytime h pmfrle. It should be noted that mom accurate determinations of h can be gained from analyses of spectral measurements, as shown in mom detail later.
Fig. 3. Broken lines: profiles of differences between daytime and
‘\ ‘. nighttime electron density, +,._
normal&i to the nighttime values, for the periods before z and after sunset on 23 Ott (+) y and before and after sunrise on 2 70- 25 Ott (o), 1989. Full circles $ (Day): assumed daytime profile z of k (from Ulwick, 1973). Full lines (Night): deduced nighttime profiles of h for 23 (+) and 25 (0) Ott, from /5/.
60' 10-l IO0 IO' 102
X=N-/Ne
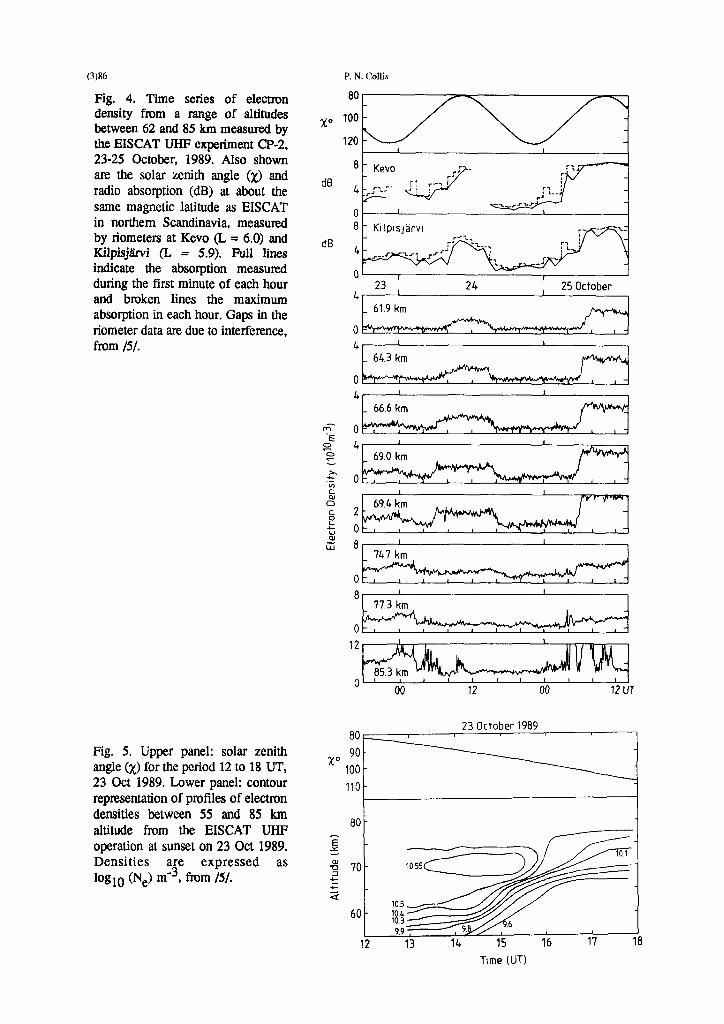
The solar control of negative ion densities in the lower D-region during SPEs was suspected already from early riometer observations in the late 1950’s, and evidence of asymmetric behaviour of radio absorption at sunset and sunrise was also observed then, eg. P/. Figure 4 illustrates the variation of electron density at selected D-region heights over a 2-day period. Day/night differences am obvious only below about 75 km; higher altitudes am dominated by irmgular changes due to electron precipitation.
The progressive decrease of electmn density at sunset, starting first at the lower altitudes, is shown in detail in Figure 5. Careful analysis of these data indicates that the time of the commencement of the N depletion at a given height increases linearly with height during this sunset period. At sunrise, the inversE behaviour was not observed, but instead a two-step increase was seen between 66 and 70 km altitude, which was interpreted as representing a transition between UV photodetachment above 70 km and a 30- min build-up of neutral oxygen species below 66 km 151.
(386
Fig. 4. Time series of electron density from a range of altitudes between 62 and 85 km measured by the EISCAT UHF experiment CP-2, 23-25 October, 1989. Also shown are the solar zenith angle (x) and radio absorption (dB) at about the same magnetic latitude as EISCAT in northern Scandinavia, measured by riometers at Kevo (L = 6.0) and Kilpisj&rvi (L = 5.9). Full lines indicate the absorption measured during the first minute of each hour and broken lines the maximum absorption in each hour. Gaps in the riometer data are due to interference, from IS/.
Fig. 5. Upper panel: solar zenith angle (x) for the period 12 to 18 UT, 23 Ott 1989. Lower panel: contour representation of profiles of electron densities between 55 and 85 km altitude from the EISCAT UHF operation at sunset on 23 Ott 1989. Densities are expressed as log10 (Ne) mV3, from /5/.
P. N. Collis
::
" ' 23 24 25October 4- _ 61.9 km
0
4
Oi.
Lr I I
_ 66.6 km
8 I I
II.3 km
23 October1989
X” ,$-==rq
Time (UT)
High-Latitude D-Region During Solar Proton Events (3 )87
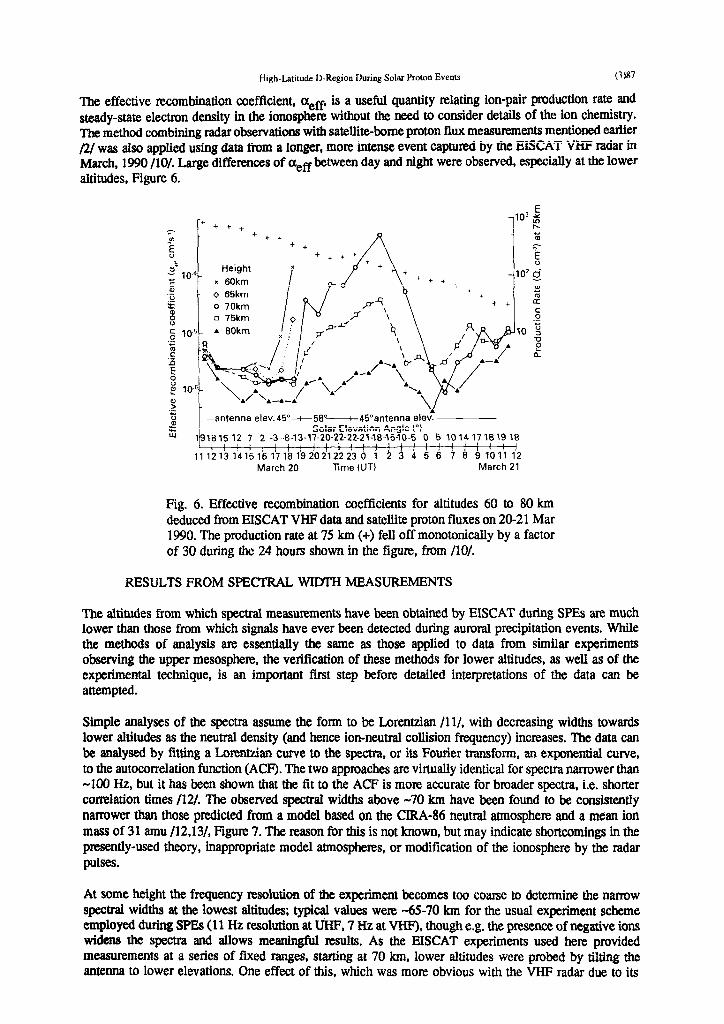
The effective recombination coefficient, oleff, is a useful quantity relating ion-pair production rate and steady-state electron density in the ionosphere without the need to consider details of the ion chemistry. The method combining radar observations with satellite-borne proton flux measurements mentioned earlier D/was also applied using data from a longer, more intense event captumd by the EISCAT VHF radar in March, 1990 /lo/. Large differences of oleff between day and night were observed, especially at the lower altitudes, Figure 6.
Q, 2 \/
B -antenna elev.45”t5E0- 45”antenna elev?
g Solar Elevatinn 4rqle f”)
191815 12 7 2 -3 .8-13-17-20-22-22-21-18-15~10-5 0 5 1014 17 1819 18 I I1 1 I I I I I I I I I I I / ~112131415llj1i1~19202122230 1”‘!11lii, 7 13 ,,,!1/OI 4 5 6 7 8 9101112
March 20 Xme (UT) March 21
Fig. 6. Effective recombination coefficients for altitudes 60 to 80 km deduced from EISCAT VHF data and satellite proton fluxes on 20-21 Mar 1990. The production rate at 75 km (+) fell off monotonically by a factor of 30 during the 24 hours shown in the figure, from /lo/.
RESULTS FROM SPECI-RAL WIDTH MEASUREMENTS
The altitudes from which spectral measurements have been obtained by EISCAT during SPEs are much lower than those from which signals have ever been detected during amoral precipitation events. While the methods of analysis are essentially the same as those applied to dam from similar experiments observing the upper mesosphem, the verification of these methods for lower altitudes, as well as of the experimental technique, is an important first step before detailed interpretations of the data can be attempted.
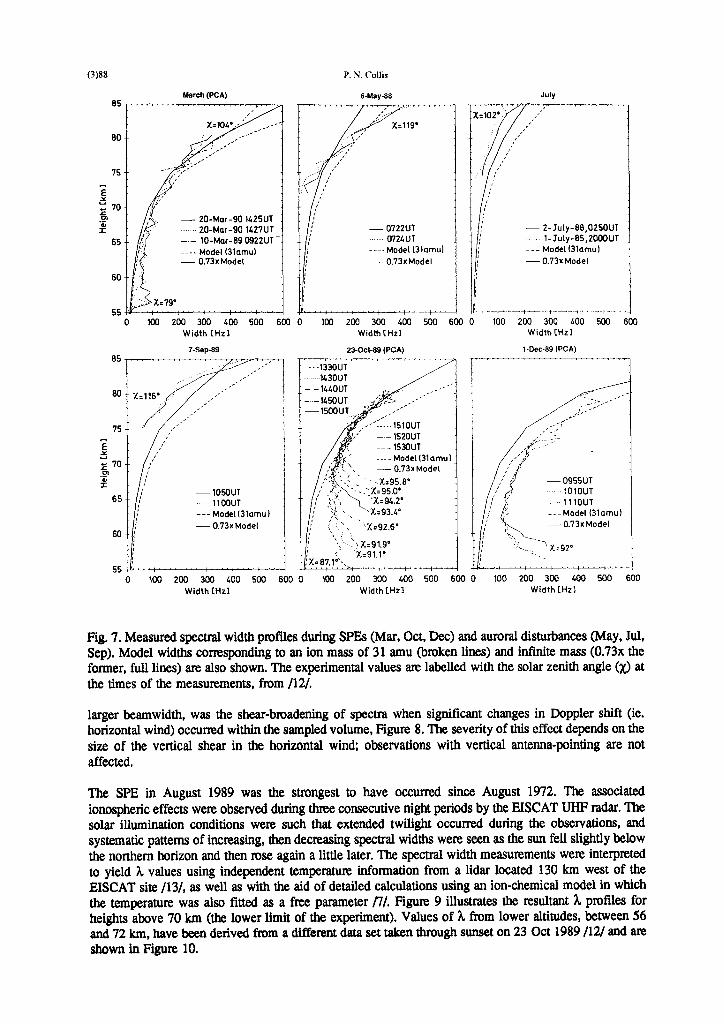
Simple analyses of the spectra assume the form to be Lorentzian /ll/, with decreasing widths towards lower altltudes as the neutral density (and hence ion-neutral collision frequency) increases. The data can be analysed by fitting a Lorentzian curve to the spectra, or its Fourier transform, an exponential curve, to the autocorrelation function (ACF). The two approaches are virtually identical for spectra narrower than -100 Hz, but it has been shown that the fit to the ACF is mote accurate for broader spectra, i.e. shorter conelation times /lZ/. The observed spectral widths above -70 km have been found to be consistently narrower than those predicted from a model based on the ClRA-86 neutral atmosphere and a mean ion mass of 31 amu /12,13/, Figure 7. The reason for this is not known, but may indicate shortcomings in the presently-used theory, inappropriate model atmospheres, or modification of the ionosphere by the radar pulses.
At some height the frequency resolution of the experiment becomes too coarse to determine the narrow spectral widths at the lowest altitudes; typical values were -65-70 km for the usual experiment scheme employed during SPEs (11 Hz resolution at UHF, 7 Hz at VHF), though e.g. the presence of negative ions widens the spectra and allows meatkgful results. As the EISCAT experiments used hem provided measurements at a series of fixed ranges, starting at 70 km, lower altitudes were probed by tilting the antenna to lower elevations. One effect of this, which was more obvious with the VHF radar due to its
March (PCA)
- ZO-Mar-90 1425UT 20-Mar-90 1427UT
-.- lo-Mar-690922UT- ---- Model l3lamul - 0.73x Model
0 100 200 300 400 .,,; Width CHzl
7-sepal9
- 105OUT ..--1lOOUT --- Model l3lamu) - 0.73xModel
P. N. Collis
6.May-88
,,,I. . ” X=119’
I’ . . . :. ,I
,* li”7-. ,... ,I
..’ ‘: ,,’ : ,’
#’ ,’
? ’ - 0722UT 0724UT
____ Model (3lamul - 0.73xModel
N---4--+.--~ ---+-
_ -7.. -r_
1(.102* .’ ~--_-T’- ..*_-
,<’ ,’
I’ I’
,’ 1’
r
,’
: #’ : ,’
” - 2- July-68,025OUT l-July-65,ZOOOUT
--- Model (Jlamul - 0.73xModel
I 0 100 200 300 400 500 600 0 100 200 300 LOO 500 Width [Hz1 Width [Hz1
250cb89 (PCA) ,-Dee89 (PCA)
- 0.73x Model
.X.95.6’ - 0955UT
- - 11lOUT ---Model (3lamul -0.73x Model
-‘X=92”
-1 6( x)
0 100 200 300 400 500 600 a 100 200 300 400 500 600 0 100 200 300 400 600 600 Width tlizl WidthLHzl Width tHzl
Fig. 7. Measured spectral width profiles during SPEs (Mar, Oct. Dee) and auroral disturbances (May, Jul. Sep). Model widths corresponding to an ion mass of 31 amu (broken lines) and inflnite mass (0.73x the former, full lines) am also shown. The experimental values am labelled with the solar zenith angle (x) at the times of the measurements, from ll2i.
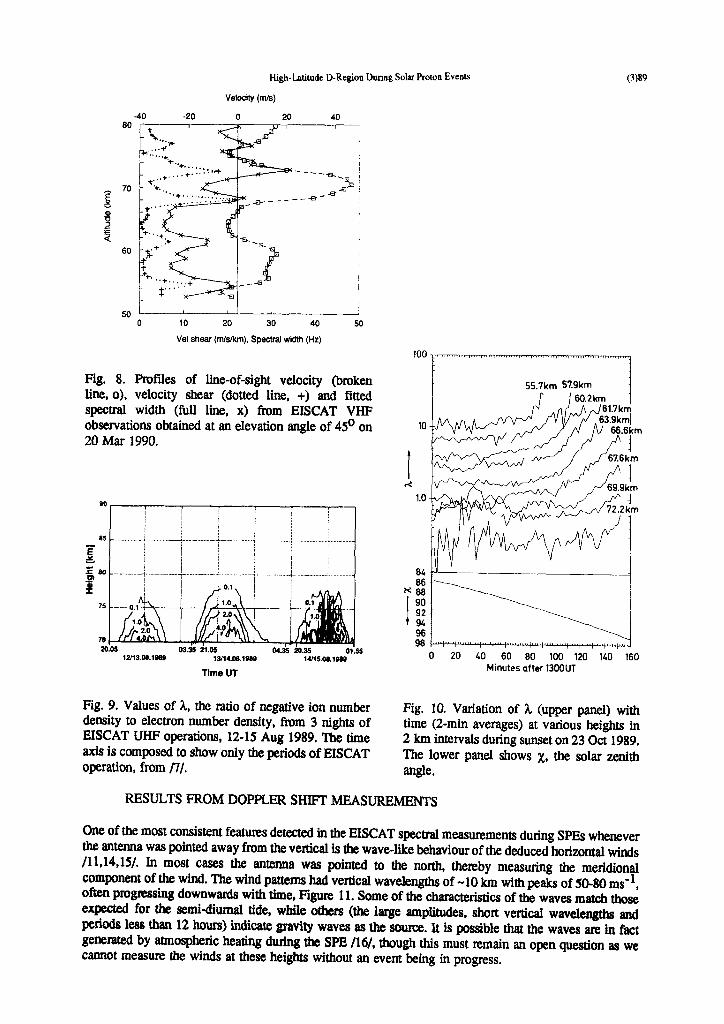
larger beamwidth, was the shear-broadening of spectra when significant changes in Doppler shift (ie. horizontal wind) occurred within the sampled volume, Figure 8. The severity of this effect depends on the size of the vertical shear in the horizontal wind; observations with vertical antenna-pointing are not affected.
The SPE in August 1989 was the stmngest to have occurred since August 1972. The associated ionospheric effects wefe observed during three consecutive night periods by the EISCAT UHF radar. The solar illumination conditions were such that extended twilight occurred during the observations, and systematic patterns of increasing, then decreasing spectral widths were seen as the sun fell slightly below the northern horizon and then rose again a little later. The spectral width measurements were interpreted to yield h values using independent temperature. information from a lidar located 130 km west of the EISCAT site /13/, as well as with the aid of detailed calculations using an ion-chemical model in which the temperature was also fined as a free parameter f7/. Figure 9 illustrates the resultant h pmfiles for heights above 70 km (the lower limit of the experiment). Values of 3L fmm lower altitudes, between 56 and 72 km, have been derived from a different data set taken through sunset on 23 Ott 1989 /12/ and am shown in Figure 10.
High-Lotitade D-Region Dunng Solar Proton Events (?)89
I
10 20 30 40
Velshear(m/s/km),S~alwidth(Hz)
Fig. 8. Profiles of line-of-sight velocity (broken line, o), velocity shear (dotted line, +) and fitted spectral width (fitll line, x) fmtn EISCAT VHF observations obtained at an elevation angle of 45’ on 20 Mar 1990.
lY14.03.1933
TlmeUT
Fig. 9. Values of h, the ratio of negative ion number density to electron number density, from 3 nights of EISCAT UHF operations, 12-15 Aug 1989. The time axis is composed to show only the periods of EISCAT operation, from PI.
:t * 0%
I 90 92
:; 98
0 20 40 60 80 100 120 140 160 Minutes after 13OOUT
Fig. 10. Variation of h (upper panel) with time (2-min averages) at various heights in 2 km intervals during sunset on 23 Ott 1989. The lower panel shows 2, the solar zenith angle.
RESULTS FROM DOPPLER SHIFT MEASUREMENTS
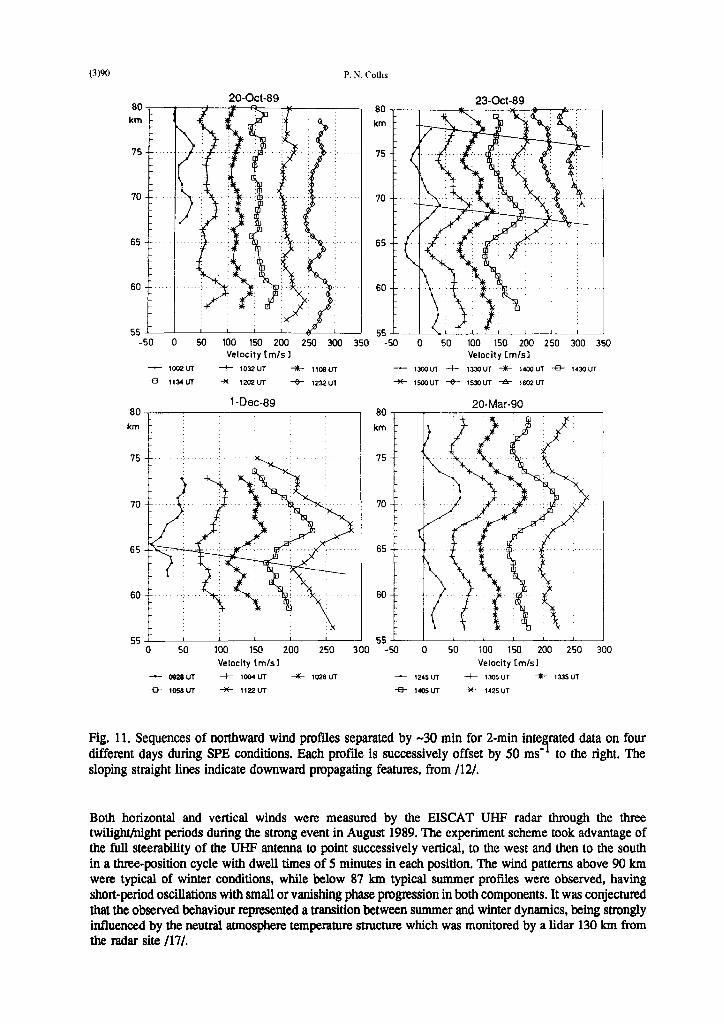
One of the. most consistent features detected in the EISCAT spectral measurements during SPEs whenever the antenna was pointed away from the vertical is the wave-like behaviour of the deduced hodxontal winds /11,14,15/. In most cases the antenna was pointed to the north, thereby measuring the meridional component of the wind. The wind patterns had vertical wavelengths of -10 km with peaks of SO-80 ms-‘, often progressing downwards with time, Figure 11. Some of the characteristics of the waves match those expected for the semi-diurnal tide, while others (the large amplitndes, shott vertical wavelengths and periods less than 12 hours) indicate gravity waves as the source. It ls possible that the waves am in fact generated by atmospheric heating during the SPE /16/, though this must remain an open question as we cannot measure the winds at these heights without an event being in progress.
(3)90 P. N. (‘ollis
20-Ott-89 23-O&89 ^^
-50 0 50 100 150 200 250 300 350 -50 0 50 100 150 200 250 300 350 Velocity Cm/s I Velocity [m/s1
- 1cuzuT + 1032UT +- 1108UT - 1333~~ + 1333~7 + 14mur -3- wour 8 1134ur * lm2uT + 1232UT * ISOOUT -4 lsPUT -k lW2UT
I
1 -Uec-89 80 7
20-Mar-90 I X’
70 --
65 --....
60 --
0 50 100 150 200 250 300 -50 0 50 100 150 200 250 300
Velocity [m/s I Velocity [m/s1
- 0328uT + IOMUT + 1028ur - l2,5UT + 13X”T + IWUT
8 1058ur * 1lzzU-r -s- 1405UT * 1425UT
Fig. 11. Sequences of northward wind profiles separated by -30 min for 2-min inte rated data on four different days during SPE conditions. Each pmfiie is successively offset by 50 ms -ti to the right. The sloping straight lines indicate downward propagating features, from /12/.
Both horizontal and vertical winds were measured by the EISCAT UHF radar through the three twilight/night periods during the strong event in August 1989. The experiment scheme took advantage of the full steerabiiity of the UHF antenna to point successively vertical, to the west and then to the south in a thme-position cycle with dwell times of 5 minutes in each position. The wind patterns above 90 km were typical of winter conditions, while below 87 km typical summer profiles were observed, having short-period oscillations with small or vanishing phase progression in both components. It was conjectured that the observed behaviour represented a transition between summer and winter dynamics, being strongly influenced by the neutral atmosphere temperature structure which was monitored by a lidar 130 km from the radar site /17/.
High-Latitude D-Region During Solar Proton EV~IW (3)91
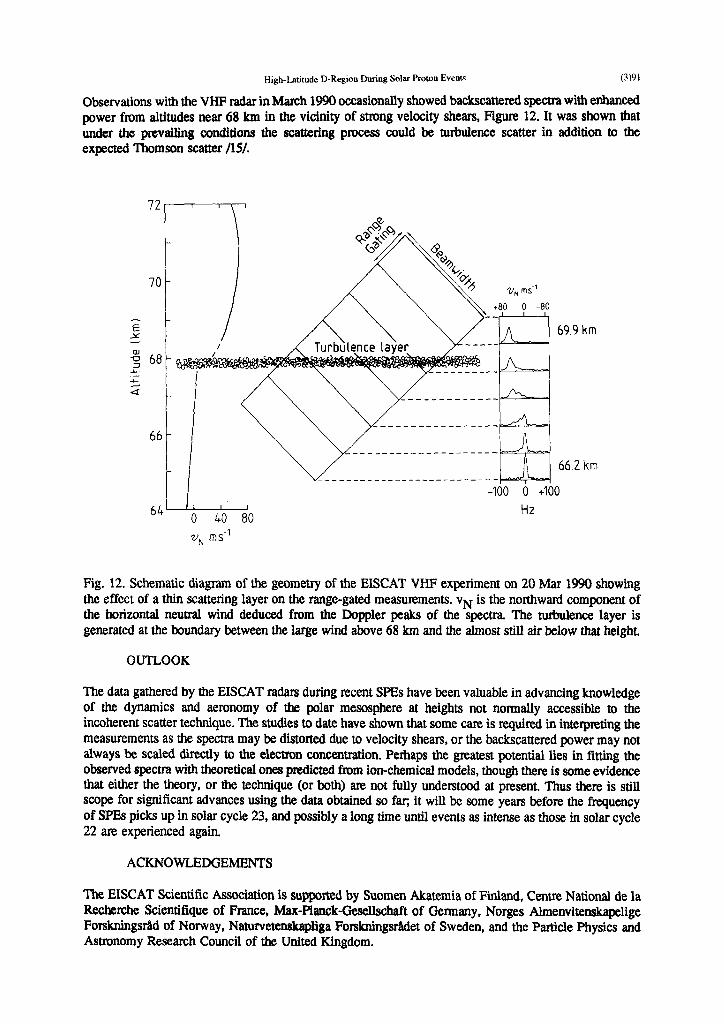
Observations with the VHF radar in March 1990 occasionally showed backscattered spectra with enhanced power from altitudes near 68 km in the vicinity of sttong velocity shears, Figure 12. It was shown that under the pmvalling conditions the scattering process could be turbulence scatter in addition to the expected Thomson scatter /15/.
72
E Y 69.9 km
G 2 68
z z ___-______
____-______A__-- 66
________-_____ 66.2 km
________________..._~----- -100 0 +I00
0 LO 80 HZ
vN rns-'
Fig. 12. Schematic diagram of the geometry of the EISCAT VHF experiment on 20 Mar 1990 showing the effect of a thin scattering layer on the range-gated measurements. vN is the northward component of the horizontal neutral wind deduced from the Doppler peaks of the spectra. The turbulence layer is generated at the boundary between the large wind above 68 km and the almost still air below that height.
OUTLOOK
The data gathered by the EISCAT radars during recent SPEs have been valuable in advancing knowledge of the dynamics and aeronomy of the polar mesosphere at heights not normally accessible to the incoherent scatter technique. The studies to date have shown that some cam is requited in interpreting the measurements as the spectra may be distorted due to velocity shears, or the backscattered power may not always be scaled directly to the electron concentration. Perhaps the greatest potential lies in fitting the observed spectra with theoretical ones predicted from ion-chemical models, though there is some evidence that either the theory, or the technique (or both) are not fully understood at present. Thus there is still scope for significant advances using the data obtained so far, it will be some years before the fmquency of SPEs picks up in solar cycle 23, and possibly a long time until events as intense as those in solar cycle 22 am experienced again.
ACKNOWLEDGEMENTS
The EISCAT Scientific Association is supported by Suomen Akatemia of Finland, Centre National de la Reohemhe Scientifique of France, Max-Planck-Gesellschaft of Germany, Norges Almenvitenskapelige Forskningsr&d of Norway, Naturvemnskapliga Forskningstidet of Sweden, and the Particle Physics and Astronomy Research Council of the United Kingdom.
(3)92 I’. N. (‘ollis
REFERENCES
1. J.B. Reagan and T.M. Watt, Simultaneous satellite and radar studies of the D-region ionosphere during the intense solar particle events of August 1972, J. Geophys. Res. 81, 4579-4596 (1976).
2. J.K. Hargmaves, H. Ranta, A. Ranta, E. Turunen and T. Turunen, Observations of the polar cap absorption event of February 1984 by the EISCAT incoherent scatter radar, Planet. Space Sci. 35.947-958 (1987).
3. K. Folkestad, T. Hagfors and S. Westerlund, EISCAT: an updated description of technical characteristics and operational capabilities, Radio Science 18, 867-879 (1983).
4. M. Baron, The EISCAT facility, J. Atmos. Terr. Phys. 46.469-472 (1984).
5. P.N. Collis and M.T. Rietveld, Mesospheric observations with the EISCAT UHF radar during polar cap absorption events: 1. Electron densities and negative ions, Ann. Geophys. 8, 809-824 (1990).
6. P.N. Collis and J. Rottger, Mesospheric studies using the EISCAT UHF and VHF radars: a review of principles and experimental results, J. atrnos. terr. Phys. 52, 569-584 (1990).
7. E. Turunen, EISCAT incoherent scatter radar observations and model studies of day to twilight variations in the D-region during the PCA event of August 1989, J. atmos. terr. Phys. 55.767-781 (1993).
8. E. Turunen, Incoherent scatter radar contributions to high latitude D-region aeronomy, J. atmos. terr. Phys. 57, in press (1995).
9. G.C. Reid, A study of the enhanced ionisation produced by solar protons during a polar cap absorption event, J. geophys. Res. 66,4071-4085 (1961).
10. J.K. Hargreaves, A.V. Shirochkov and A.D. Farmer, The polar cap absorption event of 19-21 Match 1990: recombination coefficients, the twilight transition and the midday recovery, J. atmos. terr. Phys. 55, 857-862 (1993).
11. J.D. Mathews, Incoherent scatter radar probing of the 60- 100 km atmosphere and ionosphere, I.E.E.E. Trans. Geosci. Remote Sensing GE-24,765-776 (1986).
12. M.T. Rietveld and P.N. Collis, Mesospheric observations with the EISCAT UHF radar during polar cap absorption events: 2. Spectral measurements, Ann. Geophys. 11, 797-808 (1993).
13. G. Hansen, U-P. Hoppe, E. Tunmen and P. Pollari, Comparison of observed and calculated incoherent scatter spectra from the D-region, Radio Sci. 26, 1153-1164 (1991).
14. M.T. Rietveld, P.N. Collis and J. Rottger, Observations of atmospheric dynamics in the low- and middle-mesosphere with the EISCAT incoherent scatter radar during solar proton events, Adv. Space Res. 12, #lo, 81-84 (1992).
15. P.N. Collis, M.T. Rietveld, J. RUttger and W.K. Hocking, Turbulence scattering layers in the middle- mesosphem observed by the EISCAT 224MHz radar, Radio Sci. 27.97-107 (1992).
16. J. Rottger, Solar proton events: a source for long-period gravity waves in the polar mesosphete?, Proc. STEP symposium (1992: Laurel, Maryland, USA), 473-476 (1994).
17. G. Hansen and U-P. Hoppe, Investigation of the upper mesosphete dynamics under polar summer conditions by EISCAT and lidar, J. atmos. terr. Phys. 57, in press (1995).


