HYDROLOGICAL PROCESSESHydrol. Process. 17, 3601–3614 (2003)Published online in Wiley InterScience (www.interscience.wiley.com). DOI: 10.1002/hyp.1358
The effects of soil bulk density, clay contentand temperature on soil water content measurement
using time-domain reflectometry
Yuanshi Gong,1 Qiaohong Cao1 and Zongjia Sun2*1 Department of Soil and Water Sciences, China Agricultural University, #2 Yuan-Ming-Yuan Xi Road, Beijing 100094, People’s Republic of
China2 ESI Environmental Sensors Inc., 100-4243 Glanford Avenue, Victoria, BC V8Z 4B9, Canada
Abstract:
Time-domain reflectometry (TDR) is increasingly used for field soil water estimation because the measurement is non-destructive and less affected by soil texture, bulk density and temperature. However, with the increase in instrumentresolution, the influences of soil bulk density and temperature on TDR soil moisture measurements have been reported.The influence is primarily caused by changes in soil and water dielectric permittivity when soil compaction andtemperature varies. The objective of this study is to quantify the influence of soil bulk density and temperature, andto provide the corresponding correction methods. Data collected from sand, sandy loam, loam and clay loam showa linear relationship between the square root of dielectric constant of dry soil and bulk density, and a bulk densitycorrection formula has been developed. The dielectric permittivity of soil solids estimated using this formula is closeto that of oxides of aluminium, silicon, magnesium and calcium. Data collection from sandy loam show a noticeabledecrease in measured soil moisture with increase in temperature when the volumetric soil water content is above0Ð30 m3 m�3. A temperature-correction equation has been developed, which could provide the corrected soil moisturebased on soil temperature and TDR-measured moisture. The effect of clay content has been detected, but it is notstatistically significant. High clay contents cause the underestimation of soil water content in the low moisture rangeand overestimation of soil water content in the high moisture range. Copyright 2003 John Wiley & Sons, Ltd.
KEY WORDS time domain reflectometry (TDR); volumetric water content; dielectric permittivity; time delay or traveltime; soil bulk density
INTRODUCTION
The accuracy of soil water content measurement using time-domain reflectometry (TDR) depends on (1) theaccuracy of time delay measurement and (2) the calibration used to convert measured time delay to volumetricsoil water content. Many techniques have been developed to improve the accuracy of time delay measurement.For example, the switching diode technique has been employed to obtain an unambiguous time mark in theMoisturežPoint TDR soil moisture instrument (Hook et al., 1992). Meanwhile, several calibration equationshave been developed to explore the relationship between time delay and volumetric soil water content (Toppet al., 1980; Ledieu et al., 1986; Roth et al., 1990; Herkelrath et al., 1991). Topp et al. (1980) developeda well-known ‘Universal’ empirical calibration equation between apparent dielectric permittivity Ka andvolumetric water content �v. This universal calibration has been validated by numerous reports for twodecades, when it is applied to general soil conditions. However, with the increase of resolution and accuracyof time delay measurement, a discrepancy between Topp et al.’s universal calibration and experimental results
* Correspondence to: Zongjia Sun, ESI Environmental Sensors Inc., 100-4243 Glanford Avenue, Victoria, BC V8Z 4B9, Canada.E-mail: [email protected]
Received 21 May 2002Copyright 2003 John Wiley & Sons, Ltd. Accepted 8 September 2002

3602 Y. GONG, Q. CAO AND Z. SUN
has been reported when the universal relationship of Ka versus � was applied to soil with high clay content andsalinity (Dirksen and Dasberg, 1993; Jacobsen and Schjønning, 1993; Dalton, 1992; Wyseure et al., 1997).
The apparent dielectric constant Ka of a material is determined by measuring the propagating time (timedelay) of an electromagnetic (EM) wave in that material. In practice, an EM wave is sent through the materialof interest along a transmission line (probe) buried in it, and the EM wave is reflected back at the end of thetransmission line. The round-trip time T is then measured. According to Maxwell’s equation, the velocity v ofan EM wave propagating in a material medium with apparent dielectric permittivity Ka can be calculated thus:
v D C
K0Ð5a
D 2L
T�1�
where C is the velocity of an EM wave in free space and L is the length of the transmission line. Multiplyingby two accounts for a round trip.
Therefore, the apparent dielectric permittivity Ka is
Ka D(
CT
2L
)2
�2�
The time delay of an EM wave in air over the distance of 2L is given by
Ta D 2L
C�3�
Combining Equations (1)–(3) we obtain
Ka D(
T
Ta
)2
or √Ka D T
Ta�4�
The normalized time T/Ta is linked directly to the dielectric permittivity of the material and it will be referredto as the time delay in the rest of this paper.
As a porous medium, soil consists of materials in three phases: solid soil particles, liquid soil solution andair in soil. The dielectric permittivity of soil, and in turn the measured time delay T/Ta, is a function of thedielectric permittivity of each of its components and the volume fraction of each component.
The following linear relation between �v and T/Ta has been developed by several researchers (Hook andLivingston, 1996):
�v D �T/Ta� � �Ts/Ta�
K0Ð5w � 1
�5�
where Ts is the travel time in dry soil. Similar to Equation (4), Ts/Ta represents the square root of thedielectric permittivity of dry soil. Kw is the dielectric permittivity of the soil solution. By replacing T/Ta andTs/Ta with Ka and Ks in equation (4) we obtain
�v D K0Ð5a � K0Ð5
s
K0Ð5w � 1
�6�
Equation (6) shows a linear relation between K0Ð5a and �v, with slope of 1/�K0Ð5
w � 1� and intercept ofK0Ð5
s /�K0Ð5w � 1�.
Ledieu et al. (1986) reported that the calibration equation between Ka and �v could be improved byconsidering soil bulk density, although the effects were relatively small.
Copyright 2003 John Wiley & Sons, Ltd. Hydrol. Process. 17, 3601–3614 (2003)

TDR MEASUREMENT OF SOIL WATER CONTENT 3603
Dry soil consists of solid particles and air. The dielectric permittivity of solid soil particles is in the range2–5 and the dielectric constant of air is near unity. The denser the soil, the greater the volume ratio ofsolid particles to air, and the larger the dielectric permittivity of dry soil Ks. The intercept of Equation (6),K0Ð5
s /�K0Ð5w � 1�, increases with increasing soil bulk density.
For soil with high clay contents, the bound water effects can not be ignored. The water phase in soil canbe subdivided into a free water phase and a bound water phase. Free water, also called bulk water, is able torotate freely following an alternating electrical field. Its dielectric permittivity is around 80 at 20 °C, attributedto its high degree of polarization under an external electrical field. In contrast, the bound water phase consistsof water molecules that are bound to the soil surface by adhesive, cohesive and osmotic forces (Hilhorst et al.,2001). The rotation of bound water molecules following an applied electrical field is restricted, resulting inless polarization compared with that of free water, and a low dielectric permittivity. Or and Wraith (1999)obtained the dielectric permittivity of bound water of 6, 10 and 14 by harmonic averaging for a bound-waterregion made up of one, two and three molecular thicknesses, respectively. Sun and Young (2001) obtaineda value of 30Ð2 for the distance-weighted average dielectric permittivity of bound water, which consists offour water-molecule layers from the particle surface (first layer) to free water (fourth layer) in Rideau clay.Obviously, the slope of the calibration Equation (5), 1/�K0Ð5
w � 1�, will be different for soil containing differentamounts of bound water, which is directly related to the clay content. The magnitude of the difference dependson the amount of clay and the clay minerals.
The electrical conductivity (EC) of clay soil imposes a great impact on soil water content measurementusing TDR (Topp et al., 1980, 2000; Malicki et al., 1994; White et al., 1994; Sun et al., 2000). The soil ECcomes from the electrolytes in soil solution and the electrical charged clay colloid surface. The elevated ECincreases the apparent dielectric permittivity (White et al., 1994; Sun et al., 2000; Topp et al., 2000), actingcounter to that of bound water in TDR soil water content measurement, and making TDR less sensitive tosoil texture.
The dielectric permittivity of free water Kw is temperature dependent. The change of dielectric permittivityof free water with temperature can be described by the following formula (Weast, 1986):
Kwater D 78Ð54[1 � 4Ð579 ð 10�3�t � 25� C 1Ð19 ð 10�5�t � 25�2 � 2Ð8 ð 10�8�t � 25�3] �7�
where t is the water temperature in celsius.When the temperature drops from 20 °C to 5 °C, the Kw will increase from 80Ð36 to 86Ð12, resulting in a
change of the slope of Equation (5) from 0Ð1256 to 0Ð1208. It is clear that the temperature effects must betaken into account for an accurate soil water content measurement using TDR.
This experiment quantitatively studied the effects of soil bulk density, clay content and temperature on soilwater content measurement using TDR, and attempts to provide practical calibrations for an accurate soilwater content measurement.
MATERIALS AND METHOD
The soils used in this study were sand, sandy loam, loam, silt loam and silt clay. Sand was dug from theriverbed of Xiao QingHe, Beijing, China. Sandy loam and loam were taken from the experimental field ofChina Agricultural University, Beijing, China. Silt clay loam (cinnamon soils) and silt clay (cinnamon soils)was taken from suburban Beijing, China. The soil type and texture are presented in Table I. The soil wasair dried and sieved (mesh #10). Soil samples were oven dried at 105 °C for 48 h and cooled to 20 °C ina desiccating chamber for further use. Soil was packed in a PVC cylinder 10 cm in diameter and 40 cm inlength. The time delay was measured using a TDR soil moisture instrument (MoisturežPoint MP-917, E.S.I.Environmental Sensors Inc., Victoria, BC, Canada). The probe used in this experiment consists of two 30 cmrectangular stainless-steel bars (1Ð3 cm wide, 0Ð32 cm thick) separated by 1Ð5 cm with epoxy between them.Switching diodes were mounted at both ends of the probe to improve the accuracy of time delay measurement
Copyright 2003 John Wiley & Sons, Ltd. Hydrol. Process. 17, 3601–3614 (2003)

3604 Y. GONG, Q. CAO AND Z. SUN
Table I. Particle size distribution of soils under investigation
Sampleno.
Soil type Sand (%)(2Ð0–0Ð05 mm)
Silt (%)(0Ð05–0Ð002 mm)
Clay (%)(<0Ð002 mm)
1 Sand 88Ð8 4Ð0 7Ð22 Sandy loam 68Ð8 21Ð0 10Ð23 Loam 40Ð8 38Ð0 21Ð24 Silt clay loam 20Ð8 44Ð2 34Ð55 Silt clay 0Ð8 50Ð4 48Ð8
(Hook et al., 1992). The probe was installed in the centre of the soil column. At each moisture level, 20 datapoints were collected and averaged.
The determination of Ts/Ta
According to Equation (4), Ts/Ta represents the travel time of an EM wave in dry soil. Its value dependslargely on soil texture and bulk density and has to be predetermined for an accurate calibration (Equation (5)).The values of Ts/Ta for four soil types, viz. sand, sandy loam, loam and silt clay loam, at three to four differentbulk densities were determined in the laboratory. Differences in bulk density were achieved by filling thecylinder with an equal volume but a different mass of oven-dried soil. In order to achieve a uniform bulkdensity throughout the whole cylinder, the length of the cylinder was pre-marked with 5 cm increments andthe total amount of soil to be filled was divided into five portions. The soil was added to the cylinder oneportion at a each time and the added soil was compacted with a hammer until its top reached the mark beforethe next portion was added. The value of Ts/Ta was calculated using Equation (5) by assuming that thevolumetric soil water content for oven-dried soil is zero. The top of the soil column matched the end of activesection of the probe. The so-called active section refers to the probe part between the two switching diodes.
Measurement of volumetric soil water content
Oven-dried sandy loam and loam were packed into the PVC cylinder with bulk densities of 1Ð3 g cm�3
and 1Ð4 g cm�3. Water was added to the bottom of the soil columns through two Mariotte bottles untilthe soil was saturated. The top of the soil column was sealed and 20 volumetric water content data werecollected using TDR. Meanwhile, the PVC cylinder was placed on a scale (Precias 3000D, Switzerland;resolution: 0Ð1 g) and the volumetric water content was measured using a conventional gravimetric method(Figure 1). The soil column was then exposed to air, allowing water evaporating from the soil columnsurface. When the decrease in water content reached 0Ð03 cm3 cm�3, the top was sealed and a new roundof measurements took place. The above procedure was repeated until the soil water content reached below0Ð05 cm3 cm�3.
Measurement of soil water content at different temperature
The sandy loam soil was packed into two cylinders to a bulk density of 1Ð3 g cm�3. One was used forsoil water content measurement and other was used as a reference for soil temperature measurement. Sixthermometers were installed in the reference soil column at depths of 30 cm, 20 cm and 10 cm to monitorthe vertical temperature variation. At each depth, two thermometers were installed 3 cm apart to monitorthe horizontal temperature variation. The difference in soil temperature was created by using a temperaturechamber. Inside the chamber the temperature varied from 5 to 45 °C in increments of 5 °C. At each temperature,the soil column water content was changed from 0Ð00 to 0Ð42 cm3 cm�3 in steps of 0Ð06 cm3 cm�3 by addingwater to the bottom of the column through the Mariotte bottles as shown in Figure 1. When the desiredwater content was reached, which was determined by measuring the weight of the soil columns, the top
Copyright 2003 John Wiley & Sons, Ltd. Hydrol. Process. 17, 3601–3614 (2003)

TDR MEASUREMENT OF SOIL WATER CONTENT 3605
Electrical balance
Computer
Probe
Cable
MP-917TDR
Mariottebottle
PVCpipe
Distilledwater
Soil particle
Figure 1. The experimental setup
of the cylinder was sealed to prevent water loss by evaporation. The soil columns were then moved to thetemperature chamber. TDR measurement started 6 h later, assuming that the soil temperature had reachedequilibrium.
Measurement of water content for soil with different clay contents
Three soil samples (loam, silt clay loam and silt clay) were packed into a cylinder with a bulk densityof 1Ð33 g cm�3. The water content of the soil column was increased from zero to 0Ð45 cm3 cm�3 in stepsof 0Ð03 cm3 cm�3 by adding water from the bottom of the cylinder using a Mariotte bottle. The volumetricwater content was measured using TDR and the gravimetric method at each water content level.
RESULTS AND DISCUSSION
The linearity of the relationship between time delay (T/Ta) and volumetric water content for the alternativeprobe
The probe used in the experiment has an epoxy filling between two rectangular metal bars. It is an alternativeprobe structure compared with the common two or three metal rod TDR probes. The question has been raisedabout whether the time delay measured by this epoxy-filled probe is linearly related to that measured bythe rod probe. If the relationship is not linear, then the epoxy-filled-probe-measured T/Ta cannot be simplyconverted to rod-probe-measured T/Ta using two calibration coefficients A and B (MoisturežPoint MP-917Manual), and Equation (5) can not be used for the alternative probe. Studies have shown (Knight et al., 1997)that any probe with its rods completely coated by a material with low permittivity has a relationship thatis not linear. However, if the coating is partial, especially when the coating surrounds less than 30° of therod circumference, then the effect of the coating is not significant. Hook et al. (1992) calibrated the epoxy-filled probe on the basis of a linear relationship between the travel time measured by this probe and by atwo-rod probe with the same length. The linearity of this epoxy-filled probe has been further evaluated byFerre et al. (2000) by using a numerical analysis presented by Knight et al. (1997). They concluded that thisepoxy-filled probe has a highly linear response to the soil relative permittivity, which supports the choice of alinear calibration relationship. The testing conducted in this laboratory also shows a highly linear relationship(R2 D 0Ð987) between measured time delay and volumetric soil water content using this epoxy-filled probe insandy soils (Sun et al., 2000).
Copyright 2003 John Wiley & Sons, Ltd. Hydrol. Process. 17, 3601–3614 (2003)
3606 Y. GONG, Q. CAO AND Z. SUN
Soil layering effect
The water content in the soil column was not uniform. The soil column was wetter at the bottom, becausethe water was added from the bottom of the column, and the soil was drier at the top because of evaporationfrom the surface. Topp et al. (1982) measured volumetric water content of layered profiles by TDR. Theyfound that the travel time through different layers of soils is additive. Therefore, the TDR-measured volumetricwater content of a layered soil column should be the weighted average of the actual water content of the layers.If the water content of a soil layer changes abruptly, then a reflection may arise at the boundary between thewet layer and dry layers, possibly resulting in an erroneous interpretation of the graphic waveform. In thisexperiment, the soil water content changes gradually from the top (dry) to bottom (wet), so no additionalreflection was found between the start and end of the probe, the positions of which were precisely determinedby the switching diodes at both ends of the probe. Nadler et al. (1991) measured soil moisture using TDRin two layers (dry/wet, wet/dry) combinations and concluded ‘volumetric water contents were found to beaccurately determined by the TDR method, regardless of soil layering’. Young et al. (1997) conducted anupward infiltration method to calibrate TDR system and concluded that this method provides a fast andrepeatable calibration, consistent with conventional calibration.
Averaging error due to water-content-dependent sensitivity
Ferre et al. (1996) defined the sensitivity of a TDR probe as the change in measured time delay per unitchange of soil water content. If the sensitivity is dependent on soil water content, then the probe-length-weighted averaging soil water content will be incorrect if the water content varies along the probe. Unlike aTDR probe with two or three metal rods without coating, many alternative probes have nonmetallic materialsplaced in series with the soil, and the average water content measured will be biased towards the water contentrange of greatest sensitivity (Ferre et al., 2000). However, in the same study, Ferre et al. (2000) found thatthe epoxy-filled probe used in this experiment showed ‘very little water content dependence of its sensitivityand should therefore return average water content with little error due to incorrect averaging’.
Soil bulk density effects
The value of Ts/Ta is a measure of the time delay for an EM wave travelling in a dry medium. It is expectedthat soils with high bulk density, or low porosity, will have a larger Ts/Ta value than soils with low bulkdensity and high porosity. The relationship between soil bulk density and its corresponding Ts/Ta is shownin Figure 2, which was generated by pooling all soil bulk densities and their corresponding Ts/Ta values. Thelinear relationship indicates that: (1) the increase in Ts/Ta is the result of increased mass of solid particlesper unit volume, since solid particles possess a higher dielectric constant than that of air—Jacobsen andSchjonning came to (1993) the same conclusion in their experiment; (2) the difference in dielectric constantsof solid particles among sand, silt and clay is small, since all the data fall onto a single linear regression linewith a high R2 value.
Figure 3 compares the measured volumetric soil water contents in sandy loam and loam using TDR andthe gravimetric method. The bulk densities for the sandy loam and loam are 1Ð3 g cm�3 and 1Ð4 g cm�3
respectively, and the corresponding Ts/Ta values are 1Ð67 and 1Ð74 respectively. The Ts/Ta value forindividual soil was pre-input into the MoisturežPoint MP-917 TDR soil moisture instrument. The TDR-measured moisture was found to be in agreement with those determined using the oven-dry method for watercontent range from zero to near saturation (0Ð40 m3 m�3 volumetric water content). This indicates that theTs/Ta value pre-installed in the instrument is correct and the relationship between soil bulk density and Ts/Ta
shown in Figure 2 is valid.According to the calibration equation in Figure 2, the Ts/Ta value increases 0Ð0306 for each 0Ð1 g cm�3
increase in soil bulk density, and this will translate to -0Ð004 m3 m�3 measurement error in soil water content(by applying Equation (5)) if a proper calibration is not conducted. When the Ts/Ta value used is larger thanexpected, the measurement error is negative, and the soil water content is underestimated, and vice versa.
Copyright 2003 John Wiley & Sons, Ltd. Hydrol. Process. 17, 3601–3614 (2003)

TDR MEASUREMENT OF SOIL WATER CONTENT 3607
1.55
1.60
1.65
1.70
1.75
1.80
1.85
0.6 0.8 1.0 1.2 1.4 1.6 1.8 2.0
bulk density g/cm3
Ts/
Tair
y = 0.3061X + 1.2842 R2 = 0.90
silt clay loamloamsandy loamsand
Figure 2. The relationship between soil bulk density and Ts/Ta value
0.0
0.1
0.2
0.3
0.4
0.5
0.0 0.1 0.2 0.3 0.4 0.5
Wat
er c
onte
nt d
eter
min
eded
by
TD
R (
cm3 /
cm3 )
1:1
(a) Sandy
water content determined bygravimetry (cm3/cm3)
0.0
0.1
0.2
0.3
0.4
0.5
0.0 0.1 0.2 0.3 0.4 0.5
Wat
er c
onte
nt d
eter
min
eded
by
TD
R (
cm3 /
cm3 )
water content determined bygravimetry (cm3/cm3)
(b) Loam
1:1
Figure 3. Comparison of soil water contents determined by TDR and gravimetric methods
The Ts/Ta value should be adjusted if an accurate soil water content measurement is required. For ordinaryagricultural soils with bulk density approximately 1Ð2 g cm�3, and according to Figure 2, the Ts/Ta valueshould be 1Ð65. This value is 0Ð1 higher than that suggested by Hook and Livingston (1996).
Malicki et al. (1996) studied the influence of a soil’s solid phase on the dielectric permittivity of the soilover a range of water contents. They found the following relationship between the square root of the dielectricpermittivity and soil bulk density:
√Ka��, �� D 0Ð819 C 0Ð168� C 0Ð159�2 C �7Ð17 C 1Ð18���
Table II compares the calculated square root of dielectric permittivity at different bulk density using theMalicki equation and using the calibration from Figure 2 and Equation (5). At 0Ð30 m3 m�3 soil water contentlevel, the calculated
pKa values using these two methods agreed with each other. The increase in
pKa is 0Ð561
and 0Ð583, using the Malicki equation and using the calibration from Figure 2 and Equation (5) respectively,as soil bulk density going up from 1Ð0 g cm�3 to 1Ð6 g cm�3. However, there is a substantial difference when
Copyright 2003 John Wiley & Sons, Ltd. Hydrol. Process. 17, 3601–3614 (2003)

3608 Y. GONG, Q. CAO AND Z. SUN
Table II. The square root of dielectric permittivity at different soil water content and bulk density calculated using Malicki’sequation, the equation from Figure 2 and Equation (5), and Whalley’s mixing model
Soil waterp
Ka at different bulk densitiescontent
(m3 m�3) Malicki equation Calibration from Figure 2and Equation (5)
Whalley mixture model
1.0 g cm�3 1.6 g cm�3 1.0 g cm�3 1.6 g cm�3 1.0 g cm�3 1.6 g cm�3
0Ð30 3Ð651 4Ð212 3Ð574 4Ð157 3Ð928 4Ð2580Ð10 1Ð981 2Ð330 2Ð384 2Ð568 2Ð340 2Ð6690Ð00 1Ð146 1Ð495 1Ð590 1Ð774 1Ð546 1Ð875
soil water content is low. The rate of increase inp
Ka as soil bulk density increases as predicted by the Malickiequation is faster than that shown in Figure 2. For example, the Malicki equation predicts a 0Ð349 increasein
pKa as the soil bulk density goes up from 1Ð0 g cm�3 to 1Ð6 g cm�3 for dry soil (� D 0). In the same
circumstance, Figure 2 predicts only 0Ð184 increase inp
Ka. The discrepancy may be caused by graduallyunderestimating the soil dielectric permittivity when using the Malicki equation when the soil bulk densityis reducing. For example, for dry soil with 1Ð2 g cm�3 bulk density, the calculated
pKais only 1Ð250 using
the Malicki equation, which gives Ka D 1Ð561. The value of Ka for dry loamy soil should be in the range of2Ð48 to 2Ð55 from a frequency from 100 MHz to 3 GHz (Jordan, 1989). Using the calibration presented inFigure 2, the calculated Ka is 2Ð738, which is much closer to the published data.
Whalley (1993) presented a mixture model, which gives the dielectric permittivity of soil as
K˛a D �K˛
w C �1 � ��K˛s C �� � ��K˛
g
where Ka is the dielectric permittivity of the soil mixture, Kw, Ks and Kg are the dielectric permittivitiesof water, solid and gas phase respectively; � is the total porosity. By choosing the geometric factor ˛ D 0Ð5as Whalley (1993) did, and Ks D 6Ð0 (Jordan, 1989), the mixture model gives a
pKa values very close to
that from the calibration in Figure 2 and Equation (5) (Table II), especially when the soil water content islow. However, the
pKa value calculated using the Malicki equation is substantially lower than that from the
mixture model in the low moisture range.
Clay content effect
Table III shows that, as expected, the slope of the linear relationship between T/Ta and volumetric soilwater content, 1/�K0Ð5
w � 1�, increases as the clay content increases. Only the time delay measured at below0Ð20 m3 m�3 was used to calculate the slope, to avoid possible bulk soil electrical conductivity interferenceat high water content levels in clayey soil. The slope for loam and silt clay loam is not significantly differentfrom that for pure sand. Silt clay shows a large increase in slope. For clayey soil at low water content, asubstantial proportion of soil water is in the bound state, resulting in a reduced permittivity of soil water. Bysolving 0Ð1319 D 1/�K0Ð5
w � 1� we obtain Kw D 73Ð64; this is the permittivity of soil water for silt clay atbelow 0Ð20 m3 m�3 water content, which is smaller than the 80Ð36 for the permittivity of free water at 20 °C.
Table III. The slope, I/�K0Ð5w � 1�, of Equation (5) for soils with different textures
Soil type Silt clay Silt clay loam Loam Pure sand
Clay content (%) 44Ð8 34Ð5 21Ð2 0Slope 0Ð1319 0Ð1252 0Ð1258 0Ð1256
Copyright 2003 John Wiley & Sons, Ltd. Hydrol. Process. 17, 3601–3614 (2003)

TDR MEASUREMENT OF SOIL WATER CONTENT 3609
0
0.1
0.2
0.3
0.4 Silt clay loam
Silt clay
loam
0.5
1 2 3 4 5 6
T/Ta
vol m
oist
ure
m3 /
m3
Figure 4. The relationship between time delay T/Ta and volumetric water content for silt clay loam, silt clay and loam
Topp et al. (2000) estimated the apparent relative permittivity for a soil in both the A and B horizons,where the clay content was 20% and 55% respectively. They found that, at the same soil water content level,the apparent relative permittivity in the B horizon is lower than that in the A horizon. At 0Ð145 m3 m�3
volumetric water content, the calculated Kw based on the apparent dielectric permittivity for horizons A andB is 71Ð1 and 53Ð78 respectively. Sun and Young (2001) tested the relationship between T/Ta and volumetricsoil water content for Rideau clay that contains more than 55% of clay content. They found that, when soilwater content is below 0Ð15 m3 m�3, the slope of Equation (5) increased to 0Ð219 and the calculated Kw wasonly 31 because the majority of the water molecules are bound in this circumstance.
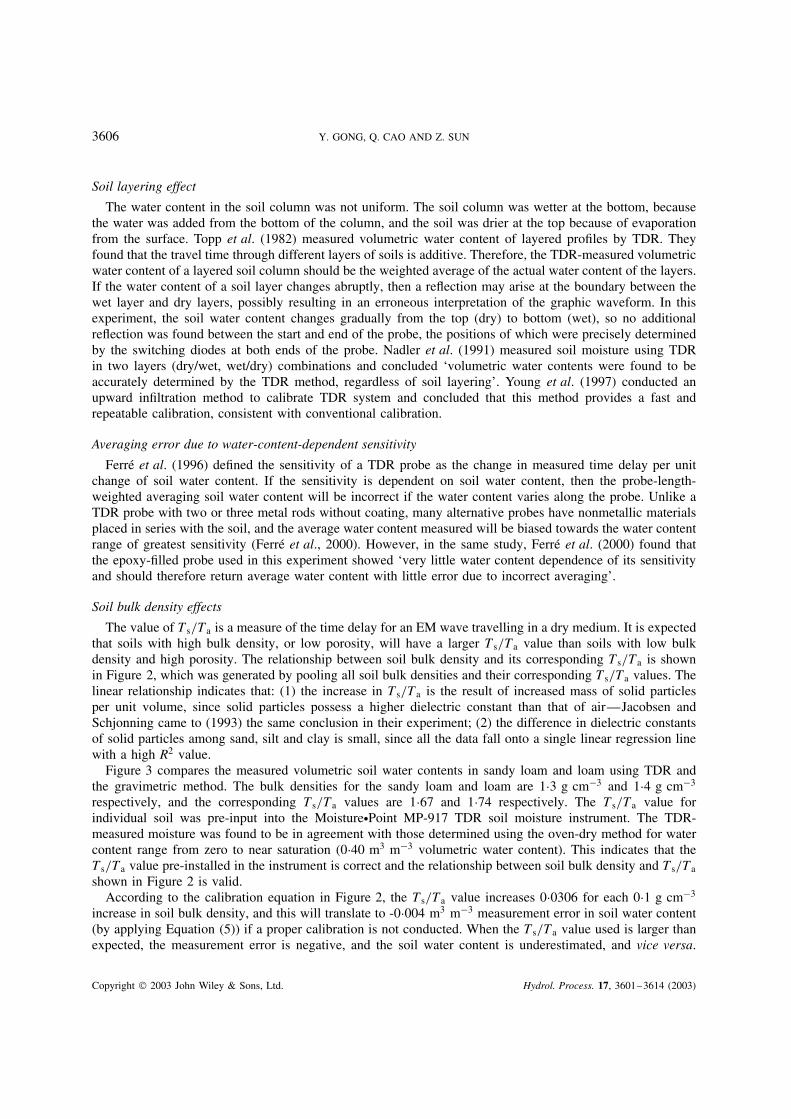
However, in general, the relationship between time delay T/Ta and volumetric soil water content in thetest is not statistically significant different between silt clay loam, silt clay and loam (Figure 4). It hasbeen suggested that the clay content may have a large influence on the relationship between time delayand volumetric water content. Firstly, the bound water associated with clay particles has a much lowerdielectric constant than that of free water. This allows a faster propagating velocity for an EM wave,resulting in an underestimation of water content, especially in the low moisture range where the ratio ofbound water to free water is high. Secondly, clay soils usually possess a higher bulk EC than sandy andloamy soils. The bulk soil EC comes from the ionic concentration in soil solution and from the chargedparticle surface. The EC would cause signal attenuation and an overestimation of water content, especiallyin the high water content range where the EC is high and the ratio of bound water to free water is low(Sun et al., 2000). Therefore, the relationship between time delay T/Ta and volumetric soil water contentwill depart from linear (Sun and Young, 2001). Here, only silt clay with 48Ð8% clay content shows theabove tendency, although it is not statistically significant (Figure 5). The EC of saturated extract of thetested silt clay is less than 3 dS m�1. At 0Ð40 m3 m�3 water content, it contributes 0Ð48 dS m�1 to bulksoil EC by using the Rhoades et al. (1989) equation. However, its high clay content contributes 1Ð10 dSm�1 to bulk soil EC. Therefore, the threshold value for the EC of soil solution at which the soil bulkEC will show its effects is lower for clayey soil than that for sandy soil. There is a turning point atthe 0Ð20 to 0Ð25 m3 m�3 moisture level, where the effect of bound water is balanced by the effect ofEC. Below this level, TDR underestimates soil moisture, and above this level TDR overestimates soilmoisture.
The soils under test did not show significant shrinkage or expansion when water was withdrawn oradded, indicating that they do not contain a large amount montmorillonite. This may explain the lack ofsignificant clay content effect. Kaolinite and illite have a much smaller specific surface and cation exchange
Copyright 2003 John Wiley & Sons, Ltd. Hydrol. Process. 17, 3601–3614 (2003)
3610 Y. GONG, Q. CAO AND Z. SUN
0.1
0
0.2
0.3
0.4
1:1 line
0.5
0 0.1 0.2 0.3 0.4 0.5
gravimetric method measured vol. water content m3/m3
TD
R m
easu
red
vol.
wat
er c
onte
nt m
3 /m
3
Figure 5. TDR-measured volumetric soil water content versus gravimetric method measured soil water content for silt clay
capacity than montmorillonite; therefore, they have far less bound water associated with them. The effectof difference in clay mineralogy on TDR soil water content measurement using TDR deserves furtherinvestigation.
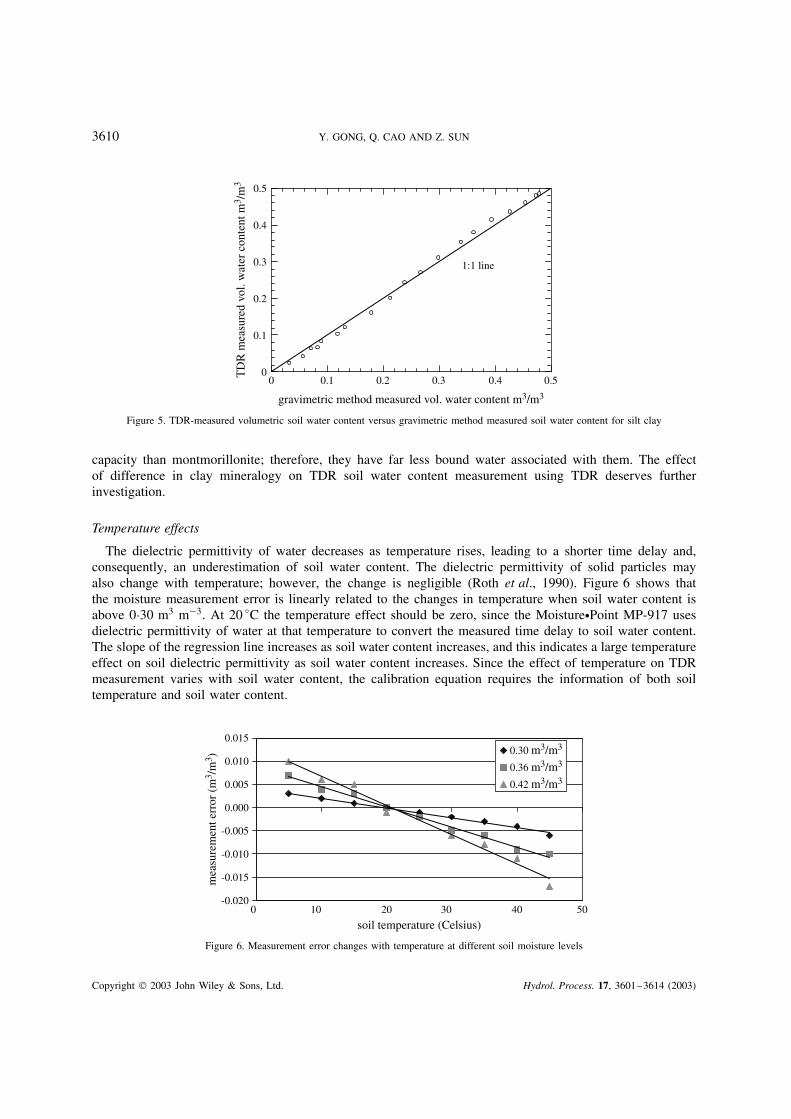
Temperature effects
The dielectric permittivity of water decreases as temperature rises, leading to a shorter time delay and,consequently, an underestimation of soil water content. The dielectric permittivity of solid particles mayalso change with temperature; however, the change is negligible (Roth et al., 1990). Figure 6 shows thatthe moisture measurement error is linearly related to the changes in temperature when soil water content isabove 0Ð30 m3 m�3. At 20 °C the temperature effect should be zero, since the MoisturežPoint MP-917 usesdielectric permittivity of water at that temperature to convert the measured time delay to soil water content.The slope of the regression line increases as soil water content increases, and this indicates a large temperatureeffect on soil dielectric permittivity as soil water content increases. Since the effect of temperature on TDRmeasurement varies with soil water content, the calibration equation requires the information of both soiltemperature and soil water content.
-0.020
-0.015
-0.010
-0.005
0.000
0.005
0.010
0.015
0 10 20 30 40 50
mea
sure
men
t err
or (
m3 /
m3 )
0.30 m3/m3
0.36 m3/m3
0.42 m3/m3
soil temperature (Celsius)
Figure 6. Measurement error changes with temperature at different soil moisture levels
Copyright 2003 John Wiley & Sons, Ltd. Hydrol. Process. 17, 3601–3614 (2003)
TDR MEASUREMENT OF SOIL WATER CONTENT 3611
The calibration equations at 0Ð42 m3 m�3, 0Ð36 m3 m�3 and 0Ð30 m3 m�3 water content level are given byEquations (8)–(10) respectively:
� D �0Ð0006t C 0Ð0132 �8�
� D �0Ð0004t C 0Ð0088 �9�
� D �0Ð0002t C 0Ð0042 �10�
where � is the measurement error due to the temperature effect; � D �m � �v, where �m and �v are theTDR-measured and reference volumetric soil water content (gravimetric method determined) respectively, andt is soil temperature in celsius. The measurement error � should be zero when the test is conducted at 20 °C;however, by applying t D 20 °C to Equations (8)–(10), the calculated � is 0Ð0008 m3 m�3, �0Ð0008 m3 m�3
and 0Ð0002 m3 m�3 respectively. The discrepancy is mainly caused by measurement noise, since the standarddeviations for these measurement are 0Ð002, 0Ð004 and 0Ð003 m3 m�3, which is in the same order or largerthan the measured error (�) at 20 °C.
In general, the calibration equation can be written as
� D a���t C b��� �11�
where a��� and b��� are functions of soil water content. Using the values of slope and intercepts inEquations (8)–(10) we obtain
a��� D �0Ð0033�v C 0Ð0008 �12�
b��� D 0Ð0750�v � 0Ð0183 �13�
For soil water content (�v) of 0Ð600 m3 m�3, the values of a��� and b��� calculated using Equations (12) and(13) are �0Ð001 18 and 0Ð0267. On substituting these numbers into equation (11) we obtain
� D �0Ð001 18t C 0Ð0267 �14�
If the soil temperature is 50 °C, then the magnitude of measurement error calculated using Equation (14)will be 0Ð0323 m3 m�3. Pepin et al. (1995) suggested a temperature correction formula of 0Ð001 750�v °C�1.Their formula shows a 0Ð0315 m3 m�3 measurement error in the same situation. For soil with 0Ð300 m3 m�3
water content, the calculated measurement error at 50 °C is reduced to 0Ð0053 m3 m�3. The calibration isrequired only when soil water content is high and the measurement accuracy demanded is also high.
By substituting a��) and b��� of Equations (12) and (13) into Equation (11) we obtain
� D �m � �v D a���t C b��� D ��0Ð0033�v C 0Ð0008�t C �0Ð0750�v � 0Ð0183�
By separating �v and �m we obtain
�v D �m � 0Ð0008t C 0Ð0183
1Ð075 � 0Ð0033t�15�
Equation (15) can be used to obtain the correct soil water content �v from TDR-displayed soil water content�m if the soil temperature t is known. For example, when the TDR-displayed moisture is 0Ð25 m3 m�3 andsoil temperature is 40 °C, the correct water content calculated using Equation (15) will be 0Ð2506 m3 m�3.The temperature effect is in the order of 1/1000 m3 m�3. However, if the TDR-displayed water content is0Ð50 m3 m�3 and soil temperature is 50 °C, then the correct soil water content will be 0Ð5226 m3 m�3 whenEquation (15) is applied. In this case the TDR-displayed soil water content is 0Ð0226 m3 m�3 less than theactual one, and error of this magnitude cannot be neglected in many applications.
Copyright 2003 John Wiley & Sons, Ltd. Hydrol. Process. 17, 3601–3614 (2003)

3612 Y. GONG, Q. CAO AND Z. SUN
Unlike many other temperature calibration formulas, in which a knowledge of the actual soil water contentsis a prerequisite for calculating the temperature effect, Equation (15) will provide the correct water contentfrom TDR-displayed soil moisture and soil temperature. It is more practical.
The negative correlation between soil temperature and bulk soil dielectric permittivity presented above issimilar to the results from Wraith and Or (1999) on Kidman sandy loam. In their experiment, the TDR-measured volumetric water content decreased 0Ð008 m3 m�3 for soil with 0Ð212 m3 m�3 water content, and0Ð014 m3 m�3 for soil with 0Ð310 m3 m�3 water content when soil temperature increased from 25 °C to45 °C. However, when Equation (11) is applied, the decreases of soil water content are only 0Ð002 m3 m�3
and 0Ð006 m3 m�3. The discrepancy comes from the difference in clay contents between the sandy loam usedin the testing (10Ð2%) and Kidman sandy loam (3Ð0%). The results showed (Or and Wraith, 1999) that thethermodielectric response is affected by how much bound water is released from the soil particle surfaceas temperature increased. The released bound water offsets the decrease in bulk dielectric permittivity offree water caused by temperature increase, leading to less soil water content measurement error. Figure 7shows that, for water content below 0Ð30 m3 m�3, the measured soil moisture by TDR hardly varied withtemperature. This is because at low soil water content a large proportion of water is held by solid surface,and its release from the bound state as temperature increases balances the effect of decrease of free waterdielectric permittivity.
Applying Kw D 80Ð36, the dielectric permittivity of free water at 20 °C, to Equation (5) results in0Ð02 m3 m�3 underestimation of water content (Table IV) for tested sandy loam with 0Ð36 m3 m�3 water
0.00
0.05
0.10
0.15
0.20
0.25
0.30
vol.
wat
er c
onte
nt (
m3 /
m3 )
0.06 m3/m3
0.12 m3/m3
0.18 m3/m3
0.24 m3/m3
temperature (Celsius)0 10 20 30 40 50
Figure 7. The relationship between temperature and measured volumetric soil water content when soil water content is below 0Ð30 m3 m�3
Table IV. The changes of dielectric permittivity of free water, measured time delay, and calculated water contentsfor sandy loam soil with 0Ð36 m3 m�3 water content
Temperature(°C)
Kw (freewater)
Measured timedelay T/Ta
Calculated watercontent usingKw D 80Ð36
Calculated water contentusing Kw from column
#2 at correspondingtemperature
20 80Ð36 4Ð510 0Ð360 0Ð35925 78Ð54 4Ð494 0Ð358 0Ð36230 76Ð76 4Ð470 0Ð355 0Ð36335 75Ð03 4Ð462 0Ð354 0Ð36740 73Ð35 4Ð438 0Ð351 0Ð36945 71Ð70 4Ð400 0Ð340 0Ð370
Copyright 2003 John Wiley & Sons, Ltd. Hydrol. Process. 17, 3601–3614 (2003)

TDR MEASUREMENT OF SOIL WATER CONTENT 3613
and at 45 °C. However, the use of Kw D 71Ð7, the permittivity of free water at 45 °C, in Equation (5) resultsin 0Ð01 m3 m�3 over-correction of water content. A possible explanation is that the decrease in dielectricpermittivity for water in soil is slower than that of free water described by Equation (7), because the decreaseis buffered by the release of bound water. Therefore, Equation (7) cannot be used to predict the dielectricpermittivity of soil water at different temperature for soil with high clay content.
A calibration that includes the clay content as an input parameter should be more universal thanEquation (15). The EC of soil solution also increases as soil temperature increases, and this may lead toa noticeable overestimation of water content when the EC level exceeds a certain level. In this experiment,the EC of soil solution is low and surface conductivity is also low, since it is a sandy soil with only 10Ð2%clay content. For saline soils, the EC of soil solution may be an additional parameter that may need to beincluded in the calibration.
CONCLUSIONS
The effect of soil bulk density, clay content and soil temperature on TDR soil water content measurementhas been discussed. The time delay T/Ta or the square root of the apparent dielectric permittivity of soil Ka
increases linearly with soil bulk density. A value of 1Ð65 for Ts/Ta (the square root of apparent dielectricpermittivity of dry soil) was suggested. For soil with high clay contents, TDR underestimates soil watercontent in the low moisture range because the bound water effect is dominant. TDR will overestimate soilwater content in the high moisture range because the soil EC effect is dominant. The extent of influencelargely depends on the clay type. The temperature affects the TDR soil moisture measurement by changingthe dielectric permittivity of free water and the releasing of bound water. A practical calibration equationhas been developed, in which the information of soil temperature and TDR-instrument-displayed moisture isrequired.
ACKNOWLEDGEMENTS
This research collaboration with the R & D Division of ESI Environmental Sensors Inc. in Canada, wassupported financially by the Ministry of Science and Technology (G1999011709) and the Excellent YoungTeachers Program of the Ministry of Education of the People’s Republic of China.
REFERENCES
Dalton FN. 1992. Development of time domain reflectometry for measuring soil water content and bulk soil electrical conductivity. InAdvances in Measurement of Soil Physical Properties: Bring Theory into Practice, Topp GC (ed.). Soil Science Society of America,Special Publication 30. Soil Science Society of America: Madison, WI; 143–167.
Dirksen C, Dasberg SI. 1993. Improved calibration of time domain reflectometry soil water content measurements. Soil Science Society ofAmerica Journal 57: 660–667.
Ferre PA, Knight JH, Rudolph DL, Kachanoski RG. 1996. Spatial averaging of water content by time domain reflectometry: implicationsfor twin rod probes with and without dielectric coatings. Water Resources Research 32: 271–280.
Ferre PA, Rudolph DL, Kachanoski RG. 2000. A numerically based analysis of the sensitivity of conventional and alternative time domainreflectometry probes. Water Resources Research 36: 2461–2468.
Herkelrath WN, Hamburg SP, Murphy F. 1991. Automatic real-time monitoring of soil moisture in a remote field area with time domainreflectometry. Water Resources Research 27: 857–864.
Hilhorst MA, Dirksen C, Kampers FWH, Feddes RA. 2001. Dielectric relaxation of bound water versus soil matric pressure. Soil ScienceSociety of America Journal 65: 311–314.
Hook WR, Livingston NJ. 1996. Errors in converting time domain reflectometry measurements of propagation velocity to estimates of soilwater content. Soil Science Society of America Journal 59: 35–41.
Hook WR, Livingston NJ, Sun ZJ, Hook PB. 1992. Remote diode shorting improves measurement soil water by time domain reflectometry.Soil Science Society of America Journal 56: 1383–1391.
Jacobsen OH, Schjonning P. 1993. A laboratory calibration of time domain reflectometry for soil water measurement including effects ofbulk density and texture. Journal of Hydrology 151: 147–157.
Copyright 2003 John Wiley & Sons, Ltd. Hydrol. Process. 17, 3601–3614 (2003)

3614 Y. GONG, Q. CAO AND Z. SUN
Jordan EC. 1989. In Reference Data for Engineers: Radio, Electronic, Computer, and Communications , 7th edn. Howard W. Sam & Company:Indiana, USA; 4–23.
Knight JH, Ferre PA, Rudolph DL, Kachanoski GR. 1997. A numerical analysis of the effects of coatings and gaps upon relative dielectricpermittivity measurement with time domain reflectometry. Water Resources Research 33(6): 1455–1460.
Ledieu J, de Ridder P, Dautrebande S. 1986. A method of measuring soil moisture by time-domain reflectometry. Journal of Hydrology 88:319–328.
Malicki MA, Walczak RT, Koch S, Fluhler H. 1994. Determining soil salinity from simultaneous readings of its electrical conductivityand permittivity using TDR. In Symposium and Workshop on Time Domain Reflectometry in Environmental, Infrastructure, and MiningApplications , United States Department of Interior Bureau of Mines: 328–336.
Malicki MA, Plagge R, Roth CH. 1996. Improving the calibration of dielectric TDR soil moisture determination taking into account thesolid soil. European Journal of Soil Science 47: 357–366.
Nadler A, Dasberg S, Lapid I. 1991. Time domain reflectometry measurement of water content and electrical conductivity of layered soilcolumns. Soil Science Society of America Journal 55: 938–943.
Or D, Wraith JM. 1999. Temperature effects on soil bulk dielectric permittivity measured by time domain reflectometry: a physical model.Water Resources Research 35: 371–383.
Pepin S, Livingston NJ, Hook WR. 1995. Temperature dependent on measurement errors in time domain reflectometry determinations ofsoil water. Soil Science Society of America Journal 59: 38–43.
Rhoades JD, Manteghi NA, Shouse PJ, Alves WJ. 1989. Soil electrical conductivity and soil salinity: new formulations and calibrations.Soil Science Society of America Journal 53: 433–439.
Roth K, Schulin R, Fluhler H, Attinger W. 1990. Calibration of time domain reflectometry for water content measurement using a compositedielectric approach. Water Resources Research 26: 2267–2273.
Sun ZJ, Young GD. 2001. Saline clayey soil moisture measurement using time domain reflectometry. In TDR 2001: The Second InternationalSymposium and Workshop on Time-Domain Reflectometry for Innovative Geotechnical Applications , North Western University, Illinois,USA.
Sun ZJ, Young GD, McFarlane R, Chambers BM. 2000. The effect of soil electrical conductivity on moisture determination using time-domain-reflectometry in sandy soil. Canadian Journal of Soil Science 80(1): 13–22.
Topp GC, Davis JL, Annan AP. 1980. Electromagnetic determination of soil water content: measurements in coaxial transmission lines.Water Resources Research 16: 574–582.
Topp GC, Davis JL, Annan AP. 1982. Electromagnetic determination of soil water content using TDR: I. Applications to wetting fronts andsteep gradients. Soil Science Society of America Journal 46: 672–684.
Topp GC, Zeglin S, White I. 2000. Impacts of real and imaginary components of relative permittivity on time domain reflectometrymeasurements in soil. Soil Science Society of America Journal 64: 1244–1252.
Weast RC (ed.). 1986. Handbook of Physics and Chemistry , 67th edn. CRC Press: Boca Raton, FL.Whalley WR. 1993. Considerations on the use of time-domain reflectometry (TDR) for measuring soil water content. Journal of Soil Science
44: 1–9.White I, Zegelin SJ, Topp GC, Fish A. 1994. Effect of bulk electrical conductivity on TDR measurement of water content in porous media.
In Symposium and Workshop on Time Domain Reflectometry in Environmental , Infrastructure, and Mining Applications, United StatesDepartment of Interior Bureau of Mines; 294–308.
Wraith JM, Or D. 1999. Temperature effects on soil bulk dielectric permittivity measured by time domain reflectometry: experimentalevidence and hypothesis development. Water Resources Research 35: 361–369.
Wyseure GCL, Mojid MA, Malik MA. 1997. Measurement of volumetric water content by TDR in saline soils. European Journal of SoilScience 8: 347–354.
Young MH, Fleming JB, Wierenga PJ, Warrick AW. 1997. Rapid laboratory of time domain reflectometry using upward infiltration SoilScience Society of America Journal 61: 707–712.
Copyright 2003 John Wiley & Sons, Ltd. Hydrol. Process. 17, 3601–3614 (2003)


