
1
The Effect of Forest Structureon Amphibian Abundance and Diversityin the Chicago Region
Victoria A. Nuzzo and Kenneth S. Mierzwa
Citizens for ConservationU.S. Environmental Protection AgencyGreat Lakes National Program OfficeLake County Forest Preserve DistrictForest Preserve District of Will County
March 19, 2000

This page intentionally left blank

3
The Effect of Forest Structureon Amphibian Abundance and Diversity
in the Chicago Region
Principal Investigators:
Victoria A. Nuzzo1403 Sovocool Hill Road
Groton NY [email protected]
Kenneth S. Mierzwa1647 N. Clybourn AvenueChicago IL 60614-5507
Project Administration:
Citizens for Conservation1086 Camellia Place
Fox River Grove, IL 60021 Thomas W. Vanderpoel
Funding Sources and Cooperating Agencies:
United States Environmental Protection AgencyGreat Lakes National Program Office (GLNPO)
77 W. Jackson BoulevardChicago, IL 60604-3590GLNPO Project GL98114
GLNPO Project Officer: Kent Fuller
Lake County Forest Preserve District2000 N. Milwaukee Avenue
Libertyville, IL 60048Jim Anderson
Forest Preserve District of Will CountyP.O. Box 1069
Joliet, IL 60434-1069Dave Mauger
March 19, 2000

The Effect of Forest Structure on Amphibian Abundance and Diversityin the Chicago Region
Victoria A. Nuzzo and Kenneth S. Mierzwa
SUMMARY
Amphibian populations are under increasing threat in the Chicago region due to habitat loss and habitatdegradation. The impacts of habitat loss are self-evident and well documented. The impacts of habitatdegradation are less clear. In the Chicago Region the majority of forests have been degraded (altered fromtheir natural pre-settlement condition) by grazing, logging, and fire exclusion, and excessive deer herbivory.We investigated whether amphibian abundance and diversity was related to the condition of upland forestsadjacent to breeding ponds. We monitored vegetation composition and amphibian abundance in April andJune, 1999, in six high quality (Grade B) forests and six low quality (Grade C and D) forests adjacent to pondsin Lake County (eight sites) and Will County (four sites), Illinois.
A total of 205 amphibians of six species were recorded at all sites in drift fences (65 trap-nights at each site,total 780 trap-nights). The six high quality forests supported higher amphibian species richness and diversitythan the six low quality forests, and nonsignificantly higher numbers of amphibians. Down wood wassignificantly more abundant in the higher quality forests, which had more and larger logs, especially well-decayed logs, than the lower quality forests. Overstory tree density was lower in the high quality forests, dueto the lower abundance of trees in smaller size classes. Cover and species diversity of herbaceous vegetationwas similar in both high and low quality forests. When forests were grouped on the basis of amphibianabundance (six ‘better’ habitat sites vs six ‘poorer’ habitat sites) percent cover of herbaceous vegetation inboth April and June was significantly higher in sites with greater numbers of amphibians.
Multiple linear regression indicated that 1) amphibian abundance was higher in sites with higher cover ofherbaceous vegetation in June, and 2) the presence of water was an important determinant of amphibianabundance. Amphibian abundance was most closely related to the length of time that ponds retained water(ponds with later dry dates permit a greater percentage of larvae to achieve metamorphosis), and the numberof ponds within 0.5 km. These results indicate that hydrology is the dominant force driving amphibianpopulations in upland forests in the Chicago Region, and forest structure is important only when hydrologyis suitable. By implication, amphibian populations in sites with suitable hydrology (clustered ponds, one ormore that retain water through mid-July) and unsuitable structure (low herbaceous cover in June) may benefitif the vegetational structure is managed. We propose two ways to test this premise. First, expand the currentstudy to include multiple ponds within several sites, over several years. Second, actively manage half of theadjacent upland forests for increased groundlayer vegetation, and monitor the response of the amphibiancommunity to these changes.
Specific site management strategies supported by the results of this study include removal of drain tiles andfilling of ditches; restoration or creation of additional wetlands which hold water well into the summer butdry in at least some years; management for increased leaf litter in spring and increased herbaceous vegetationin summer; and understory thinning through removal of exotic or weedy shrubs and saplings, and judicioususe of prescribed fire. Pending the outcome of current research on fire effects, we encourage either very earlyspring or late fall burns (when few amphibians are surface active), and either a conservative fire-returninterval or use of multiple burn units around the best amphibian breeding wetlands.
5
INTRODUCTION
Researchers interested in assessing interactions between amphibians and upland habitat havefocused on areas characterized by distinct differences, comparing old growth forests to recentlylogged forest stands (Ash, 1997; Welsh and Lind 1991, 1995; Petranka et al. 1993; Pearman, 1997),undeveloped sites to developed sites (Delis et al. 1996, Dodd 1996, Means et al. 1996), disparatehabitat types (Jones 1988), or sites subjected to different logging treatments (Renken, 1997). Nostudies have investigated the impact of gradual habitat degradation on amphibian abundance andspecies richness, nor the relationship between forest quality and amphibian abundance and diversity.
The majority of upland forests in the Chicago Region have been moderately to severely degraded byurban development (fragmentation), land use activities (fire suppression, grazing, logging), white-tailed deer herbivory, and invasion of non-indigenous species (Bowles et al. 1998). Few of theforests in the Chicago region retain high natural quality, yet upland forest provides critical habitat forat least six local amphibian species (Mierzwa 1998; Phillips et al. 1999). Many amphibians are non-migratory or short distance migrants (Phillips and Sexton 1989; Madison 1997) and have smallhome ranges (Kleeberger and Werner 1983). Habitat-restricted species, such as Ambystomamaculatum and Rana sylvatica are likely more impacted by habitat degradation than habitatgeneralist species, such as Bufo americanus and Rana catesbeiana.
This study was an investigation of the relationship between forest structure (and, by implication,natural quality) and amphibian diversity and abundance in the Chicago Region. Specific researchquestions were: 1) Is there a significant difference in abundance or diversity of amphibians in highvs low natural quality forests?; and 2) If so, what factors are associated with higher amphibianabundance or diversity? Adult pond-breeding salamanders spend the majority of the year in uplandhabitat, in underground refuges (Semlitsch 1998) with occasional intervals of surface movement andforaging (Madison and Farrand 1997). We therefore also investigated whether the ‘natural quality’of the upland forests affected salamander survival, specifically, were adult salamander numbershigher in high quality forests than low quality forests adjacent to breeding ponds. We hypothesizedthat high quality natural sites would support more species, and higher abundance, of amphibiansthan low quality sites. Further, we hypothesized that high quality sites would be more likely tosupport “habitat restricted” species, and low quality sites would support “habitat generalist” species.This information is critical for the long-term preservation of amphibians within the Chicago region,where many forest species survive in relatively isolated populations within existing preserves..
METHODS
Study sites were selected that: 1) consisted of a minimum of 40 ha of contiguous wooded habitat inpublic ownership; 2) contained one or more known or probable amphibian breeding ponds, definedas ephemeral ponds at least 10cm deep and 20m diameter in spring 1999. Plots were located at least50m from an edge, defined as a road, trail, housing development or field, and at least 500m from anyother study site (Ambystoma maculatum travels a mean of 125m between upland and breedinghabitats, and 95% remain within 164m of the breeding pond; Semlitsch 1998); and 3) could be pairedon the basis of assumed natural quality (INAI grade A or B vs INAI Grade C or D) with another study
site that a) had a similar sized pond with similar vegetation and canopy cover, b) had a similar uplandforest community type, and c) was located in the same forested tract or in a nearby forested tract.Twelve sites were located that met these criteria. Eight were in Lake County, 30 miles north ofChicago, and four were in Will County, 30 miles south of Chicago (Figure 1 and Table 1). Withineach county, sites were paired on the basis of pond size and vegetative structure, and apparent naturalquality of the adjacent upland forest of similar size, soil, hydrology, and aspect. All forests werelocated within the Northeastern Morainal Division (Schwegman, 1973) to minimize biogeographicvariation in the potential species assemblage.
“Natural quality” is a qualitative assessment of the perceived similarity of a natural community to thepresettlement condition, based on visual evidence of past impacts. While used extensivelythroughout Illinois and other states, “natural quality” lacks a quantitative basis that wouldsubstantiate the qualitative assignments, and that would allow comparisons between sites withsimilar or dissimilar assigned grades. While most experienced natural area biologists agree on theassignment of sites to very high or very low natural quality, there is a large grey area for sites betweenthese two extremes.
We initially intended to sample mesic upland forests adjacent to ponds of similar size and structure,with the forests differing primarily in natural quality; very high (rich herbaceous understory,oldgrowth overstory) and very low (bare understory or an understory dominated by nonindigenousvegetation, and young or highly disturbed overstory). We failed to locate any Grade A mesic forestsadjacent to suitable ponds, and used
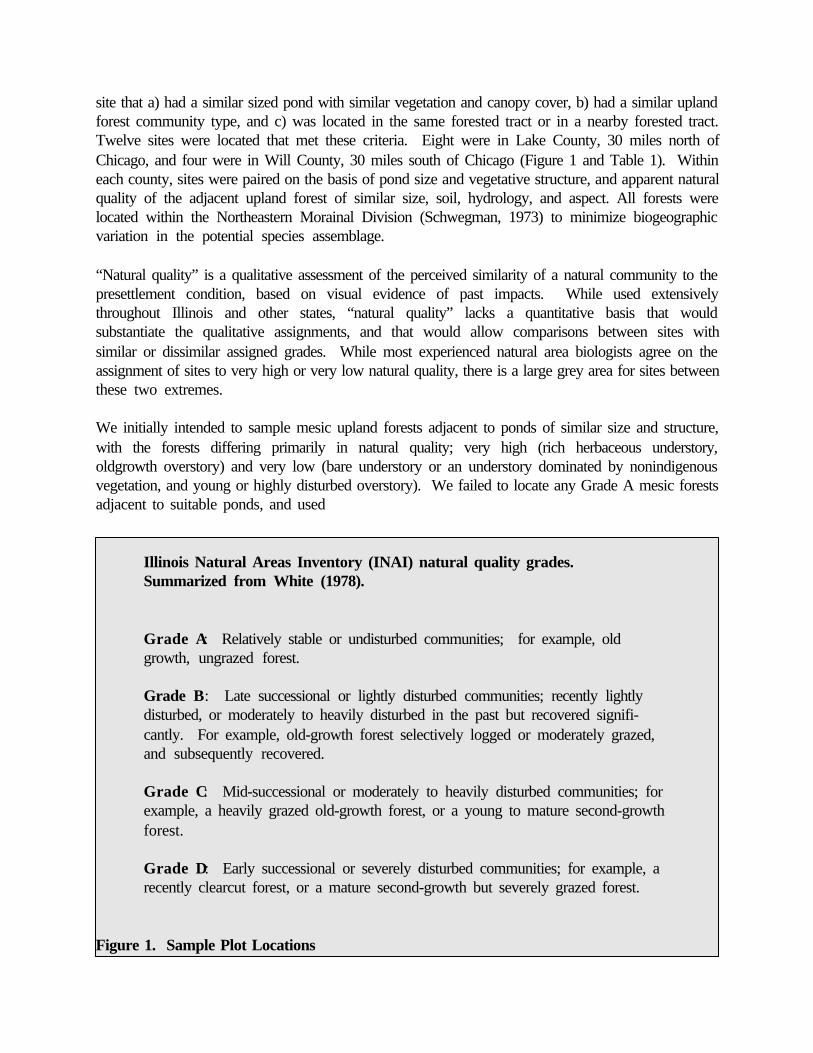
Illinois Natural Areas Inventory (INAI) natural quality grades.Summarized from White (1978).
Grade A: Relatively stable or undisturbed communities; for example, oldgrowth, ungrazed forest.
Grade B: Late successional or lightly disturbed communities; recently lightlydisturbed, or moderately to heavily disturbed in the past but recovered signifi-cantly. For example, old-growth forest selectively logged or moderately grazed,and subsequently recovered.
Grade C: Mid-successional or moderately to heavily disturbed communities; forexample, a heavily grazed old-growth forest, or a young to mature second-growthforest.
Grade D: Early successional or severely disturbed communities; for example, arecently clearcut forest, or a mature second-growth but severely grazed forest.
Figure 1. Sample Plot Locations

7
Grade B forests as our “high quality” sites. We found only one pair of sites that met the selectioncriteria (Ryerson 5 and Lake-Cook). Consequently, we expanded the selection criteria to includedry-mesic, mesic, and wet-mesic forests, and also a range in ‘low’ natural quality (Grade C andGrade D). Thus, within pairs there was a distinct difference in natural quality, with one plotobviously more degraded than the other, but among all plots this distinction was less evident, and theplots formed a gradient of both natural quality and community type. Establishing study site criteriain the office helps focus the search for suitable sites, but locating sites that meet these criteria is oftendifficult, with the result that site selection criteria must often be expanded to allow a minimumnumber of replicate study sites (Petranka 1994).
Table 1. Sample Plot Coordinates
Plot Name County Latitude Longitude UTM E UTM N
MacArthur Lake 42 14 42 087 55 54 423084 4677406Daniel Wright Lake 42 12 50 087 55 22 423826 4673943Elm North Lake 42 13 00 087 54 52 424529 4674216Elm South Lake 42 12 55 087 54 44 424711 4673964Ryerson North Lake 42 10 50 087 54 27 424991 4670295Ryerson South Lake 42 10 20 087 54 17 425280 4669339Ryerson 5 Lake 42 10 35 087 54 21 425187 4669773Lake-Cook Lake 42 09 06 087 54 05 425480 4667096Plum West Will 41 27 02 087 33 44 453131 4588934Plum East Will 41 27 10 087 33 27 453448 4589126Thorn 19 Will 41 27 43 087 40 58 442977 4590262Thorn 13 Will 41 27 29 087 40 52 443170 4589840
Within each site a single 0.25ha (50m x 50m) plot was located, with the plot center approximately25m from the edge of the pond. We initially intended to establish 1ha plots, but found that mostponds were located less than 100m from an edge or disturbance. In the Chicago region virtually alllarge forested tracts that contain ephemeral/flatwoods ponds are publicly owned, and the majorityhave trail systems that traverse the entire tract, leaving few areas sufficiently isolated from trails andedges to meet the site selection criteria. Therefore, plot size was reduced.
We chose to conduct high intensity sampling (both amphibians and vegetation) in a relatively lownumber of plots (n=12), given the tradeoffs between number of replicates, plot size, and samplingeffort (Hairston 1989 in Petranka 1994), and the difficulty in locating suitable study sites.
Data Collection, Amphibians and reptiles — Amphibians and reptiles were sampled with driftfences and time-constrained visual encounter surveys (Heyer et al., 1994; Sutherland, 1996), withdrift fences installed at least one week prior to sampling activities. A single drift fence array wasinstalled at the center of each sample plot, oriented parallel to and approximately 25m distant fromthe pond. Drift fences were constructed of aluminum flashing, 30m long and 50cm high, embeddedseveral cm into the substrate. The array included two funnel traps constructed from cylinders ofaluminum window screening and plastic funnels, one placed at each end of the drift fence, and two5l buckets buried flush with the substrate surface at the center of the fence, one placed on each side
of the fence. Drift fences were checked at one to two day intervals over a three week period in spring(April 24 to May 18 1999) when early breeding amphibian species were leaving ponds and laterbreeding species were arriving, and a four week period in summer (June 22 to July 25 1999) whenimmature amphibians were leaving the ponds. Spring drift fence sampling was timed to coincidewith the movement of early breeding species away from the ponds. This typically results in fewercaptures than during the earlier in-migration period. However, post-breeding animals arepresumably moving more slowly and spending time foraging, and thus give a better representationof terrestrial habitat use.
All captured animals were identified to species and released away from the fence in the direction oforiginal movement to minimize chances of recapture. Because most movement is directional, eithertoward or away from the pond (Dodd and Cade 1998), we assumed that placement of the animal onthe opposite side of and several meters from the drift fence was sufficient to prevent the sameanimals from being recaptured. Results are reported as catch per trap night, with a trap night beingthe equivalent of a 24 hour period of sampling with each 30m long drift fence. When drift fenceswere not in use funnel traps were removed and buckets covered.
Time constrained visual encounter surveys were conducted at each site within 48 hours of rainfallby two trained observers on four visits between April 16 and June 1, 1999. Search area centered onthe drift fence and covered the entire plot on each visit. Each round of sampling was conducted bythe same individual(s) at all plots, to minimize bias. The observers turned logs and other coverobjects, and observed animals under cover or active and in the open (Welsh and Lind, 1991;Churchwell and Mierzwa, 1998). Results are reported as catch per person hour.
Data Collection, Vegetation — Structure and composition of each forest was recorded within the0.25ha (50m x 50m) plot centered on the drift fence array, using a systematic sampling design(Elzinga et al 1998). Five parallel 50m transects were established along a baseline parallel to and25m distant from the drift fence, and more or less following the pond edge; thus, transects bisectedthe drift fence and extended from pond edge 50m into the forest. The first transect was randomlylocated within the first 10m interval along the baseline, and the remaining transects weresystematically located at 10m intervals. Groundlayer data were recorded in 25 permanent 1m2
quadrats, five per transect; the first quadrat was randomly positioned within the first 10m of transect,and the remaining four quadrats were then systematically located at ten meter intervals.Groundlayer data consisted of presence and estimated cover (within 13 cover classes) of all vascularspecies <1m tall, and of exposed soil, wood, and leaf litter.
Shrub and tree data were recorded in 13 circular 100m2 (5.78m radius) quadrats centered on alternategroundlayer quadrats. Density was recorded by species for all woody plants >1m tall and <10cm dbhin three size classes; <1-2m tall; >2m tall and <5cm dbh; and 5-9.9cm dbh, and density and diameterat breast height were recorded by species for all trees (> 10 cm dbh). Groundlayer data were recordedin both April and June as we anticipated seasonal changes, while shrub and tree data were recordedonly in April.
Abiotic features were recorded within the 1m2 quadrats. Litter depth, canopy cover, and vegetation“thickness” were recorded in April and June. Litter depth was measured to the nearest cm at four
9
points/quadrat. Canopy cover was measured at 0.3m above ground level using a concavedensiometer. Vegetation thickness was measured by recording number of 30cm2 (6cm x 5cm)squares obscured by vegetation (observed from 4m distant at a height of 1.5m above ground), on aboard 0.30m x 2.0m, in four vertical layers; 0-.25m, >.25-.50m, >.50-1.0m and >1.0-2.0m aboveground (100 squares/vertical meter, maximum 200 squares total). Diameter of all stumps and downlogs >10cm in diameter were recorded to the nearest cm, and assigned to one of five ‘decay classes’(Maser et al. 1979: 1= newly fallen tree with intact bark, branches and trees; 2=sagging slightly, withintact bark, some branches, and no twigs; 3=sagging near ground, with sloughing bark and no largebranches; 4=completely on ground with little or no bark, and punky wood; 5= well decayed, with softpowdery wood and invasion of roots and seedlings). Because we were interested in measuring actualavailable habitat/shelter, we recorded only that portion of down logs that was actually on or within3cm of the ground surface.
Data collection, wetland — Surface area of the pond was measured in the field and from aerialphotographs. Depth was recorded at 5m intervals beginning at the pond edge and extending acrossthe pond, along three transects parallel to vegetation transects and at right angles to the center of thedrift array.
Data collection, landscape -- Features potentially affecting amphibian and reptile metapopulationswere measured from one inch = 400 foot black and white aerial photographs, supplemented withcoarser scale color infrared photos for most sites. The number of known or potential amphibianbreeding wetlands within 0.5km was noted; this distance was chosen based on the greatestdocumented dispersal distance for juvenile blue-spotted salamanders in the Chicago Region(Mierzwa and Beltz, 1999). Also measured was the distance to the nearest known or probablebreeding wetland, and the distance to the nearest forest edge.
Data Analysis: Amphibian data consisted of a single value/site, and therefore we used the meanvalue (average among quadrats at each site) for each environmental variable in all statistical tests.Because sites formed a gradient of natural quality and community type, we used stepwise multipleregression (using drift fence data) to determine if specific habitat features of the upland forests wereassociated with higher amphibian abundance and diversity. Variables for each regression wereselected with the Best Subset Regression procedure. We used two-tailed t-tests to determine if‘high’ quality sites collectively differed significantly from ‘low’ quality sites in amphibianabundance and diversity, and biotic and abiotic variables. We used paired t-tests to determine if plotpairs had similar between-plot differences in amphibian abundance and diversity, and biotic andabiotic variables.
Plots were ranked for amphibian habitat quality using total drift fence data (spring and summercombined). Two methods were used; the first ranked sites from high to low on the basis of total driftfence abundance, combining salamanders, toads, and frogs. The second method independentlyranked sites from high to low for salamanders (two relatively specialized forest habitat species),toads (one habitat generalist), and frogs (three species, two usually associated with herbaceousvegetation and one with woodland habitat), and then summed the three ranks. Both methodsproduced similar rankings of sites. The six sites with the highest abundance of amphibians wereclassified as ‘good’ habitat and the remaining six sites as ‘poor’ habitat. Two-tailed t-tests were then

used to test for significant differences between the ‘good’ and ‘poor’ amphibian sites. Consideringtoads (Bufonidae) and frogs (Hylidae and Ranidae) separately is a somewhat artificial split in ataxonomic sense; however it does take into consideration the presumed physiological andbehavioral adaptations of toads for an existence in relatively xeric conditions.
All data were tested for homogeneity of variance, then tested for significant differences usingparametric (t-tests) or non-parametric (Kruskal-Wallis) tests as appropriate. Statistical analysis wasconducted with Statistix (Analytical Software 1996). Reptile data are presented in tables butwere notincluded in statistical analysis as the project focused on amphibian use of upland forests.Detrended correspondence analysis was conducted on groundlayer and overstory data to determineif stands clustered on the basis of natural quality or amphibian abundance and diversity, and to assesswhich variables were most closely associated with a) natural quality and b) amphibian richness anddensity. Multivariate analysis was conducted with PC-ORD (McCune 1993).
RESULTS
A total of 205 amphibians of six species were recorded at all sites in drift fences (65 trap-nights ateach site, total 780 trap-nights; Table 2). The highest abundance and diversity were recorded at ElmNorth, where 42 salamanders, nine toads, and 14 frogs were captured. The lowest abundance wasrecorded at Lake-Cook, where no amphibians were captured during the study period. Mostamphibians were recorded during the spring capture period; 80% of salamanders, 41% of toads, and92% of frogs.
Time constrained visual encounter surveys resulted in a total of 74 captures at all sites (2.5 hours/site; Table 2). Ninety-six percent of captures were of one species, Ambystoma laterale. Singleindividuals were captured of Pseudacris triseriata, Rana pipiens, and Thamnophis sirtalis.
Multiple linear regression indicated that just seven of the tested variables explained most of thedifferences in amphibian abundance (Table 3). Three of these variables reflected vegetationstructure; percent cover of herbaceous vegetation in June, percent cover of leaf litter in April, andhorizontal vegetation thickness in April, while four of the variables reflected the presence of water;average pond depth, pond drydate, number of ponds within 0.5km, and distance to the nearest pond.Pond drydate was positively and significantly correlated with both pond depth and pond number(p<0.01). The former correlation is expected, as deeper ponds tend to retain water longer, but thelatter correlation is likely an anomaly dependent on two sites (Thorn 13 and Thorn 19) that retainedwater throughout the study period, and were also near a large number of other ponds. When thesetwo sites were omitted, no correlation was detected between pond number and dry date (p=0.62),while the correlation between pond depth and drydate remained strong (p<0.01). Therefore, onlypond drydate was used in multiple regressions, when both drydate and pond number were identifiedby the best subset regression procedure.
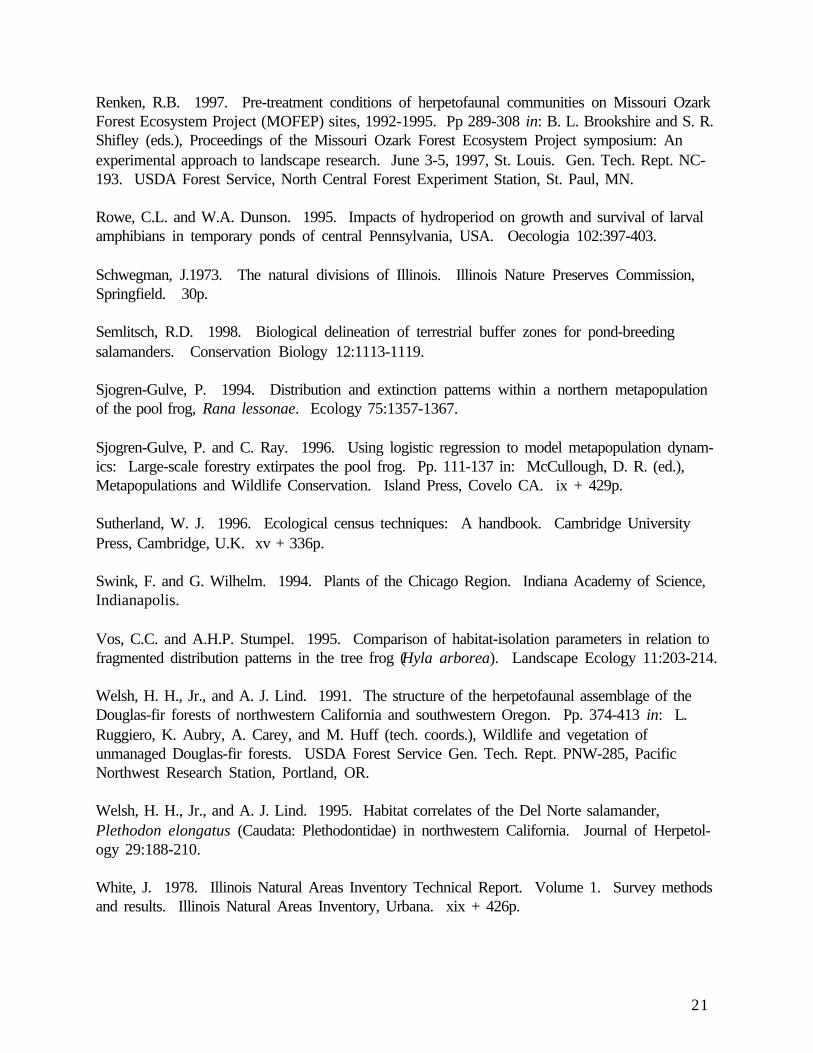
Salamanders, primarily Ambystoma laterale and some Ambystoma maculatum, were recorded at 11of the 12 sites (no amphibians were recorded at the 12th site) and were the dominant amphibian groupat seven sites. Eighty percent of salamanders were captured in April. Salamander abundance was
11
significantly and positively related to pond depth and cover of herbaceous vegetation in June(Figures 2a and 2b). Together, these two factors accounted for 64% of the variation in totalsalamander abundance, and 67% of the variation in April salamander abundance. In June,salamander abundance increased significantly as a function of pond drydate (Figure 2c).
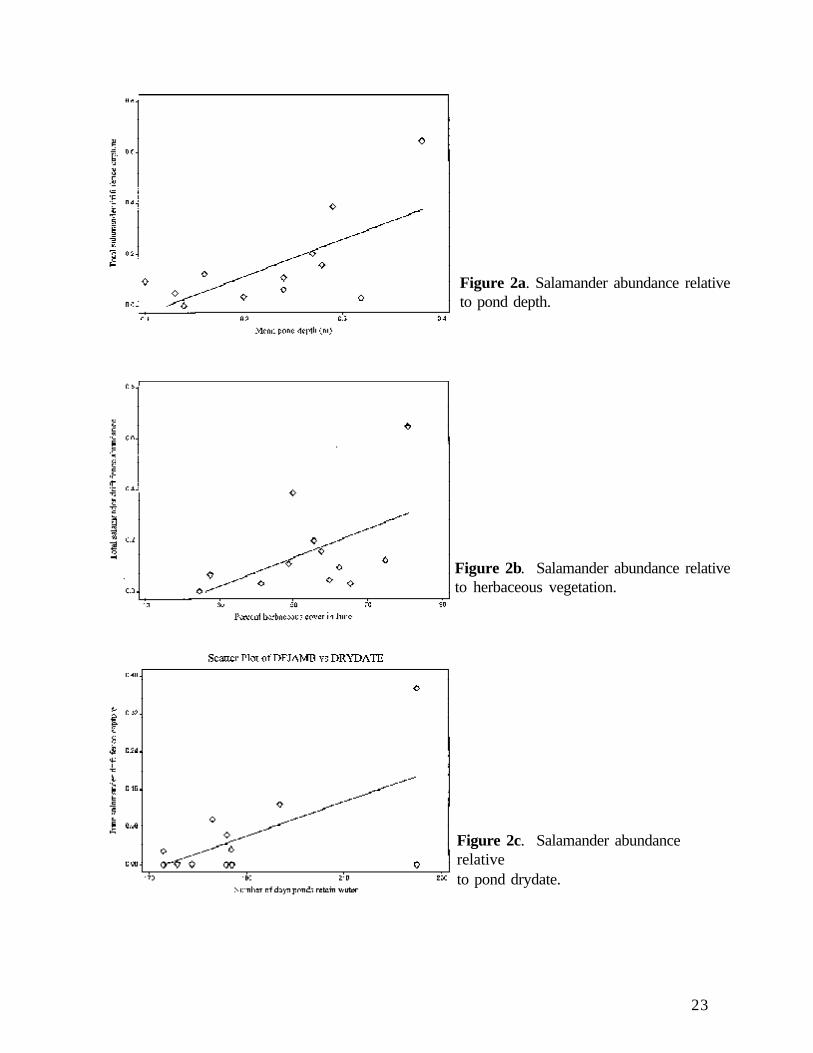
Toads (Bufo americanus) were recorded at nine sites and were the dominant amphibians at threesites. Toads were more abundant in June (0.81/trap-night) than in April (0.54/trap-night). Toadabundance in June was positively related to pond drydate (Figure 3a), but toad abundance in Aprilwas unrelated to any of the tested variables. Total toad abundance (April and June combined) wassignificantly related only to horizontal vegetation thickness in April; toad abundance increased asvegetation thickness decreased (Figure 3b).
Frogs (Pseudacris crucifer, Pseudacris triseriata, Rana pipiens) were recorded at seven sites andwere the dominant amphibian group at one site. Frogs were slightly more abundant in April (1.06/trap night) than in June (0.81/trap night). Frog abundance in both April and June was consistentlyand significantly positively associated with herbaceous cover in June (Figure 4a). Frog abundancein April was also significantly and positively associated with reduced distance to the nearest pond(Figure 4b).
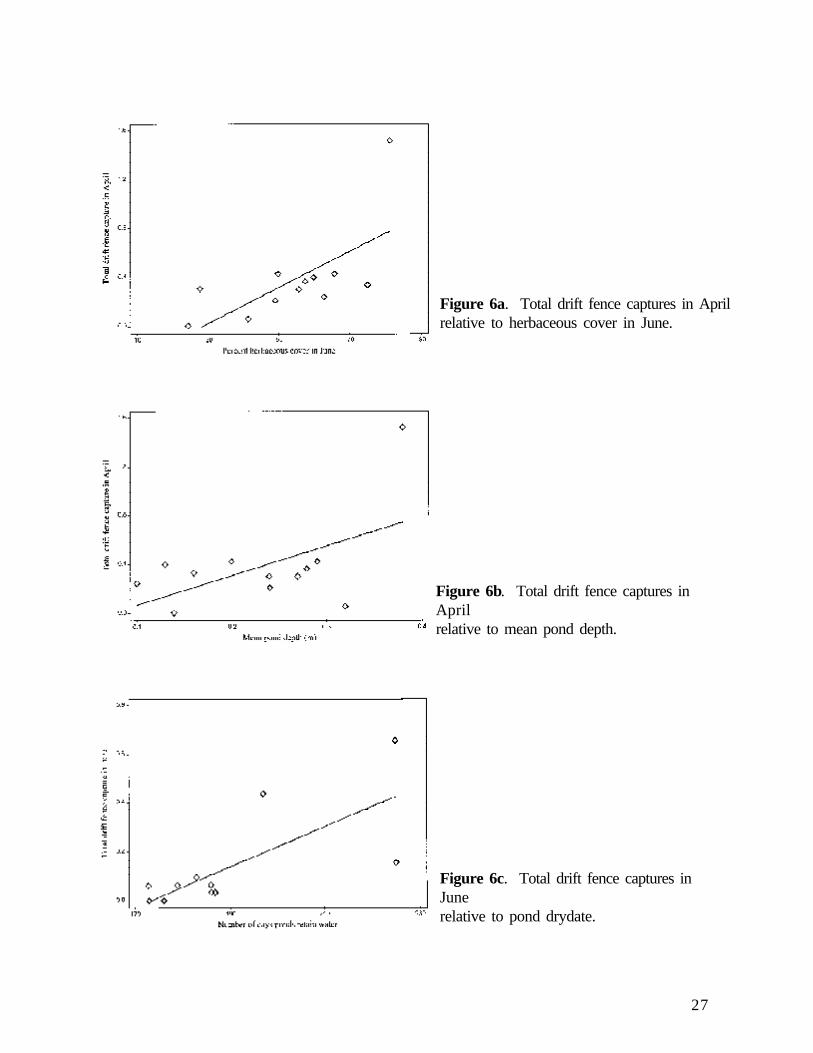
Total drift fence data reflected the interaction of the three amphibian groups. Pond depth and coverof leaf litter in April accounted for 68% of the variation in capture rate throughout the study period(Figures 5a and 5b). Leaf litter cover in April was also a primary influence on amphibian speciesrichness (see below). In April, drift fence capture was significantly and positively related to bothherbaceous cover in June and pond depth (Figures 6a and 6b). In June, total drift fence captureincreased significantly with increased pond drydate (Figure 6c).
The number of amphibian species at any given site was very strongly related to just four variables;cover of leaf litter in April, and cover of herbaceous vegetation in June, and distance to the nearestpond and pond drydate. Together, these four factors explained 97% of the variation in speciesrichness. Amphibian species diversity (H’), a measure of the relative number of species andevenness of species distributions among all sites (Brower et al. 1990), was strongly related to coverof leaf litter in April, and the distance to the nearest pond.
As a group, the six ‘good’ amphibian sites had significantly more groundlayer vegetation in Apriland in June than the six ‘poor’ amphibian sites (18.2% and 64.8% vs 10.5% and 43.5% in April andJune, respectively), and significantly more down wood in lower decay classes (670 dm3 vs 118 dm3,respectively; Table 3). No other significant differences were detected between the two groups ofsites.
As a group, the six ‘high’ natural quality sites had significantly higher amphibian species richnessand nonsignificantly higher H’ diversity than the six ‘low’ quality sites (Table 3). Drift fence capturerates of all amphibians were two to three times higher in the six ‘high’ quality sites, but thesedifferences were not significant. Both high and low quality sites had statistically similar cover ofherbaceous vegetation, species richness, vegetation thickness, and canopy cover, in both April andJune. The ‘high’ quality sites had significantly more (43.7 vs 14.5) and larger (1323 dm3 vs 88 dm3)

logs, greater volume of well-decayed logs (3888 dm3 vs 890 dm3), and deeper leaf litter in June, thanthe ‘low’ quality sites. Tree density was nonsignificantly greater in the ‘low’ quality sites (3569/ha)than in the ‘high’ quality sites (2365/ha) although basal area was similar. This indicates that the‘high’ quality sites had fewer but larger trees while the ‘low’ quality sites had numerous smallertrees. The presence of large trees was one of the characteristics used to define ‘high’ natural quality.The ‘low quality’ sites had nonsignificantly more alien or nonindigenous trees (26% vs 7%), than thehigh quality sites. The ‘low’ quality sites also had nonsignificantly more shrubs (4234/ha vs 1785/ha) and a higher percent of nonindigenous shrubs (5% vs 17%). The presence of nonindigenous treesand shrubs was one of the characteristics used to define ‘high’ and ‘low’ natural quality.Paired t-tests indicated that within each pair of plots, the ‘high’ quality site had significantly moreleaf litter cover and lower tree canopy cover in April, and deeper and more leaf litter cover and lessexposed soil in June, and more down wood, than the ‘low’ quality site (Table 4). Nonindigenousshrubs were significantly denser in the ‘low’ quality site of each pair, as would be expected, as theabundance of nonindigenous shrubs was one of the characteristics used to define ‘low’ naturalquality.
Decorana of groundlayer vegetation in both April and June separated the Will County sites from theLake County sites along the first axis, and grouped plots within preserves along the second axis(Figure 7a). Decorana of overstory trees separated the ‘high’ quality sites from the ‘low’ quality sitesalong the first and second axes (Figure 7b). No correlations were detected between amphibianabundance or diversity and forest composition.
DISCUSSION
Amphibian abundance was strongly influenced by the presence of water. Sites with deeper pondsthat dried later in the summer supported more amphibians (especially salamanders and toads) thanshallow ponds that dried early in the summer. Sites that were located near other ponds alsosupported significantly more salamanders and toads. Interestingly, frog (but not salamander or toad)abundance was significantly related to the distance to the nearest pond; frog abundance in Aprilincreased as the distance to other ponds decreased. Neither the size of the pond (surface area insquare meters) nor the distance to the forest edge was associated with any of the amphibianmeasures.
The importance of water to amphibian abundance was not unexpected, as all amphibiansencountered in this study are pond-breeders. The relationship between upland forest vegetation andamphibians was surprisingly simplistic; sites with greater herbaceous cover in June supported moreamphibians (especially salamanders and frogs) than sites with less herbaceous cover. Whilesalamanders have long been associated with abundance of down wood (Welsh and Lind 1995,Dupuis et al, 1995), we found no relationship between salamanders and the number of logs, the areaof log contact, the amount of down wood, or the abundance of well decayed wood.
The number and diversity of amphibian species were also closely correlated with June herbaceouscover and pond drydate, and with two additional features; cover of leaf litter in April, and distanceto the nearest pond. Sites with <80% leaf cover supported zero to one species, while sites with >90%
13
leaf cover supported four to five species. Potentially, leaf cover provided protection from predationand desiccation. Ash (1997) suggested that leaf litter provided an important foraging habitat forplethodontid salamanders in the Blue Ridge Mountains, and that changes in leaf litter characteristicscould affect both moisture and food availability. A study by deMaynadier and Hunter (1998)determined that litter cover was an important habitat feature for amphibians in general. Sites locatednear (<200m) another potential breeding pond supported an average of 3.8 amphibian species, whilesites located far (>400m) from a potential breeding pond averaged just 1.5 species. Both spotted andblue-spotted salamanders adults tend to remain near the breeding pond, but some individualsmigrate between ponds (Semlitsch 1998). This migration allows both genetic and demographicexchange among established populations (Gill 1978, Berven and Grudzien 1990) and tocolonization of new (or former) breeding sites (Laan and Verboom 1990). Several studies havedocumented an increased risk of amphibian extinction at isolated ponds (Sjogren-Gulve and Ray1996; Sjogren-Gulve 1994). In general an assemblage of amphibians, or any other taxa, is morelikely to persist over the long term when it is a component of a functioning metapopulation (Hanski1997).
In this study, salamander abundance was strongly and positively associated with the number ofnearby potential breeding ponds, as also found with other amphibians (Vos and Stumpel 1995). Asingle-year study cannot document source-sink relationships (Pulliam 1997), but we suggest thatlong-term viability of salamander populations requires presence of several breeding ponds within asite. In the Chicago Region, forested sites with breeding ponds are often isolated by streets and urbandevelopment, and salamanders can rarely if ever migrate between these sites (deMaynadier andHunter 2000, Gibbs 1998). Consequently, migration between breeding ponds is frequentlyrestricted to within-sites.
The length of time that the ephemeral ponds retained water was closely associated with abundanceof salamanders and toads in June. This relationship reflected the presence of juveniles emergingfrom ponds that held water longer. The four sites that dried before June 28 had no recruitment; fivesites that dried in the first week of July had low recruitment, and two of the three sites that retainedwater past July 10 had high recruitment. These results indicate that (in the Chicago Region, at least)some percentage of Ambystoma maculatum can develop from egg to juvenile in approximately 130days. The actual percentage of larvae that emerge prior to mid July is likely low, as a minimum of154 days is needed for just 10% of Pennsylvania A. maculatum larvae to achieve metamorphosis(Rowe and Dunson 1995).
At four ponds which dried on or before June 28 (Ryerson 5, Lake-Cook, Plum West, Plum East) onlyone juvenile amphibian, a Pseudacris triseriata, was captured. This species is typically the first toachieve metamorphosis in Chicago region ponds. Assuming that this dry date is typical, it is unlikelythat juvenile recruitment of most amphibian species occurs at these four locations except perhaps inexceptionally wet years. Most adult amphibians inhabiting terrestrial habitat at these sites are almostcertainly immigrants from nearby ponds. At Lake-Cook, which is isolated from other ponds by roadsand residential development, the combination of an early drying pond and lack of availablemovement corridors has apparently resulted in complete amphibian extirpation. No amphibianswere caught at that site in drift fences, time-constrained visual encounter surveys, or seining of thepond. No calling frogs were heard, and no egg masses were noted. Amphibians were known

historically from the immediate vicinity (Field Museum of Natural History collection, and RichardA. Edgren Jr.; KSM personal communication, March 3, 2000).
Five ponds dried between July 2 and July 6 (Dan Wright, Elm South, Ryerson South, Ryerson North,and MacArthur). Low numbers of juvenile Ambystoma laterale were captured at the first threeponds. No juveniles were observed at the other two ponds, and none of the five ponds had capturesof more than one species of juvenile amphibian. When juvenile A. laterale were captured, they madeup a relatively high percentage of total captures for that species (30-40%) because the number ofadult captures was also low. Unpredictable annual variation in juvenile survival at these ponds maylimit the size of the adult population.
One pond (Elm North) dried on July 16. Juveniles of three species of amphibians were captured(Ambystoma laterale, Bufo americanus, Pseudacris crucifer) and a fourth (Rana pipiens) wasobserved in the dry pond basin but not captured. Juveniles were more abundant than at earlier dryingponds, but made up only 16.8% of total observations because adult amphibians were more commonhere than at any other site. The forest adjacent to this pond also had the highest amount of Juneherbaceous cover (81%).
Two ponds (Thorn 19 and Thorn 13) did not dry in 1999 and are believed to be permanent most years.At Thorn 19 juveniles made up 48.6% of the captures for three species (Ambystoma laterale,Ambystoma maculatum, and Bufo americanus). At Thorn 13 only toad juveniles were captured, andfew amphibians of any age class were observed. These disparate results are difficult to interpret,because predator-prey relationships and competitive dynamics are likely very different in permanentponds relative to the ephemeral ponds at most sites. Larval survival or growth rates could differ inthe two ponds. Alternatively, the lower amount of herbaceous cover in June at Thorn 13 could resultin higher predation on juveniles, increased desiccation, or an inability to move far enough from thepond to encounter drift fences.
In the Chicago Region, amphibians must contend with multiple impacts; habitat loss as well ashabitat isolation due to roads and urban development, and historic and ongoing hydrologicalalteration. At the beginning of this study we assumed that all ponds were essentially ‘undisturbed’,based on visual assessment and general site history. We found during the course of this study thatthree of the 12 sites had anthropogenic alteration; the area surrounding the MacArthur pond had beendrained many years prior, isolating the pond hydrologically from other ponds; the pond at Plum Westwas drained by a ravine that had been ‘straightened’ at a prior date and subsequently eroded back intothe pond margin; and the pond at Lake-Cook on at least one occasion appeared to receive stormrunoff from the right-of-way of a heavily trafficked four-lane highway, with the associatedcontaminants (we did not assess water quality in the ponds). We noted shallow ditches or tiles nearother ponds, including two at Ryerson Woods, which did not directly drain the ponds but may haveinfluenced runoff rates. It has also been suggested that reduced herbaceous vegetation contributesto more rapid runoff and a lowered water table (Swink and Wilhelm, 1994), although we did notdocument this relationship in this study.
Our study documented surface water conditions at 12 ponds in a year with a wet early spring and adry late spring and summer. Longer-term conditions are more complex: We noted in February/
15
March 2000 that at least two of the 12 ponds (MacArthur and Lake-Cook) were still dry. Ponds inareas with high clay content soils, including Ryerson North and Ryerson 5, held snowmelt and hadsufficient water on March 8, 2000 to support calling Pseudacris triseriata and Pseudacris crucifer.It would be useful to investigate the effect of pond hydroperiod on amphibians with a multi-yearhydrology study addressing relative degree of groundwater and surface water influence on eachpond, permeability of underlying soils, and influence of historic drainage.
Assessing amphibian abundance at different seasons (April and June) provides insight into temporalresponses to habitat features. There was little correlation between the abundance of amphibians inApril, based on drift fence data, and their abundance in June, and all three species groups(salamanders , toad, and frogs) were associated with different features in April and June. Becausethese animals occupy the sites on a year round basis, using data from a single season or a singlespecies group may provide a one-sided assessment of the suitability of an upland site to supportamphibians. Collecting data over multiple years would allow a better assessment of the long-termusefulness of any particular site.
We found no relationship between drift fence sampling and time constrained visual encountersurveys. Drift fences are effective for sampling nocturnal and fossorial species such as salamandersof the genus Ambystoma and many frogs, but are less effective with large active species able to climbover the fence. Visual encounter surveys will often encounter these more active species, althoughin our study 96% of the
captures were of Ambystoma laterale. Used in combination, these two methods can provide anaccurate survey of the fauna at a given location (Heyer et al., 1994; Karns, 1987).
When we grouped sites on the basis of higher vs lower amphibian abundance, we found that siteswith more amphibians had significantly more herbaceous vegetation in both April and June thansites with few amphibians. (18% vs 11% in April, and 65% vs 44% in June). We were unable to findsignificant differences in terms of down wood, overstory cover or composition, herbaceous speciesrichness or other site characteristics that could explain the differences in observed amphibianabundance. While other studies have found strong correlations between upland habitat structure andsalamander abundance, many of these studies assessed sites with substantial macroscale differences,such as logged vs unlogged (Renken 1997, Petranka et al. 1993), different community types(Beauregard and Leclair 1988), or moisture gradients. In this study, we investigated sites that weresimilar on a macroscale (all were upland forests adjacent to flatwoods ponds in the Chicago Region)but differed substantially on a microscale. Thus, it is not unexpected that our results differ fromthose of previous studies. Alternatively, it may imply that other unmeasured variables are importantto salamander density, or that salamanders are surviving in vestigial habitats. Adult salamanders arelong-lived, and gradual change in habitat may have delayed impacts on salamander density, incontrast to rapid change such as logging. Without longterm data to determine trends (increased ordecreased density over time at each site) it is difficult to determine factors responsible for differentamphibian abundances in these forests adjacent to flatwoods ponds.
We were interested in whether the quality of the upland forest community was related to amphibianabundance and diversity. We predicted that ‘high’ quality sites would support more individuals and
more species than ‘low’ quality sites. Amphibian species richness and diversity were bothsignificantly higher in ‘high’ quality forests than in ‘low’ quality forests, supporting the second partof our hypothesis. The first part of the hypothesis was not supported: Although the six ‘high’ qualitysites (INAI Grade B) supported more than twice the number of salamanders, frogs, and toads thanthe six ‘low’ quality sites (INAI Grade C and D), these differences were not significant (Table 4).
Rather than two distinct groups of ‘high’ and ‘low’ natural quality in the same community type, our12 study sites formed a gradient in natural quality within three community types. We believe this isan artifact of the low number of sites (12) and the inherent variability between natural communitiesand along the quality gradient, resulting in considerable noise in the data set. This problem could beaddressed in future by including a much larger number of sites.
Sites varied substantially in vegetation structure and composition. This heterogeneity may haveobscured any relationship between natural quality and amphibian abundance. Sites also varied innatural quality. While the two Grade D sites (Lake-Cook and Thorn13) supported the fewestamphibians, and two of the Grade B sites (Elm North and Thorn 19) supported the most amphibians,the remaining eight sites did not follow a consistent pattern. Three Grade C sites (Daniel Wright,Plum East, and Ryerson South) supported more amphibians than their paired Grade B sites. Whenonly salamanders were considered, two of the Grade C sites (Daniel Wright and Ryerson South) stillsupported more animals than their paired Grade B sites. We conclude that the suite of characteristicsused to determine natural quality are not necessarily the features that characterize suitable uplandhabitat for amphibians in general and salamanders in particular, although there may be substantialoverlap.
Natural quality is an arbitrary and qualitative assessment of site degradation. Sites with a history oflogging, grazing, fire exclusion, alien species invasion, etc., are deemed to have lower natural quality(less resemblance to presettlement conditions) than sites without these impacts. While this conceptintuitively holds true, no studies have been conducted to document and substantiate this assumption.Basic parameters such as tree density, basal area, and groundlayer species richness, are insufficientmeasures of natural quality. Likely, a combination of factors, including abundance of speciesconsidered ‘conservative’ vs ‘disturbance-adapted’, density of trees in a range of size classes, agesince disturbance, and degree of disturbance (including both direct anthropogenic disturbance, suchas logging and grazing, and indirect anthropogenic disturbance such as excessive white tailed deerherbivory and localized lowering of the water table) will be necessary to verify the validity of thenatural quality assessment.
This study was preliminary, looking only at 12 sites. Each preserve had several ponds to select from,and within forested tracts monitored ponds were selected more or less at random. Selecting differentponds would have produced different results; we suggest increasing the number of study sites, andmonitoring multiple ponds within a forest to obtain insight into the actual relationships betweenponds, upland forest, and amphibian abundance and diversity. In March 2000 (after this study wasconcluded) we established drift fences at an additional four ponds at MacArthur. Capture rates fora single night (March 8) ranged from none at the 1999 pond to 75 individuals at a pond just 400mnorth. The 1999 pond was dry on March 8 2000, and the adjacent upland forest had very littleherbaceous vegetation. The new pond had shallow water, and part of the adjacent flatwoods forest
17
was densely vegetated. Based on this study, and the additional drift fence work in MacArthur, weconclude that 1) There is substantial variation in salamander and amphibian abundance among theponds within individual sites. 2) This variation is related to the length of time that an individual pondholds water and the number of nearby ponds, which in turn is affected by site-wide hydrologicconditions. Hydrology is likely the primary limiting factor for Chicago Region amphibians; 3) Thisvariation is also related to the abundance of groundlayer vegetation in the adjacent forest. Wesuggest that forest vegetation structure is a limiting factor, but only IF a site is sufficiently large andwith several ponds to allow between-pond migration, and IF some of those ponds hold water longenough to allow larvae to achieve metamorphosis.
It may be possible to test the relationship between upland forest structure and amphibian success.Elm North, with the highest amphibian abundance of the 12 sites, was the only actively managedsite; understory saplings were removed and the site had been prescribed burned in prior years. Otherresearchers have assessed amphibian response to natural area management activities, includingshrub removal and prescribed burning, and documented a positive response for at least some species(Mierzwa, 1997; Palis, 1994; Kirkland et al., 1996). We suggest that similar management beconducted on Elm South, and the abundance of amphibians and community structure be monitoredover time in both sites. If the relative abundance of amphibians in Elm South increases withmanagement, then the characteristics of the managed sites may be assumed to provide better uplandforest habitat. Conducting this same study in two or more sites (we suggest MacArthur Woods andThorn Creek) would provide replication and permit a broader application of results.
Acknowledgements
This study was funded by a grant from the U.S. Environmental Protection Agency Great LakesProgram Office, and matching funds provided by the Lake County Forest Preserve District andthe Forest Preserve District of Will County. Kent Fuller, Karen Holland, and Duane Heaton(USEPA), Jim Anderson (LCFPD), and Dave Mauger and Marcy DeMauro (FPDWC) providedvaluable services during the grant process and through subsequent administration. Citizens forConservation administered the grant; Tom Vanderpoel expeditiously handled related paperworkand maintained communication on a wide variety of issues.
Bob Aitchison, Juanita Armstrong, Dave Beamer, Mary Cline, Mike Fitzpatrick, Ricky Garza,Claudia Gray, Nick Huber, Daniel Lee, Chuck Myers, Joan Palincsar, Joyce Proper, JacquelineSchlosser, Jennifer Schultz, Nancy Vandenberg, and Richard Wachenheimer assisted withamphibian sampling. Special thanks go to Russ Hendricks who coordinated the Lake Countyfield efforts. Kathy Riddle, Ken Klick, Josh Skolnick, Gail Dartez, and Britta Lees assisted withvegetation sampling.
Satie Airame and Shannon Knapp contributed key thoughts during lengthy discussions on studydesign and conceptual issues. Jon Mendelson and Judy Dolan Mendelson helped locate ponds atThorn Creek Woods, and allowed us to access the site from their residence. Ellin Beltz providedcontinuous feedback during the study, developed spreadsheets to track amphibian data, andgraciously tolerated muddy boots on the floor and drift fence materials in the basement.
LITERATURE CITED
Analytical software. 1996. Statistix for windows analytical software. Tallahassee FL.
Ash, A. N. 1997. Disappearance and return of plethodontid salamanders to clearcut plots in thesouthern Blue Ridge Mountains. Conservation Biology 11:983-989.
Beauregard, N. and R. Leclair, Jr. 1988. Multivariate analysis of the summer habitat structure ofRana pipiens Schreber, in Lac Saint Pierre (Quebec, Canada). Pp 129-143 in: Management ofamphibians, reptiles, and small mammals in North America. USDA Forest Service Gen. Tech.Rept. RM-166.
Berven, K.A. and T.A. Grudzien. 1990. Dispersal in the wood frog (Rana sylvatica): implica-tions for genetic population structure. Evolution 44:2047-2056.
Bowles, M., J. McBride and C. Dunn. 1998. Twenty-year woody vegetation changes in northernflatwoods and mesic forest at Ryerson Conservation Area, Lake County, Illinois. Unpublishedreport, The Morton Arboretum, Lisle, IL.
Brower, J., J. Zar and C. von Ende. 1990. Field and Laboratory methods for general ecology.Third Edition. Wm. C. Brown, Dubuque IA.
Churchwell, B. M. and K. S. Mierzwa. 1998. Examination of long-term monitoring techniqueand the effects of fire management on the herpetofauna of Chilton Creek Preserve in Shannonand Carter Counties, Missouri. Unpublished report, The Nature Conservancy of Missouri, St.Louis. 21p.
Delis, P.R., H.R. Mushinsky, and E.D. McCoy. 1996. Decline of some west-central Floridaanuran populations in response to habitat degradation. Biodiversity and Conservation 5:1579-1595.
deMaynadier, P.G. and M.L. Hunter. 1998. Effects of silvicultural edges on the distribution andabundance of amphibians in Maine. Conservation Biology 12:350-352.
deMaynadier, P.G. and M.L. Hunter. 2000. Road effects on amphibian movements in a forestedlandscape. Natural Areas Journal 20:56-65.
Dodd, C.K. 1996. Use of terrestrial habitats by amphibians in the sandhill uplands of north-central Florida. Alytes 14:42-52.
Dodd, C. K. Jr. and B. S. Cade. 1998. Movement patterns and the conservation of amphibiansbreeding in small, temporary wetlands. Conservation Biology 12:331-339.
Dupuis, L.A., J.N.M. Smith and F. Bunnell. 1995. Relation of terrestrial-breeding amphibianabundance to tree-stand age. Conservation Biology 9:645-653.
19
Elzinga, C.L., D.W. Salzer, and J.W. Willoughby. 1998. Measuring and monitoring plantpopulations. BLM Technical Reference 1730-1. Denver CO.
Gibbs, J.P. 1998. Amphibian movements in response to forest edges, roads and streambeds insouthern New England. Journal of Wildlife Management 62:584-589.
Gill, D.E. 1978. Effective population size and interdemic migration rates in a metapopulation ofthe red-spotted newt, Notophthalmus viridescens. Ecological Monographs 48:145-166.
Hairston, N. G., Sr. 1989. Ecological experiments: Purpose, design, and execution. CambridgeUniversity Press, Cambridge.
Hanski, I. 1997. Metapopulation ecology. Pp. 13-44 in: O. E Rhodes, Jr., R. K. Chesser andM. H. Smith (eds.), Population Dynamics in Ecological Space and Time. University of ChicagoPress, Chicago. viii + 388p.
Heyer, W. R., M. A. Donnelly, R. W. McDiarmid, L. C. Hayek, and M. S. Foster. 1994. Measur-ing and monitoring biological diversity: Standard methods for amphibians. Smithsonian Institu-tion Press, Washington, D. C. xix + 364p.
Jones, K.B . 1988. Comparison of herpetofaunas of a natural and altered riparian ecosystem. Pp222-227 in: Management of amphibians, reptiles, and small mammals in North America,.USDA Forest Service Gen. Tech. Rept. RM-166.
Karns, D. 1986. Field herpetology: Methods for the study of amphibians and reptiles in Minne-sota. James Ford Bell Museum of Natural History Occ. Pap. 18. 88p.
Kirkland, G. L., Jr., H. W. Snoddy, and T. L. Amsler. 1996. Impact of fire on small mammalsand amphibians in a central Appalachian deciduous forest. American Midland Naturalist135:253-260.
Kleeberger, S.R. and J.K. Werner. 1983. Post-breeding migrations and summer movement ofAmbystoma maculatum. Journal of Herpetology 17:176-177.
Laan, R. and B. Verboom. 1990. Effects of pool size and isolation on amphibian communities.Biological Conservation 54:251-262.
Madison, D. 1997. The emigration of radio-implanted spotted salamanders, Ambystomamaculatum. Journal of Herpetology 31:542-551.
Madison, D. and L. Farrand III. 1997. Habitat use during breeding and emigration in radio-implanted tiger salamanders, Ambystoma tigrinum. Copiea 1997:402-410.
Maser, C., R.G. Anderson, K. Cromack, Jr., J.T. Williams, and R.E. Martin. 1979. Dead anddown woody material. Pp 79-95 in: Thomas, J.W. (tech. ed.). Wildlife habitats in managedforests: the Blue Mountains of Oregon and Washington. USDA Forest Service AgricultureHandbook 553. Washington DC.
McCune, B. 1993. Multivariate analysis on the PC-ORD system. Oregon State University.Corvallis, OR.
Means, D. B., J. G. Palis, and M. Baggett. 1996. Effects of slash pine silviculture on a Floridapopulation of the flatwoods salamander. Conservation Biology 10:426-437.
Mierzwa, K. S. 1997. Amphibians and reptiles. Pp. 319-325 in: S. Packard and C. Mutel(eds.), The tallgrass restoration handbook. Island Press, Covelo, CA.
Mierzwa, K. S. 1998. Amphibian habitat in the Midwestern United States. Pp. 16-23 in: M. J.Lannoo (ed.), Status and Conservation of Midwestern Amphibians. University of Iowa Press,Iowa City. xviii + 507p.
Mierzwa, K. S. and E. Beltz. 1999. Amphibians, reptiles and mammals of Edward L. RyersonConservation Area. Unpublished report, Lake County Forest Preserve District. 34p. + appendi-ces.
Palis, J. G. 1994. Post-fire herpetofauna of Mogan Ridge, Hoosier National Forest, Indiana.Unpublished report to the U. S. Forest Service.
Pearman, P.B. 1997. Correlates of amphibian diversity in an altered landscape of AmazonianEcuador. Conservation Biology 11:1211-1225.
Petranka, J.W. 1994. Response to impact of timber harvesting on salamanders. ConservationBiology 8:302-304.
Petranka, J. W., M. E. Eldridge, and K. E. Haley. 1993. Effects of timber harvesting on southernAppalachian salamanders. Conservation Biology 8:363-370.
Phillips, C. A., R. A. Brandon, and E. O. Moll. 1999. Field Guide to Amphibians and Reptilesof Illinois. Illinois Natural History Survey Manual 8. xiv + 282p.
Phillips, C. A. and O. J. Sexton. 1989. Orientation and sexual differences during breedingmigrations of the spotted salamander, Ambystoma maculatum. Evolution 48:597-607.
Pulliam, H. R. 1997. Sources and sinks: Empirical evidence and population consequences. Pp.45-69 in: O. E Rhodes, Jr., R. K. Chesser and M. H. Smith (eds.), Population Dynamics inEcological Space and Time. University of Chicago Press, Chicago. viii + 388p.
21
Renken, R.B. 1997. Pre-treatment conditions of herpetofaunal communities on Missouri OzarkForest Ecosystem Project (MOFEP) sites, 1992-1995. Pp 289-308 in: B. L. Brookshire and S. R.Shifley (eds.), Proceedings of the Missouri Ozark Forest Ecosystem Project symposium: Anexperimental approach to landscape research. June 3-5, 1997, St. Louis. Gen. Tech. Rept. NC-193. USDA Forest Service, North Central Forest Experiment Station, St. Paul, MN.
Rowe, C.L. and W.A. Dunson. 1995. Impacts of hydroperiod on growth and survival of larvalamphibians in temporary ponds of central Pennsylvania, USA. Oecologia 102:397-403.
Schwegman, J.1973. The natural divisions of Illinois. Illinois Nature Preserves Commission,Springfield. 30p.
Semlitsch, R.D. 1998. Biological delineation of terrestrial buffer zones for pond-breedingsalamanders. Conservation Biology 12:1113-1119.
Sjogren-Gulve, P. 1994. Distribution and extinction patterns within a northern metapopulationof the pool frog, Rana lessonae. Ecology 75:1357-1367.
Sjogren-Gulve, P. and C. Ray. 1996. Using logistic regression to model metapopulation dynam-ics: Large-scale forestry extirpates the pool frog. Pp. 111-137 in: McCullough, D. R. (ed.),Metapopulations and Wildlife Conservation. Island Press, Covelo CA. ix + 429p.
Sutherland, W. J. 1996. Ecological census techniques: A handbook. Cambridge UniversityPress, Cambridge, U.K. xv + 336p.
Swink, F. and G. Wilhelm. 1994. Plants of the Chicago Region. Indiana Academy of Science,Indianapolis.
Vos, C.C. and A.H.P. Stumpel. 1995. Comparison of habitat-isolation parameters in relation tofragmented distribution patterns in the tree frog (Hyla arborea). Landscape Ecology 11:203-214.
Welsh, H. H., Jr., and A. J. Lind. 1991. The structure of the herpetofaunal assemblage of theDouglas-fir forests of northwestern California and southwestern Oregon. Pp. 374-413 in: L.Ruggiero, K. Aubry, A. Carey, and M. Huff (tech. coords.), Wildlife and vegetation ofunmanaged Douglas-fir forests. USDA Forest Service Gen. Tech. Rept. PNW-285, PacificNorthwest Research Station, Portland, OR.
Welsh, H. H., Jr., and A. J. Lind. 1995. Habitat correlates of the Del Norte salamander,Plethodon elongatus (Caudata: Plethodontidae) in northwestern California. Journal of Herpetol-ogy 29:188-210.
White, J. 1978. Illinois Natural Areas Inventory Technical Report. Volume 1. Survey methodsand results. Illinois Natural Areas Inventory, Urbana. xix + 426p.
23
Figure 2a. Salamander abundance relativeto pond depth.
Figure 2b. Salamander abundance relativeto herbaceous vegetation.
Figure 2c. Salamander abundancerelativeto pond drydate.
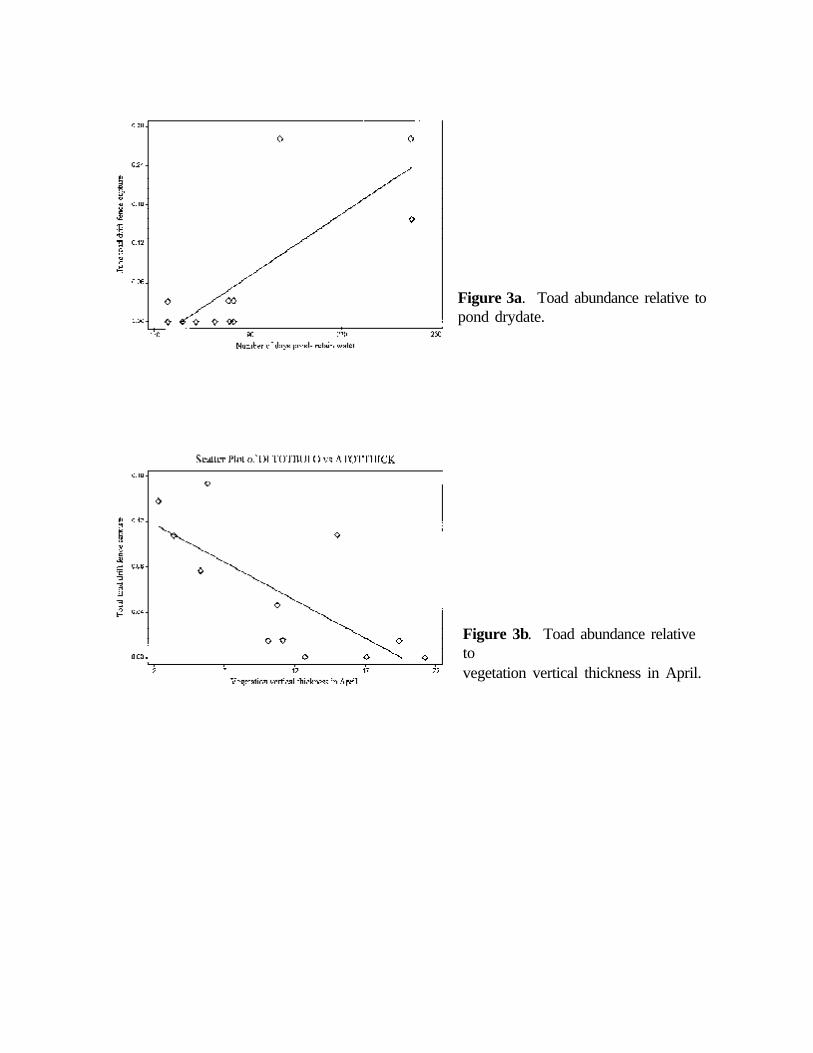
Figure 3a. Toad abundance relative topond drydate.
Figure 3b. Toad abundance relativetovegetation vertical thickness in April.
25
Figure 4a. Frog abundance relativetoherbaceous cover in June.
Figure 4b. Frog abundance relativetodistance to nearest pond.

Figure 5a. Total amphibian abundancerelative to mean pond depth.
Figure 5b. Total amphibian abundancerelative to leaf litter cover in April.
27
Figure 6a. Total drift fence captures in Aprilrelative to herbaceous cover in June.
Figure 6b. Total drift fence captures inAprilrelative to mean pond depth.
Figure 6c. Total drift fence captures inJunerelative to pond drydate.

Figure 7a. Decorana of groundlayer vegeta-tion.
Figure 7b. Decorana of overstory trees.
29
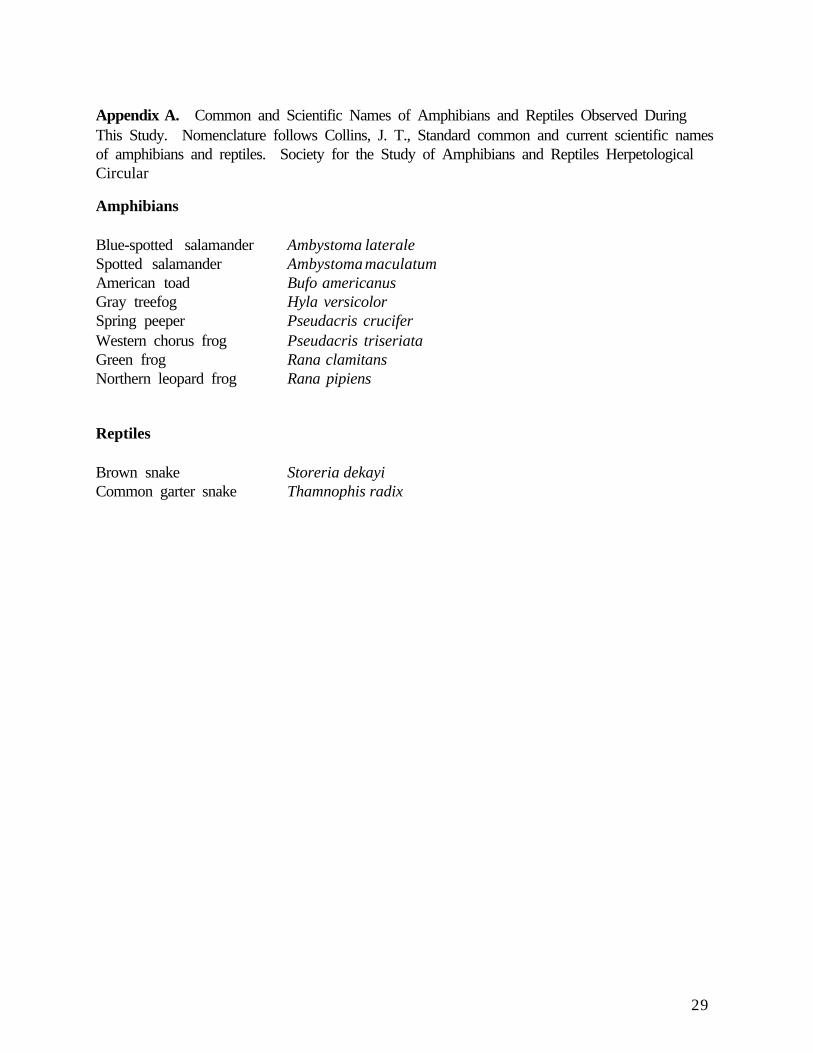
Appendix A. Common and Scientific Names of Amphibians and Reptiles Observed DuringThis Study. Nomenclature follows Collins, J. T., Standard common and current scientific namesof amphibians and reptiles. Society for the Study of Amphibians and Reptiles HerpetologicalCircular
Amphibians
Blue-spotted salamander Ambystoma lateraleSpotted salamander Ambystoma maculatumAmerican toad Bufo americanusGray treefog Hyla versicolorSpring peeper Pseudacris cruciferWestern chorus frog Pseudacris triseriataGreen frog Rana clamitansNorthern leopard frog Rana pipiens
Reptiles
Brown snake Storeria dekayiCommon garter snake Thamnophis radix


