United States Environmental Protection Agency
Office of Radiation and Indoor Air Radiation Protection Program (6608J)
EPA 402-R-07-004 October 2007
Technology Reference Guide for Radioactively Contaminated Media
TECHNOLOGY REFERENCE GUIDE FOR RADIOACTIVELY CONTAMINATED MEDIA
EPA - 402-R-07-004
U.S. Environmental Protection Agency Office of Air and Radiation
Office of Radiation and Indoor Air Radiation Protection Division
Center for Radiation Site Cleanup
Prepared Under:
Contract No. 4W-2323-YTSX

i
DISCLAIMER
This Technology Guide, developed by USEPA, is meant to be a summary of information available for technologies demonstrated to be effective for treatment of radioactively contaminated media. Inclusion of technologies in this Guide should not be viewed as an endorsement of either the technology or the vendor by USEPA. Similarly, exclusion of any technology should not be viewed as not being endorsed by USEPA; it merely means that the information related to that technology was not so readily available during the development of this Guide. Also, the technology-specific performance and cost data presented in this document are somewhat subjective as they are from a limited number of demonstration projects and based on professional judgment. In addition, all images used in this document are from public domain or have been used with permission.
ii
ACKNOWEDGEMENTS
This Guide was developed by the Radiation Protection Division (RPD) of EPA’s Office of Radiation and Indoor Air (ORIA). Mr. Edward Feltcorn of ORIA’s Center for Radiation Site Cleanup, served as the Work Assignment Manager.
Several individuals provided valuable input regarding the content of this Guide throughout its development. EPA/ORIA wishes to thank the following individuals for their assistance and technical review comments on the drafts of this Guide:
Schatzi Fitz-James Rodger Goodman Brian Littleton
Special thanks goes to the following ORIA staff that were instrumental in the technical review and production of this 2007 updated Guide:
Ronald Wilhelm Lindsey Bender
This document was prepared by Terranear PMC, Inc., under contract number 4W-2323-YTSX.
iii
FORWARD
The Technology Reference Guidance for Radioactively Contaminated Media (Guide) is intended to aid in the selection of treatment technologies for remediation of radioactively contaminated media. The Guide is designed to help site managers, Remedial Program Managers (RPM), On-Scene Coordinators (OSC), their contractors and others to identify and understand technologies that are potentially useful in the remediation of radioactively contaminated media.
This Guide is designed to give easy access to critical information on applied technologies that address radioactive contamination in solid and liquid media. The solid media includes soils, sediments, sludge and solid waste, but does not include buildings and structures. The liquid media includes groundwater, surface water, leachate and waste water.
The Guide is an update of the 1996 document “Technology Screening Guide for Radioactively Contaminated Site,” EPA-402-R-96-017. New technologies have been added. The Guide is primarily targeted at Superfund or Comprehensive Environmental Response, Compensation, and Liability Act of 1980 (CERCLA) sites. It is hoped that it will be useful for other sites facing similar problems.
The Guide is a snapshot in time and may be updated again in the future. If you have any comments on the document or suggestions for incorporation in future updates, please contact:
U.S. Environmental Protection Agency Office of Radiation and Indoor Air Radiation Protection Division 1200 Pennsylvania Avenue, NW (MC 6608J) Washington, DC 20460-0001 U.S. Phone: (202) 343-9290
iv
THIS PAGE INTENTIONALLY LEFT BLANK
v
TABLE OF CONTENTS
LIST OF EXHIBITS vii
LIST OF APPENDICIES viii
LIST OF ACRONYMS ix
EXECUTIVE SUMMARY xi
1.0 INTRODUCTION 1
1.1 PURPOSE 1
1.2 BACKGROUND 2
1.3 GENERAL INFORMATION RELATED TO RADIOACTIVELY CONTAMINATED SITES 3 1.3.1 Types of Sites 3 1.3.2 Characteristics of Radioactively Contaminated NPL Sites 3 1.3.3 General Remedial Response Actions 5
1.4 TECHNICAL APPROACH USED 6 1.4.1 Technologies Presented 6 1.4.2 Technology Profile Organization 7 1.4.3 Summaries of Technologies 8
1.5 TECHNOLOGY INFORMATION RESOURCES ON THE WEB 18
1.6 ORGANIZATION AND USE OF THIS GUIDE 19
2.0 SOLID MEDIA TECHNOLOGY PROFILES 21
2.1 CONTAINMENT TECHNOLOGIES 21 2.1.1 Capping 21 2.1.2 Land Encapsulation 27 2.1.3 Cryogenic Barriers 33
2.1.4 Vertical Barriers 39
2.2 SOLIDIFICATION/STABILIZATION 47 2.2.1 Cement Solidification/Stabilization 49 2.2.2 Chemical Solidification/Stabilization 57
2.3 CHEMICAL SEPARATION TECHNOLOGIES 65 2.3.1 Solvent/Chemical Extraction 65
2.4 PHYSICAL SEPARATION TECHNOLOGIES 73 2.4.1 Dry Soil Separation 73 2.4.2 Soil Washing 80 2.4.3 Flotation 88
2.5 VITRIFICATION 92 2.5.1 In-Situ Vitrification 92
vi
2.5.2 Ex-Situ Vitrification 99
2.6 BIOLOGICAL TREATMENT 107 2.6.1 Phytoremediation 107
3.0 LIQUID MEDIA TECHNOLOGY PROFILES 115
3.1 CHEMICAL SEPARATION 115 3.1.1 Ion Exchange 115 3.1.2 Chemical Precipitation 123 3.1.3 Permeable Reactive Barriers 129
3.2 PHYSICAL SEPARATION 138 3.2.1 Membrane Filtration 138 3.2.2 Adsorption 145 3.2.3 Aeration 150
3.3 BIOLOGICAL TREATMENT 155 3.3.1 Phytoremediation 156
3.4 NATURAL ATTENUATION 162 3.4.1 Monitored Natural Attenuation 162
4.0 EMERGING TECHNOLOGIES 169
4.1 ELECTROKINETICS 169
4.2 SUPERCRITICAL FLUID EXTRACTION 170
4.3 MAGNETIC SEPARATION 171
4.4 BACTERIAL REDUCTION 173
4.5 IN-SITU GASEOUS REDUCTION 174
vii
LIST OF EXHIBITS
Exhibit 1-1: Isotope Distribution at Radioactively Contaminated NPL Sites...............................4 Exhibit 1-2: NPL Sites by Radionuclide and Media .......................................................................5 Exhibit 1-3: Summary of Solid and Liquid Media Technologies...................................................9 Exhibit 1-4: Technologies Sorted by Applicable Media...............................................................16 Exhibit 1-5: Technologies Sorted by Radionuclide Type............................................................17 Exhibit 1-6: Using the Technology Profiles..................................................................................20 Exhibit 2-1: Typical Cap for Radioactive Waste...........................................................................22 Exhibit 2-2: Operating Characteristics of Capping......................................................................23 Exhibit 2-3: Cap Construction Costs ............................................................................................25 Exhibit 2-4: Land Encapsulation ...................................................................................................28 Exhibit 2-5: Operating Characteristics of Land Encapsulation ..................................................29 Exhibit 2-6: Cryogenic Barrier .......................................................................................................33 Exhibit 2-7: Operating Characteristics of Cryogenic Barriers....................................................35 Exhibit 2-8: Vertical Barriers..........................................................................................................40 Exhibit 2-9: Operating Characteristics of Vertical Barriers ........................................................41 Exhibit 2-10: Vertical Barrier Construction Costs .......................................................................43 Exhibit 2-11: Ex-Situ Solidification/Stabilization .........................................................................48 Exhibit 2-12: In-Situ Solidification/Stabilization...........................................................................48 Exhibit 2-13: Operating Characteristics of Cement Solidification/Stabilization .......................51 Exhibit 2-14: Operating Characteristics of Chemical Solidification/Stabilization.....................59 Exhibit 2-15: Solvent Extraction ....................................................................................................66 Exhibit 2-16: Operating Characteristics of Solvent/Chemical Extraction..................................68 Exhibit 2-17: Dry Soil Separation ..................................................................................................74 Exhibit 2-18: Operating Characteristics of Dry Soil Separation .................................................75 Exhibit 2-19: Performance of Segmented Gate System ..............................................................77 Exhibit 2-20: Soil Washing .............................................................................................................81 Exhibit 2-21: Operating Characteristics of Soil Washing............................................................83 Exhibit 2-22: Performance of Soil Washing..................................................................................84 Exhibit 2-23: Flotation ....................................................................................................................88 Exhibit 2-24: Operating Characteristics of Flotation ...................................................................89 Exhibit 2-25: In-situ Vitrification ....................................................................................................93 Exhibit 2-26: Operating Characteristics of In-situ Vitrification...................................................95 Exhibit 2-27: Ex-situ Vitrification.................................................................................................101 Exhibit 2-28: Operating Characteristics of Ex-situ Vitrification................................................102 Exhibit 2-29: Phytoremediation ...................................................................................................108 Exhibit 2-30: Operating Characteristics of Phytoremediation..................................................109 Exhibit 3-1: Ion Exchange ............................................................................................................116 Exhibit 3-2: Operating Characteristics of Ion Exchange...........................................................118 Exhibit 3-3: Chemical Precipitation Diagram .............................................................................124 Exhibit 3-4: Operating Characteristics of Chemical Precipitation............................................125 Exhibit 3-5: Permeable Reactive Barriers...................................................................................130
viii
LIST OF EXHIBITS (CONTINUED)
Exhibit 3-6: Operating Characteristics of Permeable Reactive Barriers..................................131 Exhibit 3-7: Performance of Permeable Reactive Barriers .......................................................132 Exhibit 3-8: Permeable Reactive Barrier Costs..........................................................................134 Exhibit 3-9: Membrane Filtration .................................................................................................139 Exhibit 3-10: Operating Characteristics of Membrane Filtration..............................................140 Exhibit 3-11: Carbon Adsorption Diagram .................................................................................145 Exhibit 3-12: Operating Characteristics of Adsorption .............................................................146 Exhibit 3-13: Aeration ...................................................................................................................151 Exhibit 3-14: Operating Characteristics of Aeration..................................................................152 Exhibit 3-15: Phytoremediation ...................................................................................................157 Exhibit 3-16: Operating Characteristics of Phytoremediation..................................................158 Exhibit 3-17: Monitored Natural Attenuation..............................................................................163 Exhibit 3-18: Operating Characteristics of Monitored Natural Attenuation.............................164 Exhibit A-1: NPL Sites and Radionuclides Detected............................................................... A-1 Exhibit B-1: Statutory and Regulatory Categories of Radioactive Waste B-2 Exhibit B-2: Principal Decay Scheme of the Uranium Series B-5 Exhibit B-3: Radiological Characteristics of Selected Radionuclides Found at
Superfund Sites B-6
LIST OF APPENDICES
APPENDIX A NPL SITES AND RADIONUCLIDES DETECTED
APPENDIX B RADIOACTIVE CONTAMINATION: BASIC CONCEPTS AND TERMS
APPENDIX C SUGGESTED READING LIST
APPENDIX D DEFINITION OF TREATMENT
ix
LIST OF ACRONYMS
ACOE U.S. Army Corps of Engineers AEA Atomic Energy Act AECL Atomic Energy of Canada, Limited AFO Amorphous Ferric Oxyhydroxide ANL Argonne National Laboratory ANS American Nuclear Society ANSI American National Standards Institute ARAR Applicable or Relevant and Appropriate Regulations ARM Accelerator-Produced Radioactive Material BDAT Best Demonstrated Available Technology BNL Brookhaven National Laboratory BRAC U.S. DOD Base Realignment and Closure CERCLA Comprehensive Environmental Response, Compensation, and
Liability Act (Superfund) CFC Chlorofluorocarbon CFR Code of Federal Regulations CLU-IN EPA Hazardous Waste Clean-Up Information System DNA Defense Nuclear Agency DOD U.S. Department of Defense DOE U.S. Department of Energy DOT U.S. Department of Transportation DWPF Defense Waste Processing Facility EDTA Ethylenediamine-tetraacetic acid EPA U.S. Environmental Protection Agency FRTR Federal Remediation Technologies Roundtable FUSRAP Formerly Utilized Sites Remedial Action Program GAC Granular Activated Carbon GCC Greater-Than-Class-C Waste GW Groundwater HDPE High Density Polyethylene HEPA High Efficiency Particulate Air HLW High Level Radioactive Waste IAEA International Atomic Energy Agency ISV In-situ Vitrification ITRC Interstate Technology Regulatory Council KEI Kapline Enterprises Inc. LANL Los Alamos National Laboratory LEHR Laboratory for Energy-Related Health Research NARM Naturally Occurring and Accelerator-Produced Radioactive Materials NAVFAC Naval Facilities Engineering Command NCP National Oil and Hazardous Substances Contingency Plan NORM Naturally Occurring Radioactive Materials NPL National Priorities List NRC U.S. Nuclear Regulatory Commission OECD Organization for Economic Cooperation and Development ORNL Oak Ridge National Laboratory OSHA Occupational Safety and Health Administration OSWER EPA Office of Solid Waste and Emergency Response OSC On-Scene Coordinator PCA Portland Cement Association PCB Polychlorinated Biphenyl
x
LIST OF ACRONYMS (CONTINUED)
PCT Product Consistency Test PRB Permeable Reactive Barrier RCRA Resource Conservation and Recovery Act RI/FS Remedial Investigation/Feasibility Study RPM Remedial Program Manager ROD Record of Decision RTDF Remediation Technologies Development Forum SAIC Science Applications International Corporation SARA Superfund Amendments and Reauthorization Act SITE EPA Superfund Innovative Technology Evaluation Program SW Surface Water TCA Total Constituent Analysis TCLP EPA Toxicity Characteristic Leaching Procedure TENORM Technologically Enhanced Naturally Occurring Radioactive Material TIE DOE Technical Information Exchange UKAEA United Kingdom Atomic Energy Agency UMTRA Uranium Mill Tailings Remedial Action USATHAMA U.S. Army Toxic and Hazardous Materials Agency USBR U.S. Bureau of Reclamation USDA U.S. Department of Agriculture VOC Volatile Organic Compound VORCE Volume Reduction/Chemical Extraction WRT Water Remediation Technology WSRC Westinghouse Savannah River Company ZVI Zero Valent Iron
xi
EXECUTIVE SUMMARY
The U.S. Environmental Protection Agency, Office of Air and Radiation, Radiation Protection Division’s Radiation Site Cleanup Center, produced this Technology Reference Guide for Radioactively Contaminated Media (Guide) as a reference for technologies that can effectively treat radioactively contaminated sites. The Guide is designed to give easy access to critical information on applied technologies that address radioactive contamination in solid and liquid media. The solid media include soils, sediment, sludge, and solid waste, but do not include buildings and structures. The liquid media include groundwater, surface water, leachate, and waste water. This information is presented in technology profiles that can be used to compare technologies for site-specific application. This Technology Guide is a revision of “Technology Screening Guide for Radioactively Contaminated Sites,” EPA 402-R-96-017, published in 1996.
The profiles include 21 applied technologies that are currently in use at contaminated sites. Of these, there are 13 technologies associated with contaminated solid media that are grouped into six categories:
• containment, • solidification/stabilization, • chemical separation, • physical separation, • vitrification, and • biological treatment.
There are eight technologies associated with contaminated liquid media that are grouped into four categories:
• chemical separation, • physical separation, • biological treatment, and • natural attenuation.
In addition to the applied technology profiles, there are brief discussions of five emerging technologies that have been bench- or pilot-tested.
This Guide builds on significant efforts by EPA, the Department of Energy, the Department of Defense, and other agencies to facilitate remedy selection. This Guide also updates information on each technology’s operating and performance data.
Profiles for each technology include a basic description, contaminants addressed, waste issues, technology operating characteristics, and site characteristics that affect performance. Each profile provides performance data, cost data, commercial availability, and contacts for technical information and vendors (if available). A list of references is provided at the end of each technology description.
Section 1 introduces the Guide, provides background information on general characteristics of radioactive waste at National Priorities List (NPL) sites, and provides summary tables for the information in this Guide. Section 2 provides profiles for technologies applicable to solid media while Section 3 presents profiles for technologies applicable to liquid media. Section 4 presents a brief discussion of five emerging technologies not yet fully demonstrated. Appendix A provides information about radionuclides present at individual NPL sites and the media affected. A quick reference to radiation concepts and glossary of terms is provided in Appendix B. Appendix C provides suggested references for further reading.
THIS PAGE INTENTIONALLY LEFT BLANK
1
1.0 INTRODUCTION
1.1 PURPOSE
This Technology Reference Guide for Radioactively Contaminated Media (Guide) is designed to help site managers, Remedial Project Managers, On-Scene Coordinators, their contractors and others to identify and understand technologies that are potentially useful in the remediation of radioactively contaminated media. The Guide is primarily targeted at Superfund or CERCLA sites (the Comprehensive Environmental Response, Compensation, and Liability Act of 1980 as amended by SARA, the Superfund Amendments and Reauthorization Act of 1986), though it is hoped that it will be useful for other locations facing similar problems.
To make appropriate site response action decisions, site managers need pertinent technical information to help guide them. For this reason, the Guide provides basic information on technologies and references to further information sources. As such, it is decision-focused to help the project manager select an appropriate technology for remediation of contaminated solid and liquid media that will meet the cleanup criteria. Each technology profile provides process descriptions, operating principles, performance and cost data, target contaminants, applicable site characteristics, and other features in a consistent presentation format for each technology.
This Guide has been written assuming that the site manager or other decision maker has had some Superfund experience, is generally aware of the hazards associated with radiological contaminants, but does not necessarily have experience with radioactive contamination. It assumes that a decision has been made to clean up a site and that cleanup goals and end state conditions have been specified. It is also assumed that the users of this Guide will, as necessary, familiarize themselves with (1) the applicable or relevant and appropriate regulations (ARAR) pertinent to the site of interest; (2) relevant sampling, analysis, and data interpretation methods to gather information needed to evaluate the suitability of a technology at the site of interest; and (3) applicable health and safety requirements and practices relevant to radionuclides and radionuclide-contaminated media. Each site and technology application will require a Health and Safety Plan that complies with the Occupational Safety and Health Administration regulations (29 CFR 1910.120). Detailed guidance on preparation of a Health and Safety Plan is provided in the document Occupational Safety and Health Guidance Manual for Hazardous Waste Site Activities prepared by the National Institute for Occupational Safety and Health, OSHA, the U.S. Coast Guard, and the EPA (1985, revised 1998) and available online at www.osha.gov.
EPA recognizes that site managers fulfill numerous technical, management, and regulatory responsibilities, all driven by the goal of making expedient, yet careful, decisions about their actions. In planning and implementing response actions, this document can be used in the Remedial Investigation/Feasibility Study (RI/FS) or Proposed Plan processes. In addition, Superfund administrators, EPA site manager counterparts in federal facilities, site managers outside of EPA, EPA Regional Radiation Program staff, and technology vendors can use the Guide to evaluate technology options. The Guide is designed to be a resource; it is not intended to be a teaching tool.
The Guide is meant to be an aid to decision making and is not meant to replace other procedures that are acknowledged as critical to the decision-making process. It might be appropriate to gather information to support remedy selection and implementation through laboratory bench-scale testing. This type of testing can provide critical information on how a proposed technology will perform under particular real-world conditions and is relatively low cost. The results can provide better data to support remedy selection and valuation. Small-scale laboratory tests might need to be followed up with advanced or pilot scale tests if more remedy design information is needed. When properly designed, bench-scale testing should yield information on seven remedy selection criteria:
2
• Overall protection of human health and the environment, • Compliance with ARARs, • Long-term effectiveness, • Reduction of toxicity, mobility and volume, • Short term effectiveness, • Implementability, and • Cost.
Recognition of the value of this approach will allow the project manager to budget early in the planning process for bench-scale testing, screen for potentially applicable technologies, develop remedial alternatives incorporating other considerations such as protective cleanup levels and waste disposal options, and perform a comparative analysis of alternatives to ultimately select the final remedial action technology. It is also important to realize that the results of bench-scale testing on technologies considered in this Guide are not only applicable to CERCLA remedial actions which typically address situations where there is a long term threat to human health or the environment, but can also be applied by On-Scene Coordinators (OSC) to make selections for CERCLA removal actions which are used in-situations where there an immediate threat to human health or to the environment.
This Guide is one of two EPA reference documents related to the remediation of radioactive contamination. The other guide is the Technology Reference Guide for Radioactively Contaminated Surfaces (U.S. EPA, 2006, EPA 402-R-06-003).
1.2 BACKGROUND
Since the passage of the Comprehensive Environmental Response, Compensation, and Liability Act in 1980 established Superfund, significant efforts have been made to study, develop, and use technologies that can address radioactive contamination. Diverse initiatives have attempted to pinpoint the safest, most thorough, efficient, and cost-effective ways to respond to this type of hazard. The American Nuclear Society, the Commission of the European Communities, and the International Atomic Energy Agency, for example, have examined remediation and waste management options for low-level and high-level radioactive waste in the United States and abroad. In addition, the U.S. Department of Energy (DOE) has played a major role in researching potential applications for innovative technologies at Federal Facility Superfund sites. The U.S. Department of Defense (DOD) has also helped refine the search for applicable technologies in its work on nonradioactive waste.
EPA had previously compiled information on cleanup technologies for radioactive waste in three documents described below.
• Technological Approaches to the Cleanup of Radiologically Contaminated Superfund Sites (1988) discusses remediation technologies for soils contaminated by radioactivity. It identifies the full range of technologies potentially useful in reducing radioactivity levels at hazardous waste sites, describing the technology, its development status, potential application, advantages and disadvantages, and associated information needs.
• Assessment of Technologies for the Remediation of Radioactively Contaminated Superfund Sites (1990) examined 29 technologies for cleaning up soil, water, and structures. It also identified information gaps related to assessing the technologies.
• Technology Screening Guide for Radioactively Contaminated Sites (1996) examined 12 technologies for cleaning up solid media and five technologies for liquid media. It provided profiles for each technology that included performance against seven of the nine National Oil
3
and Hazardous Substances Pollution Contingency Plan evaluation criteria that could be used in screening and comparison.
This Guide focuses on technologies that address radioactive waste and are effective for soil and liquid media at radioactively contaminated sites. The solid media include soils, sediment, sludge, and solid waste; they do not include buildings and structures. The liquid media include groundwater, surface water, and wastewater. This Guide does not address radon in air or the decontamination of structures (decontamination of structures is addressed in a related document: Technology Reference Guide for Radioactively Contaminated Surfaces). For each technology, information is provided to allow the user to gain a basic understanding of the process, to identify the demonstrated and potential applications, to understand the limitations of the technology and its availability, and to identify technical and vendor contacts.
To develop this document, a survey of EPA, DOE, DOD, and other databases and websites was performed, and documents were reviewed that describe or assess technology applications to radioactively contaminated waste. This information was drawn from government publications and journal articles and formed the basis for the technology characterizations presented in subsequent sections. CERCLA Records of Decision for National Priority List sites contaminated with radioactive waste were also reviewed.
When used in this document, the term disposal is defined as the approved, final placement, containment, or immobilization of radioactive waste, radioactive waste residuals, or radioactively contaminated media. A definition of the term treatment is provided in Appendix D.
1.3 GENERAL INFORMATION RELATED TO RADIOACTIVELY CONTAMINATED SITES
1.3.1 Types of Sites
Of the radioactively contaminated sites identified, nine general types of sites have been established. These are:
• defense plants • mill tailings, processing, and disposal sites • radium and thorium sites • commercial landfills • low-level waste disposal sites • research facilities • commercial manufacturing • fuel fabrication and processing • scrap metal recovery.
Source: Environmental Characteristics of EPA, NRC, and DOE Sites Contaminated With Radioactive Substances, U.S. EPA (1993), EPA/402/R-93/011.
1.3.2 Characteristics of Radioactively Contaminated NPL Sites
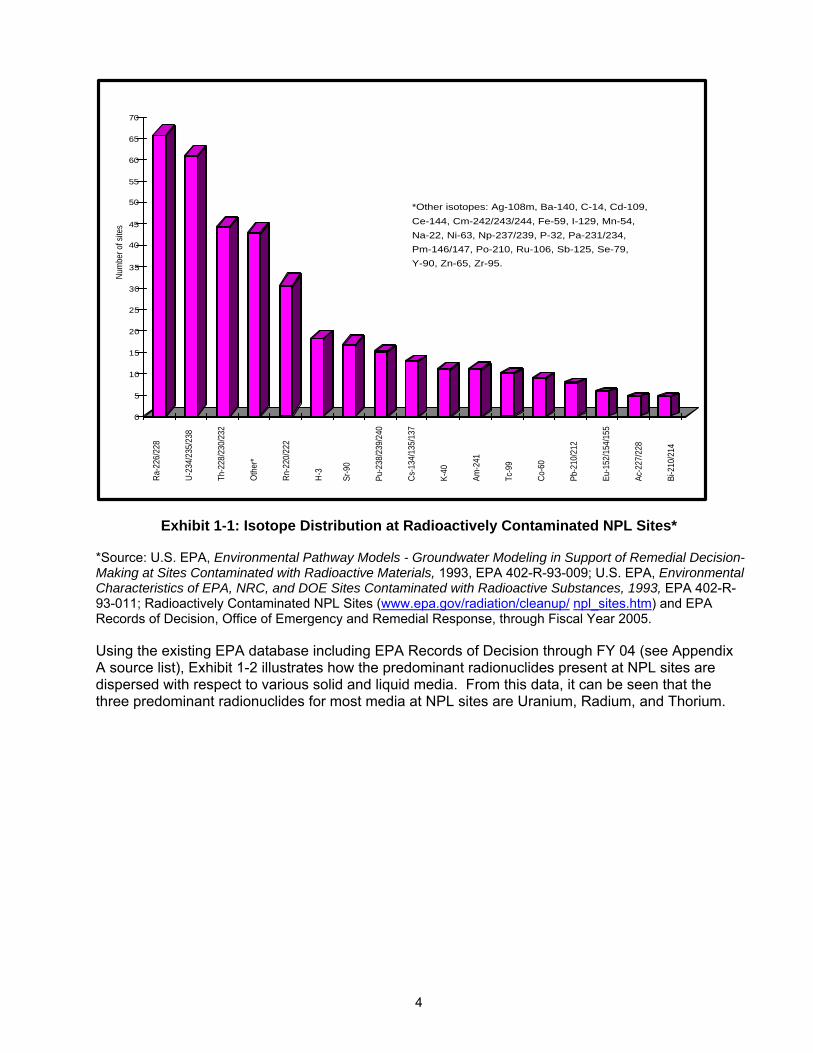
Experience with Superfund sites demonstrates that waste at radioactively contaminated sites is primarily a by-product of four main processes or activities: research, design, or development of nuclear weapons; radioactive waste disposal; mining/processing of radioactive ores; and some forms of manufacturing. As shown in Exhibit 1-1, radium represents the most prevalent element with respect to radioactively contaminated NPL sites, followed by uranium, thorium, and radon.
4
0
5
10
15
20
25
30
35
Num
ber o
f site
s
*Other isotopes: Ag-108m, Ba-140, C-14, Cd-109,
Sr-9
0
Pu-2
38/2
39/2
40
Cs-
134/
135/
137
K-40
Am-2
41
Tc-9
9
Co-
60
Pb-2
10/2
12
Eu-1
52/1
54/1
55
Ac-2
27/2
28
Bi-2
10/2
14
45
55
60
65
70
50
40
Ra-
226/
228
U-2
34/2
35/2
38
Th-2
28/2
30/2
32
Oth
er*
Rn-
220/
222
H-3
Ce-144, Cm-242/243/244, Fe-59, I-129, Mn-54,
Na-22, Ni-63, Np-237/239, P-32, Pa-231/234,
Pm-146/147, Po-210, Ru-106, Sb-125, Se-79,
Y-90, Zn-65, Zr-95.
Exhibit 1-1: Isotope Distribution at Radioactively Contaminated NPL Sites*
*Source: U.S. EPA, Environmental Pathway Models - Groundwater Modeling in Support of Remedial Decision-Making at Sites Contaminated with Radioactive Materials, 1993, EPA 402-R-93-009; U.S. EPA, Environmental Characteristics of EPA, NRC, and DOE Sites Contaminated with Radioactive Substances, 1993, EPA 402-R-93-011; Radioactively Contaminated NPL Sites (www.epa.gov/radiation/cleanup/ npl_sites.htm) and EPA Records of Decision, Office of Emergency and Remedial Response, through Fiscal Year 2005.
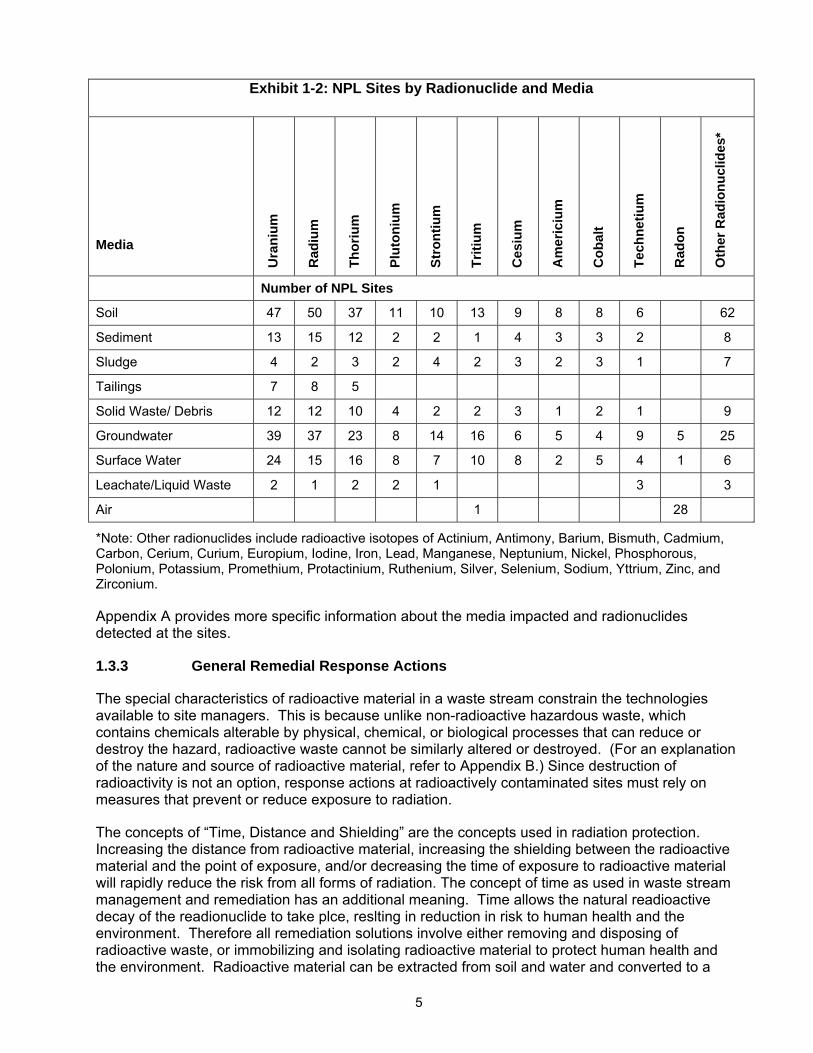
Using the existing EPA database including EPA Records of Decision through FY 04 (see Appendix A source list), Exhibit 1-2 illustrates how the predominant radionuclides present at NPL sites are dispersed with respect to various solid and liquid media. From this data, it can be seen that the three predominant radionuclides for most media at NPL sites are Uranium, Radium, and Thorium.
5
Exhibit 1-2: NPL Sites by Radionuclide and Media
Media
Ura
nium
Rad
ium
Thor
ium
Plut
oniu
m
Stro
ntiu
m
Triti
um
Ces
ium
Am
eric
ium
Cob
alt
Tech
netiu
m
Rad
on
Oth
er R
adio
nucl
ides
*
Number of NPL Sites
Soil 47 50 37 11 10 13 9 8 8 6 62
Sediment 13 15 12 2 2 1 4 3 3 2 8
Sludge 4 2 3 2 4 2 3 2 3 1 7
Tailings 7 8 5
Solid Waste/ Debris 12 12 10 4 2 2 3 1 2 1 9
Groundwater 39 37 23 8 14 16 6 5 4 9 5 25
Surface Water 24 15 16 8 7 10 8 2 5 4 1 6
Leachate/Liquid Waste 2 1 2 2 1 3 3
Air 1 28
*Note: Other radionuclides include radioactive isotopes of Actinium, Antimony, Barium, Bismuth, Cadmium, Carbon, Cerium, Curium, Europium, Iodine, Iron, Lead, Manganese, Neptunium, Nickel, Phosphorous, Polonium, Potassium, Promethium, Protactinium, Ruthenium, Silver, Selenium, Sodium, Yttrium, Zinc, and Zirconium.
Appendix A provides more specific information about the media impacted and radionuclides detected at the sites.
1.3.3 General Remedial Response Actions
The special characteristics of radioactive material in a waste stream constrain the technologies available to site managers. This is because unlike non-radioactive hazardous waste, which contains chemicals alterable by physical, chemical, or biological processes that can reduce or destroy the hazard, radioactive waste cannot be similarly altered or destroyed. (For an explanation of the nature and source of radioactive material, refer to Appendix B.) Since destruction of radioactivity is not an option, response actions at radioactively contaminated sites must rely on measures that prevent or reduce exposure to radiation.
The concepts of “Time, Distance and Shielding” are the concepts used in radiation protection. Increasing the distance from radioactive material, increasing the shielding between the radioactive material and the point of exposure, and/or decreasing the time of exposure to radioactive material will rapidly reduce the risk from all forms of radiation. The concept of time as used in waste stream management and remediation has an additional meaning. Time allows the natural readioactive decay of the readionuclide to take plce, reslting in reduction in risk to human health and the environment. Therefore all remediation solutions involve either removing and disposing of radioactive waste, or immobilizing and isolating radioactive material to protect human health and the environment. Radioactive material can be extracted from soil and water and converted to a
6
form suitable for disposal at an approved location. Alternatively, radioactively contaminated soil can be immobilized, preventing the radioactive components from migrating from the site and causing harm. Associated with immobilization are measures to isolate (shield) radioactive material while it decays to site specific levels, thus ensuring that people are protected from direct exposure to the radiation by inhalation, ingestion or contact.
The selection of a technology is influenced by such considerations as site characteristics (soil properties, hydrogeology, geochemistry, etc.), the half-lives of the radionuclides present, type of radiation of the radioactive materials (alpha, beta, or gamma), radioactive concentration (pCi/g, Bq/L), other waste characteristics (depth and horizontal distribution, presence of multiple radionuclides or mixed waste, etc.), proximity of the waste to populations, available resources, handling required and level of personal protective equipment, and treatment costs. A key part of the selection process, disposal of extracted and concentrated radioactive material must be considered near the beginning of the decision process. Disposal requirements and options for transporting such waste materials to licensed facilities vary, depending on the nature of the contaminant and the containment technology used.
This Guide presumes that a succession of remedial measures, commonly referred to as a “treatment train,” would be employed at most sites to respond to various types of site contamination. Treatment trains can reduce the volume of materials that need further treatment and/or remediate multiple contaminants within a single medium. A treatment train, for example, might include soil washing, followed by solidification and stabilization measures, and land encapsulation.
1.4 TECHNICAL APPROACH USED
1.4.1 Technologies Presented
To provide a concise guide to a variety of treatment alternatives that could be viable for use at specific sites, 21 applied technologies have been selected for evaluation in this Guide. These technologies address contamination of solid and liquid media. These technologies were selected for two reasons: 1) the technology had been considered and/or selected at a Superfund site with radioactive contamination, or 2) there were sufficient data available from field scale testing and other research that demonstrated the technology’s potential application to an actual cleanup of radioactive contamination. Many more technologies were reviewed but not presented due to insufficient development, insufficient data and/or unreliable sources of data. The technologies in this Guide are:
• Solid Media: - Capping - Land Encapsulation - Cryogenic Barrier - Vertical Barriers - Cement Solidification/Stabilization - Chemical Solidification/Stabilization - Solvent/Chemical Extraction - Dry Soil Separation - Soil Washing - Flotation - In-situ Vitrification - Ex-situ Vitrification - Phytoremediation
• Liquid Media:
7
- Ion Exchange - Chemical Precipitation - Permeable Reactive Barriers - Membrane Filtration - Adsorption - Aeration - Phytoremediation - Monitored Natural Attenuation
Although most technologies examined apply to non-radioactive hazardous waste, the determining factor in selecting the technologies presented here is their applicability to radioactive waste. For example, incineration technologies can treat volatile and semi-volatile organic compounds, but do not affect radioactively contaminated media, and are therefore excluded. This Guide also excludes technologies that specifically remediate radon contamination in air or contaminated structures. Information on technologies that can be used to remediate radioactively contaminated surfaces can be found in the related EPA document Technology Reference Guide for Radioactively Contaminated Surfaces. For more complete information for supporting technology decisions, references for each technology can be found at the end of each profile. Appendix C also cites suggested references for readers who wish to explore the technology in greater detail.
1.4.2 Technology Profile Organization
Profiles of selected technologies are designed to provide pertinent information in a consistent format. Because numerous information sources are available on these technologies, only key data concerning technology and site characteristics are included. Data categories are based on the information useful in a basic engineering evaluation. The following is a detailed discussion about what information each profile includes.
1) Description: This section describes basic principles and methodologies of each technology. Descriptions focus on the features relevant to making criteria evaluations and comparisons with other technologies. Profiles describe the overall effects of the technology on the contaminated materials. Descriptions of operating procedures, process outcomes, and reagents are general in nature.
2) Target Contaminants: This segment of the profile lists individual contaminants or contaminant groups addressed by the technology.
3) Applicable Site Characteristics: This discussion addresses important site characteristics that can affect the technology’s viability or implementation at a particular site, including, for example, topography, depth to groundwater, and soil types.
4) Waste Management Issues: This section discusses the types of wastes that can be generated during the treatment process and the types of residuals after completion of treatment.
5) Operating Characteristics: This segment discusses various aspects of operating the technology including removal efficiencies, potential air emissions, reliability of the technology, process times, applicable media, pretreatment or site requirements, installation and operation requirements, expected post-treatment conditions, and the ability to monitor the effectiveness of the technology.
6) Performance Data: This section presents available performance data on the effectiveness of the technology in removing, containing, or stabilizing radionuclides in the treated media.
7) Capital and Operating Costs: This section discusses estimated capital and operation and
8
maintenance costs and the components that are included in these costs. Costs are typically driven by the cost of purchasing/leasing and operating treatment equipment; the volume of waste requiring treatment; and costs associated with waste transport, residuals storage and/or disposal. In addition, for radioactively contaminated sites, costs of remediation could include cost of shielding and protective equipment to reduce external exposure to remediation workers. Specific cost data are not available for all technologies and those stated in this Guide should be considered broad estimates.
8) Commercial Availability: This section discusses availability of services, equipment and materials required to perform the proposed remedial action.
9) Contact Information: Contacts are listed in this section including appropriate EPA and/or DOE contacts and vendors for technologies that are commercially available for application to radionuclide treatment.
A reference list is included at the end of each technology profile listing all of the references cited and utilized in the preparation of the profile.
The format of the information presented in the profiles is consistent so that comparison with other profiles is facilitated.
1.4.3 Summaries of Technologies
The seven categories of technologies presented in this guide are defined as follows:
• Containment - technologies that provide barriers between radionuclide-contaminated and uncontaminated media to prevent radionuclide migration and shield potential receptors from radiation.
• Solidification/Stabilization – technologies that add material to the radionuclide- contaminated waste and soil to produce a leach-resistant media, which binds the waste.
• Chemical Separation – technologies that use the radionuclides’ chemical properties to separate radionuclides from the contaminated media.
• Physical Separation – technologies that rely on the radionuclides’ physical properties to separate radionuclides from the contaminated media.
• Vitrification – a technology that heats radionuclide-contaminated media sufficiently to liquefy the media and the radionuclides and, upon cooling, traps the radionuclides in a glass matrix.
• Biological Treatment – technologies that use microorganisms or plants to remove, transfer, or stabilize radionuclides.
• Natural Attenuation – technologies that rely on natural processes to attenuate radionuclides.
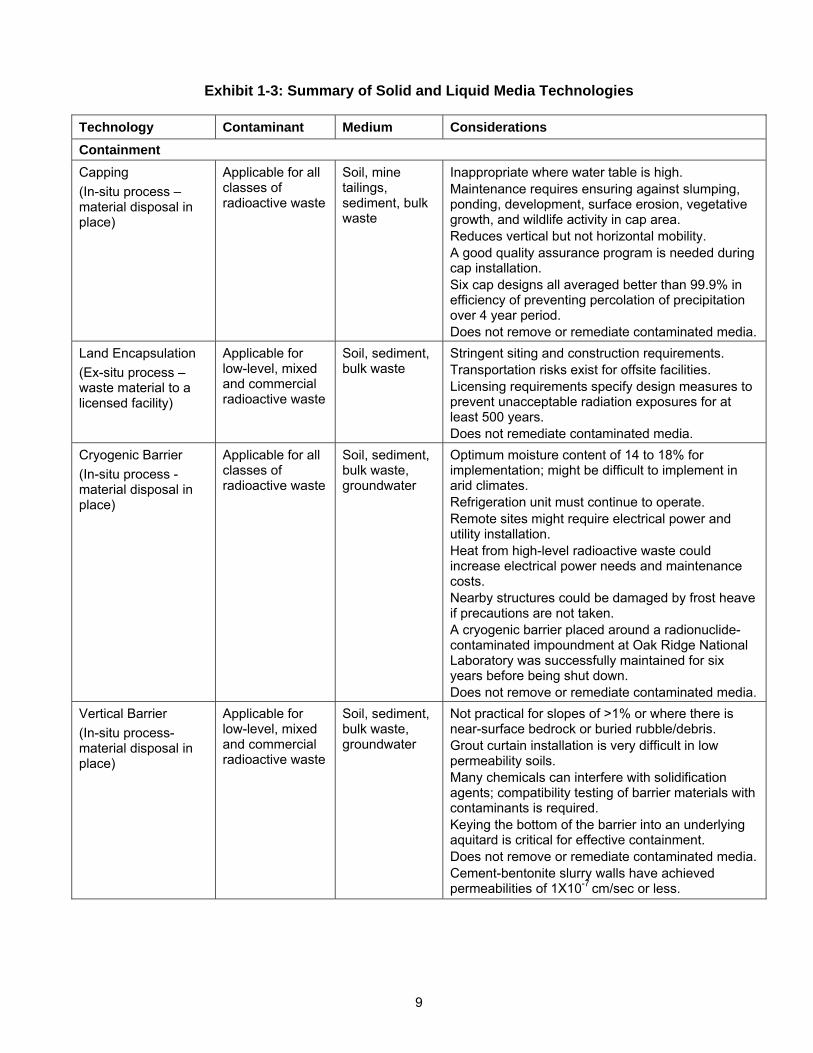
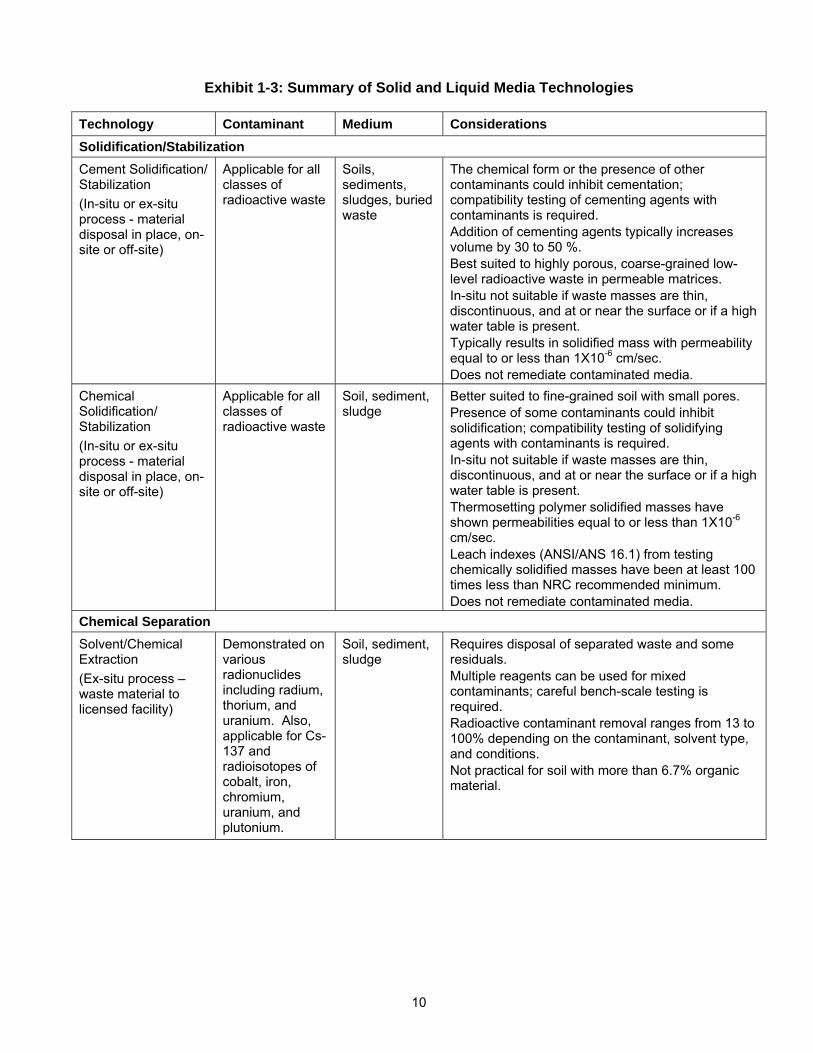
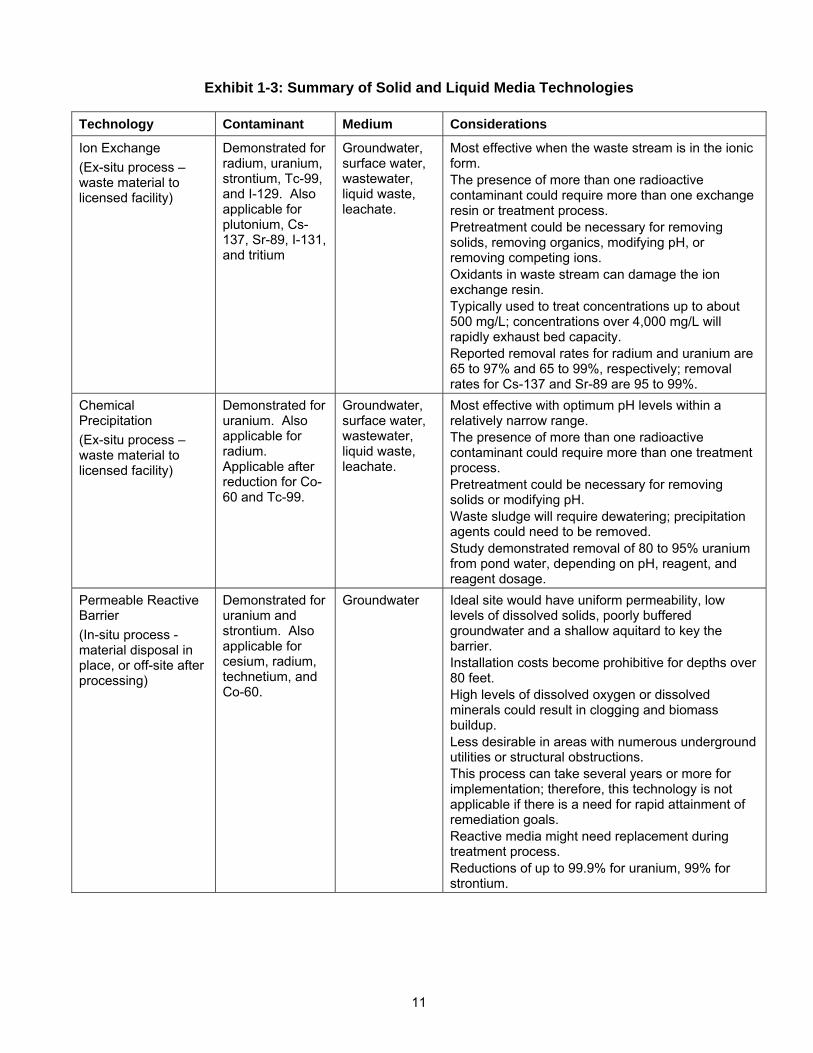
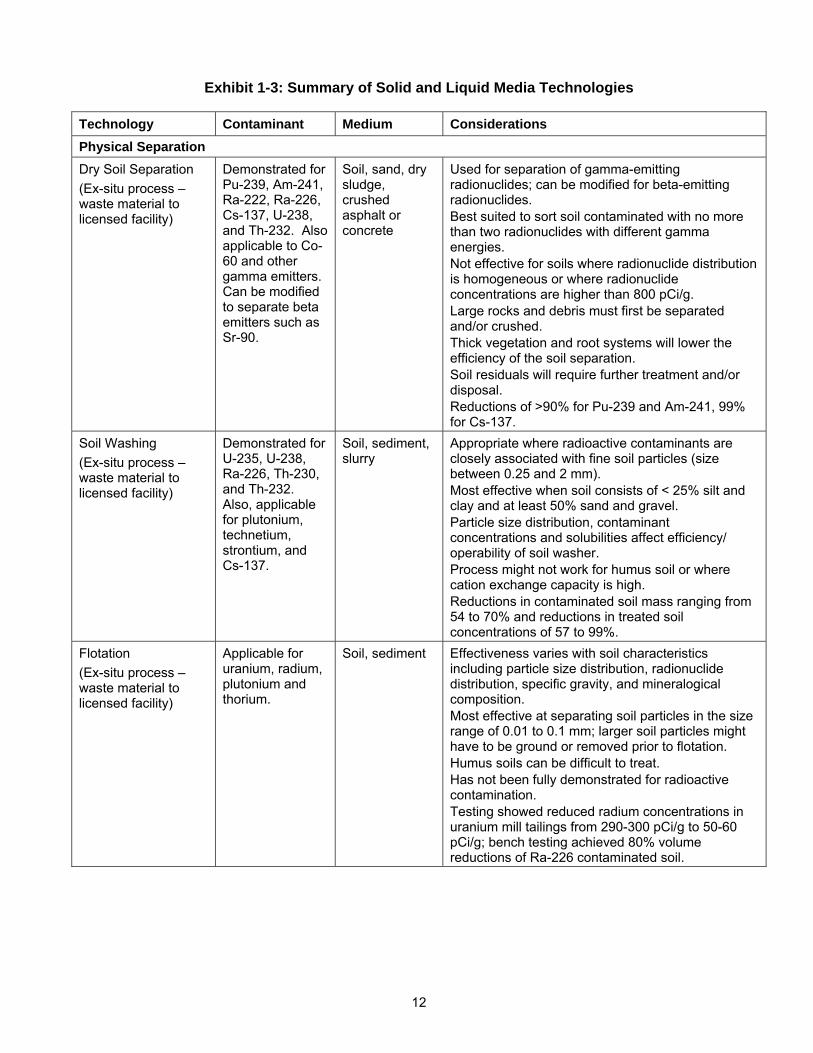
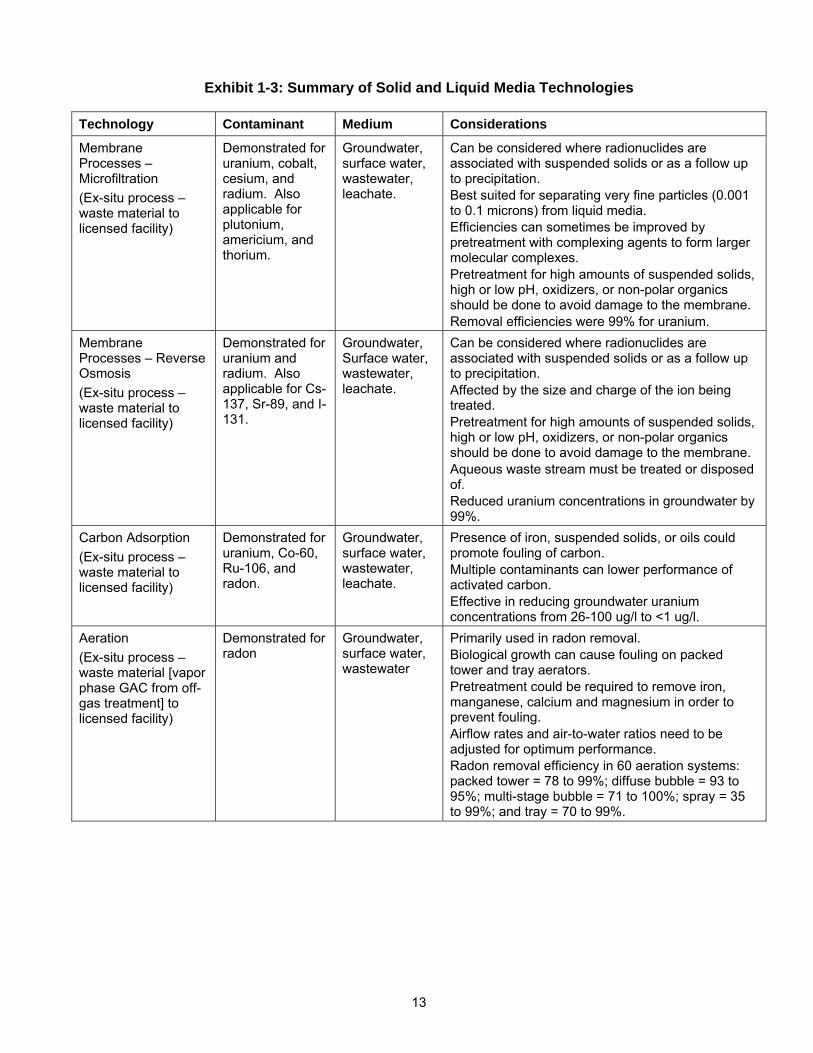
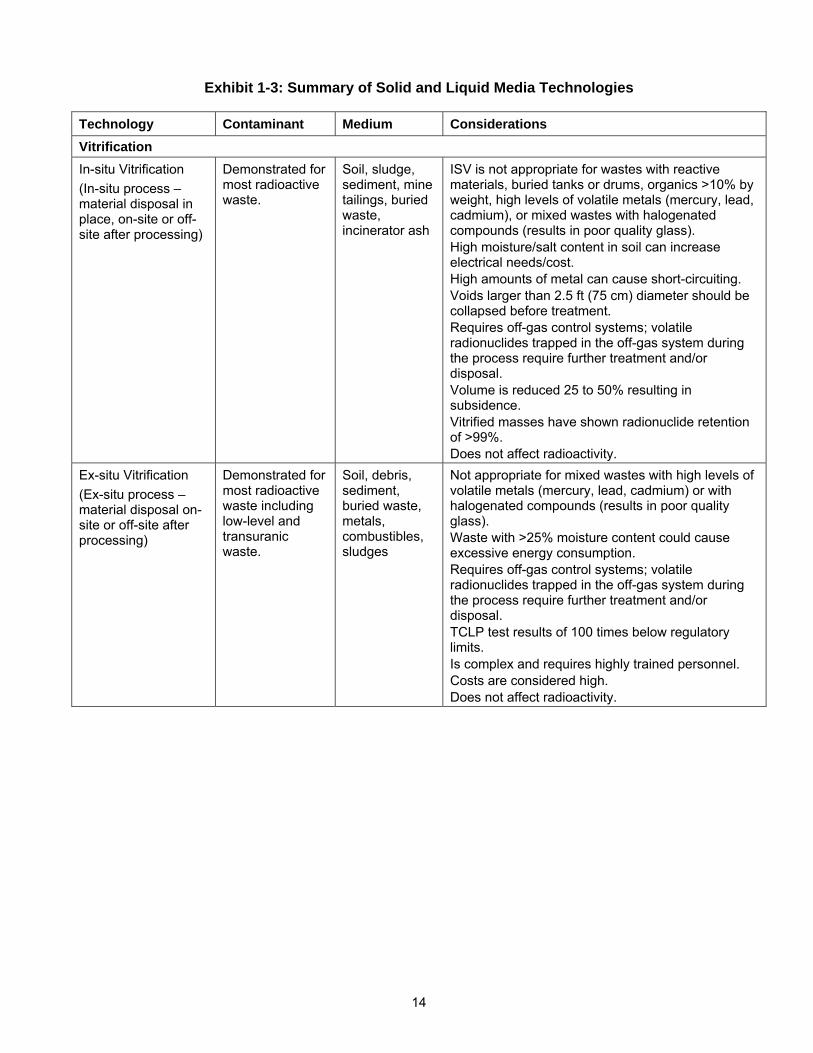
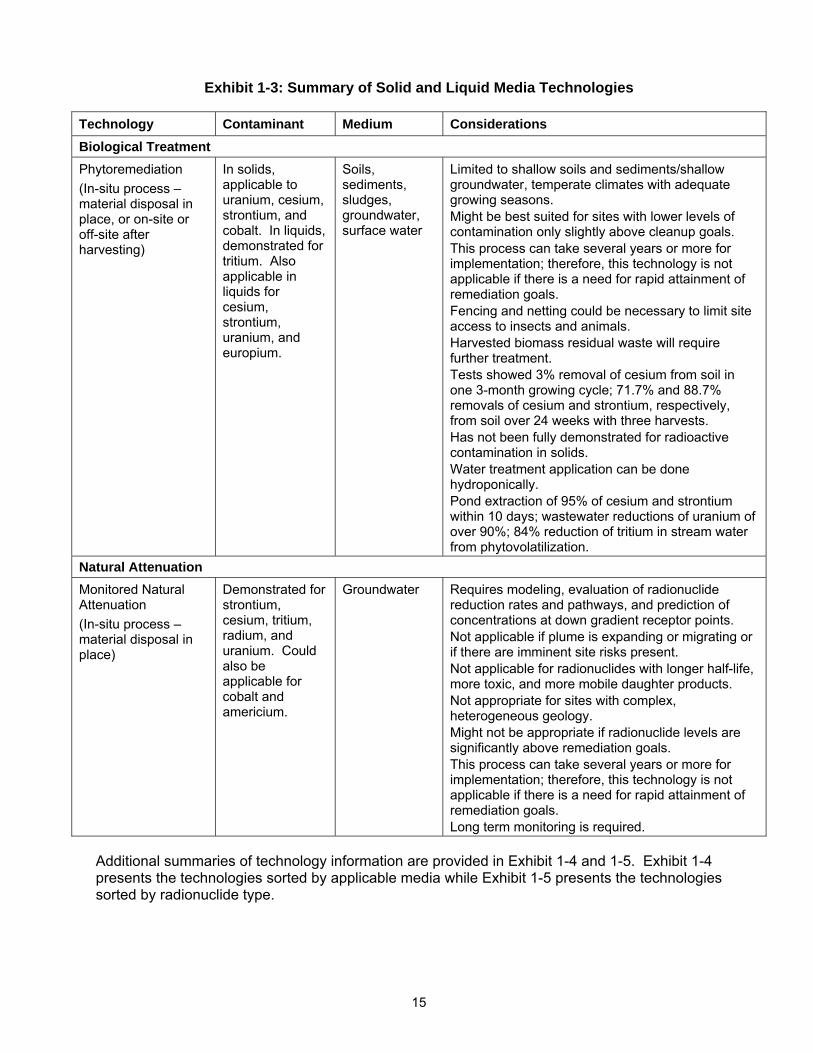
A table summarizing each of the technologies is presented in Exhibit 1-3. This table describes which media are addressed by the technology and the radioactive contaminants for which the technology is applicable or demonstrated. In addition, the table includes special considerations that could affect whether a technology is appropriate for a specific site and general results and/or limitations on how well the technology has performed. These considerations are general in nature and the reader should refer to the technology profiles for a complete discussion of each technology.
9
Exhibit 1-3: Summary of Solid and Liquid Media Technologies
Technology Contaminant Medium Considerations Containment Capping (In-situ process – material disposal in place)
Applicable for all classes of radioactive waste
Soil, mine tailings, sediment, bulk waste
Inappropriate where water table is high. Maintenance requires ensuring against slumping, ponding, development, surface erosion, vegetative growth, and wildlife activity in cap area. Reduces vertical but not horizontal mobility. A good quality assurance program is needed during cap installation. Six cap designs all averaged better than 99.9% in efficiency of preventing percolation of precipitation over 4 year period. Does not remove or remediate contaminated media.
Land Encapsulation (Ex-situ process –waste material to a licensed facility)
Applicable for low-level, mixed and commercial radioactive waste
Soil, sediment, bulk waste
Stringent siting and construction requirements. Transportation risks exist for offsite facilities. Licensing requirements specify design measures to prevent unacceptable radiation exposures for at least 500 years. Does not remediate contaminated media.
Cryogenic Barrier (In-situ process - material disposal in place)
Applicable for all classes of radioactive waste
Soil, sediment, bulk waste, groundwater
Optimum moisture content of 14 to 18% for implementation; might be difficult to implement in arid climates. Refrigeration unit must continue to operate. Remote sites might require electrical power and utility installation. Heat from high-level radioactive waste could increase electrical power needs and maintenance costs. Nearby structures could be damaged by frost heave if precautions are not taken. A cryogenic barrier placed around a radionuclide-contaminated impoundment at Oak Ridge National Laboratory was successfully maintained for six years before being shut down. Does not remove or remediate contaminated media.
Vertical Barrier (In-situ process- material disposal in place)
Applicable for low-level, mixed and commercial radioactive waste
Soil, sediment, bulk waste, groundwater
Not practical for slopes of >1% or where there is near-surface bedrock or buried rubble/debris. Grout curtain installation is very difficult in low permeability soils. Many chemicals can interfere with solidification agents; compatibility testing of barrier materials with contaminants is required. Keying the bottom of the barrier into an underlying aquitard is critical for effective containment. Does not remove or remediate contaminated media. Cement-bentonite slurry walls have achieved permeabilities of 1X10⁻⁷ cm/sec or less.
10
Exhibit 1-3: Summary of Solid and Liquid Media Technologies
Technology Contaminant Medium Considerations Solidification/Stabilization Cement Solidification/ Stabilization (In-situ or ex-situ process - material disposal in place, on-site or off-site)
Applicable for all classes of radioactive waste
Soils, sediments, sludges, buried waste
The chemical form or the presence of other contaminants could inhibit cementation; compatibility testing of cementing agents with contaminants is required. Addition of cementing agents typically increases volume by 30 to 50 %. Best suited to highly porous, coarse-grained low-level radioactive waste in permeable matrices. In-situ not suitable if waste masses are thin, discontinuous, and at or near the surface or if a high water table is present. Typically results in solidified mass with permeability equal to or less than 1X10⁻⁶ cm/sec. Does not remediate contaminated media.
Chemical Solidification/ Stabilization (In-situ or ex-situ process - material disposal in place, on-site or off-site)
Applicable for all classes of radioactive waste
Soil, sediment, sludge
Better suited to fine-grained soil with small pores. Presence of some contaminants could inhibit solidification; compatibility testing of solidifying agents with contaminants is required. In-situ not suitable if waste masses are thin, discontinuous, and at or near the surface or if a high water table is present. Thermosetting polymer solidified masses have shown permeabilities equal to or less than 1X10⁻⁶
cm/sec. Leach indexes (ANSI/ANS 16.1) from testing chemically solidified masses have been at least 100 times less than NRC recommended minimum. Does not remediate contaminated media.
Chemical Separation Solvent/Chemical Extraction (Ex-situ process – waste material to licensed facility)
Demonstrated on various radionuclides including radium, thorium, and uranium. Also, applicable for Cs-137 and radioisotopes of cobalt, iron, chromium, uranium, and plutonium.
Soil, sediment, sludge
Requires disposal of separated waste and some residuals. Multiple reagents can be used for mixed contaminants; careful bench-scale testing is required. Radioactive contaminant removal ranges from 13 to 100% depending on the contaminant, solvent type, and conditions. Not practical for soil with more than 6.7% organic material.
11
Exhibit 1-3: Summary of Solid and Liquid Media Technologies
Technology Contaminant Medium Considerations
Ion Exchange (Ex-situ process – waste material to licensed facility)
Demonstrated for radium, uranium, strontium, Tc-99, and I-129. Also applicable for plutonium, Cs-137, Sr-89, I-131, and tritium
Groundwater, surface water, wastewater, liquid waste, leachate.
Most effective when the waste stream is in the ionic form. The presence of more than one radioactive contaminant could require more than one exchange resin or treatment process. Pretreatment could be necessary for removing solids, removing organics, modifying pH, or removing competing ions. Oxidants in waste stream can damage the ion exchange resin. Typically used to treat concentrations up to about 500 mg/L; concentrations over 4,000 mg/L will rapidly exhaust bed capacity. Reported removal rates for radium and uranium are 65 to 97% and 65 to 99%, respectively; removal rates for Cs-137 and Sr-89 are 95 to 99%.
Chemical Precipitation (Ex-situ process – waste material to licensed facility)
Demonstrated for uranium. Also applicable for radium. Applicable after reduction for Co-60 and Tc-99.
Groundwater, surface water, wastewater, liquid waste, leachate.
Most effective with optimum pH levels within a relatively narrow range. The presence of more than one radioactive contaminant could require more than one treatment process. Pretreatment could be necessary for removing solids or modifying pH. Waste sludge will require dewatering; precipitation agents could need to be removed. Study demonstrated removal of 80 to 95% uranium from pond water, depending on pH, reagent, and reagent dosage.
Permeable Reactive Barrier (In-situ process - material disposal in place, or off-site after processing)
Demonstrated for uranium and strontium. Also applicable for cesium, radium, technetium, and Co-60.
Groundwater Ideal site would have uniform permeability, low levels of dissolved solids, poorly buffered groundwater and a shallow aquitard to key the barrier. Installation costs become prohibitive for depths over 80 feet. High levels of dissolved oxygen or dissolved minerals could result in clogging and biomass buildup. Less desirable in areas with numerous underground utilities or structural obstructions. This process can take several years or more for implementation; therefore, this technology is not applicable if there is a need for rapid attainment of remediation goals. Reactive media might need replacement during treatment process. Reductions of up to 99.9% for uranium, 99% for strontium.
12
Exhibit 1-3: Summary of Solid and Liquid Media Technologies
Technology Contaminant Medium Considerations Physical Separation Dry Soil Separation (Ex-situ process – waste material to licensed facility)
Demonstrated for Pu-239, Am-241, Ra-222, Ra-226, Cs-137, U-238, and Th-232. Also applicable to Co-60 and other gamma emitters. Can be modified to separate beta emitters such as Sr-90.
Soil, sand, dry sludge, crushed asphalt or concrete
Used for separation of gamma-emitting radionuclides; can be modified for beta-emitting radionuclides. Best suited to sort soil contaminated with no more than two radionuclides with different gamma energies. Not effective for soils where radionuclide distribution is homogeneous or where radionuclide concentrations are higher than 800 pCi/g. Large rocks and debris must first be separated and/or crushed. Thick vegetation and root systems will lower the efficiency of the soil separation. Soil residuals will require further treatment and/or disposal. Reductions of >90% for Pu-239 and Am-241, 99% for Cs-137.
Soil Washing (Ex-situ process – waste material to licensed facility)
Demonstrated for U-235, U-238, Ra-226, Th-230, and Th-232. Also, applicable for plutonium, technetium, strontium, and Cs-137.
Soil, sediment, slurry
Appropriate where radioactive contaminants are closely associated with fine soil particles (size between 0.25 and 2 mm). Most effective when soil consists of < 25% silt and clay and at least 50% sand and gravel. Particle size distribution, contaminant concentrations and solubilities affect efficiency/ operability of soil washer. Process might not work for humus soil or where cation exchange capacity is high. Reductions in contaminated soil mass ranging from 54 to 70% and reductions in treated soil concentrations of 57 to 99%.
Flotation (Ex-situ process – waste material to licensed facility)
Applicable for uranium, radium, plutonium and thorium.
Soil, sediment Effectiveness varies with soil characteristics including particle size distribution, radionuclide distribution, specific gravity, and mineralogical composition. Most effective at separating soil particles in the size range of 0.01 to 0.1 mm; larger soil particles might have to be ground or removed prior to flotation. Humus soils can be difficult to treat. Has not been fully demonstrated for radioactive contamination. Testing showed reduced radium concentrations in uranium mill tailings from 290-300 pCi/g to 50-60 pCi/g; bench testing achieved 80% volume reductions of Ra-226 contaminated soil.
13
Exhibit 1-3: Summary of Solid and Liquid Media Technologies
Technology Contaminant Medium Considerations
Membrane Processes – Microfiltration (Ex-situ process – waste material to licensed facility)
Demonstrated for uranium, cobalt, cesium, and radium. Also applicable for plutonium, americium, and thorium.
Groundwater, surface water, wastewater, leachate.
Can be considered where radionuclides are associated with suspended solids or as a follow up to precipitation. Best suited for separating very fine particles (0.001 to 0.1 microns) from liquid media. Efficiencies can sometimes be improved by pretreatment with complexing agents to form larger molecular complexes. Pretreatment for high amounts of suspended solids, high or low pH, oxidizers, or non-polar organics should be done to avoid damage to the membrane. Removal efficiencies were 99% for uranium.
Membrane Processes – Reverse Osmosis (Ex-situ process – waste material to licensed facility)
Demonstrated for uranium and radium. Also applicable for Cs-137, Sr-89, and I-131.
Groundwater, Surface water, wastewater, leachate.
Can be considered where radionuclides are associated with suspended solids or as a follow up to precipitation. Affected by the size and charge of the ion being treated. Pretreatment for high amounts of suspended solids, high or low pH, oxidizers, or non-polar organics should be done to avoid damage to the membrane. Aqueous waste stream must be treated or disposed of. Reduced uranium concentrations in groundwater by 99%.
Carbon Adsorption (Ex-situ process – waste material to licensed facility)
Demonstrated for uranium, Co-60, Ru-106, and radon.
Groundwater, surface water, wastewater, leachate.
Presence of iron, suspended solids, or oils could promote fouling of carbon. Multiple contaminants can lower performance of activated carbon. Effective in reducing groundwater uranium concentrations from 26-100 ug/l to <1 ug/l.
Aeration (Ex-situ process – waste material [vapor phase GAC from off-gas treatment] to licensed facility)
Demonstrated for radon
Groundwater, surface water, wastewater
Primarily used in radon removal. Biological growth can cause fouling on packed tower and tray aerators. Pretreatment could be required to remove iron, manganese, calcium and magnesium in order to prevent fouling. Airflow rates and air-to-water ratios need to be adjusted for optimum performance. Radon removal efficiency in 60 aeration systems: packed tower = 78 to 99%; diffuse bubble = 93 to 95%; multi-stage bubble = 71 to 100%; spray = 35 to 99%; and tray = 70 to 99%.
14
Exhibit 1-3: Summary of Solid and Liquid Media Technologies
Technology Contaminant Medium Considerations Vitrification In-situ Vitrification (In-situ process – material disposal in place, on-site or off-site after processing)
Demonstrated for most radioactive waste.
Soil, sludge, sediment, mine tailings, buried waste, incinerator ash
ISV is not appropriate for wastes with reactive materials, buried tanks or drums, organics >10% by weight, high levels of volatile metals (mercury, lead, cadmium), or mixed wastes with halogenated compounds (results in poor quality glass). High moisture/salt content in soil can increase electrical needs/cost. High amounts of metal can cause short-circuiting. Voids larger than 2.5 ft (75 cm) diameter should be collapsed before treatment. Requires off-gas control systems; volatile radionuclides trapped in the off-gas system during the process require further treatment and/or disposal. Volume is reduced 25 to 50% resulting in subsidence. Vitrified masses have shown radionuclide retention of >99%. Does not affect radioactivity.
Ex-situ Vitrification (Ex-situ process – material disposal on-site or off-site after processing)
Demonstrated for most radioactive waste including low-level and transuranic waste.
Soil, debris, sediment, buried waste, metals, combustibles, sludges
Not appropriate for mixed wastes with high levels of volatile metals (mercury, lead, cadmium) or with halogenated compounds (results in poor quality glass). Waste with >25% moisture content could cause excessive energy consumption. Requires off-gas control systems; volatile radionuclides trapped in the off-gas system during the process require further treatment and/or disposal. TCLP test results of 100 times below regulatory limits. Is complex and requires highly trained personnel. Costs are considered high. Does not affect radioactivity.
15
Exhibit 1-3: Summary of Solid and Liquid Media Technologies
Technology Contaminant Medium Considerations Biological Treatment Phytoremediation (In-situ process – material disposal in place, or on-site or off-site after harvesting)
In solids, applicable to uranium, cesium, strontium, and cobalt. In liquids, demonstrated for tritium. Also applicable in liquids for cesium, strontium, uranium, and europium.
Soils, sediments, sludges, groundwater, surface water
Limited to shallow soils and sediments/shallow groundwater, temperate climates with adequate growing seasons. Might be best suited for sites with lower levels of contamination only slightly above cleanup goals. This process can take several years or more for implementation; therefore, this technology is not applicable if there is a need for rapid attainment of remediation goals. Fencing and netting could be necessary to limit site access to insects and animals. Harvested biomass residual waste will require further treatment. Tests showed 3% removal of cesium from soil in one 3-month growing cycle; 71.7% and 88.7% removals of cesium and strontium, respectively, from soil over 24 weeks with three harvests. Has not been fully demonstrated for radioactive contamination in solids. Water treatment application can be done hydroponically. Pond extraction of 95% of cesium and strontium within 10 days; wastewater reductions of uranium of over 90%; 84% reduction of tritium in stream water from phytovolatilization.
Natural Attenuation Monitored Natural Attenuation (In-situ process – material disposal in place)
Demonstrated for strontium, cesium, tritium, radium, and uranium. Could also be applicable for cobalt and americium.
Groundwater Requires modeling, evaluation of radionuclide reduction rates and pathways, and prediction of concentrations at down gradient receptor points. Not applicable if plume is expanding or migrating or if there are imminent site risks present. Not applicable for radionuclides with longer half-life, more toxic, and more mobile daughter products. Not appropriate for sites with complex, heterogeneous geology. Might not be appropriate if radionuclide levels are significantly above remediation goals. This process can take several years or more for implementation; therefore, this technology is not applicable if there is a need for rapid attainment of remediation goals. Long term monitoring is required.
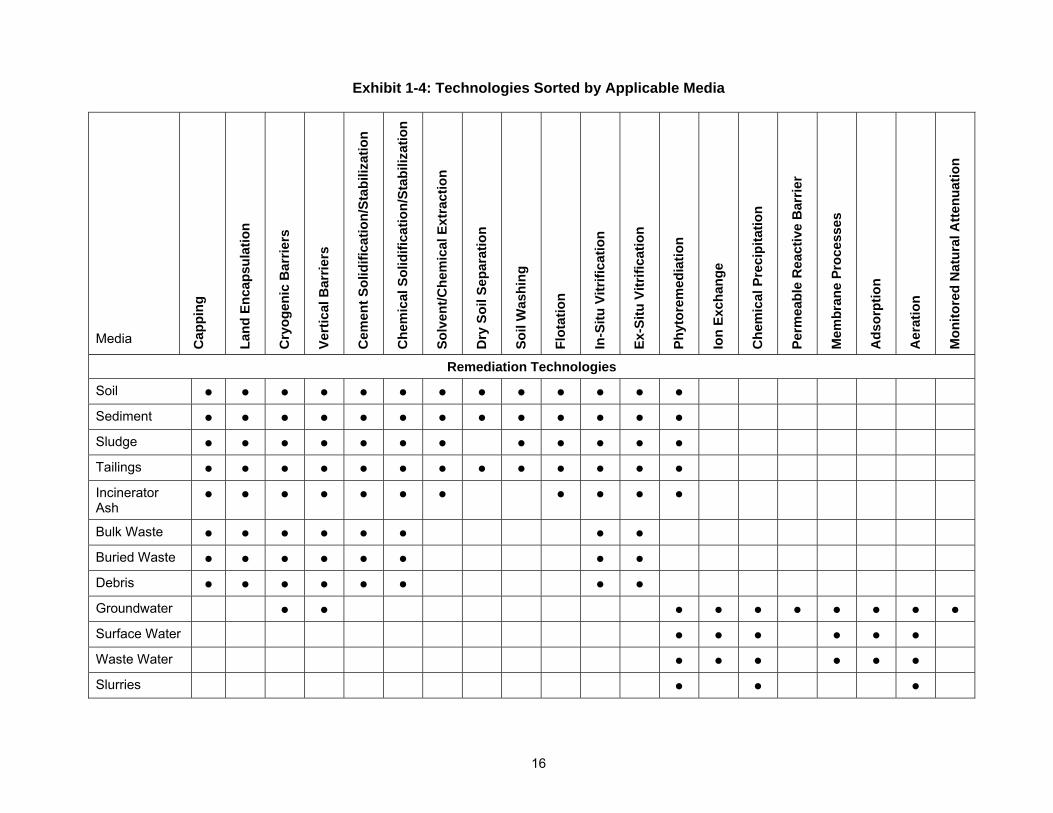
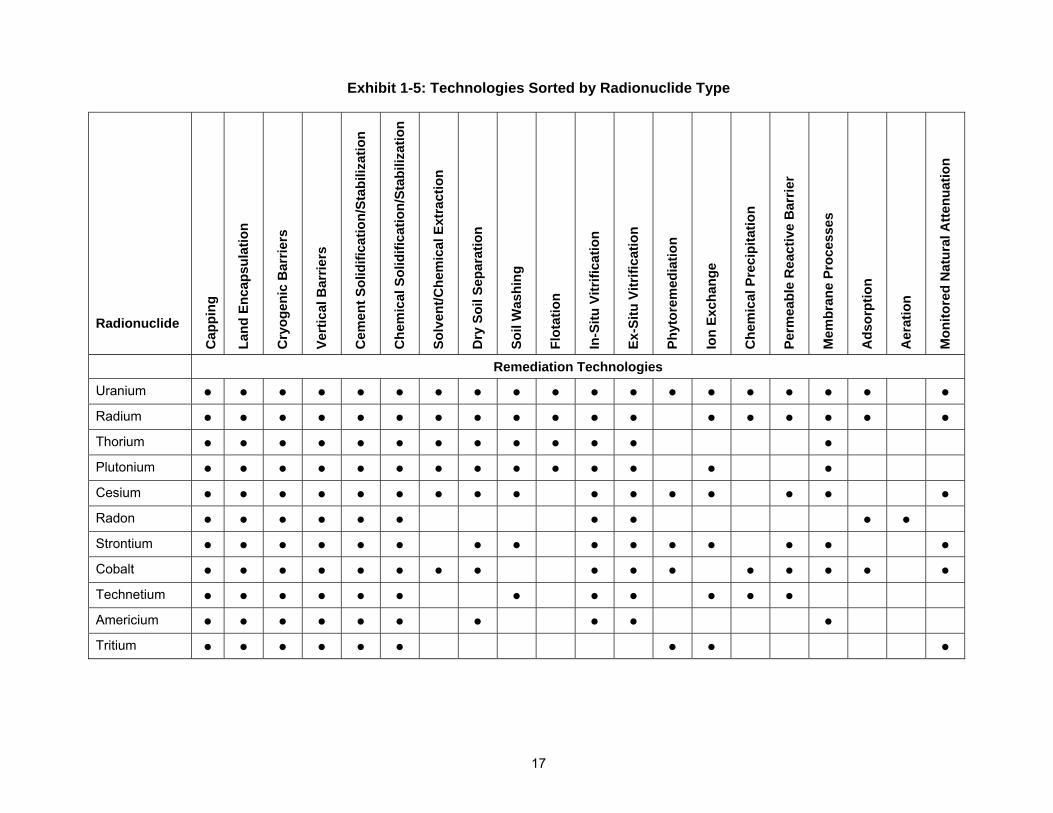
Additional summaries of technology information are provided in Exhibit 1-4 and 1-5. Exhibit 1-4 presents the technologies sorted by applicable media while Exhibit 1-5 presents the technologies sorted by radionuclide type.
16
Exhibit 1-4: Technologies Sorted by Applicable Media
Media C
appi
ng
Land
Enc
apsu
latio
n
Cry
ogen
ic B
arrie
rs
Vert
ical
Bar
riers
Cem
ent S
olid
ifica
tion/
Stab
iliza
tion
Che
mic
al S
olid
ifica
tion/
Stab
iliza
tion
Solv
ent/C
hem
ical
Ext
ract
ion
Dry
Soi
l Sep
arat
ion
Soil
Was
hing
Flot
atio
n
In-S
itu V
itrifi
catio
n
Ex-S
itu V
itrifi
catio
n
Phyt
orem
edia
tion
Ion
Exch
ange
Che
mic
al P
reci
pita
tion
Perm
eabl
e R
eact
ive
Bar
rier
Mem
bran
e Pr
oces
ses
Ads
orpt
ion
Aer
atio
n
Mon
itore
d N
atur
al A
ttenu
atio
n
Remediation Technologies
Soil ● ● ● ● ● ● ● ● ● ● ● ● ● Sediment ● ● ● ● ● ● ● ● ● ● ● ● ● Sludge ● ● ● ● ● ● ● ● ● ● ● ● Tailings ● ● ● ● ● ● ● ● ● ● ● ● ● Incinerator Ash
● ● ● ● ● ● ● ● ● ● ●
Bulk Waste ● ● ● ● ● ● ● ● Buried Waste ● ● ● ● ● ● ● ● Debris ● ● ● ● ● ● ● ● Groundwater ● ● ● ● ● ● ● ● ● ● Surface Water ● ● ● ● ● ● Waste Water ● ● ● ● ● ● Slurries ● ● ●
17
Exhibit 1-5: Technologies Sorted by Radionuclide Type
Radionuclide
Cap
ping
Land
Enc
apsu
latio
n
Cry
ogen
ic B
arrie
rs
Vert
ical
Bar
riers
Cem
ent S
olid
ifica
tion/
Stab
iliza
tion
Che
mic
al S
olid
ifica
tion/
Stab
iliza
tion
Solv
ent/C
hem
ical
Ext
ract
ion
Dry
Soi
l Sep
arat
ion
Soil
Was
hing
Flot
atio
n
In-S
itu V
itrifi
catio
n
Ex-S
itu V
itrifi
catio
n
Phyt
orem
edia
tion
Ion
Exch
ange
Che
mic
al P
reci
pita
tion
Perm
eabl
e R
eact
ive
Bar
rier
Mem
bran
e Pr
oces
ses
Ads
orpt
ion
Aer
atio
n
Mon
itore
d N
atur
al A
ttenu
atio
n
Remediation Technologies
Uranium ● ● ● ● ● ● ● ● ● ● ● ● ● ● ● ● ● ● ● Radium ● ● ● ● ● ● ● ● ● ● ● ● ● ● ● ● ● ● Thorium ● ● ● ● ● ● ● ● ● ● ● ● ● Plutonium ● ● ● ● ● ● ● ● ● ● ● ● ● ● Cesium ● ● ● ● ● ● ● ● ● ● ● ● ● ● ● ● Radon ● ● ● ● ● ● ● ● ● ● Strontium ● ● ● ● ● ● ● ● ● ● ● ● ● ● ● Cobalt ● ● ● ● ● ● ● ● ● ● ● ● ● ● ● ● Technetium ● ● ● ● ● ● ● ● ● ● ● ● Americium ● ● ● ● ● ● ● ● ● ● Tritium ● ● ● ● ● ● ● ● ●
18
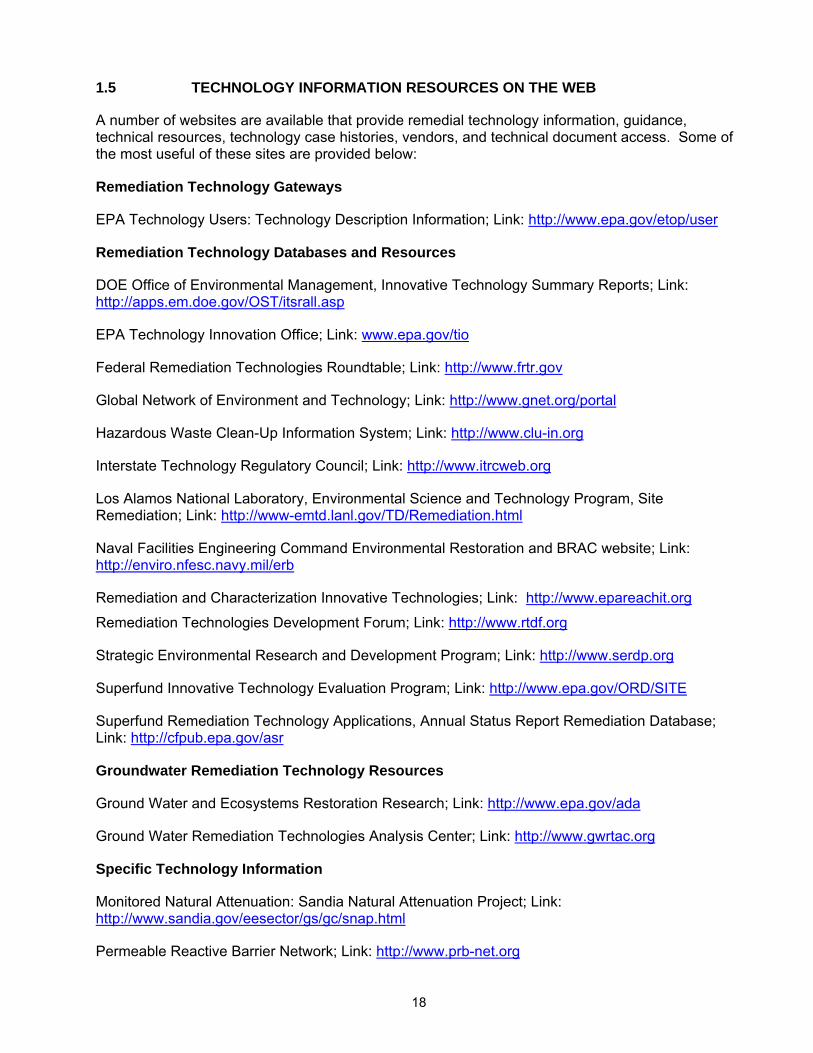
1.5 TECHNOLOGY INFORMATION RESOURCES ON THE WEB
A number of websites are available that provide remedial technology information, guidance, technical resources, technology case histories, vendors, and technical document access. Some of the most useful of these sites are provided below:
Remediation Technology Gateways
EPA Technology Users: Technology Description Information; Link: http://www.epa.gov/etop/user
Remediation Technology Databases and Resources
DOE Office of Environmental Management, Innovative Technology Summary Reports; Link: http://apps.em.doe.gov/OST/itsrall.asp
EPA Technology Innovation Office; Link: www.epa.gov/tio
Federal Remediation Technologies Roundtable; Link: http://www.frtr.gov
Global Network of Environment and Technology; Link: http://www.gnet.org/portal
Hazardous Waste Clean-Up Information System; Link: http://www.clu-in.org
Interstate Technology Regulatory Council; Link: http://www.itrcweb.org
Los Alamos National Laboratory, Environmental Science and Technology Program, Site Remediation; Link: http://www-emtd.lanl.gov/TD/Remediation.html
Naval Facilities Engineering Command Environmental Restoration and BRAC website; Link: http://enviro.nfesc.navy.mil/erb
Remediation and Characterization Innovative Technologies; Link: http://www.epareachit.org
Remediation Technologies Development Forum; Link: http://www.rtdf.org
Strategic Environmental Research and Development Program; Link: http://www.serdp.org
Superfund Innovative Technology Evaluation Program; Link: http://www.epa.gov/ORD/SITE
Superfund Remediation Technology Applications, Annual Status Report Remediation Database; Link: http://cfpub.epa.gov/asr
Groundwater Remediation Technology Resources
Ground Water and Ecosystems Restoration Research; Link: http://www.epa.gov/ada
Ground Water Remediation Technologies Analysis Center; Link: http://www.gwrtac.org
Specific Technology Information
Monitored Natural Attenuation: Sandia Natural Attenuation Project; Link: http://www.sandia.gov/eesector/gs/gc/snap.html
Permeable Reactive Barrier Network; Link: http://www.prb-net.org
19
Radioactively Contaminated Sites Guidance
Key OSWER Radiation Guidances and Reports, Link: http://www.epa.gov/superfund/resources/radiation
Publications for Radiation Site Cleanup; Link: http://www.epa.gov/radiation/cleanup/pubs.htm
Technical and Guidance Documents for Radioactively Contaminated Sites; Link: http://www.epa.gov/radiation/cleanup/documents.html
Electronic Document Access
DOE documents - Office of Scientific and Technical Information, Information Bridge database; Link: http://www.osti.gov/bridge
EPA documents - National Environmental Publication Information System; Link: http://nepis.epa.gov/pubtitle.htm
Superfund Records of Decision; Link: http://cfpub.epa.gov/superrods
1.6 ORGANIZATION AND USE OF THIS GUIDE
The remainder of this Guide contains the following components:
Section 2 provides 13 treatment technologies for solid media grouped under six categories:
• Containment • Solidification/Stabilization • Chemical Separation • Physical Separation • Vitrification • Biological Treatment
Section 3 which describes eight treatment technologies for radionuclide-contaminated liquid media, grouped under four categories:
• Chemical Separation • Physical Separation • Biological Treatment • Natural Attenuation
Section 4 describes five emerging technologies that show potential for development. These technologies have been bench-tested for treatment of radionuclides and in some cases, pilot-tested but have not had full-scale applications demonstrated for radionuclide contaminated media.
Following Section 4 are the Appendices, containing a table with specific information about radionuclides present at individual NPL sites, a discussion of radioactivity concepts, glossary of terms, a list of elements and symbols, and a suggested reading list of general references for those readers who wish to research the technologies further.
Exhibit 1-6 suggests how the profiles in this Guide can be used to identify potential treatment technologies for application to radioactively contaminated media at a specific site.
20
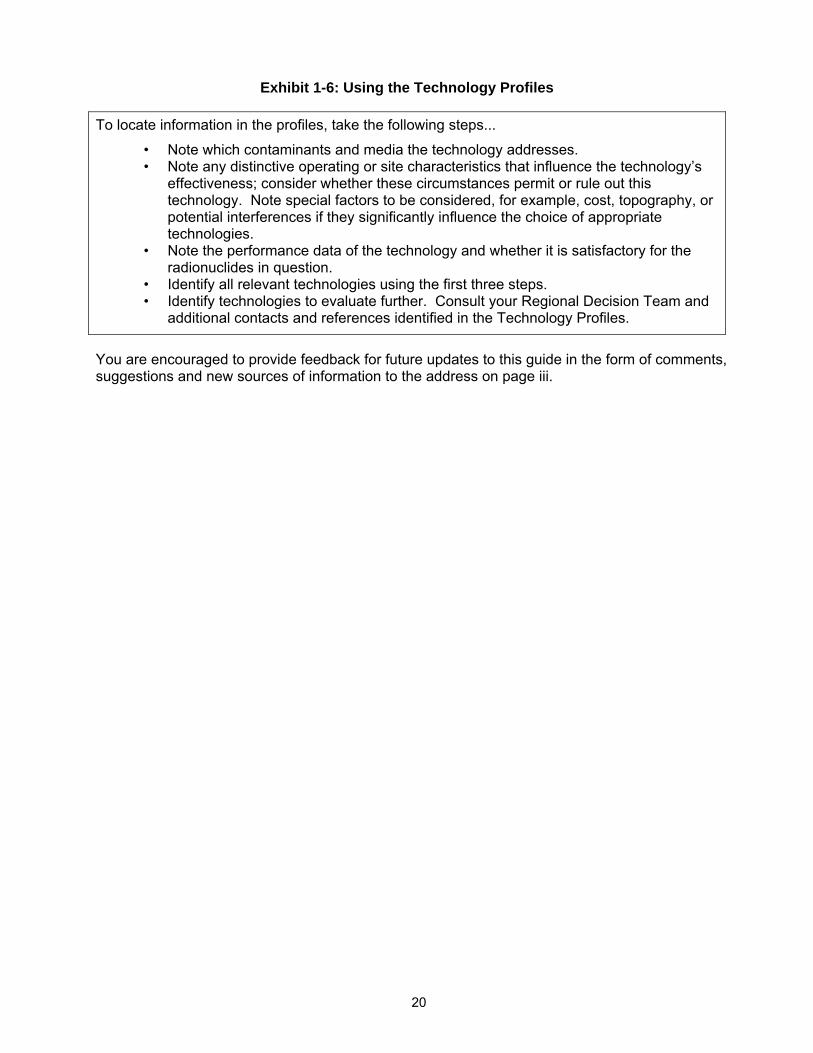
Exhibit 1-6: Using the Technology Profiles
To locate information in the profiles, take the following steps...
• Note which contaminants and media the technology addresses. • Note any distinctive operating or site characteristics that influence the technology’s
effectiveness; consider whether these circumstances permit or rule out this technology. Note special factors to be considered, for example, cost, topography, or potential interferences if they significantly influence the choice of appropriate technologies.
• Note the performance data of the technology and whether it is satisfactory for the radionuclides in question.
• Identify all relevant technologies using the first three steps. • Identify technologies to evaluate further. Consult your Regional Decision Team and
additional contacts and references identified in the Technology Profiles.
You are encouraged to provide feedback for future updates to this guide in the form of comments, suggestions and new sources of information to the address on page iii.
21
2.0 SOLID MEDIA TECHNOLOGY PROFILES
2.1 CONTAINMENT TECHNOLOGIES
Containment technologies are designed to isolate contaminated materials in order to prevent exposure to humans and the environment. Often, volume reduction or other treatment technologies are applied to radioactive waste prior to containment. Regardless of the technologies applied, however, there is generally a portion of the radioactive material that requires long-term disposal. Exceptions include radionuclides with relatively short half-lives (e.g. cobalt-60), in which case containment for shorter periods of time could be appropriate. Because most radionuclides require long-term disposal, remedies for radioactively contaminated sites usually employ containment technologies. Some containment technologies are designed to prevent horizontal contaminant migration, some to prevent vertical migration, and others to prevent any form of migration. To achieve the necessary level of isolation, different containment technologies are often used in conjunction with one another.
The following containment technologies used to isolate radioactive waste are discussed in this section: capping (containment in place); land encapsulation (excavation and disposal, on-site or off-site); cryogenic barriers (containment in place); and vertical barriers (containment in place). There can be one or more sub-options applicable to each technology.
2.1.1 Capping
Description
Capping is a containment technology that forms a barrier between the contaminated media and the surface, thereby shielding humans and the environment from radiation effects. Capping radioactive waste involves covering the contaminated media with a cap sufficiently thick and impermeable to minimize the migration of waste to the surface and to control windblown contamination. A cap must also restrict surface water infiltration into the contaminated subsurface to reduce the potential for contaminants to leach from the site. Capping does not prevent horizontal migration of contaminants due to groundwater flow, however, it can be used in conjunction with vertical walls to produce an essentially complete structure surrounding the waste mass (EPA, 1988). This complete type of containment is referred to as land encapsulation and is discussed in the following technology section.
When waste is entirely above the saturated zone, a properly designed cap can prevent the entry of water to underlying contaminated materials. A cap can be placed over a large, discrete contaminated area or it can be a continuous cover over several smaller contaminated areas close together. A cap must extend a few feet beyond the perimeter of the contaminated area to prevent lateral infiltration of rain.
Caps can be made of a variety of materials, each of which provides a different degree of protection. Capping materials include synthetic membrane liners such as geomembranes (e.g. high density polyethylene), asphalt, cement and natural low-permeability soils such as clay. A cap is usually a combination of materials layered one on top of the other. A typical cap for containing radioactive media might consist of several feet of compacted filler, a geomembrane, a layer of compacted clay, another geomembrane and several feet of top soil (see Exhibit 2-1). A layer of ground cover vegetation can be applied to the surface of the cap to reduce soil erosion and limit the potential for precipitation to permeate the cap. A drainage layer can also be necessary beneath the topsoil and above the upper geomembrane in areas of higher precipitation.
Caps for radium-contaminated sites must be designed to confine gaseous radon until it has essentially decayed. If synthetic membrane liners are not used, the depth of cover required is
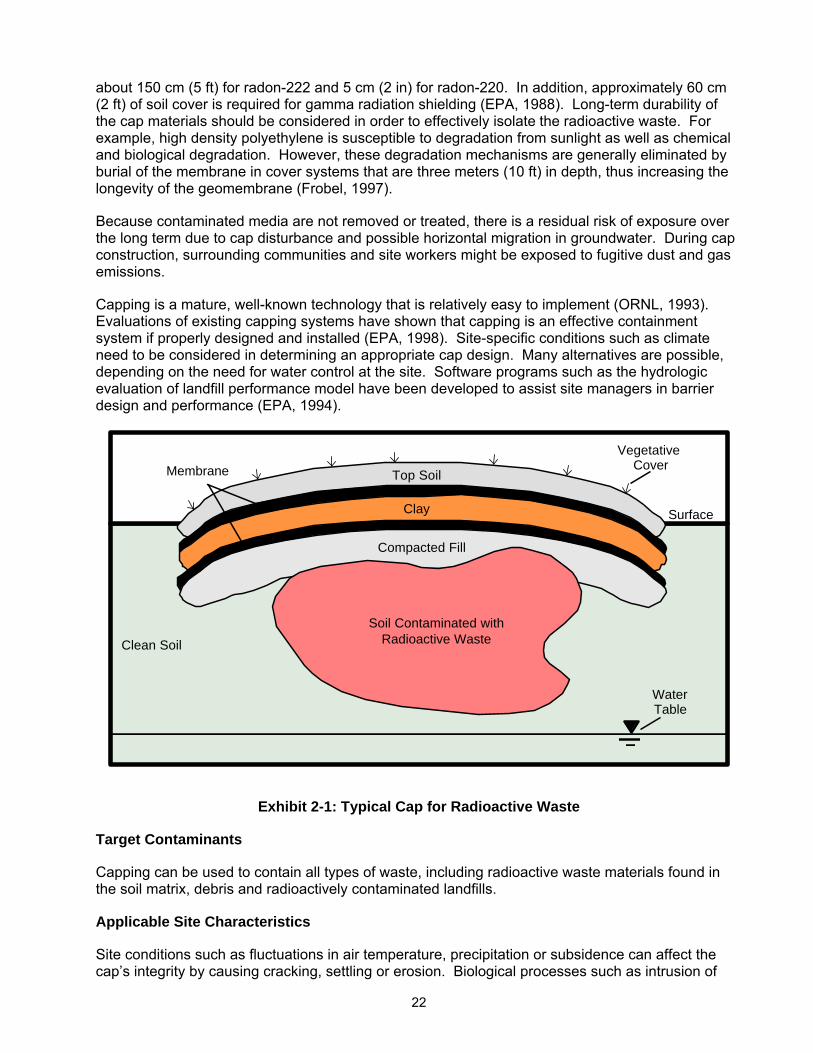
22
about 150 cm (5 ft) for radon-222 and 5 cm (2 in) for radon-220. In addition, approximately 60 cm (2 ft) of soil cover is required for gamma radiation shielding (EPA, 1988). Long-term durability of the cap materials should be considered in order to effectively isolate the radioactive waste. For example, high density polyethylene is susceptible to degradation from sunlight as well as chemical and biological degradation. However, these degradation mechanisms are generally eliminated by burial of the membrane in cover systems that are three meters (10 ft) in depth, thus increasing the longevity of the geomembrane (Frobel, 1997).
Because contaminated media are not removed or treated, there is a residual risk of exposure over the long term due to cap disturbance and possible horizontal migration in groundwater. During cap construction, surrounding communities and site workers might be exposed to fugitive dust and gas emissions.
Capping is a mature, well-known technology that is relatively easy to implement (ORNL, 1993). Evaluations of existing capping systems have shown that capping is an effective containment system if properly designed and installed (EPA, 1998). Site-specific conditions such as climate need to be considered in determining an appropriate cap design. Many alternatives are possible, depending on the need for water control at the site. Software programs such as the hydrologic evaluation of landfill performance model have been developed to assist site managers in barrier design and performance (EPA, 1994).
Compacted Fill
Clay
Membrane
Soil Contaminated with Radioactive WasteClean Soil
Surface
Top Soil
VegetativeCover
WaterTable
Exhibit 2-1: Typical Cap for Radioactive Waste
Target Contaminants
Capping can be used to contain all types of waste, including radioactive waste materials found in the soil matrix, debris and radioactively contaminated landfills.
Applicable Site Characteristics
Site conditions such as fluctuations in air temperature, precipitation or subsidence can affect the cap’s integrity by causing cracking, settling or erosion. Biological processes such as intrusion of
23
plant roots and burrowing animals can also affect the cap’s integrity. If a synthetic geomembrane is used in the cap design, it must be protected from ultraviolet radiation (sunlight) by a soil cover. Synthetic geomembranes are not suitable for use in covers for radioactive wastes with higher levels of radiation because of potential degradation (Frobel, 1995). These considerations are particularly important for containing radioactive waste because of the long-term isolation required. In order to promote the cap’s longevity, infiltration barriers should be covered by a soil layer sufficiently thick to extend below the frost line, to accommodate rooting depths of native plants and to extend below the probable depth of animal burrows (ORNL, 1995). If significant subsidence is expected, an interim or temporary cover can be installed before final closure to provide containment. When most of the settlement is done and the underlying waste mass is more stable, a final cover can be provided that will require less post-closure maintenance (EPA, 1993).
Characterization of soils is not as critical for capping as it is for more complex remedial approaches that depend on soil conditions (e.g. stabilization). In dry and porous soils with high radium concentrations, venting might be required to control radon gas migration and buildup below the ground surface. Such venting might violate applicable emission standards unless the radon is collected and treated (EPA, 1995). The impact that groundwater flow could have on contaminant migration at the site should be considered. Capping might not be a feasible alternative at sites with low topography, flooding or a shallow groundwater table; these conditions encourage horizontal migration and decrease the cap’s effectiveness.
Waste Management Issues
Waste management issues are minimal since the contaminated media are not processed or removed. There might be small amounts of waste from decontamination of equipment and from disposable personal protective equipment generated from contact with the surface of the wastes during the initial stages of cap installation (clearing and grubbing, grading and initial emplacement of cover material). Once the initial lifts of cover material are placed, no further contact waste materials would be generated.
Operating Characteristics
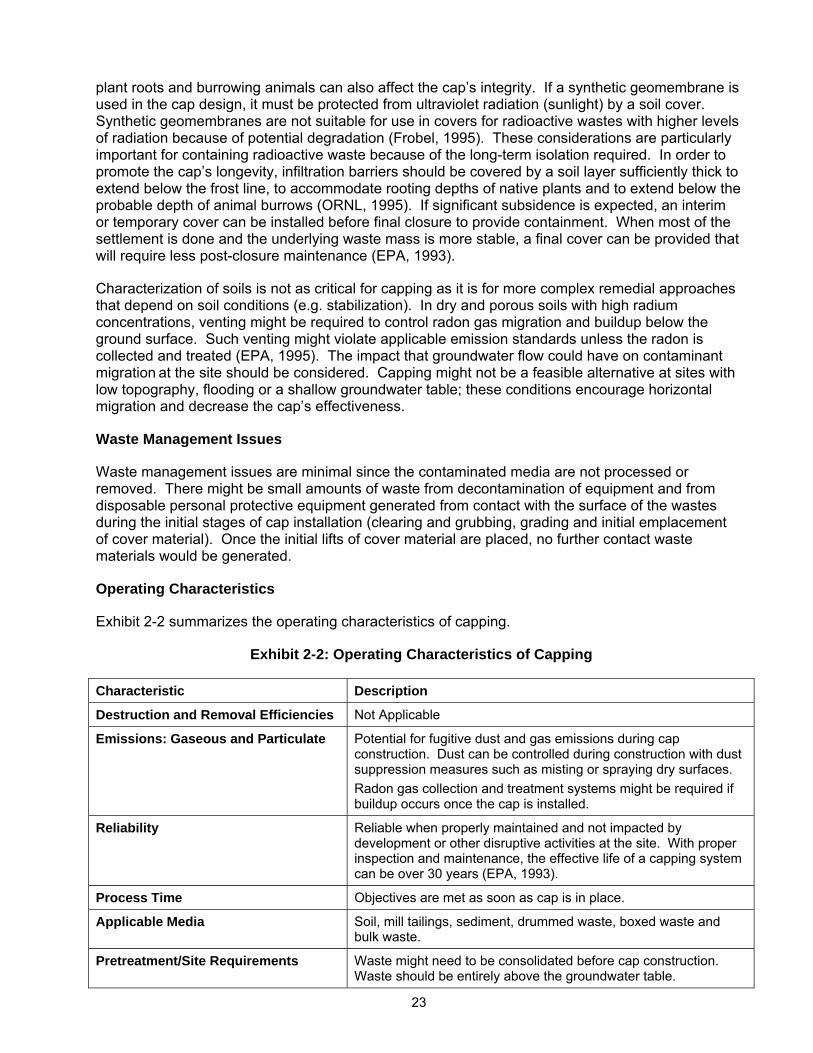
Exhibit 2-2 summarizes the operating characteristics of capping.
Exhibit 2-2: Operating Characteristics of Capping
Characteristic Description
Destruction and Removal Efficiencies Not Applicable
Emissions: Gaseous and Particulate Potential for fugitive dust and gas emissions during cap construction. Dust can be controlled during construction with dust suppression measures such as misting or spraying dry surfaces. Radon gas collection and treatment systems might be required if buildup occurs once the cap is installed.
Reliability Reliable when properly maintained and not impacted by development or other disruptive activities at the site. With proper inspection and maintenance, the effective life of a capping system can be over 30 years (EPA, 1993).
Process Time Objectives are met as soon as cap is in place.
Applicable Media Soil, mill tailings, sediment, drummed waste, boxed waste and bulk waste.
Pretreatment/Site Requirements Waste might need to be consolidated before cap construction. Waste should be entirely above the groundwater table.
24
Exhibit 2-2: Operating Characteristics of Capping
Characteristic Description
Installation Requirements Clay barrier and soil layers need to be compacted to appropriate densities to perform properly. Geomembranes need proper installation and continuously welded seams to perform properly. A good quality assurance program during construction will considerably lessen the need for subsequent cap repairs (EPA, 1993).
Post-treatment Conditions Institutional controls, such as deed, site access and land use restrictions, are usually required. Regular inspections are needed to check cap integrity (erosion, surface slumping, animal burrows) and condition of run-on/run-off controls. Monitoring wells should be installed to monitor performance.
Ability to Monitor Effectiveness Radon gas emissions from the subsurface, cap integrity and the effects of contamination on groundwater can be easily monitored.
Performance Data
It has been shown that capping can control direct contact with contaminated media and decay gases, prevent vertical migration of contamination to the surface and to reduce vertical infiltration of water into waste materials (EPA, 1993; FRTR, 2002).
Once a cap is installed, it can be difficult to monitor or evaluate its performance (EPA, 1993). Monitoring well systems or infiltration monitoring systems can provide some information, but it is often not possible to determine whether the water or leachate originated as surface water or ground water.
An EPA study of 22 capped sites concluded that the performance of the majority of the sites was acceptable or better than acceptable (EPA, 1998). A study by Sandia National Laboratory indicated that the efficiencies of six different cap designs all averaged better than 99.9 percent over a four-year period from 1997 through 2000 (DOE, 2000). Efficiency was measured as: efficiency = (1-(percolation volume/precipitation volume) X 100). The six different designs included the following:
• A conventional RCRA Subtitle C cover consisting of three layers with a total thickness of 1.5 m (5 ft). These layers were a 60 cm (2 ft) thick bottom layer of compacted clay (< 1 X 10⁻⁷ cm/sec) overlain with a 40 mil low density polyethylene geomembrane, a 30 cm (1 ft) thick middle drainage layer of sand (> 1 X 10⁻² cm/sec) overlain with a geotextile filter fabric, and a 60 cm (2ft) thick top layer of uncompacted soil.
• A conventional RCRA Subtitle D cover consisting of two layers with a total thickness of 60 cm (2 ft). These layers were a 45 cm (1.5 ft) thick bottom layer of compacted soil (< 1 X 10⁻⁵ cm/sec) and a 15 cm (6 in) thick top layer of loosely laid topsoil.
• A geosynthetic clay liner cover consisting of three layers with a total thickness of 90 cm (3 ft). From bottom to top, these layers were a thin geosynthetic clay liner (5 X 10⁻⁹ cm/sec) overlain with a 40 mil low density polyethylene geomembrane, a 30 cm (1 ft) thick middle drainage layer of sand (> 1 X 10⁻² cm/sec) overlain with a geotextile filter fabric, and a 60 cm (2 ft) thick top layer of uncompacted soil.
• A capillary barrier cover consisting of four layers with a total thickness of 142 cm (56 in). From bottom to top, these layers were a 30 cm (1 ft) thick uncompacted sand lower drainage layer, a 35 (14 in) cm thick barrier layer of compacted soil, an upper drainage layer of 22 cm (9 in) of
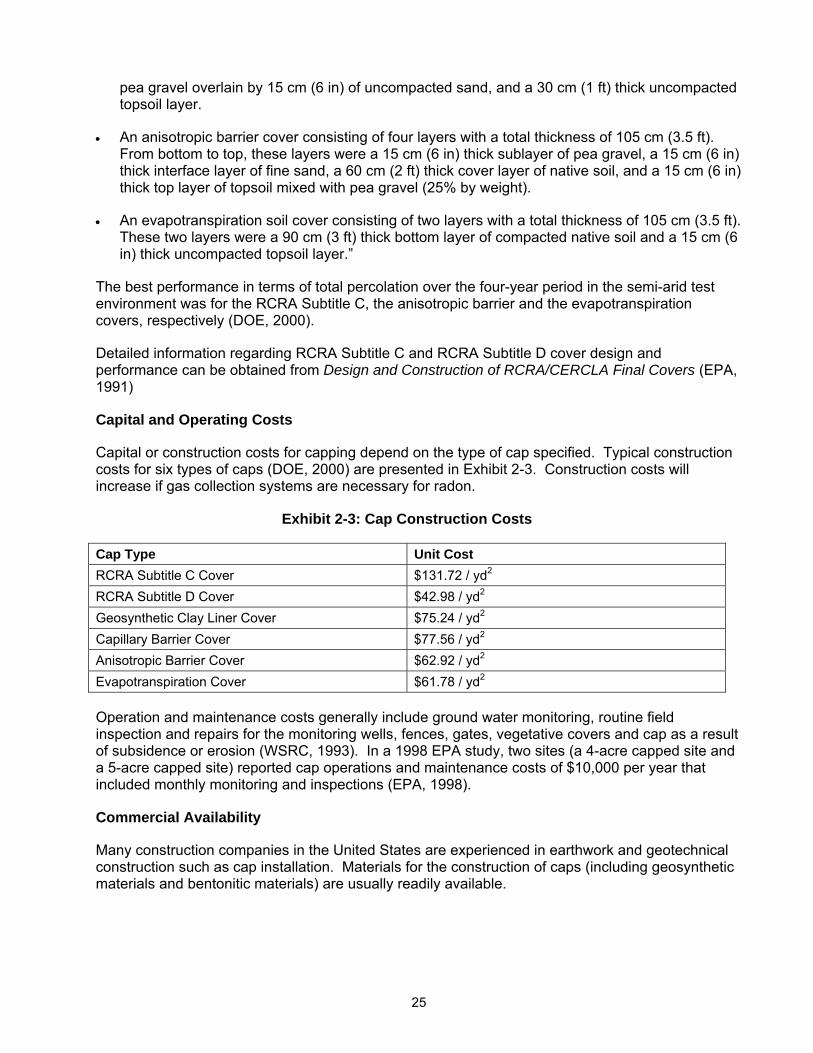
25
pea gravel overlain by 15 cm (6 in) of uncompacted sand, and a 30 cm (1 ft) thick uncompacted topsoil layer.
• An anisotropic barrier cover consisting of four layers with a total thickness of 105 cm (3.5 ft). From bottom to top, these layers were a 15 cm (6 in) thick sublayer of pea gravel, a 15 cm (6 in) thick interface layer of fine sand, a 60 cm (2 ft) thick cover layer of native soil, and a 15 cm (6 in) thick top layer of topsoil mixed with pea gravel (25% by weight).
• An evapotranspiration soil cover consisting of two layers with a total thickness of 105 cm (3.5 ft). These two layers were a 90 cm (3 ft) thick bottom layer of compacted native soil and a 15 cm (6 in) thick uncompacted topsoil layer.”
The best performance in terms of total percolation over the four-year period in the semi-arid test environment was for the RCRA Subtitle C, the anisotropic barrier and the evapotranspiration covers, respectively (DOE, 2000).
Detailed information regarding RCRA Subtitle C and RCRA Subtitle D cover design and performance can be obtained from Design and Construction of RCRA/CERCLA Final Covers (EPA, 1991)
Capital and Operating Costs
Capital or construction costs for capping depend on the type of cap specified. Typical construction costs for six types of caps (DOE, 2000) are presented in Exhibit 2-3. Construction costs will increase if gas collection systems are necessary for radon.
Exhibit 2-3: Cap Construction Costs
Cap Type Unit Cost RCRA Subtitle C Cover $131.72 / yd2 RCRA Subtitle D Cover $42.98 / yd2 Geosynthetic Clay Liner Cover $75.24 / yd2 Capillary Barrier Cover $77.56 / yd2 Anisotropic Barrier Cover $62.92 / yd2 Evapotranspiration Cover $61.78 / yd2
Operation and maintenance costs generally include ground water monitoring, routine field inspection and repairs for the monitoring wells, fences, gates, vegetative covers and cap as a result of subsidence or erosion (WSRC, 1993). In a 1998 EPA study, two sites (a 4-acre capped site and a 5-acre capped site) reported cap operations and maintenance costs of $10,000 per year that included monthly monitoring and inspections (EPA, 1998).
Commercial Availability
Many construction companies in the United States are experienced in earthwork and geotechnical construction such as cap installation. Materials for the construction of caps (including geosynthetic materials and bentonitic materials) are usually readily available.
26
Contact Information
General Contacts:
EPA Office of Superfund Remediation and Technology Innovation
1200 Pennsylvania Avenue, NW Washington, DC 20460 (703) 603-9910
National Risk Management Research Laboratory
David Carson 26 West Martin Luther King Drive Cincinnati, OH 45268 (513) 569-7527 [email protected]
Alternative Landfill Covers:
Sandia National Laboratory Stephen F. Dwyer P.O. Box 5800 Albuquerque, NM 87185 (505) 844-0595 [email protected]
Capping References
Federal Remediation Technologies Roundtable. Remediation Technologies Screening Matrix and Reference Guide, Version 4.0: Landfill Cap, 2002. http://www.frtr.gov/matrix2/section4/4-27.html
Frobel, R. “Geomembranes in Surface Barriers.” Barrier Technologies for Environmental Management: Summary of a Workshop. National Academies Press, Washington, DC. pp. D71-D78, 1995.
Oak Ridge National Laboratory. “Natural, Physical, and Biological Processes Compromise the Long Term Performance of Compacted Soil Caps”. Environmental Restoration Conference, 1995
Oak Ridge National Laboratory. Oak Ridge National Laboratory Technology Logic Diagrams, Volume 2, Part B, Remedial Action, 1993. ORNL/M-2751/V2/Pt.B.
U.S. Department of Energy. Innovative Technology Summary Report: Alternative Landfill Cover, 2000. DOE/EM-0558.
U.S. Environmental Protection Agency. Evaluation of Subsurface Engineered Barriers at Waste Sites, 1998. EPA/542/R-98/005.
U.S. Environmental Protection Agency. Background Information Document for Radiation Site Cleanup Proposed Rule, Revised Draft, 1995.
U.S. Environmental Protection Agency. The Hydrological Evaluation of Landfill Performance (HELP) Model: User’s Guide for Version 3, 1994. EPA/600/R-94/168a.
U.S. Environmental Protection Agency. Engineering Bulletin: Landfill Covers, 1993. EPA/540/S-93/500.
U.S. Environmental Protection Agency. Design and Construction of RCRA/CERCLA Final Covers, 1991. EPA/625/4-91/025.
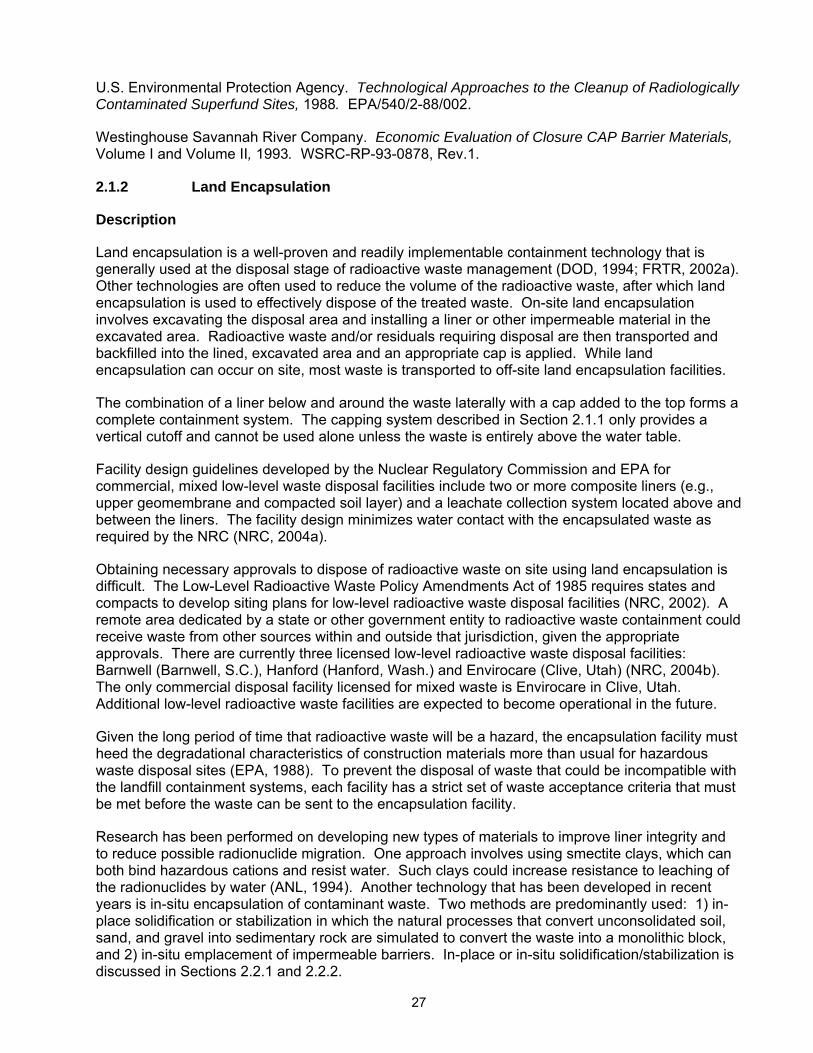
27
U.S. Environmental Protection Agency. Technological Approaches to the Cleanup of Radiologically Contaminated Superfund Sites, 1988. EPA/540/2-88/002.
Westinghouse Savannah River Company. Economic Evaluation of Closure CAP Barrier Materials, Volume I and Volume II, 1993. WSRC-RP-93-0878, Rev.1.
2.1.2 Land Encapsulation
Description
Land encapsulation is a well-proven and readily implementable containment technology that is generally used at the disposal stage of radioactive waste management (DOD, 1994; FRTR, 2002a). Other technologies are often used to reduce the volume of the radioactive waste, after which land encapsulation is used to effectively dispose of the treated waste. On-site land encapsulation involves excavating the disposal area and installing a liner or other impermeable material in the excavated area. Radioactive waste and/or residuals requiring disposal are then transported and backfilled into the lined, excavated area and an appropriate cap is applied. While land encapsulation can occur on site, most waste is transported to off-site land encapsulation facilities.
The combination of a liner below and around the waste laterally with a cap added to the top forms a complete containment system. The capping system described in Section 2.1.1 only provides a vertical cutoff and cannot be used alone unless the waste is entirely above the water table.
Facility design guidelines developed by the Nuclear Regulatory Commission and EPA for commercial, mixed low-level waste disposal facilities include two or more composite liners (e.g., upper geomembrane and compacted soil layer) and a leachate collection system located above and between the liners. The facility design minimizes water contact with the encapsulated waste as required by the NRC (NRC, 2004a).
Obtaining necessary approvals to dispose of radioactive waste on site using land encapsulation is difficult. The Low-Level Radioactive Waste Policy Amendments Act of 1985 requires states and compacts to develop siting plans for low-level radioactive waste disposal facilities (NRC, 2002). A remote area dedicated by a state or other government entity to radioactive waste containment could receive waste from other sources within and outside that jurisdiction, given the appropriate approvals. There are currently three licensed low-level radioactive waste disposal facilities: Barnwell (Barnwell, S.C.), Hanford (Hanford, Wash.) and Envirocare (Clive, Utah) (NRC, 2004b). The only commercial disposal facility licensed for mixed waste is Envirocare in Clive, Utah. Additional low-level radioactive waste facilities are expected to become operational in the future.
Given the long period of time that radioactive waste will be a hazard, the encapsulation facility must heed the degradational characteristics of construction materials more than usual for hazardous waste disposal sites (EPA, 1988). To prevent the disposal of waste that could be incompatible with the landfill containment systems, each facility has a strict set of waste acceptance criteria that must be met before the waste can be sent to the encapsulation facility.
Research has been performed on developing new types of materials to improve liner integrity and to reduce possible radionuclide migration. One approach involves using smectite clays, which can both bind hazardous cations and resist water. Such clays could increase resistance to leaching of the radionuclides by water (ANL, 1994). Another technology that has been developed in recent years is in-situ encapsulation of contaminant waste. Two methods are predominantly used: 1) in-place solidification or stabilization in which the natural processes that convert unconsolidated soil, sand, and gravel into sedimentary rock are simulated to convert the waste into a monolithic block, and 2) in-situ emplacement of impermeable barriers. In-place or in-situ solidification/stabilization is discussed in Sections 2.2.1 and 2.2.2.
28
In-situ emplacement of subsurface impermeable barriers through the use of jet grouting has been successfully demonstrated in a full-scale cold (no radioactive waste) demonstration at the DOE’s Hanford Site in 1995 (Dwyer, 1997) and in a full-scale hot (with radioactive waste) demonstration at DOE’s Brookhaven National Laboratory in 1996 (Heiser and Dwyer, 1997). Another method of in-situ emplacement of subsurface impermeable barriers is being developed using a cable saw device to saw through soils and subsurface materials beneath contaminated waste while grout is pumped into the resulting void space to form a continuous barrier (Carter Technologies, 2002). Additional discussion of in-situ emplacement of impermeable barriers is discussed in Sections 2.1.3 and 2.1.4.
Exhibit 2-4 illustrates the land encapsulation process.
TransportationExcavation Land Encapsulation
Exhibit 2-4: Land Encapsulation
Target Contaminants
Land encapsulation is generally used as a final disposal method. Thus it can be applied to a wide variety of contaminants, including low-level radioactive waste or mixed and commercial wastes (definitions of low-level radioactive waste, mixed waste and high-level waste are provided in Appendix B). Land encapsulation might be appropriate for radionuclides, whether or not they have been extracted from a contaminated medium. Currently, no commercial operating land encapsulation facilities accept high-level waste.
Applicable Site Characteristics
Since there can be considerable public antipathy to this technology, the primary site consideration is location (e.g., proximity to residential areas). Transportation of large volumes of radioactive materials entails certain risks. Safety and licensing and/or regulatory approval considerations are more cumbersome if radionuclides have been concentrated by extraction and separation processes.
Disposal site suitability requirements as described in 10 CFR Part 61, Licensing Requirements for Land Disposal of Radioactive Waste, include avoidance of known natural resources; location above the 100-year floodplain and away from wetlands and coastal areas; minimal upstream drainage areas; sufficiently deep ground water such that no ground water intrusion into the waste occurs; and avoidance of areas with occurrences of faulting, folding, seismic activity, volcanism, erosion, and forms of mass wasting such as surface creep, slumping, or landslides.
29
Waste Management Issues
Waste management considerations for off-site land encapsulation include placement of wastes into appropriate containers for transport and performing required chemical, radiological and geotechnical analyses to provide information to the land encapsulation facility verifying that the waste acceptance criteria are met and to ensure that U.S. Department of Transportation requirements for shipping are met (Envirocare of Utah, 2006a; Envirocare of Utah, 2006b). If wastes are excavated, controls are necessary to minimize or prevent surface runoff from surrounding areas into the excavation (EPA, 1997). Precipitation that collects in the waste excavation will have to be containerized, analyzed and, if necessary, treated and disposed of appropriately. If dewatering of ground water is necessary prior to excavation, pumped water will have to be containerized, analyzed and, if necessary, treated and disposed of appropriately. Containerized waste might have to be stored in an appropriately posted and fenced area while awaiting approval from the land encapsulation facility for shipping to proceed. Encapsulation facility waste acceptance requirements can also necessitate additional treatment prior to shipping to the facility or upon receipt at the facility.
Operating Characteristics
Exhibit 2-5 summarizes the operating characteristics of land encapsulation.
Exhibit 2-5: Operating Characteristics of Land Encapsulation
Characteristic Description
Destruction and Removal Efficiencies Not applicable
Emissions: Gaseous and Particulate Potential for gas and dust emissions from construction of the land encapsulation facility, excavation of the waste, and (for off-site) transportation of waste material. Dust can be controlled during construction with dust suppression measures such as misting or spraying dry surfaces.
Reliability Highly certain for 100-1,000 years (EPA, 1990). Design and mitigation procedures can improve reliability.
Process Time "Process time" can include the time devoted to either excavation/transportation of the material or construction time for a new land encapsulation facility. Once material reaches the facility, the process is complete.
Applicable Media Soil, landfill leachates, sediments, bulk waste
Pretreatment/Site Requirements The waste must first be excavated before being transported to an off-site encapsulation facility or must be excavated and securely stockpiled while an in-situ facility is constructed. Other technologies might be applied to the waste prior to land encapsulation. A new land encapsulation facility will require licensing and/or regulatory approvals.
Disposal Needs and Options For off-site land encapsulation, generally dependent on currently licensed operating disposal facilities. Will need to meet facility waste acceptance criteria (see “Waste Management Issues”). Siting of a new disposal facility must comply with applicable regulations.
Post-treatment Conditions Regulatory compliance procedures apply (i.e., monitoring and mitigation).
30
Exhibit 2-5: Operating Characteristics of Land Encapsulation
Characteristic Description
Ability to Monitor Effectiveness Effectiveness of the encapsulation can be monitored by leachate collection systems and groundwater monitoring wells.
Performance Data
Land encapsulation is designed to be a long-term solution to waste disposal. However, since land encapsulation does not reduce the volume or radioactivity of the contaminants, design features such as liner integrity, monitoring and mitigation procedures are necessary to ensure effectiveness. Proximity to residential areas, site characteristics and land management plans all play a critical role in the continued effectiveness of a land encapsulation facility. NRC licensing requirements for low-level radioactive waste facilities (10CFR Part 61, Licensing Requirements for Land Disposal of Radioactive Waste) require designs that incorporate deep disposal and/or engineered barriers that will prevent exposures to unacceptable levels of radiation for at least 500 years.
For excavation, the rate depends on a number of factors, including the number of trucks and loaders operating. The excavation of 20,000 tons of contaminated soil would typically require about two months (FRTR, 2002a).
The performance of the encapsulation facility can be monitored with leachate collection systems and ground water monitoring wells.
Capital and Operating Costs
Costs for waste excavation and transport/disposal to an existing land encapsulation facility from a site in California were reported as $100/yd3 ($131/m3) and $1,600/ton, respectively (LANL, 1996). Rates in 2006 for low-level (Class A) waste disposal at the Barnwell Facility in South Carolina were $276/ft3 ($9,745/m3) for Atlantic Compact member states and approximately $650/ft3 ($23,000/ m3)
for non-Atlantic Compact waste (South Carolina Energy Office, 2004). Transportation costs for shipping the waste to the facility would be additional.
For the Pit 6 Landfill Operable Unit at the Lawrence Livermore National Laboratory Site 300, the operations and maintenance cost for a 2.4 acre landfill for 30 years is projected as $1,612,000 (present-worth dollars), or an average of $53,733/year, which includes inspections, surveys, maintenance, repairs, ground water monitoring and reporting (DOE, 1997; FRTR, 2002b).
Commercial Availability
Three commercially available low-level radioactive waste disposal sites are currently in operation (see “Description” above). Additional low-level radioactive waste disposal sites are in operation at some DOE sites such as the Nevada Test Site, Los Alamos National Laboratory, Oak Ridge National Laboratory, and the Idaho National Environmental and Engineering Laboratory, but they are restricted to receiving low-level radioactive wastes from DOE and other U.S. government sites.
It is expected that additional commercially available sites (such as additional state compact sites) will be licensed in the future. Many construction companies in the United States are experienced in the excavation and transport of low-level radioactive waste materials to land encapsulation facilities.
In-situ emplacement of subsurface impermeable barriers through the use of jet grouting to achieve land encapsulation is commercially available through some of the larger grouting contractors in the United States (see “Contact Information” in Section 2.1.4, Vertical Barriers).
31
Contact Information
Low-Level Radioactive Waste Disposal General Contacts:
Environmental Protection Agency U.S. EPA Office of Air and Radiation Radiation Protection Division 1200 Pennsylvania Avenue, NW (MC 6608J) Washington, DC 20460 (202) 343-9600
Nuclear Regulatory Commission Washington, D.C. 20555-0001 (301) 415-7000
Land Encapsulation via the in-situ emplacement of subsurface impermeable barriers:
Brookhaven National Laboratory John Heiser Environmental & Waste Technology Center P.O. Box 5000 Upton, NY 11973 (516) 344-4405 [email protected]
Sandia National Laboratory Brian Dwyer P.O. Box 5800 Albuquerque, NM 87185 (505) 845-9894 [email protected]
Low-Level Waste Disposal Sites:
Barnwell Disposal Facility Chem-Nuclear Systems LLC 740 Osborn Road Barnwell, SC 29812 (803) 259-1781 http://www.chemnuclear.com
Envirocare Facility Envirocare of Utah Inc. 605 North 5600 West Salt Lake City, UT 84116 (801) 532-1330 http://www.envirocareutah.com
Richland Disposal Site U.S. Ecology Inc. 1777 Terminal Drive Richland, WA 99352 (509) 377-2411 http://www.americanecology.com/locations/richland/INDEX.asp
32
Land Encapsulation References
Argonne National Laboratory. Encapsulation of Hazardous Ions in Smectite Clays. Project Description, 1994.
Carter Technologies Company. Final Technical Report: EarthSawTM In-Situ Containment of Pits and Trenches. Report to the DOE National Energy Technology Laboratory, Morgantown, W.Va., 2002. Contract DE-AC26-01NT41144.
Dwyer, B. Demonstration of Close-Coupled Barriers for Subsurface Containment of Buried Waste. Sandia National Laboratory, Albuquerque, N.M., 1997. SAND97-1193.
Envirocare of Utah Inc. Containerized Waste Facility, Waste Acceptance Criteria, Revision 6, 2006a. http://www.energysolutions.com/pdf/CWF_WAC_R6.pdf
Envirocare of Utah Inc. Bulk Waste Disposal and Treatment Facilities, Waste Acceptance Criteria, Revision 6, 2006b. http://www.energysolutions.com/pdf/CWF_WAC_R6.pdf
Federal Remediation Technologies Roundtable. Remediation Technologies Screening Matrix and Reference Guide, Version 4.0: Excavation, Retrieval, and Off-Site, 2002a. http://www.frtr.gov/matrix2/section4/4-29.html
Federal Remediation Technologies Roundtable. Technology Cost and Performance, Cap at DOE’s Lawrence Livermore National Laboratory, Site 300, Pit 6 Landfill OU (1998), 2004b. http://costperformance.org/profile.cfm?ID=131&CaseID=131
Heiser, J. and Dwyer, B. Summary Report on Close-Coupled Subsurface Barrier Technology, Initial Field Trials to Full-Scale Demonstration. Brookhaven National Laboratory, Upton, N.Y., 1997. BNL-52531.
Los Alamos National Laboratory. A Compendium of Cost Data for Environmental Remediation Technologies, Second Edition, 1996. LA-UR-96-2205. http://www.lanl.gov/orgs/d/d4/enviro/etcap/
South Carolina Energy Office. Radioactive Waste Disposal Program, 2004. http://www.energy.sc.gov/RadWaste/rwdp_index.htm
U.S. Department of Defense, Environmental Technology Transfer Committee. Remediation Technologies Screening Matrix and Reference Guide, Second Edition, 1994.
U.S. Department of Energy. Cost and Performance Report, Pit 6 Landfill Operable Unit, Lawrence Livermore National Laboratory Site 300, 1997. UCRL-AR-128480.
U.S. Environmental Protection Agency. Best Management Practices (BMPs) for Soil Treatment Technologies: Suggested Operational Guidelines to Prevent Cross-media Transfer of Contaminants during Clean-Up Activities, 1997. EPA/530/R-97/007.
U.S. Environmental Protection Agency. Assessment of Technologies for the Remediation of Radioactively Contaminated Superfund Sites, 1990. EPA/540/2-90/001.
U.S. Environmental Protection Agency. Technological Approaches to the Cleanup of Radiologically Contaminated Superfund Sites, 1988. EPA/540/2-88/002.
U.S. Nuclear Regulatory Commission. 10CFR 61.51 – Disposal Site Design for Land Disposal. U.S Government Printing Office, Washington, DC, 2004a.
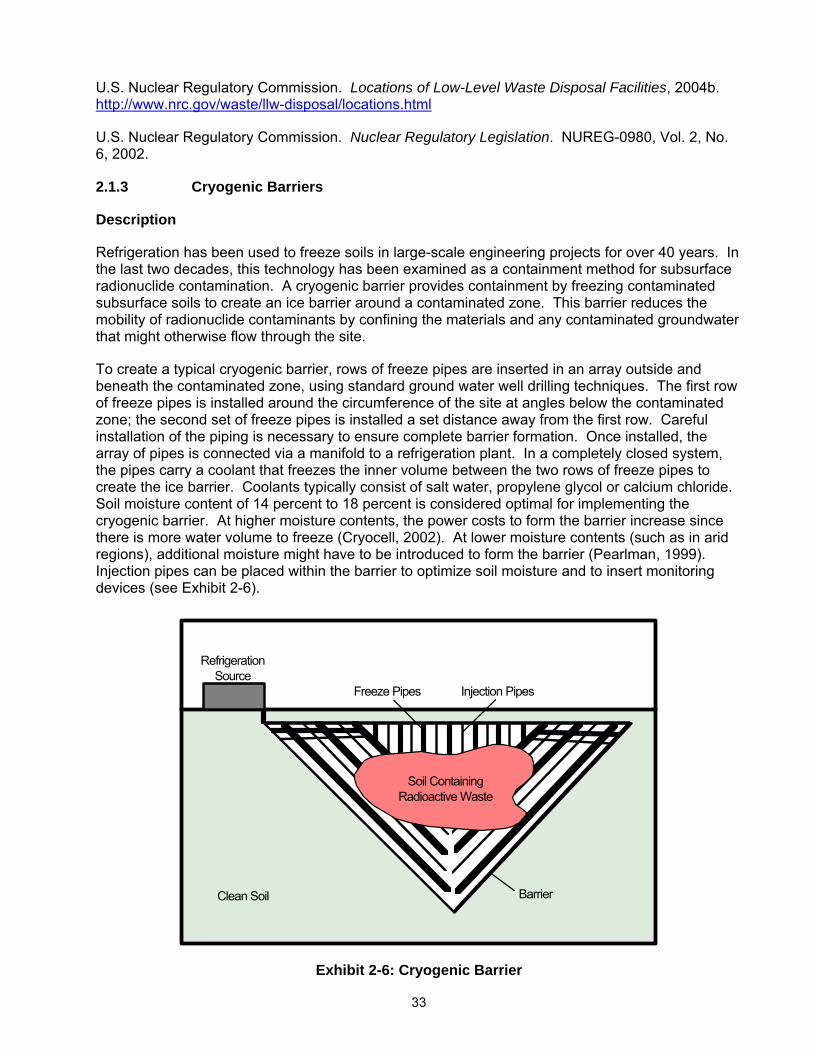
33
U.S. Nuclear Regulatory Commission. Locations of Low-Level Waste Disposal Facilities, 2004b. http://www.nrc.gov/waste/llw-disposal/locations.html
U.S. Nuclear Regulatory Commission. Nuclear Regulatory Legislation. NUREG-0980, Vol. 2, No. 6, 2002.
2.1.3 Cryogenic Barriers
Description
Refrigeration has been used to freeze soils in large-scale engineering projects for over 40 years. In the last two decades, this technology has been examined as a containment method for subsurface radionuclide contamination. A cryogenic barrier provides containment by freezing contaminated subsurface soils to create an ice barrier around a contaminated zone. This barrier reduces the mobility of radionuclide contaminants by confining the materials and any contaminated groundwater that might otherwise flow through the site.
To create a typical cryogenic barrier, rows of freeze pipes are inserted in an array outside and beneath the contaminated zone, using standard ground water well drilling techniques. The first row of freeze pipes is installed around the circumference of the site at angles below the contaminated zone; the second set of freeze pipes is installed a set distance away from the first row. Careful installation of the piping is necessary to ensure complete barrier formation. Once installed, the array of pipes is connected via a manifold to a refrigeration plant. In a completely closed system, the pipes carry a coolant that freezes the inner volume between the two rows of freeze pipes to create the ice barrier. Coolants typically consist of salt water, propylene glycol or calcium chloride. Soil moisture content of 14 percent to 18 percent is considered optimal for implementing the cryogenic barrier. At higher moisture contents, the power costs to form the barrier increase since there is more water volume to freeze (Cryocell, 2002). At lower moisture contents (such as in arid regions), additional moisture might have to be introduced to form the barrier (Pearlman, 1999). Injection pipes can be placed within the barrier to optimize soil moisture and to insert monitoring devices (see Exhibit 2-6).
Refrigeration����� �����
Source�����
Injection Pipes�����Freeze Pipes�����
�����
Barrier�����
Soil Containing����� �����
Radioactive Waste�����
Clean Soil��
Exhibit 2-6: Cryogenic Barrier
34
A full-scale field test (cold test) of a cryogenic barrier was performed near Oak Ridge, Tenn. in 1994 (DOE, 1995). From 1997 to 1998, a full-scale demonstration, which included extensive field monitoring, was conducted at a radionuclide-contaminated site at Oak Ridge National Laboratory (DOE, 1999; Arctic Foundations Inc., 2000).
Cryogenic barriers can be positioned to depths of several thousand feet and do not require excavation for installation (ORNL, 1993a; Arctic Foundations Inc., 2000). Barrier thickness, ranging from 15 to 50 feet (4.5 to 15 m), and temperature can vary to suit site conditions. Ongoing refrigeration is required to maintain cryogenic barriers; heat generated from high-level radioactive waste can increase the electrical power needs (Fremond, 1994; Cryocell, 2002). With adequate refrigeration, the ice does not degrade or weaken over time and is repairable in-situ. If ground movement fractures the barrier, the cracks will self-heal through refreezing of ground water entering the cracks (Sayles and Iskandar, 1995). If there is insufficient ground water or soil moisture present, the fissures can be repaired by injecting water into the leakage area (EPA, 2003). After reaching full design thickness, testing as part of a DOE full demonstration has shown that a cryogenic barrier can withstand power outages of up to one week in duration without any loss of integrity (DOE, 1999).
Cryogenic barriers are considered a good application for the containment of short-lived radionuclides such as tritium (Pearlman, 1999) and might be applicable to sites that need a containment technique that will not generate a secondary waste during installation and operation (DOE, 1996). It is best suited for non-arid conditions where there is sufficient moisture in the soil to produce a good barrier since injection of liquids to allow freezing could be counter productive towards the overall objective of maintaining containment of contaminants (IAEA, 1997). Cryogenic barriers have also been considered as a possible response action to mitigate and control subsurface radioactive waste spills (e.g., tank leaks) at the DOE’s Savannah River Site (WSRC, 1995).
Target Contaminants
Cryogenic barriers provide subsurface containment for a wide variety of waste in soil and groundwater, including radionuclides, metals and organics. While cryogenic barriers are used for radionuclides in soluble form, the solubility of the radionuclides depends on site-specific conditions such as pH and other chemicals present.
Because containment by other barrier methods such as grout curtains and slurry walls becomes more cost effective after eight or nine years of operation, cryogenic barriers might be more applicable to containment of short-lived radionuclides such as tritium (DOE, 1999; Pearlman, 1999).
Applicable Site Characteristics
Design criteria for cryogenic barriers are site-specific and depend on waste type, site topography, soil conditions, thermal conductivity and groundwater movement. Cryogenic barriers are adaptable to almost any site geometry; however drilling technologies might present a constraint (EPA, 2003). Power is required for the refrigeration plant to freeze the soil; remote sites might require electrical power and utility installation (ORNL, 1993b). Heat from high-level radioactive waste can increase electrical power needs for maintaining frozen barriers.
The proximity of engineered structures such as roads, foundations, piping and tanks should be taken into account since high frost heave pressures (and subsequent settling when the barrier thaws) can develop if precautions are not taken (DOE, 1999; Sayles and Iskandar, 1995).
For installation in saturated zones, ground water velocity must be less than one meter (3 ft) per day, otherwise the freezing soil columns might not merge to form a continuous barrier (Sayles and
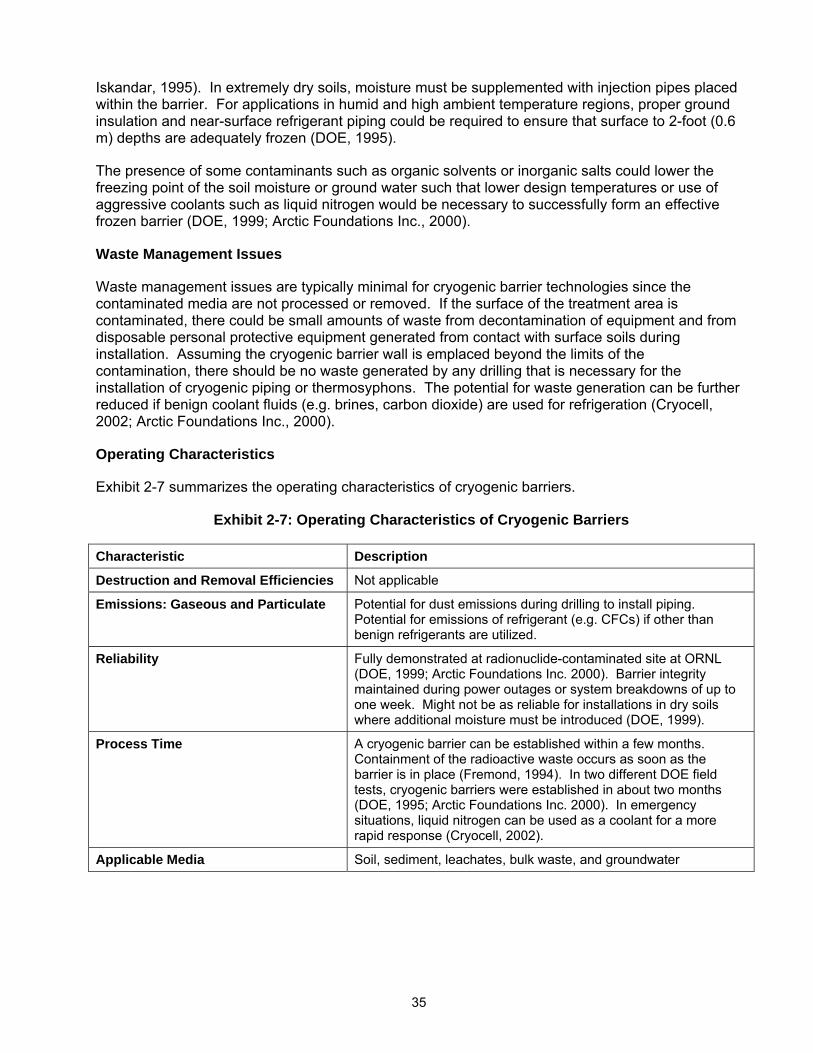
35
Iskandar, 1995). In extremely dry soils, moisture must be supplemented with injection pipes placed within the barrier. For applications in humid and high ambient temperature regions, proper ground insulation and near-surface refrigerant piping could be required to ensure that surface to 2-foot (0.6 m) depths are adequately frozen (DOE, 1995).
The presence of some contaminants such as organic solvents or inorganic salts could lower the freezing point of the soil moisture or ground water such that lower design temperatures or use of aggressive coolants such as liquid nitrogen would be necessary to successfully form an effective frozen barrier (DOE, 1999; Arctic Foundations Inc., 2000).
Waste Management Issues
Waste management issues are typically minimal for cryogenic barrier technologies since the contaminated media are not processed or removed. If the surface of the treatment area is contaminated, there could be small amounts of waste from decontamination of equipment and from disposable personal protective equipment generated from contact with surface soils during installation. Assuming the cryogenic barrier wall is emplaced beyond the limits of the contamination, there should be no waste generated by any drilling that is necessary for the installation of cryogenic piping or thermosyphons. The potential for waste generation can be further reduced if benign coolant fluids (e.g. brines, carbon dioxide) are used for refrigeration (Cryocell, 2002; Arctic Foundations Inc., 2000).
Operating Characteristics
Exhibit 2-7 summarizes the operating characteristics of cryogenic barriers.
Exhibit 2-7: Operating Characteristics of Cryogenic Barriers
Characteristic Description
Destruction and Removal Efficiencies Not applicable
Emissions: Gaseous and Particulate Potential for dust emissions during drilling to install piping. Potential for emissions of refrigerant (e.g. CFCs) if other than benign refrigerants are utilized.
Reliability Fully demonstrated at radionuclide-contaminated site at ORNL (DOE, 1999; Arctic Foundations Inc. 2000). Barrier integrity maintained during power outages or system breakdowns of up to one week. Might not be as reliable for installations in dry soils where additional moisture must be introduced (DOE, 1999).
Process Time A cryogenic barrier can be established within a few months. Containment of the radioactive waste occurs as soon as the barrier is in place (Fremond, 1994). In two different DOE field tests, cryogenic barriers were established in about two months (DOE, 1995; Arctic Foundations Inc. 2000). In emergency situations, liquid nitrogen can be used as a coolant for a more rapid response (Cryocell, 2002).
Applicable Media Soil, sediment, leachates, bulk waste, and groundwater
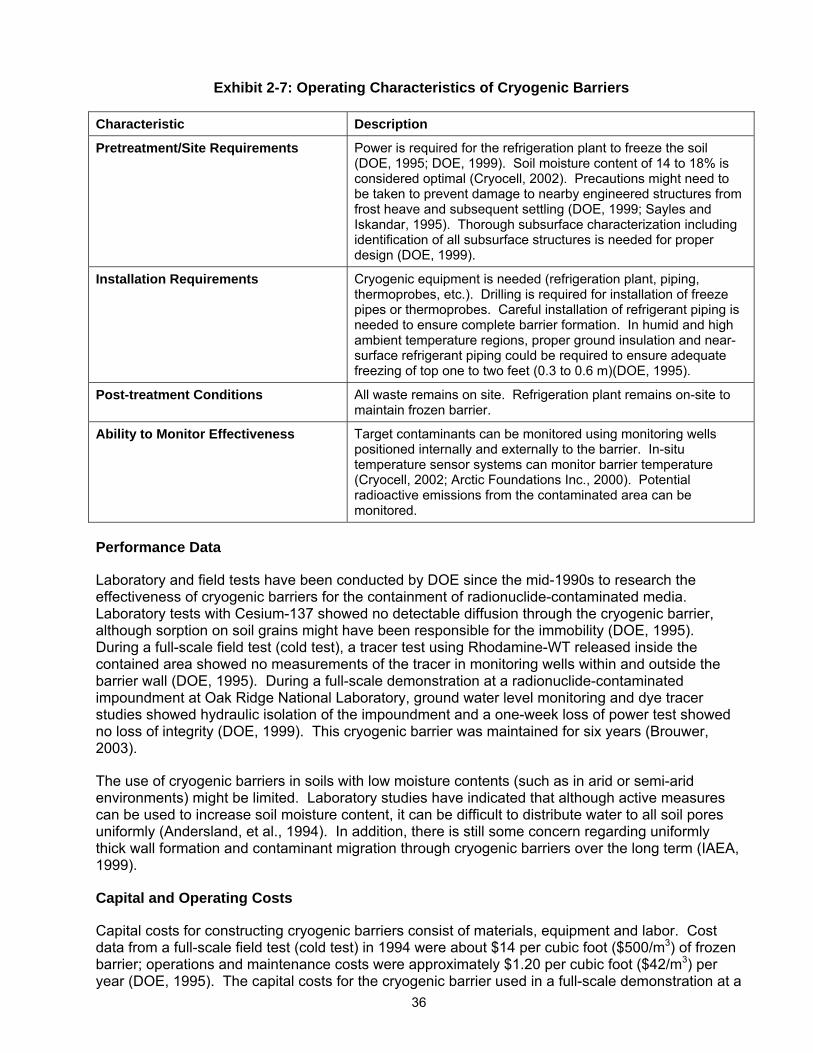
36
Exhibit 2-7: Operating Characteristics of Cryogenic Barriers
Characteristic Description
Pretreatment/Site Requirements Power is required for the refrigeration plant to freeze the soil (DOE, 1995; DOE, 1999). Soil moisture content of 14 to 18% is considered optimal (Cryocell, 2002). Precautions might need to be taken to prevent damage to nearby engineered structures from frost heave and subsequent settling (DOE, 1999; Sayles and Iskandar, 1995). Thorough subsurface characterization including identification of all subsurface structures is needed for proper design (DOE, 1999).
Installation Requirements Cryogenic equipment is needed (refrigeration plant, piping, thermoprobes, etc.). Drilling is required for installation of freeze pipes or thermoprobes. Careful installation of refrigerant piping is needed to ensure complete barrier formation. In humid and high ambient temperature regions, proper ground insulation and near-surface refrigerant piping could be required to ensure adequate freezing of top one to two feet (0.3 to 0.6 m)(DOE, 1995).
Post-treatment Conditions All waste remains on site. Refrigeration plant remains on-site to maintain frozen barrier.
Ability to Monitor Effectiveness Target contaminants can be monitored using monitoring wells positioned internally and externally to the barrier. In-situ temperature sensor systems can monitor barrier temperature (Cryocell, 2002; Arctic Foundations Inc., 2000). Potential radioactive emissions from the contaminated area can be monitored.
Performance Data
Laboratory and field tests have been conducted by DOE since the mid-1990s to research the effectiveness of cryogenic barriers for the containment of radionuclide-contaminated media. Laboratory tests with Cesium-137 showed no detectable diffusion through the cryogenic barrier, although sorption on soil grains might have been responsible for the immobility (DOE, 1995). During a full-scale field test (cold test), a tracer test using Rhodamine-WT released inside the contained area showed no measurements of the tracer in monitoring wells within and outside the barrier wall (DOE, 1995). During a full-scale demonstration at a radionuclide-contaminated impoundment at Oak Ridge National Laboratory, ground water level monitoring and dye tracer studies showed hydraulic isolation of the impoundment and a one-week loss of power test showed no loss of integrity (DOE, 1999). This cryogenic barrier was maintained for six years (Brouwer, 2003).
The use of cryogenic barriers in soils with low moisture contents (such as in arid or semi-arid environments) might be limited. Laboratory studies have indicated that although active measures can be used to increase soil moisture content, it can be difficult to distribute water to all soil pores uniformly (Andersland, et al., 1994). In addition, there is still some concern regarding uniformly thick wall formation and contaminant migration through cryogenic barriers over the long term (IAEA, 1999).
Capital and Operating Costs
Capital costs for constructing cryogenic barriers consist of materials, equipment and labor. Cost data from a full-scale field test (cold test) in 1994 were about $14 per cubic foot ($500/m3) of frozen barrier; operations and maintenance costs were approximately $1.20 per cubic foot ($42/m3) per year (DOE, 1995). The capital costs for the cryogenic barrier used in a full-scale demonstration at a
37
radionuclide-contaminated site from 1997 to 1998 were $16.75 per cubic foot ($591/m3)of frozen barrier; operations and maintenance costs were estimated as $0.20 per cubic foot ($7/m3) per year (DOE, 1999). Estimates were made from the results of this demonstration of the total 5-year capital and operations cost for a similarly sized site (180,000 cubic feet or 5,100 m3) with radionuclide contamination and for the total 10-year capital and operations cost for a second site with five times the volume. The estimated total cost for Case 1 was $8.50 per cubic foot ($300/m3) while the estimated total cost for Case 2 was $9.30 per cubic foot ($328/m3) (EPA, 2004).
Factors that could impact operating costs include contaminant containment and threat to the surrounding environment, contaminant types, coolants and site logistical considerations. The use of aggressive coolants such as liquid nitrogen to form cryogenic barriers when dealing with lower freezing points because of the presence of contaminants such as organic solvents or inorganic salts or when rapid response is necessary for emergency situations can increase capital and operations and maintenance costs (DOE, 1995; DOE, 1999). Heat from high-level radioactive waste could increase electrical power needs and maintenance costs.
Commercial Availability
The cryogenic barriers that have been tested and demonstrated through the EPA SITE and DOE Innovative Technology programs are offered by two vendors: RKK-Soilfreeze Technologies LLC (CRYOCELL®) and Arctic Foundations Inc.
Contact Information
General Contacts:
EPA National Risk Management Research Laboratory
Steven Rock EPA Project Manager 26 West Martin Luther King Drive Cincinnati, OH 45268 (513) 569-7149 [email protected]
DOE Oak Ridge Operations Office Elizabeth Phillips Principal Investigator P.O. Box 2001, EW-923 Oak Ridge, TN 37830 (865) 241-6172 [email protected]
Vendors:
RKK-Soilfreeze Technologies LLC (CRYOCELL®)
8410 154th Avenue NE Redmond, WA 98052 (425) 861-6010 [email protected]
Arctic Foundations Inc. 5621 Arctic Blvd. Anchorage, AK 99518-1667 (907) 562-2741 [email protected]
38
Cryogenic Barrier References
Andersland, O., Davies, S., and Wiggert, D. Performance and Formation of Cryogenic Containment Barriers in Dry Soils. Submitted to RUST Geotech, DOE Grand Junction Office, Colorado, 1994.
Arctic Foundations Inc. Cryogenic Barrier Demonstration Project, Final Report, March 2000. DOE Office of Scientific and Technical Information ID No. 760626.
Brouwer, G. Environmental Engineering: DOE to Extract Icy Nuclear Barrier. Civil Engineering, June 2003. Vol. 73, No. 6, p. 20.
Cryocell. Cryocell Frozen Soil Barriers: Questions and Answers. Vendor Information, 2002. http://www.cryocell.com/ccell.html
Fremond, M. “Ground Freezing 94.” Proceedings of the Seventh International Symposium on Ground Freezing, Nancy, France, 1994.
International Atomic Energy Agency. Technical Options for the Remediation of Contaminated Groundwater, 1999. IAEA-TECDOC-1088.
International Atomic Energy Agency. Technologies for In-Situ Immobilization and Isolation of Radioactive Wastes at Disposal and Contaminated Sites, 1997. IAEA-TECDOC-972.
Oak Ridge National Laboratory. Oak Ridge National Laboratory Technology Logic Diagrams, Volume 3, Technology Evaluation Data Sheets, Part B, Dismantlement - Remedial Action, 1993a. ORNL/M-2751/V3/Pt.B.
Oak Ridge National Laboratory. Oak Ridge National Laboratory Technology Logic Diagrams, Volume 2, Part B, Remedial Action, 1993b. ORNL/M-2751/V2/Pt.B.
Pearlman, L. Subsurface Containment and Monitoring Systems: Barriers and Beyond (Overview Report). Prepared for U.S. EPA, Office of Solid Waste and Emergency Response, Technology Innovation Office, 1999. http://www.clu-in.org
Sayles, F. and Iskandar, I. “Ground Freezing for Containment of Hazardous Waste.” Presented at International Containment Technology Workshop, Baltimore, Md., 1995. DOE/OR /22141-T3.
U.S. Department of Energy. Innovative Technology Summary Report: Frozen Soil Barrier, 1999. DOE/EM-0483.
U.S. Department of Energy. Subsurface Contaminants Focus Area: Technology Summary, August 1996. DOE/EM-0296.
U.S. Department of Energy. Innovative Technology Summary Report: Frozen Soil Barrier Technology, 1995. DOE/EM-0273.
U.S. Environmental Protection Agency. SITE Technology Capsule: Artic Foundations Inc., Freeze Barrier System, 2004. EPA/540/R-03/508a.
U.S. Environmental Protection Agency. Superfund Innovative Technology Evaluation Program: Technology Profiles, Eleventh Edition, Volume 1, Demonstration Program, 2003. EPA/540/R-03/501.
Westinghouse Savannah River Company. Contingency Plan for Large Radioactive Spills from SRS Tank Farms, Rev. 1, 1995.
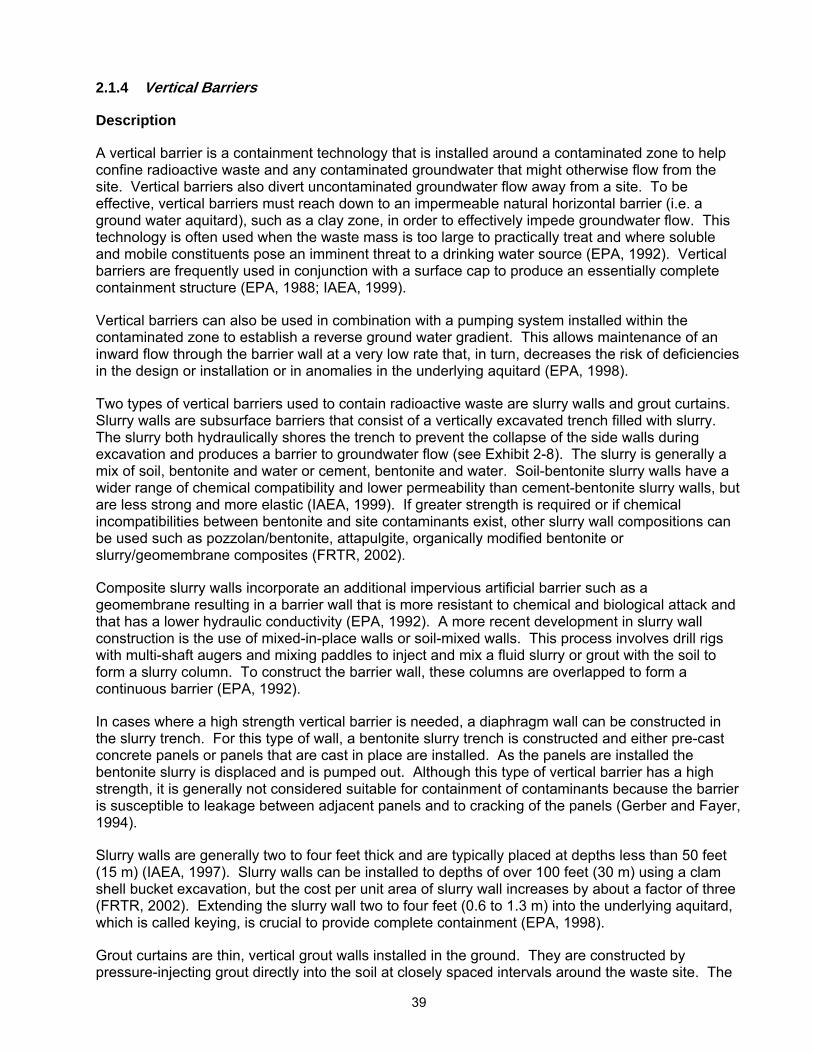
39
2.1.4 Vertical Barriers
Description
A vertical barrier is a containment technology that is installed around a contaminated zone to help confine radioactive waste and any contaminated groundwater that might otherwise flow from the site. Vertical barriers also divert uncontaminated groundwater flow away from a site. To be effective, vertical barriers must reach down to an impermeable natural horizontal barrier (i.e. a ground water aquitard), such as a clay zone, in order to effectively impede groundwater flow. This technology is often used when the waste mass is too large to practically treat and where soluble and mobile constituents pose an imminent threat to a drinking water source (EPA, 1992). Vertical barriers are frequently used in conjunction with a surface cap to produce an essentially complete containment structure (EPA, 1988; IAEA, 1999).
Vertical barriers can also be used in combination with a pumping system installed within the contaminated zone to establish a reverse ground water gradient. This allows maintenance of an inward flow through the barrier wall at a very low rate that, in turn, decreases the risk of deficiencies in the design or installation or in anomalies in the underlying aquitard (EPA, 1998).
Two types of vertical barriers used to contain radioactive waste are slurry walls and grout curtains. Slurry walls are subsurface barriers that consist of a vertically excavated trench filled with slurry. The slurry both hydraulically shores the trench to prevent the collapse of the side walls during excavation and produces a barrier to groundwater flow (see Exhibit 2-8). The slurry is generally a mix of soil, bentonite and water or cement, bentonite and water. Soil-bentonite slurry walls have a wider range of chemical compatibility and lower permeability than cement-bentonite slurry walls, but are less strong and more elastic (IAEA, 1999). If greater strength is required or if chemical incompatibilities between bentonite and site contaminants exist, other slurry wall compositions can be used such as pozzolan/bentonite, attapulgite, organically modified bentonite or slurry/geomembrane composites (FRTR, 2002).
Composite slurry walls incorporate an additional impervious artificial barrier such as a geomembrane resulting in a barrier wall that is more resistant to chemical and biological attack and that has a lower hydraulic conductivity (EPA, 1992). A more recent development in slurry wall construction is the use of mixed-in-place walls or soil-mixed walls. This process involves drill rigs with multi-shaft augers and mixing paddles to inject and mix a fluid slurry or grout with the soil to form a slurry column. To construct the barrier wall, these columns are overlapped to form a continuous barrier (EPA, 1992).
In cases where a high strength vertical barrier is needed, a diaphragm wall can be constructed in the slurry trench. For this type of wall, a bentonite slurry trench is constructed and either pre-cast concrete panels or panels that are cast in place are installed. As the panels are installed the bentonite slurry is displaced and is pumped out. Although this type of vertical barrier has a high strength, it is generally not considered suitable for containment of contaminants because the barrier is susceptible to leakage between adjacent panels and to cracking of the panels (Gerber and Fayer, 1994).
Slurry walls are generally two to four feet thick and are typically placed at depths less than 50 feet (15 m) (IAEA, 1997). Slurry walls can be installed to depths of over 100 feet (30 m) using a clam shell bucket excavation, but the cost per unit area of slurry wall increases by about a factor of three (FRTR, 2002). Extending the slurry wall two to four feet (0.6 to 1.3 m) into the underlying aquitard, which is called keying, is crucial to provide complete containment (EPA, 1998).
Grout curtains are thin, vertical grout walls installed in the ground. They are constructed by pressure-injecting grout directly into the soil at closely spaced intervals around the waste site. The
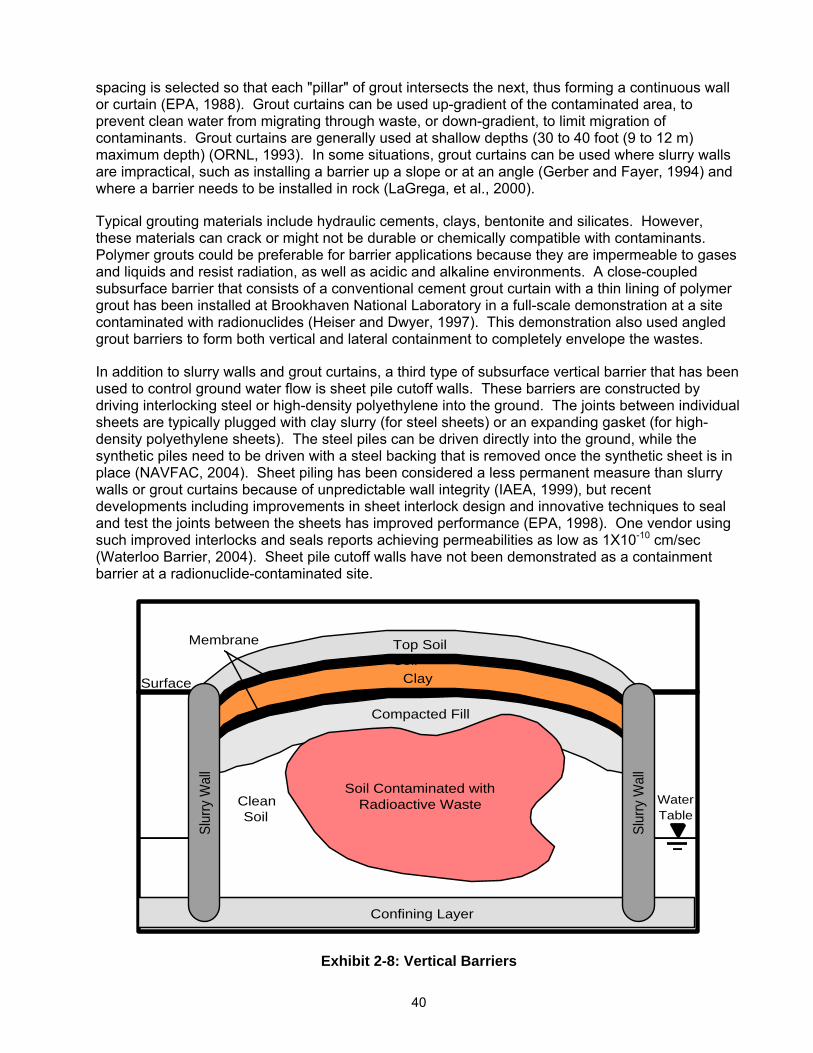
40
spacing is selected so that each "pillar" of grout intersects the next, thus forming a continuous wall or curtain (EPA, 1988). Grout curtains can be used up-gradient of the contaminated area, to prevent clean water from migrating through waste, or down-gradient, to limit migration of contaminants. Grout curtains are generally used at shallow depths (30 to 40 foot (9 to 12 m) maximum depth) (ORNL, 1993). In some situations, grout curtains can be used where slurry walls are impractical, such as installing a barrier up a slope or at an angle (Gerber and Fayer, 1994) and where a barrier needs to be installed in rock (LaGrega, et al., 2000).
Typical grouting materials include hydraulic cements, clays, bentonite and silicates. However, these materials can crack or might not be durable or chemically compatible with contaminants. Polymer grouts could be preferable for barrier applications because they are impermeable to gases and liquids and resist radiation, as well as acidic and alkaline environments. A close-coupled subsurface barrier that consists of a conventional cement grout curtain with a thin lining of polymer grout has been installed at Brookhaven National Laboratory in a full-scale demonstration at a site contaminated with radionuclides (Heiser and Dwyer, 1997). This demonstration also used angled grout barriers to form both vertical and lateral containment to completely envelope the wastes.
In addition to slurry walls and grout curtains, a third type of subsurface vertical barrier that has been used to control ground water flow is sheet pile cutoff walls. These barriers are constructed by driving interlocking steel or high-density polyethylene into the ground. The joints between individual sheets are typically plugged with clay slurry (for steel sheets) or an expanding gasket (for high-density polyethylene sheets). The steel piles can be driven directly into the ground, while the synthetic piles need to be driven with a steel backing that is removed once the synthetic sheet is in place (NAVFAC, 2004). Sheet piling has been considered a less permanent measure than slurry walls or grout curtains because of unpredictable wall integrity (IAEA, 1999), but recent developments including improvements in sheet interlock design and innovative techniques to seal and test the joints between the sheets has improved performance (EPA, 1998). One vendor using such improved interlocks and seals reports achieving permeabilities as low as 1X10⁻¹⁰ cm/sec (Waterloo Barrier, 2004). Sheet pile cutoff walls have not been demonstrated as a containment barrier at a radionuclide-contaminated site.
Compacted Fill
Clay
Top Soil Soil
Membrane
Soil Contaminated with Radioactive WasteClean
Soil
Confining Layer
Surface
Slu
rry
Wal
l
Slu
rry
Wal
l
WaterTable
Exhibit 2-8: Vertical Barriers
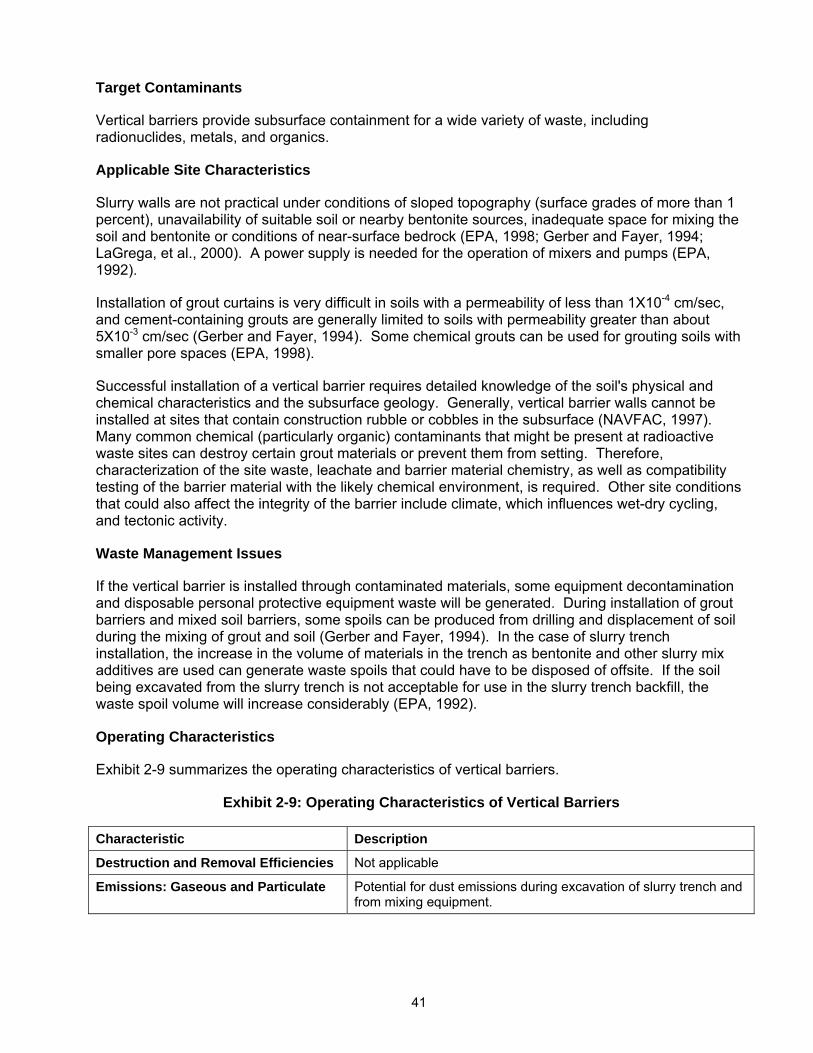
41
Target Contaminants
Vertical barriers provide subsurface containment for a wide variety of waste, including radionuclides, metals, and organics.
Applicable Site Characteristics
Slurry walls are not practical under conditions of sloped topography (surface grades of more than 1 percent), unavailability of suitable soil or nearby bentonite sources, inadequate space for mixing the soil and bentonite or conditions of near-surface bedrock (EPA, 1998; Gerber and Fayer, 1994; LaGrega, et al., 2000). A power supply is needed for the operation of mixers and pumps (EPA, 1992).
Installation of grout curtains is very difficult in soils with a permeability of less than 1X10⁻⁴ cm/sec, and cement-containing grouts are generally limited to soils with permeability greater than about 5X10⁻³ cm/sec (Gerber and Fayer, 1994). Some chemical grouts can be used for grouting soils with smaller pore spaces (EPA, 1998).
Successful installation of a vertical barrier requires detailed knowledge of the soil's physical and chemical characteristics and the subsurface geology. Generally, vertical barrier walls cannot be installed at sites that contain construction rubble or cobbles in the subsurface (NAVFAC, 1997). Many common chemical (particularly organic) contaminants that might be present at radioactive waste sites can destroy certain grout materials or prevent them from setting. Therefore, characterization of the site waste, leachate and barrier material chemistry, as well as compatibility testing of the barrier material with the likely chemical environment, is required. Other site conditions that could also affect the integrity of the barrier include climate, which influences wet-dry cycling, and tectonic activity.
Waste Management Issues
If the vertical barrier is installed through contaminated materials, some equipment decontamination and disposable personal protective equipment waste will be generated. During installation of grout barriers and mixed soil barriers, some spoils can be produced from drilling and displacement of soil during the mixing of grout and soil (Gerber and Fayer, 1994). In the case of slurry trench installation, the increase in the volume of materials in the trench as bentonite and other slurry mix additives are used can generate waste spoils that could have to be disposed of offsite. If the soil being excavated from the slurry trench is not acceptable for use in the slurry trench backfill, the waste spoil volume will increase considerably (EPA, 1992).
Operating Characteristics
Exhibit 2-9 summarizes the operating characteristics of vertical barriers.
Exhibit 2-9: Operating Characteristics of Vertical Barriers
Characteristic Description
Destruction and Removal Efficiencies Not applicable
Emissions: Gaseous and Particulate Potential for dust emissions during excavation of slurry trench and from mixing equipment.
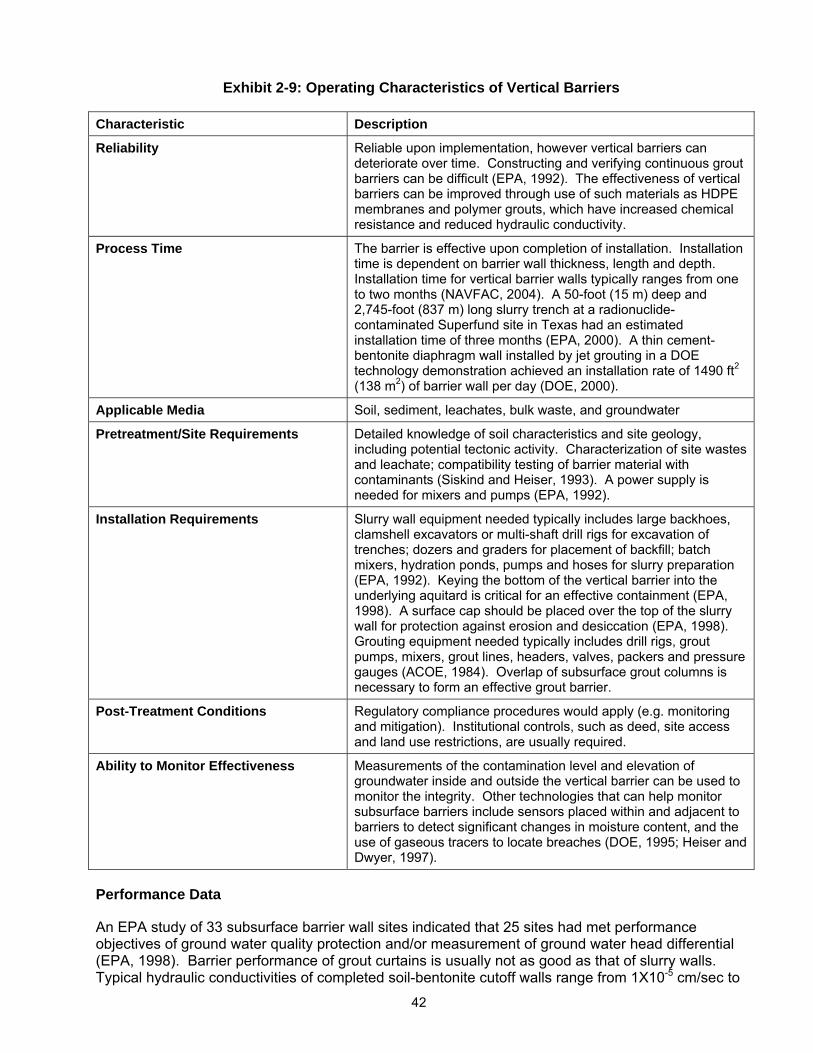
42
Exhibit 2-9: Operating Characteristics of Vertical Barriers
Characteristic Description
Reliability Reliable upon implementation, however vertical barriers can deteriorate over time. Constructing and verifying continuous grout barriers can be difficult (EPA, 1992). The effectiveness of vertical barriers can be improved through use of such materials as HDPE membranes and polymer grouts, which have increased chemical resistance and reduced hydraulic conductivity.
Process Time The barrier is effective upon completion of installation. Installation time is dependent on barrier wall thickness, length and depth. Installation time for vertical barrier walls typically ranges from one to two months (NAVFAC, 2004). A 50-foot (15 m) deep and 2,745-foot (837 m) long slurry trench at a radionuclide-contaminated Superfund site in Texas had an estimated installation time of three months (EPA, 2000). A thin cement-bentonite diaphragm wall installed by jet grouting in a DOE technology demonstration achieved an installation rate of 1490 ft2 (138 m2) of barrier wall per day (DOE, 2000).
Applicable Media Soil, sediment, leachates, bulk waste, and groundwater
Pretreatment/Site Requirements Detailed knowledge of soil characteristics and site geology, including potential tectonic activity. Characterization of site wastes and leachate; compatibility testing of barrier material with contaminants (Siskind and Heiser, 1993). A power supply is needed for mixers and pumps (EPA, 1992).
Installation Requirements Slurry wall equipment needed typically includes large backhoes, clamshell excavators or multi-shaft drill rigs for excavation of trenches; dozers and graders for placement of backfill; batch mixers, hydration ponds, pumps and hoses for slurry preparation (EPA, 1992). Keying the bottom of the vertical barrier into the underlying aquitard is critical for an effective containment (EPA, 1998). A surface cap should be placed over the top of the slurry wall for protection against erosion and desiccation (EPA, 1998). Grouting equipment needed typically includes drill rigs, grout pumps, mixers, grout lines, headers, valves, packers and pressure gauges (ACOE, 1984). Overlap of subsurface grout columns is necessary to form an effective grout barrier.
Post-Treatment Conditions Regulatory compliance procedures would apply (e.g. monitoring and mitigation). Institutional controls, such as deed, site access and land use restrictions, are usually required.
Ability to Monitor Effectiveness Measurements of the contamination level and elevation of groundwater inside and outside the vertical barrier can be used to monitor the integrity. Other technologies that can help monitor subsurface barriers include sensors placed within and adjacent to barriers to detect significant changes in moisture content, and the use of gaseous tracers to locate breaches (DOE, 1995; Heiser and Dwyer, 1997).
Performance Data
An EPA study of 33 subsurface barrier wall sites indicated that 25 sites had met performance objectives of ground water quality protection and/or measurement of ground water head differential (EPA, 1998). Barrier performance of grout curtains is usually not as good as that of slurry walls. Typical hydraulic conductivities of completed soil-bentonite cutoff walls range from 1X10⁻⁵ cm/sec to
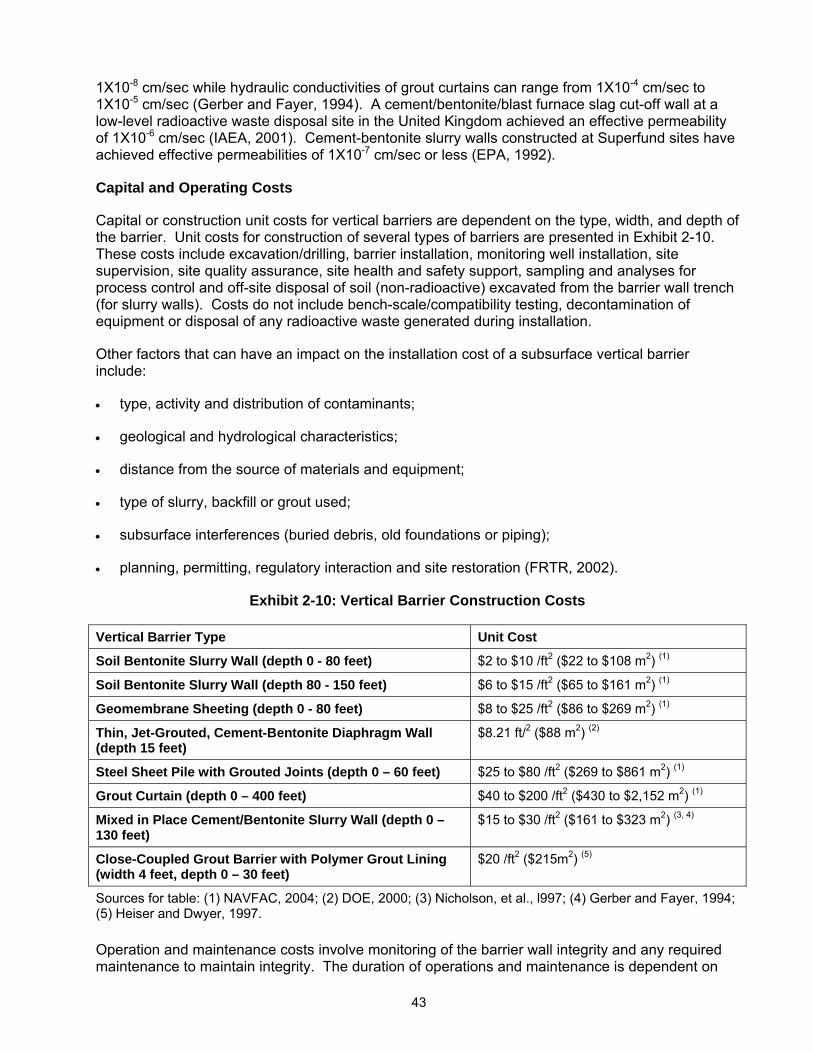
43
1X10⁻⁸ cm/sec while hydraulic conductivities of grout curtains can range from 1X10⁻⁴ cm/sec to 1X10⁻⁵ cm/sec (Gerber and Fayer, 1994). A cement/bentonite/blast furnace slag cut-off wall at a low-level radioactive waste disposal site in the United Kingdom achieved an effective permeability of 1X10⁻⁶ cm/sec (IAEA, 2001). Cement-bentonite slurry walls constructed at Superfund sites have achieved effective permeabilities of 1X10⁻⁷ cm/sec or less (EPA, 1992).
Capital and Operating Costs
Capital or construction unit costs for vertical barriers are dependent on the type, width, and depth of the barrier. Unit costs for construction of several types of barriers are presented in Exhibit 2-10. These costs include excavation/drilling, barrier installation, monitoring well installation, site supervision, site quality assurance, site health and safety support, sampling and analyses for process control and off-site disposal of soil (non-radioactive) excavated from the barrier wall trench (for slurry walls). Costs do not include bench-scale/compatibility testing, decontamination of equipment or disposal of any radioactive waste generated during installation.
Other factors that can have an impact on the installation cost of a subsurface vertical barrier include:
• type, activity and distribution of contaminants;
• geological and hydrological characteristics;
• distance from the source of materials and equipment;
• type of slurry, backfill or grout used;
• subsurface interferences (buried debris, old foundations or piping);
• planning, permitting, regulatory interaction and site restoration (FRTR, 2002).
Exhibit 2-10: Vertical Barrier Construction Costs
Vertical Barrier Type Unit Cost
Soil Bentonite Slurry Wall (depth 0 - 80 feet) $2 to $10 /ft2 ($22 to $108 m2) (1)
Soil Bentonite Slurry Wall (depth 80 - 150 feet) $6 to $15 /ft2 ($65 to $161 m2) (1)
Geomembrane Sheeting (depth 0 - 80 feet) $8 to $25 /ft2 ($86 to $269 m2) (1)
Thin, Jet-Grouted, Cement-Bentonite Diaphragm Wall (depth 15 feet)
$8.21 ft/2 ($88 m2) (2)
Steel Sheet Pile with Grouted Joints (depth 0 – 60 feet) $25 to $80 /ft2 ($269 to $861 m2) (1)
Grout Curtain (depth 0 – 400 feet) $40 to $200 /ft2 ($430 to $2,152 m2) (1)
Mixed in Place Cement/Bentonite Slurry Wall (depth 0 – 130 feet)
$15 to $30 /ft2 ($161 to $323 m2) (3, 4)
Close-Coupled Grout Barrier with Polymer Grout Lining (width 4 feet, depth 0 – 30 feet)
$20 /ft2 ($215m2) (5)
Sources for table: (1) NAVFAC, 2004; (2) DOE, 2000; (3) Nicholson, et al., l997; (4) Gerber and Fayer, 1994; (5) Heiser and Dwyer, 1997.
Operation and maintenance costs involve monitoring of the barrier wall integrity and any required maintenance to maintain integrity. The duration of operations and maintenance is dependent on
44
the cleanup goals, geohydrologic setting and chemical nature and concentration of the contaminants (NAVFAC, 2004). Operation and maintenance costs reported by four sites as a part of an EPA survey ranged from $30,000 per year to $1.2 million per year (EPA, 1998). The reason for the wide range in operation and maintenance cost was not clear from the literature. However, operation and maintenance costs would be expected to vary according to the total numbers of samples and types of analyses performed for monitoring the systems during a given year.
Commercial Availability
There are a number of vendors in the United States that offer vertical barrier construction services. Contact information for some of these vendors is included in the following subsection.
Contact Information
General Contacts:
EPA National Risk Management Research Laboratory
David Carson 26 West Martin Luther King Drive Cincinnati, OH 45268 (513) 569-7527 [email protected]
Vendors:
This is a partial listing of available vendors. Additional and updated vendor information can be obtained from the EPA Remediation and Characterization Technologies website: http://www.epareachit.org, the EPA Cleanup Information website: http://clu-in.org and by contacting the federal agency contact listed above.
Key to methods listed by vendor: SL = slurry walls, G = grout curtains, M = mixed in place slurry walls, D = diaphragm walls, SP = sheet pile walls
Brayman Environmental (SL, G, M, SP)
1000 John Roebling Way Saxonburg, PA 16056 (724) 443-1533 http://www.braymanenvironmental.com
Envirocon (SL, SP) 101 International Way Missoula, MT 59808 (406) 523-1150 http://www.envirocon.com
Geo-Con Environmental Barrier Company (SL, G, M)
4075 Monroeville Blvd., Suite 400 Monroeville, PA 15146 (412) 856-7700 http://www.geocon.net
Hayward Baker (SL, G, M, D) 1130 Annapolis Road, Suite 202 Odenton, MD 21113-1635 (410) 551-8200 http://www.haywardbaker.com
45
INQUIP Associates (SL, G, M, D) P.O. Box 6277 McLean, VA 22106 (703) 442-0143 http://www.inquip.com
Moore & Taber Geotechnical Constructors (G) 1290 North Hancock Street Suite 102 Anaheim, CA 92807 (714) 779-0681 http://www.mooreandtaber.com
Raito Inc. (M) 1660 Factor Avenue San Leandro, CA 94577 (510) 346-9840 http://www.raitoinc.com
Rembco Geotechnical Contractors (G) P.O. Box 23009 Knoxville, TN 37933-1009 (865) 671-2925 http://www.rembco.com
Remedial Construction Services (SL, G, M, D, SP)
9720 Derrington Houston, TX 77064 (281) 955-2442 http://www.recon-net.com
Schnabel Foundation Company (M) Mid-Atlantic Regional Office 5210 River Road Bethesda, MD 20816 (301) 657-3060 http://www.schnabel.com
TREVIICOS Corporation (SL, M) 273 Summer Street Boston, MA 02210 (617) 737-1453 http://www.treviicos.com
Vertical Barrier References
Federal Remediation Technologies Roundtable. Remediation Technologies Screening Matrix and Reference Guide, Version 4.0: Physical Barriers, 2002. http://www.frtr.gov/matrix2/section4/4-53.html
Gerber, M. and Fayer, M. In-situ Remediation Integrated Program: Evaluation and Assessment of Containment Technology. Prepared by Pacific Northwest Laboratory for U.S. DOE, 1994. DOE-EM-0201.
Heiser, J. and Dwyer, B. Summary Report on Close-Coupled Subsurface Barrier Technology, Initial Field Trials to Full-Scale Demonstration. Brookhaven National Laboratory, Upton, N.Y., 1997. BNL-52531.
International Atomic Energy Agency. Performance of Engineered Barrier Materials in Near Surface Disposal Facilities for Radioactive Wastes, 2001. IAEA-TECDOC-1255.
46
International Atomic Energy Agency. Technologies for Remediation of Radioactively Contaminated Sites, 1999. IAEA-TECDOC-1086.
International Atomic Energy Agency. Technologies for In-Situ Immobilization and Isolation of Radioactive Wastes at Disposal and Contaminated Sites, 1997. IAEA-TECDOC-972.
LaGrega, M., Buckingham, P., and Evans, J. Hazardous Waste Management, Second Edition. McGraw-Hill Inc., 2000.
Nicholson, P., Jasperse, B., and Fisher, M. “Economic Alternatives for Containment Barriers.” Proceedings of the International Containment Technology Conference, St. Petersburg, Fla., February 1997.
Oak Ridge National Laboratory. Oak Ridge National Laboratory Technology Logic Diagrams, Volume 3, Technology Evaluation Data Sheets, Part B, Dismantlement - Remedial Action, 1993. ORNL/M-2751/V3/Pt.B.
Siskind, B. and Heiser, J. Regulatory Issues and Assumptions Associated with Barriers in the Vadose Zone Surrounding Buried Waste. Brookhaven National Laboratory, Upton, N.Y., 1993. BNL-48749.
U.S. Army Corps of Engineers. Grouting Technology, 1984. EM-1110-2-3506.
U.S. Department of Energy. Innovative Technology Summary Report: Cement Bentonite Thin Diaphragm Wall, 2000. DOE/EM-0551.
U.S. Department of Energy. “Verification of Subsurface Barriers Using Time Domain Reflectometry with Waveguides.” Contaminant Plumes Containment and Remediation Focus Area: Technology Summary, June, 1995. DOE/EM-0248.
U.S. Environmental Protection Agency. EPA Superfund Record of Decision Amendment: Tex-Tin Corp., EPA ID: TXD062113329, OU1, Texas City, Texas, 09/28/2000. EPA/AMD/R06-00/504.
U.S. Environmental Protection Agency. Evaluation of Subsurface Engineered Barriers at Waste Sites, 1998. EPA/542/R-98/005.
U.S. Environmental Protection Agency. Engineering Bulletin: Slurry Walls, 1992. EPA/540/S-92/008.
U.S. Environmental Protection Agency. Technological Approaches to the Cleanup of Radiologically Contaminated Superfund Sites, 1988. EPA/540/2-88/002.
U.S. Naval Facilities Engineering Command. Naval Facilities Engineering Service Center, Port Hueneme, Environmental Restoration & BRAC Website, Technology Pages: Vertical Cutoff Wall, 2004. http://enviro.nfesc.navy.mil/erb
U.S. Naval Facilities Engineering Command. Remediation Technologies for Typical Contaminants and Media Types at Navy Sites, 1997. http://enviro.nfesc.navy.mil/erb
Waterloo Barrier. Waterloo Barrier® Groundwater Containment Wall. Vendor Information, 2004. http://www.waterloo-barrier.com
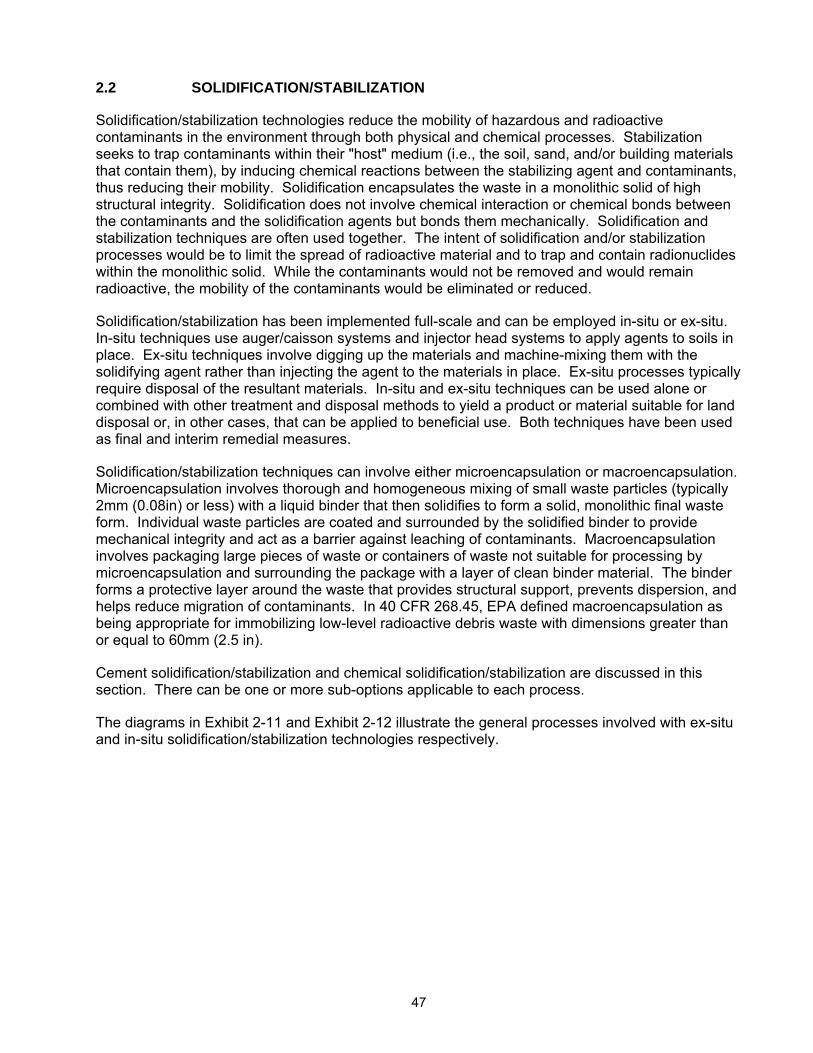
47
2.2 SOLIDIFICATION/STABILIZATION
Solidification/stabilization technologies reduce the mobility of hazardous and radioactive contaminants in the environment through both physical and chemical processes. Stabilization seeks to trap contaminants within their "host" medium (i.e., the soil, sand, and/or building materials that contain them), by inducing chemical reactions between the stabilizing agent and contaminants, thus reducing their mobility. Solidification encapsulates the waste in a monolithic solid of high structural integrity. Solidification does not involve chemical interaction or chemical bonds between the contaminants and the solidification agents but bonds them mechanically. Solidification and stabilization techniques are often used together. The intent of solidification and/or stabilization processes would be to limit the spread of radioactive material and to trap and contain radionuclides within the monolithic solid. While the contaminants would not be removed and would remain radioactive, the mobility of the contaminants would be eliminated or reduced.
Solidification/stabilization has been implemented full-scale and can be employed in-situ or ex-situ. In-situ techniques use auger/caisson systems and injector head systems to apply agents to soils in place. Ex-situ techniques involve digging up the materials and machine-mixing them with the solidifying agent rather than injecting the agent to the materials in place. Ex-situ processes typically require disposal of the resultant materials. In-situ and ex-situ techniques can be used alone or combined with other treatment and disposal methods to yield a product or material suitable for land disposal or, in other cases, that can be applied to beneficial use. Both techniques have been used as final and interim remedial measures.
Solidification/stabilization techniques can involve either microencapsulation or macroencapsulation. Microencapsulation involves thorough and homogeneous mixing of small waste particles (typically 2mm (0.08in) or less) with a liquid binder that then solidifies to form a solid, monolithic final waste form. Individual waste particles are coated and surrounded by the solidified binder to provide mechanical integrity and act as a barrier against leaching of contaminants. Macroencapsulation involves packaging large pieces of waste or containers of waste not suitable for processing by microencapsulation and surrounding the package with a layer of clean binder material. The binder forms a protective layer around the waste that provides structural support, prevents dispersion, and helps reduce migration of contaminants. In 40 CFR 268.45, EPA defined macroencapsulation as being appropriate for immobilizing low-level radioactive debris waste with dimensions greater than or equal to 60mm (2.5 in).
Cement solidification/stabilization and chemical solidification/stabilization are discussed in this section. There can be one or more sub-options applicable to each process.
The diagrams in Exhibit 2-11 and Exhibit 2-12 illustrate the general processes involved with ex-situ and in-situ solidification/stabilization technologies respectively.
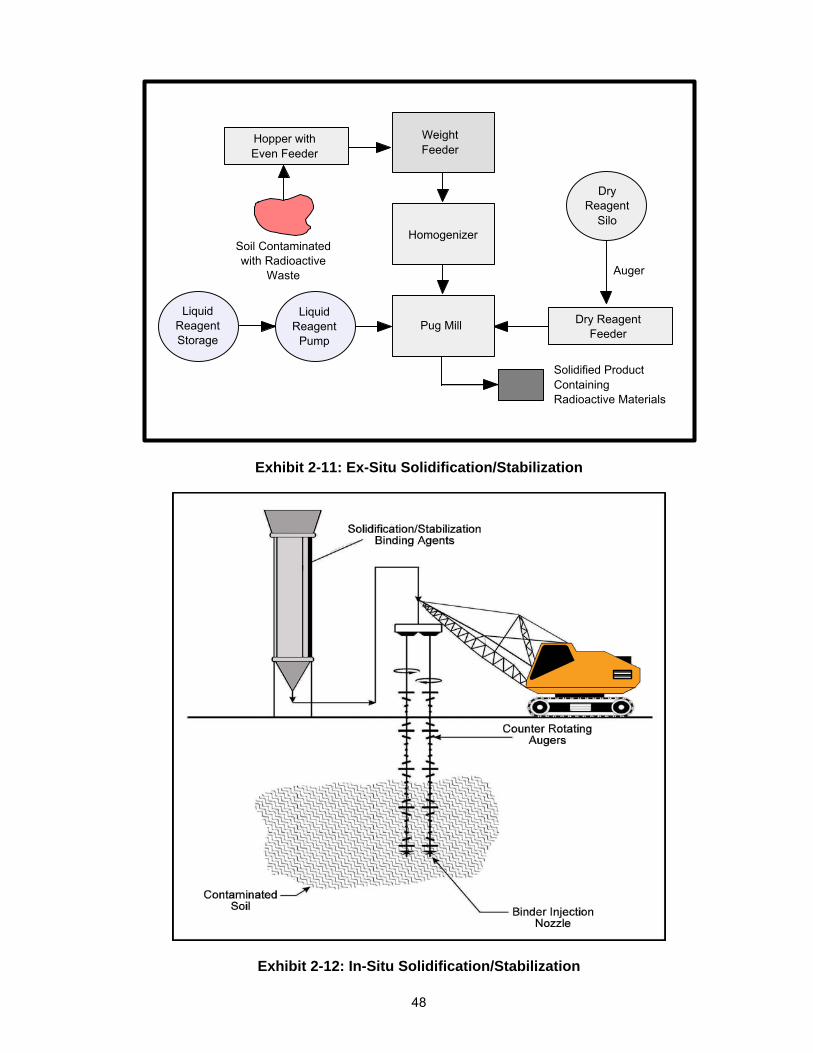
48
Soil Contaminated��� ���
with Radioactive���
���
Waste���
Dry��� ���
Reagent���
���
Silo���
Hopper with��� ���
Even Feeder���
Weight��� ���
Feeder���
Homogenizer���
Auger�
�
�
Solidified Product ���Containing ���Radioactive Materials���
Liquid��� ���
Reagent���
���
Storage���
Pug Mill��� Dry Reagent��� ���
Feeder���
Liquid��� ���
Reagent���
���
Pump���
Exhibit 2-11: Ex-Situ Solidification/Stabilization
Exhibit 2-12: In-Situ Solidification/Stabilization
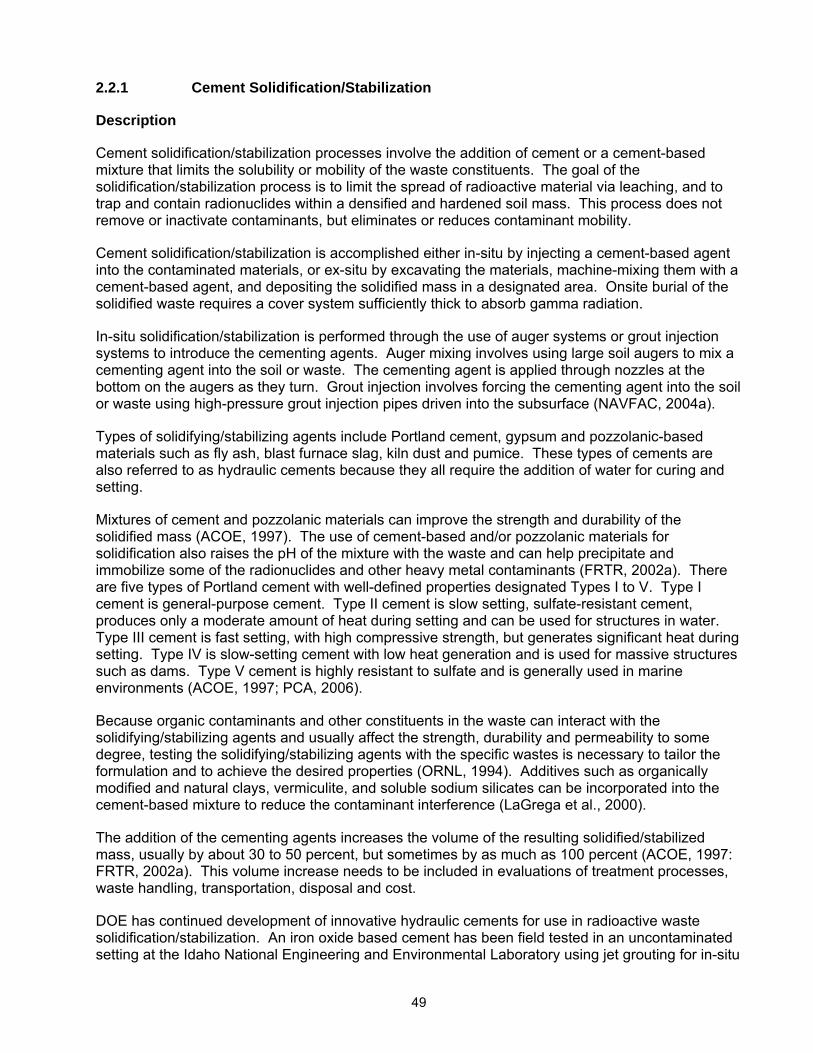
49
2.2.1 Cement Solidification/Stabilization
Description
Cement solidification/stabilization processes involve the addition of cement or a cement-based mixture that limits the solubility or mobility of the waste constituents. The goal of the solidification/stabilization process is to limit the spread of radioactive material via leaching, and to trap and contain radionuclides within a densified and hardened soil mass. This process does not remove or inactivate contaminants, but eliminates or reduces contaminant mobility.
Cement solidification/stabilization is accomplished either in-situ by injecting a cement-based agent into the contaminated materials, or ex-situ by excavating the materials, machine-mixing them with a cement-based agent, and depositing the solidified mass in a designated area. Onsite burial of the solidified waste requires a cover system sufficiently thick to absorb gamma radiation.
In-situ solidification/stabilization is performed through the use of auger systems or grout injection systems to introduce the cementing agents. Auger mixing involves using large soil augers to mix a cementing agent into the soil or waste. The cementing agent is applied through nozzles at the bottom on the augers as they turn. Grout injection involves forcing the cementing agent into the soil or waste using high-pressure grout injection pipes driven into the subsurface (NAVFAC, 2004a).
Types of solidifying/stabilizing agents include Portland cement, gypsum and pozzolanic-based materials such as fly ash, blast furnace slag, kiln dust and pumice. These types of cements are also referred to as hydraulic cements because they all require the addition of water for curing and setting.
Mixtures of cement and pozzolanic materials can improve the strength and durability of the solidified mass (ACOE, 1997). The use of cement-based and/or pozzolanic materials for solidification also raises the pH of the mixture with the waste and can help precipitate and immobilize some of the radionuclides and other heavy metal contaminants (FRTR, 2002a). There are five types of Portland cement with well-defined properties designated Types I to V. Type I cement is general-purpose cement. Type II cement is slow setting, sulfate-resistant cement, produces only a moderate amount of heat during setting and can be used for structures in water. Type III cement is fast setting, with high compressive strength, but generates significant heat during setting. Type IV is slow-setting cement with low heat generation and is used for massive structures such as dams. Type V cement is highly resistant to sulfate and is generally used in marine environments (ACOE, 1997; PCA, 2006).
Because organic contaminants and other constituents in the waste can interact with the solidifying/stabilizing agents and usually affect the strength, durability and permeability to some degree, testing the solidifying/stabilizing agents with the specific wastes is necessary to tailor the formulation and to achieve the desired properties (ORNL, 1994). Additives such as organically modified and natural clays, vermiculite, and soluble sodium silicates can be incorporated into the cement-based mixture to reduce the contaminant interference (LaGrega et al., 2000).
The addition of the cementing agents increases the volume of the resulting solidified/stabilized mass, usually by about 30 to 50 percent, but sometimes by as much as 100 percent (ACOE, 1997: FRTR, 2002a). This volume increase needs to be included in evaluations of treatment processes, waste handling, transportation, disposal and cost.
DOE has continued development of innovative hydraulic cements for use in radioactive waste solidification/stabilization. An iron oxide based cement has been field tested in an uncontaminated setting at the Idaho National Engineering and Environmental Laboratory using jet grouting for in-situ
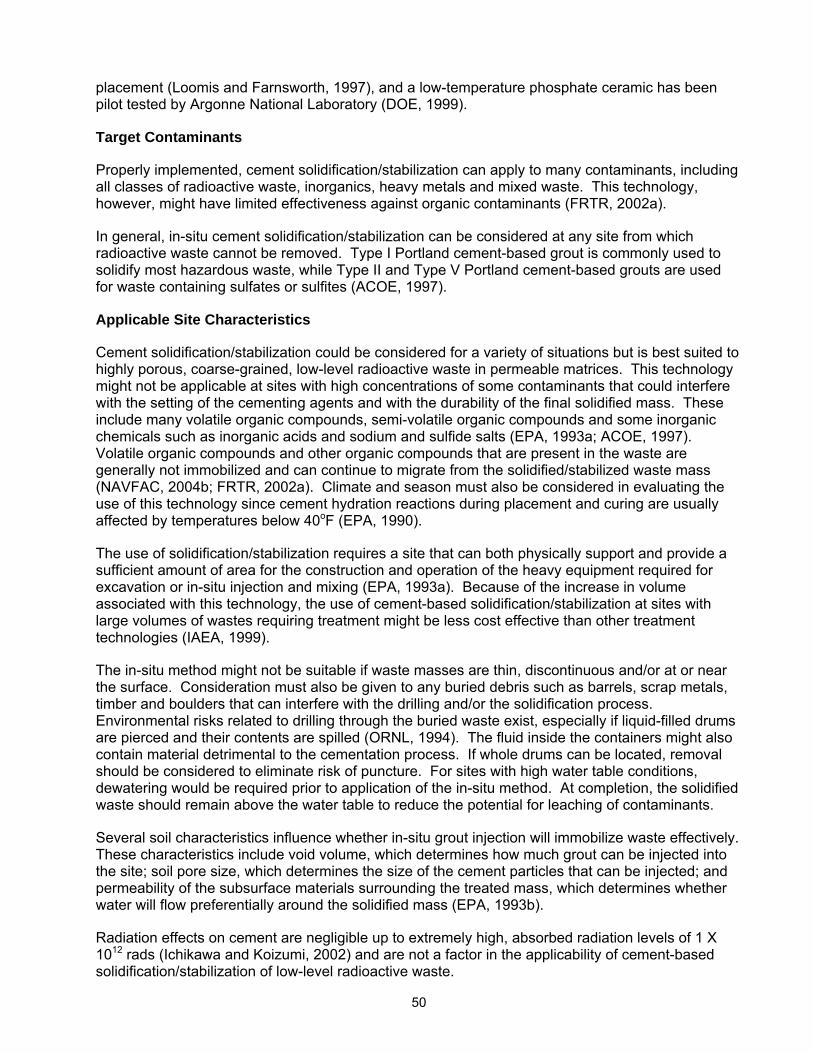
50
placement (Loomis and Farnsworth, 1997), and a low-temperature phosphate ceramic has been pilot tested by Argonne National Laboratory (DOE, 1999).
Target Contaminants
Properly implemented, cement solidification/stabilization can apply to many contaminants, including all classes of radioactive waste, inorganics, heavy metals and mixed waste. This technology, however, might have limited effectiveness against organic contaminants (FRTR, 2002a).
In general, in-situ cement solidification/stabilization can be considered at any site from which radioactive waste cannot be removed. Type I Portland cement-based grout is commonly used to solidify most hazardous waste, while Type II and Type V Portland cement-based grouts are used for waste containing sulfates or sulfites (ACOE, 1997).
Applicable Site Characteristics
Cement solidification/stabilization could be considered for a variety of situations but is best suited to highly porous, coarse-grained, low-level radioactive waste in permeable matrices. This technology might not be applicable at sites with high concentrations of some contaminants that could interfere with the setting of the cementing agents and with the durability of the final solidified mass. These include many volatile organic compounds, semi-volatile organic compounds and some inorganic chemicals such as inorganic acids and sodium and sulfide salts (EPA, 1993a; ACOE, 1997). Volatile organic compounds and other organic compounds that are present in the waste are generally not immobilized and can continue to migrate from the solidified/stabilized waste mass (NAVFAC, 2004b; FRTR, 2002a). Climate and season must also be considered in evaluating the use of this technology since cement hydration reactions during placement and curing are usually affected by temperatures below 40oF (EPA, 1990).
The use of solidification/stabilization requires a site that can both physically support and provide a sufficient amount of area for the construction and operation of the heavy equipment required for excavation or in-situ injection and mixing (EPA, 1993a). Because of the increase in volume associated with this technology, the use of cement-based solidification/stabilization at sites with large volumes of wastes requiring treatment might be less cost effective than other treatment technologies (IAEA, 1999).
The in-situ method might not be suitable if waste masses are thin, discontinuous and/or at or near the surface. Consideration must also be given to any buried debris such as barrels, scrap metals, timber and boulders that can interfere with the drilling and/or the solidification process. Environmental risks related to drilling through the buried waste exist, especially if liquid-filled drums are pierced and their contents are spilled (ORNL, 1994). The fluid inside the containers might also contain material detrimental to the cementation process. If whole drums can be located, removal should be considered to eliminate risk of puncture. For sites with high water table conditions, dewatering would be required prior to application of the in-situ method. At completion, the solidified waste should remain above the water table to reduce the potential for leaching of contaminants.
Several soil characteristics influence whether in-situ grout injection will immobilize waste effectively. These characteristics include void volume, which determines how much grout can be injected into the site; soil pore size, which determines the size of the cement particles that can be injected; and permeability of the subsurface materials surrounding the treated mass, which determines whether water will flow preferentially around the solidified mass (EPA, 1993b).
Radiation effects on cement are negligible up to extremely high, absorbed radiation levels of 1 X 10¹² rads (Ichikawa and Koizumi, 2002) and are not a factor in the applicability of cement-based solidification/stabilization of low-level radioactive waste.
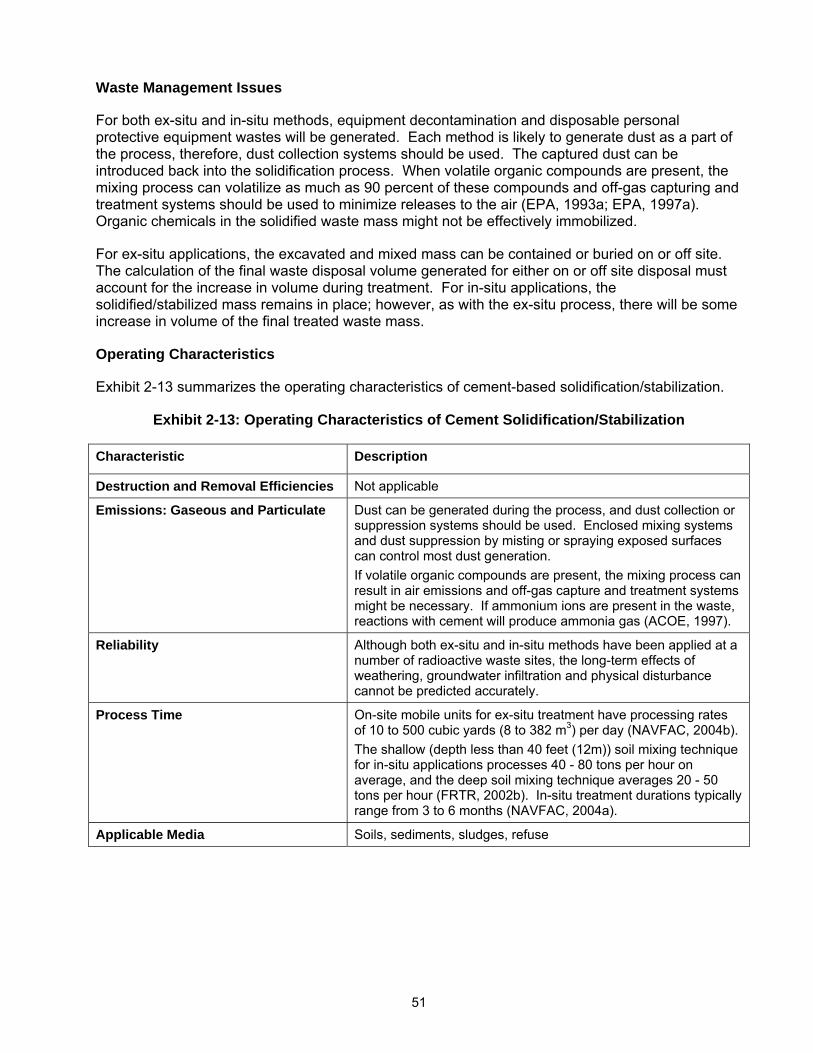
51
Waste Management Issues
For both ex-situ and in-situ methods, equipment decontamination and disposable personal protective equipment wastes will be generated. Each method is likely to generate dust as a part of the process, therefore, dust collection systems should be used. The captured dust can be introduced back into the solidification process. When volatile organic compounds are present, the mixing process can volatilize as much as 90 percent of these compounds and off-gas capturing and treatment systems should be used to minimize releases to the air (EPA, 1993a; EPA, 1997a). Organic chemicals in the solidified waste mass might not be effectively immobilized.
For ex-situ applications, the excavated and mixed mass can be contained or buried on or off site. The calculation of the final waste disposal volume generated for either on or off site disposal must account for the increase in volume during treatment. For in-situ applications, the solidified/stabilized mass remains in place; however, as with the ex-situ process, there will be some increase in volume of the final treated waste mass.
Operating Characteristics
Exhibit 2-13 summarizes the operating characteristics of cement-based solidification/stabilization.
Exhibit 2-13: Operating Characteristics of Cement Solidification/Stabilization
Characteristic Description
Destruction and Removal Efficiencies Not applicable
Emissions: Gaseous and Particulate Dust can be generated during the process, and dust collection or suppression systems should be used. Enclosed mixing systems and dust suppression by misting or spraying exposed surfaces can control most dust generation. If volatile organic compounds are present, the mixing process can result in air emissions and off-gas capture and treatment systems might be necessary. If ammonium ions are present in the waste, reactions with cement will produce ammonia gas (ACOE, 1997).
Reliability Although both ex-situ and in-situ methods have been applied at a number of radioactive waste sites, the long-term effects of weathering, groundwater infiltration and physical disturbance cannot be predicted accurately.
Process Time On-site mobile units for ex-situ treatment have processing rates of 10 to 500 cubic yards (8 to 382 m3) per day (NAVFAC, 2004b). The shallow (depth less than 40 feet (12m)) soil mixing technique for in-situ applications processes 40 - 80 tons per hour on average, and the deep soil mixing technique averages 20 - 50 tons per hour (FRTR, 2002b). In-situ treatment durations typically range from 3 to 6 months (NAVFAC, 2004a).
Applicable Media Soils, sediments, sludges, refuse
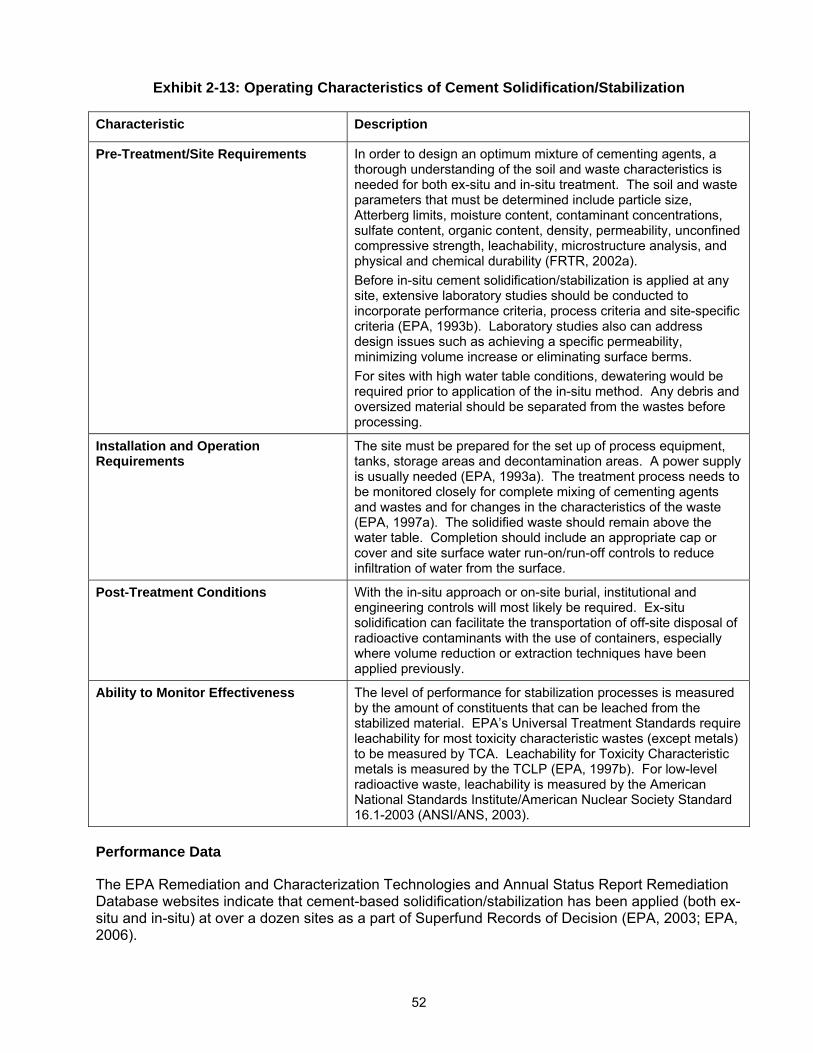
52
Exhibit 2-13: Operating Characteristics of Cement Solidification/Stabilization
Characteristic Description
Pre-Treatment/Site Requirements In order to design an optimum mixture of cementing agents, a thorough understanding of the soil and waste characteristics is needed for both ex-situ and in-situ treatment. The soil and waste parameters that must be determined include particle size, Atterberg limits, moisture content, contaminant concentrations, sulfate content, organic content, density, permeability, unconfined compressive strength, leachability, microstructure analysis, and physical and chemical durability (FRTR, 2002a). Before in-situ cement solidification/stabilization is applied at any site, extensive laboratory studies should be conducted to incorporate performance criteria, process criteria and site-specific criteria (EPA, 1993b). Laboratory studies also can address design issues such as achieving a specific permeability, minimizing volume increase or eliminating surface berms. For sites with high water table conditions, dewatering would be required prior to application of the in-situ method. Any debris and oversized material should be separated from the wastes before processing.
Installation and Operation Requirements
The site must be prepared for the set up of process equipment, tanks, storage areas and decontamination areas. A power supply is usually needed (EPA, 1993a). The treatment process needs to be monitored closely for complete mixing of cementing agents and wastes and for changes in the characteristics of the waste (EPA, 1997a). The solidified waste should remain above the water table. Completion should include an appropriate cap or cover and site surface water run-on/run-off controls to reduce infiltration of water from the surface.
Post-Treatment Conditions With the in-situ approach or on-site burial, institutional and engineering controls will most likely be required. Ex-situ solidification can facilitate the transportation of off-site disposal of radioactive contaminants with the use of containers, especially where volume reduction or extraction techniques have been applied previously.
Ability to Monitor Effectiveness The level of performance for stabilization processes is measured by the amount of constituents that can be leached from the stabilized material. EPA’s Universal Treatment Standards require leachability for most toxicity characteristic wastes (except metals) to be measured by TCA. Leachability for Toxicity Characteristic metals is measured by the TCLP (EPA, 1997b). For low-level radioactive waste, leachability is measured by the American National Standards Institute/American Nuclear Society Standard 16.1-2003 (ANSI/ANS, 2003).
Performance Data
The EPA Remediation and Characterization Technologies and Annual Status Report Remediation Database websites indicate that cement-based solidification/stabilization has been applied (both ex-situ and in-situ) at over a dozen sites as a part of Superfund Records of Decision (EPA, 2003; EPA, 2006).
53
Cement-based solidification has also been used to treat solid radioactive wastes in shallow land trenches in Sergiev Posad, Russia, and cesium- and strontium-contaminated tank sediments in Trombay, India (IAEA, 1997).
Soil mixing and grout injection processes have demonstrated the capability to reduce the mobility of contaminated waste by greater than 95 percent. The effects, over the long term, of weathering, ground water infiltration and physical disturbance associated with uncontrolled future land use can significantly affect the integrity of the stabilized mass and contaminant mobility in ways that cannot be predicted by laboratory tests (FRTR, 2002b).
The typical range of unconfined compressive strength for waste treated by cement-based solidification/stabilization is 75 psi to 866 psi with an average of 410 psi (Kikkeri and Ness, 1996). A bench-scale test of several mixes of cement, bentonite and silicate for in-situ soil mixing application for the solidification of soils at the Savannah River Site contaminated with cesium-137, strontium-90, and plutonium-239/240 produced 28-day unconfined compressive strengths in excess of 220 psi and 28-day hydraulic conductivities from 2X10⁻⁶ cm/sec to 4 X10⁻¹⁰ cm/sec (Nakagawa, 1999).
At a Superfund Innovative Technology Evaluation Program demonstration site in Florida, hazardous-waste contaminated soils were solidified in-situ using soil-mixing techniques with a proprietary cementing agent that included pozzolanic materials. Testing of the solidified soils indicated unconfined compression strengths of 300 psi to 1,000 psi, hydraulic conductivities of 1 X10⁻⁶ to 1 X10⁻⁷ cm/sec and an overall volume increase of 8.5 percent (EPA, 1990).
At Brookhaven National Laboratory, a demonstration of in-situ cement-based stabilization using jet grouting was conducted to treat buried wastes that were contaminated with radionuclides. Tests of core samples indicated hydraulic conductivities ranging from 1.1 X 10⁻⁶ cm/sec to 1.6 X 10⁻⁸ cm/sec (Dwyer, et al., 1999). At Oak Ridge National Laboratory, cement-based grouts used in permeation grouting to solidify waste disposal trenches contaminated with strontium-90 produced an average hydraulic conductivity (field measurement) of less than 1 X10⁻⁶ cm/sec (Long, et al., 1997).
Capital and Operating Costs
For ex-situ solidification/stabilization processes, installation (capital) costs range from $90 to $290 per cubic yard ($118 to $379 per cubic meter) plus a fixed mobilization cost of $10,000 to $20,000. These costs include equipment, excavation, labor, utilities, cementing agent, process control sampling and analysis, site quality assurance, health and safety support and on-site disposal of treated materials. These costs do not include site characterization, bench-scale testing, project management, design and engineering, permits and fees, performance bond and off-site transportation and disposal costs (NAVFAC, 2004b). Ex-situ treatment of drummed waste has been reported as high as $512 per cubic yard ($670 per cubic meter) (EPA, 1995).
Installation costs for in-situ soil mixing/auger techniques average $40 - $60 per cubic yard ($52 to $78 per cubic meter) for shallow applications up to a depth of 40 feet (12 m) and $150 - $250 per cubic yard ($196 to $327 per cubic meter) for deeper applications. Grout injection techniques include costs for drilling of $50 to $150 per foot ($164 to $492 per meter) and costs for grouting of $50 to $75 per foot ($164 to $246 per meter). These costs do not include mobilization, wash disposal, or adverse site condition expenses (FRTR, 2002b).
There would be no operation and maintenance costs after completion of installation for an ex-situ treatment site with off site disposal. For ex-situ treatment sites with on-site disposal and for in-situ treatment sites, operations and maintenance costs would include ground water monitoring and inspection, repair and maintenance of cover systems and run-on/run-off controls.
54
Commercial Availability
Ex-situ solidification/stabilization is a mature technology that is offered by many vendors in the United States. In-situ technology is less mature, but has been successfully demonstrated and applied at several radioactive waste sites. Contact information for some of the vendors for these technologies is included in the following subsection.
Contact Information
General Contacts:
EPA National Risk Management Research Laboratory
Ed Barth 26 West Martin Luther King Drive Cincinnati, OH 45268 (513) 569-7669 [email protected]
Vendors:
This is a partial listing of available vendors. Additional and updated vendor information can be obtained from the EPA Remediation and Characterization Technologies website: http://www.epareachit.org/, the EPA Cleanup Information website: http://clu-in.org, and by contacting the federal agency contact listed above.
Key to methods listed by vendor: ES = Ex-situ, ISM = in-situ soil mixing, ISG = in-situ grouting
Brayman Environmental (ISM, ISG) 1000 John Roebling Way Saxonburg, PA 16056 (724) 443-1533 http://www.braymanenvironmental.com
Envirocon (SL, SP) 101 International Way Missoula, MT 59808 (406) 523-1150 http://www.envirocon.com
Geo-Con Environmental Barrier Company (ISM)
4075 Monroeville Blvd., Suite 400 Monroeville, PA 15146 (412) 856-7700 http://www.geocon.net
Hayward Baker (ISM, ISG) 1130 Annapolis Road, Suite 202 Odenton, MD 21113-1635 (410) 551-8200 http://www.haywardbaker.com
INQUIP Associates (ISM, ISG) P.O. Box 6277 McLean, VA 22106 (703) 442-0143 http://www.inquip.com
55
Moore & Taber Geotechnical Constructors (ISG)
1290 North Hancock Street Suite 102 Anaheim, CA 92807 (714) 779-0681 http://www.mooreandtaber.com
Raito Inc. (ISM) 1660 Factor Avenue San Leandro, CA 94577 (510) 346-9840 http://www.raitoinc.com
Rembco Geotechnical Contractors (ISG) P.O. Box 23009 Knoxville, TN 37933-1009 (865) 671-2925 http://www.rembco.com
Remedial Construction Services (ES, ISM, ISG)
9720 Derrington Houston, TX 77064 (281) 955-2442 http://www.recon-net.com
Schnabel Foundation Company (ISM) Mid-Atlantic Regional Office 5210 River Road Bethesda, MD 20816 (301) 657-3060 http://www.schnabel.com
Sevenson Environmental Services (ES, ISM) 2749 Lockport Road Niagara Falls, NY 14305 (716) 284-0431 http://www.sevenson.com/
Cement Solidification/Stabilization References
American National Standards Institute/American Nuclear Society. Measurement of the Leachability of Solidified Low-Level Radioactive Waste by a Short-Term Procedure, 2003. ANSI/ANS 16.1-2003.
Dwyer, B., Heiser, J., and Gilbert, J. Demonstration of In-Situ Stabilization of Buried Waste at Pit G-11 at the Brookhaven National Laboratory Glass Pits Disposal Site. Sandia National Laboratories, 1999. SAND98-2842.
Federal Remediation Technologies Roundtable. Remediation Technologies Screening Matrix and Reference Guide, Version 4.0: Solidification/Stabilization (Ex-Situ), 2002a. http://www.frtr.gov/matrix2/section4/4-21.html
Federal Remediation Technologies Roundtable. Remediation Technologies Screening Matrix and Reference Guide, Version 4.0: Solidification/Stabilization (In-Situ), 2002b. http://www.frtr.gov/matrix2/section4/4-8.html
Ichikawa, T. and Koizumi, H. “Possibility of Radiation-Induced Degradation of Concrete by Alkali-Silica Reaction of Aggregates.” Journal of Nuclear Science and Technology. Vol. 39, No. 8, pp. 880-884, August, 2002.
56
International Atomic Energy Agency. Technologies for In-Situ Immobilization and Isolation of Radioactive Wastes at Disposal and Contaminated Sites, 1997. IAEA-TECDOC-972.
International Atomic Energy Agency. Technologies for Remediation of Radioactively Contaminated Sites, 1999. IAEA-TECDOC-1086.
Kikkeri, S. and Ness, E. Engineering Parameters for Environmental Remediation Technologies. Prepared for U.S. Coast Guard, Office of Research and Development, 1996. Report No. CG-D-15-96.
LaGrega, M., Buckingham, P., and Evans, J. Hazardous Waste Management, Second Edition. McGraw-Hill Inc., 2000.
Long, J., Huff, D., and Naudts, A. “A Case Study – Using a Multi-Grout Barrier to Control 90Sr Release at ORNL.” Proceedings of the International Containment Technology Conference, St. Petersburg, Fla., February, 1997.
Loomis, G. and Farnsworth, R. “Field Application of Innovative Grouting Agents for In-Situ Stabilization of Buried Waste Sites.” Proceedings of the International Containment Technology Conference, St. Petersburg, Fla., February, 1997.
Nakagawa, P. Soil Stabilization/Solidification Grout Mix Design Study for the C-, K-, L-, and P-Reactor Seepage Basins Closure Final Report. Westinghouse Savannah River Company, Savannah River Site, 1999. WSRC-RP-99-4075, Rev. 1.
Oak Ridge National Laboratory. Y-12 Plant Remedial Action Technology Logic Diagram, Volume 3, Technology Evaluation Data Sheets, Part A, Remedial Action, 1994. Y/ER-161/V3/PtA.
Portland Cement Association. Cement & Concrete Basics Website, 2006. http://www.cement.org/basics.index.asp
U.S. Army Corps of Engineers. Guidance for Low-Level Radioactive Waste (LLRW) and Mixed Waste (MW) Treatment and Handling, 1997. EM-1110-1-4002.
U.S. Department of Energy. Innovative Technology Summary Report: Stabilization Using Phosphate Bonded Ceramics, 1999. DOE/EM-0486.
U.S. Environmental Protection Agency. Remediation and Characterization Technologies Website, 2006. http://www.epareachit.org/
U.S. Environmental Protection Agency. Annual Status Report Remediation Database Website, 2003. http://cfpub.epa.gov/asr/
U.S. Environmental Protection Agency. Best Management Practices (BMPs) for Soil Treatment Technologies: Suggested Operational Guidelines to Prevent Cross-media Transfer of Contaminants During Clean-Up Activities, 1997a. EPA/530/R-97/007.
U.S. Environmental Protection Agency. Innovative Site Remediation Technology, Design & Application, Volume 4: Stabilization/Solidification, 1997b. EPA/542/B-97/007.
U.S. Environmental Protection Agency. Contaminants and Remedial Options at Selected Metal-Contaminated Sites, 1995. EPA/540/R-95/512.
U.S. Environmental Protection Agency. Engineering Bulletin: Solidification/Stabilization of Organics and Inorganics, 1993a. EPA/540/S-92/015.
57
U.S. Environmental Protection Agency. Approaches for the Remediation of Federal Facility Sites Contaminated With Explosive or Radioactive Wastes, 1993b. EPA/625/R-93/013.
U.S. Environmental Protection Agency. Superfund Innovative Technology Evaluation Program: International Waste Technologies/Geo-Con In-situ Stabilization/Solidification, Applications Analysis Report, 1990. EPA/540/A5-89/004.
U.S. Naval Facilities Engineering Command. Naval Facilities Engineering Service Center, Port Hueneme, Environmental Restoration & BRAC Website, Technology Pages: Solidification/Stabilization (In-Situ), 2004a. http://enviro.nfesc.navy.mil/erb
U.S. Naval Facilities Engineering Command. Naval Facilities Engineering Service Center, Port Hueneme, Environmental Restoration & BRAC Website, Technology Pages: Solidification/Stabilization (Ex-Situ), 2004b. http://enviro.nfesc.navy.mil/erb
2.2.2 Chemical Solidification/Stabilization
Description
Chemical solidification/stabilization involves adding chemical reagents to waste in order to limit the waste solubility and mobility. Like cement solidification/stabilization, the goal of the chemical solidification/stabilization process is to limit the spread of radioactive material via leaching, and to trap and contain radionuclides within a densified and hardened soil mass. This process does not remove or inactivate contaminants, but eliminates or reduces contaminant mobility.
Chemical solidification/stabilization is accomplished either in-situ, by injecting a solidifying/stabilizing agent into contaminated materials, or ex-situ, by excavating and machine-mixing the materials with the solidifying/stabilizing agent and then placing the solidified mass in containers for off-site disposal or re-emplacing it on site. Onsite burial of the solidified waste requires a cover system sufficiently thick to absorb gamma radiation.
Chemical solidification/stabilization agents include thermoplastic polymers (asphalt bitumen, paraffin, polyethylene, polypropylene, modified sulfur cement), thermosetting polymers (vinyl ester monomers, urea formaldehyde, epoxy polymers), and other proprietary additives.
Thermoplastic polymers are materials that repeatedly melt to a flowable state when heated and then harden to a solid when cooled. Thermosetting polymers are formed from the combination of several liquid ingredients which polymerize and harden to a solid and which cannot be reversed to a flowable state without destroying the original characteristics (EPA, 1997a).
Thermoplastic polymers would typically be used in ex-situ applications since the polymers would be melted and would need to remain molten during the mixing with the waste. Before mixing the waste with the polymer, the waste would need to be dried. Thermoplastic encapsulation can produce waste forms containing up to 50 percent by weight of solid waste (ACOE, 1997).
Thermosetting polymers used in solidification/stabilization can fill more than 97 percent of the void space in a waste material, making the resulting mass more solid and less permeable (ACOE, 1997). Thermosetting resins typically have low viscosities that make them readily adaptable for in-situ solidification (EPA, 1997a).
Like cement-based solidification/stabilization applications, the chemical-based methods can increase the volume of the resulting solidified/stabilized mass. However, because the waste is dried before applying ex-situ chemical methods and because in-situ thermosetting methods are
58
efficient in filling void spaces, the increases in volume are less than those for cement-based methods in most cases (ACOE, 1997).
Target Contaminants
Properly implemented, chemical solidification/stabilization can apply to many contaminants, including all classes of radioactive waste, inorganics, heavy metals, and mixed waste. This process might have limited effectiveness against organic contaminants that can inhibit the chemical bonding of stabilizers or the mechanical bonding of solidifying agents.
EPA has identified polymer macroencapsulation in 40 CFR 268.40 as the Best Demonstrated Available Technology for D008 radioactive lead solids (e.g., all lead shielding and other elemental forms of lead).
Applicable Site Characteristics
While chemical solidification/stabilization can be used in a variety of physical environments, it is better suited to fine-grained soil with small pores. The use of solidification/stabilization requires a site that can both physically support and provide a sufficient amount of area for the construction and operation of the heavy equipment required for excavation or in-situ injection and mixing (EPA, 1993a).
Several soil characteristics influence whether in-situ chemical grout injection will immobilize waste effectively. These characteristics include void volume, which determines how much grout can be injected into the site; soil pore size, which determines the size of the chemical cement particles that can be injected; and permeability of the subsurface materials surrounding the treated mass, which determines whether water will flow preferentially around the solidified mass (EPA, 1993b).
The in-situ method might not be suitable for residential sites because gamma radiation might not be sufficiently reduced, and because maintenance of utilities would be difficult. The in-situ method also might not be suitable if waste masses are thin, discontinuous, and/or at or near the surface. Consideration must also be given to any buried debris such as barrels, scrap metals, timber and boulders that can interfere with the drilling and/or the solidification process. Environmental risks related to drilling through the buried waste exist, especially if liquid-filled drums are pierced and their contents are spilled (ORNL, 1994). The fluid inside the containers might also contain material detrimental to the solidification/stabilization process. If whole drums can be located, removal should be considered to eliminate risk of puncture. For sites with high water table conditions, dewatering would be required prior to application of the in-situ method. At completion, the solidified waste should remain above the water table to reduce the potential for leaching of contaminants.
Thermoplastics might be incompatible with wastes that have combustible chemicals because of the high temperatures (over 100oC) needed for melting. Bitumen is incompatible with some chemicals such as solvents and greases (the resulting treated waste will be too elastic); nitrate, chlorate, and perchlorate salts (which will cause cracking and splitting), and borate salts (which cause quick solidification and potential equipment damage) (ACOE, 1997).
Thermosetting polymers require a chemical polymerization reaction to form a solid product. Interaction with reducing agents (such as reduced metals), complexing agents (such as ethylenediamine-tetraacetic acid), or sorbents (such as carbon filter media) in the waste can interfere with this reaction (EPA, 1997a).
Modified sulfur cements are not appropriate for wastes containing the following constituents: nitrate salts or other oxidizers (since the resulting mix could become reactive), dried ion exchange resins
59
and expanding clays (since introduction of moisture could cause swelling and rupture of the cement) and sulfur-dissolving solvents (EPA, 1997a; ACOE, 1997).
Waste Management Issues
For both ex-situ and in-situ methods, wastes from equipment decontamination and disposable personal protective equipment will be generated. Each method is also likely to generate dust as a part of the process, therefore, dust collection systems should be used when implementing these processes. The captured dust can be introduced back into the solidification process. When volatile organic compounds are present, the mixing process can volatilize as much as 90 percent of these compounds and off-gas capturing and treatment systems should be used to minimize releases to the air (EPA, 1993a; EPA, 1997b).
For ex-situ applications, the excavated and mixed mass can be contained or buried on or off site. The calculation of the final waste disposal volume generated for either on or off site disposal must account for any increase in volume during treatment. For in-situ applications, the solidified/stabilized mass remains in place.
If the waste to be solidified contains any liquid, urea-formaldehyde will generally weep for months, necessitating the use of additional absorbents. The urea-formaldehyde reaction is very acidic (pH 1.5) and is incompatible with metal waste containers (ACOE, 1997).
Operating Characteristics
Exhibit 2-14 summarizes the operating characteristics of chemical solidification/stabilization.
Exhibit 2-14: Operating Characteristics of Chemical Solidification/Stabilization
Characteristic Description
Destruction and Removal Efficiencies Not applicable
Emissions: Gaseous and Particulate Dust can be generated during the process, and dust collection or suppression systems should be used. If volatile organic compounds are present, the mixing process can result in air emissions, and off-gas capture and treatment systems might be necessary. If ammonium ions are present in the waste, reactions with chemical cement may produce ammonia gas (ACOE, 1997). For sulfur cement, limited emissions of sulfur dioxide and hydrogen sulfide will generally be below allowable threshold values (FRTR, 2002a).
60
Exhibit 2-14: Operating Characteristics of Chemical Solidification/Stabilization
Characteristic Description
Reliability The long-term reliability of most chemical stabilizing agents has yet to be fully determined. Bitumen is insoluble in water and resulting solidified wastes have less leaching potential than those produced by cement-based treatment; however, bitumen can be damaged by radiation at a threshold of 1 X 10⁸ to 1 X 10⁹ rads (ACOE, 1997). Sulfur cement waste forms exposed to gamma radiation doses up to 1 X 10⁸ rad do not reveal any significant changes in mechanical integrity (Kalb, 2001b). Polyethylene encapsulated waste has been demonstrated to exceed NRC, EPA, and DOT waste form criteria (FRTR, 2002a). Exposure to radiation doses up to 1 X 10⁸ rad cause increased internal bonding in polyethylene resulting in higher strength and lower leachability (Kalb, 2001a). The effects of radiation on the physical properties of thermosetting polymers are not significant, even at radiation doses of greater than 1 X 10⁹ rads (ACOE, 1997).
Process Time A full-scale demonstration of polyethylene encapsulation of mixed waste by DOE showed the feasibility to process wastes at a rate of 2,000 lb/hour (FRTR, 2002a). The shallow (depth less than 40 feet (12 m)) soil mixing technique for in-situ applications processes 40 - 80 tons per hour on average, and the deep soil mixing technique averages 20 - 50 tons per hour (FRTR, 2002b). In-situ treatment durations typically range from 3 to 6 months (NAVFAC, 2004).
Applicable Media Soils, sediments, sludges, refuse
Pretreatment/Site Requirements A thorough characterization of the waste, including types and concentrations of contaminants, chemical constituents, moisture content and particle size, is necessary to enable proper selection of a polymer solidification/stabilization system. Testing must also be performed to assess the effectiveness of the chemical mix with the contaminant. Since processing temperatures for thermoplastic polymers is over 100oC, residual moisture can form steam in the mixture and result in voids in the solidified waste mass. Therefore, prior to using thermoplastic polymers for solidification/stabilization, the waste should be dried (ACOE, 1997). Polyethylene is more sensitive to residual moisture than modified sulfur cement (EPA, 1997a). For ex-situ treatment, debris and oversized material should be separated from the waste before processing. Waste particle size should be reduced by screening and/or crushing, if necessary, since optimum results are achieved with particle sizes of less than about 1/8 inch (3 mm). Material/ debris of greater than about 2.5 inches (60 mm) can be macroencapsulated (EPA, 1997a). For sites with high water table conditions, dewatering would be required prior to application of the in-situ method.
61
Exhibit 2-14: Operating Characteristics of Chemical Solidification/Stabilization
Characteristic Description
Installation and Operation Requirements
The site must be prepared for the set up of process equipment, tanks, storage areas and decontamination areas. A power supply is usually needed (EPA, 1993a). The treatment process needs to be monitored closely for complete mixing of solidifying agents and wastes and for changes in the characteristics of the waste (EPA, 1997b). The solidified waste should remain above the water table. Completion should include an appropriate cap or cover and site surface water run-on/run-off controls to reduce infiltration of water from the surface. When using bitumen for solidification, a container must be used for support since the resulting waste mass is solid but not rigid (ACOE, 1997).
Post-Treatment Conditions With the in-situ approach or on-site burial, institutional and engineering controls will most likely be required. Ex-situ solidification can facilitate the transportation of off-site disposal of radioactive contaminants with the use of containers, especially where volume reduction or extraction techniques have been applied previously.
Ability to Monitor Effectiveness The level of performance for stabilization processes is measured by the amount of constituents that can be leached from the stabilized material. EPA’s Universal Treatment Standards require leachability for most toxicity characteristic wastes (except metals) to be measured by TCA. Leachability for Toxicity Characteristic metals is measured by the TCLP (EPA, 1997a). For low-level radioactive waste, leachability is measured by the American National Standards Institute/American Nuclear Society Standard 16.1-2003 (ANSI/ANS, 2003).
Performance Data
Performance as measured by EPA Toxicity Characteristic Leaching Procedure testing is generally poor for polymer solidification/stabilization since the test requires the monolithic mass to be ground to a particle size that fits through a 9.5-mm (3/8 in) sieve. This usually disrupts the encapsulation of the waste and exposes wastes to leaching during the test. A modified preparation procedure was developed by the State of Utah for use at the Envirocare of Utah facility that uses encapsulated waste pellets that fit through the 9.5-mm (3/8 in) sieve (Kalb, 2001a). For measurement of radionuclide leaching, the Nuclear Regulatory Commission recommends the ANSI/ANS 16.1 testing procedure (ANSI/ANS, 2003).
Thermoplastic polymers such as polyethylene and sulfur cement and several thermosetting polymers have shown the ability to withstand degradation from saturated soil conditions, freeze-thaw cycling, microbial activity, and high radiation environments (EPA, 1997a).
Leaching tests on polyethylene encapsulated wastes using the ANSI/ANS 16.1 protocol (ANSI/ANS, 2003) yielded results that were between two and five orders of magnitude better than the minimum leach index recommended by the NRC (Kalb, 2001a). Compressive strengths of polyethylene-encapsulated wastes typically range from 1,000 to 2,500 psi (Kalb, 2001a).
Sulfur cements are stable and resistant to extremely harsh environments and chemical attack. Modified sulfur cements can achieve strengths of about twice the strength of Portland cements and achieve full strength in a matter of hours rather than weeks as required by hydraulic cements
62
(ACOE, 1997). Compressive strengths for modified sulfur cement encapsulated wastes typically range from 2,000 to 5,000 psi (Kalb, 2001b). Leaching of cobalt-60 and cesium-137 from sulfur cement solidified radioactive waste yielded results that were over four orders of magnitude better than the NRC-recommended minimum leach index (Kalb, 2001b).
Wastes solidified with thermosetting polymers have achieved unconfined compressive strengths of up to 7,000 psi and permeabilities of less than 1 X 10-11 cm/sec (EPA, 1997; Heiser and Milian, 1994). Thermosetting polyacrylamide grout was used at Oak Ridge National Laboratory for in-situ solidification/stabilization of radioactive solid waste burial trenches in order to reduce permeabilities from approximately 1 X 10⁻² cm/sec to less than 1 X 10⁻⁶ cm/sec (IAEA, 1997).
Modified sulfur cements have been pilot-tested for solidification of mercury-contaminated mixed waste at Brookhaven National Laboratory and leach testing (ANSI/ANS 16.1) indicated leach rates of 11 to 12 orders of magnitude better than the NRC-recommended minimum leach index (Kalb, et al., 2001b).
Envirocare of Utah has is permitted by the State of Utah to use a polyethylene encapsulation method developed at Brookhaven National Laboratory for the treatment of radioactively contaminated lead and lead mixed waste. Between 1996 and 1998, the facility treated approximately 500,000 lb of radioactive waste using this process (DOE, 1998).
Capital and Operating Costs
For ex-situ processes, approximate overall capital (installation) costs are under $100 per ton, including excavation (FRTR, 2002a). This cost does not include off-site transportation and disposal costs. Ex-situ treatment of drummed waste has been reported as high as $512 per cubic yard ($670 per cubic meter) (EPA, 1995).
Installation costs for in-situ soil mixing/auger techniques average $40 - $60 per cubic yard ($52 to $78 per cubic meter) for shallow applications up to a depth of 40 feet (12 m) and $150 - $250 per cubic yard ($196 to $327 per cubic meter) for deeper applications. Grout injection techniques include costs for drilling of $50 to $150 per foot ($164 to $492 per meter) and costs for grouting of $50 to $75 per foot ($164 to $246 per meter). These costs do not include mobilization, wash disposal, or adverse site condition expenses (FRTR, 2002b).
In general, equipment, labor, and power costs for using thermoplastic polymer solidification/stabilization methods will be considerably higher than those for cement-based methods (ACOE, 1997). Modified sulfur cement solidified waste can be produced at a cost of about $0.17 per pound (ACOE, 1997).
Thermosetting polymers are generally much more expensive than hydraulic cements (ACOE, 1997). The cost of some epoxies can be as high as $6.50 per pound (EPA, 1997a).
Costs for disposal of radioactively contaminated lead and lead mixed waste using polyethylene macroencapsulation at the Envirocare of Utah facility range between $90 and $100 per cubic foot ($3,180 to $3,530 per cubic meter)(DOE, 1998).
There would be no operation and maintenance costs after completion of installation for an ex-situ treatment site with off site disposal. For ex-situ treatment sites with on-site disposal and for in-situ treatment sites, operations and maintenance costs would include ground water monitoring and inspection, repair and maintenance of cover systems and run-on/run-off controls.
63
Commercial Availability
Ex-situ solidification/stabilization is a mature technology that is offered by many vendors in the United States. In-situ technology is less mature, but has been successfully demonstrated and applied at several radioactive waste sites.
Most polymers that have been considered or used for waste encapsulation are commercially available.
Contact Information
General Contacts:
EPA National Risk Management Research Laboratory (NRMRL)
Ed Barth 26 West Martin Luther King Drive Cincinnati, OH 45268 (513) 569-7669 [email protected]
DOE Office of Science and Technology William Owca DOE-Idaho (208) 526-1983 [email protected]
Brookhaven National Laboratory Paul Kalb P.O. Box 5000 Upton, NY 11973 (631) 344-7644 [email protected]
Vendors:
This is a partial listing of available vendors. Additional and updated vendor information can be obtained from the EPA Remediation and Characterization Technologies website: http://www.epareachit.org/, the EPA Cleanup Information website: http://clu-in.org, and by contacting the federal agency contact listed above.
Key to methods listed by vendor: ES = ex-situ, PE = polyethylene encapsulation, ISCG = in-situ chemical grouting, ISCM = in-situ chemical soil mixing
Envirocare Facility (PE) Envirocare of Utah Inc. 605 North 5600 West Salt Lake City, UT 84116 (801) 532-1330 http://www.envirocareutah.com
Hayward Baker (ISCM, ISCG) 1130 Annapolis Road, Suite 202 Odenton, MD 21113-1635 (410) 551-8200 http://www.haywardbaker.com
64
Moore & Taber Geotechnical Constructors (ISCG)
1290 North Hancock Street Suite 102 Anaheim, CA 92807 (714) 779-0681 http://www.mooreandtaber.com
Rembco Geotechnical Contractors (ISCG) P.O. Box 23009 Knoxville, TN 37933-1009 (865) 671-2925 http://www.rembco.com
Remedial Construction Services (ES, ISCM, ISCG)
9720 Derrington Houston, TX 77064 (281) 955-2442 http://www.recon-net.com
Chemical Solidification/Stabilization References
American National Standards Institute/American Nuclear Society. Measurement of the Leachability of Solidified Low-Level Radioactive Waste by a Short-Term Procedure, 2003. ANSI/ANS 16.1-2003.
Federal Remediation Technologies Roundtable. Remediation Technologies Screening Matrix and Reference Guide, Version 4.0: Solidification/Stabilization (Ex-Situ), 2002a. http://www.frtr.gov/matrix2/section4/4-21.html
Federal Remediation Technologies Roundtable. Remediation Technologies Screening Matrix and Reference Guide, Version 4.0: Solidification/Stabilization (In-Situ), 2002b. http://www.frtr.gov/matrix2/section4/4-8.html
Heiser, J. and Milian, L. Laboratory Evaluation of Performance and Durability of Polymer Grouts for Subsurface Hydraulic/Diffusion Barriers. Brookhaven National Laboratory, Upton, N.Y., 1994. BNL-61292.
International Atomic Energy Agency. Technologies for In-Situ Immobilization and Isolation of Radioactive Wastes at Disposal and Contaminated Sites, 1997. IAEA-TECDOC-972.
Kalb, P. “Polyethylene Encapsulation.” Hazardous and Radioactive Waste Treatment Technologies Handbook, Oh, C., Ed. CRC Press, Boca Raton, Fla., 2001a. BNL-68581.
Kalb, P. “Sulfur Polymer Encapsulation.” Hazardous and Radioactive Waste Treatment Technologies Handbook, Oh, C., Ed. CRC Press, Boca Raton, Fla., 2001b. BNL-68585.
Kalb, P., Adams, J., and Milian, L. Sulfur Polymer Stabilization/Solidification (SPSS) Treatment of Mixed-Waste Mercury Recovered from Environmental Restoration Activities at BNL. Brookhaven National Laboratory, Upton, N.Y., 2001 BNL-52614.
Oak Ridge National Laboratory. Y-12 Plant Remedial Action Technology Logic Diagram, Volume 3, Technology Evaluation Data Sheets, Part A, Remedial Action, 1994. Y/ER-161/V3/PtA.
U.S. Army Corps of Engineers. Guidance for Low-Level Radioactive Waste (LLRW) and Mixed Waste (MW) Treatment and Handling, 1997. EM-1110-1-4002.
65
U.S. Department of Energy. Innovative Technology Summary Report: Polyethylene Macroencapsulation, 1998. OST Reference # 30.
U.S. Environmental Protection Agency. Innovative Site Remediation Technology, Design & Application, Volume 4: Stabilization/Solidification, 1997a. EPA/542/B-97/007.
U.S. Environmental Protection Agency. Best Management Practices (BMPs) for Soil Treatment Technologies: Suggested Operational Guidelines to Prevent Cross-media Transfer of Contaminants During Clean-Up Activities, 1997b. EPA/530/R-97/007.
U.S. Environmental Protection Agency. Contaminants and Remedial Options at Selected Metal-Contaminated Sites, 1995. EPA/540/R-95/512.
U.S. Environmental Protection Agency. Innovative Site Remediation Technology, Volume 4: Stabilization/Solidification, 1994. EPA/542/B-94/001.
U.S. Environmental Protection Agency. Engineering Bulletin: Solidification/Stabilization of Organics and Inorganics, 1993. EPA/540/S-92/015.
U.S. Naval Facilities Engineering Command. Naval Facilities Engineering Service Center, Port Hueneme, Environmental Restoration & BRAC Website, Technology Pages: Solidification/ Stabilization (In-Situ), 2004. http://enviro.nfesc.navy.mil/erb
2.3 CHEMICAL SEPARATION TECHNOLOGIES
Chemical separation, involving the use of solvent/chemical extraction, separates and concentrates radioactive contaminants from soil. The process residuals require further treatment, storage, or disposal. Radionuclide contaminants can be extracted by using inorganic salts, mineral acids, complexing agents, or organic solvents. There are notable differences in the extractability rates of each agent due to the types and concentrations of contaminants as well as varying conditions within the method. The implementability of this technology is controlled by site-specific factors and its applicability must be determined on a site-by-site basis.
2.3.1 Solvent/Chemical Extraction
Description
Solvent/chemical extraction is an ex-situ chemical separation technology that separates hazardous contaminants from soils, sludges, and sediments to reduce the volume of hazardous waste that must be treated. Solvent/chemical extraction involves excavating and transferring soil to equipment that mixes the soil with a solvent. Use of water alone as the solvent is referred to as soil washing (see Section 2.4.2).
The solvent/chemical extraction equipment can handle contaminated soil either in batches, for dry soil, or as a continuous flow, for pumpable waste. When the hazardous contaminants have been sufficiently extracted, the solvent is separated from the soil and is either distilled in an evaporator or column or removed from the leachate by precipitation. Distilled vapor consists of relatively pure solvent that is recycled into the extraction process; the liquid residue, which contains concentrated contaminants, undergoes further treatment or disposal (see Exhibit 2-15). If the contaminants are precipitated, the sludge is dried with a filter press. While not all radionuclides and solvent will be removed from the contaminated soil, if it is sufficiently clean it can be returned to its original location. Otherwise, it might require separate storage or disposal.
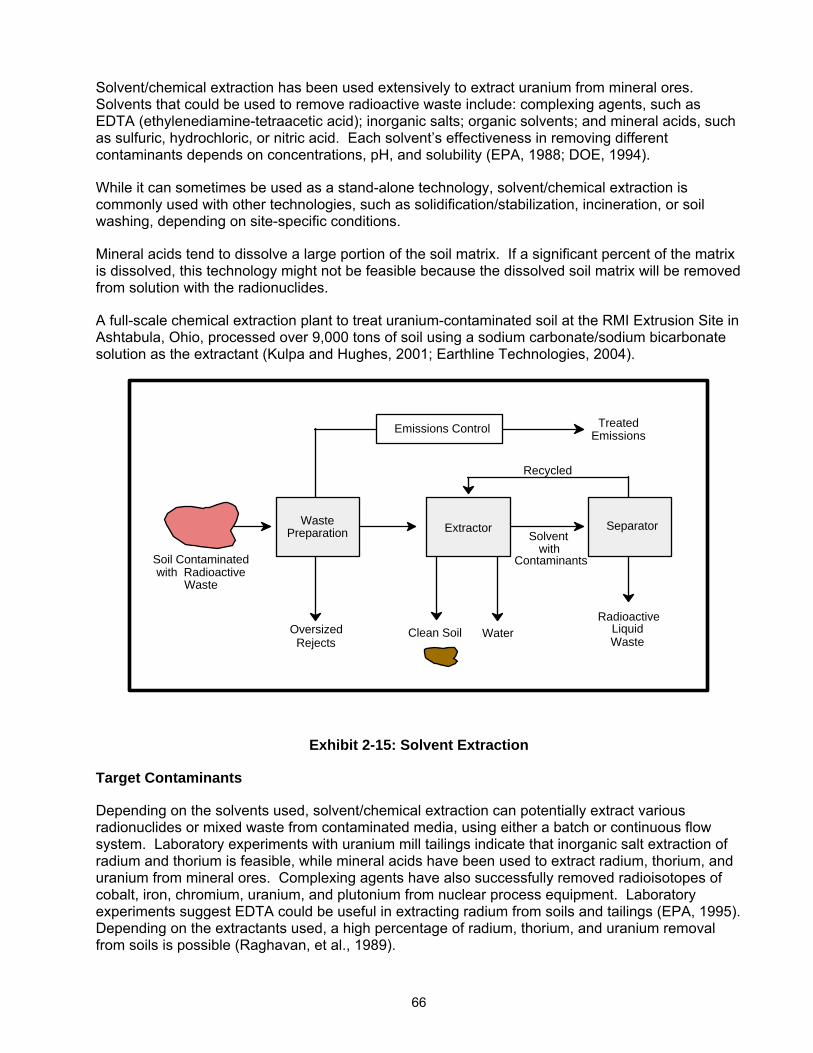
66
Solvent/chemical extraction has been used extensively to extract uranium from mineral ores. Solvents that could be used to remove radioactive waste include: complexing agents, such as EDTA (ethylenediamine-tetraacetic acid); inorganic salts; organic solvents; and mineral acids, such as sulfuric, hydrochloric, or nitric acid. Each solvent’s effectiveness in removing different contaminants depends on concentrations, pH, and solubility (EPA, 1988; DOE, 1994).
While it can sometimes be used as a stand-alone technology, solvent/chemical extraction is commonly used with other technologies, such as solidification/stabilization, incineration, or soil washing, depending on site-specific conditions.
Mineral acids tend to dissolve a large portion of the soil matrix. If a significant percent of the matrix is dissolved, this technology might not be feasible because the dissolved soil matrix will be removed from solution with the radionuclides.
A full-scale chemical extraction plant to treat uranium-contaminated soil at the RMI Extrusion Site in Ashtabula, Ohio, processed over 9,000 tons of soil using a sodium carbonate/sodium bicarbonate solution as the extractant (Kulpa and Hughes, 2001; Earthline Technologies, 2004).
Soil Contaminated with Radioactive
Waste
Waste Preparation Extractor Separator
Emissions Control Treated Emissions
LiquidClean Soil WaterOversized
Recycled
with Contaminants
Radioactive
Solvent
Rejects Waste
Exhibit 2-15: Solvent Extraction
Target Contaminants
Depending on the solvents used, solvent/chemical extraction can potentially extract various radionuclides or mixed waste from contaminated media, using either a batch or continuous flow system. Laboratory experiments with uranium mill tailings indicate that inorganic salt extraction of radium and thorium is feasible, while mineral acids have been used to extract radium, thorium, and uranium from mineral ores. Complexing agents have also successfully removed radioisotopes of cobalt, iron, chromium, uranium, and plutonium from nuclear process equipment. Laboratory experiments suggest EDTA could be useful in extracting radium from soils and tailings (EPA, 1995). Depending on the extractants used, a high percentage of radium, thorium, and uranium removal from soils is possible (Raghavan, et al., 1989).
67
Pilot-scale and full-scale applications of chemical extraction of uranium from soils using carbonate solutions show good results with high removal efficiencies (LANL, 2003; Kulpa and Hughes, 2001). Pilot-scale studies of chemical extraction of cobalt-60 and cesium-137 from sediments using hot nitric acid showed excellent removal efficiencies for cobalt-60 but were less efficient for cesium-137 since successive dissolution steps were required which also dissolved about 30 percent of the soil matrix (FRTR, 1993). Pilot-scale testing of chemical extraction of cobalt, cesium and uranium at DOE’s Hanford Site showed high removal efficiencies (Porter, et al., 1997). A field demonstration project involving treatment of 1,000 tons of soil from an Army Corps of Engineers site in Maywood, N.J. contaminated with radium-226 and thorium-232 showed removals of 60 to 67 percent and 73 to 76 percent, respectively (ART Engineering, 2004).
Solvent/chemical extraction has effectively treated sediments, soils, and sludges containing such organic contaminants as PCBs, volatile organic compounds, halogenated solvents, and petroleum waste, as well as organically bound metals. This technology has also been effective commercially in treating media containing heavy metals (FRTR, 2002).
Applicable Site Characteristics
Soil properties such as particle size, pH, partition coefficient, cation exchange capacity, organic content, moisture content, and contaminant concentrations and solubilities are factors that could affect the efficiency and the operability of solvent/chemical extraction (FRTR, 2002). Careful bench-scale testing is encouraged. Soils with high clay, silt, or organic content might cause dewatering problems in the contaminated waste stream; chemical extraction is not practical for soil with more than 6.7 percent organic material (humus) (EPA, 1995).
Equipment and facilities are needed to perform the solvent/chemical extraction process and to store waste residuals. Whether the soil can be returned to the site with no further treatment will depend on cleanup requirements. Facility and process costs vary significantly depending on the pretreatment, extraction, and post-treatment required.
Interference from thorium could limit the application of EDTA in removing radium when both radionuclides are present (EPA, 1995).
Waste Management Issues
The process liquid residue containing concentrated waste must undergo further treatment, storage, or disposal. Treated soils that do not meet cleanup requirements must be treated further, stored, or disposed of.
Operating Characteristics
Exhibit 2-16 summarizes the operating characteristics of solvent/chemical extraction.
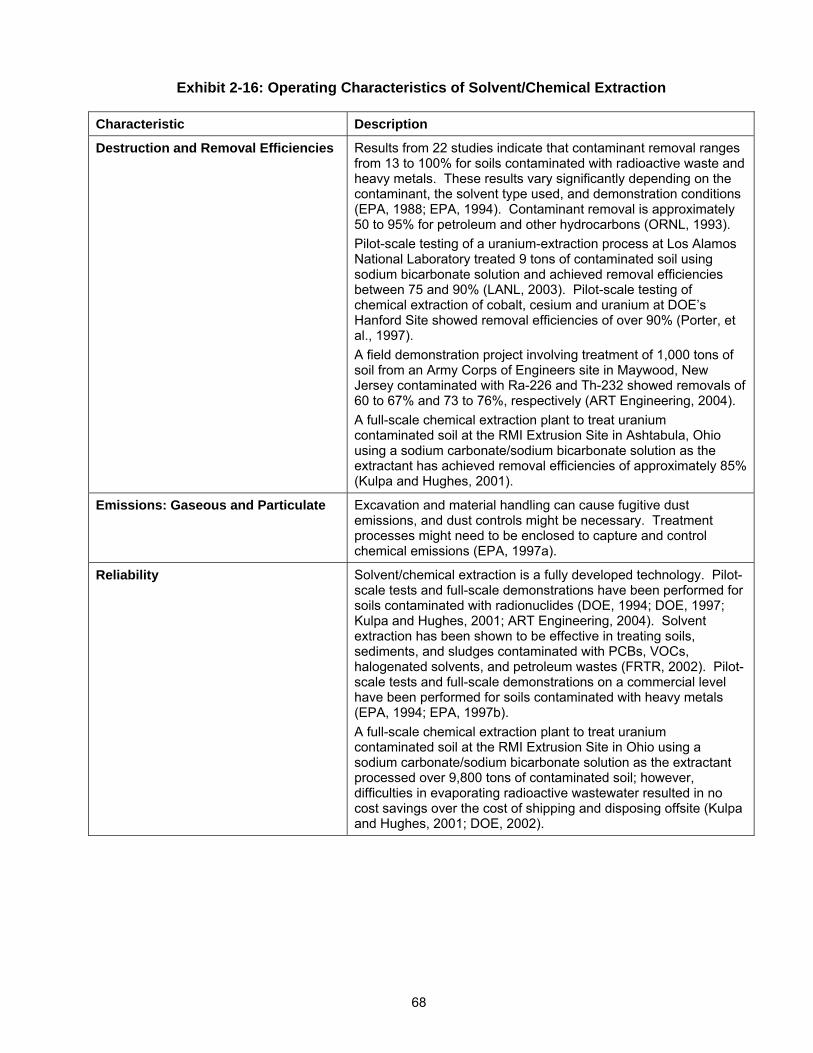
68
Exhibit 2-16: Operating Characteristics of Solvent/Chemical Extraction
Characteristic Description
Destruction and Removal Efficiencies Results from 22 studies indicate that contaminant removal ranges from 13 to 100% for soils contaminated with radioactive waste and heavy metals. These results vary significantly depending on the contaminant, the solvent type used, and demonstration conditions (EPA, 1988; EPA, 1994). Contaminant removal is approximately 50 to 95% for petroleum and other hydrocarbons (ORNL, 1993). Pilot-scale testing of a uranium-extraction process at Los Alamos National Laboratory treated 9 tons of contaminated soil using sodium bicarbonate solution and achieved removal efficiencies between 75 and 90% (LANL, 2003). Pilot-scale testing of chemical extraction of cobalt, cesium and uranium at DOE’s Hanford Site showed removal efficiencies of over 90% (Porter, et al., 1997). A field demonstration project involving treatment of 1,000 tons of soil from an Army Corps of Engineers site in Maywood, New Jersey contaminated with Ra-226 and Th-232 showed removals of 60 to 67% and 73 to 76%, respectively (ART Engineering, 2004). A full-scale chemical extraction plant to treat uranium contaminated soil at the RMI Extrusion Site in Ashtabula, Ohio using a sodium carbonate/sodium bicarbonate solution as the extractant has achieved removal efficiencies of approximately 85% (Kulpa and Hughes, 2001).
Emissions: Gaseous and Particulate Excavation and material handling can cause fugitive dust emissions, and dust controls might be necessary. Treatment processes might need to be enclosed to capture and control chemical emissions (EPA, 1997a).
Reliability Solvent/chemical extraction is a fully developed technology. Pilot-scale tests and full-scale demonstrations have been performed for soils contaminated with radionuclides (DOE, 1994; DOE, 1997; Kulpa and Hughes, 2001; ART Engineering, 2004). Solvent extraction has been shown to be effective in treating soils, sediments, and sludges contaminated with PCBs, VOCs, halogenated solvents, and petroleum wastes (FRTR, 2002). Pilot-scale tests and full-scale demonstrations on a commercial level have been performed for soils contaminated with heavy metals (EPA, 1994; EPA, 1997b). A full-scale chemical extraction plant to treat uranium contaminated soil at the RMI Extrusion Site in Ohio using a sodium carbonate/sodium bicarbonate solution as the extractant processed over 9,800 tons of contaminated soil; however, difficulties in evaporating radioactive wastewater resulted in no cost savings over the cost of shipping and disposing offsite (Kulpa and Hughes, 2001; DOE, 2002).
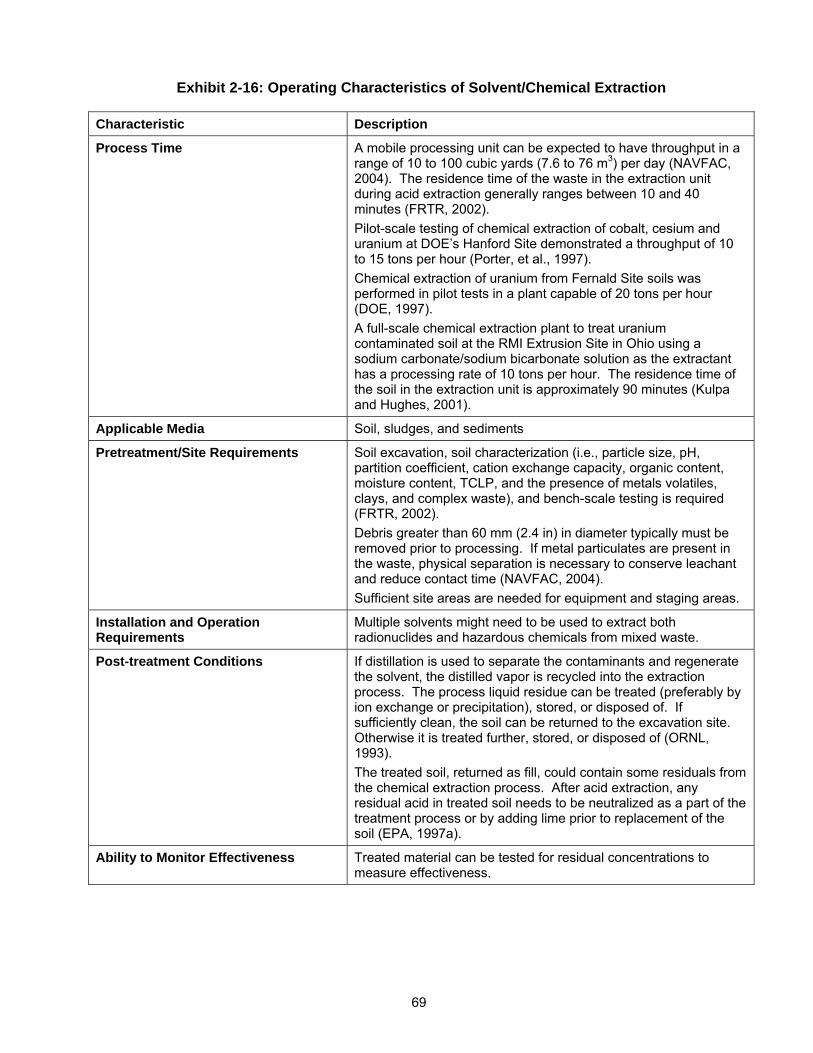
69
Exhibit 2-16: Operating Characteristics of Solvent/Chemical Extraction
Characteristic Description
Process Time A mobile processing unit can be expected to have throughput in a range of 10 to 100 cubic yards (7.6 to 76 m3) per day (NAVFAC, 2004). The residence time of the waste in the extraction unit during acid extraction generally ranges between 10 and 40 minutes (FRTR, 2002). Pilot-scale testing of chemical extraction of cobalt, cesium and uranium at DOE’s Hanford Site demonstrated a throughput of 10 to 15 tons per hour (Porter, et al., 1997). Chemical extraction of uranium from Fernald Site soils was performed in pilot tests in a plant capable of 20 tons per hour (DOE, 1997). A full-scale chemical extraction plant to treat uranium contaminated soil at the RMI Extrusion Site in Ohio using a sodium carbonate/sodium bicarbonate solution as the extractant has a processing rate of 10 tons per hour. The residence time of the soil in the extraction unit is approximately 90 minutes (Kulpa and Hughes, 2001).
Applicable Media Soil, sludges, and sediments
Pretreatment/Site Requirements Soil excavation, soil characterization (i.e., particle size, pH, partition coefficient, cation exchange capacity, organic content, moisture content, TCLP, and the presence of metals volatiles, clays, and complex waste), and bench-scale testing is required (FRTR, 2002). Debris greater than 60 mm (2.4 in) in diameter typically must be removed prior to processing. If metal particulates are present in the waste, physical separation is necessary to conserve leachant and reduce contact time (NAVFAC, 2004). Sufficient site areas are needed for equipment and staging areas.
Installation and Operation Requirements
Multiple solvents might need to be used to extract both radionuclides and hazardous chemicals from mixed waste.
Post-treatment Conditions If distillation is used to separate the contaminants and regenerate the solvent, the distilled vapor is recycled into the extraction process. The process liquid residue can be treated (preferably by ion exchange or precipitation), stored, or disposed of. If sufficiently clean, the soil can be returned to the excavation site. Otherwise it is treated further, stored, or disposed of (ORNL, 1993). The treated soil, returned as fill, could contain some residuals from the chemical extraction process. After acid extraction, any residual acid in treated soil needs to be neutralized as a part of the treatment process or by adding lime prior to replacement of the soil (EPA, 1997a).
Ability to Monitor Effectiveness Treated material can be tested for residual concentrations to measure effectiveness.
70
Performance Data
Since contaminants are removed from soil, this technology is very effective in the long-term. Some soil types and moisture content levels will adversely impact process performance.
DOE performed bench-scale and pilot-scale chemical leaching of soils from the Fernald Site contaminated with uranium and was able to remediate the soils below a target value of 35 pCi/g (DOE, 1997). As a part of the same project, Atomic Energy of Canada Limited used dilute acid to mobilize strontium-90 for recovery in an in-situ field test (DOE, 1997).
Chemical extraction pilot-scale testing of removal of uranium-235, uranium-238, cesium-137 and cobalt-60 at DOE’s Hanford Facility treated 380 tons of contaminated soil and achieved greater than a 90 percent reduction of the contaminants by weight and met all specified test performance standards for contaminant concentrations (ART Engineering, 2004). Pilot-scale testing of a uranium-extraction process at Los Alamos National Laboratory treated nine tons of contaminated soil using sodium bicarbonate solution and achieved removal efficiencies between 75 and 90 percent (LANL, 2003).
A full-scale chemical extraction plant to treat uranium contaminated soil at the RMI Extrusion Site in Ashtabula, Ohio using a 0.2M sodium carbonate/sodium bicarbonate solution as the extractant achieved removal efficiencies of 85% with volume reductions in excess of 90% and has reduced over 9,000 tons of soil with average uranium contamination levels of about 100 pCi/gm to levels below the target of 30 pCi/gm (Kulpa and Hughes, 2001).
Capital and Operating Costs
Medium to high capital and operating and maintenance costs are associated with this technology. Facility and process cost estimates can vary significantly depending on the volume of soil treated, types of extractants, amount of required post-treatment of extractant for contaminant separation and extractant regeneration, disposal of extractant if regeneration is not possible, post-treatment of residuals in soils and disposal of extracted contaminant solids. Costs are lower if physical separation is used to remove “clean” soil fractions prior to solvent extraction. A multiple-stage extraction process would add to the capital and operating costs. Operating and maintenance costs are also associated with storing of the treatment process waste.
Estimated costs for nitric acid extraction of cobalt-60 and cesium-137 from sediment after pilot-scale testing at Idaho National Engineering and Environmental Laboratory was about $1,000 per cubic yard ($1,300 m3) (FRTR, 1993). This cost included several sequential dissolution steps for cesium-137 and final polishing by ion exchange, reverse osmosis, precipitation, or evaporation.
Chemical extraction of uranium from Fernald Site soils using dilute sulphuric acid was estimated to cost $340 per ton of treated soil including leaching and leachate treatment and assumed reuse of recovered uranium (AECL, 1996).
Chemical extraction of uranium from soil at the RMI Extrusion Site in Ohio using a sodium carbonate/sodium bicarbonate solution was performed at a price of $565 per ton. This price included excavation, extraction, removal of the uranium from the leachate solution by ion exchange, regeneration of the ion exchange resin, recovery of the uranium by precipitation after addition of acid, dewatering of the resulting uranium peroxide “yellow cake”, containment in drums, off-site disposal of the “yellow cake” at a low-level waste landfill and site restoration (DOE, 1998; Kulpa and Hughes, 2001). This price does not include costs associated with problems with the generation and evaporation of higher than expected amounts of radioactive wastewater, which have added about $115 per ton to the total cost (DOE, 2002).
71
Commercial Availability
Solvent/chemical extraction is an established technology. Contractors and equipment are readily available in the United States. Contact information for some of the vendors of solvent/chemical extraction technology is included in the following subsection.
Contact Information
General Contacts:
EPA National Risk Management Research Laboratory
Richard Griffiths 26 West Martin Luther King Drive Cincinnati, OH 45268 (513) 569-7832 [email protected]
National Energy Technology Laboratory (Chemical extraction of Uranium from soils)
Jagdish Malhotra DOE Project Manager 3610 Collins Ferry Road Morgantown, WV 26507 (304) 285-4053 [email protected]
Los Alamos National Laboratory (Uranium extraction using sodium bicarbonate, Containerized Vat Leach System)
David Janecky Los Alamos National Laboratory Los Alamos, NM 87545 (505) 665-0253 [email protected]
Vendors:
This is a partial listing of available vendors. Additional and updated vendor information can be obtained from the EPA Remediation and Characterization Technologies website: http://www.epareachit.org/, the EPA Cleanup Information website: http://clu-in.org, and by contacting the federal agency contacts listed above.
ART Engineering LLC 12526 Leatherleaf Drive Tampa, FL 33626 (813) 855-9852 http://www.art-engineering.com
Bergmann USA 1550 Airport Road Gallatin, TN 37066 (615) 452-5500
Earthline Technologies Inc. 1800 E. 21st Street Ashtabula, OH 44004 (800) 991-7038
72
Solvent-Chemical Extraction References
ART Engineering. Soil Radionuclide (-s) Separation Pilot Study, Hanford Project: Separation of Radionuclides Uranium, Thorium, Cesium. Vendor Website, 2004. http://www/art-engineering.com
Atomic Energy of Canada Ltd. Soil Treatment to Remove Uranium and Related Mixed Radioactive Contaminants, Final Report, September 1992 – October 1995. Prepared for the U.S. Department of Energy, 1996. DOE/MC/28245—5291.
Earthline Technologies. Soil Washing and Soil Remediation. Vendor Website, 2004. http://www.earthlinetech.com
Federal Remediation Technologies Roundtable. Remediation Technologies Screening Matrix and Reference Guide, Version 4.0: Chemical Extraction, 2002. http://www.frtr.gov/matrix2/section4/4-15.html
Federal Remediation Technologies Roundtable. “Physical Separation/Chemical Extraction, Radionuclides and Metals in Sediments.” Synopses of Federal Demonstrations of Innovative Site Remediation Technologies, Third Edition, 1993. EPA/542/B-93/009.
Kulpa, J. and Hughes, H. “Deployment of Chemical Extraction Soil Treatment on Uranium Contaminated Soil.” Presented at: The Annual International Conference on Soils, Sediments and Water, University of Massachusetts, Amherst, Massachusetts, October, 2001.
Los Alamos National Laboratory. Los Alamos National Laboratory, Environmental Science and Technology Program, Environmental Problem-Solving Through Science and Technology Website: Remediation of Uranium Contaminated Soils, 2003. http://www-emtd.lanl.gov/TD/Remediation/RemediationOfUraniumSoils.html
Oak Ridge National Laboratory. Oak Ridge National Laboratory Technology Logic Diagrams, Volume 3, Technology Evaluation Data Sheets, Part B, Dismantlement - Remedial Action, 1993. ORNL/M-2751/V3/Pt.B.
Porter,R., Hamby, D. and Martin, J. Treatment Methods and Comparative Risks of Thorium Removal from Waste Residues. Prepared for the Department of Energy, Office of Environmental Management, 1997. DOE/EW/00001—T2-Pt.1.
Raghavan, R., Wolf, G. and Williams, D. “Technologies Applicable for the Remediation of Contaminated Soil at Superfund Radiation Sites.” Proceedings of the Third International Conference of New Frontiers for Hazardous Waste Management, Pittsburgh, Pa., September 10-13, 1989. EPA/600/9-89/072.
U.S. Department of Energy. Audit Report: Soil Washing at the Ashtabula Environmental Management Project. Office of Inspector General, January 2002. DOE/IG-0542.
U.S. Department of Energy. Cost and Performance Report, Chemical Extraction for Uranium Contaminated Soil, RMI Titanium Company Extrusion Plant, Ashtabula, Ohio. Innovative Treatment Remediation Demonstration. U.S. DOE, July 1998.
U.S. Department of Energy. Technology Development Data Sheet: Soil Treatment to Remove Uranium and Related Mixed Radioactive Heavy Metal Contamination. Federal Energy Technology Center, October 1997.
73
U.S. Department of Energy. Effective Separation and Processing Integrated Program (ESP-IP), 1994. DOE/EM-0126P.
U.S. Environmental Protection Agency. Technological Approaches to the Cleanup of Radiologically Contaminated Superfund Sites, 1998. EPA/540/2-88/002.
U.S. Environmental Protection Agency. Best Management Practices (BMPs) for Soil Treatment Technologies: Suggested Operational Guidelines to Prevent Cross-media Transfer of Contaminants During Clean-Up Activities, 1997a. EPA/530/R-97/007.
U.S. Environmental Protection Agency. Engineering Bulletin: Technology Alternatives for the Remediation of Soil Contaminated with As, Cd, Cr, Hg, and Pb, 1997b. EPA/540/S-97/500.
U.S. Environmental Protection Agency. Background Information Document for Radiation Site Cleanup Proposed Rule, Revised Draft, August 1995.
U.S. Environmental Protection Agency. Emerging Technology Summary: Acid Extraction Treatment System for Treatment of Metal Contaminated Soils, 1994. EPS/540/SR-94/513.
U.S. Naval Facilities Engineering Command. Naval Facilities Engineering Service Center, Port Hueneme, Environmental Restoration & BRAC Website, Technology Pages: Chemical Leaching, 2004. http://enviro.nfesc.navy.mil/erb
2.4 PHYSICAL SEPARATION TECHNOLOGIES
Physical separation technologies are a class of treatment in which radionuclide contaminated media are separated into clean and contaminated fractions by taking advantage of the contaminants’ physical properties. These technologies work on the principle that radionuclides are associated with particular fractions of the media, which can be separated based on their size and other physical attributes. In solid media (i.e. soil, sediment), most radioactive contaminants are associated with smaller particles, known as soil fines (clays and silts). Radionuclides in liquid media are either solvated by the liquid media (i.e., one molecule of the radionuclide surrounded by many molecules of the liquid) or are present as microscopic particles suspended in the solution. Physical separation of the contaminated media into clean and contaminated fractions reduces the volume of contaminated media requiring further treatment and/or disposal.
Physical separation technologies can be applied to a variety of solid and liquid media, including soil, sediment, sludge, groundwater, surface water, and debris. In addition to treating radionuclides, physical separation technologies can be used to treat semivolatile organic compounds, oils, PCBs, and heavy metals.
The profiles in this section address the following physical separation technologies: dry soil separation, soil washing, and column and centrifugal flotation.
2.4.1 Dry Soil Separation
Description
Dry soil separation separates radioactive particles from clean soil particles. The simplest application involves screening and sieving soils to separate finer fractions (silt and clay) from coarser fractions of the soil. Since most contaminants tend to bind, either chemically or physically, to the fine fraction of a soil, separating the finer portion of the soil can concentrate the contaminants into a smaller volume of soil for treatment or disposal (FRTR, 2002).
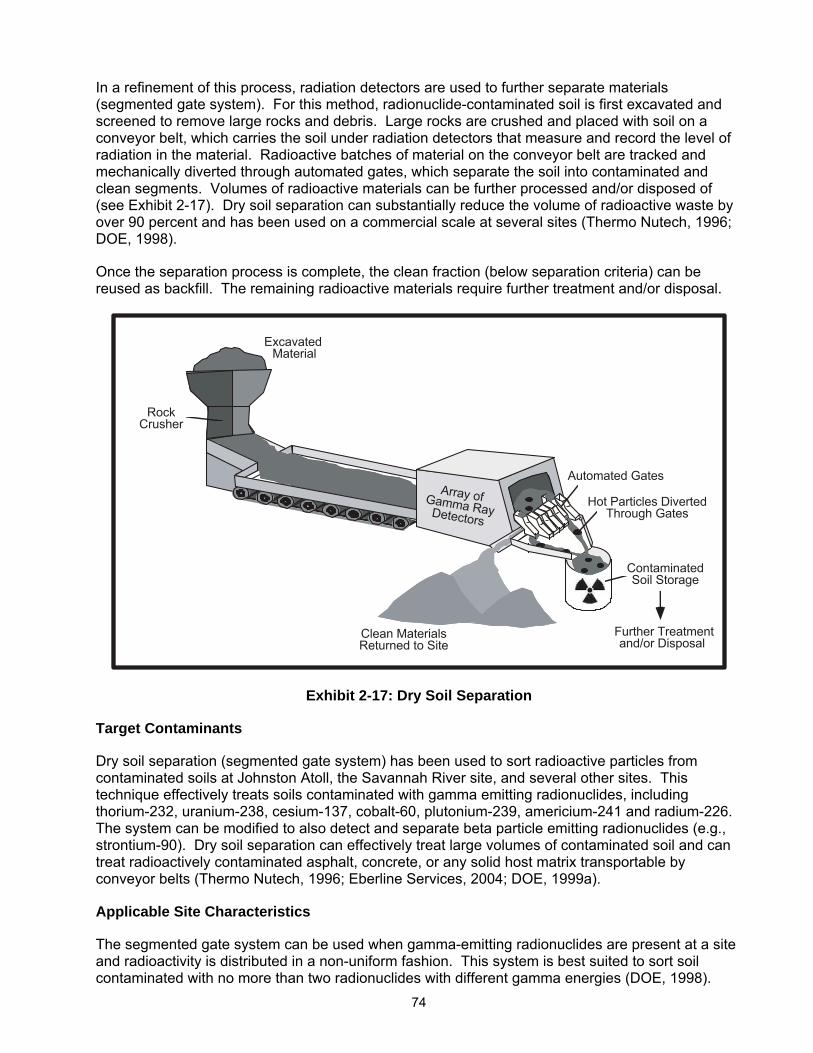
74
In a refinement of this process, radiation detectors are used to further separate materials (segmented gate system). For this method, radionuclide-contaminated soil is first excavated and screened to remove large rocks and debris. Large rocks are crushed and placed with soil on a conveyor belt, which carries the soil under radiation detectors that measure and record the level of radiation in the material. Radioactive batches of material on the conveyor belt are tracked and mechanically diverted through automated gates, which separate the soil into contaminated and clean segments. Volumes of radioactive materials can be further processed and/or disposed of (see Exhibit 2-17). Dry soil separation can substantially reduce the volume of radioactive waste by over 90 percent and has been used on a commercial scale at several sites (Thermo Nutech, 1996; DOE, 1998).
Once the separation process is complete, the clean fraction (below separation criteria) can be reused as backfill. The remaining radioactive materials require further treatment and/or disposal.
Material����Excavated���
Crusher���Rock���
Returned to Site���Clean Materials���
Through Gates���Hot Particles Diverted���
Soil Storage���Contaminated���
Automated Gates���
Gamma Ray���
Array of���
Detectors���
and/or Disposal��Further Treatment��
Exhibit 2-17: Dry Soil Separation
Target Contaminants
Dry soil separation (segmented gate system) has been used to sort radioactive particles from contaminated soils at Johnston Atoll, the Savannah River site, and several other sites. This technique effectively treats soils contaminated with gamma emitting radionuclides, including thorium-232, uranium-238, cesium-137, cobalt-60, plutonium-239, americium-241 and radium-226. The system can be modified to also detect and separate beta particle emitting radionuclides (e.g., strontium-90). Dry soil separation can effectively treat large volumes of contaminated soil and can treat radioactively contaminated asphalt, concrete, or any solid host matrix transportable by conveyor belts (Thermo Nutech, 1996; Eberline Services, 2004; DOE, 1999a).
Applicable Site Characteristics
The segmented gate system can be used when gamma-emitting radionuclides are present at a site and radioactivity is distributed in a non-uniform fashion. This system is best suited to sort soil contaminated with no more than two radionuclides with different gamma energies (DOE, 1998).
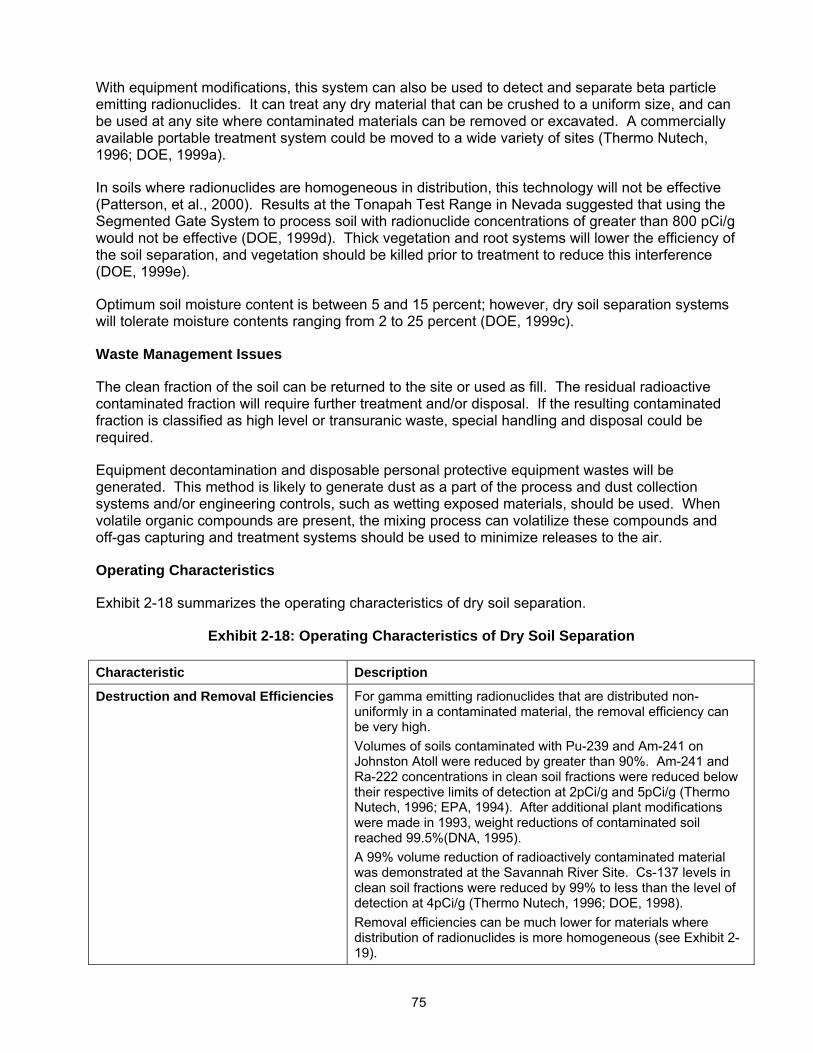
75
With equipment modifications, this system can also be used to detect and separate beta particle emitting radionuclides. It can treat any dry material that can be crushed to a uniform size, and can be used at any site where contaminated materials can be removed or excavated. A commercially available portable treatment system could be moved to a wide variety of sites (Thermo Nutech, 1996; DOE, 1999a).
In soils where radionuclides are homogeneous in distribution, this technology will not be effective (Patterson, et al., 2000). Results at the Tonapah Test Range in Nevada suggested that using the Segmented Gate System to process soil with radionuclide concentrations of greater than 800 pCi/g would not be effective (DOE, 1999d). Thick vegetation and root systems will lower the efficiency of the soil separation, and vegetation should be killed prior to treatment to reduce this interference (DOE, 1999e).
Optimum soil moisture content is between 5 and 15 percent; however, dry soil separation systems will tolerate moisture contents ranging from 2 to 25 percent (DOE, 1999c).
Waste Management Issues
The clean fraction of the soil can be returned to the site or used as fill. The residual radioactive contaminated fraction will require further treatment and/or disposal. If the resulting contaminated fraction is classified as high level or transuranic waste, special handling and disposal could be required.
Equipment decontamination and disposable personal protective equipment wastes will be generated. This method is likely to generate dust as a part of the process and dust collection systems and/or engineering controls, such as wetting exposed materials, should be used. When volatile organic compounds are present, the mixing process can volatilize these compounds and off-gas capturing and treatment systems should be used to minimize releases to the air.
Operating Characteristics
Exhibit 2-18 summarizes the operating characteristics of dry soil separation.
Exhibit 2-18: Operating Characteristics of Dry Soil Separation
Characteristic Description
Destruction and Removal Efficiencies For gamma emitting radionuclides that are distributed non-uniformly in a contaminated material, the removal efficiency can be very high. Volumes of soils contaminated with Pu-239 and Am-241 on Johnston Atoll were reduced by greater than 90%. Am-241 and Ra-222 concentrations in clean soil fractions were reduced below their respective limits of detection at 2pCi/g and 5pCi/g (Thermo Nutech, 1996; EPA, 1994). After additional plant modifications were made in 1993, weight reductions of contaminated soil reached 99.5%(DNA, 1995). A 99% volume reduction of radioactively contaminated material was demonstrated at the Savannah River Site. Cs-137 levels in clean soil fractions were reduced by 99% to less than the level of detection at 4pCi/g (Thermo Nutech, 1996; DOE, 1998). Removal efficiencies can be much lower for materials where distribution of radionuclides is more homogeneous (see Exhibit 2-19).
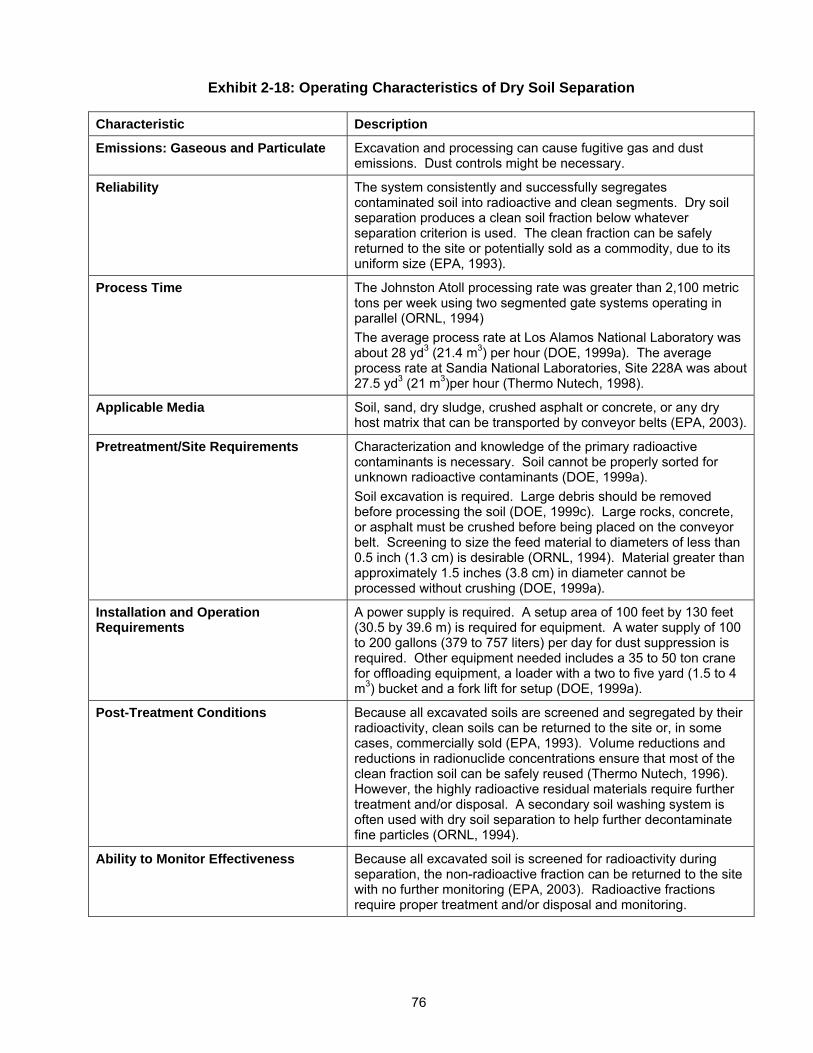
76
Exhibit 2-18: Operating Characteristics of Dry Soil Separation
Characteristic Description
Emissions: Gaseous and Particulate Excavation and processing can cause fugitive gas and dust emissions. Dust controls might be necessary.
Reliability The system consistently and successfully segregates contaminated soil into radioactive and clean segments. Dry soil separation produces a clean soil fraction below whatever separation criterion is used. The clean fraction can be safely returned to the site or potentially sold as a commodity, due to its uniform size (EPA, 1993).
Process Time The Johnston Atoll processing rate was greater than 2,100 metric tons per week using two segmented gate systems operating in parallel (ORNL, 1994) The average process rate at Los Alamos National Laboratory was about 28 yd3 (21.4 m3) per hour (DOE, 1999a). The average process rate at Sandia National Laboratories, Site 228A was about 27.5 yd3 (21 m3)per hour (Thermo Nutech, 1998).
Applicable Media Soil, sand, dry sludge, crushed asphalt or concrete, or any dry host matrix that can be transported by conveyor belts (EPA, 2003).
Pretreatment/Site Requirements Characterization and knowledge of the primary radioactive contaminants is necessary. Soil cannot be properly sorted for unknown radioactive contaminants (DOE, 1999a). Soil excavation is required. Large debris should be removed before processing the soil (DOE, 1999c). Large rocks, concrete, or asphalt must be crushed before being placed on the conveyor belt. Screening to size the feed material to diameters of less than 0.5 inch (1.3 cm) is desirable (ORNL, 1994). Material greater than approximately 1.5 inches (3.8 cm) in diameter cannot be processed without crushing (DOE, 1999a).
Installation and Operation Requirements
A power supply is required. A setup area of 100 feet by 130 feet (30.5 by 39.6 m) is required for equipment. A water supply of 100 to 200 gallons (379 to 757 liters) per day for dust suppression is required. Other equipment needed includes a 35 to 50 ton crane for offloading equipment, a loader with a two to five yard (1.5 to 4 m3) bucket and a fork lift for setup (DOE, 1999a).
Post-Treatment Conditions Because all excavated soils are screened and segregated by their radioactivity, clean soils can be returned to the site or, in some cases, commercially sold (EPA, 1993). Volume reductions and reductions in radionuclide concentrations ensure that most of the clean fraction soil can be safely reused (Thermo Nutech, 1996). However, the highly radioactive residual materials require further treatment and/or disposal. A secondary soil washing system is often used with dry soil separation to help further decontaminate fine particles (ORNL, 1994).
Ability to Monitor Effectiveness Because all excavated soil is screened for radioactivity during separation, the non-radioactive fraction can be returned to the site with no further monitoring (EPA, 2003). Radioactive fractions require proper treatment and/or disposal and monitoring.
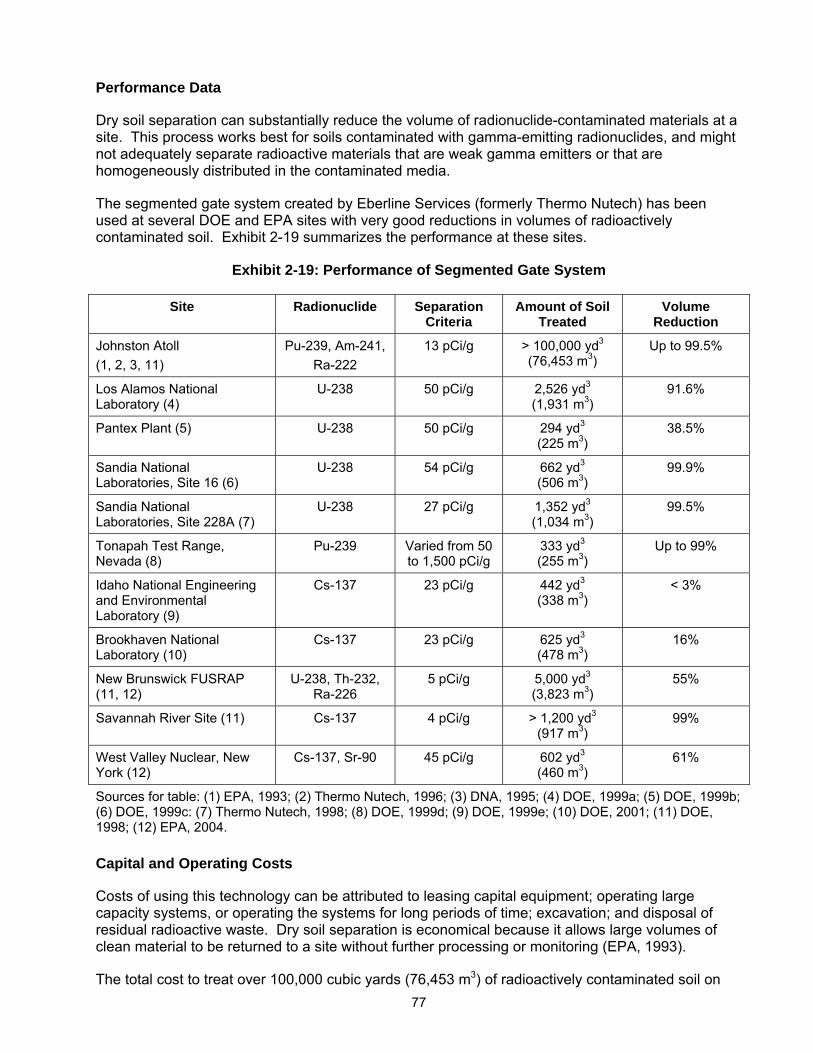
77
Performance Data
Dry soil separation can substantially reduce the volume of radionuclide-contaminated materials at a site. This process works best for soils contaminated with gamma-emitting radionuclides, and might not adequately separate radioactive materials that are weak gamma emitters or that are homogeneously distributed in the contaminated media.
The segmented gate system created by Eberline Services (formerly Thermo Nutech) has been used at several DOE and EPA sites with very good reductions in volumes of radioactively contaminated soil. Exhibit 2-19 summarizes the performance at these sites.
Exhibit 2-19: Performance of Segmented Gate System
Site Radionuclide Separation Criteria
Amount of Soil Treated
Volume Reduction
Johnston Atoll (1, 2, 3, 11)
Pu-239, Am-241, Ra-222
13 pCi/g > 100,000 yd3
(76,453 m3) Up to 99.5%
Los Alamos National Laboratory (4)
U-238 50 pCi/g 2,526 yd3
(1,931 m3) 91.6%
Pantex Plant (5) U-238 50 pCi/g 294 yd3
(225 m3) 38.5%
Sandia National Laboratories, Site 16 (6)
U-238 54 pCi/g 662 yd3
(506 m3) 99.9%
Sandia National Laboratories, Site 228A (7)
U-238 27 pCi/g 1,352 yd3
(1,034 m3) 99.5%
Tonapah Test Range, Nevada (8)
Pu-239 Varied from 50 to 1,500 pCi/g
333 yd3
(255 m3) Up to 99%
Idaho National Engineering and Environmental Laboratory (9)
Cs-137 23 pCi/g 442 yd3
(338 m3) < 3%
Brookhaven National Laboratory (10)
Cs-137 23 pCi/g 625 yd3
(478 m3) 16%
New Brunswick FUSRAP (11, 12)
U-238, Th-232, Ra-226
5 pCi/g 5,000 yd3
(3,823 m3) 55%
Savannah River Site (11) Cs-137 4 pCi/g > 1,200 yd3
(917 m3) 99%
West Valley Nuclear, New York (12)
Cs-137, Sr-90 45 pCi/g 602 yd3
(460 m3) 61%
Sources for table: (1) EPA, 1993; (2) Thermo Nutech, 1996; (3) DNA, 1995; (4) DOE, 1999a; (5) DOE, 1999b; (6) DOE, 1999c: (7) Thermo Nutech, 1998; (8) DOE, 1999d; (9) DOE, 1999e; (10) DOE, 2001; (11) DOE, 1998; (12) EPA, 2004.
Capital and Operating Costs
Costs of using this technology can be attributed to leasing capital equipment; operating large capacity systems, or operating the systems for long periods of time; excavation; and disposal of residual radioactive waste. Dry soil separation is economical because it allows large volumes of clean material to be returned to a site without further processing or monitoring (EPA, 1993).
The total cost to treat over 100,000 cubic yards (76,453 m3) of radioactively contaminated soil on
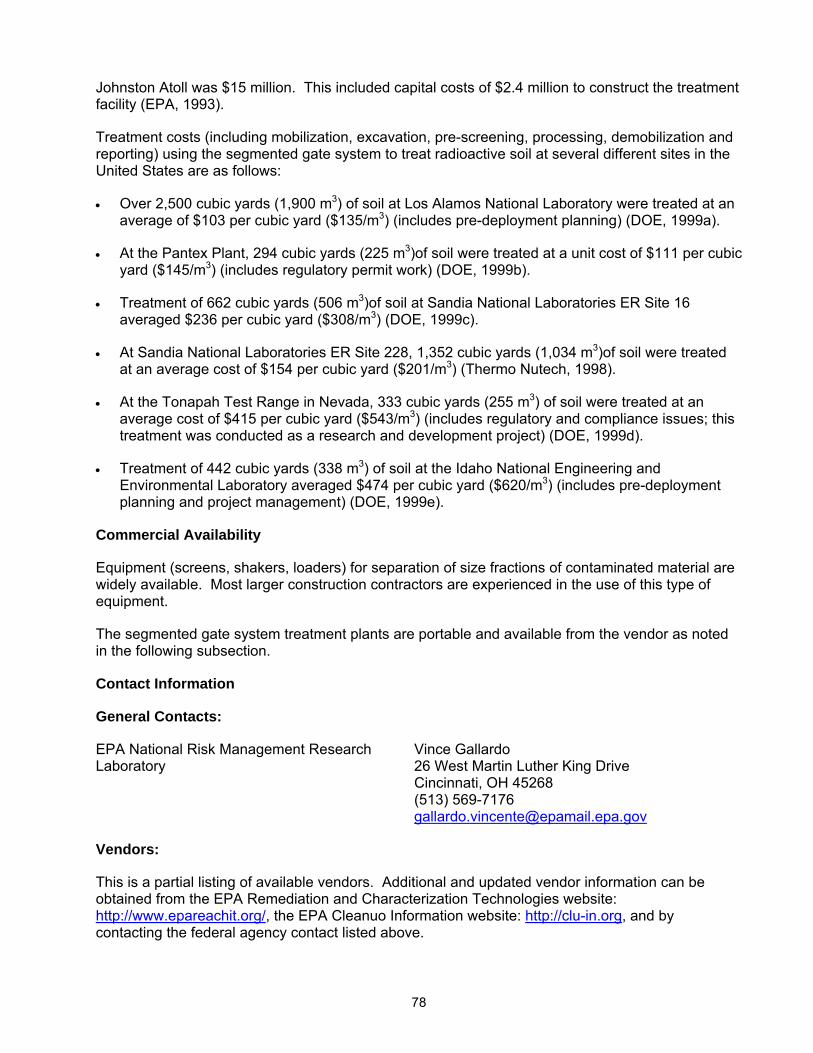
78
Johnston Atoll was $15 million. This included capital costs of $2.4 million to construct the treatment facility (EPA, 1993).
Treatment costs (including mobilization, excavation, pre-screening, processing, demobilization and reporting) using the segmented gate system to treat radioactive soil at several different sites in the United States are as follows:
• Over 2,500 cubic yards (1,900 m3) of soil at Los Alamos National Laboratory were treated at an average of $103 per cubic yard ($135/m3) (includes pre-deployment planning) (DOE, 1999a).
• At the Pantex Plant, 294 cubic yards (225 m3)of soil were treated at a unit cost of $111 per cubic yard ($145/m3) (includes regulatory permit work) (DOE, 1999b).
• Treatment of 662 cubic yards (506 m3)of soil at Sandia National Laboratories ER Site 16 averaged $236 per cubic yard ($308/m3) (DOE, 1999c).
• At Sandia National Laboratories ER Site 228, 1,352 cubic yards (1,034 m3)of soil were treated at an average cost of $154 per cubic yard ($201/m3) (Thermo Nutech, 1998).
• At the Tonapah Test Range in Nevada, 333 cubic yards (255 m3) of soil were treated at an average cost of $415 per cubic yard ($543/m3) (includes regulatory and compliance issues; this treatment was conducted as a research and development project) (DOE, 1999d).
• Treatment of 442 cubic yards (338 m3) of soil at the Idaho National Engineering and Environmental Laboratory averaged $474 per cubic yard ($620/m3) (includes pre-deployment planning and project management) (DOE, 1999e).
Commercial Availability
Equipment (screens, shakers, loaders) for separation of size fractions of contaminated material are widely available. Most larger construction contractors are experienced in the use of this type of equipment.
The segmented gate system treatment plants are portable and available from the vendor as noted in the following subsection.
Contact Information
General Contacts:
EPA National Risk Management Research Laboratory
Vince Gallardo 26 West Martin Luther King Drive Cincinnati, OH 45268 (513) 569-7176 [email protected]
Vendors:
This is a partial listing of available vendors. Additional and updated vendor information can be obtained from the EPA Remediation and Characterization Technologies website: http://www.epareachit.org/, the EPA Cleanuo Information website: http://clu-in.org, and by contacting the federal agency contact listed above.
79
Eberline Services Inc. (Segmented Gate System)
4501 Indian School Road, NE Suite 105 Albuquerque, NM 87110 (505) 262-2694 www.eberlineservices.com
Dry Soil Separation References
Defense Nuclear Agency. Johnston Atoll Plutonium Cleanup Project, Contract Bridge Report. Contract DNA-001-90-C-0119, April 1995. DNA-TR-93-169.
Eberline Services. Segmented Gate System: Radiological Characterization and Sorting Technology. Vendor brochure, 2004. http://www.eberlineservices.com/fieldservices.htm
Federal Remediation Technologies Roundtable. Remediation Technologies Screening Matrix and Reference Guide, Version 4.0: Separation, 2002. http://www.frtr.gov/matrix2/section4/4-18.html
Oak Ridge National Laboratory. Y-12 Plant Remedial Action Technology Logic Diagram, Volume 3, Technology Evaluation Data Sheets, Part A, Remedial Action, 2004. Y/ER-161/V3/PtA.
Patterson, R., Maynor, D., and Callan, C. “The Accelerated Site Technology Deployment Program Presents the Segmented Gate System.” Presented at: Waste Management 2000 Conference, February 27 - March 3, 2000, Tucson, Ariz. Abstract #559, Session 12, Paper # 6, 2000. DOE OSTI Rpt. No. SAND2000-0492C.
Thermo Nutech. Segmented Gate System, ER Site 228A Remediation Project, Sandia National Laboratories, Final Report, December 15, 1998. Prepared for Sandia National Laboratories.
Thermo Nutech. Statement of Qualifications and Description of Thermo Nutech’s Segmented Gate System. Thermo Nutech, Environmental Field Services Group. Oak Ridge, Tenn., 1996.
U.S. Department of Energy. Cost and Performance Report: ThermoRetech’s Segmented Gate System, Brookhaven National Laboratory, Area of Concern 16, Suffolk County, N.Y. Prepared by Sandia National Laboratories, February 2001.
U.S. Department of Energy. Cost and Performance Report: Thermo Nutech’s Segmented Gate System, Los Alamos National Laboratory, Technical Area 33, Los Alamos, N.M. Prepared by Sandia National Laboratories, November 1999a.
U.S. Department of Energy. Cost and Performance Report: Thermo NUtech’s Segmented Gate System, Pantex Plant, Firing Site 5, Amarillo, Texas. Prepared by Sandia National Laboratories, March 1999b.
U.S. Department of Energy. Cost and Performance Report: Thermo NUtech’s Segmented Gate System, Sandia National Laboratories, ER Site 16, Albuquerque, N.M. Prepared by Sandia National Laboratories, January 1999c.
U.S. Department of Energy. Cost and Performance Report: Thermo NUtech’s Segmented Gate System, Tonapah Test Range, Clean Slate 2, Tonapah, Nev. Prepared by Sandia National Laboratories. July 1999d.
U.S. Department of Energy. Cost and Performance Report: Thermo NUtech’s Segmented Gate System, Idaho National Engineering and Environmental Laboratory, Auxiliary Reactor Area-23, Idaho Falls, Idaho. Prepared by Sandia National Laboratories, November 1999e.
80
U.S. Department of Energy. Technology Deployment: Segmented Gate System (SGS). Accelerated Site Technology Deployment Program, August 1998.
U.S. Environmental Protection Agency. Remediation and Characterization Technologies Website, 2004. http://www.epareachit.org/
U.S. Environmental Protection Agency. Superfund Innovative Technology Evaluation Program, Technology Profiles, Eleventh Edition, 2003. EPA/540/R-03/009.
U.S. Environmental Protection Agency. Superfund Innovative Technology Program, Technology Profiles, Seventh Edition, 1994. EPA/540/R-94/526.
U.S. Environmental Protection Agency. Approaches for the Remediation of Federal Facility Sites Contaminated With Explosive or Radioactive Wastes, 1993. EPA/625/R-93/013.
2.4.2 Soil Washing
Description
Soil washing is a process in which water, with or without surfactants, mixes with contaminated soil and debris to produce a slurry feed. This feed enters through a scrubbing machine to remove contaminated fine soil particles (silts and clay) from granular soil particles. Contaminants are generally bound more tightly to the fine soil particles and not to larger grained sand and gravel. Separation processes include screening to divide soils into the coarse and fine fractions, and dissolving or suspending contaminants in the wash. The sand and gravel fraction is generally passed through an abrasive scouring or scrubbing action to remove surface contamination. The fine fraction can be separated further in a sedimentation tank, sometimes with the help of a flocculating agent. The output streams of these processes consist of clean granular soil particles, contaminated soil fines, and process/wash water, all of which are tested for contamination. Soil washing is effective only if the process transfers the radionuclides to the wash fluids or concentrates them in a fraction of the original soil volume. In either case, soil washing must be used with other treatment technologies, such as precipitation, filtration and/or ion exchange. Clean soil (sand and gravel) can be returned to the excavation area, while remaining contaminated soil fines and process waste are further treated and/or disposed of (EPA, 1991; EPA, 1997a).
If chemicals such as acids or solvents are added to the process to chemically extract radionuclides from the contaminated materials, the process is defined in this report as a chemical separation rather than a physical separation and is discussed as solvent/chemical extraction (see Section 2.3.1).
Soil washing is most effective when the contaminated soil consists of less than 25 percent silt and clay and at least 50 percent sand and gravel; soil particles should be between 0.25 mm and 2 mm (0.01 to 0.08 in) in diameter for optimum performance. When soil particles are too large (greater than about 6 mm or ¼ inch in diameter), removal of oversized particles could be required; when particles are smaller than 0.063 mm (0.002 in) in diameter, soil washing performance is poor because these particles are very difficult to separate into contaminated and uncontaminated components (EPA, 1991; Fristad and Jones, 1994; Suer, 1995).
Another factor impacting the effectiveness of soil washing is the cation exchange capacity of the soil (ion exchange is discussed in Section 3.1.1). If the soil’s cation exchange capacity is too high, separating pollutants from the soil particles is difficult (EPA, 1993a).
One type of soil washing system developed specifically by EPA for treating radioactively contaminated soils is the Volume Reduction/Chemical Extraction plant. VORCE pilot plants have
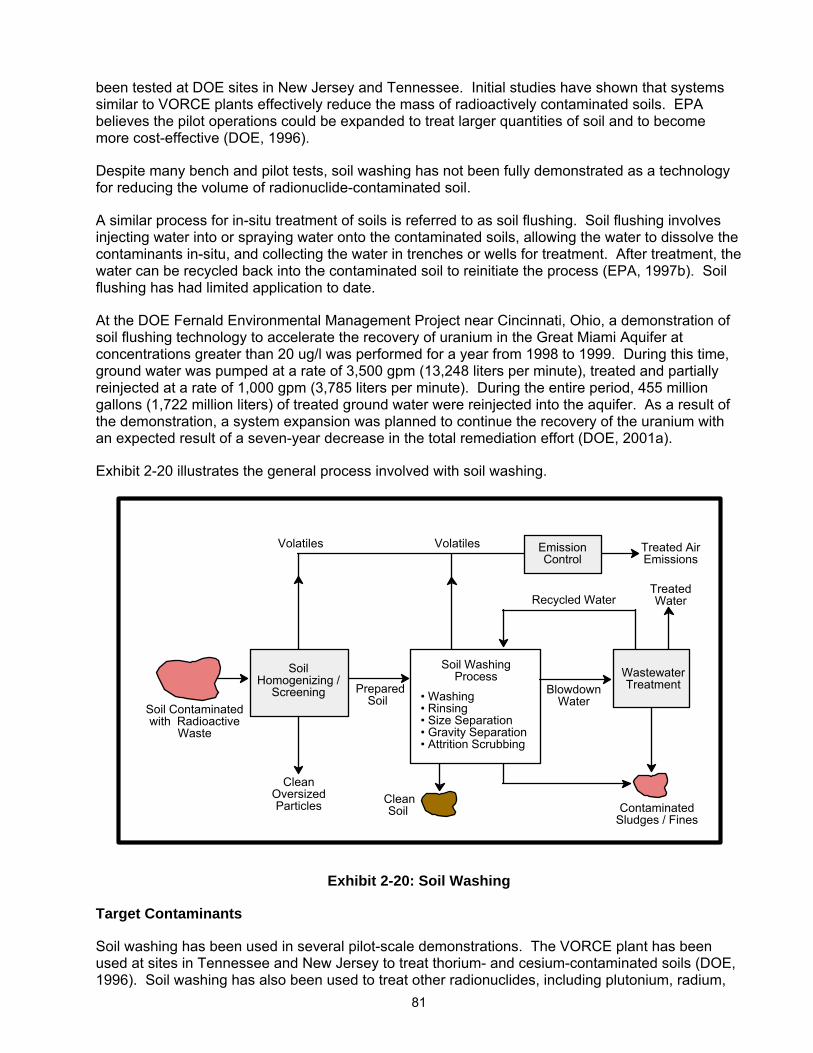
81
been tested at DOE sites in New Jersey and Tennessee. Initial studies have shown that systems similar to VORCE plants effectively reduce the mass of radioactively contaminated soils. EPA believes the pilot operations could be expanded to treat larger quantities of soil and to become more cost-effective (DOE, 1996).
Despite many bench and pilot tests, soil washing has not been fully demonstrated as a technology for reducing the volume of radionuclide-contaminated soil.
A similar process for in-situ treatment of soils is referred to as soil flushing. Soil flushing involves injecting water into or spraying water onto the contaminated soils, allowing the water to dissolve the contaminants in-situ, and collecting the water in trenches or wells for treatment. After treatment, the water can be recycled back into the contaminated soil to reinitiate the process (EPA, 1997b). Soil flushing has had limited application to date.
At the DOE Fernald Environmental Management Project near Cincinnati, Ohio, a demonstration of soil flushing technology to accelerate the recovery of uranium in the Great Miami Aquifer at concentrations greater than 20 ug/l was performed for a year from 1998 to 1999. During this time, ground water was pumped at a rate of 3,500 gpm (13,248 liters per minute), treated and partially reinjected at a rate of 1,000 gpm (3,785 liters per minute). During the entire period, 455 million gallons (1,722 million liters) of treated ground water were reinjected into the aquifer. As a result of the demonstration, a system expansion was planned to continue the recovery of the uranium with an expected result of a seven-year decrease in the total remediation effort (DOE, 2001a).
Exhibit 2-20 illustrates the general process involved with soil washing.
Soil��� ���
Homogenizing /���
���
Screening���
���
Emission��� ���
Control���
���
Wastewater��� ���
Treatment���
���
Soil Washing��� ���
Process���
���
• Washing �
�
�
���
• Rinsing ���
���
• Size Separation ���
���
• Gravity Separation ���
���
• Attrition Scrubbing���
���
Prepared��� ���
Soil���
���
Blowdown��� ���
Water���
���
Clean��� ���
Oversized���
���
Particles���
���
Clean��� ���
Soil���
���
Contaminated��� ���
Sludges / Fines���
���
Treated Air��� ���
Emissions���
���Treated��� �
��
Water���
���
Recycled Water���
Volatiles���Volatiles���
Soil Contaminated��� ���
with Radioactive���
���
Waste���
Exhibit 2-20: Soil Washing
Target Contaminants
Soil washing has been used in several pilot-scale demonstrations. The VORCE plant has been used at sites in Tennessee and New Jersey to treat thorium- and cesium-contaminated soils (DOE, 1996). Soil washing has also been used to treat other radionuclides, including plutonium, radium,
82
uranium, thorium, technetium, strontium and cesium; organics, including polyaromatic hydrocarbons, polychlorinated biphenyls, pentachlorophenol, creosote, heavy petroleum; and heavy metals, including cadmium, chromium, copper, lead, mercury, nickel, and zinc (EPA, 1988; ACOE, 1997; LANL, 1996).
Applicable Site Characteristics
Soil washing is useful in-situations where radioactive contaminants are closely associated with fine soil particles and soils have the proper particle size distribution. This method is more successful with sandy or gravelly soils with little to no humus (total organic carbon less than 10%) and with low cation exchange capacities (less than 8 meq/l) (Kikkeri and Ness, 1996). Soil washing is generally not effective for soils with high percentages (i.e. greater than 40 percent) of clay and silt. It is difficult to formulate a single, effective washing fluid for complex mixtures of contaminants, such as a mixed waste of radionuclides with organic compounds (EPA, 1991; EPA, 1997b). Soil washing will generally not be cost effective for sites with less than 5,000 tons of contaminated soil (ITRC, 1997). Soil washing appears to work best for soils contaminated with low-level radioactivity (UKAEA, 2004).
Whether the segregated uncontaminated washed soil can be returned to the site with no further treatment, thus increasing cost-effectiveness, depends on cleanup and land disposal requirements. Soil character, moisture content, particle size distribution, and contaminant concentrations and solubilities are factors that impact the efficiency and operation of soil washing (EPA, 1993a).
Waste Management Issues
Soil washing will produce contaminated residual soils and contaminated wastewater that will each require further treatment and/or disposal. If oversized material cannot be size reduced to allow processing, this could also require treatment and/or disposal. Contaminated soil fines could be incinerated or disposed of as radioactive waste; wash water can be treated by ion exchange (EPA, 1993a).
Process water is potentially suitable for recycling as wash water, but would likely require further treatment before being recycled. If treated water cannot be reused as wash water, it must be discarded in accordance with applicable discharge requirements. Equipment decontamination and disposable personal protective equipment wastes will be generated as a part of this process.
Operating Characteristics
Exhibit 2-21 summarizes the operating characteristics of dry soil washing.
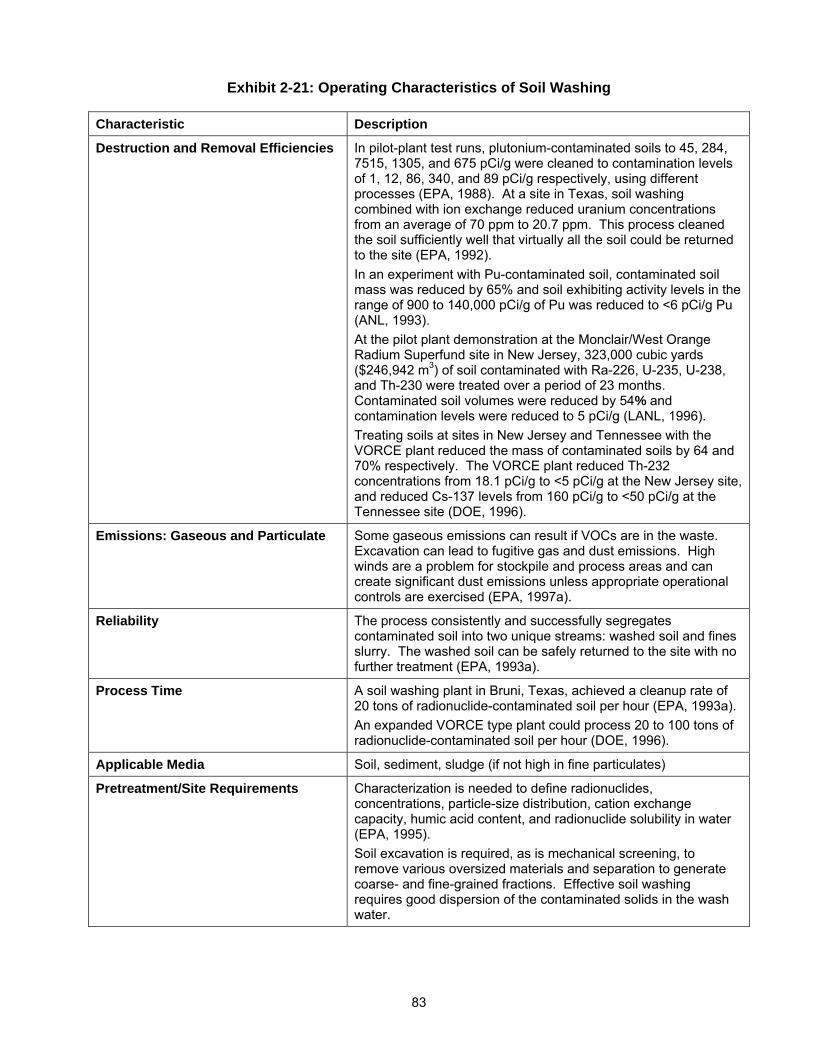
83
Exhibit 2-21: Operating Characteristics of Soil Washing
Characteristic Description
Destruction and Removal Efficiencies In pilot-plant test runs, plutonium-contaminated soils to 45, 284, 7515, 1305, and 675 pCi/g were cleaned to contamination levels of 1, 12, 86, 340, and 89 pCi/g respectively, using different processes (EPA, 1988). At a site in Texas, soil washing combined with ion exchange reduced uranium concentrations from an average of 70 ppm to 20.7 ppm. This process cleaned the soil sufficiently well that virtually all the soil could be returned to the site (EPA, 1992). In an experiment with Pu-contaminated soil, contaminated soil mass was reduced by 65% and soil exhibiting activity levels in the range of 900 to 140,000 pCi/g of Pu was reduced to <6 pCi/g Pu (ANL, 1993). At the pilot plant demonstration at the Monclair/West Orange Radium Superfund site in New Jersey, 323,000 cubic yards ($246,942 m3) of soil contaminated with Ra-226, U-235, U-238, and Th-230 were treated over a period of 23 months. Contaminated soil volumes were reduced by 54% and contamination levels were reduced to 5 pCi/g (LANL, 1996). Treating soils at sites in New Jersey and Tennessee with the VORCE plant reduced the mass of contaminated soils by 64 and 70% respectively. The VORCE plant reduced Th-232 concentrations from 18.1 pCi/g to <5 pCi/g at the New Jersey site, and reduced Cs-137 levels from 160 pCi/g to <50 pCi/g at the Tennessee site (DOE, 1996).
Emissions: Gaseous and Particulate Some gaseous emissions can result if VOCs are in the waste. Excavation can lead to fugitive gas and dust emissions. High winds are a problem for stockpile and process areas and can create significant dust emissions unless appropriate operational controls are exercised (EPA, 1997a).
Reliability The process consistently and successfully segregates contaminated soil into two unique streams: washed soil and fines slurry. The washed soil can be safely returned to the site with no further treatment (EPA, 1993a).
Process Time A soil washing plant in Bruni, Texas, achieved a cleanup rate of 20 tons of radionuclide-contaminated soil per hour (EPA, 1993a). An expanded VORCE type plant could process 20 to 100 tons of radionuclide-contaminated soil per hour (DOE, 1996).
Applicable Media Soil, sediment, sludge (if not high in fine particulates)
Pretreatment/Site Requirements Characterization is needed to define radionuclides, concentrations, particle-size distribution, cation exchange capacity, humic acid content, and radionuclide solubility in water (EPA, 1995). Soil excavation is required, as is mechanical screening, to remove various oversized materials and separation to generate coarse- and fine-grained fractions. Effective soil washing requires good dispersion of the contaminated solids in the wash water.
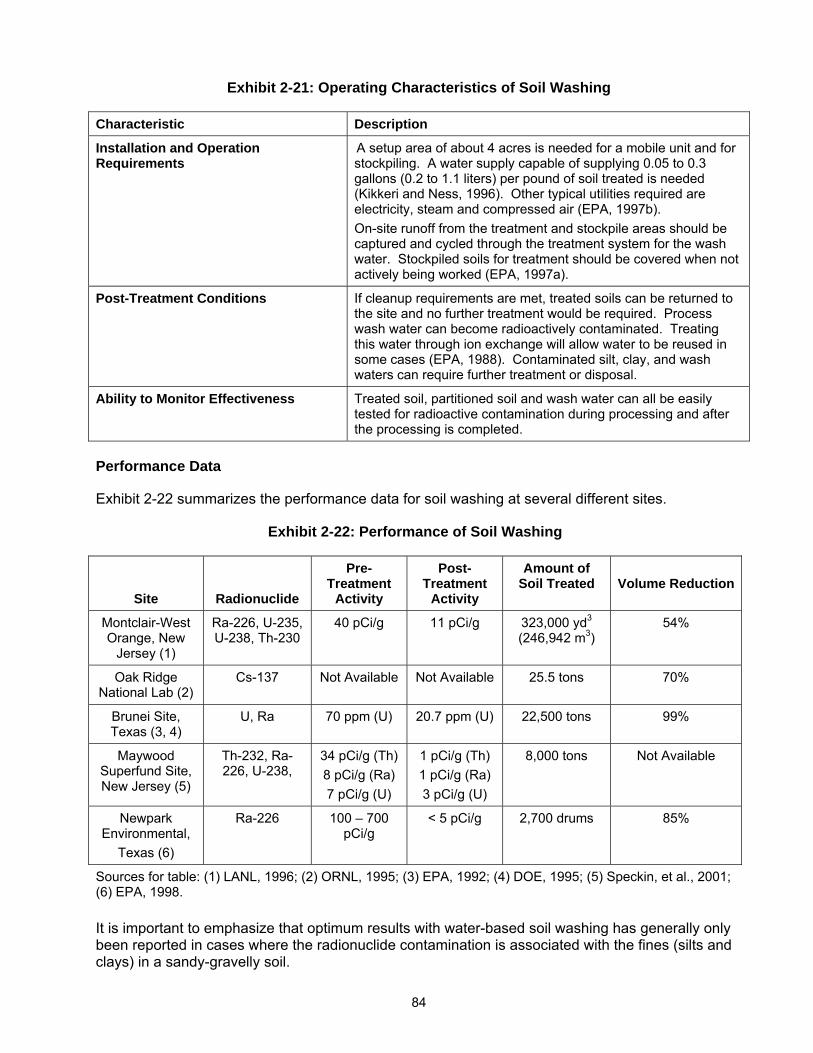
84
Exhibit 2-21: Operating Characteristics of Soil Washing
Characteristic Description
Installation and Operation Requirements
A setup area of about 4 acres is needed for a mobile unit and for stockpiling. A water supply capable of supplying 0.05 to 0.3 gallons (0.2 to 1.1 liters) per pound of soil treated is needed (Kikkeri and Ness, 1996). Other typical utilities required are electricity, steam and compressed air (EPA, 1997b). On-site runoff from the treatment and stockpile areas should be captured and cycled through the treatment system for the wash water. Stockpiled soils for treatment should be covered when not actively being worked (EPA, 1997a).
Post-Treatment Conditions If cleanup requirements are met, treated soils can be returned to the site and no further treatment would be required. Process wash water can become radioactively contaminated. Treating this water through ion exchange will allow water to be reused in some cases (EPA, 1988). Contaminated silt, clay, and wash waters can require further treatment or disposal.
Ability to Monitor Effectiveness Treated soil, partitioned soil and wash water can all be easily tested for radioactive contamination during processing and after the processing is completed.
Performance Data
Exhibit 2-22 summarizes the performance data for soil washing at several different sites.
Exhibit 2-22: Performance of Soil Washing
Site
Radionuclide
Pre-Treatment
Activity
Post-Treatment
Activity
Amount of Soil Treated
Volume Reduction
Montclair-West Orange, New
Jersey (1)
Ra-226, U-235, U-238, Th-230
40 pCi/g 11 pCi/g 323,000 yd3
(246,942 m3) 54%
Oak Ridge National Lab (2)
Cs-137 Not Available Not Available 25.5 tons 70%
Brunei Site, Texas (3, 4)
U, Ra 70 ppm (U) 20.7 ppm (U) 22,500 tons 99%
Maywood Superfund Site, New Jersey (5)
Th-232, Ra-226, U-238,
34 pCi/g (Th) 8 pCi/g (Ra) 7 pCi/g (U)
1 pCi/g (Th) 1 pCi/g (Ra) 3 pCi/g (U)
8,000 tons Not Available
Newpark Environmental,
Texas (6)
Ra-226 100 – 700 pCi/g
< 5 pCi/g 2,700 drums 85%
Sources for table: (1) LANL, 1996; (2) ORNL, 1995; (3) EPA, 1992; (4) DOE, 1995; (5) Speckin, et al., 2001; (6) EPA, 1998.
It is important to emphasize that optimum results with water-based soil washing has generally only been reported in cases where the radionuclide contamination is associated with the fines (silts and clays) in a sandy-gravelly soil.
85
Capital and Operating Costs
Costs of using this technology are attributed to leasing capital equipment; operating large capacity systems, or operating the systems for long periods of time; transportation; and disposal of residual radioactive waste.
The capital costs for soil washing are usually limited to the treatment plant and supporting equipment. The capital cost for a 25 ton per hour soil washing plant ranges from $3 to $5 million (EPA, 1998). This cost does not include mobilization, demobilization, and site preparation.
Operating costs for a soil washing plant will include excavation, plant labor, plant consumables (surfactants, personal protective equipment, etc.), utilities, sampling and analysis during operations, emplacing the clean fraction as backfill, site restoration and residuals treatment and/or disposal costs.
Based on pilot testing results, volume reduction at a rate of 1.5 tons per hour costs approximately $300 per hour (EPA, 1993b). Treatment costs for the VORCE plant ranged from $111 to $134 per ton for processing between 20 to 100 tons per hour. Total costs could be as high as $280 per ton when waste is transported off site (DOE, 1996).
Costs estimates for soil washing systems evaluated for use at the Nevada Test Site for remediation of plutonium-239 contaminated soils ranged from $189 to $270 per cubic yard ($247 to $353/m3) (DOE, 2001b).
If onsite plants are not constructed, transportation and disposal costs could increase the treatment costs significantly. Processing large quantities of soils could reduce the unit cost of soil washing.
Commercial Availability
Soil washing equipment is commercially available and can be leased or purchased. Most soil washing equipment is the same as is used in sand and gravel quarry operations. Several vendors have performed pilot scale soil washing operations for radionuclides. Contact information for some of the vendors offering this technology is included in the following subsection.
Contact Information
General Contacts:
EPA National Risk Management Research Laboratory
Richard Griffiths 26 West Martin Luther King Drive Cincinnati, OH 45268 (513) 569-7832 [email protected]
Vendors:
This is a partial listing of available vendors. Additional and updated vendor information can be obtained from the EPA Remediation and Characterization Technologies website: http://www.epareachit.org/, the EPA Cleanup Information website: http://clu-in.org, and by contacting the federal agency contacts listed above.
86
ART Engineering, LLC 12526 Leatherleaf Drive Tampa, FL 33626 (813) 855-9852 http://www.art-engineering.com/
Bergmann USA 1550 Airport Road Gallatin, TN 37066 (615) 452-5500
Brice Environmental Services 3200 Shell Street Fairbanks, AK 99709 (907) 452-2512 http://www.briceinc.com/
COGNIS Corporation USA 5051 Estecreek Drive Cincinnati, OH 45232 513-482-3000 http://www.na.cognis.com/
Earthline Technologies Inc. 1800 E. 21st Street Ashtabula, OH 44004 (800) 991-7038
Terra Resources Ltd. HC4 Box 9311 Palmer, AK 99645 (907) 746-4981 www.terrawash.com
Soil Washing References
Argonne National Laboratory. Soil Washing as a Potential Remediation Technology for Contaminated DOE Sites, March 1993. DE93-009205.
Fristad, W. and Jones, C. “Soil Washing and TerrametTM Lead Leaching/Recovery Process at the Twin Cities Army Ammunition Plant.” Proceedings of the Fifth Forum on Innovative Hazardous Waste Treatment Technologies: Domestic and International. U.S. EPA, May 3-5, 1994. Chicago, Ill. EPA/540/R-94/503.
Interstate Technology and Regulatory Council. Technical and Regulatory Guidelines for Soil Washing, December 1997. http://www.itrcweb.org/
Kikkeri, S. and Ness, E. Engineering Parameters for Environmental Remediation Technologies. Prepared for U.S. Coast Guard, Office of Research and Development. Report No. CG-D-15-96, 1996.
Los Alamos National Laboratory. A Compendium of Cost Data for Environmental Remediation Technologies, Second Edition, 1996. LA-UR-96-2205. http://www.lanl.gov/orgs/d/d4/enviro/etcap/
Oak Ridge National Laboratory. Soil Washing for Volume Reduction. Technology Demonstration Summary, 1995.
Speckin, P., Tool, A., Skryness, R., Connelly, D., Marquis, B., and Mendonca, M. “Pilot Demonstration for Radiological Waste Volume Reduction.” Presented at: USACE Environmental Development Workshop, April 16 – 20, 2001, Portland, Ore.
87
Suer, A. Soil Washing Technology Evaluation. Westinghouse Savannah River Company, April 1995. WSRC-TR-95-0183.
U.S. Army Corps of Engineers. Guidance for Low-Level Radioactive Waste (LLRW) and Mixed Waste (MW) Treatment and Handling, 1997. EM-1110-1-4002.
U.S. Department of Energy. Innovative Technology Summary Report: Mobilization, Extraction, and Removal of Radionuclides, 2001a. DOE/EM-0559.
U.S. Department of Energy. Proceedings from the Remediation of Radioactive Surface Soils Workshop, August 14-15, 2001. Hosted by U.S. DOE National Nuclear Security Administration, Nevada Operations Office, 2001b. DOE/NV-798.
U.S. Department of Energy. Results of a Soil Washing Demonstration Project for Low-Level Radioactively Contaminated Soil, 1996. DOE/OR/21949-404.
U.S. Department of Energy. “Session Identifies and Overcomes (Some) Barriers to Technology Implementation.” Notes of Concurrent Session: Resolving Barriers to Soil Treatment, Technical Information Exchange Workshop 7, Cincinnati, Ohio, April 1995. DOE Office of Environmental Management. http://web.em.doe.gov/tie/sum955a.html
U.S. Environmental Protection Agency. Innovative Site Remediation Technology, Design & Application, Volume 3: Liquid Extraction Technologies, May 1998. EPA/542/B-97/006.
U.S. Environmental Protection Agency. Best Management Practices (BMPs) for Soil Treatment Technologies: Suggested Operational Guidelines to Prevent Cross-Media Transfer of Contaminants During Clean-up Activities, 1997a. EPA/530/R-97/007.
U.S. Environmental Protection Agency. Engineering Bulletin: Technology Alternatives for the Remediation of Soils Contaminated with As, Cd, Cr, Hg, and Pb, 1997b. EPA/540/S-97/500.
U.S. Environmental Protection Agency. Contaminants and Remedial Options at Selected Metal-Contaminated Sites, 1995. EPA/540/R-95/512.
U.S. Environmental Protection Agency. Innovative Site Remediation Technology, Soil Washing/Soil Flushing, Volume 3, 1993a. EPA/542/B-93/012.
U.S. Environmental Protection Agency. Synopses of Federal Demonstrations of Innovative Site Remediation Technologies, Third Edition. Federal Remediation Technologies Roundtable, 1993b. EPA/542/B-93/009.
U.S. Environmental Protection Agency. Synopses of Federal Demonstrations of Innovative Site Remediation Technologies. Federal Remediation Technologies Roundtable, August 1992. EPA/542/B-92/003.
U.S. Environmental Protection Agency. Guide for Conducting Treatability Studies Under CERCLA: Soil Washing – Quick Reference Fact Sheet, 1991. EPA/540/2-91/020B.
U.S. Environmental Protection Agency. Technological Approaches to the Cleanup of Radiologically Contaminated Superfund Sites, 1988. EPA/540/2-88/002.
United Kingdom Atomic Energy Agency. The Technology of Decommissioning and Liabilities Management, Site Investigation, Remediation and Restoration: Rock and Soil Washing Trials. Webpage publication, 2004. http://www.ukaea.org.uk/reports/tdecomm/Tech_rock-soil.pdf
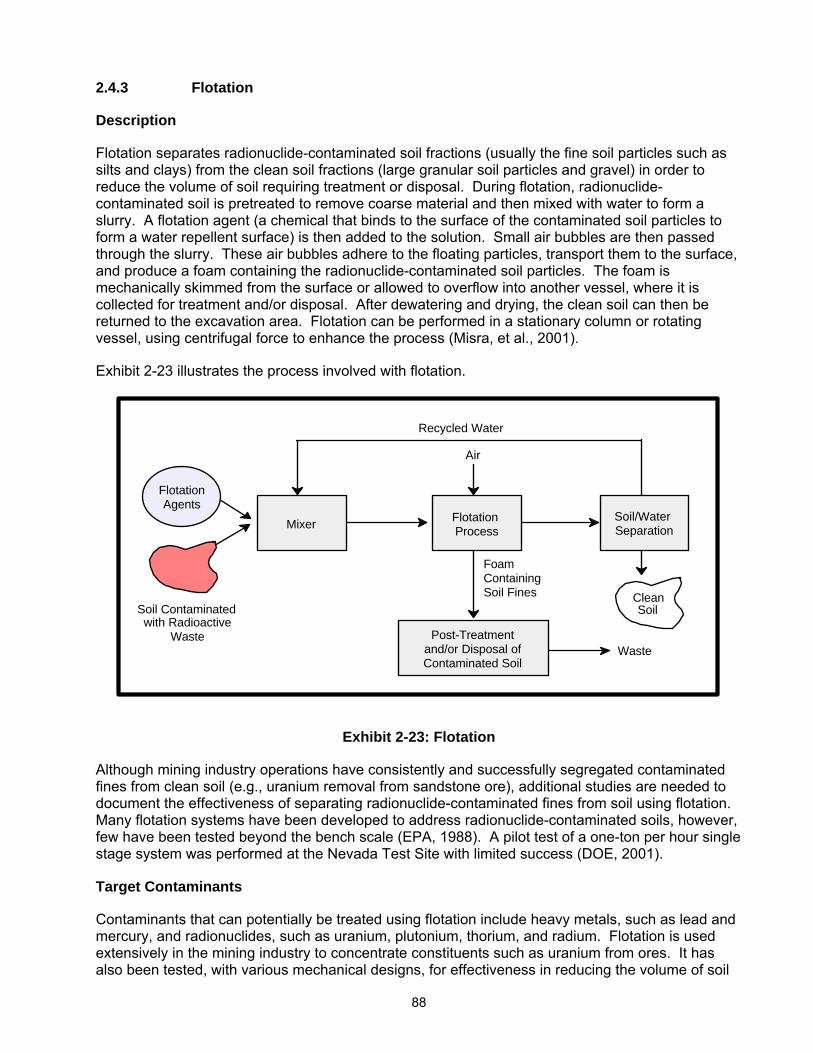
88
2.4.3 Flotation
Description
Flotation separates radionuclide-contaminated soil fractions (usually the fine soil particles such as silts and clays) from the clean soil fractions (large granular soil particles and gravel) in order to reduce the volume of soil requiring treatment or disposal. During flotation, radionuclide-contaminated soil is pretreated to remove coarse material and then mixed with water to form a slurry. A flotation agent (a chemical that binds to the surface of the contaminated soil particles to form a water repellent surface) is then added to the solution. Small air bubbles are then passed through the slurry. These air bubbles adhere to the floating particles, transport them to the surface, and produce a foam containing the radionuclide-contaminated soil particles. The foam is mechanically skimmed from the surface or allowed to overflow into another vessel, where it is collected for treatment and/or disposal. After dewatering and drying, the clean soil can then be returned to the excavation area. Flotation can be performed in a stationary column or rotating vessel, using centrifugal force to enhance the process (Misra, et al., 2001).
Exhibit 2-23 illustrates the process involved with flotation.
Soil/Water Separation
Recycled Water
Air
with Radioactive
Waste Post-Treatment and/or Disposal of Contaminated Soil
Waste
Mixer
Soil
Foam Containing Soil Fines
Flotation Agents cFlotation
Process
Soil ContaminatedClean
Exhibit 2-23: Flotation
Although mining industry operations have consistently and successfully segregated contaminated fines from clean soil (e.g., uranium removal from sandstone ore), additional studies are needed to document the effectiveness of separating radionuclide-contaminated fines from soil using flotation. Many flotation systems have been developed to address radionuclide-contaminated soils, however, few have been tested beyond the bench scale (EPA, 1988). A pilot test of a one-ton per hour single stage system was performed at the Nevada Test Site with limited success (DOE, 2001).
Target Contaminants
Contaminants that can potentially be treated using flotation include heavy metals, such as lead and mercury, and radionuclides, such as uranium, plutonium, thorium, and radium. Flotation is used extensively in the mining industry to concentrate constituents such as uranium from ores. It has also been tested, with various mechanical designs, for effectiveness in reducing the volume of soil
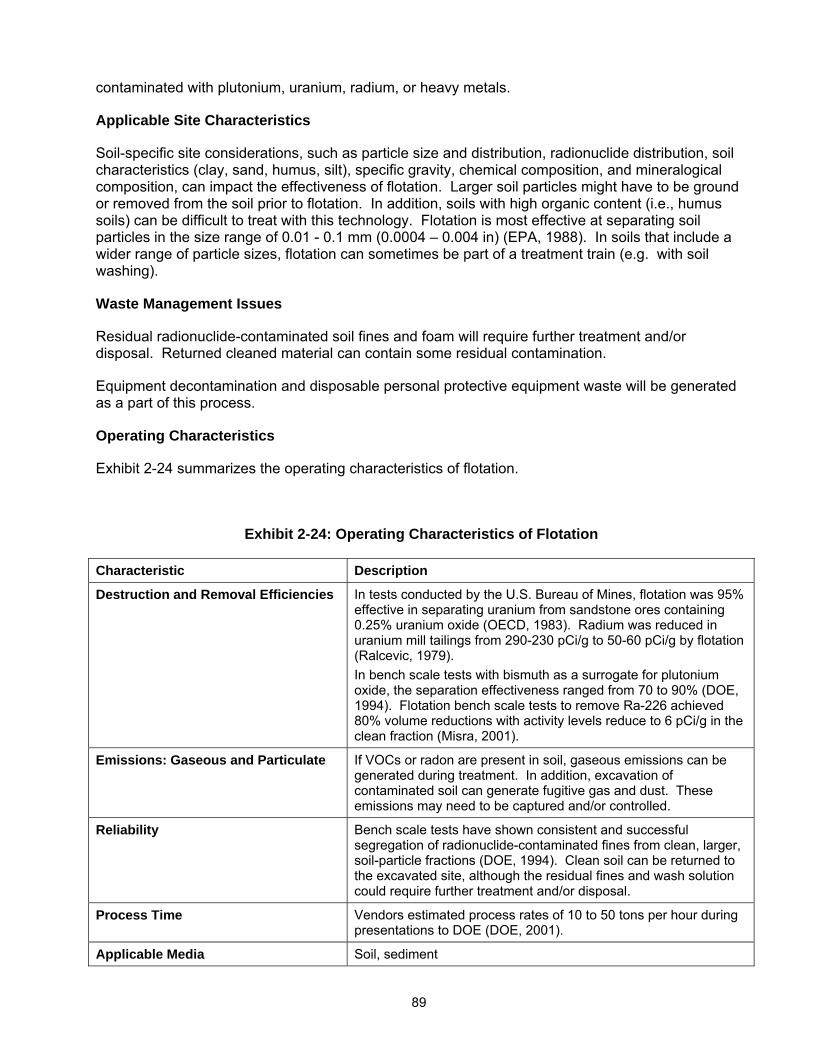
89
contaminated with plutonium, uranium, radium, or heavy metals.
Applicable Site Characteristics
Soil-specific site considerations, such as particle size and distribution, radionuclide distribution, soil characteristics (clay, sand, humus, silt), specific gravity, chemical composition, and mineralogical composition, can impact the effectiveness of flotation. Larger soil particles might have to be ground or removed from the soil prior to flotation. In addition, soils with high organic content (i.e., humus soils) can be difficult to treat with this technology. Flotation is most effective at separating soil particles in the size range of 0.01 - 0.1 mm (0.0004 – 0.004 in) (EPA, 1988). In soils that include a wider range of particle sizes, flotation can sometimes be part of a treatment train (e.g. with soil washing).
Waste Management Issues
Residual radionuclide-contaminated soil fines and foam will require further treatment and/or disposal. Returned cleaned material can contain some residual contamination.
Equipment decontamination and disposable personal protective equipment waste will be generated as a part of this process.
Operating Characteristics
Exhibit 2-24 summarizes the operating characteristics of flotation.
Exhibit 2-24: Operating Characteristics of Flotation
Characteristic Description
Destruction and Removal Efficiencies In tests conducted by the U.S. Bureau of Mines, flotation was 95% effective in separating uranium from sandstone ores containing 0.25% uranium oxide (OECD, 1983). Radium was reduced in uranium mill tailings from 290-230 pCi/g to 50-60 pCi/g by flotation (Ralcevic, 1979). In bench scale tests with bismuth as a surrogate for plutonium oxide, the separation effectiveness ranged from 70 to 90% (DOE, 1994). Flotation bench scale tests to remove Ra-226 achieved 80% volume reductions with activity levels reduce to 6 pCi/g in the clean fraction (Misra, 2001).
Emissions: Gaseous and Particulate If VOCs or radon are present in soil, gaseous emissions can be generated during treatment. In addition, excavation of contaminated soil can generate fugitive gas and dust. These emissions may need to be captured and/or controlled.
Reliability Bench scale tests have shown consistent and successful segregation of radionuclide-contaminated fines from clean, larger, soil-particle fractions (DOE, 1994). Clean soil can be returned to the excavated site, although the residual fines and wash solution could require further treatment and/or disposal.
Process Time Vendors estimated process rates of 10 to 50 tons per hour during presentations to DOE (DOE, 2001).
Applicable Media Soil, sediment
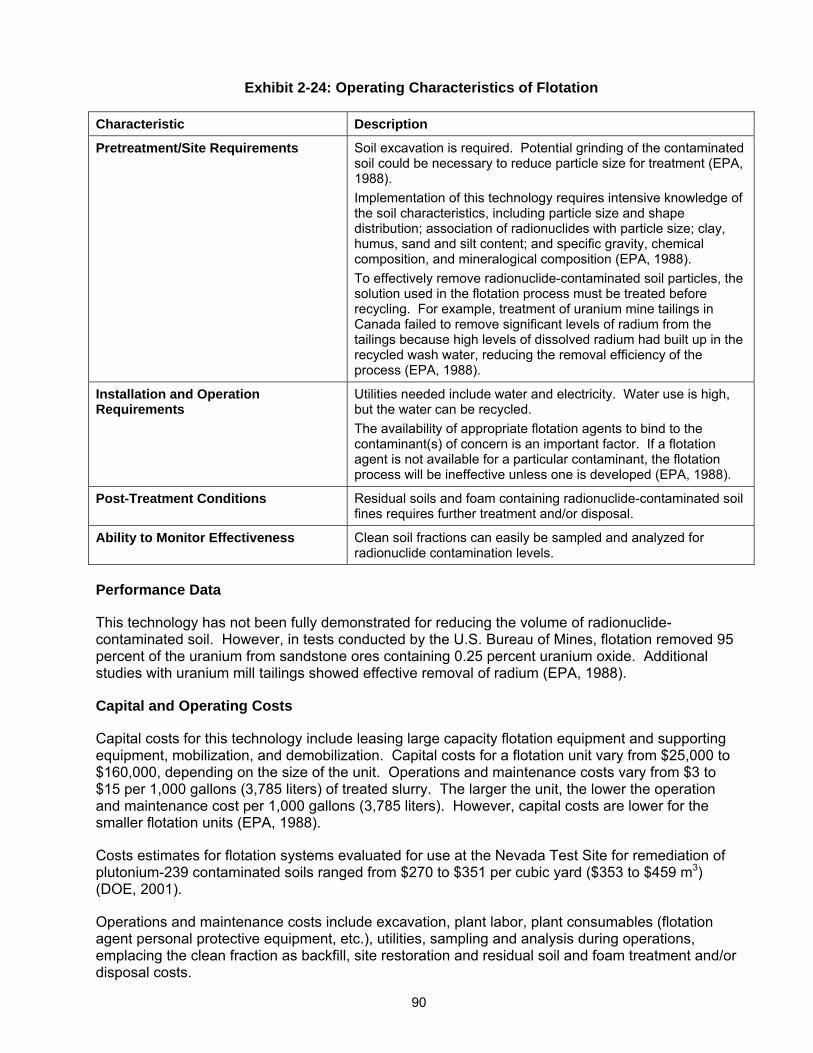
90
Exhibit 2-24: Operating Characteristics of Flotation
Characteristic Description
Pretreatment/Site Requirements Soil excavation is required. Potential grinding of the contaminated soil could be necessary to reduce particle size for treatment (EPA, 1988). Implementation of this technology requires intensive knowledge of the soil characteristics, including particle size and shape distribution; association of radionuclides with particle size; clay, humus, sand and silt content; and specific gravity, chemical composition, and mineralogical composition (EPA, 1988). To effectively remove radionuclide-contaminated soil particles, the solution used in the flotation process must be treated before recycling. For example, treatment of uranium mine tailings in Canada failed to remove significant levels of radium from the tailings because high levels of dissolved radium had built up in the recycled wash water, reducing the removal efficiency of the process (EPA, 1988).
Installation and Operation Requirements
Utilities needed include water and electricity. Water use is high, but the water can be recycled. The availability of appropriate flotation agents to bind to the contaminant(s) of concern is an important factor. If a flotation agent is not available for a particular contaminant, the flotation process will be ineffective unless one is developed (EPA, 1988).
Post-Treatment Conditions Residual soils and foam containing radionuclide-contaminated soil fines requires further treatment and/or disposal.
Ability to Monitor Effectiveness Clean soil fractions can easily be sampled and analyzed for radionuclide contamination levels.
Performance Data
This technology has not been fully demonstrated for reducing the volume of radionuclide-contaminated soil. However, in tests conducted by the U.S. Bureau of Mines, flotation removed 95 percent of the uranium from sandstone ores containing 0.25 percent uranium oxide. Additional studies with uranium mill tailings showed effective removal of radium (EPA, 1988).
Capital and Operating Costs
Capital costs for this technology include leasing large capacity flotation equipment and supporting equipment, mobilization, and demobilization. Capital costs for a flotation unit vary from $25,000 to $160,000, depending on the size of the unit. Operations and maintenance costs vary from $3 to $15 per 1,000 gallons (3,785 liters) of treated slurry. The larger the unit, the lower the operation and maintenance cost per 1,000 gallons (3,785 liters). However, capital costs are lower for the smaller flotation units (EPA, 1988).
Costs estimates for flotation systems evaluated for use at the Nevada Test Site for remediation of plutonium-239 contaminated soils ranged from $270 to $351 per cubic yard ($353 to $459 m3) (DOE, 2001).
Operations and maintenance costs include excavation, plant labor, plant consumables (flotation agent personal protective equipment, etc.), utilities, sampling and analysis during operations, emplacing the clean fraction as backfill, site restoration and residual soil and foam treatment and/or disposal costs.
91
Commercial Availability
Although many flotation systems have been developed to address radionuclide-contaminated soils, few have been tested beyond the bench scale. A pilot test of a one-ton per hour single stage system was performed at the Nevada Test Site with limited success (DOE, 2001). Vendors have made presentations to DOE regarding flotation systems that can be used for remediation of uranium, plutonium, and thorium at sites such as the Nevada Test Site (DOE, 2001). Some of these vendors are listed in the following subsection.
Contact Information
General Contacts:
EPA National Risk Management Research Laboratory
Richard Griffiths 26 West Martin Luther King Drive Cincinnati, OH 45268 (513) 569-7832 [email protected]
Vendors:
This is a partial listing of available vendors. Additional and updated vendor information can be obtained from the EPA Remediation and Characterization Technologies website: http://www.epareachit.org/, the EPA Cleanup Information website: http://clu-in.org, and by contacting the federal agency contact listed above.
URS Corporation Contact: Mr. Ye Yi 756 East Winchester Street, # 400 Salt Lake City, UT 84107 (801) 904-4000 [email protected]
University of Nevada, Reno Contact: Rajendra Mehta OSPA/Mail Stop 325 Reno, NV 89557 (775) 784-4040 [email protected]
Flotation References
Misra, M., Mehta, R. and Lan, P. Remediation of Radium from Contaminated Soil. University of Nevada, Reno. Prepared for U.S. EPA National Risk Management Research Laboratory, December 2001. EPA/600/R-01/099.
Organization for Economic Cooperation and Development. Uranium Extraction Technology, 1983. OECD, Paris.
Ralcevic, D. “Decontamination of Elliot Lake Tailings.” CIM Bulletin 72(808), pp. 109-115, 1979.
U.S. Department of Energy. Proceedings from the Remediation of Radioactive Surface Soils Workshop, August 14-15, 2001, Las Vegas, Nev. Hosted by U.S. DOE National Nuclear Security Administration, Nevada Operations Office, 2001. DOE/NV-798.
U.S. Department of Energy. Heavy Metals Contaminated Soil Project, Resource Recovery Project
92
and Dynamic Underground Stripping Project: Technology Summary, February 1994. DOE/EM-0129P.
U.S. Environmental Protection Agency. Technological Approaches to the Cleanup of Radiologically Contaminated Superfund Sites, 1988. EPA/540/2-88/002.
2.5 VITRIFICATION
Vitrification involves heating contaminated media to extremely high temperatures, then cooling them to form a solid mass. Upon cooling, a dense glassified mass remains, trapping radioactive contaminants. The process can be applied to contaminated soil, sludge, sediment, mine tailings, buried waste, and metal combustibles. Different devices can be used, such as plasma torches or electric arc furnaces. An off-gas system could be required for emissions during vitrification because some organic contaminants will likely be destroyed and some inorganics, including low melting point radionuclides, will volatilize due to the high temperatures involved.
Vitrification technologies can be particularly useful for treating radioactive or mixed waste and is the treatment of choice for high-level radioactive waste. EPA has designated vitrification as a Best Demonstrated Available Technology for high level waste (40CFR 268.42, Table 3).
Vitrification processes can be performed both in-situ and ex-situ. This section discusses both types of processes in detail. Ex-situ processes addressed include: plasma centrifugal furnace, arc melter vitrification, graphite DC plasma arc melter, plasma fixed hearth, and thermal plasma processes.
2.5.1 In-Situ Vitrification
Description
In-situ vitrification uses an electric current to melt soil or other media at extremely high temperatures (1,600 to 2,000 °C or 2,900 to 3,650 °F) (EPA, 1997a). Radionuclides and other pollutants are immobilized within the vitrified glass, a chemically stable, leach-resistant, durable material similar to obsidian or basalt rock. In-situ vitrification volatilizes and destroys most organic pollutants by pyrolysis, breaking the organics down into their elemental components. A vacuum hood is usually placed over the treated area to collect off-gases, which are treated before release. Because of the high temperature of the melt, no residual organic contamination remains in the glass monolith. Upon cooling there is a net volume reduction of the treated material. Most in-situ vitrification processes utilize joule heating of the soil (electricity is passed through the soil to melt it). However, a plasma torch for in-situ melting of soil has been demonstrated at the Savannah River Site (Blundy and Zionkowski, 1997).
Traditional in-situ vitrification uses a square array of four graphite electrodes that allows a melt width of approximately 20 to 40 feet (6.1 to 12.2 m) and a potential treatment depth of up to 20 feet (6.1 m). Multiple locations, referred to as settings, can be used for remediation of a larger contaminated area. The electric power is supplied to the electrodes through flexible conductors. Initially, the electrodes are inserted one to two feet (0.3 to 1.2 m) below the soil surface, and a conductive starter path (consisting of a mixture of flaked graphite and glass frit) is laid between them. An electric potential is applied to the electrodes to establish an electrical current in the starter path that heats up and causes the surrounding soil to melt. Once the soil is melted, it too becomes electrically conductive. As the power is applied, the melt continues downward and outward at an average rate of 1 to 2 inches (2.5 to 5.1 cm) per hour. The electrode array is lowered progressively, as the melt grows, to the desired treatment depth. When complete, the mass of a single melt can exceed 1000 tons (EPA, 1994a; EPA, 1995a).
A full-scale demonstration of non-traditional in-situ vitrification (now referred to as planar in-situ
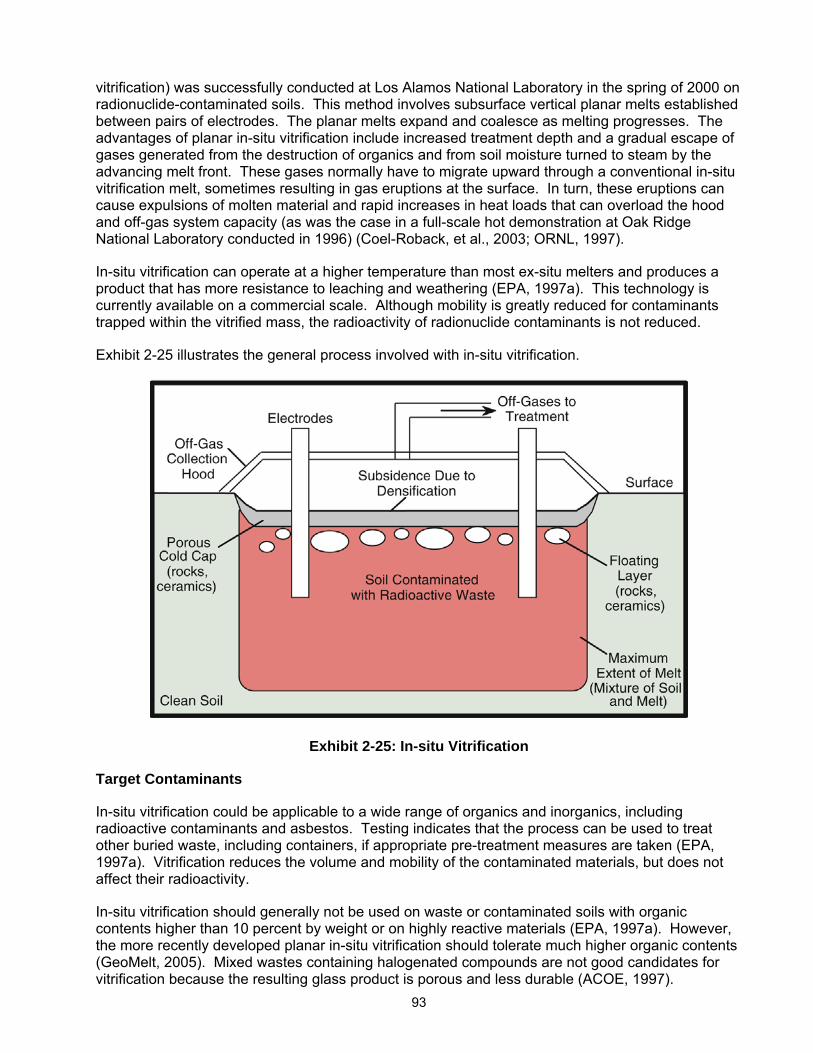
93
vitrification) was successfully conducted at Los Alamos National Laboratory in the spring of 2000 on radionuclide-contaminated soils. This method involves subsurface vertical planar melts established between pairs of electrodes. The planar melts expand and coalesce as melting progresses. The advantages of planar in-situ vitrification include increased treatment depth and a gradual escape of gases generated from the destruction of organics and from soil moisture turned to steam by the advancing melt front. These gases normally have to migrate upward through a conventional in-situ vitrification melt, sometimes resulting in gas eruptions at the surface. In turn, these eruptions can cause expulsions of molten material and rapid increases in heat loads that can overload the hood and off-gas system capacity (as was the case in a full-scale hot demonstration at Oak Ridge National Laboratory conducted in 1996) (Coel-Roback, et al., 2003; ORNL, 1997).
In-situ vitrification can operate at a higher temperature than most ex-situ melters and produces a product that has more resistance to leaching and weathering (EPA, 1997a). This technology is currently available on a commercial scale. Although mobility is greatly reduced for contaminants trapped within the vitrified mass, the radioactivity of radionuclide contaminants is not reduced.
Exhibit 2-25 illustrates the general process involved with in-situ vitrification.
Exhibit 2-25: In-situ Vitrification
Target Contaminants
In-situ vitrification could be applicable to a wide range of organics and inorganics, including radioactive contaminants and asbestos. Testing indicates that the process can be used to treat other buried waste, including containers, if appropriate pre-treatment measures are taken (EPA, 1997a). Vitrification reduces the volume and mobility of the contaminated materials, but does not affect their radioactivity.
In-situ vitrification should generally not be used on waste or contaminated soils with organic contents higher than 10 percent by weight or on highly reactive materials (EPA, 1997a). However, the more recently developed planar in-situ vitrification should tolerate much higher organic contents (GeoMelt, 2005). Mixed wastes containing halogenated compounds are not good candidates for vitrification because the resulting glass product is porous and less durable (ACOE, 1997).
94
Most metals are captured in the melt and are not significantly volatilized. The exception is mercury, which is essentially completely volatilized. Lead and cadmium are also volatilized to a high degree during in-situ vitrification. Therefore, mixed wastes with high levels of mercury, lead, and/or cadmium are generally not good candidates for vitrification (EPA, 1992).
Applicable Site Characteristics
High soil moisture and salt content can increase electrical needs and cost. In-situ vitrification treatment on soils or waste with moisture contents of over 25 percent might not be cost efficient and dewatering might have to be performed before treatment (EPA, 1992). To effectively immobilize radionuclides and heavy metals, soils should have greater than 30 percent glass-forming materials (SiO2) (EPA, 1997b).
Concentrations of fissionable materials, void volumes and percentages of metals, rubble, and combustible organics must also be considered. Criticality limits have been conservatively placed at 30-kg plutonium per in-situ vitrification setting (DOE, 1995). Although in-situ vitrification has successfully processed soils with elemental metal concentrations of up to 37 percent, high amounts of metal can be a problem because of short-circuiting (EPA, 1997a). Soils and waste that contain greater than 55 percent inorganic debris and/or rubble are difficult to treat with in-situ vitrification (EPA, 1997c). Also, soils and waste with high organic concentrations might not be treatable by some in-situ vitrification systems because of the excessive heat loadings resulting from combustion of the gases produced.
The in-situ vitrification process is not applicable to soils or waste containing sealed containers such as drums, tanks or paint cans since pressurized gases will be released that can disrupt the melt. The use of dynamic disruption and compaction to break open containers before treatment can alleviate this potential type of disturbance (EPA, 1997a).
The traditional in-situ vitrification process works best on homogeneous soils since different strata can interfere with the extent (i.e., depth in soil) to which the process is effective. In order to keep the melt from flowing under the influence of gravity, surface slopes in the treatment area should be less than 5 percent. Traditional in-situ vitrification can only treat near-surface contamination (within about 20 feet (6.1 m) of the surface). Planar in-situ vitrification can be performed at depths greater than 30 feet (9.1 m) and can melt selected intervals in the subsurface (GeoMelt, 2005). Contaminated soils to be treated at depths of less than six feet (1.8 m) might need additional overburden placed over the treatment area to help retain volatile metals (EPA, 1995b).
The waste and/or contaminated media must have sufficient alkali content (i.e. Na2O, Li2O and K2O) to ensure the proper balance between electrical conductivity and melting temperature. More than 15 percent of alkali increases the electrical conductivity such that insufficient heat is developed, while too little (less than 1.4 percent) results in undesirably, high melt temperatures. Most soils have sufficient alkali to allow use of in-situ vitrification. In cases where alkali content is low, solutions containing alkali can be injected into the soil (EPA, 1997a).
Waste Management Issues
Volatile radionuclides (cesium-137, strontium-90, tritium, and others) can be released during vitrification and should be captured by an off-gas system. Waste from this off-gas system, including scrubber solution and spent filters, will have to be treated and/or disposed of. Dependent on the corrosiveness of the off-gases, the temperature during treatment and the duration of treatment, some number of off-gas hood panels might have to be disposed of as waste (EPA, 1997a). Other waste that will be generated include decontamination liquids and materials and discarded personal protective equipment. Some of these wastes can be disposed of by vitrification in subsequent in-situ vitrification settings.
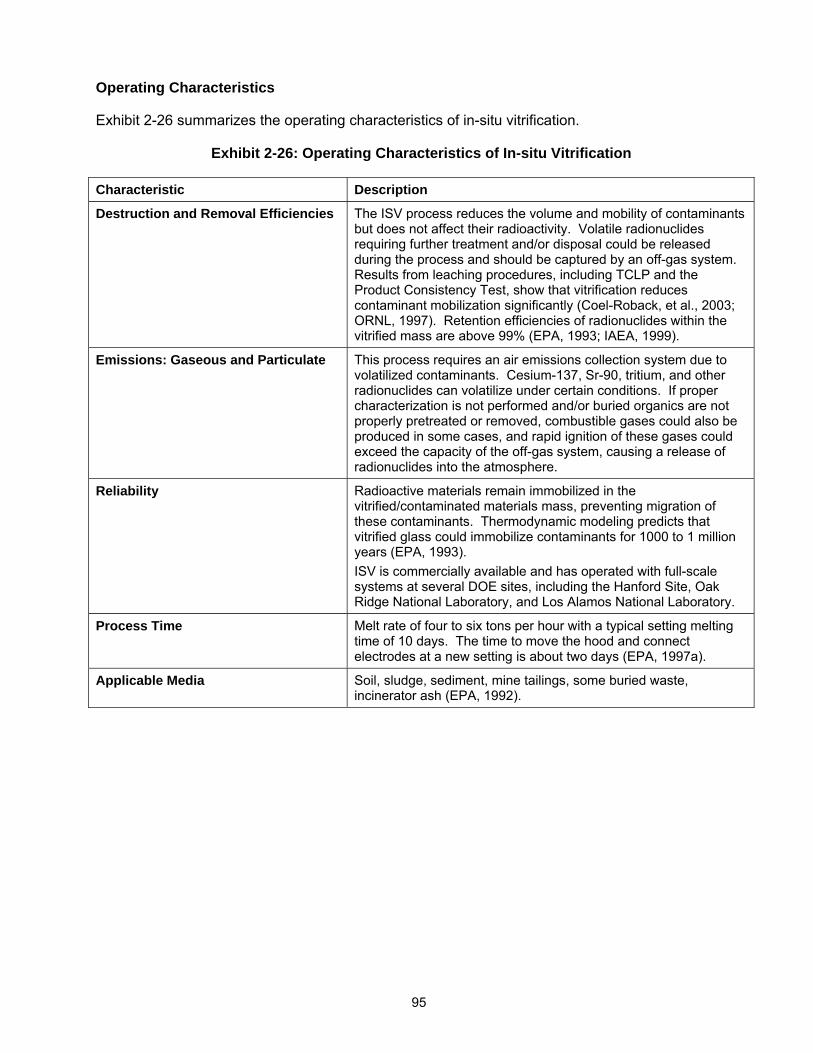
95
Operating Characteristics
Exhibit 2-26 summarizes the operating characteristics of in-situ vitrification.
Exhibit 2-26: Operating Characteristics of In-situ Vitrification
Characteristic Description
Destruction and Removal Efficiencies The ISV process reduces the volume and mobility of contaminants but does not affect their radioactivity. Volatile radionuclides requiring further treatment and/or disposal could be released during the process and should be captured by an off-gas system. Results from leaching procedures, including TCLP and the Product Consistency Test, show that vitrification reduces contaminant mobilization significantly (Coel-Roback, et al., 2003; ORNL, 1997). Retention efficiencies of radionuclides within the vitrified mass are above 99% (EPA, 1993; IAEA, 1999).
Emissions: Gaseous and Particulate This process requires an air emissions collection system due to volatilized contaminants. Cesium-137, Sr-90, tritium, and other radionuclides can volatilize under certain conditions. If proper characterization is not performed and/or buried organics are not properly pretreated or removed, combustible gases could also be produced in some cases, and rapid ignition of these gases could exceed the capacity of the off-gas system, causing a release of radionuclides into the atmosphere.
Reliability Radioactive materials remain immobilized in the vitrified/contaminated materials mass, preventing migration of these contaminants. Thermodynamic modeling predicts that vitrified glass could immobilize contaminants for 1000 to 1 million years (EPA, 1993). ISV is commercially available and has operated with full-scale systems at several DOE sites, including the Hanford Site, Oak Ridge National Laboratory, and Los Alamos National Laboratory.
Process Time Melt rate of four to six tons per hour with a typical setting melting time of 10 days. The time to move the hood and connect electrodes at a new setting is about two days (EPA, 1997a).
Applicable Media Soil, sludge, sediment, mine tailings, some buried waste, incinerator ash (EPA, 1992).
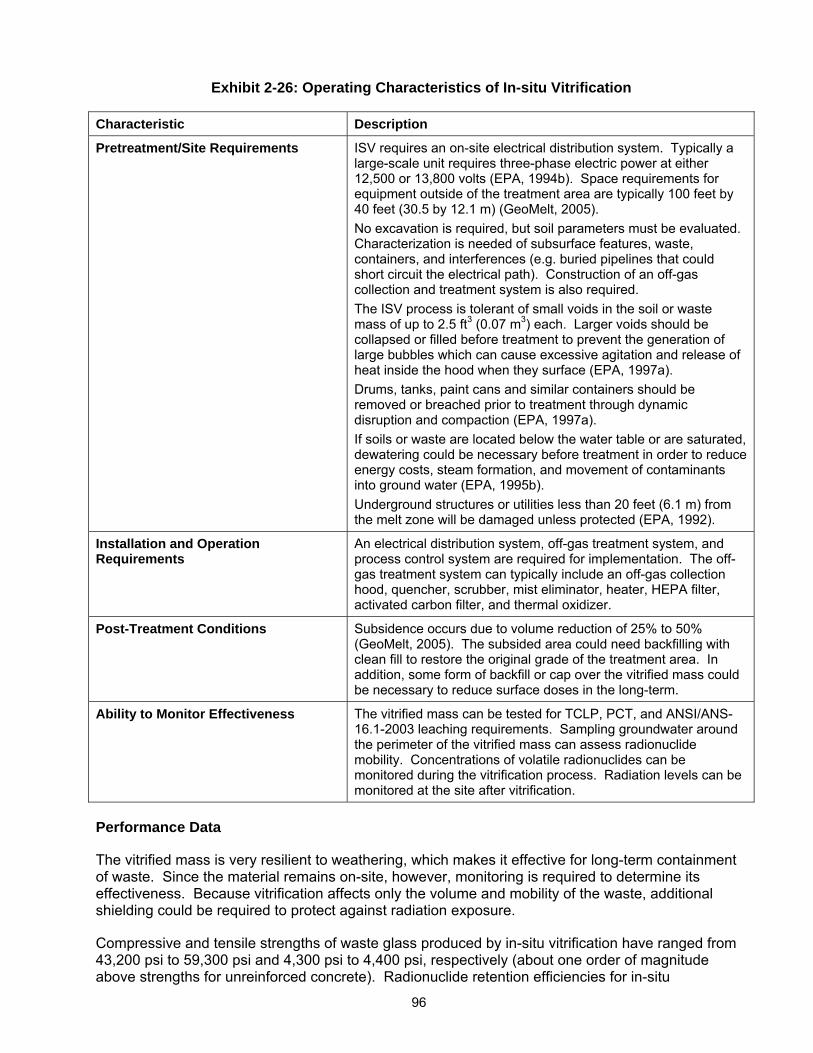
96
Exhibit 2-26: Operating Characteristics of In-situ Vitrification
Characteristic Description
Pretreatment/Site Requirements ISV requires an on-site electrical distribution system. Typically a large-scale unit requires three-phase electric power at either 12,500 or 13,800 volts (EPA, 1994b). Space requirements for equipment outside of the treatment area are typically 100 feet by 40 feet (30.5 by 12.1 m) (GeoMelt, 2005). No excavation is required, but soil parameters must be evaluated. Characterization is needed of subsurface features, waste, containers, and interferences (e.g. buried pipelines that could short circuit the electrical path). Construction of an off-gas collection and treatment system is also required. The ISV process is tolerant of small voids in the soil or waste mass of up to 2.5 ft3 (0.07 m3) each. Larger voids should be collapsed or filled before treatment to prevent the generation of large bubbles which can cause excessive agitation and release of heat inside the hood when they surface (EPA, 1997a). Drums, tanks, paint cans and similar containers should be removed or breached prior to treatment through dynamic disruption and compaction (EPA, 1997a). If soils or waste are located below the water table or are saturated, dewatering could be necessary before treatment in order to reduce energy costs, steam formation, and movement of contaminants into ground water (EPA, 1995b). Underground structures or utilities less than 20 feet (6.1 m) from the melt zone will be damaged unless protected (EPA, 1992).
Installation and Operation Requirements
An electrical distribution system, off-gas treatment system, and process control system are required for implementation. The off-gas treatment system can typically include an off-gas collection hood, quencher, scrubber, mist eliminator, heater, HEPA filter, activated carbon filter, and thermal oxidizer.
Post-Treatment Conditions Subsidence occurs due to volume reduction of 25% to 50% (GeoMelt, 2005). The subsided area could need backfilling with clean fill to restore the original grade of the treatment area. In addition, some form of backfill or cap over the vitrified mass could be necessary to reduce surface doses in the long-term.
Ability to Monitor Effectiveness The vitrified mass can be tested for TCLP, PCT, and ANSI/ANS-16.1-2003 leaching requirements. Sampling groundwater around the perimeter of the vitrified mass can assess radionuclide mobility. Concentrations of volatile radionuclides can be monitored during the vitrification process. Radiation levels can be monitored at the site after vitrification.
Performance Data
The vitrified mass is very resilient to weathering, which makes it effective for long-term containment of waste. Since the material remains on-site, however, monitoring is required to determine its effectiveness. Because vitrification affects only the volume and mobility of the waste, additional shielding could be required to protect against radiation exposure.
Compressive and tensile strengths of waste glass produced by in-situ vitrification have ranged from 43,200 psi to 59,300 psi and 4,300 psi to 4,400 psi, respectively (about one order of magnitude above strengths for unreinforced concrete). Radionuclide retention efficiencies for in-situ
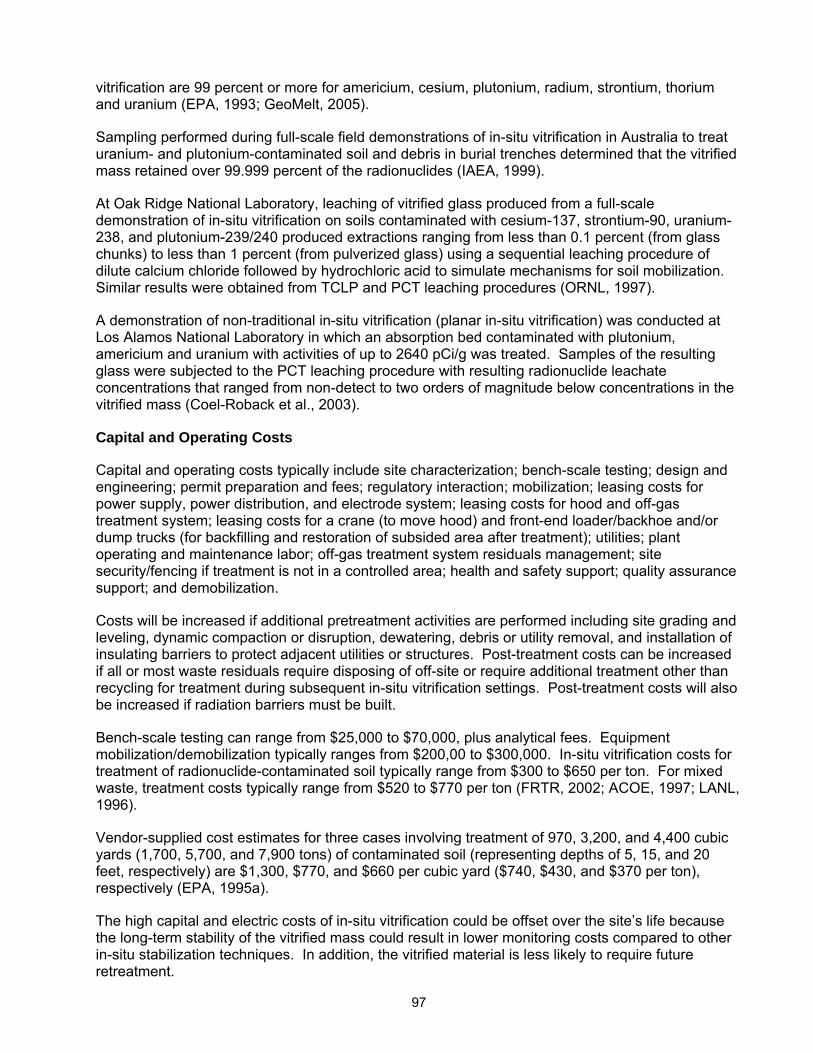
97
vitrification are 99 percent or more for americium, cesium, plutonium, radium, strontium, thorium and uranium (EPA, 1993; GeoMelt, 2005).
Sampling performed during full-scale field demonstrations of in-situ vitrification in Australia to treat uranium- and plutonium-contaminated soil and debris in burial trenches determined that the vitrified mass retained over 99.999 percent of the radionuclides (IAEA, 1999).
At Oak Ridge National Laboratory, leaching of vitrified glass produced from a full-scale demonstration of in-situ vitrification on soils contaminated with cesium-137, strontium-90, uranium-238, and plutonium-239/240 produced extractions ranging from less than 0.1 percent (from glass chunks) to less than 1 percent (from pulverized glass) using a sequential leaching procedure of dilute calcium chloride followed by hydrochloric acid to simulate mechanisms for soil mobilization. Similar results were obtained from TCLP and PCT leaching procedures (ORNL, 1997).
A demonstration of non-traditional in-situ vitrification (planar in-situ vitrification) was conducted at Los Alamos National Laboratory in which an absorption bed contaminated with plutonium, americium and uranium with activities of up to 2640 pCi/g was treated. Samples of the resulting glass were subjected to the PCT leaching procedure with resulting radionuclide leachate concentrations that ranged from non-detect to two orders of magnitude below concentrations in the vitrified mass (Coel-Roback et al., 2003).
Capital and Operating Costs
Capital and operating costs typically include site characterization; bench-scale testing; design and engineering; permit preparation and fees; regulatory interaction; mobilization; leasing costs for power supply, power distribution, and electrode system; leasing costs for hood and off-gas treatment system; leasing costs for a crane (to move hood) and front-end loader/backhoe and/or dump trucks (for backfilling and restoration of subsided area after treatment); utilities; plant operating and maintenance labor; off-gas treatment system residuals management; site security/fencing if treatment is not in a controlled area; health and safety support; quality assurance support; and demobilization.
Costs will be increased if additional pretreatment activities are performed including site grading and leveling, dynamic compaction or disruption, dewatering, debris or utility removal, and installation of insulating barriers to protect adjacent utilities or structures. Post-treatment costs can be increased if all or most waste residuals require disposing of off-site or require additional treatment other than recycling for treatment during subsequent in-situ vitrification settings. Post-treatment costs will also be increased if radiation barriers must be built.
Bench-scale testing can range from $25,000 to $70,000, plus analytical fees. Equipment mobilization/demobilization typically ranges from $200,00 to $300,000. In-situ vitrification costs for treatment of radionuclide-contaminated soil typically range from $300 to $650 per ton. For mixed waste, treatment costs typically range from $520 to $770 per ton (FRTR, 2002; ACOE, 1997; LANL, 1996).
Vendor-supplied cost estimates for three cases involving treatment of 970, 3,200, and 4,400 cubic yards (1,700, 5,700, and 7,900 tons) of contaminated soil (representing depths of 5, 15, and 20 feet, respectively) are $1,300, $770, and $660 per cubic yard ($740, $430, and $370 per ton), respectively (EPA, 1995a).
The high capital and electric costs of in-situ vitrification could be offset over the site’s life because the long-term stability of the vitrified mass could result in lower monitoring costs compared to other in-situ stabilization techniques. In addition, the vitrified material is less likely to require future retreatment.
98
Commercial Availability
In-situ vitrification is a proven, commercially available technology. The current number of vendors, however, is limited. Two vendors of in-situ vitrification are listed in the following subsection.
Contact Information
General Contacts:
EPA National Risk Management Research Laboratory
Terri Richardson 26 West Martin Luther King Drive Cincinnati, OH 45268 (513) 569-7949 [email protected]
Vendors:
GeoMelt 1135 Jadwin Avenue Richland, WA 99352 (509) 942-1114 http://www.geomelt.com
Electro-Pyrolysis Inc. 996 Old Eagle School Road Suite 1118 Wayne, PA 19087 (610) 964-8570 http://www.electropyrolysis.com
In-Situ Vitrification References
Blundy, R. and Zionkowski, P. Final Report for the Demonstration of Plasma In-Situ Vitrification at the 904-65G K-Reactor Seepage Basin. Westinghouse Savannah River Company, December 1997. WSRC-RP-97-405, Rev. 0.
Coel-Roback, B., Lowery, P., Springer, M., Thompson, L., and Huddleston, G. “Non-Traditional In-Situ Vitrification – A Technology Demonstration at Los Alamos National Laboratory.” Presented at: Waste Management 2003 Conference, February 23 - 27, 2003, Tucson, Ariz.
Federal Remediation Technologies Roundtable. Remediation Technologies Screening Matrix and Reference Guide, Version 4.0: Solidification/Stabilization (In-Situ), 2002. http://www.frtr.gov/matrix2/section4/4-8.html
GeoMelt. Vendor Webpage, 2005. http://www.geomelt.com/
International Atomic Energy Agency. Technologies for Remediation of Radioactively Contaminated Sites, 1999. IAEA-TECDOC-1086.
Los Alamos National Laboratory. A Compendium of Cost Data for Environmental Remediation Technologies, Second Edition, 1996. LA-UR-96-2205. http://www.lanl.gov/orgs/d/d4/enviro/etcap/
Oak Ridge National Laboratory. In-Situ Vitrification Demonstration at Pit 1, Oak Ridge National Laboratory, Volume 1: Results of Treatability Study, 1997. ORNL/ER-425/V1.
U.S. Army Corps of Engineers. Guidance for Low-Level Radioactive Waste (LLRW) and Mixed Waste (MW) Treatment and Handling, 1997. EM-1110-1-4002.
99
U.S. Department of Energy. “In-Situ Vitrification of Contaminated Soils.” Technology Catalogue, Second Edition, April 1995. DOE/EM-0235.
U.S. Environmental Protection Agency. Innovative Site Remediation Technology, Design & Application, Volume 4: Stabilization/Solidification, 1997a. EPA/542/B-97/007.
U.S. Environmental Protection Agency. Engineering Bulletin: Technology Alternatives for the Remediation of Soils Contaminated with As, Cd, Cr, Hg, and Pb, 1997b. EPA/540/S-97/500.
U.S. Environmental Protection Agency. Best Management Practices (BMPs) for Soil Treatment Technologies: Suggested Operational Guidelines to Prevent Cross-media Transfer of Contaminants During Clean-Up Activities, 1997c. EPA/530/R-97/007.
U.S. Environmental Protection Agency. Geosafe Corporation In-situ Vitrification, Innovative Technology Evaluation Report, March 1995a. EPA/540/R-94/520.
U.S. Environmental Protection Agency. Contaminants and Remedial Options at Selected Metal-Contaminated Sites, 1995b. EPA/540/R-95/512.
U.S. Environmental Protection Agency. “Geosafe Corporation (In-Situ Vitrification).” Superfund Innovative Technology Evaluation Program, Technology Profiles, Seventh Edition, November 1994a. EPA/540/R-94/526.
U.S. Environmental Protection Agency. Engineering Bulletin: In-situ Vitrification Treatment, October 1994b. EPA/540/S-94/504.
U.S. Environmental Protection Agency. Approaches for the Remediation of Federal Facility Sites Contaminated With Explosive or Radioactive Wastes, 1993. EPA/625/R-93/013.
U.S. Environmental Protection Agency. Handbook: Vitrification Technologies for Treatment of Hazardous and Radioactive Waste, 1992. EPA/625/R-92/002.
2.5.2 Ex-Situ Vitrification
Description
Ex-situ vitrification applies heat to destroy some contaminants (e.g., organics) and immobilize others (e.g., radioactive waste) into a dense, glassified mass. While the final non-leaching glassy solid product does not require further treatment, vitrification does not reduce the waste’s radioactivity. Vitrified radioactive waste must therefore be properly handled, stored and disposed of after treatment. During all ex-situ vitrification processes, volatiles are released and organics are either pyrolyzed or oxidized. Therefore, systems for off-gas capture and treatment are necessary to minimize air emissions. Ex-situ vitrification can treat many different forms of radioactive waste and forms a strong, stable, leach-resistant product that is easily handled. Mobility is greatly reduced for contaminants trapped within the vitrified mass. After treatment with ex-situ vitrification, volume reductions of waste can range as high as 80 percent depending on waste type (ACOE, 1997).
Heating devices that can be used for ex-situ vitrification include joule-process heating furnaces, plasma furnaces, electric arc furnaces, microwave furnaces, and coal-, gas- or oil-fired cyclone furnaces (EPA, 1997a; EPA, 2003).
Joule-process heating furnaces for the treatment of contaminated materials evolved directly from glass furnaces in the glass industry. This type of electric furnace uses a ceramic-lined, steel-shelled melter to contain the molten glass and waste materials to be melted. The melt is initiated by
100
some form of pre-heating and is continued by joule heating as current is passed through the melt between two electrodes. Melt temperatures range from about 1,000 to 1,600oC (or 1,830 to 2,900oF). Waste materials and glass batch chemicals are fed directly onto the surface of the molten glass melt. This cold cap of material functions as the interface between the incoming material and the melt. Although water and some volatiles are evaporated from the melt and enter the off-gas system, the cold cap filters and holds some of the volatilized waste for re-incorporation into the melt. The furnace is periodically tapped or drained to remove the glass product. The molten glass can be cast into containers or quenched in a water bath to produce a granular residual product. Variations of the joule-process heating furnace include stir melters (molten material is agitated by a stirrer which increases heat distribution and throughput) and liquid-fed ceramic melters (converts liquid waste directly into glass without pre-calcination) (EPA, 1992a).
Plasma furnaces use an electrical arc to convert an injected gas (typically nitrogen, oxygen, noble gases such as argon, air or mixtures of these) into a plasma or hot ionized gas to melt the waste materials. The ionized plasmas are extremely hot, ranging from about 2,300 to 5,300oC (or 4,200 to 9,600oF) and are used to melt the waste to temperatures of up to 2,200oC (or 4,000oF). In the method typically used for vitrification of radioactive waste, the electric arc uses the waste material as one of the electrodes (an application called transferred arc) and melts the waste by both the hot plasma torch and the electrical resistance. One variation of this transferred arc method employs a rotating reactor that serves as one of the electrodes. Waste is fed into a rotating reactor and the waste and molten material are held against the side by centrifugal force. During the rotation, the waste moves through the stationary plasma torch. To remove the molten material from the furnace, the hearth’s rotation is slowed and the slag flows through a bottom opening. Effluent gases are generally kept in a separate container where high temperatures combust/oxidize the contents (EPA, 1992a; DOE, 1998a).
Electric arc furnaces provide heat for vitrification by creating current flow between two electrodes in an ionized gas environment. They differ from plasma furnaces in that plasma is not created and therefore is not part of the heat transfer mechanism. A typical electric arc furnace contains carbon electrodes, cooled side walls, a continuous feed system, an off-gas treatment system, and slag and metals tapping capability. In this process, waste is fed into the top of a refractory chamber where it is heated to temperatures greater than 1,700°C (or 3,100°F) by carbon electrodes. The weight of the waste pushes the molten slag through a bottom opening into a cooling chamber, where slag and molten metals can be separated. Volatile substances, including some radionuclides, emitted during the process are treated in an off-gas collection and treatment system (EPA, 1992a; Wittle, 2001).
In microwave furnaces, the material to be treated is placed in an alternating electric field causing successive distortion of the molecules and heating of the material. A microwave generator produces the energy that is directed by a waveguide to the waste material by reflecting the microwaves from its metal walls. The heat causing the melt is produced directly and solely in the mass of the material to be treated. Batches of waste fed into the melter can be placed in crucibles or drums that serve as melt containers, and storage containers after cooling. Microwave furnaces can be limited to waste with low percentages of elemental metal and carbon because of problems with electric arcing (EPA, 1992a; EPA, 1997a).
Cyclone furnaces for waste vitrification use fossil fuels to produce the high temperatures (2,400 to 3,000oF) needed for melting. In one application, preheated combustion air, natural gas, and soil or waste material enter tangentially along the cyclone furnace barrel. The soil or waste begins to melt and forms a slag layer that is retained on the furnace barrel wall by centrifugal action. As the soil continues to melt, it exits the cyclone furnace from a tap at the cyclone throat and drops into a water-filled slag tank where it solidifies. Organics are destroyed in the gas phase or in the molten slag layer in the cyclone furnace. Off-gas treatment includes a bag house to capture particulates that can be recycled to the furnace (EPA, 1992a; EPA, 2003).
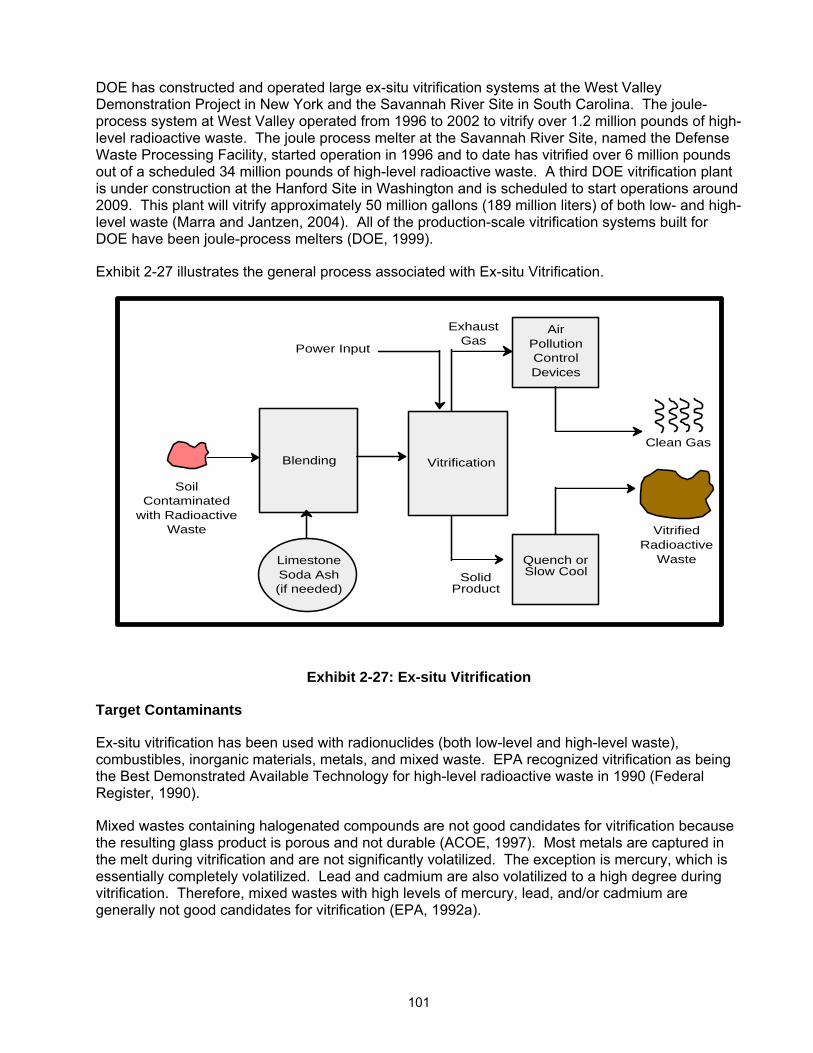
101
DOE has constructed and operated large ex-situ vitrification systems at the West Valley Demonstration Project in New York and the Savannah River Site in South Carolina. The joule-process system at West Valley operated from 1996 to 2002 to vitrify over 1.2 million pounds of high-level radioactive waste. The joule process melter at the Savannah River Site, named the Defense Waste Processing Facility, started operation in 1996 and to date has vitrified over 6 million pounds out of a scheduled 34 million pounds of high-level radioactive waste. A third DOE vitrification plant is under construction at the Hanford Site in Washington and is scheduled to start operations around 2009. This plant will vitrify approximately 50 million gallons (189 million liters) of both low- and high-level waste (Marra and Jantzen, 2004). All of the production-scale vitrification systems built for DOE have been joule-process melters (DOE, 1999).
Exhibit 2-27 illustrates the general process associated with Ex-situ Vitrification.
Power Input
Exhaust
GasAir
Pollution Control Devices
Clean Gas
Slow CoolLimestone Soda Ash (if needed)
Soil Contaminated
with Radioactive Waste
Product
VitrificationBlending
Quench or
Solid
VitrifiedRadioactive
Waste
Exhibit 2-27: Ex-situ Vitrification
Target Contaminants
Ex-situ vitrification has been used with radionuclides (both low-level and high-level waste), combustibles, inorganic materials, metals, and mixed waste. EPA recognized vitrification as being the Best Demonstrated Available Technology for high-level radioactive waste in 1990 (Federal Register, 1990).
Mixed wastes containing halogenated compounds are not good candidates for vitrification because the resulting glass product is porous and not durable (ACOE, 1997). Most metals are captured in the melt during vitrification and are not significantly volatilized. The exception is mercury, which is essentially completely volatilized. Lead and cadmium are also volatilized to a high degree during vitrification. Therefore, mixed wastes with high levels of mercury, lead, and/or cadmium are generally not good candidates for vitrification (EPA, 1992a).
102
Applicable Site Characteristics
Ex-situ vitrification applies to a broad range of solid media including soil, sediment, sludge, debris, and incinerator ash.
Ex-situ vitrification could be difficult to implement under the following circumstances: waste containing greater than 25 percent moisture content that could cause excessive fuel/energy consumption; waste where size reduction and classification are difficult or expensive; or waste contains high amounts of volatile metals (mercury, cadmium, lead) (EPA, 1997b).
Waste Management Issues
Volatile radionuclides (cesium-137, strontium-90, tritium, and others) and volatile heavy metals (mercury, cadmium, lead) can be released during vitrification and should be captured by an off-gas system. Waste from this off-gas system, including scrubber solution and spent filters, will have to be treated and/or disposed of. Other waste that will be generated includes decontamination liquids and materials and discarded personal protective equipment. If a furnace includes a refractory lining, it will need to be shut down periodically so that it can be relined (EPA, 1997a). The old refractory lining might have to be disposed of as a radioactive waste. Some of the off-gas treatment and other waste streams can be recycled back into the vitrification process to help minimize waste.
The vitrified waste contains radioactive material that will require final handling and disposal. The vitrification product is disposable without further stabilization treatment, but must be safely stored to prevent radiation exposure until the vitrified waste is disposed of properly.
Operating Characteristics
Some ex-situ vitrification plants are very compact, are flexible in process control, and are highly automated. Material of different forms can be fed into furnaces. For example, liquids can be pumped; shredded waste can be screw fed; and steel drums can be directly inserted by robotics, opened, and completely melted inside the furnace (Hoffeiner, et al., 1993). Operation of an ex-situ vitrification plant is complex and requires highly trained personnel.
Exhibit 2-28 summarizes the operating characteristics of ex-situ vitrification.
Exhibit 2-28: Operating Characteristics of Ex-situ Vitrification
Characteristic Description
Destruction and Removal Efficiencies
Ex-situ vitrification significantly reduces the mobility and volume of radionuclide-contaminated waste (volume reductions up to 80% with some waste), but does not reduce their radioactivity; volatile radionuclides trapped by the off-gas system require further treatment and/or disposal (ACOE, 1997).
Emissions: Gaseous and Particulate
Since vitrification processes can cause polluted flue gases (i.e., containing radionuclides), appropriate gas collection systems must be used to minimize emissions. Some processes use a wet gas cleaning system, producing extremely clean off-gas (Hoffeiner, et al., 1993). Excavation of contaminated materials for ex-situ vitrification could cause fugitive gas and dust emissions of radionuclides.
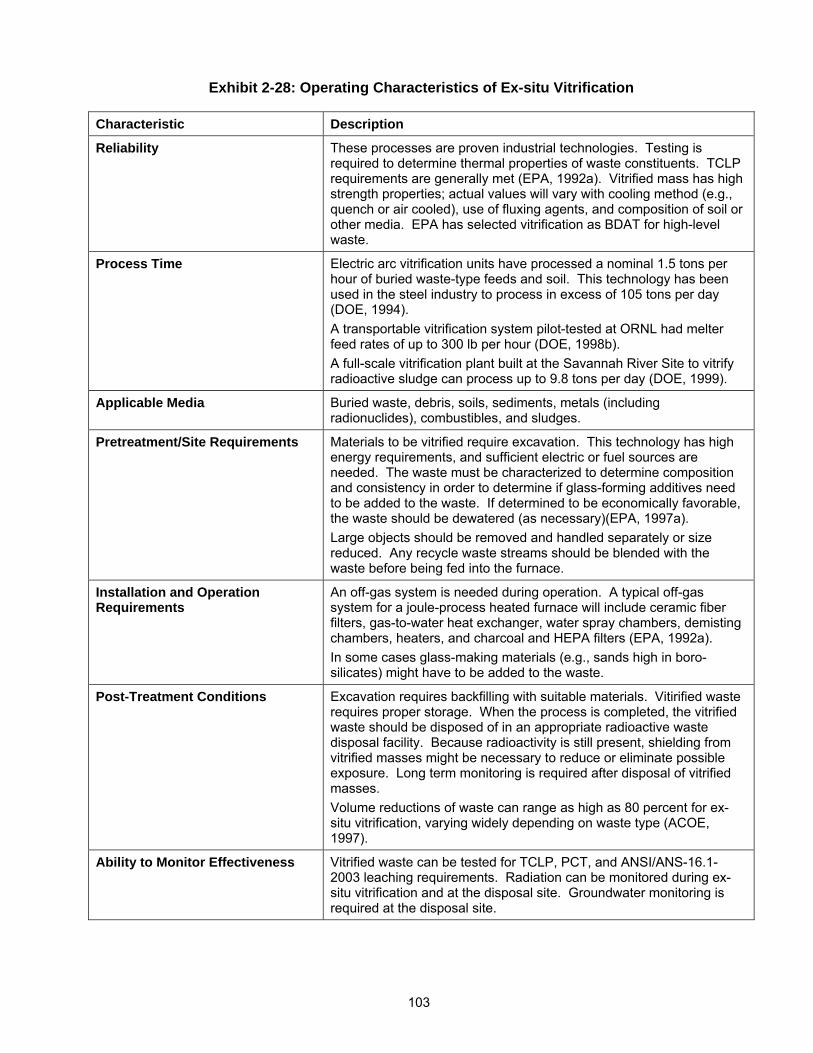
103
Exhibit 2-28: Operating Characteristics of Ex-situ Vitrification
Characteristic Description
Reliability These processes are proven industrial technologies. Testing is required to determine thermal properties of waste constituents. TCLP requirements are generally met (EPA, 1992a). Vitrified mass has high strength properties; actual values will vary with cooling method (e.g., quench or air cooled), use of fluxing agents, and composition of soil or other media. EPA has selected vitrification as BDAT for high-level waste.
Process Time Electric arc vitrification units have processed a nominal 1.5 tons per hour of buried waste-type feeds and soil. This technology has been used in the steel industry to process in excess of 105 tons per day (DOE, 1994). A transportable vitrification system pilot-tested at ORNL had melter feed rates of up to 300 lb per hour (DOE, 1998b). A full-scale vitrification plant built at the Savannah River Site to vitrify radioactive sludge can process up to 9.8 tons per day (DOE, 1999).
Applicable Media Buried waste, debris, soils, sediments, metals (including radionuclides), combustibles, and sludges.
Pretreatment/Site Requirements Materials to be vitrified require excavation. This technology has high energy requirements, and sufficient electric or fuel sources are needed. The waste must be characterized to determine composition and consistency in order to determine if glass-forming additives need to be added to the waste. If determined to be economically favorable, the waste should be dewatered (as necessary)(EPA, 1997a). Large objects should be removed and handled separately or size reduced. Any recycle waste streams should be blended with the waste before being fed into the furnace.
Installation and Operation Requirements
An off-gas system is needed during operation. A typical off-gas system for a joule-process heated furnace will include ceramic fiber filters, gas-to-water heat exchanger, water spray chambers, demisting chambers, heaters, and charcoal and HEPA filters (EPA, 1992a). In some cases glass-making materials (e.g., sands high in boro-silicates) might have to be added to the waste.
Post-Treatment Conditions Excavation requires backfilling with suitable materials. Vitirified waste requires proper storage. When the process is completed, the vitrified waste should be disposed of in an appropriate radioactive waste disposal facility. Because radioactivity is still present, shielding from vitrified masses might be necessary to reduce or eliminate possible exposure. Long term monitoring is required after disposal of vitrified masses. Volume reductions of waste can range as high as 80 percent for ex-situ vitrification, varying widely depending on waste type (ACOE, 1997).
Ability to Monitor Effectiveness Vitrified waste can be tested for TCLP, PCT, and ANSI/ANS-16.1-2003 leaching requirements. Radiation can be monitored during ex-situ vitrification and at the disposal site. Groundwater monitoring is required at the disposal site.
104
Performance Data
Past demonstrations and studies indicate organic contaminants are consistently volatilized and destroyed or successfully captured in off-gas systems while radionuclides are immobilized in applicable media. Vitrified masses have high strength and generally meet EPA TCLP testing requirements. Compressive and tensile strengths of waste glass produced by joule-heated ceramic melters were 43,200 psi and 4,300 psi, respectively (about one order of magnitude above strengths for unreinforced concrete) (EPA, 1992a).
During pilot testing of a transportable joule process heated furnace at Oak Ridge National Laboratory, 8 tons of mixed waste (contaminated with uranium and strontium) were vitrified. EPA Toxicity Characteristic Leaching Procedure test results for heavy metals were 100 times below regulatory limits (DOE, 1998b). Product consistency test results from the testing of vitrified high-level radioactive waste from the Defense Waste Processing Facility at the Savannah River Site in South Carolina show that the leachability of the glass is well below the waste acceptance requirements specified by DOE for vitrified high-level waste forms (Marra, et al., 1999).
Capital and Operating Costs
Capital costs for ex-situ vitrification are high due to its heavy use of energy and the need to transport radioactive waste. Due to the stability of the vitrified product, however, long-term maintenance costs are reduced, even if additional containment shielding is required.
Capital costs can typically include waste characterization, design, bench-scale testing, permit preparation and fees, construction, and purchase of equipment for feed handling, off-gas treatment, glass product handling, and process monitoring and control. Operation costs can typically include soil excavation, operation and maintenance labor, glass-making additives, utilities, sampling and analysis for process control, decontamination and decommissioning, treatment and disposal of off-gas treatment residuals not recycled into the furnace, storage and disposal of the vitrified waste, health and safety support, and quality assurance support (EPA, 1997a).
The cost to develop and build an ex-situ system (electric arc furnace) that can process five tons per hour could cost from $50 to $100 million (EPA, 1994). Dependent on furnace type, typical operating costs could range from $220 to $1,900 per ton (LANL, 1996).
Cost estimates for a joule-process heated furnace for the Weldon Spring Site to treat radioactive sludges and soils included total capital costs of $16.3 million and operation costs over a four-year period of $60.3 million (EPA, 1992a).
As a part of the EPA Superfund Innovative Technology Evaluations program pilot-testing of a gas-fired cyclone furnace, cost estimates were developed for vitrification of 20,000 tons of contaminated soil using a 3.3 ton per hour system. The estimates ranged from $465 to $529 per ton dependent on the percentage of time the system is on line (EPA, 1992b). For an EPA SITE program pilot-test of a plasma arc centrifugal furnace, estimates were developed for a system capable of vitrifying 10,000 tons of contaminated soil. Capital cost for plant construction was estimated at $8 million; mobilization, transport, and installation was estimated at $300,000; and operating costs were estimated at $446 per ton. Total cost per ton was estimated at $774 (EPA, 1992c).
Commercial Availability
Ex-situ vitrification equipment is available and is being manufactured by both the glass-making and ceramic industries and by specialty contractors. There are a number of vendors who have built and operated pilot-scale and/or full-scale ex-situ vitrification systems. Contact information for some of these vendors is included in the following subsection.
105
Contact Information
General Contacts:
EPA National Risk Management Research Laboratory
Terri Richardson 26 West Martin Luther King Drive Cincinnati, OH 45268 (513) 569-7949 [email protected]
Vendors:
This is a partial listing of available vendors. Additional and updated vendor information can be obtained from the EPA Remediation and Characterization Technologies website: http://www.epareachit.org/, the EPA Cleanup Information website: http://clu-in.org, and by contacting the federal agency contact listed above.
Joule-Process Furnaces: Duratek Federal Services Inc. 1009 Commerce Park Dr. Suite 100 Oak Ridge, TN 37830 (865) 481-6300 http://www.duratekinc.com/
Ferro Corporation Attn: Emilio Spinosa Corporate Research 7500 East Pleasant Valley Road Independence, OH 44131 (216) 641-8585 Ext. 6657 http://www.ferro.com
Plasma Furnaces: ReTech Systems LLC 301 South State Street Ukiah, CA 95482 (707) 462-6522 http://www.retechsystemsllc.com/
Electric Arc Furnaces: Electro-Pyrolysis Inc. 996 Old Eagle School Road Suite 1118 Wayne, PA 19087 (610) 964-8570 http://www.electropyrolysis.com/
Cyclone Furnaces: BWX Technologies Inc. Attn: Jerry Maringo 20 South Van Buren Avenue P.O. Box 351 Barberton, OH 44203 (330) 860-6321 http://www.bwxt.com/
106
Vortec Corporation Attn: James Hnat 3770 Ridge Pike Collegeville, PA 19426 (610) 489-2255
Ex-Situ Vitrification References
Federal Register. “Land Disposal Restrictions for Third Third Scheduled Wastes, Final Rule.” 55 FR22627, June 1, 1990.
Hoffeiner, W., Chrubasik, A., and Eschenbach, R. “Volume Reduction and Vitrification of Nuclear Waste With Thermal Plasma.” Proceedings of the 1993 International Conference on Nuclear Waste Management and Environmental Remediation, Volume 3, September 5 - 11, 1993. Prague, Czech Republic.
Los Alamos National Laboratory. A Compendium of Cost Data for Environmental Remediation Technologies, Second Edition, 1996. LA-UR-96-2205. http://www.lanl.gov/orgs/d/d4/enviro/etcap/
Marra, J. and Jantzen, C. Glass – An Environmental Protector. Westinghouse Savannah River Company, 2004. WSRC-MS-2004-00688, Rev. 0.
Marra, S., O’Driscoll, R., Fellinger, T., Ray, J., Patel, P., and Occhipinti, J. DWPF Vitrification – Transition to the Second Batch of HLW Radioactive Sludge. Westinghouse Savannah River Company, 1999. WSRC-MS-99-00141.
U.S. Army Corps of Engineers. Guidance for Low-Level Radioactive Waste (LLRW) and Mixed Waste (MW) Treatment and Handling, 1997. EM-1110-1-4002.
U.S. Department of Energy. Waste Vitrification Systems Lessons Learned. Office of the Deputy Assistant Secretary for Nuclear and Facility Safety, March 1999. http://www.eh.doe.gov/ll/WasteVit.pdf
U.S. Department of Energy. Innovative Technology Summary Report: Plasma Hearth Process. Mixed Waste Focus Area, November 1998a. OST Reference # 26.
U.S. Department of Energy. Innovative Technology Summary Report:Transportable Vitrification System. Mixed Waste Focus Area, September 1998b. OST Reference # 222.
U.S. Department of Energy. Buried Waste Integrated Demonstration. Office of Technology Development, March 1994. DOE/EM-0149P.
U.S. Environmental Protection Agency. Technology Profiles, Eleventh Edition, Volume 1, Demonstration Program, September 2003. EPA/540/R-03/501.
U.S. Environmental Protection Agency. Innovative Site Remediation Technology, Design & Application, Volume 4: Stabilization/Solidification, 1997a. EPA/542/B-97/007.
U.S. Environmental Protection Agency. Engineering Bulletin: Technology Alternatives for the Remediation of Soils Contaminated with As, Cd, Cr, Hg, and Pb, 1997b. EPA/540/S-97/500.
U.S. Environmental Protection Agency. Superfund Innovative Technology Evaluation Program: Technology Profiles, Seventh Edition, November 1994. EPA/540/R-94/526.
U.S. Environmental Protection Agency. Handbook: Vitrification Technologies for Treatment of
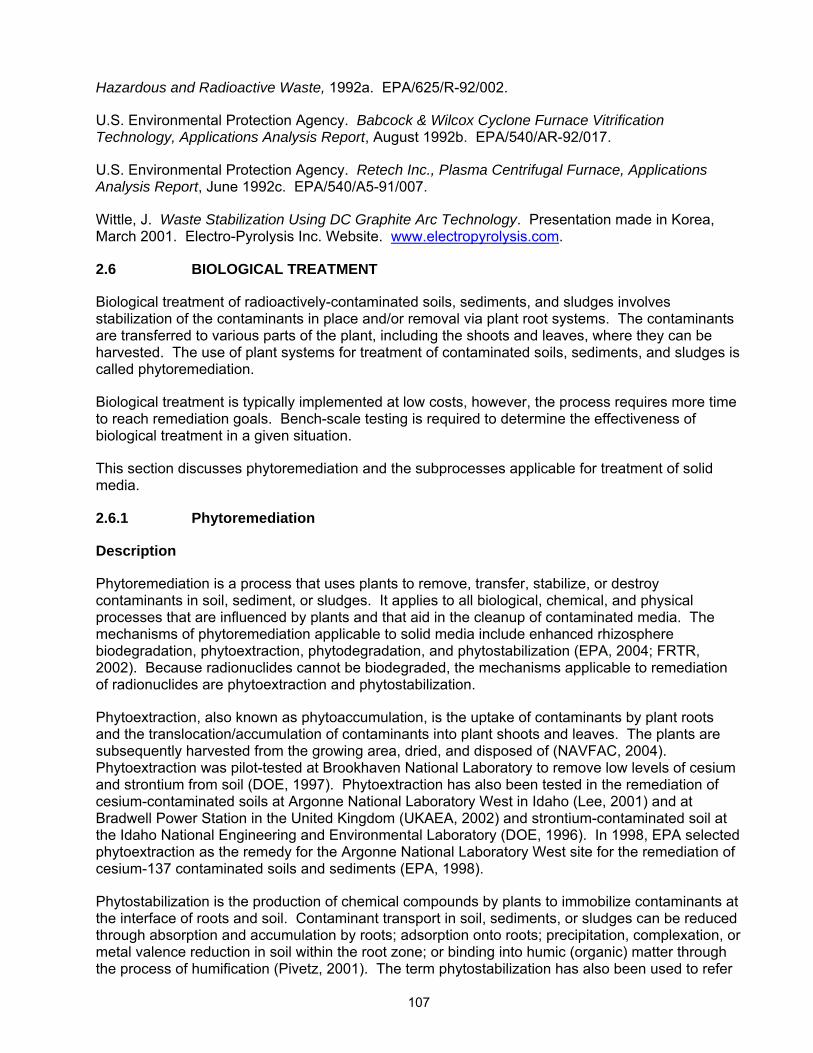
107
Hazardous and Radioactive Waste, 1992a. EPA/625/R-92/002.
U.S. Environmental Protection Agency. Babcock & Wilcox Cyclone Furnace Vitrification Technology, Applications Analysis Report, August 1992b. EPA/540/AR-92/017.
U.S. Environmental Protection Agency. Retech Inc., Plasma Centrifugal Furnace, Applications Analysis Report, June 1992c. EPA/540/A5-91/007.
Wittle, J. Waste Stabilization Using DC Graphite Arc Technology. Presentation made in Korea, March 2001. Electro-Pyrolysis Inc. Website. www.electropyrolysis.com.
2.6 BIOLOGICAL TREATMENT
Biological treatment of radioactively-contaminated soils, sediments, and sludges involves stabilization of the contaminants in place and/or removal via plant root systems. The contaminants are transferred to various parts of the plant, including the shoots and leaves, where they can be harvested. The use of plant systems for treatment of contaminated soils, sediments, and sludges is called phytoremediation.
Biological treatment is typically implemented at low costs, however, the process requires more time to reach remediation goals. Bench-scale testing is required to determine the effectiveness of biological treatment in a given situation.
This section discusses phytoremediation and the subprocesses applicable for treatment of solid media.
2.6.1 Phytoremediation
Description
Phytoremediation is a process that uses plants to remove, transfer, stabilize, or destroy contaminants in soil, sediment, or sludges. It applies to all biological, chemical, and physical processes that are influenced by plants and that aid in the cleanup of contaminated media. The mechanisms of phytoremediation applicable to solid media include enhanced rhizosphere biodegradation, phytoextraction, phytodegradation, and phytostabilization (EPA, 2004; FRTR, 2002). Because radionuclides cannot be biodegraded, the mechanisms applicable to remediation of radionuclides are phytoextraction and phytostabilization.
Phytoextraction, also known as phytoaccumulation, is the uptake of contaminants by plant roots and the translocation/accumulation of contaminants into plant shoots and leaves. The plants are subsequently harvested from the growing area, dried, and disposed of (NAVFAC, 2004). Phytoextraction was pilot-tested at Brookhaven National Laboratory to remove low levels of cesium and strontium from soil (DOE, 1997). Phytoextraction has also been tested in the remediation of cesium-contaminated soils at Argonne National Laboratory West in Idaho (Lee, 2001) and at Bradwell Power Station in the United Kingdom (UKAEA, 2002) and strontium-contaminated soil at the Idaho National Engineering and Environmental Laboratory (DOE, 1996). In 1998, EPA selected phytoextraction as the remedy for the Argonne National Laboratory West site for the remediation of cesium-137 contaminated soils and sediments (EPA, 1998).
Phytostabilization is the production of chemical compounds by plants to immobilize contaminants at the interface of roots and soil. Contaminant transport in soil, sediments, or sludges can be reduced through absorption and accumulation by roots; adsorption onto roots; precipitation, complexation, or metal valence reduction in soil within the root zone; or binding into humic (organic) matter through the process of humification (Pivetz, 2001). The term phytostabilization has also been used to refer
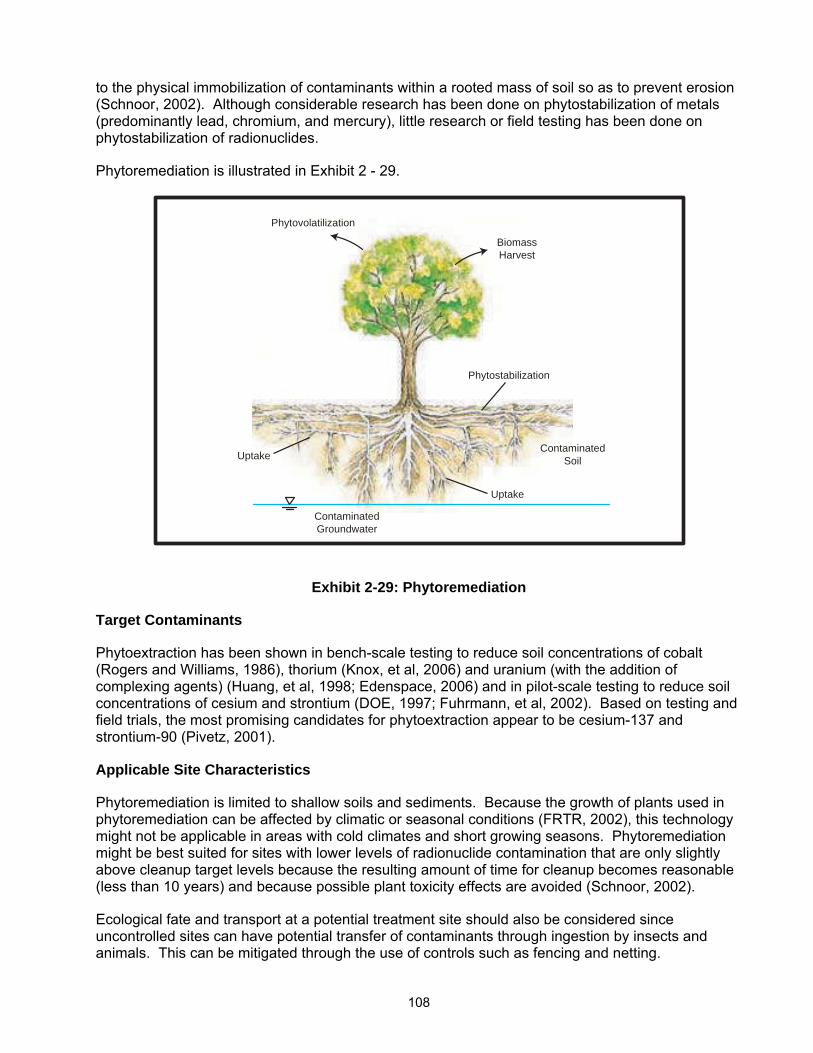
108
to the physical immobilization of contaminants within a rooted mass of soil so as to prevent erosion (Schnoor, 2002). Although considerable research has been done on phytostabilization of metals (predominantly lead, chromium, and mercury), little research or field testing has been done on phytostabilization of radionuclides.
Phytoremediation is illustrated in Exhibit 2 - 29.
SoilContaminated
GroundwaterContaminated
HarvestBiomass
Phytovolatilization
Phytostabilization
Uptake
Uptake
Exhibit 2-29: Phytoremediation
Target Contaminants
Phytoextraction has been shown in bench-scale testing to reduce soil concentrations of cobalt (Rogers and Williams, 1986), thorium (Knox, et al, 2006) and uranium (with the addition of complexing agents) (Huang, et al, 1998; Edenspace, 2006) and in pilot-scale testing to reduce soil concentrations of cesium and strontium (DOE, 1997; Fuhrmann, et al, 2002). Based on testing and field trials, the most promising candidates for phytoextraction appear to be cesium-137 and strontium-90 (Pivetz, 2001).
Applicable Site Characteristics
Phytoremediation is limited to shallow soils and sediments. Because the growth of plants used in phytoremediation can be affected by climatic or seasonal conditions (FRTR, 2002), this technology might not be applicable in areas with cold climates and short growing seasons. Phytoremediation might be best suited for sites with lower levels of radionuclide contamination that are only slightly above cleanup target levels because the resulting amount of time for cleanup becomes reasonable (less than 10 years) and because possible plant toxicity effects are avoided (Schnoor, 2002).
Ecological fate and transport at a potential treatment site should also be considered since uncontrolled sites can have potential transfer of contaminants through ingestion by insects and animals. This can be mitigated through the use of controls such as fencing and netting.
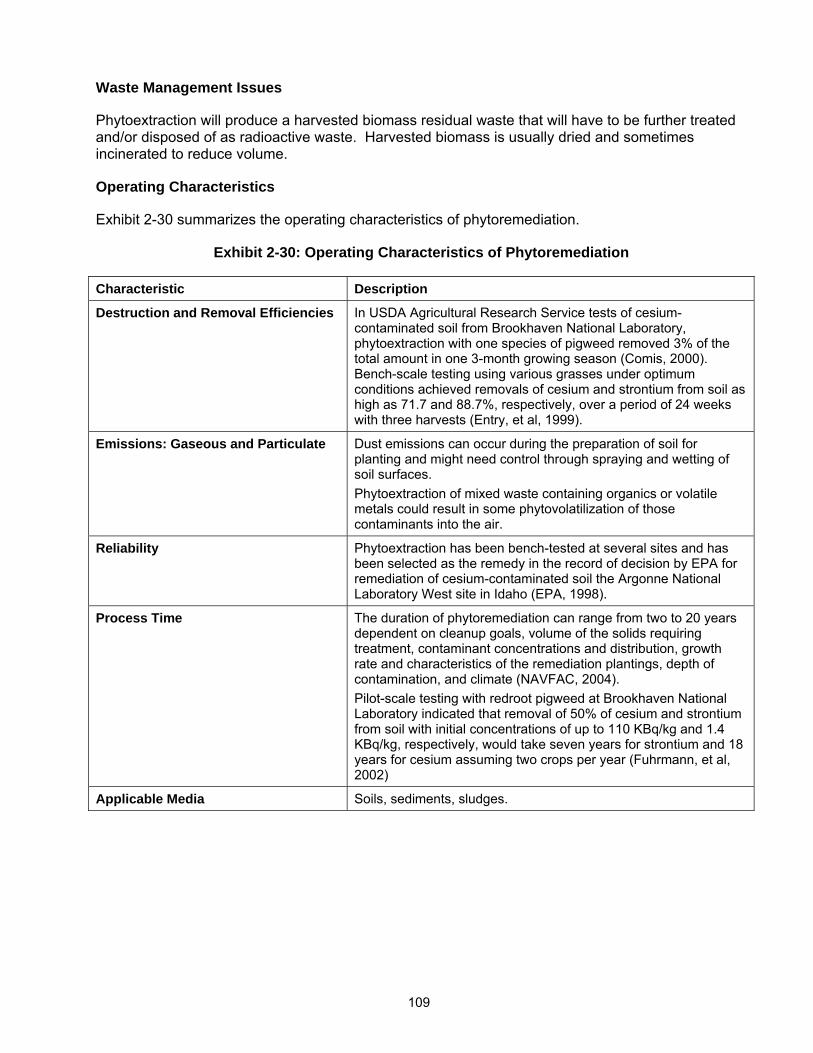
109
Waste Management Issues
Phytoextraction will produce a harvested biomass residual waste that will have to be further treated and/or disposed of as radioactive waste. Harvested biomass is usually dried and sometimes incinerated to reduce volume.
Operating Characteristics
Exhibit 2-30 summarizes the operating characteristics of phytoremediation.
Exhibit 2-30: Operating Characteristics of Phytoremediation
Characteristic Description
Destruction and Removal Efficiencies In USDA Agricultural Research Service tests of cesium-contaminated soil from Brookhaven National Laboratory, phytoextraction with one species of pigweed removed 3% of the total amount in one 3-month growing season (Comis, 2000). Bench-scale testing using various grasses under optimum conditions achieved removals of cesium and strontium from soil as high as 71.7 and 88.7%, respectively, over a period of 24 weeks with three harvests (Entry, et al, 1999).
Emissions: Gaseous and Particulate Dust emissions can occur during the preparation of soil for planting and might need control through spraying and wetting of soil surfaces. Phytoextraction of mixed waste containing organics or volatile metals could result in some phytovolatilization of those contaminants into the air.
Reliability Phytoextraction has been bench-tested at several sites and has been selected as the remedy in the record of decision by EPA for remediation of cesium-contaminated soil the Argonne National Laboratory West site in Idaho (EPA, 1998).
Process Time The duration of phytoremediation can range from two to 20 years dependent on cleanup goals, volume of the solids requiring treatment, contaminant concentrations and distribution, growth rate and characteristics of the remediation plantings, depth of contamination, and climate (NAVFAC, 2004). Pilot-scale testing with redroot pigweed at Brookhaven National Laboratory indicated that removal of 50% of cesium and strontium from soil with initial concentrations of up to 110 KBq/kg and 1.4 KBq/kg, respectively, would take seven years for strontium and 18 years for cesium assuming two crops per year (Fuhrmann, et al, 2002)
Applicable Media Soils, sediments, sludges.
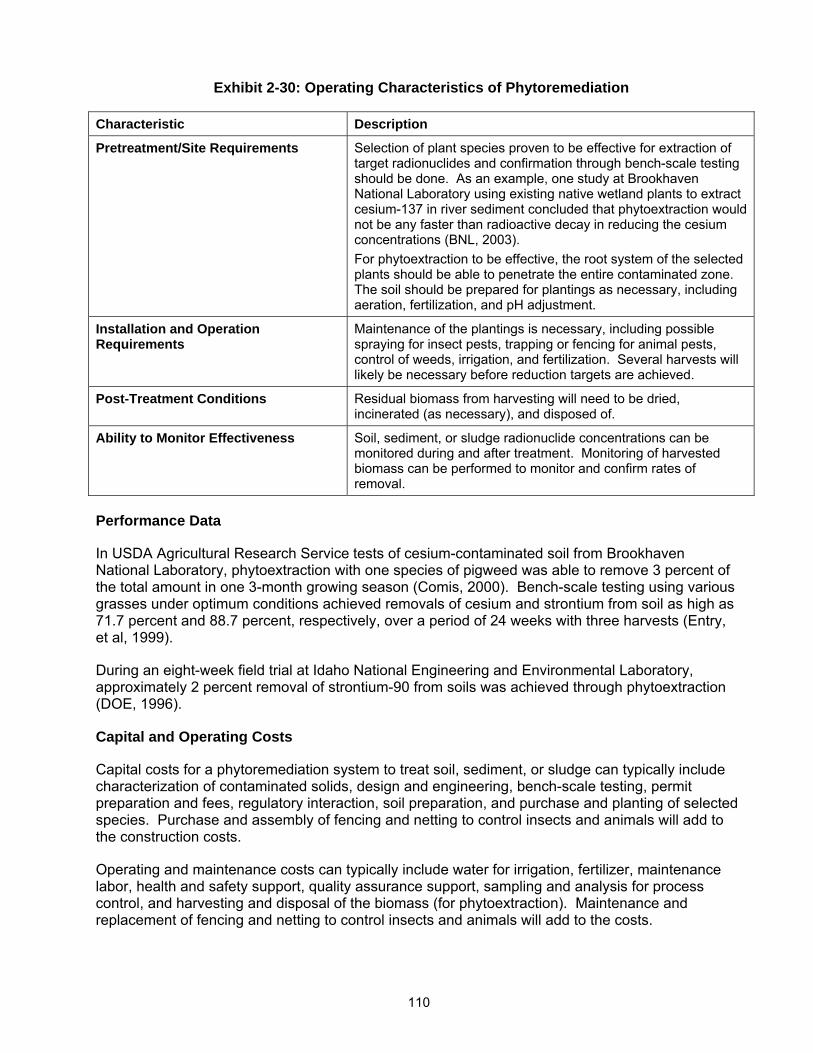
110
Exhibit 2-30: Operating Characteristics of Phytoremediation
Characteristic Description
Pretreatment/Site Requirements Selection of plant species proven to be effective for extraction of target radionuclides and confirmation through bench-scale testing should be done. As an example, one study at Brookhaven National Laboratory using existing native wetland plants to extract cesium-137 in river sediment concluded that phytoextraction would not be any faster than radioactive decay in reducing the cesium concentrations (BNL, 2003). For phytoextraction to be effective, the root system of the selected plants should be able to penetrate the entire contaminated zone. The soil should be prepared for plantings as necessary, including aeration, fertilization, and pH adjustment.
Installation and Operation Requirements
Maintenance of the plantings is necessary, including possible spraying for insect pests, trapping or fencing for animal pests, control of weeds, irrigation, and fertilization. Several harvests will likely be necessary before reduction targets are achieved.
Post-Treatment Conditions Residual biomass from harvesting will need to be dried, incinerated (as necessary), and disposed of.
Ability to Monitor Effectiveness Soil, sediment, or sludge radionuclide concentrations can be monitored during and after treatment. Monitoring of harvested biomass can be performed to monitor and confirm rates of removal.
Performance Data
In USDA Agricultural Research Service tests of cesium-contaminated soil from Brookhaven National Laboratory, phytoextraction with one species of pigweed was able to remove 3 percent of the total amount in one 3-month growing season (Comis, 2000). Bench-scale testing using various grasses under optimum conditions achieved removals of cesium and strontium from soil as high as 71.7 percent and 88.7 percent, respectively, over a period of 24 weeks with three harvests (Entry, et al, 1999).
During an eight-week field trial at Idaho National Engineering and Environmental Laboratory, approximately 2 percent removal of strontium-90 from soils was achieved through phytoextraction (DOE, 1996).
Capital and Operating Costs
Capital costs for a phytoremediation system to treat soil, sediment, or sludge can typically include characterization of contaminated solids, design and engineering, bench-scale testing, permit preparation and fees, regulatory interaction, soil preparation, and purchase and planting of selected species. Purchase and assembly of fencing and netting to control insects and animals will add to the construction costs.
Operating and maintenance costs can typically include water for irrigation, fertilizer, maintenance labor, health and safety support, quality assurance support, sampling and analysis for process control, and harvesting and disposal of the biomass (for phytoextraction). Maintenance and replacement of fencing and netting to control insects and animals will add to the costs.
111
For phytoextraction to be be cost effective, the rate of plant uptake must be greater than one percent of the plant’s weight per harvest and the time to complete the remediation process must be between two to ten years (DOE, 1997).
Installation of the vegetation at a phytoremediation site typically ranges from $10,000 to $25,000 per acre (not including bench-scale testing, design, and site preparation) (Schnoor, 2002).
Typical total costs for phytoremediation are estimated to be $75,000 to $150,000 per acre (not including biomass disposal as low-level radioactive waste) (NAVFAC, 2004).
Commercial Availability
Phytoremediation is being applied to many hazardous waste sites, and a number of bioremediation companies offer phytoremediation as a remediation technology. Some of these vendors are listed in the following subsection.
Contact Information
General Contacts:
EPA National Risk Management Research Laboratory
Steven Rock 26 West Martin Luther King Drive Cincinnati, OH 45268 (513) 569-7149 [email protected]
Vendors:
This is a partial listing of available vendors. Additional and updated vendor information can be obtained from the EPA Remediation and Characterization Technologies website: http://www.epareachit.org/, the EPA Cleanup Information website: http://clu-in.org, and by contacting the federal agency contact listed above.
Edenspace 3810 Concorde Parkway Suite 100 Dulles, VA 20151 (703) 961-8700 http://www.edenspace.com
Applied Natural Sciences 4129 Tonya Trail Hamilton, OH 45011 (513) 895-6061 http://www.treemediation.com
Phytokinetics 1770 North Research Parkway Suite 110 North Logan, UT 84341 (435) 755-0891 http://www.phytokinetics.com
112
Ecolotree 3017 Valley View Lane North Liberty, IA 52317 (319) 665-3547 http://www.ecolotree.com
The Bioengineering Group 18 Commercial Street Salem, MA 01970 (978) 740-0096 http://www.bioengineering.com
Phytoremediation References
Brookhaven National Laboratory. Operable Unit V - Peconic River: Determination of Phytoextraction and Harvesting Efficiency of Several Dominant Emergent Wetland Plants – Contaminated Sediment in the Peconic River, Brookhaven National Laboratory, Upton, N.Y., January 17, 2003. Prepared for U.S. DOE by BNL, Environmental Management Directorate.
Comis, D. “Phytoremediation: Using Plants to Clean Up Soils.” Agricultural Research, June 2000.
Edenspace. Vendor Webpage, 2006. http://www.edenspace.com/casestudy-uranium.html
Entry, J., Watrud, L., and Reeves, M. “Accumulation of 137Cs and 90Sr From Contaminated Soil by Three Grass Species Inoculated With Mycorrhizal Fungi.” Environmental Pollution, Vol. 104, Iss. 3, pp. 449 – 457, 1999.
Federal Remediation Technologies Roundtable. Remediation Technologies Screening Matrix and Reference Guide, Version 4.0: Phytoremediation, 2002. http://www.frtr.gov/matrix2/section4/4-3.html
Fuhrman, M., Lasat, M., Ebbs, S., Kochian, L., and Cornish, J. “Uptake of Cesium-137 and Strontium-90 from Contaminated Soils by Three Plant Species, Application to Phytoremediation”. Journal of Environmental Quality, 2002. Vol. 31, pp. 904 – 909.
Huang, J., Blaylock, M., Kapulnik, Y., and Ensley, B. “Phytoremediation of Uranium-Contaminated Soils: Role of Organic Acids in Triggering Uranium Hyperaccumulation in Plants.” Environmental Science and Technology, Vol. 32, Iss. 13, pp. 2004 – 2008, 1998.
Knox, A., Kaplan, D., and Hinton, T. Elevated Uptake of Th and U by Netted Chain Fern (Woodwardia Arelota). Savannah River National Laboratory, 2006. WSRC-MS-2006-00164.
Lee, S. “Phytoremediation Application for Radionuclide Removal at Argonne National Laboratory West”. Summary of the Phytoremediation State of the Science Conference, Boston, Massachusetts, May 1-2, 2000, November 2001. EPA/625/R-01/011a.
Pivetz, B. Ground Water Issue: Phytoremediation of Contaminated Soil and Ground Water at Hazardous Waste Sites. Prepared for U.S. EPA, Office of Solid Waste and Emergency Response, February 2001. EPA/540/S-01/500.
Rogers, R. and Williams, S. “Vesicular-Arbuscular Mycorrhiza: Influence on Plant Uptake of Cesium and Cobalt.” Soil Biology & Biochemistry, 1986. Vol. 18, Iss. 4, pp. 371-376.
Schnoor, J. Phytoremediation of Soil and Groundwater. Prepared for the Ground-Water Remediation Technologies Analysis Center, March 2002. Technology Evaluation Report TE-02-01.
113
U.S. Department of Energy. “Phytoremediation: Natural Attenuation That Really Works.” TIE Quarterly. Volume 6 (1), Spring 1997.
U.S. Department of Energy. Subsurface Contaminants Focus Area: Technology Summary, August 1996. DOE/EM-0296.
U.S. Environmental Protection Agency. Treatment Technologies for Site Cleanup: Annual Status Report (Eleventh Edition), February 2004. EPA/542/R-03/009.
U.S. Environmental Protection Agency. EPA Superfund Record of Decision: Idaho National Engineering Laboratory (USDOE), EPA ID: ID4890008952, OU 21, Idaho Falls, ID, 09/29/1998, 1998. EPA/ROD/R10-98/061.
U.S. Naval Facilities Engineering Command. Naval Facilities Engineering Service Center, Port Hueneme, Environmental Restoration & BRAC Website, Technology Pages: Phytoremediation, 2004. http://enviro.nfesc.navy.mil/erb
United Kingdom Atomic Energy Authority. “Phytoremediation of Radioactively Contaminated Soils.” The Technology of Decommissioning and Liabilities Management - Site Investigation, Remediation, and Restoration, 2002. http://www.ukaea.org.uk/reports/tdecomm/Tech_phytoremediation.pdf

114
THIS PAGE INTENTIONALLY LEFT BLANK
115
3.0 LIQUID MEDIA TECHNOLOGY PROFILES
3.1 CHEMICAL SEPARATION
Chemical separation technologies for liquid media involve processes that separate and concentrate radioactive contaminants from groundwater, surface, or waste water. Process residuals such as filters, filter cakes, carbon units, and ion exchange resins require further treatment, storage, or disposal. Extractability rates of the different chemical separation technologies vary considerably based on the types and concentrations of contaminants, as well as differences in methodology. Whether these technologies are applicable at a specific site must be determined based on site-specific factors.
Chemical separation technologies can be in-situ or ex-situ. For ex-situ treatment of groundwater, the construction and operation of a groundwater extraction and delivery system is required. All ex-situ chemical separation technologies generate a treated effluent and a contaminated residual that requires further treatment or disposal.
The profiles in this section address three chemical separation technologies: ion exchange and chemical precipitation, which are ex-situ treatments, and permeable reactive barriers, which are in-situ treatments.
3.1.1 Ion Exchange
Description
Ion exchange, a fully developed chemical separation process, is highly efficient in reducing radionuclide and inorganic metal levels in liquid waste streams to levels suitable for effluent discharge. Ion exchange has been identified as a Best Demonstrated Available Technology for the removal of radium-226, radium-228, and uranium. This technology separates and replaces radionuclides in a waste stream with relatively harmless ions from a synthetic resin or natural zeolite (for strontium and cesium). Resins consist of an insoluble structure with many ion transfer sites and an affinity for particular kinds of ions. “Exchangeable” ions are bound to the resin with a weak ionic bond. If the electrochemical potential of the ion to be recovered (contaminant) is greater than that of the exchangeable ion, the exchange ion goes into solution and the ionic contaminant binds to the resin. Resins must be periodically regenerated by exposure to a concentrated solution of the original exchange ion. Zeolites, when spent, are stored as solid waste.
A typical ion exchange unit uses columns or beds containing the exchange resin and various pumps and piping to carry the waste streams and potentially new and spent resin. Resins are either acid-cationic (for removing positively charged ions) or base-anionic (for removing negatively charged ions); resins used for radioactive liquid waste are often either hydrogen or hydroxyl. Alternatively, some ion exchange units send water through a mixed-bed, which contains both cationic and anionic resins in the same bed (DOE, 1994). Typically, four operations are carried out in a complete ion exchange cycle: service, backwash, regeneration, and rinse. In the service step, the ion exchange resin is contacted with the solution containing the contaminant ion targeted for removal. After a critical relative concentration of contaminant ion to exchangeable ion in solution is reached, the resin is spent or no longer effective. A backwash step is then operated to expand the resin and remove fines that could be clogging the bed. Following the backwash, the spent resin is regenerated by exposing it to a very concentrated solution of the original exchange ion, resulting in a reverse exchange process. The rinse step removes excess regeneration solution before the next service step (ORNL, 1994). Regeneration of cationic resins utilizes acidic solutions, while anionic resins use caustic solutions. The brine from the backwash, regeneration, and rinse steps is collected for radiological waste disposal.
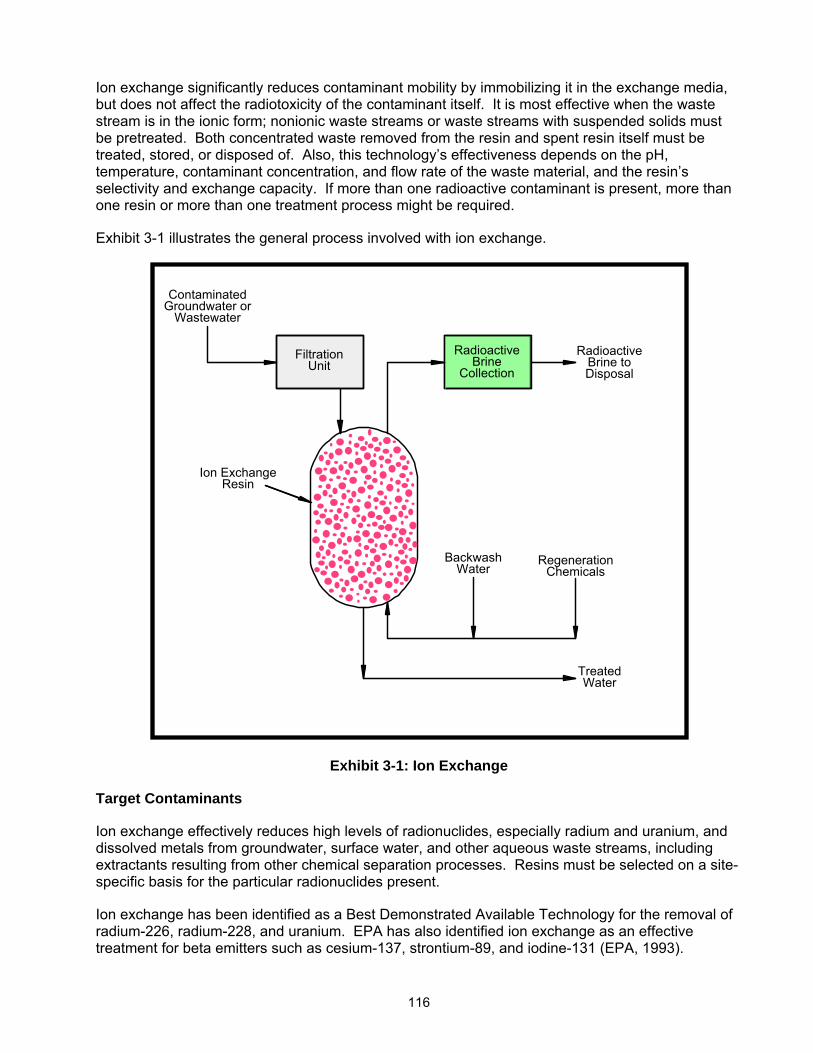
116
Ion exchange significantly reduces contaminant mobility by immobilizing it in the exchange media, but does not affect the radiotoxicity of the contaminant itself. It is most effective when the waste stream is in the ionic form; nonionic waste streams or waste streams with suspended solids must be pretreated. Both concentrated waste removed from the resin and spent resin itself must be treated, stored, or disposed of. Also, this technology’s effectiveness depends on the pH, temperature, contaminant concentration, and flow rate of the waste material, and the resin’s selectivity and exchange capacity. If more than one radioactive contaminant is present, more than one resin or more than one treatment process might be required.
Exhibit 3-1 illustrates the general process involved with ion exchange.
Wastewater���
Groundwater or����
Contaminated����
Collection���
Brine���
Radioactive��� Disposal�
��
Brine to���
Radioactive���
Unit���
Filtration���
Resin���
Ion Exchange���
Water���
Backwash���
Chemicals���
Regeneration���
Water���
Treated���
Exhibit 3-1: Ion Exchange
Target Contaminants
Ion exchange effectively reduces high levels of radionuclides, especially radium and uranium, and dissolved metals from groundwater, surface water, and other aqueous waste streams, including extractants resulting from other chemical separation processes. Resins must be selected on a site-specific basis for the particular radionuclides present.
Ion exchange has been identified as a Best Demonstrated Available Technology for the removal of radium-226, radium-228, and uranium. EPA has also identified ion exchange as an effective treatment for beta emitters such as cesium-137, strontium-89, and iodine-131 (EPA, 1993).
117
Bench-scale and pilot-scale testing has shown that ion exchange can also be effective for the removal of tritium (Jeppson, et al., 2000), plutonium (Fryxell, 2001), strontium-90, and technetium-99 (DOE, 2001). Ion exchange is being used at DOE’s Savannah River Site as a polishing process (after precipitation) to remove radionuclides from ground water including technetium-99, strontium-90, and iodine-129 (Serkiz, et al., 2000).
Applicable Site Characteristics
Characteristics such as contaminant type and concentration should be well defined to accurately predict the performance of ion exchange. The presence of multiple radionuclides could impact the technology’s effectiveness. Cation exchange has been found to be effective for the removal of cesium and strontium (Sorg, 1992).
Media with more than one radioactive contaminant can require more than one treatment process. Ion exchange could be difficult without pretreatment to remove organics, to destroy chelating agents, or to destroy the chelant metal bond. Pretreatment could also be needed to remove solids in order to prevent blinding or clogging of the column or to modify the pH of the influent stream for optimum removal efficiencies (ORNL, 1994). Because ion exchange media can have a preference for one element over another, it is also important to determine whether other competing ions are present that could interfere with the removal of the target contaminant. In some cases, pretreatment could be necessary to remove the competing ions (EPA, 1993). Oxidants in the contaminated solution to be treated need to be evaluated since they can damage the ion exchange resin (FRTR, 2002).
Ion exchange treatment is effective only for liquid waste streams that are in ionic form. Nonionic forms (insoluble particles, colloids, and neutral molecules and complexes) require pretreatment.
This technology is typically used to treat contaminant concentrations up to about 200 to 500 mg/L. Concentrations of dissolved solids greater than 4,000 mg/L will rapidly exhaust bed capacity (NAVFAC, 2004).
Waste Management Issues
The concentrated radioactive brine removed from the ion exchange resin and the spent resins require treatment, storage, or disposal. The radioactive brine residual will be a caustic or acid solution (depending on type of resin and regeneration material used) and will require neutralization. Spent ion exchange resin can be rigorously eluted to lower its radionuclide content before disposal and can be incorporated into cement for storage or disposal (EPA, 1993).
During ion exchange, radiolytic byproducts can be produced including benzene derivatives when the resin is placed in a radioactive environment. A small amount of hydrogen gas formed in the presence of organic materials can be captured by an off-gas treatment system (EPA, 1993).
Because anion exchange resins have such a large adsorption capacity for uranium, wastes can become extremely concentrated and can be difficult to handle (KEI, 1994).
Operating Characteristics
Exhibit 3-2 summarizes the operating characteristics of ion exchange.
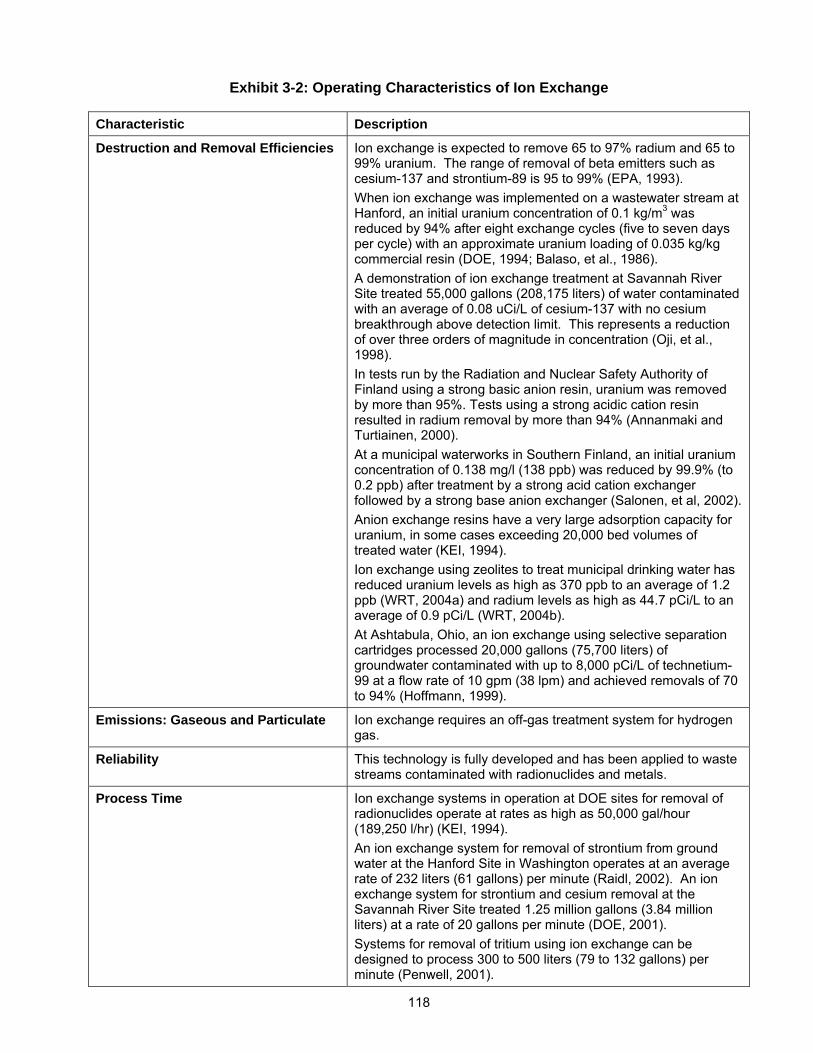
118
Exhibit 3-2: Operating Characteristics of Ion Exchange
Characteristic Description
Destruction and Removal Efficiencies Ion exchange is expected to remove 65 to 97% radium and 65 to 99% uranium. The range of removal of beta emitters such as cesium-137 and strontium-89 is 95 to 99% (EPA, 1993). When ion exchange was implemented on a wastewater stream at Hanford, an initial uranium concentration of 0.1 kg/m3 was reduced by 94% after eight exchange cycles (five to seven days per cycle) with an approximate uranium loading of 0.035 kg/kg commercial resin (DOE, 1994; Balaso, et al., 1986). A demonstration of ion exchange treatment at Savannah River Site treated 55,000 gallons (208,175 liters) of water contaminated with an average of 0.08 uCi/L of cesium-137 with no cesium breakthrough above detection limit. This represents a reduction of over three orders of magnitude in concentration (Oji, et al., 1998). In tests run by the Radiation and Nuclear Safety Authority of Finland using a strong basic anion resin, uranium was removed by more than 95%. Tests using a strong acidic cation resin resulted in radium removal by more than 94% (Annanmaki and Turtiainen, 2000). At a municipal waterworks in Southern Finland, an initial uranium concentration of 0.138 mg/l (138 ppb) was reduced by 99.9% (to 0.2 ppb) after treatment by a strong acid cation exchanger followed by a strong base anion exchanger (Salonen, et al, 2002). Anion exchange resins have a very large adsorption capacity for uranium, in some cases exceeding 20,000 bed volumes of treated water (KEI, 1994). Ion exchange using zeolites to treat municipal drinking water has reduced uranium levels as high as 370 ppb to an average of 1.2 ppb (WRT, 2004a) and radium levels as high as 44.7 pCi/L to an average of 0.9 pCi/L (WRT, 2004b). At Ashtabula, Ohio, an ion exchange using selective separation cartridges processed 20,000 gallons (75,700 liters) of groundwater contaminated with up to 8,000 pCi/L of technetium-99 at a flow rate of 10 gpm (38 lpm) and achieved removals of 70 to 94% (Hoffmann, 1999).
Emissions: Gaseous and Particulate Ion exchange requires an off-gas treatment system for hydrogen gas.
Reliability This technology is fully developed and has been applied to waste streams contaminated with radionuclides and metals.
Process Time Ion exchange systems in operation at DOE sites for removal of radionuclides operate at rates as high as 50,000 gal/hour (189,250 l/hr) (KEI, 1994). An ion exchange system for removal of strontium from ground water at the Hanford Site in Washington operates at an average rate of 232 liters (61 gallons) per minute (Raidl, 2002). An ion exchange system for strontium and cesium removal at the Savannah River Site treated 1.25 million gallons (3.84 million liters) at a rate of 20 gallons per minute (DOE, 2001). Systems for removal of tritium using ion exchange can be designed to process 300 to 500 liters (79 to 132 gallons) per minute (Penwell, 2001).
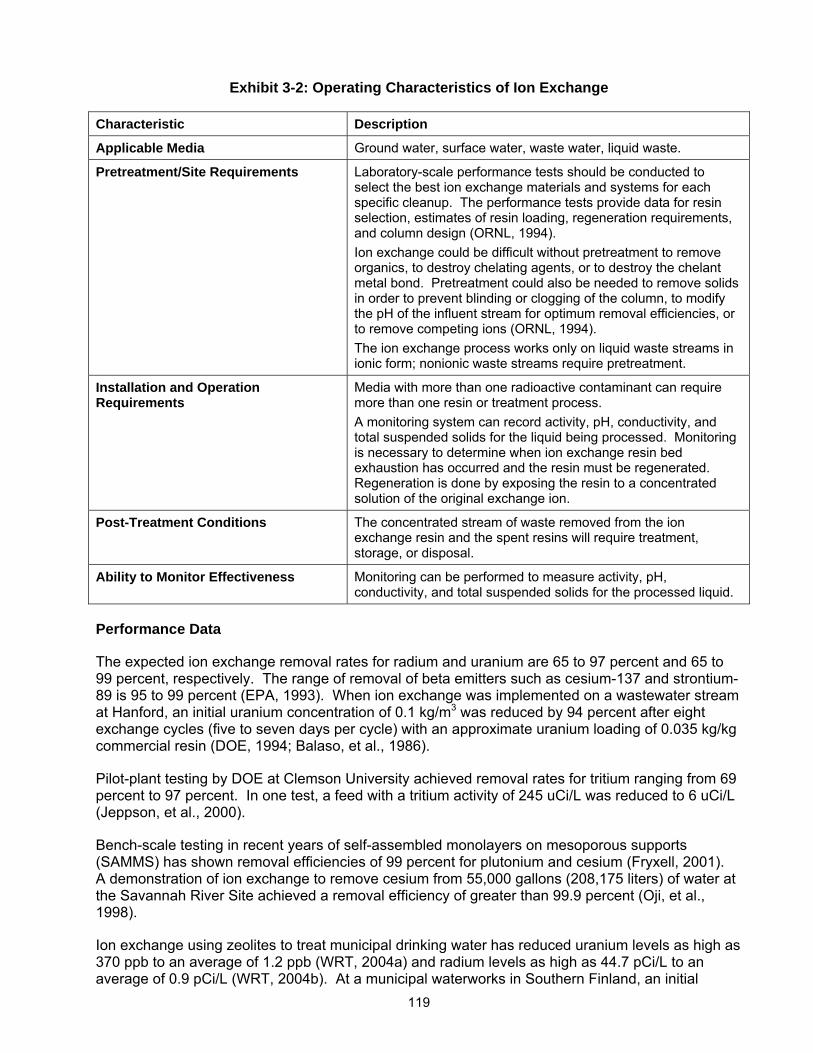
119
Exhibit 3-2: Operating Characteristics of Ion Exchange
Characteristic Description
Applicable Media Ground water, surface water, waste water, liquid waste.
Pretreatment/Site Requirements Laboratory-scale performance tests should be conducted to select the best ion exchange materials and systems for each specific cleanup. The performance tests provide data for resin selection, estimates of resin loading, regeneration requirements, and column design (ORNL, 1994). Ion exchange could be difficult without pretreatment to remove organics, to destroy chelating agents, or to destroy the chelant metal bond. Pretreatment could also be needed to remove solids in order to prevent blinding or clogging of the column, to modify the pH of the influent stream for optimum removal efficiencies, or to remove competing ions (ORNL, 1994). The ion exchange process works only on liquid waste streams in ionic form; nonionic waste streams require pretreatment.
Installation and Operation Requirements
Media with more than one radioactive contaminant can require more than one resin or treatment process. A monitoring system can record activity, pH, conductivity, and total suspended solids for the liquid being processed. Monitoring is necessary to determine when ion exchange resin bed exhaustion has occurred and the resin must be regenerated. Regeneration is done by exposing the resin to a concentrated solution of the original exchange ion.
Post-Treatment Conditions The concentrated stream of waste removed from the ion exchange resin and the spent resins will require treatment, storage, or disposal.
Ability to Monitor Effectiveness Monitoring can be performed to measure activity, pH, conductivity, and total suspended solids for the processed liquid.
Performance Data
The expected ion exchange removal rates for radium and uranium are 65 to 97 percent and 65 to 99 percent, respectively. The range of removal of beta emitters such as cesium-137 and strontium-89 is 95 to 99 percent (EPA, 1993). When ion exchange was implemented on a wastewater stream at Hanford, an initial uranium concentration of 0.1 kg/m3 was reduced by 94 percent after eight exchange cycles (five to seven days per cycle) with an approximate uranium loading of 0.035 kg/kg commercial resin (DOE, 1994; Balaso, et al., 1986).
Pilot-plant testing by DOE at Clemson University achieved removal rates for tritium ranging from 69 percent to 97 percent. In one test, a feed with a tritium activity of 245 uCi/L was reduced to 6 uCi/L (Jeppson, et al., 2000).
Bench-scale testing in recent years of self-assembled monolayers on mesoporous supports (SAMMS) has shown removal efficiencies of 99 percent for plutonium and cesium (Fryxell, 2001). A demonstration of ion exchange to remove cesium from 55,000 gallons (208,175 liters) of water at the Savannah River Site achieved a removal efficiency of greater than 99.9 percent (Oji, et al., 1998).
Ion exchange using zeolites to treat municipal drinking water has reduced uranium levels as high as 370 ppb to an average of 1.2 ppb (WRT, 2004a) and radium levels as high as 44.7 pCi/L to an average of 0.9 pCi/L (WRT, 2004b). At a municipal waterworks in Southern Finland, an initial
120
uranium concentration of 0.138 mg/l (138 ppb) was reduced by 99.9% (to 0.2 ppb) after treatment by a strong acid cation exchanger followed by a strong base anion exchanger (Salonen, et al, 2002).
At Ashtabula, Ohio, an ion exchange using selective separation cartridges processed 20,000 gallons (75,700 liters) of groundwater contaminated with up to 8,000 pCi/L of technetium-99 at a flow rate of 10 gpm (381 pm) and achieved removals of 70 to 94% (Hoffmann, 1999).
Capital and Operating Costs
Capital costs for an ion exchange system can typically include characterization of contaminated liquids, design and engineering, bench-scale testing, permit preparation and fees, regulatory interaction, purchase of system equipment (columns, prefilters, tanks, piping, pumps, valves, controls, resin, regeneration solution), and system construction.
Operating and maintenance costs typically include pretreatment to remove suspended solids, operating and maintenance labor, replacement resin, utilities, regeneration chemicals, sampling and analysis for process control, health and safety support, quality assurance support, and off-site disposal of regeneration waste.
Resins are relatively more expensive than other adsorption reagents such as carbon, but can achieve higher degrees of selectivity than activated carbon. Capital and operating costs (not including disposal costs) for ion exchange are estimated to be $5 to $10 per 1,000 gallons (3,785 liters) of liquid waste (ORNL, 1994).
The capital cost for an ion exchange system as a part of a chemical extraction treatment train for uranium at the DOE Fernald Site in Ohio was estimated as $1.4 million. This included pumps, tanks, ion exchange columns (six 10-foot (3-meter) diameter by 10-foot (3-meter) deep tanks), and resin with a design process rate of up to 800 gallons (3,028 liters) per minute (Douthat, et al., 1995).
The capital cost for a 20 gallon (76 liter) per minute system used at the Savannah River Site to treat 1.25 million gallons (3.84 million liters) of water for removal of cesium and strontium was approximately $158,000 (including planning and startup costs). The operation and maintenance cost for 10 weeks of operation was $64,390 (DOE, 2001).
Estimated operating and maintenance costs for typical anionic and cationic ion exchangers for the removal of radionuclides including storage and disposal costs of spent sorbent is approximately $35 and $450 per 1,000 gallons (3,785 liters), respectively (KEI, 1994).
Commercial Availability
This technology is fully developed and has long been used in industry. It is commercially available and has been applied to waste streams contaminated with radionuclides and metals.
Contact Information
General Contacts:
EPA National Risk Management Research Laboratory
Tom Sorg 26 West Martin Luther King Drive Cincinnati, OH 45268 (513) 569-7370 [email protected]
121
Vendors:
This is a partial listing of available vendors. Additional and updated vendor information can be obtained from the EPA Remediation and Characterization Technologies website: http://www.epareachit.org/, the EPA Cleanup Information website: http://clu-in.org, and by contacting the federal agency contact listed above.
3M Selective Separation Cartridges (removal of Cs, Sr, Tc, Co)
Keith M. Hoffmann 3M Filtration Products Department 3M Center St. Paul, MN 55144 (651) 575-1795 [email protected]
Ionsiv® IE-911 (Crystalline Silicotitanate - removal of Cs, Sr)
Dennis Fennelly UOP Inc. 25 East Algonquin Road Des Plaines, IL 60017 (609) 727-9400 [email protected]
Chabazite Zeolite (removal of Cs, Sr) GSA Resources Inc. P.O. Box 509 Tucson, AZ 85652 (800) 866-4052 http://www.gsaresources.com/
Water Remediation Technology (removal of U, Ra)
5460 Ward Road, Suite 100 Arvada, CO 80002 (303) 424-5355 http://www.wrtnet.com
Purolite Resins D3696, A-520E, NRW-160 (removal of Tc, Cs)
Jim Sabzali The Purolite Company 150 Monument Road Bala Cynwyd, Pennsylvania 19004 (800) 343-1500 [email protected] http://puroliteusa.com
Ion Exchange References
Annanmaki, M. and Turtiainen, T. (eds.). Treatment Techniques for Removing Natural Radionuclides from Drinking Water. Final Report of the TENAWA project. Prepared for the Radiation and Nuclear Safety Authority of Finland (STUK), Helsinki, 2000. Report No. STUK –A169.
Balasco, A., Santhanam, C., Stevens, J., Walters, R., and Wolfrum, E. Soluble Sulfide Precipitation Study. Arthur D. Little Inc. Final Report to USATHAMA, December 1986. Report No. AMXTH-TE-CR-87106.
Douthat, D., Stewart, R., and Armstrong, A. Operating and Life-Cycle Costs for Uranium-Contaminated Soil Treatment Technologies. Prepared by the University of Tennessee and Oak Ridge National Laboratory for the U.S. Department of Energy, September 1995. ORNL-6882.
122
Federal Remediation Technologies Roundtable. Remediation Technologies Screening Matrix and Reference Guide, Version 4.0:Ion Exchange, 2002. http://www.frtr.gov/matrix2/section4/4-49.html
Fryxell, G. Final Report: Actinide-Specific Interfacial Chemistry of Monolayer Coated Mesoporous Ceramics. Prepared by Pacific Northwest National Laboratory for U.S. Department of Energy, Report No. EMSP-65370, September 2001.
Hoffman, K. “Radionuclide Capture Using Membrane Technology”. Presented at: FETC Industry Partnerships to Deploy Environmental Technology Conference, October 12 – 14, 1999, Morgantown, West Virginia.
Jeppson, D., Collins, G., Furlong, L., and Stockinger, S. “Separation of Tritium From Wastewater”. Presented at: Waste Management 2000 Conference, February 27 - March 3, 2000, Tucson, Ariz. Prepared for U.S. Department of Energy, 2000. HNF-4906-FP, Rev. 0.
Kapline Enterprises Inc.. Aqueous-Stream Uranium-Removal Technology Cost/Benefit and Market Analysis. Prepared for U.S. Department of Energy, Office of Technology Development, March 1994. DOE/OR-2006.
Oak Ridge National Laboratory. Y-12 Plant Remedial Action Technology Logic Diagram, Volume 3, Technology Evaluation Data Sheets, Part A, Remedial Action, 1994. Y/ER-161/V3/PtA.
Oji, L., Thompson, M., Peterson, K., May, C., and Kafka, T. Cesium Removal from R-Reactor Building Disassembly Basin Using 3M® Empore Web-Membrane Filter Technology. Prepared by Westinghouse Savannah River Company for U.S. Department of Energy, 1998. WSRC-TR-98-00209.
Penwell, D. 2001 Evaluation of Tritium Removal and Mitigation Technologies for Wastewater Treatment. Prepared by COGEMA Engineering Corporation for U.S. Department of Energy, June 2001. DOE/RL-2001-33, Rev. 0.
Raidl, R. Calendar Year 2001 Annual Summary Report for the 100-HR-3, 100-KR-4 and 100-NR-2 Operable Unit Pump and Treat Operations. Prepared by Fluor Hanford Inc. for the U.S. Department of Energy, September 2002. DOE/RL-2002-05, Rev. 0.
Salonen, L., Turunen, H., Mehtonen, J., Mjönes, L., Hagberg, N., Wilken, R., Raff, O. Removal of Radon by Aeration: Testing of Various Aeration Techniques for Small Water Works. Radiation and Nuclear Safety Authority of Finland (STUK), Helsinki, 2002. Report No. STUK-A193.
Serkiz, S., Rebout, S., Bell, N., Kanzleiter, J., Bohrer, S., Lovekamp, J., and Faulk, G. Reengineering Water Treatment Units for Removal of Sr-90, I-129, Tc-99, and Uranium from Contaminated Groundwater at the DOE’s Savannah River Site. Prepared by Westinghouse Savannah River Company for U.S. Department of Energy, 2000. WSRC-MS-2000-00097.
Sorg, T. “Treatment of Radioactive Compounds in Water.” Radioactive Site Remediaton Technologies Seminar, Speaker Slide Copies. EPA Office of Research and Development. June 1992. EPA/540/K-92/001.
U.S. Department of Energy. Innovative Technology Summary Report: 3M Selective Separation Cartridges. Industry Programs and Subsurface Contaminants Focus Area, 2001. DOE/EM-0606.
U.S. Department of Energy. Decommissioning Handbook. Office of Environmental Restoration, March 1994. DOE/EM-0142.
123
U.S. Environmental Protection Agency. Approaches for the Remediation of Federal Facility Sites Contaminated With Explosive or Radioactive Wastes, 1993. EPA/625/R-93/013.
U.S. Naval Facilities Engineering Command. Naval Facilities Engineering Service Center, Port Hueneme, Environmental Restoration & BRAC Website, Technology Pages: Ion Exchange, 2004. http://enviro.nfesc.navy.mil/erb
Water Remediation Technology. Pilot Study Report for Z-92TM Uranium Treatment Process Conducted at the Mountain Water & Sanitation District, Conifer, Colo., Revised November 11, 2004a. http://www.wrtnet.com
Water Remediation Technology. Pilot Study Report for Z-88TM Radium Treatment Process Conducted at the Richland Special Utility District Richland Springs, Texas, May 18, 2004b. http://www.wrtnet.com
3.1.2 Chemical Precipitation
Description
Chemical precipitation converts soluble radionuclides to an insoluble form through a chemical reaction or by changing the solvent’s composition to diminish solubility. Precipitation adds a chemical precipitant to the radionuclide-containing aqueous waste in a stirred reaction vessel. Solids are separated from the liquids by settling in a clarifier and/or by filtration. Flocculation, with or without a chemical coagulant or settling aid, can be used to enhance solids removal. Commonly used precipitants include carbonates, sulfates, sulfides, phosphates, polymers, lime and other hydroxides. The amounts of radionuclides that can be removed from a solution depend on the precipitant and dosage used, the concentration of radionuclides present in the aqueous waste, and the pH of the solution. Maintaining optimum pH levels within a relatively narrow range is usually necessary to achieve adequate radionuclide precipitation.
Either batch reactors or continuous flow designs can be used. Batch reactors are generally favored for flows up to 50,000 gallons (189,250 liters) per day and usually operate with two parallel tanks. Each tank acts as a flow equalizer, reactor, and settler, thus eliminating the need for separate equipment for each step. Continuous systems have a chemical feeder, flash mixer, flocculator, settling unit, filtration unit (if used), and control system for feed regulation.
Chemical precipitation significantly reduces the volume of contaminants in the liquid medium, the toxicity of the liquid medium, but not the mobility of the contaminants remaining in the liquid medium. The process yields a purified liquid medium, and contaminated process residuals (precipitated sludges) then can be stored, further processed, or disposed of.
EPA has identified chemical precipitation as a Best Demonstrated Available Technology for treatment of radium-226, radium-228, and uranium (EPA, 1993). EPA defines precipitation as including coagulation/filtration and lime softening (EPA, 1993). Coagulation/filtration involves the continuous addition and mixing of a coagulant, such as ferric sulfate or aluminum sulfate (alum), with the contaminated solution for formation of a flocculant precipitate. Lime softening involves the addition of lime (calcium oxide) to remove water hardness by the formation of insoluble calcium carbonate and magnesium hydroxide. At elevated pH levels, lime softening has been shown to be very effective in removing dissolved uranium from water (KEI, 1994).
Exhibit 3-3 illustrates the general process involved with chemical precipitation.
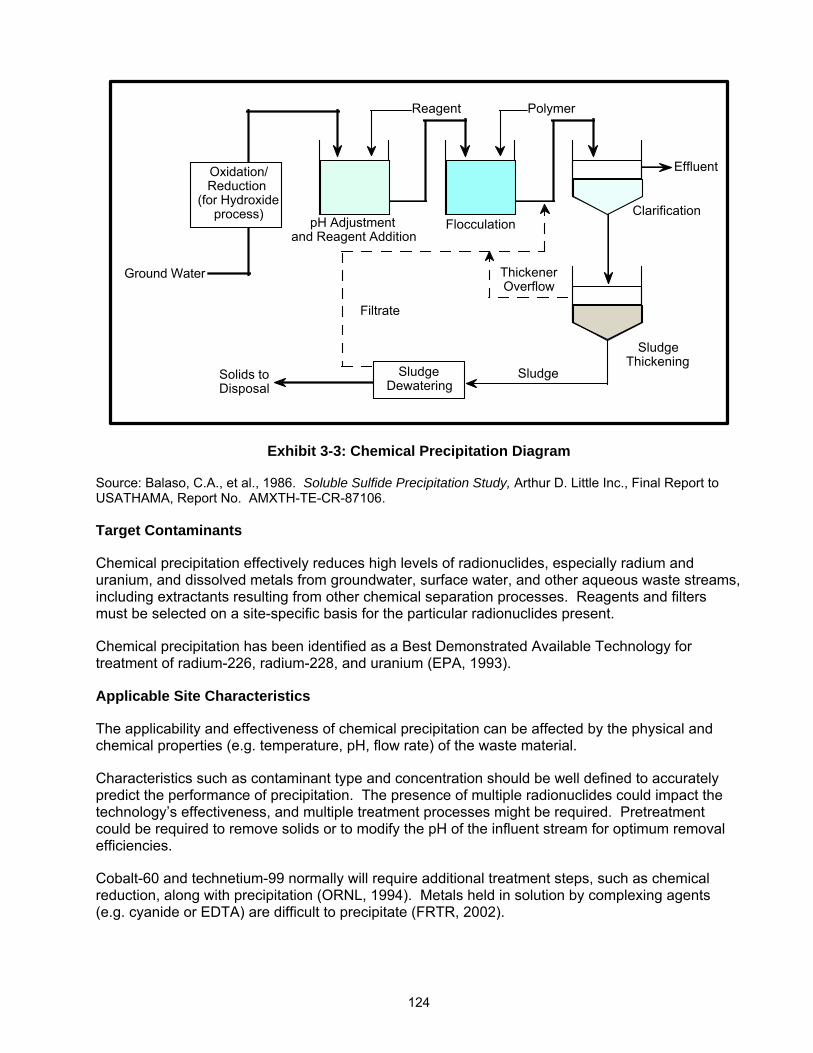
124
Effluent���
Reagent��� Polymer���
Sludge���
���
Dewatering���
pH Adjustment ���and Reagent Addition���
Flocculation���Clarification���
Sludge��� ���
Thickening���
Sludge���Solids to ���Disposal���
Thickener��� ���
Overflow���Filtrate�
�
�
Oxidation/ ���Reduction ���
(for Hydroxide���
���
process)���
Ground Water���
Exhibit 3-3: Chemical Precipitation Diagram
Source: Balaso, C.A., et al., 1986. Soluble Sulfide Precipitation Study, Arthur D. Little Inc., Final Report to USATHAMA, Report No. AMXTH-TE-CR-87106.
Target Contaminants
Chemical precipitation effectively reduces high levels of radionuclides, especially radium and uranium, and dissolved metals from groundwater, surface water, and other aqueous waste streams, including extractants resulting from other chemical separation processes. Reagents and filters must be selected on a site-specific basis for the particular radionuclides present.
Chemical precipitation has been identified as a Best Demonstrated Available Technology for treatment of radium-226, radium-228, and uranium (EPA, 1993).
Applicable Site Characteristics
The applicability and effectiveness of chemical precipitation can be affected by the physical and chemical properties (e.g. temperature, pH, flow rate) of the waste material.
Characteristics such as contaminant type and concentration should be well defined to accurately predict the performance of precipitation. The presence of multiple radionuclides could impact the technology’s effectiveness, and multiple treatment processes might be required. Pretreatment could be required to remove solids or to modify the pH of the influent stream for optimum removal efficiencies.
Cobalt-60 and technetium-99 normally will require additional treatment steps, such as chemical reduction, along with precipitation (ORNL, 1994). Metals held in solution by complexing agents (e.g. cyanide or EDTA) are difficult to precipitate (FRTR, 2002).
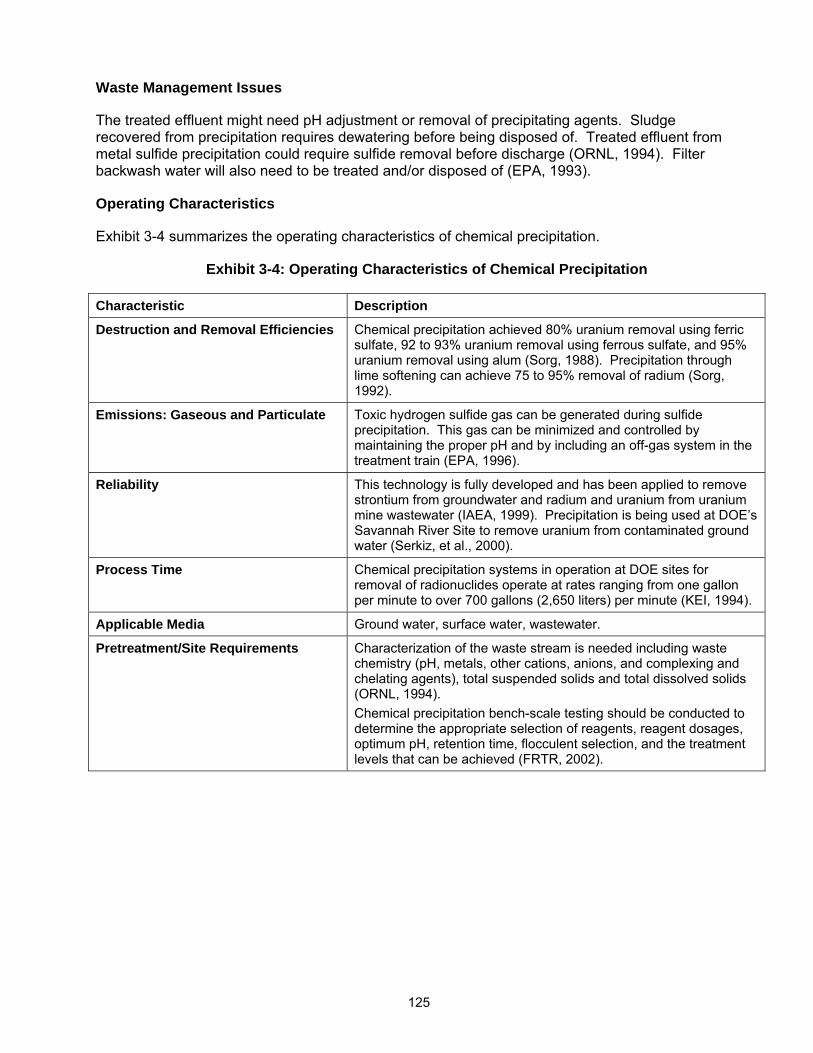
125
Waste Management Issues
The treated effluent might need pH adjustment or removal of precipitating agents. Sludge recovered from precipitation requires dewatering before being disposed of. Treated effluent from metal sulfide precipitation could require sulfide removal before discharge (ORNL, 1994). Filter backwash water will also need to be treated and/or disposed of (EPA, 1993).
Operating Characteristics
Exhibit 3-4 summarizes the operating characteristics of chemical precipitation.
Exhibit 3-4: Operating Characteristics of Chemical Precipitation
Characteristic Description
Destruction and Removal Efficiencies Chemical precipitation achieved 80% uranium removal using ferric sulfate, 92 to 93% uranium removal using ferrous sulfate, and 95% uranium removal using alum (Sorg, 1988). Precipitation through lime softening can achieve 75 to 95% removal of radium (Sorg, 1992).
Emissions: Gaseous and Particulate Toxic hydrogen sulfide gas can be generated during sulfide precipitation. This gas can be minimized and controlled by maintaining the proper pH and by including an off-gas system in the treatment train (EPA, 1996).
Reliability This technology is fully developed and has been applied to remove strontium from groundwater and radium and uranium from uranium mine wastewater (IAEA, 1999). Precipitation is being used at DOE’s Savannah River Site to remove uranium from contaminated ground water (Serkiz, et al., 2000).
Process Time Chemical precipitation systems in operation at DOE sites for removal of radionuclides operate at rates ranging from one gallon per minute to over 700 gallons (2,650 liters) per minute (KEI, 1994).
Applicable Media Ground water, surface water, wastewater.
Pretreatment/Site Requirements Characterization of the waste stream is needed including waste chemistry (pH, metals, other cations, anions, and complexing and chelating agents), total suspended solids and total dissolved solids (ORNL, 1994). Chemical precipitation bench-scale testing should be conducted to determine the appropriate selection of reagents, reagent dosages, optimum pH, retention time, flocculent selection, and the treatment levels that can be achieved (FRTR, 2002).
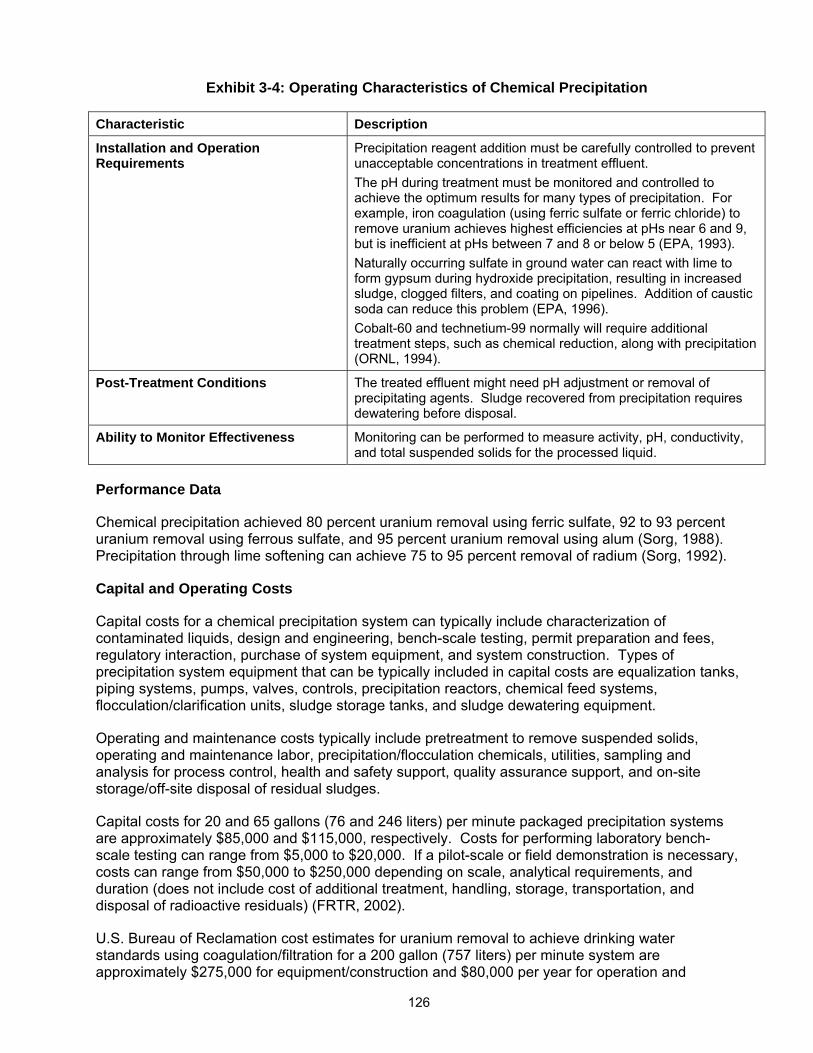
126
Exhibit 3-4: Operating Characteristics of Chemical Precipitation
Characteristic Description
Installation and Operation Requirements
Precipitation reagent addition must be carefully controlled to prevent unacceptable concentrations in treatment effluent. The pH during treatment must be monitored and controlled to achieve the optimum results for many types of precipitation. For example, iron coagulation (using ferric sulfate or ferric chloride) to remove uranium achieves highest efficiencies at pHs near 6 and 9, but is inefficient at pHs between 7 and 8 or below 5 (EPA, 1993). Naturally occurring sulfate in ground water can react with lime to form gypsum during hydroxide precipitation, resulting in increased sludge, clogged filters, and coating on pipelines. Addition of caustic soda can reduce this problem (EPA, 1996). Cobalt-60 and technetium-99 normally will require additional treatment steps, such as chemical reduction, along with precipitation (ORNL, 1994).
Post-Treatment Conditions The treated effluent might need pH adjustment or removal of precipitating agents. Sludge recovered from precipitation requires dewatering before disposal.
Ability to Monitor Effectiveness Monitoring can be performed to measure activity, pH, conductivity, and total suspended solids for the processed liquid.
Performance Data
Chemical precipitation achieved 80 percent uranium removal using ferric sulfate, 92 to 93 percent uranium removal using ferrous sulfate, and 95 percent uranium removal using alum (Sorg, 1988). Precipitation through lime softening can achieve 75 to 95 percent removal of radium (Sorg, 1992).
Capital and Operating Costs
Capital costs for a chemical precipitation system can typically include characterization of contaminated liquids, design and engineering, bench-scale testing, permit preparation and fees, regulatory interaction, purchase of system equipment, and system construction. Types of precipitation system equipment that can be typically included in capital costs are equalization tanks, piping systems, pumps, valves, controls, precipitation reactors, chemical feed systems, flocculation/clarification units, sludge storage tanks, and sludge dewatering equipment.
Operating and maintenance costs typically include pretreatment to remove suspended solids, operating and maintenance labor, precipitation/flocculation chemicals, utilities, sampling and analysis for process control, health and safety support, quality assurance support, and on-site storage/off-site disposal of residual sludges.
Capital costs for 20 and 65 gallons (76 and 246 liters) per minute packaged precipitation systems are approximately $85,000 and $115,000, respectively. Costs for performing laboratory bench-scale testing can range from $5,000 to $20,000. If a pilot-scale or field demonstration is necessary, costs can range from $50,000 to $250,000 depending on scale, analytical requirements, and duration (does not include cost of additional treatment, handling, storage, transportation, and disposal of radioactive residuals) (FRTR, 2002).
U.S. Bureau of Reclamation cost estimates for uranium removal to achieve drinking water standards using coagulation/filtration for a 200 gallon (757 liters) per minute system are approximately $275,000 for equipment/construction and $80,000 per year for operation and
127
maintenance. U.S. Bureau of Reclamation cost estimates for uranium and radium removal to achieve drinking water standards using lime softening for a 200 gallon (757 liters) per minute system are approximately $310,000 for equipment/construction and $82,000 per year for operation and maintenance (USBR, 2001).
Commercial Availability
This technology is fully developed and has been applied to waste streams contaminated with radionuclides and metals. It is sometimes used in municipal water systems to treat radionuclides.
Contact Information
General Contacts:
EPA National Risk Management Research Laboratory
Tom Sorg 26 West Martin Luther King Drive Cincinnati, OH 45268 (513) 569-7370 [email protected]
Vendors:
This is a partial listing of available vendors. Additional and updated vendor information can be obtained from the EPA Remediation and Characterization Technologies website: http://www.epareachit.org/, the EPA Cleanup Information website: http://clu-in.org, and by contacting the federal agency contact listed above.
U.S. Filter Industrial Wastewater Systems 181 Thorn Hill Road Warrendale, PA 15086 (800) 541-8610 http://www.usfilter.com/water/
Tonka Equipment Company P.O. Box 41126 Plymouth, MN 55441 (763) 559-2837 http://www.tonkawater.com
Exede Corporation W146 N5800 Enterprise Avenue Menomonee Falls, WI 53168 (262) 703-9770 http://www.exede.com
Severn Trent Services 580 Virginia Drive, Suite 300 Ft. Washington, PA 19034 (215) 646-9201 http://www.severntrentservices.com
Hoffland Environmental Inc. 5100 Enterprise Drive Elliston, VA 24087 (936) 856-4515 http://www.hofflandenv.com
128
ProChem Inc. 5100 Enterprise Drive Elliston, VA 24087 (800) 290-2295 http://www.prochemweb.com
Enprotec 4465 Limaburg Road Hebron, KY 41048 (859) 689-4300 http://www.enprotec-usa.com
Chemical Precipitation References
Balasco, A., Santhanam, C., Stevens, J., Walters, R., and Wolfrum, E. Soluble Sulfide Precipitation Study. Arthur D. Little Inc. Final Report to USATHAMA, December 1986. Report No. AMXTH-TE-CR-87106.
Federal Remediation Technologies Roundtable. Remediation Technologies Screening Matrix and Reference Guide, Version 4.0: Precipitation/Coagulation/ Flocculation, 2002. http://www.frtr.gov/matrix2/section4/4-50.html
International Atomic Energy Agency. Technical Options for the Remediation of Contaminated Groundwater, June 1999. IAEA-TECDOC-1088.
Kapline Enterprises Inc. Aqueous-Stream Uranium-Removal Technology Cost/Benefit and Market Analysis. Prepared for U.S. Department of Energy, Office of Technology Development, March 1994. DOE/OR-2006.
Serkiz. S., Rebout, S., Bell, N., Kanzleiter, J., Bohrer, S., Lovekamp, J., and Faulk, G. Reengineering Water Treatment Units for Removal of Sr-90, I-129, Tc-99, and Uranium from Contaminated Groundwater at the DOE’s Savannah River Site. Prepared by Westinghouse Savannah River Company for U.S. Department of Energy, 2000. WSRC-MS-2000-00097.
Sorg, T. “Treatment of Radioactive Compounds in Water.” Radioactive Site Remediaton Technologies Seminar, Speaker Slide Copies. EPA Office of Research and Development, June 1992. EPA/540/K-92/001.
Sorg, T. “Methods for Removing Uranium From Drinking Water.” Journal of the American Water Works Association, July 1988. 80(7):105-111.
U.S. Bureau of Reclamation. Radionuclides Fact Sheet. Technical Service Center, Water Treatment Engineering and Research Group, Denver, Colo., 2001. http://www.usbr.gov/pmts/water/media/pdfs/Radionuclide.pdf
U.S. Environmental Protection Agency. Presumptive Response Strategy and Ex-Situ Treatment Technologies for Contaminated Ground Water at CERCLA Sites, Final Guidance, October 1996. EPA/540/R-96/023.
U.S. Environmental Protection Agency. Approaches for the Remediation of Federal Facility Sites Contaminated With Explosive or Radioactive Wastes, 1993. EPA/625/R-93/013.
129
3.1.3 Permeable Reactive Barriers
Description
Permeable reactive barriers, also known as passive treatment walls, are installed in the subsurface across the flow path of a radionuclide-contaminated groundwater plume, allowing the groundwater to passively flow through the wall while prohibiting the movement of the radionuclides. This is accomplished by employing treatment agents within the wall such as chelators (ligands specific for a given radionuclide), sorbents (such as peat, bone char phosphate, apatite, activated carbon, or zeolites) and reactive minerals (such as limestone). The radionuclides are retained in a concentrated form by the barrier material, which can require periodic replacement (FRTR, 2002).
A permeable reactive barrier is built by excavating a trench perpendicular to the groundwater flow path and backfilling it with the reactive materials, which can be mixed with sand to increase permeability. In some applications, the permeable reactive barrier is made the focal point of laterally connected, impermeable subsurface barriers (such as sheet piles or slurry walls) or permeable conduits (such as french drains) so that the groundwater is collected and funneled through the reactive material. This type of arrangement is usually referred to as a funnel and gate system.
Typical permeable reactive barriers are installed to depths of up to 80 feet (24.4 m) with backhoes, modified backhoes, and continuous trenching machines. For backhoe excavation in unstable soils, steel sheet piling is sometimes emplaced prior to excavation. Trench boxes are also used to provide stability during backfilling of excavations with the reactive media. Greater installation depths of up to 120 feet (36.6 m) are possible using slurry trenches for installation. For slurry trench installation, the slurry used is typically biodegradable (guar gum) to reduce potential wall plugging (Vidic, 2001). Other methods for installation include deep soil mixing (mixing the reactive material with soil using augers, similar to in-situ solidification techniques), jet grouting (injection of a mixture containing reactive material), and vibrating beam (driving an I-beam to depth and withdrawing while injecting a reactive slurry in the resulting void space) (NAVFAC, 2002).
Permeable reactive barriers have been selected by EPA to reduce uranium concentrations in groundwater as a part of the remedies at three sites: the Monticello Mill Tailings site in Utah (as a pilot study) (EPA, 1998a); the Rocky Flats Environmental Technology Site in Colorado (DOE, 2002a); and the Lincoln Park site in Colorado (as an interim measure) (EPA, 2002a).
Exhibit 3-5 illustrates the general process involved with permeable reactive barriers.
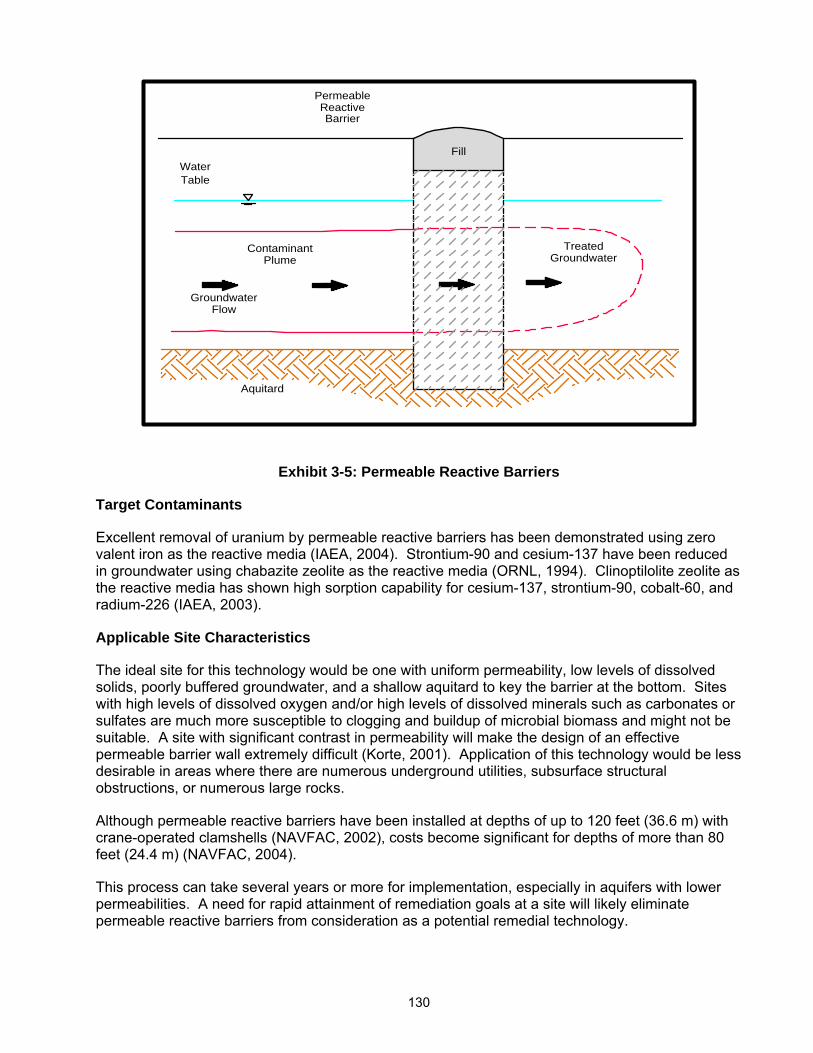
130
ReactivePermeable
Barrier
FlowGroundwater
PlumeContaminant
GroundwaterTreated
Fill
Aquitard
WaterTable
Exhibit 3-5: Permeable Reactive Barriers
Target Contaminants
Excellent removal of uranium by permeable reactive barriers has been demonstrated using zero valent iron as the reactive media (IAEA, 2004). Strontium-90 and cesium-137 have been reduced in groundwater using chabazite zeolite as the reactive media (ORNL, 1994). Clinoptilolite zeolite as the reactive media has shown high sorption capability for cesium-137, strontium-90, cobalt-60, and radium-226 (IAEA, 2003).
Applicable Site Characteristics
The ideal site for this technology would be one with uniform permeability, low levels of dissolved solids, poorly buffered groundwater, and a shallow aquitard to key the barrier at the bottom. Sites with high levels of dissolved oxygen and/or high levels of dissolved minerals such as carbonates or sulfates are much more susceptible to clogging and buildup of microbial biomass and might not be suitable. A site with significant contrast in permeability will make the design of an effective permeable barrier wall extremely difficult (Korte, 2001). Application of this technology would be less desirable in areas where there are numerous underground utilities, subsurface structural obstructions, or numerous large rocks.
Although permeable reactive barriers have been installed at depths of up to 120 feet (36.6 m) with crane-operated clamshells (NAVFAC, 2002), costs become significant for depths of more than 80 feet (24.4 m) (NAVFAC, 2004).
This process can take several years or more for implementation, especially in aquifers with lower permeabilities. A need for rapid attainment of remediation goals at a site will likely eliminate permeable reactive barriers from consideration as a potential remedial technology.
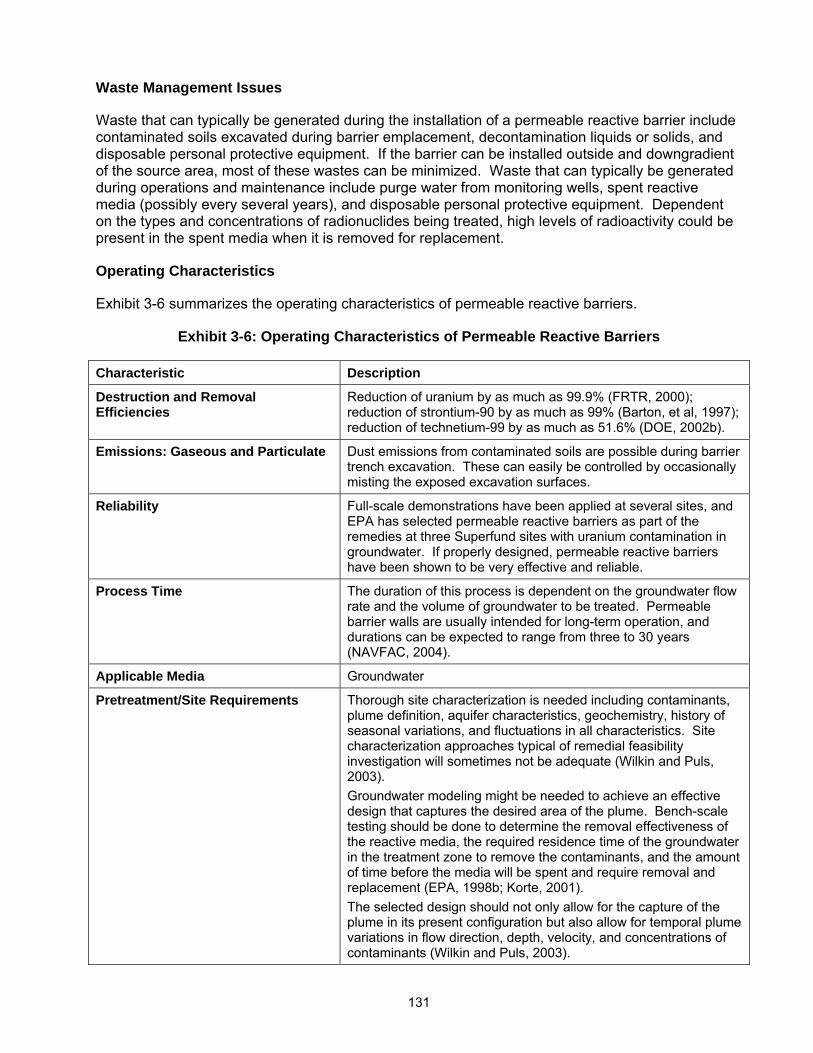
131
Waste Management Issues
Waste that can typically be generated during the installation of a permeable reactive barrier include contaminated soils excavated during barrier emplacement, decontamination liquids or solids, and disposable personal protective equipment. If the barrier can be installed outside and downgradient of the source area, most of these wastes can be minimized. Waste that can typically be generated during operations and maintenance include purge water from monitoring wells, spent reactive media (possibly every several years), and disposable personal protective equipment. Dependent on the types and concentrations of radionuclides being treated, high levels of radioactivity could be present in the spent media when it is removed for replacement.
Operating Characteristics
Exhibit 3-6 summarizes the operating characteristics of permeable reactive barriers.
Exhibit 3-6: Operating Characteristics of Permeable Reactive Barriers
Characteristic Description
Destruction and Removal Efficiencies
Reduction of uranium by as much as 99.9% (FRTR, 2000); reduction of strontium-90 by as much as 99% (Barton, et al, 1997); reduction of technetium-99 by as much as 51.6% (DOE, 2002b).
Emissions: Gaseous and Particulate Dust emissions from contaminated soils are possible during barrier trench excavation. These can easily be controlled by occasionally misting the exposed excavation surfaces.
Reliability Full-scale demonstrations have been applied at several sites, and EPA has selected permeable reactive barriers as part of the remedies at three Superfund sites with uranium contamination in groundwater. If properly designed, permeable reactive barriers have been shown to be very effective and reliable.
Process Time The duration of this process is dependent on the groundwater flow rate and the volume of groundwater to be treated. Permeable barrier walls are usually intended for long-term operation, and durations can be expected to range from three to 30 years (NAVFAC, 2004).
Applicable Media Groundwater
Pretreatment/Site Requirements Thorough site characterization is needed including contaminants, plume definition, aquifer characteristics, geochemistry, history of seasonal variations, and fluctuations in all characteristics. Site characterization approaches typical of remedial feasibility investigation will sometimes not be adequate (Wilkin and Puls, 2003). Groundwater modeling might be needed to achieve an effective design that captures the desired area of the plume. Bench-scale testing should be done to determine the removal effectiveness of the reactive media, the required residence time of the groundwater in the treatment zone to remove the contaminants, and the amount of time before the media will be spent and require removal and replacement (EPA, 1998b; Korte, 2001). The selected design should not only allow for the capture of the plume in its present configuration but also allow for temporal plume variations in flow direction, depth, velocity, and concentrations of contaminants (Wilkin and Puls, 2003).
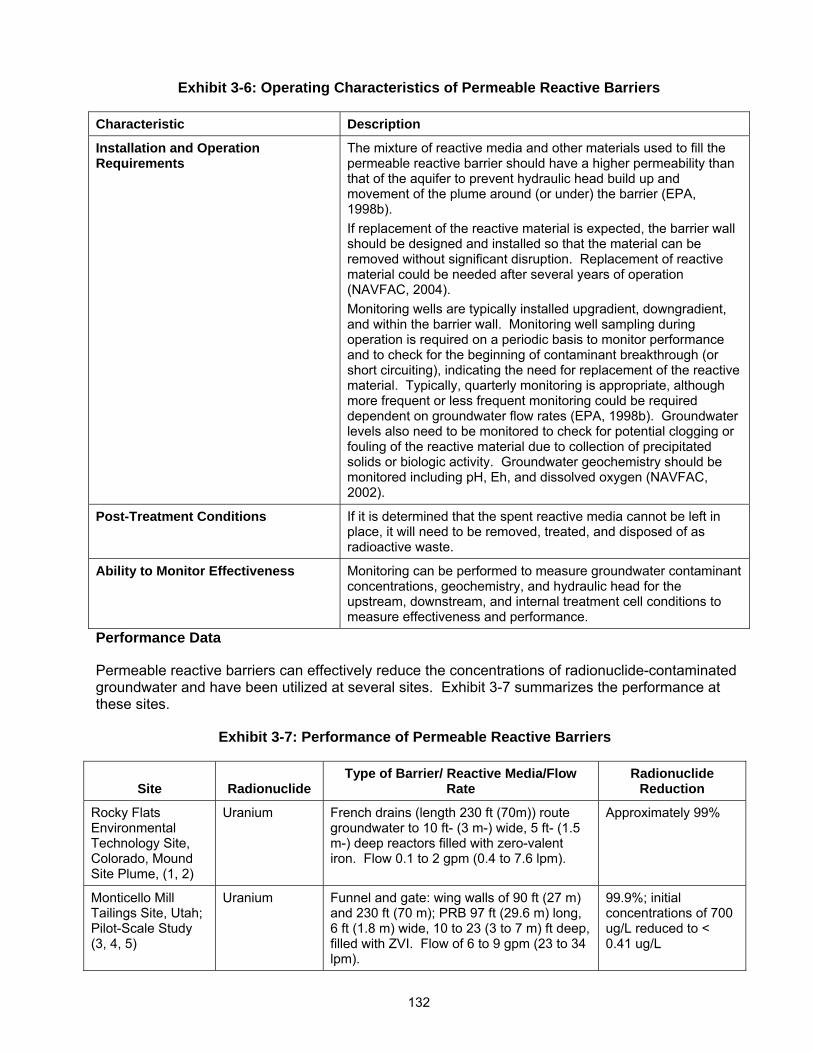
132
Exhibit 3-6: Operating Characteristics of Permeable Reactive Barriers
Characteristic Description
Installation and Operation Requirements
The mixture of reactive media and other materials used to fill the permeable reactive barrier should have a higher permeability than that of the aquifer to prevent hydraulic head build up and movement of the plume around (or under) the barrier (EPA, 1998b). If replacement of the reactive material is expected, the barrier wall should be designed and installed so that the material can be removed without significant disruption. Replacement of reactive material could be needed after several years of operation (NAVFAC, 2004). Monitoring wells are typically installed upgradient, downgradient, and within the barrier wall. Monitoring well sampling during operation is required on a periodic basis to monitor performance and to check for the beginning of contaminant breakthrough (or short circuiting), indicating the need for replacement of the reactive material. Typically, quarterly monitoring is appropriate, although more frequent or less frequent monitoring could be required dependent on groundwater flow rates (EPA, 1998b). Groundwater levels also need to be monitored to check for potential clogging or fouling of the reactive material due to collection of precipitated solids or biologic activity. Groundwater geochemistry should be monitored including pH, Eh, and dissolved oxygen (NAVFAC, 2002).
Post-Treatment Conditions If it is determined that the spent reactive media cannot be left in place, it will need to be removed, treated, and disposed of as radioactive waste.
Ability to Monitor Effectiveness Monitoring can be performed to measure groundwater contaminant concentrations, geochemistry, and hydraulic head for the upstream, downstream, and internal treatment cell conditions to measure effectiveness and performance.
Performance Data
Permeable reactive barriers can effectively reduce the concentrations of radionuclide-contaminated groundwater and have been utilized at several sites. Exhibit 3-7 summarizes the performance at these sites.
Exhibit 3-7: Performance of Permeable Reactive Barriers
Site
Radionuclide
Type of Barrier/ Reactive Media/Flow Rate
Radionuclide Reduction
Rocky Flats Environmental Technology Site, Colorado, Mound Site Plume, (1, 2)
Uranium French drains (length 230 ft (70m)) route groundwater to 10 ft- (3 m-) wide, 5 ft- (1.5 m-) deep reactors filled with zero-valent iron. Flow 0.1 to 2 gpm (0.4 to 7.6 lpm).
Approximately 99%
Monticello Mill Tailings Site, Utah; Pilot-Scale Study (3, 4, 5)
Uranium Funnel and gate: wing walls of 90 ft (27 m) and 230 ft (70 m); PRB 97 ft (29.6 m) long, 6 ft (1.8 m) wide, 10 to 23 (3 to 7 m) ft deep, filled with ZVI. Flow of 6 to 9 gpm (23 to 34 lpm).
99.9%; initial concentrations of 700 ug/L reduced to < 0.41 ug/L
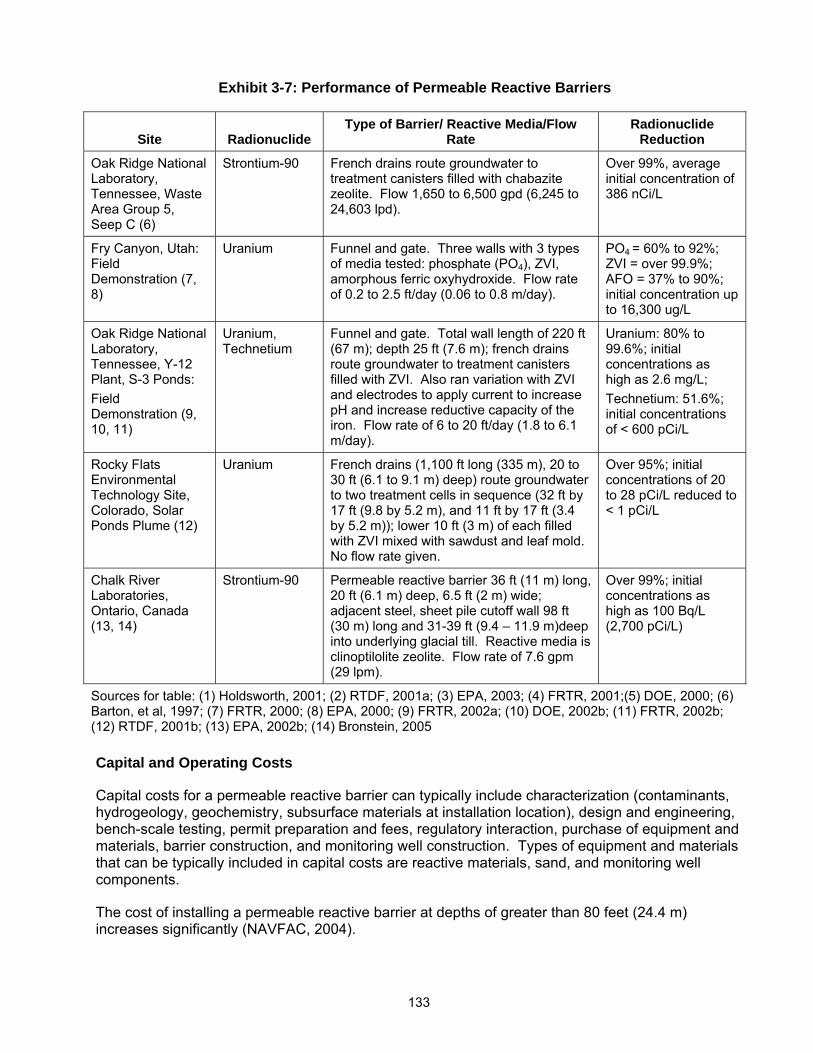
133
Exhibit 3-7: Performance of Permeable Reactive Barriers
Site
Radionuclide
Type of Barrier/ Reactive Media/Flow Rate
Radionuclide Reduction
Oak Ridge National Laboratory, Tennessee, Waste Area Group 5, Seep C (6)
Strontium-90 French drains route groundwater to treatment canisters filled with chabazite zeolite. Flow 1,650 to 6,500 gpd (6,245 to 24,603 lpd).
Over 99%, average initial concentration of 386 nCi/L
Fry Canyon, Utah: Field Demonstration (7, 8)
Uranium Funnel and gate. Three walls with 3 types of media tested: phosphate (PO4), ZVI, amorphous ferric oxyhydroxide. Flow rate of 0.2 to 2.5 ft/day (0.06 to 0.8 m/day).
PO4 = 60% to 92%; ZVI = over 99.9%; AFO = 37% to 90%; initial concentration up to 16,300 ug/L
Oak Ridge National Laboratory, Tennessee, Y-12 Plant, S-3 Ponds: Field Demonstration (9, 10, 11)
Uranium, Technetium
Funnel and gate. Total wall length of 220 ft (67 m); depth 25 ft (7.6 m); french drains route groundwater to treatment canisters filled with ZVI. Also ran variation with ZVI and electrodes to apply current to increase pH and increase reductive capacity of the iron. Flow rate of 6 to 20 ft/day (1.8 to 6.1 m/day).
Uranium: 80% to 99.6%; initial concentrations as high as 2.6 mg/L; Technetium: 51.6%; initial concentrations of < 600 pCi/L
Rocky Flats Environmental Technology Site, Colorado, Solar Ponds Plume (12)
Uranium French drains (1,100 ft long (335 m), 20 to 30 ft (6.1 to 9.1 m) deep) route groundwater to two treatment cells in sequence (32 ft by 17 ft (9.8 by 5.2 m), and 11 ft by 17 ft (3.4 by 5.2 m)); lower 10 ft (3 m) of each filled with ZVI mixed with sawdust and leaf mold. No flow rate given.
Over 95%; initial concentrations of 20 to 28 pCi/L reduced to < 1 pCi/L
Chalk River Laboratories, Ontario, Canada (13, 14)
Strontium-90 Permeable reactive barrier 36 ft (11 m) long, 20 ft (6.1 m) deep, 6.5 ft (2 m) wide; adjacent steel, sheet pile cutoff wall 98 ft (30 m) long and 31-39 ft (9.4 – 11.9 m)deep into underlying glacial till. Reactive media is clinoptilolite zeolite. Flow rate of 7.6 gpm (29 lpm).
Over 99%; initial concentrations as high as 100 Bq/L (2,700 pCi/L)
Sources for table: (1) Holdsworth, 2001; (2) RTDF, 2001a; (3) EPA, 2003; (4) FRTR, 2001;(5) DOE, 2000; (6) Barton, et al, 1997; (7) FRTR, 2000; (8) EPA, 2000; (9) FRTR, 2002a; (10) DOE, 2002b; (11) FRTR, 2002b; (12) RTDF, 2001b; (13) EPA, 2002b; (14) Bronstein, 2005
Capital and Operating Costs
Capital costs for a permeable reactive barrier can typically include characterization (contaminants, hydrogeology, geochemistry, subsurface materials at installation location), design and engineering, bench-scale testing, permit preparation and fees, regulatory interaction, purchase of equipment and materials, barrier construction, and monitoring well construction. Types of equipment and materials that can be typically included in capital costs are reactive materials, sand, and monitoring well components.
The cost of installing a permeable reactive barrier at depths of greater than 80 feet (24.4 m) increases significantly (NAVFAC, 2004).
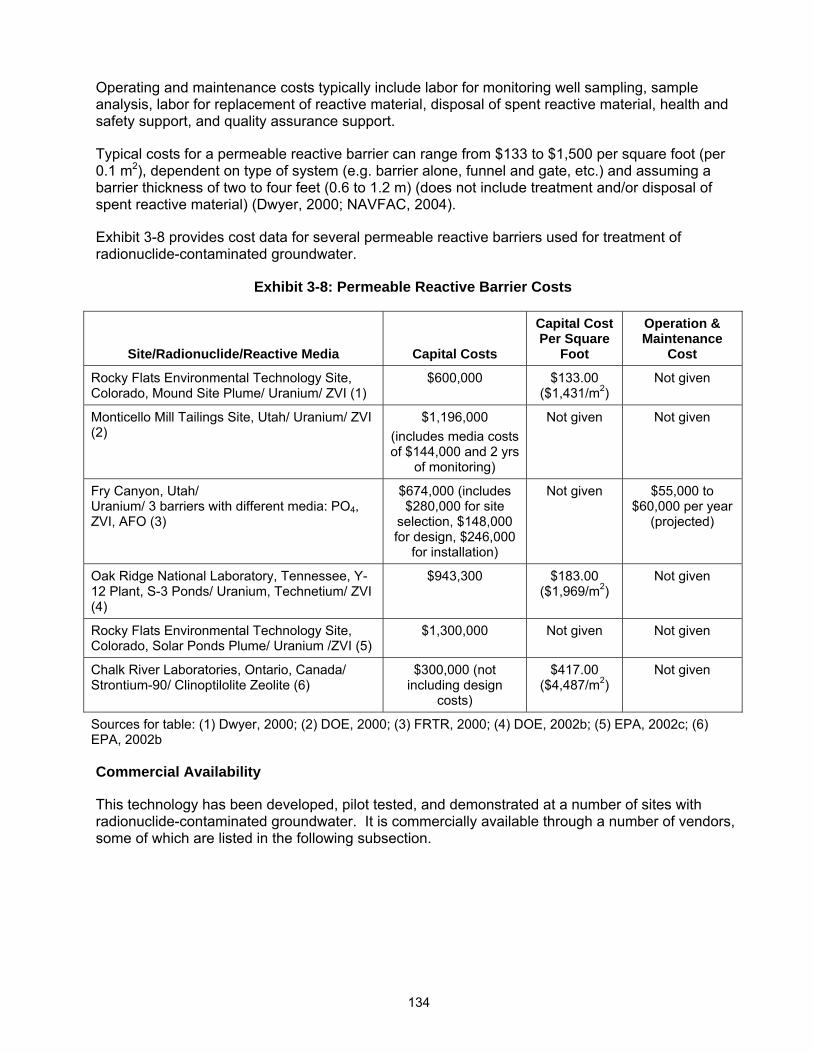
134
Operating and maintenance costs typically include labor for monitoring well sampling, sample analysis, labor for replacement of reactive material, disposal of spent reactive material, health and safety support, and quality assurance support.
Typical costs for a permeable reactive barrier can range from $133 to $1,500 per square foot (per 0.1 m2), dependent on type of system (e.g. barrier alone, funnel and gate, etc.) and assuming a barrier thickness of two to four feet (0.6 to 1.2 m) (does not include treatment and/or disposal of spent reactive material) (Dwyer, 2000; NAVFAC, 2004).
Exhibit 3-8 provides cost data for several permeable reactive barriers used for treatment of radionuclide-contaminated groundwater.
Exhibit 3-8: Permeable Reactive Barrier Costs
Site/Radionuclide/Reactive Media
Capital Costs
Capital Cost Per Square
Foot
Operation & Maintenance
Cost
Rocky Flats Environmental Technology Site, Colorado, Mound Site Plume/ Uranium/ ZVI (1)
$600,000 $133.00 ($1,431/m2)
Not given
Monticello Mill Tailings Site, Utah/ Uranium/ ZVI (2)
$1,196,000 (includes media costs of $144,000 and 2 yrs
of monitoring)
Not given Not given
Fry Canyon, Utah/ Uranium/ 3 barriers with different media: PO4, ZVI, AFO (3)
$674,000 (includes $280,000 for site
selection, $148,000 for design, $246,000
for installation)
Not given $55,000 to $60,000 per year
(projected)
Oak Ridge National Laboratory, Tennessee, Y-12 Plant, S-3 Ponds/ Uranium, Technetium/ ZVI (4)
$943,300 $183.00 ($1,969/m2)
Not given
Rocky Flats Environmental Technology Site, Colorado, Solar Ponds Plume/ Uranium /ZVI (5)
$1,300,000 Not given Not given
Chalk River Laboratories, Ontario, Canada/ Strontium-90/ Clinoptilolite Zeolite (6)
$300,000 (not including design
costs)
$417.00 ($4,487/m2)
Not given
Sources for table: (1) Dwyer, 2000; (2) DOE, 2000; (3) FRTR, 2000; (4) DOE, 2002b; (5) EPA, 2002c; (6) EPA, 2002b
Commercial Availability
This technology has been developed, pilot tested, and demonstrated at a number of sites with radionuclide-contaminated groundwater. It is commercially available through a number of vendors, some of which are listed in the following subsection.
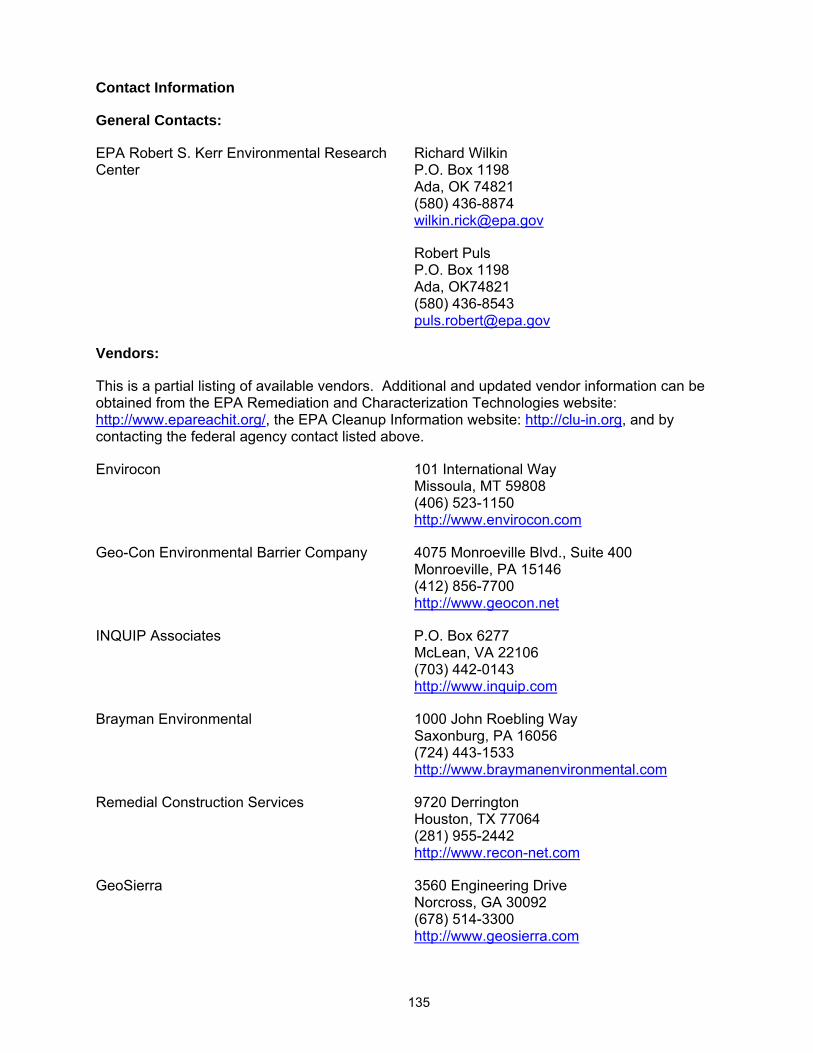
135
Contact Information
General Contacts:
EPA Robert S. Kerr Environmental Research Center
Richard Wilkin P.O. Box 1198 Ada, OK 74821 (580) 436-8874 [email protected]
Robert Puls P.O. Box 1198 Ada, OK74821 (580) 436-8543 [email protected]
Vendors:
This is a partial listing of available vendors. Additional and updated vendor information can be obtained from the EPA Remediation and Characterization Technologies website: http://www.epareachit.org/, the EPA Cleanup Information website: http://clu-in.org, and by contacting the federal agency contact listed above.
Envirocon 101 International Way Missoula, MT 59808 (406) 523-1150 http://www.envirocon.com
Geo-Con Environmental Barrier Company 4075 Monroeville Blvd., Suite 400 Monroeville, PA 15146 (412) 856-7700 http://www.geocon.net
INQUIP Associates P.O. Box 6277 McLean, VA 22106 (703) 442-0143 http://www.inquip.com
Brayman Environmental 1000 John Roebling Way Saxonburg, PA 16056 (724) 443-1533 http://www.braymanenvironmental.com
Remedial Construction Services 9720 Derrington Houston, TX 77064 (281) 955-2442 http://www.recon-net.com
GeoSierra 3560 Engineering Drive Norcross, GA 30092 (678) 514-3300 http://www.geosierra.com
136
Permeable Reactive Barrier References
Barton, W., Craig, P., and Stone, W. “Two Passive Groundwater Treatment Installations at DOE Facilities.” Proceedings of: International Containment Technology Conference, February 9-12, 1997, St. Peterburg, Fla.
Bronstein, K. Permeable Reactive Barriers for Inorganic and Radioactive Contamination. Prepared for U.S. EPA, Office of Solid Waste and Emergency Response, through the National Network of Environmental Management Studies. August, 2005.
Dwyer, B. Design, Construction and Monitoring of a Permeable Reactive Barrier Technology for Use at Rocky Flats Environmental Technology Site (RFETS). Prepared by Sandia National Laboratories for the U.S. DOE, November 2000. Sandia Report SAND2000-2702.
Federal Remediation Technologies Roundtable. Remediation Technologies Screening Matrix and Reference Guide, Version 4.0: Passive/Reactive Treatment Walls, 2002. http://www.frtr.gov/matrix2/section4/4-41.html
Federal Remediation Technologies Roundtable. “Passive Reactive Barrier at Oak Ridge National Laboratory, Oak Ridge, Tennessee.” Abstracts of Remediation Case Studies, Volume 6, June 2002a. EPA/542/R-02/006.
Federal Remediation Technologies Roundtable. Evaluation of Permeable Reactive Barrier Performance, Revised Report, December 2002b. http://www.frtr.gov/pdf/2-prb_performance.pdf
Federal Remediation Technologies Roundtable. “Permeable Reactive Barrier at Monticello Mill Tailings Site, Monticello, Utah.” Abstracts of Remediation Case Studies, Volume 5, May 2001. EPA/542/R-01/008.
Federal Remediation Technologies Roundtable. “In-situ Permeable Reactive Barriers for Contaminated Groundwater at Fry Canyon.” Abstracts of Remediation Case Studies, Volume 4, June 2000. EPA/542/R-00/006.
Holdsworth, T. “Iron Reactive Barrier Used at Rock Flats Site.” Ground Water Currents, Issue No. 39, U.S. EPA, April 2001. EPA/542/N-01/005.
International Atomic Energy Agency. The Long Term Stabilization of Uranium Mill Tailings – Final Report of a Co-ordinated Research Project, 2000-2004, August 2004. IAEA-TECDOC-1403.
International Atomic Energy Agency. Combined Methods for Liquid Radioactive Waste Treatment – Final Report of a Coordinated Research Project, 1997-2001, February 2003. IAEA-TECDOC-1336.
Korte, N. Zero-Valent Iron Permeable Reactive Barriers: A Review of Performance. Prepared by Oak Ridge National Laboratory for the U.S. DOE, April 2001. ORNL/TM-2000/345.
Oak Ridge National Laboratory. Y-12 Plant Remedial Action Technology Logic Diagram, Volume 3, Technology Evaluation Data Sheets, Part A, Remedial Action, 1994. Y/ER-161/V3/PtA.
Remediation Technologies Development Forum. Rocky Flats Environmental Technology Site (Mound Site), Golden, Colo. Permeable Barriers Action Team, Permeable Reactive Barrier Installation Profiles, 2001a. http://www.rtdf.org.public/permbarr/PRBSUMMS/profile.cfm?mid=85
Remediation Technologies Development Forum. Rocky Flats Environmental Technology Site (Solar Ponds Plume), Golden, Colo. Permeable Barriers Action Team, Permeable Reactive Barrier
137
Installation Profiles, 2001b. http://www.rtdf.org.public/permbarr/PRBSUMMS/profile.cfm?mid=87
U.S. Department of Energy. First Five-Year Review Report for Rocky Flats Environmental Technology Site, Golden, Colo., July 2002a. Prepared by U.S. DOE, Rocky Flats Field Office for U.S. EPA.
U.S. Department of Energy. Innovative Technology Summary Report: Passive Reactive Barrier. Subsurface Contaminants Focus Area, March 2002b. DOE/EM-0623.
U.S. Department of Energy. Innovative Technology Summary Report: Permeable Reactive Treatment (PeRT) Wall for Rads and Metals. Subsurface Contaminants Focus Area, September 2000. DOE/EM-0557.
U.S. Environmental Protection Agency. “Evaluating Performance of the Monticello PRB in Treating Uranium and Metals.” Technology News and Trends, July 2003. EPA CLU-IN Newsletter. http://clu-in.org
U.S. Environmental Protection Agency. EPA Superfund Record of Decision: Lincoln Park, EPA ID: COD042167858, OU 02, Canon City, Colo., 01/03/2002, 2002a. EPA/ROD/R08-02/108.
U.S. Environmental Protection Agency. Cost and Performance Report – Permeable Reactive Barriers Interim Summary Report: Permeable Reactive Barriers Using Continuous Walls to Treat Metals, May 2002. Office of Solid Waste and Emergency Response, Technology Innovation Office, 2002b.
U.S. Environmental Protection Agency. Cost and Performance Report – Permeable Reactive Barriers Interim Summary Report: Permeable Reactive Barriers Using Iron With a Bulking Agent as a Reactive Media, May 2002. Office of Solid Waste and Emergency Response, Technology Innovation Office, 2002c.
U.S. Environmental Protection Agency. Field Demonstration of Permeable Reactive Barriers to Remove Dissolved Uranium From Groundwater, Fry Canyon, Utah, September 1997 through September 1998, Interim Report. Office of Air and Radiation, November 2000. EPA/402/C-00/001.
U.S. Environmental Protection Agency. EPA Superfund Record of Decision: Monticello Mill Tailings (USDOE), EPA ID: UT3890090035, OU 3, Monticello, Utah, 09/29/1998. 1998a. EPA/ROD/R08-98/106.
U.S. Environmental Protection Agency. Permeable Reactive Barrier Technologies for Contaminant Remediation. Office of Research and Development, Office of Solid Waste and Emergency Response, September 1998b. EPA/600/R-98/125.
U.S. Naval Facilities Engineering Command. Naval Facilities Engineering Service Center, Port Hueneme, Environmental Restoration & BRAC Website, Technology Pages: Treatment Wall (Permeable Reactive Barrier), 2004. http://enviro.nfesc.navy.mil/erb
U.S. Naval Facilities Engineering Command. Tech Data Sheet: Advances in Permeable Reactive Barrier Technologies, August, 2002. Washington, DC. NFESC TDS-2089-ENV.
Vidic, R. Permeable Reactive Barrier: Case Study Review. Ground-Water Remediation Technologies Analysis Center, November 2001. Technology Evaluation Report TE-01-01.
138
Wilkin, R. and Puls, R. Capstone Report on the Application, Monitoring, and Performance of Permeable Reactive Barriers for Ground-Water Remediation: Volume 1 – Performance Evaluations at Two Sites. U.S. EPA, National Risk Management Research Laboratory, August 2003. EPA/600/R-03/045a.
3.2 PHYSICAL SEPARATION
Physical separation technologies for liquid media separate contaminated media into clean and contaminated fractions by taking advantage of the contaminants’ physical properties.
Contaminants are either solvated by the liquid media (i.e., one molecule of the contaminant surrounded by many molecules of the liquid) or are present as microscopic particles suspended in the solution. The physical separation of the radionuclides from the liquid media results in “clean” liquid and a contaminated residue that requires further handling, treatment, and/or disposal. These residuals can take the form of a sludge, filter cake, or carbon adsorption unit. Physical separation technologies can be applied to a variety of liquid media, including groundwater, surface water, wastewater, and slurried sludge or sediment.
Physical separation technologies are ex-situ processes and require the construction and operation of a ground-water extraction and delivery system. They generate a treated effluent waste stream of which the volume and type depend on the technology. This profile addresses the following technologies: membrane filtration (reverse osmosis and microfiltration), carbon adsorption, and aeration.
3.2.1 Membrane Filtration
Description
Membrane filtration uses a semi-permeable membrane to separate dissolved radionuclides or solid radionuclide particles in liquid media (e.g., groundwater, surface water) from the liquid media itself. Generally, some form of pretreatment (such as filtration of suspended solids) is required in order to protect the membrane’s integrity. Water flow rate and pH should be controlled to ensure optimum conditions. Two types of membrane processes used for treatment of radionuclides in liquids are micro or ultrafiltration and reverse osmosis.
Micro and ultrafiltration rely on the pore size of the membrane, which can be varied to remove particles and molecules of various sizes. Micro, ultra, and nanofiltration processes generally work best for separating very fine particles (0.001-0.1 microns) from the liquid. These filtration processes can operate at pressures in the range of five to 100 psi (ACOE, 1997). Efficiencies of ultrafiltration separation are sometimes enhanced through pretreatment of the contaminated liquids with complexing agents to form larger molecular complexes (e.g. metal-polymers or chelates) that are more readily separated by the membranes (EPA, 2000).
Reverse osmosis uses a selectively permeable membrane that allows water to pass through it, but which traps radionuclide ions on the concentrated, contaminated liquid side of the membrane. Normally, osmotic pressures would draw the cleaner water to the dissolved ions, but high pressure in the range of 200 to 400 psi applied to the solution forces water with lower ion concentrations through the membrane (ACOE, 1997). The three most commonly used reverse osmosis membrane materials are cellulose acetate, aromatic polyamide, and thin-film composites, which consist of a thin film of a salt-rejecting membrane on the surface of a porous support polymer (NAVFAC, 2004). Reverse osmosis is affected by the size and charge of the ion being treated. Because radium and uranium ions are large and highly charged, reverse osmosis is particularly effective at removing these dissolved radionuclides from contaminated solutions. Reverse osmosis removes molecules with diameters in the range of 0.0001 microns (Dow, 2000).
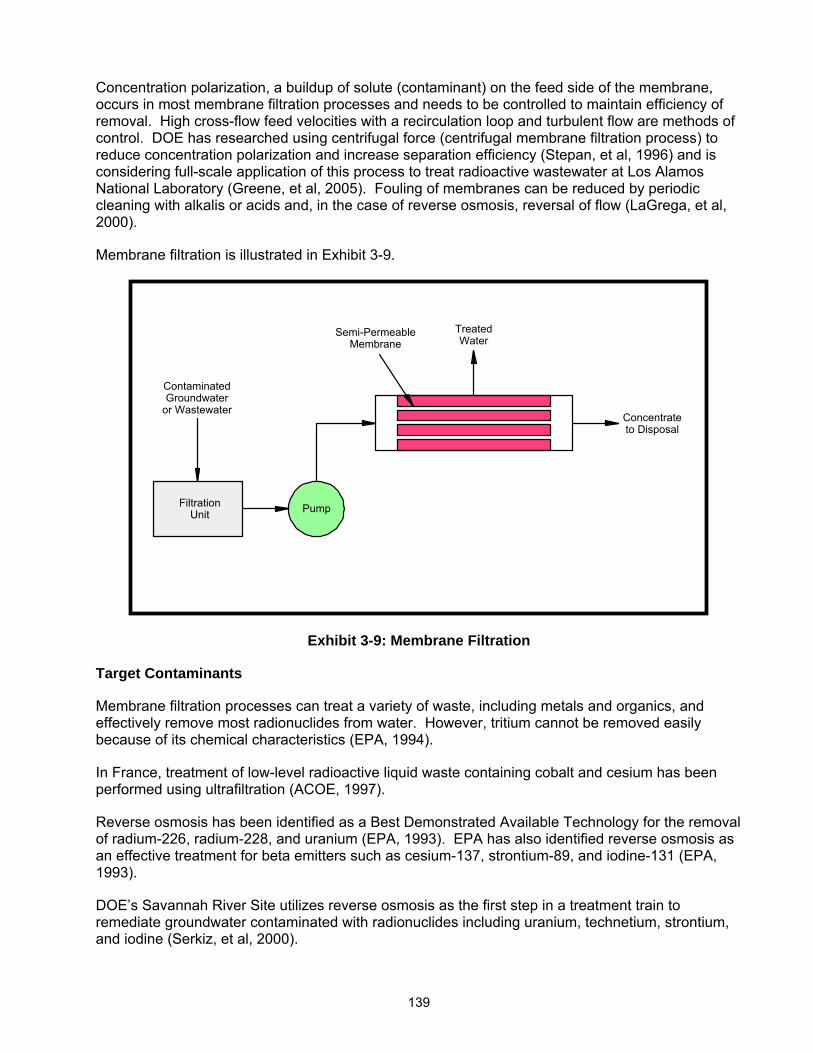
139
Concentration polarization, a buildup of solute (contaminant) on the feed side of the membrane, occurs in most membrane filtration processes and needs to be controlled to maintain efficiency of removal. High cross-flow feed velocities with a recirculation loop and turbulent flow are methods of control. DOE has researched using centrifugal force (centrifugal membrane filtration process) to reduce concentration polarization and increase separation efficiency (Stepan, et al, 1996) and is considering full-scale application of this process to treat radioactive wastewater at Los Alamos National Laboratory (Greene, et al, 2005). Fouling of membranes can be reduced by periodic cleaning with alkalis or acids and, in the case of reverse osmosis, reversal of flow (LaGrega, et al, 2000).
Membrane filtration is illustrated in Exhibit 3-9.
or Wastewater���
Groundwater���
Contaminated���
Pump���
Unit���
Filtration���
to Disposal���
Concentrate���
Membrane���
Semi-Permeable���
Water���
Treated���
Exhibit 3-9: Membrane Filtration
Target Contaminants
Membrane filtration processes can treat a variety of waste, including metals and organics, and effectively remove most radionuclides from water. However, tritium cannot be removed easily because of its chemical characteristics (EPA, 1994).
In France, treatment of low-level radioactive liquid waste containing cobalt and cesium has been performed using ultrafiltration (ACOE, 1997).
Reverse osmosis has been identified as a Best Demonstrated Available Technology for the removal of radium-226, radium-228, and uranium (EPA, 1993). EPA has also identified reverse osmosis as an effective treatment for beta emitters such as cesium-137, strontium-89, and iodine-131 (EPA, 1993).
DOE’s Savannah River Site utilizes reverse osmosis as the first step in a treatment train to remediate groundwater contaminated with radionuclides including uranium, technetium, strontium, and iodine (Serkiz, et al, 2000).
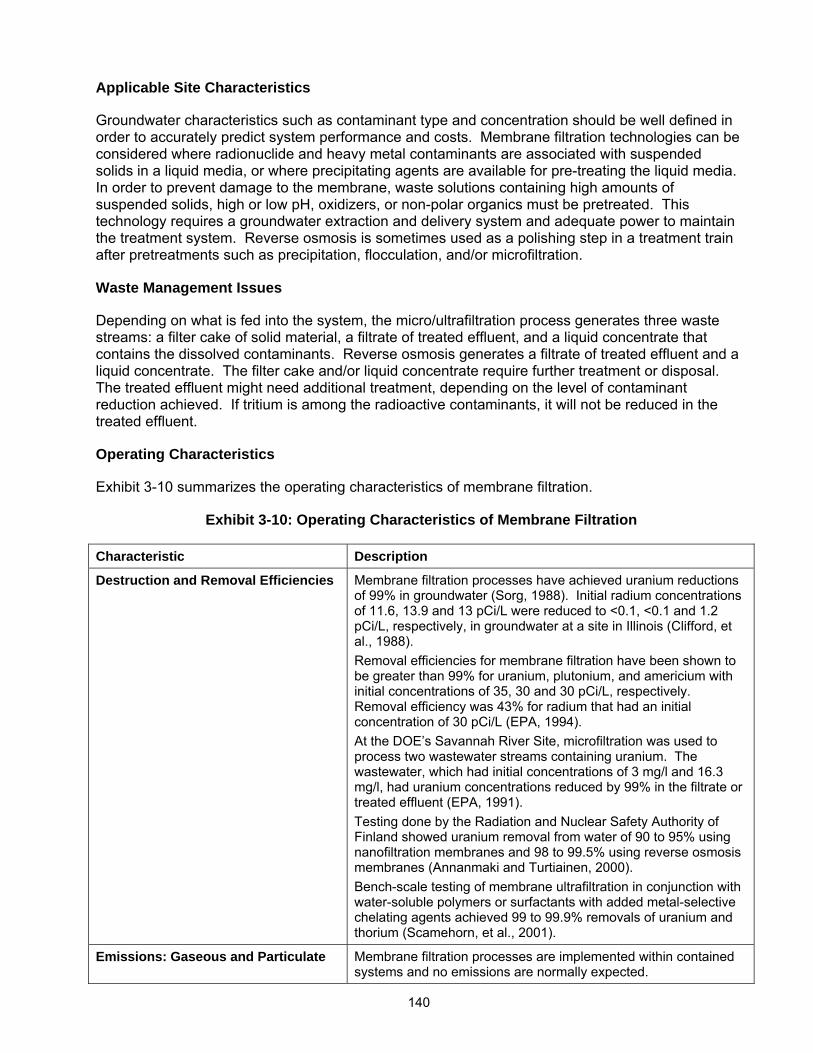
140
Applicable Site Characteristics
Groundwater characteristics such as contaminant type and concentration should be well defined in order to accurately predict system performance and costs. Membrane filtration technologies can be considered where radionuclide and heavy metal contaminants are associated with suspended solids in a liquid media, or where precipitating agents are available for pre-treating the liquid media. In order to prevent damage to the membrane, waste solutions containing high amounts of suspended solids, high or low pH, oxidizers, or non-polar organics must be pretreated. This technology requires a groundwater extraction and delivery system and adequate power to maintain the treatment system. Reverse osmosis is sometimes used as a polishing step in a treatment train after pretreatments such as precipitation, flocculation, and/or microfiltration.
Waste Management Issues
Depending on what is fed into the system, the micro/ultrafiltration process generates three waste streams: a filter cake of solid material, a filtrate of treated effluent, and a liquid concentrate that contains the dissolved contaminants. Reverse osmosis generates a filtrate of treated effluent and a liquid concentrate. The filter cake and/or liquid concentrate require further treatment or disposal. The treated effluent might need additional treatment, depending on the level of contaminant reduction achieved. If tritium is among the radioactive contaminants, it will not be reduced in the treated effluent.
Operating Characteristics
Exhibit 3-10 summarizes the operating characteristics of membrane filtration.
Exhibit 3-10: Operating Characteristics of Membrane Filtration
Characteristic Description
Destruction and Removal Efficiencies Membrane filtration processes have achieved uranium reductions of 99% in groundwater (Sorg, 1988). Initial radium concentrations of 11.6, 13.9 and 13 pCi/L were reduced to <0.1, <0.1 and 1.2 pCi/L, respectively, in groundwater at a site in Illinois (Clifford, et al., 1988). Removal efficiencies for membrane filtration have been shown to be greater than 99% for uranium, plutonium, and americium with initial concentrations of 35, 30 and 30 pCi/L, respectively. Removal efficiency was 43% for radium that had an initial concentration of 30 pCi/L (EPA, 1994). At the DOE’s Savannah River Site, microfiltration was used to process two wastewater streams containing uranium. The wastewater, which had initial concentrations of 3 mg/l and 16.3 mg/l, had uranium concentrations reduced by 99% in the filtrate or treated effluent (EPA, 1991). Testing done by the Radiation and Nuclear Safety Authority of Finland showed uranium removal from water of 90 to 95% using nanofiltration membranes and 98 to 99.5% using reverse osmosis membranes (Annanmaki and Turtiainen, 2000). Bench-scale testing of membrane ultrafiltration in conjunction with water-soluble polymers or surfactants with added metal-selective chelating agents achieved 99 to 99.9% removals of uranium and thorium (Scamehorn, et al., 2001).
Emissions: Gaseous and Particulate Membrane filtration processes are implemented within contained systems and no emissions are normally expected.
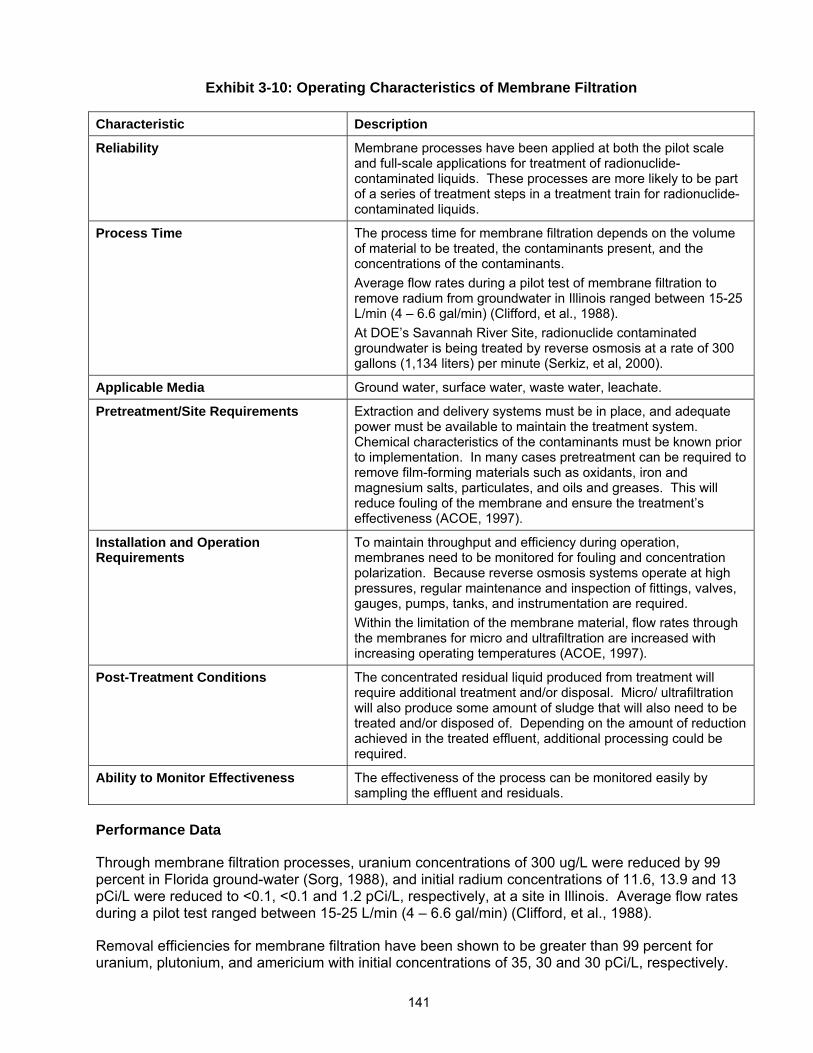
141
Exhibit 3-10: Operating Characteristics of Membrane Filtration
Characteristic Description
Reliability Membrane processes have been applied at both the pilot scale and full-scale applications for treatment of radionuclide-contaminated liquids. These processes are more likely to be part of a series of treatment steps in a treatment train for radionuclide-contaminated liquids.
Process Time The process time for membrane filtration depends on the volume of material to be treated, the contaminants present, and the concentrations of the contaminants. Average flow rates during a pilot test of membrane filtration to remove radium from groundwater in Illinois ranged between 15-25 L/min (4 – 6.6 gal/min) (Clifford, et al., 1988). At DOE’s Savannah River Site, radionuclide contaminated groundwater is being treated by reverse osmosis at a rate of 300 gallons (1,134 liters) per minute (Serkiz, et al, 2000).
Applicable Media Ground water, surface water, waste water, leachate.
Pretreatment/Site Requirements Extraction and delivery systems must be in place, and adequate power must be available to maintain the treatment system. Chemical characteristics of the contaminants must be known prior to implementation. In many cases pretreatment can be required to remove film-forming materials such as oxidants, iron and magnesium salts, particulates, and oils and greases. This will reduce fouling of the membrane and ensure the treatment’s effectiveness (ACOE, 1997).
Installation and Operation Requirements
To maintain throughput and efficiency during operation, membranes need to be monitored for fouling and concentration polarization. Because reverse osmosis systems operate at high pressures, regular maintenance and inspection of fittings, valves, gauges, pumps, tanks, and instrumentation are required. Within the limitation of the membrane material, flow rates through the membranes for micro and ultrafiltration are increased with increasing operating temperatures (ACOE, 1997).
Post-Treatment Conditions The concentrated residual liquid produced from treatment will require additional treatment and/or disposal. Micro/ ultrafiltration will also produce some amount of sludge that will also need to be treated and/or disposed of. Depending on the amount of reduction achieved in the treated effluent, additional processing could be required.
Ability to Monitor Effectiveness The effectiveness of the process can be monitored easily by sampling the effluent and residuals.
Performance Data
Through membrane filtration processes, uranium concentrations of 300 ug/L were reduced by 99 percent in Florida ground-water (Sorg, 1988), and initial radium concentrations of 11.6, 13.9 and 13 pCi/L were reduced to <0.1, <0.1 and 1.2 pCi/L, respectively, at a site in Illinois. Average flow rates during a pilot test ranged between 15-25 L/min (4 – 6.6 gal/min) (Clifford, et al., 1988).
Removal efficiencies for membrane filtration have been shown to be greater than 99 percent for uranium, plutonium, and americium with initial concentrations of 35, 30 and 30 pCi/L, respectively.
142
Removal efficiency was 43 percent for radium that had an initial concentration of 30 pCi/L (EPA, 1994).
At the DOE’s Savannah River Site, microfiltration was used to process two wastewater streams containing uranium. The wastewater, which had initial concentrations of 3 mg/l and 16.3 mg/l, had uranium concentrations reduced by 99 percent in the filtrate or treated effluent (EPA, 1991).
Testing done by the Radiation and Nuclear Safety Authority of Finland showed uranium removal from water of 90 to 95 percent using nanofiltration membranes and 98 to 99.5 percent using reverse osmosis membranes (Annanmaki and Turtiainen, 2000).
Bench-scale testing of membrane ultrafiltration in conjunction with water-soluble polymers or surfactants with added metal-selective chelating agents achieved 99 to 99.9 percent removals of uranium and thorium (Scamehorn, et al., 2001).
Capital and Operating Costs
Capital costs for a membrane filtration system can typically include characterization of contaminated liquids, design and engineering, bench-scale testing, permit preparation and fees, regulatory interaction, purchase of system equipment (prefilters, tanks, piping, pumps, valves, controls, membrane), and system construction.
Operating and maintenance costs can typically include pretreatment (filtration) to remove suspended solids, operating and maintenance labor, utilities, sampling and analysis for process control, membrane replacement, health and safety support, quality assurance support, and additional treatment and/or off-site disposal of residual concentrated liquid waste and filter cake (from micro/ultrafiltration).
Operating and maintenance costs decrease as the duration of treatment increases, indicating minimal maintenance costs (EPA, 1994). Complications such as contaminant fouling of the membrane result in higher costs. Pretreatment, if necessary, also will affect cost. In addition, further treatment and disposal of the waste (e.g. filter cake, liquid concentrate) will raise costs.
Microfiltration/ultrafiltration treatment costs range from $0.50 to $15 per 1000 gallons (3,785 liters) and depend on the volume to be treated, treatment duration, and contaminant concentrations (EPA, 1994). At the DOE’s Savannah River Site, microfiltration treatment costs (including polymers, filter aids, and filter media) of uranium-contaminated wastewater were about $5 per 1,000 gallons (3,785 liters) (EPA. 1991).
Evaluation of reverse osmosis for uranium treatment in municipal water systems indicated that the costs could range from $0.89 per 1000 gallons (3,785 liters) for very large systems (over 1 million people) to $6.20 per 1,000 gallons (3,785 liters) for very small systems (25 to 100 people) (KEI, 1994).
Commercial Availability
Microfiltration/ultrafiltration and reverse osmosis treatment are commonly used in both municipal drinking water systems and industrial wastewater treatment systems. Some municipal treatment systems utilize ultrafiltration and reverse osmosis to meet EPA drinking water standards for radionuclides in drinking water. Equipment and assembled membrane filtration systems are readily available from a number of vendors. Contact information for some of these vendors are listed in the following subsection.
143
Contact Information
General Contacts:
EPA National Risk Management Research Laboratory
Tom Sorg 26 West Martin Luther King Drive Cincinnati, OH 45268 (513) 569-7370 [email protected]
Vendors:
This is a partial listing of available vendors. Additional and updated vendor information can be obtained from the EPA Remediation and Characterization Technologies website: http://www.epareachit.org/, the EPA Cleanup Information website: http://clu-in.org, and by contacting the federal agency contact listed above.
U.S. Filter 181 Thorn Hill Road Warrendale, PA 15086 (800) 541-8610 http://www.usfilter.com/water/
The Dow Chemical Company Liquid Separations
P.O. Box 1206 Midland, MI 48642 (800) 447-4369 http://www.dow.com/liquidseps
Severn Trent Services 580 Virginia Drive, Suite 300 Ft. Washington, PA 19034 (215) 646-9201 http://www.severntrentservices.com
Tonka Equipment Company P.O. Box 41126 Plymouth, MN 55441 (763) 559-2837 http://www.tonkawater.com
Hoffland Environmental Inc. 10391 Silver Springs Road Conroe, TX 77303 (936) 856-4515 http://www.hofflandenv.com
Remco Engineering 4835 Colt Street Ventura, CA 93003 (805) 658-0600 http://www.remco.com
Koch Membrane Systems 850 Main Street Wilmington, MA 01887 (888) 677-5624 http://www.kochmembrane.com
144
Membrane Filtration References
Annanmaki, M. and Turtiainen, T. (eds.). Treatment Techniques for Removing Natural Radionuclides from Drinking Water. Final Report of the TENAWA project. Prepared for the Radiation and Nuclear Safety Authority of Finland (STUK), Helsinki, 2000. Report No. STUK –A169.
Clifford, D., Vijjeswarapu, W., and Subramoniuan, S. “Evaluating Various Adsorbents and Membranes for Removing Radium from Groundwater.” Journal of the American Water Works Association. 80(7):94-104, July 1988.
Dow Chemical Company. Nanofiltration for Municipal Water Treatment, September 26, 2000. Dow Chemical website. http://www.dow.com/liquidseps/news/NF-Backgrounder.htm
Greene, W., Kirk, P., Hayes, R., and Riley, J. Final Report: Centrifugal Membrane Filtration. Prepared by: SpinTek Membrane Systems Inc. Prepared for the U.S. DOE, Contract No. DE-AC21-96MC3313, 2005.
Kapline Enterprises Inc. Aqueous-Stream Uranium-Removal Technology Cost/Benefit and Market Analysis. Prepared for U.S. Department of Energy, Office of Technology Development, March 1994. DOE/OR-2006.
LaGrega, M., Buckingham, P., and Evans, J. Hazardous Waste Management, Second Edition. McGraw-Hill Inc., 2000.
Scamehorn, J., Taylor, R., and Palmer, C. Final Report: Removal of Radioactive Cations and Anions from Polluted Water Using Ligand-Modified Colloid-Enhanced Ultrafiltration. Prepared by University of Oklahoma. Prepared for the U.S. DOE, Project No. 60041-OK, 2001.
Sorg, T. “Methods for Removing Uranium From Drinking Water.” Journal of the American Water Works Association, 80(7):105-111, July 1988.
Stepan, D., Moe, T., and Collings, M. Task 9 – Centrifugal Membrane Filtration, Semi-Annual Report, April 1 – September 30, 1996. Prepared by Energy and Environmental Research Center, University of North Dakota, for the U.S. Department of Energy, 1996. DOE/MC/31388 – 5500.
U.S. Army Corps of Engineers. Guidance for Low-Level Radioactive Waste (LLRW) and Mixed Waste (MW) Treatment and Handling, 1997. EM-1110-1-4002.
U.S. Environmental Protection Agency. “Atomic Energy of Canada, Limited (Chemical Treatment and Ultrafiltration).” Superfund Innovative Technology Evaluation Program, Technology Profiles, Tenth Edition, August 2000. EPA/540/C-99/500.
U.S. Environmental Protection Agency. The Superfund Innovative Technology Evaluation Capsule: Filter Flow Technology Inc., Colloid Polishing Filter Method, July 1994. EPA/540/R-94/501a.
U.S. Environmental Protection Agency. Approaches for the Remediation of Federal Facility Sites Contaminated With Explosive or Radioactive Wastes, 1993. EPA/625/R-93/013.
U.S. Environmental Protection Agency. Applications Analysis Report: E.I. DuPont De Nemours & Company/Oberlin Filter Company Microfiltration Technology, October 1991. EPA/540/A5-90/007.
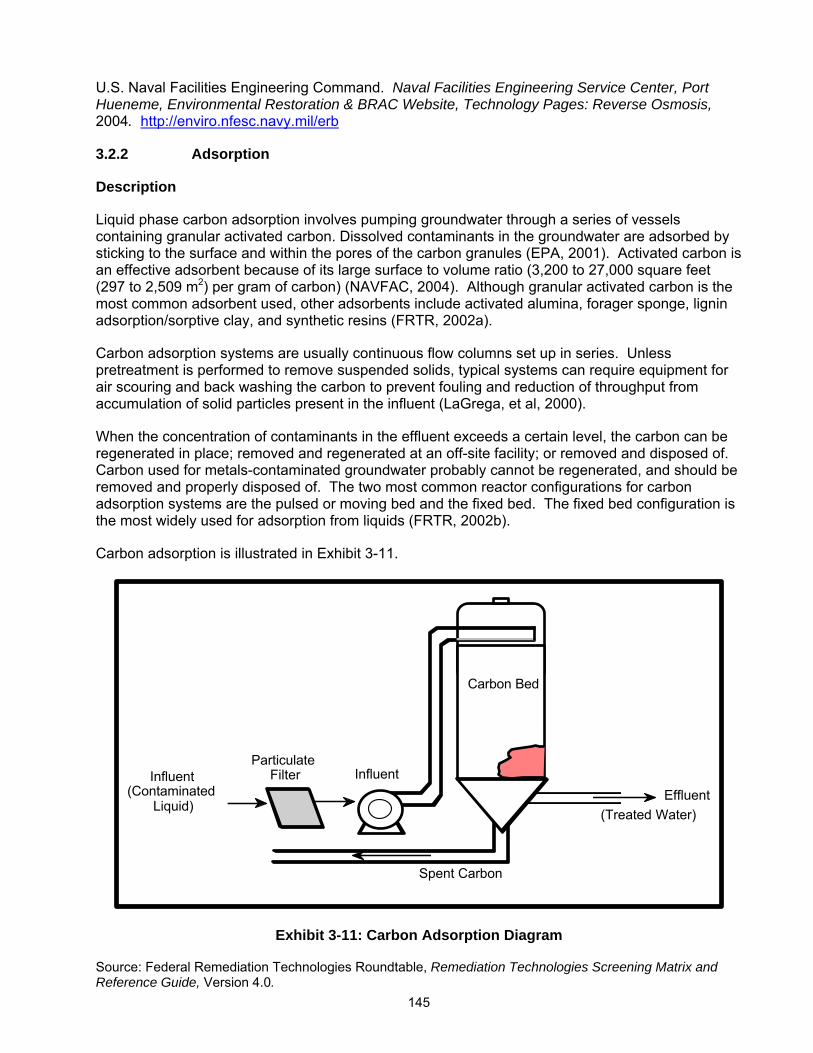
145
U.S. Naval Facilities Engineering Command. Naval Facilities Engineering Service Center, Port Hueneme, Environmental Restoration & BRAC Website, Technology Pages: Reverse Osmosis, 2004. http://enviro.nfesc.navy.mil/erb
3.2.2 Adsorption
Description
Liquid phase carbon adsorption involves pumping groundwater through a series of vessels containing granular activated carbon. Dissolved contaminants in the groundwater are adsorbed by sticking to the surface and within the pores of the carbon granules (EPA, 2001). Activated carbon is an effective adsorbent because of its large surface to volume ratio (3,200 to 27,000 square feet (297 to 2,509 m2) per gram of carbon) (NAVFAC, 2004). Although granular activated carbon is the most common adsorbent used, other adsorbents include activated alumina, forager sponge, lignin adsorption/sorptive clay, and synthetic resins (FRTR, 2002a).
Carbon adsorption systems are usually continuous flow columns set up in series. Unless pretreatment is performed to remove suspended solids, typical systems can require equipment for air scouring and back washing the carbon to prevent fouling and reduction of throughput from accumulation of solid particles present in the influent (LaGrega, et al, 2000).
When the concentration of contaminants in the effluent exceeds a certain level, the carbon can be regenerated in place; removed and regenerated at an off-site facility; or removed and disposed of. Carbon used for metals-contaminated groundwater probably cannot be regenerated, and should be removed and properly disposed of. The two most common reactor configurations for carbon adsorption systems are the pulsed or moving bed and the fixed bed. The fixed bed configuration is the most widely used for adsorption from liquids (FRTR, 2002b).
Carbon adsorption is illustrated in Exhibit 3-11.
Particulate��� ���
Filter���
Influent���Effluent���
(Treated Water)���
(Contaminated��� ���
Liquid)���
Carbon Bed���
Influent���
Spent Carbon
Exhibit 3-11: Carbon Adsorption Diagram
Source: Federal Remediation Technologies Roundtable, Remediation Technologies Screening Matrix and Reference Guide, Version 4.0.
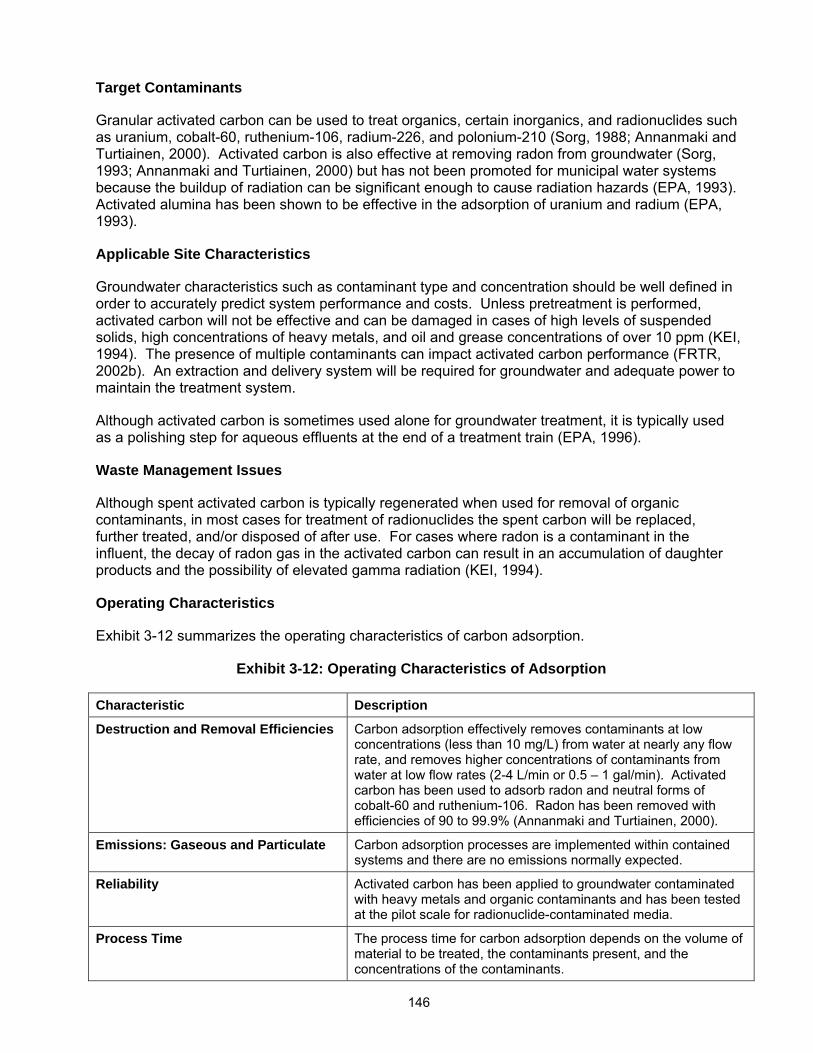
146
Target Contaminants
Granular activated carbon can be used to treat organics, certain inorganics, and radionuclides such as uranium, cobalt-60, ruthenium-106, radium-226, and polonium-210 (Sorg, 1988; Annanmaki and Turtiainen, 2000). Activated carbon is also effective at removing radon from groundwater (Sorg, 1993; Annanmaki and Turtiainen, 2000) but has not been promoted for municipal water systems because the buildup of radiation can be significant enough to cause radiation hazards (EPA, 1993). Activated alumina has been shown to be effective in the adsorption of uranium and radium (EPA, 1993).
Applicable Site Characteristics
Groundwater characteristics such as contaminant type and concentration should be well defined in order to accurately predict system performance and costs. Unless pretreatment is performed, activated carbon will not be effective and can be damaged in cases of high levels of suspended solids, high concentrations of heavy metals, and oil and grease concentrations of over 10 ppm (KEI, 1994). The presence of multiple contaminants can impact activated carbon performance (FRTR, 2002b). An extraction and delivery system will be required for groundwater and adequate power to maintain the treatment system.
Although activated carbon is sometimes used alone for groundwater treatment, it is typically used as a polishing step for aqueous effluents at the end of a treatment train (EPA, 1996).
Waste Management Issues
Although spent activated carbon is typically regenerated when used for removal of organic contaminants, in most cases for treatment of radionuclides the spent carbon will be replaced, further treated, and/or disposed of after use. For cases where radon is a contaminant in the influent, the decay of radon gas in the activated carbon can result in an accumulation of daughter products and the possibility of elevated gamma radiation (KEI, 1994).
Operating Characteristics
Exhibit 3-12 summarizes the operating characteristics of carbon adsorption.
Exhibit 3-12: Operating Characteristics of Adsorption
Characteristic Description
Destruction and Removal Efficiencies Carbon adsorption effectively removes contaminants at low concentrations (less than 10 mg/L) from water at nearly any flow rate, and removes higher concentrations of contaminants from water at low flow rates (2-4 L/min or 0.5 – 1 gal/min). Activated carbon has been used to adsorb radon and neutral forms of cobalt-60 and ruthenium-106. Radon has been removed with efficiencies of 90 to 99.9% (Annanmaki and Turtiainen, 2000).
Emissions: Gaseous and Particulate Carbon adsorption processes are implemented within contained systems and there are no emissions normally expected.
Reliability Activated carbon has been applied to groundwater contaminated with heavy metals and organic contaminants and has been tested at the pilot scale for radionuclide-contaminated media.
Process Time The process time for carbon adsorption depends on the volume of material to be treated, the contaminants present, and the concentrations of the contaminants.
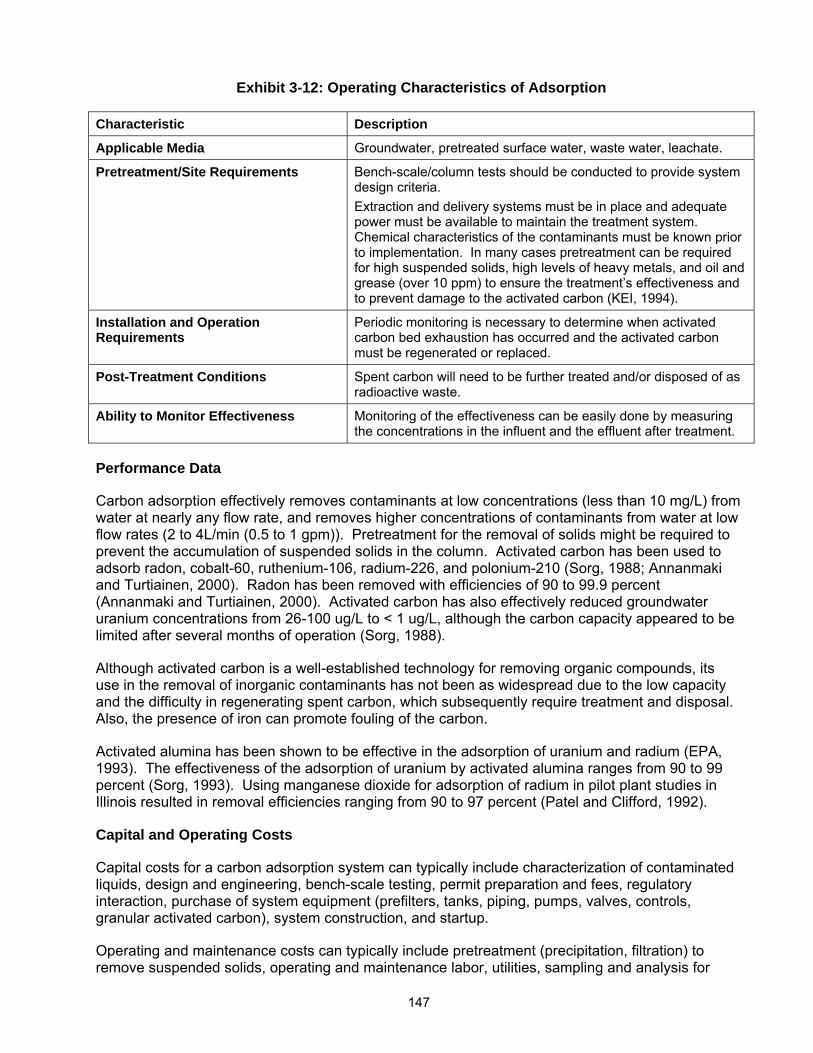
147
Exhibit 3-12: Operating Characteristics of Adsorption
Characteristic Description
Applicable Media Groundwater, pretreated surface water, waste water, leachate.
Pretreatment/Site Requirements Bench-scale/column tests should be conducted to provide system design criteria. Extraction and delivery systems must be in place and adequate power must be available to maintain the treatment system. Chemical characteristics of the contaminants must be known prior to implementation. In many cases pretreatment can be required for high suspended solids, high levels of heavy metals, and oil and grease (over 10 ppm) to ensure the treatment’s effectiveness and to prevent damage to the activated carbon (KEI, 1994).
Installation and Operation Requirements
Periodic monitoring is necessary to determine when activated carbon bed exhaustion has occurred and the activated carbon must be regenerated or replaced.
Post-Treatment Conditions Spent carbon will need to be further treated and/or disposed of as radioactive waste.
Ability to Monitor Effectiveness Monitoring of the effectiveness can be easily done by measuring the concentrations in the influent and the effluent after treatment.
Performance Data
Carbon adsorption effectively removes contaminants at low concentrations (less than 10 mg/L) from water at nearly any flow rate, and removes higher concentrations of contaminants from water at low flow rates (2 to 4L/min (0.5 to 1 gpm)). Pretreatment for the removal of solids might be required to prevent the accumulation of suspended solids in the column. Activated carbon has been used to adsorb radon, cobalt-60, ruthenium-106, radium-226, and polonium-210 (Sorg, 1988; Annanmaki and Turtiainen, 2000). Radon has been removed with efficiencies of 90 to 99.9 percent (Annanmaki and Turtiainen, 2000). Activated carbon has also effectively reduced groundwater uranium concentrations from 26-100 ug/L to < 1 ug/L, although the carbon capacity appeared to be limited after several months of operation (Sorg, 1988).
Although activated carbon is a well-established technology for removing organic compounds, its use in the removal of inorganic contaminants has not been as widespread due to the low capacity and the difficulty in regenerating spent carbon, which subsequently require treatment and disposal. Also, the presence of iron can promote fouling of the carbon.
Activated alumina has been shown to be effective in the adsorption of uranium and radium (EPA, 1993). The effectiveness of the adsorption of uranium by activated alumina ranges from 90 to 99 percent (Sorg, 1993). Using manganese dioxide for adsorption of radium in pilot plant studies in Illinois resulted in removal efficiencies ranging from 90 to 97 percent (Patel and Clifford, 1992).
Capital and Operating Costs
Capital costs for a carbon adsorption system can typically include characterization of contaminated liquids, design and engineering, bench-scale testing, permit preparation and fees, regulatory interaction, purchase of system equipment (prefilters, tanks, piping, pumps, valves, controls, granular activated carbon), system construction, and startup.
Operating and maintenance costs can typically include pretreatment (precipitation, filtration) to remove suspended solids, operating and maintenance labor, utilities, sampling and analysis for
148
process control, replacement granular activated carbon, health and safety support, quality assurance support, and off-site regeneration or off-site treatment and disposal of depleted granular activated carbon. Complications such as contaminant fouling of the activated carbon result in higher costs.
At flow rates of 100,000 gallons (378,500 liters) per day, adsorption treatment costs range from $1.20 to $6.30 per 1000 gallons (3,785 liters) treated, and depend on the type and concentration of contaminants present and flow rates (FRTR, 2002b).
U.S. Bureau of Reclamation cost estimates for radon removal to achieve drinking water standards using granular activated carbon for a 200 gallon per minute treatment system are approximately $700,000 for equipment/construction and $135,000 per year for operation and maintenance (does not include spent activated carbon disposal and /or treatment costs as possible radioactive waste) (USBR, 2001).
Commercial Availability
Carbon adsorption is commonly used in industrial wastewater treatment systems. Equipment, granular activated carbon, and assembled systems are readily available from a number of vendors. Contact information for some of these vendors are listed in the following subsection.
Contact Information
General Contacts:
EPA National Risk Management Research Laboratory
Tom Sorg 26 West Martin Luther King Drive Cincinnati, OH 45268 (513) 569-7370 [email protected]
Vendors:
This is a partial listing of available vendors. Additional and updated vendor information can be obtained from the EPA Remediation and Characterization Technologies website: http://www.epareachit.org/, the EPA Cleanup Information website: http://clu-in.org, and by contacting the federal agency contact listed above.
Calgon Carbon Corporation 400 Calgon Carbon Drive Pittsburgh, PA 15205 (800) 422-7266 http://www.calgoncarbon.com/
U.S. Filter 181 Thorn Hill Road Warrendale, PA 15086 (800) 525-0658 http://www.usfilter.com/water/
UOP 25 East Algonquin Road Des Plaines, IL 60017 (847) 391-2000 http://www.uop.com
149
Axens North America 1800 St. James Place, Suite 500 Houston, TX 77056 (713) 840-1133 http://www.axens.net
Adsorption References
Annanmaki, M. and Turtiainen, T. (eds.). Treatment Techniques for Removing Natural Radionuclides from Drinking Water. Final Report of the TENAWA project. Prepared for the Radiation and Nuclear Safety Authority of Finland (STUK), Helsinki, 2000. Report No. STUK –A169.
Federal Remediation Technologies Roundtable. Remediation Technologies Screening Matrix and Reference Guide, Version 4.0: Adsoprtion/Absorption, 2002a. http://www.frtr.gov/matrix2/section4/4-44.html
Federal Remediation Technologies Roundtable. Remediation Technologies Screening Matrix and Reference Guide, Version 4.0: Granulated Activated Carbon (GAC)/Liquid Phase Carbon Adsoprtion, 2002b. http://www.frtr.gov/matrix2/section4/4-47.html
Kapline Enterprises Inc. Aqueous-Stream Uranium-Removal Technology Cost/Benefit and Market Analysis. Prepared for U.S. Department of Energy, Office of Technology Development, March 1994. DOE/OR-2006.
LaGrega, M., Buckingham, P., and Evans, J. Hazardous Waste Management, Second Edition. McGraw-Hill Inc., 2000.
Patel, R. and Clifford, D. Project Summary: Radium Removal from Water by Manganese Dioxide Adsorption and Diatomaceous Earth Filtration. Prepared for U.S. EPA, March 1992. EPA/600/S2-91/063.
Sorg, T. Seminar on Technologies for Remediating Sites Contaminated with Explosive and Radioactive Wastes. U.S. EPA, June 1993. EPA/625/K-93/001.
Sorg, T. “Methods for Removing Uranium From Drinking Water.” Journal of the American Water Works Association, 80(7):105-111, July 1988.
U.S. Bureau of Reclamation. Radionuclides Fact Sheet. Technical Service Center, Water Treatment Engineering and Research Group, Denver, Colo., 2001 http://www.usbr.gov/pmts/water/media/pdfs/Radionuclide.pdf
U.S. Environmental Protection Agency. A Citizen’s Guide to Activated Carbon Treatment, December 2001. EPA/542/F-01/020.
U.S. Environmental Protection Agency. Presumptive Response Strategy and Ex-Situ Treatment Technologies for Contaminated Ground Water at CERCLA Sites, Final Guidance, October 1996. EPA/540/R-96/023.
U.S. Environmental Protection Agency. Approaches for the Remediation of Federal Facility Sites Contaminated With Explosive or Radioactive Wastes, 1993. EPA/625/R-93/013.
U.S. Naval Facilities Engineering Command. Naval Facilities Engineering Service Center, Port Hueneme, Environmental Restoration & BRAC Website, Technology Pages: Granular Activated Carbon (GAC) Adsorption (Liquid Phase), 2004. http://enviro.nfesc.navy.mil/erb
150
3.2.3 Aeration
Description
EPA has identified aeration as a Best Demonstrated Available Technology for the removal of radon (EPA, 1993). Aeration is a mass transfer process that enhances the volatilization of compounds from water by passing air through water to improve the transfer between air and water phases. The process can be performed using packed towers, tray aeration, spray systems, or diffused bubble aeration.
In packed tower aeration, a counter-current flow of water and air are passed through a packing material. The packing, which typically consists of plastic shapes that have a high surface-to-volume ratio, provides a high surface area for the radon transfer from the water to the air (LaGrega, et al, 2000). The ground water is pumped to the top of the packed tower and distributed evenly over the packing while an air stream is blown into the bottom of the tower. The treated groundwater leaves the tower at the bottom while the air stream with most of the radon leaves at the top.
Tray aeration utilizes a series of trays equipped with slats, or perforated or wire-mesh bottoms. Radon removal occurs as the water falls through the trays and contacts the air. Air can either be supplied with a natural draft or through a forced draft from a blower (SAIC, 1999).
Spray aeration directs water upward in small drops to provide a large interfacial area from which the radon migrates into the air. The spray is projected from fixed nozzles on a pipe grid and requires a larger area for operation than other processes (SAIC, 1999).
In a diffused bubble system, an air blower forces air into several treatment tanks. The air is injected into the water by means of submerged diffusers such as porous plates or perforated pipes. The injected air forms bubbles that create turbulence in the water as they rise to the surface. The radon is then stripped from the water and vented outside the treatment area (SAIC, 1999).
Aeration treatment of radon contaminated groundwater produces radon air emissions from the treatment unit. Dependent on radon concentration in the emissions and regulations, an off-gas treatment system to capture the radon might be needed. Radon off-gas treatment usually consists of passing the air emissions through vapor phase activated carbon treatment.
Aeration is illustrated in Exhibit 3-13.
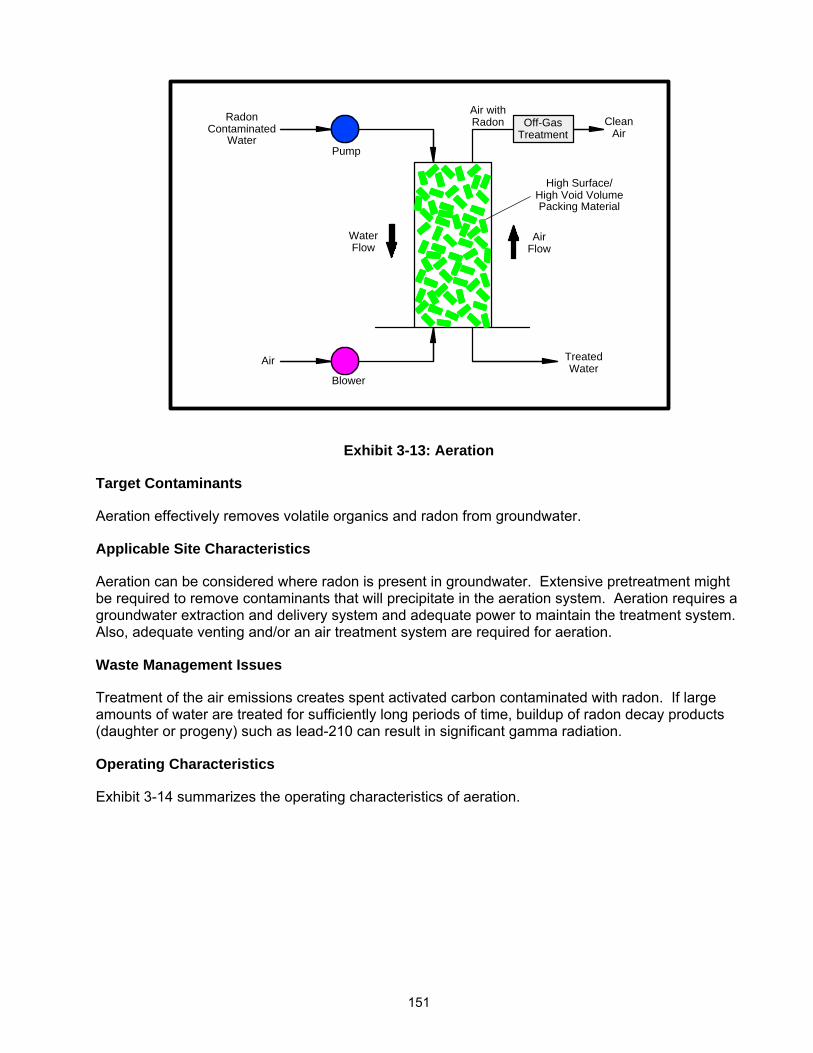
151
ContaminatedRadon
Water
High Void VolumeHigh Surface/
Packing Material
RadonAir with
FlowAir
FlowWater
WaterTreatedAir
Blower
Pump
AirClean
TreatmentOff-Gas
Exhibit 3-13: Aeration
Target Contaminants
Aeration effectively removes volatile organics and radon from groundwater.
Applicable Site Characteristics
Aeration can be considered where radon is present in groundwater. Extensive pretreatment might be required to remove contaminants that will precipitate in the aeration system. Aeration requires a groundwater extraction and delivery system and adequate power to maintain the treatment system. Also, adequate venting and/or an air treatment system are required for aeration.
Waste Management Issues
Treatment of the air emissions creates spent activated carbon contaminated with radon. If large amounts of water are treated for sufficiently long periods of time, buildup of radon decay products (daughter or progeny) such as lead-210 can result in significant gamma radiation.
Operating Characteristics
Exhibit 3-14 summarizes the operating characteristics of aeration.
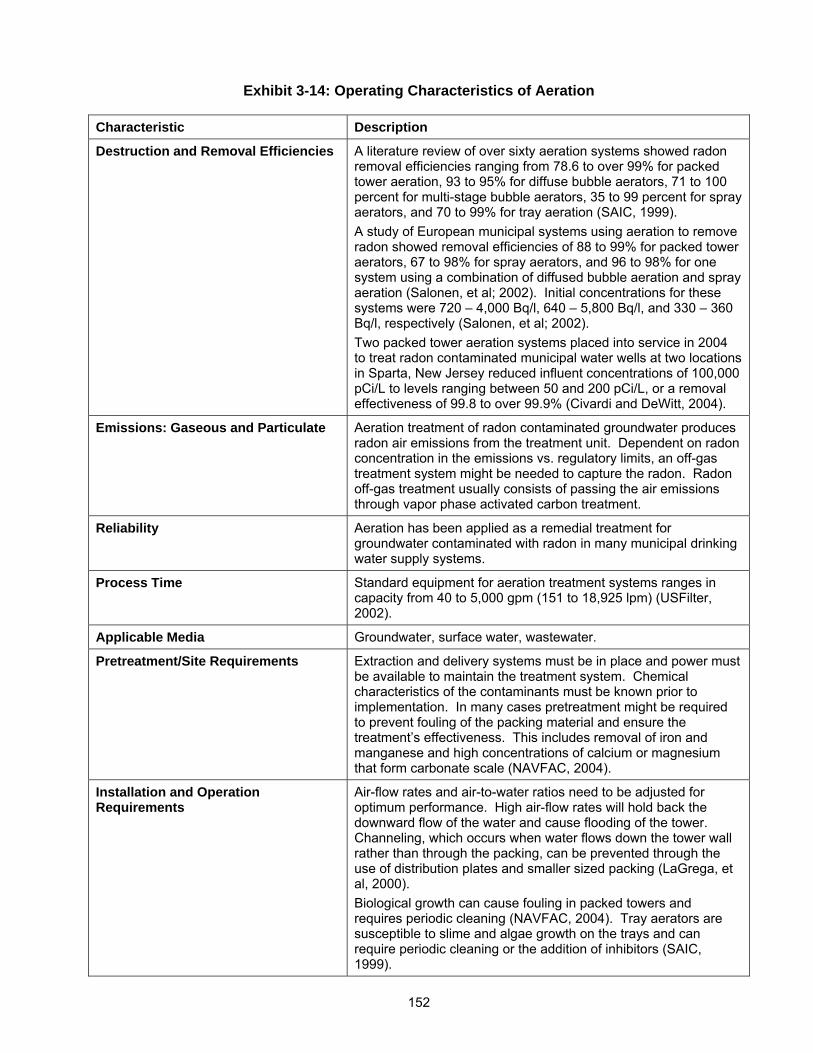
152
Exhibit 3-14: Operating Characteristics of Aeration
Characteristic Description
Destruction and Removal Efficiencies A literature review of over sixty aeration systems showed radon removal efficiencies ranging from 78.6 to over 99% for packed tower aeration, 93 to 95% for diffuse bubble aerators, 71 to 100 percent for multi-stage bubble aerators, 35 to 99 percent for spray aerators, and 70 to 99% for tray aeration (SAIC, 1999). A study of European municipal systems using aeration to remove radon showed removal efficiencies of 88 to 99% for packed tower aerators, 67 to 98% for spray aerators, and 96 to 98% for one system using a combination of diffused bubble aeration and spray aeration (Salonen, et al; 2002). Initial concentrations for these systems were 720 – 4,000 Bq/l, 640 – 5,800 Bq/l, and 330 – 360 Bq/l, respectively (Salonen, et al; 2002). Two packed tower aeration systems placed into service in 2004 to treat radon contaminated municipal water wells at two locations in Sparta, New Jersey reduced influent concentrations of 100,000 pCi/L to levels ranging between 50 and 200 pCi/L, or a removal effectiveness of 99.8 to over 99.9% (Civardi and DeWitt, 2004).
Emissions: Gaseous and Particulate Aeration treatment of radon contaminated groundwater produces radon air emissions from the treatment unit. Dependent on radon concentration in the emissions vs. regulatory limits, an off-gas treatment system might be needed to capture the radon. Radon off-gas treatment usually consists of passing the air emissions through vapor phase activated carbon treatment.
Reliability Aeration has been applied as a remedial treatment for groundwater contaminated with radon in many municipal drinking water supply systems.
Process Time Standard equipment for aeration treatment systems ranges in capacity from 40 to 5,000 gpm (151 to 18,925 lpm) (USFilter, 2002).
Applicable Media Groundwater, surface water, wastewater.
Pretreatment/Site Requirements Extraction and delivery systems must be in place and power must be available to maintain the treatment system. Chemical characteristics of the contaminants must be known prior to implementation. In many cases pretreatment might be required to prevent fouling of the packing material and ensure the treatment’s effectiveness. This includes removal of iron and manganese and high concentrations of calcium or magnesium that form carbonate scale (NAVFAC, 2004).
Installation and Operation Requirements
Air-flow rates and air-to-water ratios need to be adjusted for optimum performance. High air-flow rates will hold back the downward flow of the water and cause flooding of the tower. Channeling, which occurs when water flows down the tower wall rather than through the packing, can be prevented through the use of distribution plates and smaller sized packing (LaGrega, et al, 2000). Biological growth can cause fouling in packed towers and requires periodic cleaning (NAVFAC, 2004). Tray aerators are susceptible to slime and algae growth on the trays and can require periodic cleaning or the addition of inhibitors (SAIC, 1999).
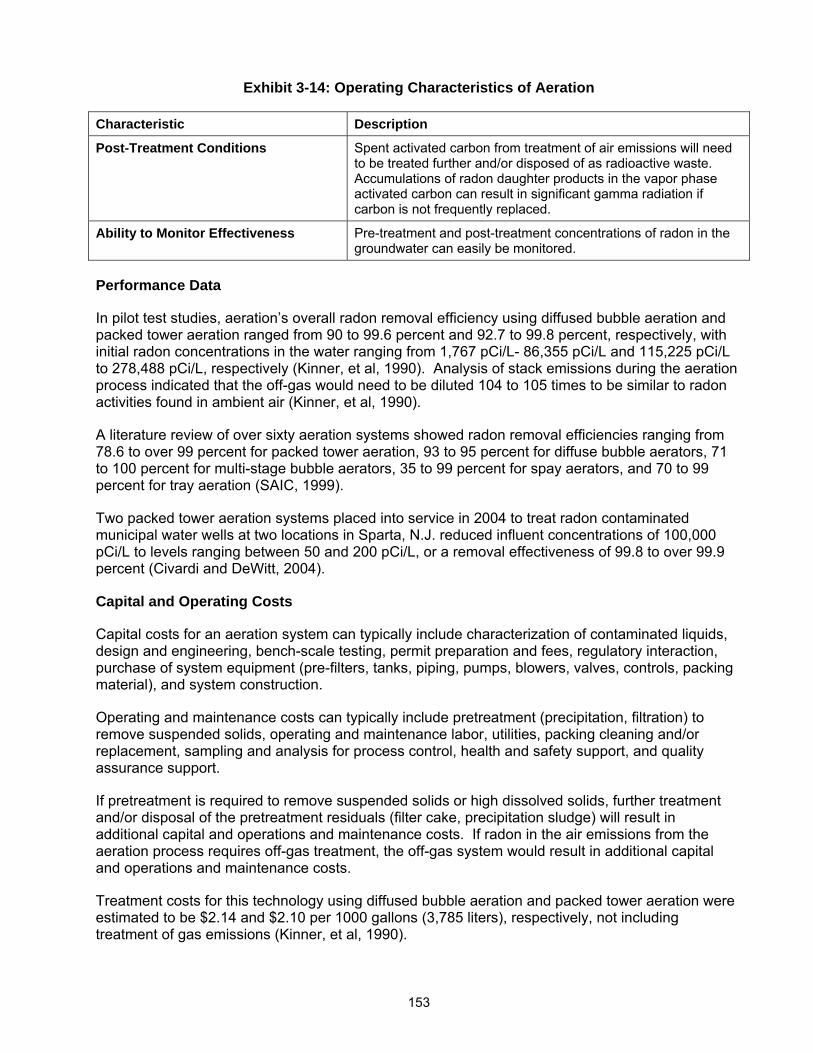
153
Exhibit 3-14: Operating Characteristics of Aeration
Characteristic Description
Post-Treatment Conditions Spent activated carbon from treatment of air emissions will need to be treated further and/or disposed of as radioactive waste. Accumulations of radon daughter products in the vapor phase activated carbon can result in significant gamma radiation if carbon is not frequently replaced.
Ability to Monitor Effectiveness Pre-treatment and post-treatment concentrations of radon in the groundwater can easily be monitored.
Performance Data
In pilot test studies, aeration’s overall radon removal efficiency using diffused bubble aeration and packed tower aeration ranged from 90 to 99.6 percent and 92.7 to 99.8 percent, respectively, with initial radon concentrations in the water ranging from 1,767 pCi/L- 86,355 pCi/L and 115,225 pCi/L to 278,488 pCi/L, respectively (Kinner, et al, 1990). Analysis of stack emissions during the aeration process indicated that the off-gas would need to be diluted 104 to 105 times to be similar to radon activities found in ambient air (Kinner, et al, 1990).
A literature review of over sixty aeration systems showed radon removal efficiencies ranging from 78.6 to over 99 percent for packed tower aeration, 93 to 95 percent for diffuse bubble aerators, 71 to 100 percent for multi-stage bubble aerators, 35 to 99 percent for spay aerators, and 70 to 99 percent for tray aeration (SAIC, 1999).
Two packed tower aeration systems placed into service in 2004 to treat radon contaminated municipal water wells at two locations in Sparta, N.J. reduced influent concentrations of 100,000 pCi/L to levels ranging between 50 and 200 pCi/L, or a removal effectiveness of 99.8 to over 99.9 percent (Civardi and DeWitt, 2004).
Capital and Operating Costs
Capital costs for an aeration system can typically include characterization of contaminated liquids, design and engineering, bench-scale testing, permit preparation and fees, regulatory interaction, purchase of system equipment (pre-filters, tanks, piping, pumps, blowers, valves, controls, packing material), and system construction.
Operating and maintenance costs can typically include pretreatment (precipitation, filtration) to remove suspended solids, operating and maintenance labor, utilities, packing cleaning and/or replacement, sampling and analysis for process control, health and safety support, and quality assurance support.
If pretreatment is required to remove suspended solids or high dissolved solids, further treatment and/or disposal of the pretreatment residuals (filter cake, precipitation sludge) will result in additional capital and operations and maintenance costs. If radon in the air emissions from the aeration process requires off-gas treatment, the off-gas system would result in additional capital and operations and maintenance costs.
Treatment costs for this technology using diffused bubble aeration and packed tower aeration were estimated to be $2.14 and $2.10 per 1000 gallons (3,785 liters), respectively, not including treatment of gas emissions (Kinner, et al, 1990).
154
The construction cost for a 130 gallon (492 liter) per minute, packed tower aeration system to treat radon contaminated municipal water wells in Sparta, New Jersey was approximately $300,000. The packed tower system included a 2.5 foot- (0.8 m-) diameter stainless steel tower filled with a 22-foot (6.7 m) column of packing and supplied with an air stream from a 450 cubic foot (12.7 m3) per minute blower (Civardi and DeWitt, 2004).
Commercial Availability
Aeration equipment for radon treatment of groundwater for single users or small systems is commonly used. Large aeration systems are commonly used in the treatment of organic volatile compounds. As such, a wide range of equipment and experienced vendors are available for application of aeration to radon.
Contact Information
General Contacts:
EPA National Risk Management Research Laboratory
Tom Sorg 26 West Martin Luther King Drive Cincinnati, OH 45268 (513) 569-7370 [email protected]
Vendors:
This is a partial listing of available vendors. Additional and updated vendor information can be obtained from the EPA Remediation and Characterization Technologies website: http://www.epareachit.org/, the EPA Cleanup Information website: http://clu-in.org, and by contacting the federal agency contact listed above.
Lowry Aeration Systems 146 South Street Blue Hill, ME (800) 434-9080 http://www.lowryh2o.com
U.S. Filter 181 Thorn Hill Road Warrendale, PA 15086 (800) 525-0658 http://www.usfilter.com/water/
Tonka Equipment Company P.O. Box 41126 Plymouth, MN 55441 (763) 559-2837 http://www.tonkawater.com
Severn Trent Services 580 Virginia Drive, Suite 300 Ft. Washington, PA19034 (215) 646-9201 http://www.severntrentservices.com
155
US Radon Systems 18 Annie Place Stamford, CT 06902 (203) 357-9114 http://www.usradonsystems.com
Aeration Technologies P.O. Box 488 North Andover, MA 01845 (978) 475-6385 http://www.aertec.com
Aeration References
Civardi, J. and DeWitt, C. “Township Project Tackles High Radon Levels.” WaterWorld, Volume 20, Issue 7, July 2004.
Kinner, N., Malley, J., Clement, J., Quern, P., Schell, G. Project Summary: Radon Removal Techniques for Small Community Public Water Supplies. Prepared for U.S. EPA, November, 1990. EPA/600/S2-90/036.
LaGrega, M., Buckingham, P., and Evans, J. Hazardous Waste Management, Second Edition. McGraw-Hill Inc., 2000.
Salonen, L, Turunen, H., Mehtonen, J., Mjönes, L., Hagberg, N., Wilken, R., Raff, O. Removal of Radon by Aeration: Testing of Various Aeration Techniques for Small Water Works. Radiation and Nuclear Safety Authority of Finland (STUK), Helsinki, 2002. Report No. STUK-A193.
Science Applications International Corporation. Technologies and Costs for the Removal of Radon From Drinking Water. Prepared for U.S. EPA, Office of Ground Water and Drinking Water, May 1999.
U.S. Environmental Protection Agency. Approaches for the Remediation of Federal Facility Sites Contaminated With Explosive or Radioactive Wastes, 1993. EPA/625/R-93/013.
U.S. Naval Facilities Engineering Command. Naval Facilities Engineering Service Center, Port Hueneme, Environmental Restoration & BRAC Website, Technology Pages: Air Stripping (Ex-Situ), 2004. http://enviro.nfesc.navy.mil/erb
USFilter. General Filter Aerators. Vendor brochure GF-AER-BR-0702, 2002. http://www.usfilter.com
3.3 BIOLOGICAL TREATMENT
Biological treatment of radioactively-contaminated groundwater, surface water, and wastewater involves removal of the contaminants via plant root systems in a hydroponic or wetlands setting, uptake by root systems and transpiration to the air (for tritium), or control of the groundwater plume through significant uptake of groundwater by plants. The use of plant systems for treatment of contaminated groundwater, surface water, and wastewater is called phytoremediation.
Biological treatment is typically implemented at low costs, however, the process requires more time to reach remediation goals. Bench-scale testing is required to determine the effectiveness of biological treatment in a given situation.
This section discusses phytoremediation and the subprocesses applicable for treatment of liquid media.
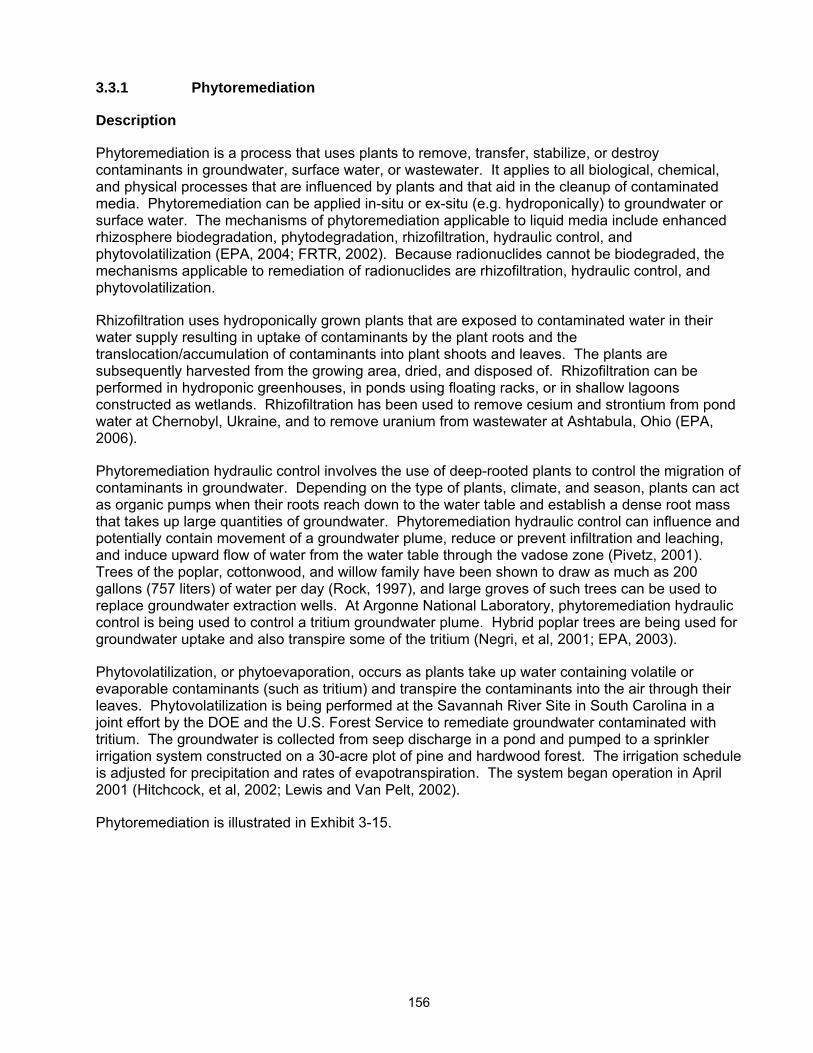
156
3.3.1 Phytoremediation
Description
Phytoremediation is a process that uses plants to remove, transfer, stabilize, or destroy contaminants in groundwater, surface water, or wastewater. It applies to all biological, chemical, and physical processes that are influenced by plants and that aid in the cleanup of contaminated media. Phytoremediation can be applied in-situ or ex-situ (e.g. hydroponically) to groundwater or surface water. The mechanisms of phytoremediation applicable to liquid media include enhanced rhizosphere biodegradation, phytodegradation, rhizofiltration, hydraulic control, and phytovolatilization (EPA, 2004; FRTR, 2002). Because radionuclides cannot be biodegraded, the mechanisms applicable to remediation of radionuclides are rhizofiltration, hydraulic control, and phytovolatilization.
Rhizofiltration uses hydroponically grown plants that are exposed to contaminated water in their water supply resulting in uptake of contaminants by the plant roots and the translocation/accumulation of contaminants into plant shoots and leaves. The plants are subsequently harvested from the growing area, dried, and disposed of. Rhizofiltration can be performed in hydroponic greenhouses, in ponds using floating racks, or in shallow lagoons constructed as wetlands. Rhizofiltration has been used to remove cesium and strontium from pond water at Chernobyl, Ukraine, and to remove uranium from wastewater at Ashtabula, Ohio (EPA, 2006).
Phytoremediation hydraulic control involves the use of deep-rooted plants to control the migration of contaminants in groundwater. Depending on the type of plants, climate, and season, plants can act as organic pumps when their roots reach down to the water table and establish a dense root mass that takes up large quantities of groundwater. Phytoremediation hydraulic control can influence and potentially contain movement of a groundwater plume, reduce or prevent infiltration and leaching, and induce upward flow of water from the water table through the vadose zone (Pivetz, 2001). Trees of the poplar, cottonwood, and willow family have been shown to draw as much as 200 gallons (757 liters) of water per day (Rock, 1997), and large groves of such trees can be used to replace groundwater extraction wells. At Argonne National Laboratory, phytoremediation hydraulic control is being used to control a tritium groundwater plume. Hybrid poplar trees are being used for groundwater uptake and also transpire some of the tritium (Negri, et al, 2001; EPA, 2003).
Phytovolatilization, or phytoevaporation, occurs as plants take up water containing volatile or evaporable contaminants (such as tritium) and transpire the contaminants into the air through their leaves. Phytovolatilization is being performed at the Savannah River Site in South Carolina in a joint effort by the DOE and the U.S. Forest Service to remediate groundwater contaminated with tritium. The groundwater is collected from seep discharge in a pond and pumped to a sprinkler irrigation system constructed on a 30-acre plot of pine and hardwood forest. The irrigation schedule is adjusted for precipitation and rates of evapotranspiration. The system began operation in April 2001 (Hitchcock, et al, 2002; Lewis and Van Pelt, 2002).
Phytoremediation is illustrated in Exhibit 3-15.
157
SoilContaminated
GroundwaterContaminated
HarvestBiomass
Phytovolatilization
Phytostabilization
Uptake
Uptake
Exhibit 3-15: Phytoremediation
Target Contaminants
Rhizofiltration has been shown in bench-scale testing to reduce water concentrations of europium (Dushenkov et al, 1997) and in field demonstrations to reduce water concentrations of cesium, strontium, and uranium (EPA, 2006). Hydraulic control of tritium-contaminated groundwater plumes by plant uptake has been demonstrated at Argonne National Laboratory (Negri, et al, 2001; EPA, 2003). Remediation of tritium-contaminated groundwater by phytovolatilization has been demonstrated at the Savannah River Site (Hitchcock, et al, 2002; Lewis and Van Pelt, 2002).
Applicable Site Characteristics
Unless being applied hydroponically as rhizofiltration to surface water, waste water, or pumped groundwater, phytoremediation is limited to shallow groundwater and requires a large surface area of land for implementation. For phytoremediation hydraulic control to be effective, the shallow groundwater should be unconfined and underlain by a confining unit that prevents vertical flow downward of the plume (Schnoor, 2002).
The growth of plants used in phytoremediation can be affected by climatic or seasonal conditions (FRTR, 2002). Phytoremediation might be limited to lower levels of contamination because of possible plant toxicity effects (NAVFAC, 2004). A need for rapid attainment of remediation goals at a site will likely eliminate phytoremediation from consideration as a potential remedial technology.
158
Waste Management Issues
Rhizofiltration will produce a harvested biomass residual waste that will have to be further treated and/or disposed of as radioactive waste. Harvested biomass is usually dried and sometimes incinerated to reduce volume.
Operating Characteristics
Exhibit 3-16 summarizes the operating characteristics of phytoremediation.
Exhibit 3-16: Operating Characteristics of Phytoremediation
Characteristic Description
Destruction and Removal Efficiencies At Chernobyl, rhizofiltration was shown to extract 95% of the cesium and strontium from a pond within 10 days. During a 9-month demonstration at the DOE’s Astabula, Ohio site, wastewater concentrations of as much as 450 ppb of uranium were reduced to 5 ppb or less (EPA, 2006; DOE, 1996).
Emissions: Gaseous and Particulate Rhizofiltration of mixed waste containing organics or volatile metals could result in some phytovolatilization of those contaminants into the air. Phytovolatilization can result in emissions of tritium to the air and requires monitoring. Monitoring of emissions of tritium from a phytovolatilization project at the Savannah River Site indicate that atmospheric levels of tritium are well below all applicable standards (Lewis and Van Pelt, 2002). For phytoremediation hydraulic control or phytovolatilization, dust emissions can occur during the preparation of soil for planting and might need control through spraying and wetting of soil surfaces.
Reliability Rhizofiltration has been demonstrated for removal of cesium and strontium at Chernobyl and for removal of uranium at DOE’s Astabula, Ohio site (EPA, 2006). Phytoremediation hydraulic control has been demonstrated at Argonne National Laboratory to control a tritium plume (Negri, et al, 2001; EPA, 2003). Phytovolatilization has been demonstrated at Savannah River Site for the remediation of tritium-contaminated groundwater (Hitchcock, et al, 2002; Lewis and Van Pelt, 2002).
Process Time The duration of phytoremediation can range from two to 20 years dependent on cleanup goals, volume of the liquids requiring treatment, contaminant concentrations and distribution, growth rate and characteristics of the remediation plantings, depth of contamination, and climate (NAVFAC, 2004).
Applicable Media Ground water and surface water.
Pretreatment/Site Requirements Bench-scale testing needs to be performed to select plant type and/or confirm performance. For phytoremediation hydraulic control and phytovolatilization, the plants should be selected so that root systems reach and grow directly into the groundwater table. Cylindrical liners can be used to cut off root access to shallow soil moisture and encourage root growth downward (Negri, et al, 2001).
159
Exhibit 3-16: Operating Characteristics of Phytoremediation
Characteristic Description
Installation and Operation Requirements
For rhizofiltration, plant nutrients in the water need to be monitored and adjusted. If a hydroponic system is being used, pumping equipment for feeding contaminated water into the system needs to be maintained. For phytoremediation hydraulic control and phytovolatilization, maintenance of the plantings is necessary, including possible spraying for insect pests, trapping or fencing for animal pests, control of weeds, and fertilization.
Post-Treatment Conditions For rhizofiltration, residual biomass from harvesting will need to be dried, incinerated (as necessary), and disposed of.
Ability to Monitor Effectiveness Radionuclide concentrations can be monitored in the contaminated water during and after treatment for rhizofiltration and phytovolatilization. Monitoring of harvested biomass from rhizofiltration can be performed to monitor and confirm rates of removal. Groundwater levels can be monitored to confirm plume containment from phytoremediation hydraulic control.
Performance Data
At Chernobyl, rhizofiltration was shown to extract 95 percent of the cesium and strontium from a small pond within 10 days. At the DOE’s Astabula, Ohio site, a 9-month demonstration was conducted with wastewater concentrations of as much as 450 ppb of uranium reduced by over 90 percent to five ppb or less (EPA, 2006; DOE, 1996).
Over a three-year period, phytovolatilization of tritium-contaminated groundwater at Argonne National Laboratory resulted in a reduction of the mean tritium concentration by 73% (EPA, 2003). Phytovolatilization of tritium-contaminated groundwater being performed at DOE’s Savannah River Site has resulted in the reduction of tritium in a stream by 84 percent (Lewis and Van Pelt, 2002).
Capital and Operating Costs
Capital costs for a phytoremediation system for groundwater, surface water, or waste water can typically include characterization of contaminated liquids, design and engineering, bench-scale testing, permit preparation and fees, regulatory interaction, soil preparation, and purchase and planting of selected species. For tank hydroponic systems, costs will also include purchase and set up of tanks, pumps, and racks to hold plants (instead of soil preparation). Pond hydroponic systems will require floating racks or construction of a wetlands area.
Operating and maintenance costs can typically include water for irrigation, fertilizer, maintenance labor, health and safety support, quality assurance support, sampling and analysis for process control, and harvesting (for rhizofiltration). For tank hydroponic systems, costs will also include system (tank, pump, and racks) maintenance and plant nutrients. If phytovolatilization of tritium is performed, air monitoring and sampling will be included.
Using trees for groundwater hydraulic control is estimated to cost approximately one-half the cost of traditional pump and treat systems (NAVFAC, 2004). Installation of the vegetation at a phytoremediation site typically ranges from $10,000 to $25,000 per acre (not including bench-scale testing, design, and site preparation) (Schnoor, 2002).
160
Cost estimates for rhizofiltration using sunflowers to remove cesium, strontium, or uranium from water range between $2 and $6 per 1,000 gallons (3,785 liters) (DOE, 1997).
Commercial Availability
Phytoremediation is being applied to many hazardous waste sites and a number of bioremediation companies offer phytoremediation as a remediation technology. Some of these vendors are listed in the following subsection.
Contact Information
General Contacts:
EPA National Risk Management Research Laboratory
Steven Rock 5995 Center Hill Avenue Cincinnati, OH 45224 (513) 569-7149 [email protected]
Vendors:
This is a partial listing of available vendors. Additional and updated vendor information can be obtained from the EPA Remediation and Characterization Technologies website: http://www.epareachit.org/, the EPA Cleanup Information website: http://clu-in.org, and by contacting the federal agency contact listed above.
Edenspace 15100 Enterprise Court Suite 100 Dulles, VA 20151 (703) 961-8700 http://www.edenspace.com
Applied Natural Sciences 4129 Tonya Trail Hamilton, OH 45011 (513) 895-6061 http://www.treemediation.com
Phytokinetics 1770 North Research Parkway Suite 110 North Logan, UT 84341 (435) 755-0891 http://www.phytokinetics.com
Ecolotree 3017 Valley View Lane North Liberty, IA 52317 (319) 665-3547 http://www.ecolotree.com
The Bioengineering Group 18 Commercial Street Salem, MA 01970 (978) 740-0096 http://www.bioengineering.com
161
Phytoremediation References
Dushenkov, S., Vasudev, D., Kapulnik, Y., Gleba, D., Fleisher, D., Ting, K., and Ensley, B. “Removal of Uranium From Water Using Terrestrial Plants.” Environmental Science and Technology, 1997. Vol. 31, No.12, pp. 3468 – 3474.
Federal Remediation Technologies Roundtable. Remediation Technologies Screening Matrix and Reference Guide, Version 4.0: Phytoremediation, 2002. http://www.frtr.gov/matrix2/section4/4-33.html
Hitchcock, D., Rebel, K., Barton, C., Seaman, J., Riha, S., and Blake, J. “Estimating Efficiencies of Tritium Phytoremediation at the Savannah River Site.” Proceeding of The Annual International Conference on Soils, Sediments, and Water, University of Massachusetts, October 22 – 24, 2002. Phytoremediation Poster Session. http://www.umasssoils.com/posters2002/phytoremediation.htm
Lewis, C. and Van Pelt, R. Natural Remediation at Savannah River Site. Prepared by Bechtel Savannah River Inc. for U.S. DOE, January, 2002. WSRC-MS-2002-00075.
NAVFAC (U.S. Naval Facilities Engineering Command). Naval Facilities Engineering Service Center, Port Hueneme, Environmental Restoration & BRAC Website, Technology Pages: Phytoremediation, 2004. http://enviro.nfesc.navy.mil/erb
Negri, M., Hinchman, R. Wozniak, J. “Capturing a ‘Mixed’ Contaminant Plume: Tritium Phytoevaporation at Argonne National Laboratory East”. Summary of the Phytoremediation State of the Science Conference, Boston, Mass., May 1-2, 2000, November 2001. EPA/625/R-01/011a.
Pivetz, B. Ground Water Issue: Phytoremediation of Contaminated Soil and Ground Water at Hazardous Waste Sites. Prepared for U.S. EPA, Office of Solid Waste and Emergency Response, February 2001. EPA/540/S-01/500.
Rock, S. “Introduction to Phytoremediation.” The Standard Handbook of Hazardous Waste Treatment and Disposal, Second Edition, 1997. H. Freeman, Editor. McGraw-Hill Inc.
Schnoor, J. Phytoremediation of Soil and Groundwater. Prepared for the Ground-Water Remediation Technologies Analysis Center, March 2002. Technology Evaluation Report TE-02-01.
U.S. Department of Energy. “Phytoremediation: Natural Attenuation That Really Works.” TIE Quarterly, Volume 6 (1), Spring 1997.
U.S. Department of Energy. Subsurface Contaminants Focus Area: Technology Summary, August 1996. DOE/EM-0296.
U.S. Environmental Protection Agency. Phytotech – Phytoextraction of Lead from Soil. EPA website, 2006. http://www.epa.gov/ORD/NRMRL/lrpcd/rr/phytlead.htm
U.S. Environmental Protection Agency. Treatment Technologies for Site Cleanup: Annual Status Report (Eleventh Edition), February 2004. EPA/542/R-03/009.
U.S. Environmental Protection Agency. Deployment of Phytotechnology in the 317/319 Area at Argonne National Laboratory-East: Innovative Technology Evaluation Report, December 2003. EPA/540/R-05/011.
162
3.4 NATURAL ATTENUATION
Natural attenuation relies on natural processes to clean up or attenuate radionuclides in groundwater. Natural attenuation occurs in the subsurface at most radioactively contaminated sites and includes such processes as dispersion, diffusion, sorption, precipitation, chelation/complexing, ion exchange, phytoremediation, evaporation (for tritium), and radioactive decay. Monitoring of these processes to confirm that natural attenuation is taking place is termed monitored natural attenuation.
In most cases, the source of the radioactive contamination is treated and/or removed before monitored natural attenuation is initiated. Detailed modeling studies are also typically performed to determine if this process will attain remedial goals in a reasonable amount of time.
3.4.1 Monitored Natural Attenuation
Description
Natural processes in the subsurface can reduce radionuclide contaminant concentrations over time to acceptable levels. Although radionuclides cannot be biodegraded, microbial action can transform the chemical state of the radioactive contaminants and modify their solubility and mobility (IAEA, 1999). Monitored natural attenuation involves allowing these processes to reduce radioactive levels while conducting long-term monitoring to confirm that the contaminant reduction is occurring at rates consistent with meeting cleanup objectives (FRTR, 2002).
Consideration of monitored natural attenuation usually requires modeling, evaluation of radionuclide reduction rates and pathways, and predicting radionuclide concentration at down gradient receptor points, especially when the plume is still expanding or migrating. The primary objective of site modeling is to demonstrate that natural processes of radionuclide reduction will reduce concentrations below remedial goals before potential exposure pathways are completed (FRTR, 2002).
Monitored natural attenuation has been selected as the groundwater remedy in various records of decision for radionuclide contaminated sites, including Idaho National Engineering Laboratory, Test Area North (strontium, cesium, tritium) (DOE, 2003); the Teledyne Wah Chang Superfund site in Oregon (radium) (EPA, 1997); the Hanford Site 300-Area (uranium, tritium) (EPA, 1996); the DOE’s Weldon Spring Site in Missouri (uranium) (EPA, 2004a); and the Savannah River Site (strontium) (EPA, 2004b). Most of these sites coupled monitored natural attenuation with institutional controls (land use restrictions and groundwater use restrictions) and with source treatment and/or removals.
There has been considerable controversy related to the application of monitored natural attenuation since its emergence as a potential remediation process for contaminated sites in the early 1990s. Careful consideration of the current regulatory policies and available technical guidance should be given before proceeding with application of this process at a radionuclide-contaminated site.
Monitored Natural Attenuation is illustrated in Exhibit 3-17.
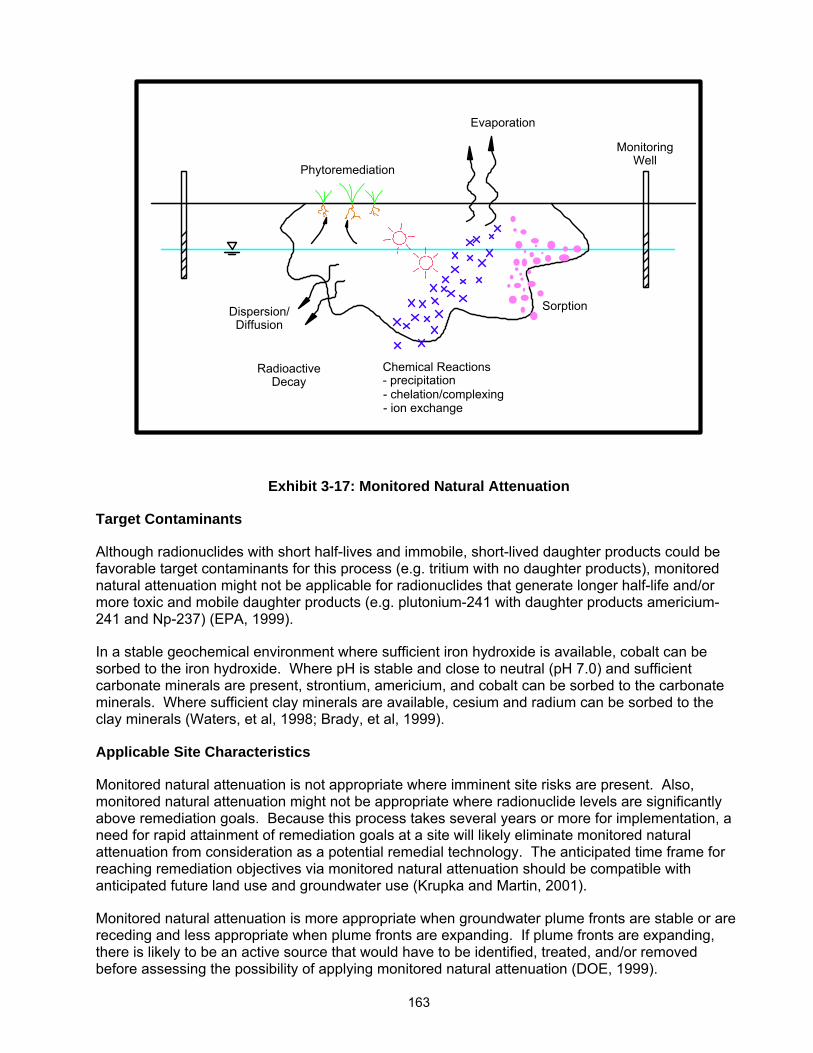
163
Phytoremediation����
Evaporation����
Sorption����
Well����
Monitoring����
Diffusion����
Dispersion/����
- precipitation����
Chemical Reactions����
Decay����
Radioactive����
- chelation/complexing����
- ion exchange����
Exhibit 3-17: Monitored Natural Attenuation
Target Contaminants
Although radionuclides with short half-lives and immobile, short-lived daughter products could be favorable target contaminants for this process (e.g. tritium with no daughter products), monitored natural attenuation might not be applicable for radionuclides that generate longer half-life and/or more toxic and mobile daughter products (e.g. plutonium-241 with daughter products americium-241 and Np-237) (EPA, 1999).
In a stable geochemical environment where sufficient iron hydroxide is available, cobalt can be sorbed to the iron hydroxide. Where pH is stable and close to neutral (pH 7.0) and sufficient carbonate minerals are present, strontium, americium, and cobalt can be sorbed to the carbonate minerals. Where sufficient clay minerals are available, cesium and radium can be sorbed to the clay minerals (Waters, et al, 1998; Brady, et al, 1999).
Applicable Site Characteristics
Monitored natural attenuation is not appropriate where imminent site risks are present. Also, monitored natural attenuation might not be appropriate where radionuclide levels are significantly above remediation goals. Because this process takes several years or more for implementation, a need for rapid attainment of remediation goals at a site will likely eliminate monitored natural attenuation from consideration as a potential remedial technology. The anticipated time frame for reaching remediation objectives via monitored natural attenuation should be compatible with anticipated future land use and groundwater use (Krupka and Martin, 2001).
Monitored natural attenuation is more appropriate when groundwater plume fronts are stable or are receding and less appropriate when plume fronts are expanding. If plume fronts are expanding, there is likely to be an active source that would have to be identified, treated, and/or removed before assessing the possibility of applying monitored natural attenuation (DOE, 1999).
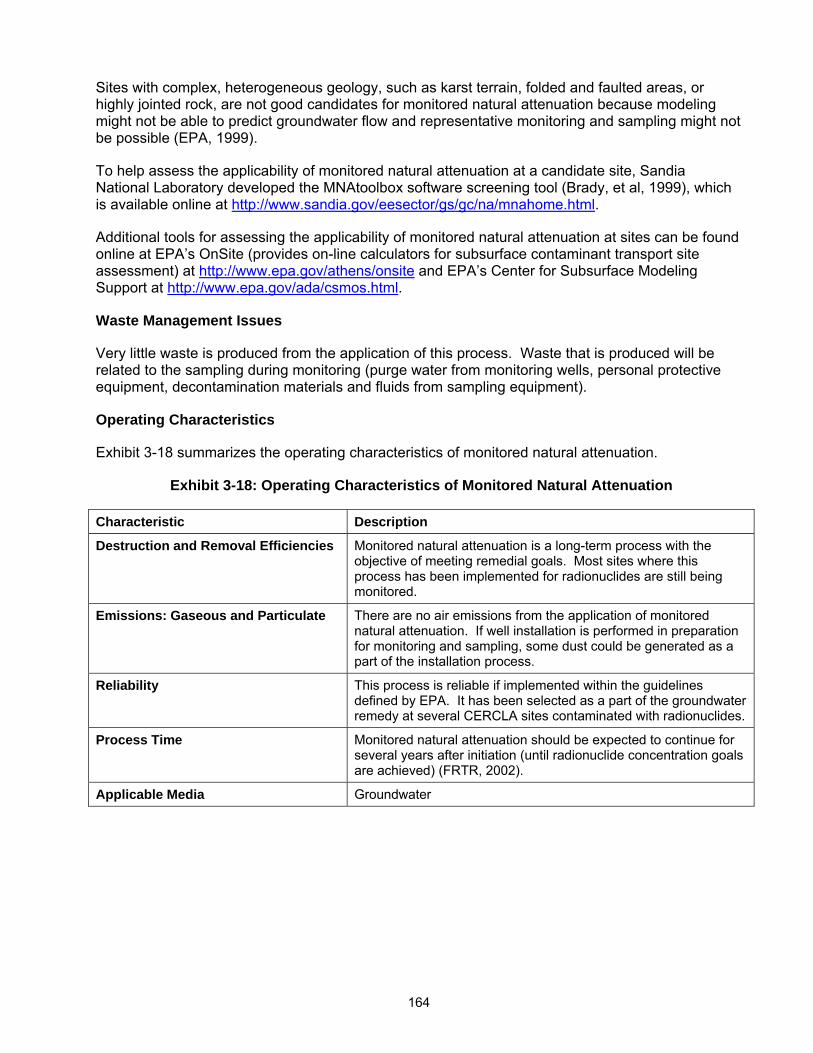
164
Sites with complex, heterogeneous geology, such as karst terrain, folded and faulted areas, or highly jointed rock, are not good candidates for monitored natural attenuation because modeling might not be able to predict groundwater flow and representative monitoring and sampling might not be possible (EPA, 1999).
To help assess the applicability of monitored natural attenuation at a candidate site, Sandia National Laboratory developed the MNAtoolbox software screening tool (Brady, et al, 1999), which is available online at http://www.sandia.gov/eesector/gs/gc/na/mnahome.html.
Additional tools for assessing the applicability of monitored natural attenuation at sites can be found online at EPA’s OnSite (provides on-line calculators for subsurface contaminant transport site assessment) at http://www.epa.gov/athens/onsite and EPA’s Center for Subsurface Modeling Support at http://www.epa.gov/ada/csmos.html.
Waste Management Issues
Very little waste is produced from the application of this process. Waste that is produced will be related to the sampling during monitoring (purge water from monitoring wells, personal protective equipment, decontamination materials and fluids from sampling equipment).
Operating Characteristics
Exhibit 3-18 summarizes the operating characteristics of monitored natural attenuation.
Exhibit 3-18: Operating Characteristics of Monitored Natural Attenuation
Characteristic Description
Destruction and Removal Efficiencies Monitored natural attenuation is a long-term process with the objective of meeting remedial goals. Most sites where this process has been implemented for radionuclides are still being monitored.
Emissions: Gaseous and Particulate There are no air emissions from the application of monitored natural attenuation. If well installation is performed in preparation for monitoring and sampling, some dust could be generated as a part of the installation process.
Reliability This process is reliable if implemented within the guidelines defined by EPA. It has been selected as a part of the groundwater remedy at several CERCLA sites contaminated with radionuclides.
Process Time Monitored natural attenuation should be expected to continue for several years after initiation (until radionuclide concentration goals are achieved) (FRTR, 2002).
Applicable Media Groundwater
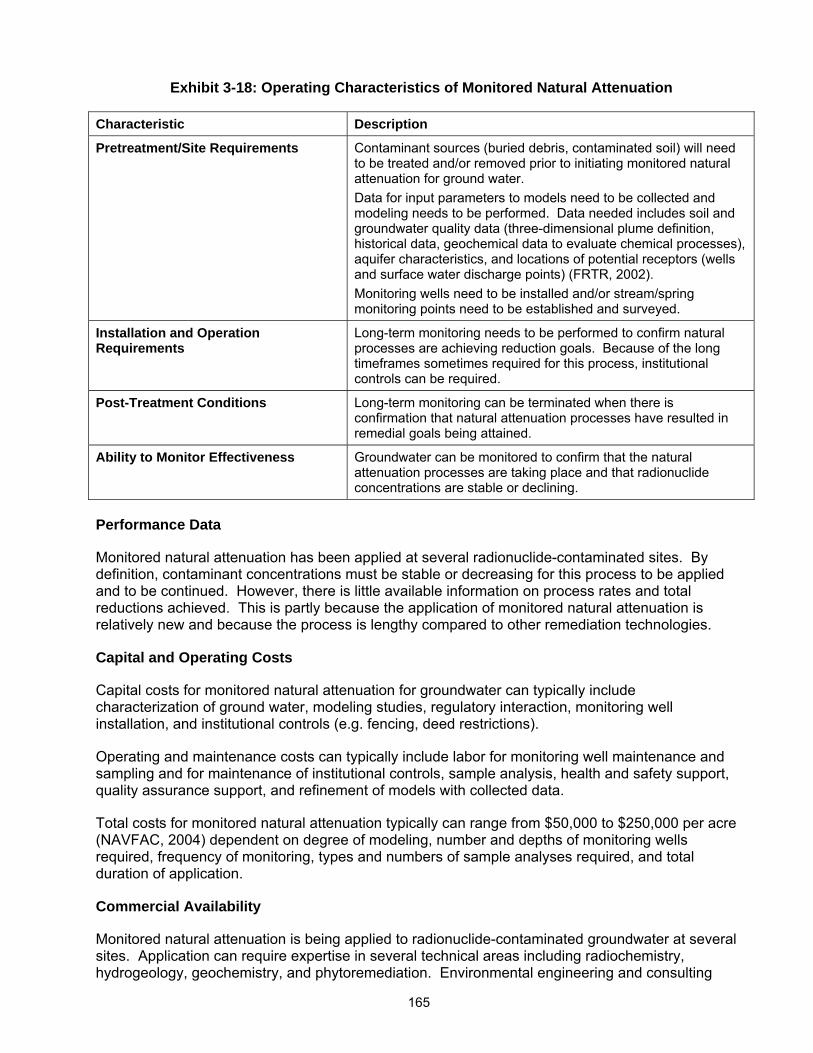
165
Exhibit 3-18: Operating Characteristics of Monitored Natural Attenuation
Characteristic Description
Pretreatment/Site Requirements Contaminant sources (buried debris, contaminated soil) will need to be treated and/or removed prior to initiating monitored natural attenuation for ground water. Data for input parameters to models need to be collected and modeling needs to be performed. Data needed includes soil and groundwater quality data (three-dimensional plume definition, historical data, geochemical data to evaluate chemical processes), aquifer characteristics, and locations of potential receptors (wells and surface water discharge points) (FRTR, 2002). Monitoring wells need to be installed and/or stream/spring monitoring points need to be established and surveyed.
Installation and Operation Requirements
Long-term monitoring needs to be performed to confirm natural processes are achieving reduction goals. Because of the long timeframes sometimes required for this process, institutional controls can be required.
Post-Treatment Conditions Long-term monitoring can be terminated when there is confirmation that natural attenuation processes have resulted in remedial goals being attained.
Ability to Monitor Effectiveness Groundwater can be monitored to confirm that the natural attenuation processes are taking place and that radionuclide concentrations are stable or declining.
Performance Data
Monitored natural attenuation has been applied at several radionuclide-contaminated sites. By definition, contaminant concentrations must be stable or decreasing for this process to be applied and to be continued. However, there is little available information on process rates and total reductions achieved. This is partly because the application of monitored natural attenuation is relatively new and because the process is lengthy compared to other remediation technologies.
Capital and Operating Costs
Capital costs for monitored natural attenuation for groundwater can typically include characterization of ground water, modeling studies, regulatory interaction, monitoring well installation, and institutional controls (e.g. fencing, deed restrictions).
Operating and maintenance costs can typically include labor for monitoring well maintenance and sampling and for maintenance of institutional controls, sample analysis, health and safety support, quality assurance support, and refinement of models with collected data.
Total costs for monitored natural attenuation typically can range from $50,000 to $250,000 per acre (NAVFAC, 2004) dependent on degree of modeling, number and depths of monitoring wells required, frequency of monitoring, types and numbers of sample analyses required, and total duration of application.
Commercial Availability
Monitored natural attenuation is being applied to radionuclide-contaminated groundwater at several sites. Application can require expertise in several technical areas including radiochemistry, hydrogeology, geochemistry, and phytoremediation. Environmental engineering and consulting
166
firms with experience in supporting Superfund investigations and experience in the remediation of radioactively contaminated sites would be able to support the application of monitored natural attenuation.
Contact Information
General Contacts:
U.S. EPA Ron Wilhelm 1200 Pennsylvania Avenue, N.W. Washington, DC 20460 (202) 343-9379 [email protected]
Monitored Natural Attenuation References
Brady, P., Spalding, B., Krupka, K., Waters, R., Zhang, P., Borns, D., and Brady, W. Site Screening and Technical Guidance for Monitored Natural Attenuation at DOE Sites. Prepared for the U.S. DOE by Sandia National Laboratories, March, 1999. Sandia Report SAND99-0464.
Federal Remediation Technologies Roundtable. Remediation Technologies Screening Matrix and Reference Guide, Version 4.0: Monitored Natural Attenuation, 2002. http://www.frtr.gov/matrix2/section4/4-32.html
International Atomic Energy Agency. Technologies for Remediation of Radioactively Contaminated Sites, 1999. IAEA-TECDOC-1086.
Krupka, K. and Martin, W. Subsurface Contaminant Focus Area: Monitored Natural Attenuation (MNA) – Programmatic, Technical, and Regulatory Issues. Prepared for U.S. DOE by Pacific Northwest National Laboratory, July 2001. PNNL-13569.
U.S. Department of Energy. Monitored Natural Attenuation Operations, Monitoring, and Maintenance Plan for Test Area North, Operable Unit 1-07B. U.S. DOE Idaho Operations Office, June 2003. DOE/ID-11066, Rev. 0.
U.S. Department of Energy. Decision-Making Framework Guide for the Evaluation and Selection of Monitored Natural Attenuation Remedies at Department of Energy Sites. Office of Environmental Restoration, May 13, 1999. http://web.em.doe.gov/framework/frame.pdf
U.S. Environmental Protection Agency. EPA Superfund Record of Decision: Weldon Spring Quarry/Plant/Pits (USDOE/Army), EPA ID: MO3210090004, OU 6, St. Charles County, Mo., 02/20/2004, 2004a. EPA/ROD/R07-04/036.
U.S. Environmental Protection Agency. EPA Superfund Record of Decision: Savannah River Site (USDOE), EPA ID: SC1890008989, OU 12, Aiken, S.C., 03/10/2004, 2004b. EPA/ROD/R04-04/007.
U.S. Environmental Protection Agency. Use of Monitored Natural Attenuation at Superfund, RCRA Corrective Action, and Underground Storage Tank Sites. Office of Solid Waste and Emergency Response, April 1999. OSWER Directive 9200.4-17P. http://www.eh.doe.gov/oepa/guidance/rcra/mna-memo2.pdf
167
U.S. Environmental Protection Agency. EPA Superfund Explanation of Significant Differences: Teledyne Wah Chang, EPA ID: ORD050955848, OU 01, Albany, Ore., 10/08/1996, 1997. EPA/ESD/R10-97/082.
U.S. Environmental Protection Agency. EPA Superfund Record of Decision: Hanford 300-Area (USDOE), EPA ID: WA2890090077, OU 01, 02, Benton County, Wash., 07/17/1996, 1996. EPA/ROD/R10-96/143.
U.S. Naval Facilities Engineering Command. Naval Facilities Engineering Service Center, Port Hueneme, Environmental Restoration & BRAC Website, Technology Pages: Natural Attenuation (Intrinsic Bioremediation), 2004. http://enviro.nfesc.navy.mil/erb
Waters, R., Brady, P., and Borns, D. “Natural Attenuation of Metals and Radionuclides – An Overview of the Sandia/DOE Approach.” Presented at: Waste Management 1998 Conference, March 1 - 5, 1998, Tucson, Ariz.
168
THIS PAGE INTENTIONALLY LEFT BLANK
169
4.0 EMERGING TECHNOLOGIES
This section provides a brief discussion of several emerging technologies for remediation of radionuclide-contaminated media. Most of these technologies have been bench-tested for treatment of radionuclides, and some have been tested at the pilot scale or demonstrated for other types of contaminants. The emerging technologies presented include: electrokinetics, supercritical fluid extraction, magnetic separation, bacterial reduction, and in-situ gaseous reduction.
4.1 ELECTROKINETICS
Description
Electrokinetic remediation is an in-situ extraction process that can separate and extract radionuclides from saturated or unsaturated soils, sludges, and sediments. It is performed by applying a low voltage direct current across electrode pairs that have been implanted in the ground on each side of the contaminated soil mass. This current mobilizes ions and charged compounds to move towards the electrodes. Cations, or negatively charged contaminants such as metal ions, move towards the cathode, while positively-charged anions move towards the anode. This transport mechanism is called electromigration (FRTR, 2002).
Extraction of metals from soil is also enhanced by an acidic condition that develops around the anode and by movement of the pore fluid in response to the electric potential difference (a transport mechanism called electroosmosis) (EPA, 1993). Contaminants can be removed after concentrating at the electrodes or treated by placing a treatment zone (such as a permeable reactive barrier) between the electrodes and periodically reversing the polarity to repeatedly cycle the contaminants through the treatment zone (FRTR, 2002).
Because of the negative surface charge of clay particles, electrokinetics is most applicable in low permeability soils. The effectiveness, however, is reduced in moisture contents less than 10 percent and where there is interference to electrical conductivity, such as buried metallic or insulating materials (FRTR, 2002).
Status of Development
There have been a limited number of commercial applications of electrokinetic remediation in the United States, and treatment of radionuclides in soils has been limited to bench-scale and pilot-scale studies. There is reported commercial application to remove uranium from soil in Europe (NAVFAC, 2004).
Bench-scale testing of the removal of uranium from soils using electrokinetics has been performed at Sandia National Laboratory (Booher, et al, 1997) and in the private sector by Electrokinetics Inc. (EPA, 1995). Using soils contaminated with up to 4,000 mg/kg of uranium, the testing by Electrokinetics Inc. resulted in removals ranging from 75 percent to 95 percent. Removals of radium and thorium using this process were much less successful because of formation of insoluble precipitates in the soil (EPA, 1995).
Pilot-scale testing using electrokinetics to remove uranium from soils has been performed at Oak Ridge National Laboratory (DOE, 1996). Removal of thorium from concrete building floors was demonstrated at the DOE Mound Facility in Miamisburg, Ohio (Lomasney, et al, 1996).
Electrokinetics is commercially available from a few vendors in the United States, although none have conducted full-scale demonstrations of radionuclide removal. Some of these vendors are currently listed on the EPA Remediation and Characterization Technologies website: http://www.epareachit.org/.
170
Electrokinetics References
Booher, W., Lindgren, E. and Brady, P. Electrokinetic Removal of Uranium from Contaminated, Unsaturated Soils. Prepared by Sandia National Laboratories for U.S. DOE, January 1997. Sandia Report SAND97-0122.
Federal Remediation Technologies Roundtable. Remediation Technologies Screening Matrix and Reference Guide, Version 4.0: Electrokinetic Separation, 2002. http://www.frtr.gov/matrix2/section4/4-4.html
Lomasney, H., SenGupta, A., and Yachmenev, V. Electrokinetic Decontamination of Concrete. Prepared for U.S. DOE, Morgantown Energy Technology Center by Isotron Corporation, 1996. DOE Paper Number DOE/MC/30162-97/C0804.
NAVFAC (U.S. Naval Facilities Engineering Command). Naval Facilities Engineering Service Center, Port Hueneme, Environmental Restoration & BRAC Website, Technology Pages: Electrokinetic Extraction, 2004. http://enviro.nfesc.navy.mil/erb
U.S. Department of Energy. Subsurface Contaminants Focus Area: Technology Summary, August 1996. DOE/EM-0296.
U.S. Environmental Protection Agency. Superfund Innovative Technology Evaluation (SITE) Emerging Technology Bulletin: Electrokinetic Soil Processing, Electrokinetics Inc., March 1995. EPA/540/F-95/504.
U.S. Environmental Protection Agency. Approaches for the Remediation of Federal Facility Sites Contaminated With Explosive or Radioactive Wastes, 1993. EPA/625/R-93/013.
4.2 SUPERCRITICAL FLUID EXTRACTION
Description
A supercritical fluid is formed when an element reaches its critical point, which is defined as the temperature and pressure at which the liquid and gaseous phases merge. Phase-change properties, such as heat of vaporization, cease to have a meaning in the supercritical region. Because the material in the supercritical region exhibits some of the characteristics of both liquids and gases, it is often referred to as a fluid (EPA, 1997).
Supercritical fluids are good solvents because they have high material densities with a high capacity for solutes combined with larger diffusivities than normal fluids but with viscosities as low as those of gases. These properties allow supercritical fluids to quickly permeate a matrix (such as a soil), dissolve an organic compound, and transfer out of the matrix quickly with little pumping. By lowering the pressure and temperature in an expansion vessel, the dissolved organics separate out of solution (Hendrickson, et al, 1995).
Carbon dioxide becomes a supercritical fluid above 90oF and 1,080 psi (DOE, 1996).
Supercritical carbon dioxide has been a preferred supercritical fluid for extraction purposes because it is noncombustible and nontoxic and has broad changes in properties with relatively small changes in pressure and temperature. DOE has examined the possibility of using supercritical carbon dioxide as a treatment for organic mixed waste to remove the organics so that the residuals can be disposed of as radioactive waste (Hendrickson, et al, 1995).
171
More recently, DOE also has examined supercritical carbon dioxide as a means of treating radionuclide-contaminated liquids and solids. By dissolving a metal complexing agent (chelating agent) in the supercritical fluid carbon dioxide, an augmented solvent is formed that is capable of extracting radionuclides from liquid or solid matrices. The resulting organometallic complex remains soluble in the supercritical carbon dioxide and is swept out of the matrix with the continued flow of the supercritical fluid (Fox and Mincher, 2002).
With the right type of complexing agents, supercritical carbon dioxide should be capable of extracting cesium, strontium, uranium, and plutonium from contaminated liquids and solids (Wai, 2003).
Status of Development
Bench-scale testing of the removal of plutonium and americium from soils using this technology has been performed at Idaho National Engineering and Environmental Laboratory (Fox and Mincher, 2002). This technology is not available commercially.
Super Critical Fluid Extraction References
Fox, R. and Mincher, B. Supercritical Fluid Extraction of Plutonium and Americium from Soil. Prepared by Idaho National Engineering and Environmental Laboratory. Presented at Spectrum 2002, August 4 – 8, 2002. INEL/CON-02-00725.
Hendrickson, D., Biyani, R., Brown, C., and Teter, W. Hanford/Rocky Flats Collaboration on Development of Supercritical Carbon Dioxide Extraction to Treat Mixed Waste. Prepared by Westinghouse Hanford Company for U.S. DOE, November 1995. WHC-EP-0892.
U.S. Department of Energy. Mixed Waste Characterization, Treatment & Disposal Focus Area: Technology Summary, August 1996. DOE/EM-0293.
U.S. Environmental Protection Agency. Innovative Site Remediation Technology, Design & Application, Volume 2: Chemical Treatment, 1997. EPA/542/B-97/005.
Wai, C. “Supercritical Fluid Extraction of Radionuclides – A Green Technology for Nuclear Waste Management.” Presented at the DOE Environmental Management Science Program Symposium on Nuclear Waste Management. Session: Separations Chemistry and Technology, Paper No. 86. 226th American Chemical Society National Meeting, September 2003.
4.3 MAGNETIC SEPARATION
Description
Magnetic separation is a physical separation process that segregates materials on the basis of magnetic susceptibility. All elements and compounds exhibit one of three magnetic properties: ferromagnetic (such as iron attraction to an ordinary magnet), paramagnetic (slightly magnetic with greater response to higher magnetic fields), or diamagnetic (non-magnetic). Uranium and plutonium compounds are paramagnetic.
The most straightforward magnetic separation process uses a strong magnetic field to separate ferromagnetic and paramagnetic materials from a contaminated fluid or slurry. Within the magnetic field, a magnetic matrix material such as steel wool extracts the magnetic and slightly magnetic contamination particles as the slurry passes (FRTR, 2002).
172
A second magnetic separation process combines chemical adsorption with magnetism to achieve separation of radionuclides from groundwater or wastewater. This proprietary process (Selentec MAG*SEPSM technology) first mixes the contaminated water with iron particles (magnetite) coated with ion exchange resins or zeolites. After mixing, the radionuclides are adsorbed onto the coated particles. The mixture then passes through a magnetic separator where the magnetic particles with the adsorbed radionuclides are separated from the water (EPA, 2003).
Status of Development
Bench-scale testing of magnetic separation using high-strength magnetic fields has been performed at Los Alamos National Laboratory on uranium- and plutonium-contaminated soils with removals of 6 to 58 percent and 83 to 84 percent, respectively. However, the magnetic separator also caught significant amounts of the soil mass, which ranged from 3 to 14 percent for the uranium separation and 24 to 32 percent for the plutonium separation (Schake, et al, 1994). Additional bench-scale testing of this process on plutonium-contaminated soils (slurried) from the Nevada Test Site achieved mass reductions of 45 to 75 percent. A dry process was also tested that was not successful in separating the plutonium from the soil (Papelis, et al, 1996).
The MAG*SEPSM combined adsorption/magnetic separation technology was accepted into the EPA SITE Program in 1996 and a demonstration of the technology to remove heavy metal concentrations from coal pile runoff water was completed at the Savannah River Site. A demonstration is planned at the Savannah River Site for removal of cesium. It is also reported that this technology is being used commercially at a dairy in the Ukraine (near Chernobyl) to remove radioactive cesium from contaminated milk (EPA, 2003).
Both the high strength magnetic field separation and the MAG*SEPSM processes are available commercially but have not been demonstrated for radionuclide removal in either pilot-scale or full-scale demonstrations. Preliminary cost estimates for this technology range from $60 to $6000 per ton (including any waste preprocessing and excluding excavation, permitting, and disposal) (S.G. Frantz Co., 2004).
Magnetic Separation References
Federal Remediation Technologies Roundtable. Remediation Technologies Screening Matrix and Reference Guide, Version 4.0: Separation, 2002. http://www.frtr.gov/matrix2/section4/4-18.html
Papelis, C., Jacobson, R., Miller, F., and Shaulis, L. Evaluation of Technologies for Volume Reduction of Plutonium-Contaminated Soils from the Nevada Test Site. Prepared by the Desert Research Institute, University of Nevada for U.S. DOE, June 1996. DOE/NV/10845-57.
Schake, A., Avens, L., Hill, D., Padilla, D., Prenger, F., Romero, D., Tolt, T., and Worl, L. Magnetic Separation for Environmental Remediation. Prepared by Los Alamos National Laboratory for U.S. DOE, 1994. LA-UR-94-3373.
S.G. Frantz Company Inc. Separation of Particles at a Magnetic Barrier – Magnetic Separation. Vendor information/technology overview on EPA REACHIT website, 2004. http://epareachit.org.
U.S. Environmental Protection Agency. “Selentec Environmental Technologies Inc. (Selentec MAG*SEPSM Technology).” Technology Profiles, Eleventh Edition, Volume 1, Demonstration Program. Office of Research and Development, September 2003. EPA/540/R-03/501.
173
4.4 BACTERIAL REDUCTION
Description
Bioremediation using microorganisms to degrade organic compounds in soil and groundwater has been a widely used and successful remediation technique. Bacteria use the organics as food and oxidize them in the process (FRTR, 2002). In bacterial reduction, the reduction side of the oxidation-reduction reaction is used. In this process, indigenous or introduced bacteria use an electron donor (a food source such as organic matter, sulfides, or ferrous iron) during the process of respiration and transfer electrons to an electron acceptor (such as a radionuclide), resulting in a lower valence or oxidation state. The result for some radionuclides is that they precipitate out of solution in a more stable, less soluble form (DOE, 2003).
In the case of uranium, soluble U(VI) can be bacterially reduced to insoluble U(IV) (Francis, 1998; Lloyd and Lovley, 2001; Anderson, et al, 2003). Technetium can be bacterially reduced from soluble Tc(VII) to less soluble Tc(IV) (Lloyd et al, 2000; Barkay and Schaefer, 2001; Lloyd and Lovley, 2001).
Status of Development
Bench-scale testing of the bacterial reduction and precipitation of uranium has been performed at Brookhaven National Laboratory (Francis, 1998) and Sandia National Laboratory (Abdelouas, et al, 2000). A pilot study was performed in the field at a former uranium ore processing facility in Rifle, Colo. (a DOE UMTRA site) over a 50-day period during which initial concentrations of 0.4 to 1.4 µM of soluble U(VI) dropped 70 percent (Anderson, et al, 2003).
Bench-scale testing of the bacterial reduction and precipitation of technetium has been performed at the University of Massachusetts (Lloyd et al, 2000).
The U.S. Department of Energy has established a research program for the development of bioremediation technology that can be used to remediate radionuclides and metals. Information on this program, the Natural and Accelerated Bioremediation Research Program, can be accessed at http://www.lbl.gov/NABIR.
This technology is currently not available commercially.
Bacterial Reduction References
Abdelouas, A., Lutze, W., Gong, W., Nuttall, E., Strietelmeier, B., and Travis, B. “Biological Reduction of Uranium in Groundwater and Subsurface Soil.” The Science of the Total Environment, April 2000. Vol. 250, Iss. 1-3, pp 21 – 35.
Anderson, R., Vrionis, H., Ortiz-Bernad, I., Resch, C., Long, P., Dayvault, R., Karp, K., Marutzky, S., Metzler, D., Peacock, A., White, D., Lowe, M., and Lovley, D. “Stimulating the In-situ Activity of Geobacter Species to Remove Uranium from the Groundwater of a Uranium-Contaminated Aquifer.” Applied and Environmental Microbiology, October 2003. Vol. 69, No. 10, pp. 5884 – 5891.
Barkay, T. and Schaefer, J. “Metal and Radionuclide Bioremediation: Issues, Considerations and Potentials.” Current Opinion in Microbiology, 2001. Vol. 4, pp. 318 – 323.
Federal Remediation Technologies Roundtable. Remediation Technologies Screening Matrix and Reference Guide, Version 4.0: In-situ Biological Treatment, 2002. http://www.frtr.gov/matrix2/section4/4-31.html
174
Francis, A. Bioremediation of Uranium Contaminated Soils and Wastes. Prepared by Brookhaven National Laboratory for U.S. DOE, September 17, 1998. BNL – 65782.
Lloyd, J., Sole, V., Van Praagh, C., and Lovley, D. “Direct and Fe(II)-mediated Reduction of Technetium by Fe(III)-reducing Bacteria.” Applied and Environmental Microbiology, September 2000. Vol. 66, No. 9, pp. 3743 – 3749.
Lloyd, J. and Lovley, D. “Microbial Detoxification of Metals and Radionuclides.” Current Opinion in Biotechnology, 2001. Vol. 12, pp. 248 – 253.
U.S. Department of Energy. Bioremediation of Metals and Radionuclides - What It Is and How It Works. Second Edition. Prepared by Lawrence Berkeley National Laboratory for U.S. DOE, Office of Biological and Environmental Research, Natural and Accelerated Bioremediation Research Program, 2003. LBNL-42595 (2003).
4.5 IN-SITU GASEOUS REDUCTION
Description
In-situ gaseous reduction involves the immobilization of redox-sensitive radionuclides like uranium in unsaturated soils by injecting a low concentration of reactive gas such as hydrogen sulfide or sulfur dioxide gas diluted in inert gases. Upon contact, the gas reduces the oxidation state of the radionuclide, resulting in a less mobile form. The gas mixture is injected into a central well, and gases are extracted by applying a vacuum in wells located at the plume boundary. The breakthrough of H2S at the extraction wells is monitored over time to provide a basis for assessing treatment progress (DOE, 2000).
Status of Development
A field demonstration of this technology for the treatment of hexavalent chromium was performed at White Sands Missile Range in New Mexico by the DOE’s Pacific Northwest National Laboratory with 70 percent of the Cr(VI) being reduced to Cr(III). Results indicated that the injected gases followed preferential pathways in more permeable sands and bypassed less permeable layers where chromium was not reduced (DOE, 2000).
Bench-scale testing of the reduction of uranium in soil using hydrogen sulfide gas has been performed at DOE’s Hanford Site. This test achieved immobilization of approximately 50 percent of the uranium using mixtures containing as little as 100 ppm of hydrogen sulfide in nitrogen (DOE, 1995).
The University of Missouri has performed bench-scale testing of the reduction of technetium in soil using hydrogen sulfide gas on Hanford Site soil samples. This test achieved immobilization of about 51 percent of the technetium (Deng, et al, 2004).
In-situ Gaseous Reduction References
Deng, B., Thornton, E., Cantrell, K., Olsen, K., and Amonette, J. Interfacial Reduction-Oxidation Mechanisms Governing Fate and Transport of Contaminants in the Vadose Zone. Prepared by the University of Missouri-Columbia and Pacific Northwest National Laboratory for the U.S. DOE. January 2004. DOE/ER/15011.
U.S. Department of Energy. Innovative Technology Summary Report: In-situ Gaseous Reduction System. Subsurface Contaminants Focus Area, April 2000. DOE/EM-0521.

175
U.S. Department of Energy. Contaminant Plumes Containment and Remediation Focus Area, Technology Summary, June 1995. Office of Environmental Management. DOE/EM-0248.

176
THIS PAGE INTENTIONALLY LEFT BLANK
APPENDIX A
NPL SITES AND RADIONUCLIDES DETECTED

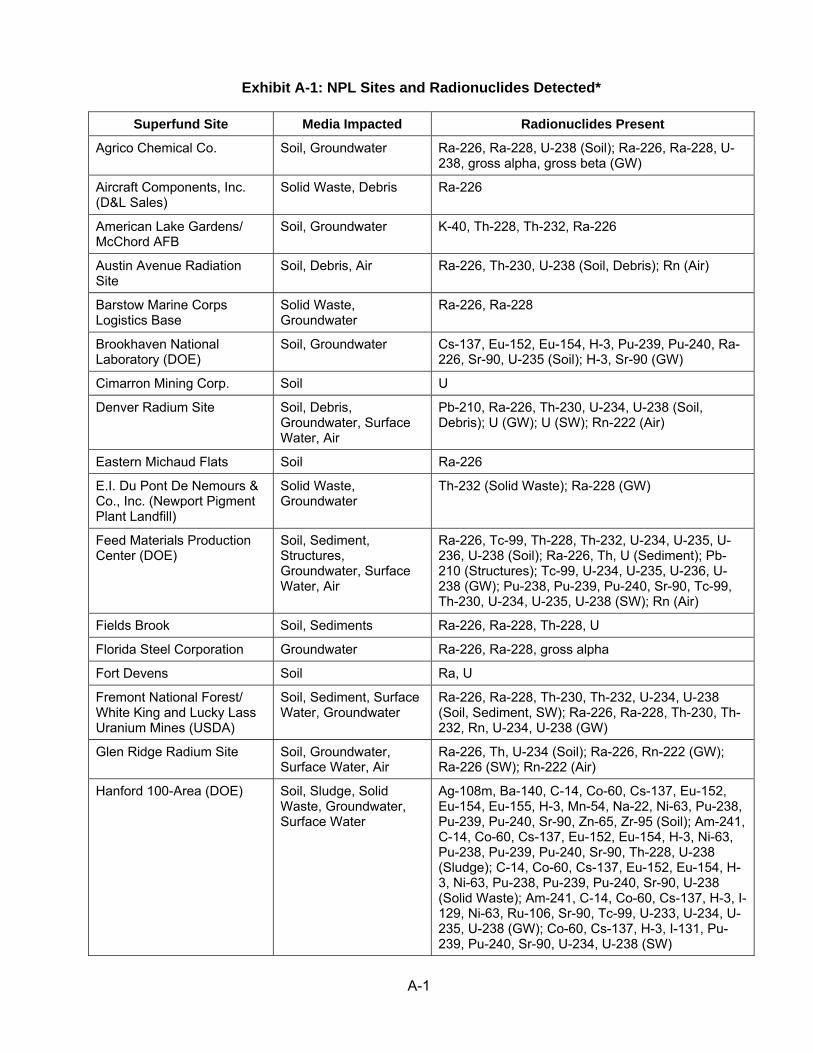
A-1
Exhibit A-1: NPL Sites and Radionuclides Detected*
Superfund Site Media Impacted Radionuclides Present
Agrico Chemical Co. Soil, Groundwater Ra-226, Ra-228, U-238 (Soil); Ra-226, Ra-228, U-238, gross alpha, gross beta (GW)
Aircraft Components, Inc. (D&L Sales)
Solid Waste, Debris Ra-226
American Lake Gardens/ McChord AFB
Soil, Groundwater K-40, Th-228, Th-232, Ra-226
Austin Avenue Radiation Site
Soil, Debris, Air Ra-226, Th-230, U-238 (Soil, Debris); Rn (Air)
Barstow Marine Corps Logistics Base
Solid Waste, Groundwater
Ra-226, Ra-228
Brookhaven National Laboratory (DOE)
Soil, Groundwater Cs-137, Eu-152, Eu-154, H-3, Pu-239, Pu-240, Ra-226, Sr-90, U-235 (Soil); H-3, Sr-90 (GW)
Cimarron Mining Corp. Soil U
Denver Radium Site Soil, Debris, Groundwater, Surface Water, Air
Pb-210, Ra-226, Th-230, U-234, U-238 (Soil, Debris); U (GW); U (SW); Rn-222 (Air)
Eastern Michaud Flats Soil Ra-226
E.I. Du Pont De Nemours & Co., Inc. (Newport Pigment Plant Landfill)
Solid Waste, Groundwater
Th-232 (Solid Waste); Ra-228 (GW)
Feed Materials Production Center (DOE)
Soil, Sediment, Structures, Groundwater, Surface Water, Air
Ra-226, Tc-99, Th-228, Th-232, U-234, U-235, U-236, U-238 (Soil); Ra-226, Th, U (Sediment); Pb-210 (Structures); Tc-99, U-234, U-235, U-236, U-238 (GW); Pu-238, Pu-239, Pu-240, Sr-90, Tc-99, Th-230, U-234, U-235, U-238 (SW); Rn (Air)
Fields Brook Soil, Sediments Ra-226, Ra-228, Th-228, U
Florida Steel Corporation Groundwater Ra-226, Ra-228, gross alpha
Fort Devens Soil Ra, U
Fremont National Forest/ White King and Lucky Lass Uranium Mines (USDA)
Soil, Sediment, Surface Water, Groundwater
Ra-226, Ra-228, Th-230, Th-232, U-234, U-238 (Soil, Sediment, SW); Ra-226, Ra-228, Th-230, Th-232, Rn, U-234, U-238 (GW)
Glen Ridge Radium Site Soil, Groundwater, Surface Water, Air
Ra-226, Th, U-234 (Soil); Ra-226, Rn-222 (GW); Ra-226 (SW); Rn-222 (Air)
Hanford 100-Area (DOE) Soil, Sludge, Solid Waste, Groundwater, Surface Water
Ag-108m, Ba-140, C-14, Co-60, Cs-137, Eu-152, Eu-154, Eu-155, H-3, Mn-54, Na-22, Ni-63, Pu-238, Pu-239, Pu-240, Sr-90, Zn-65, Zr-95 (Soil); Am-241, C-14, Co-60, Cs-137, Eu-152, Eu-154, H-3, Ni-63, Pu-238, Pu-239, Pu-240, Sr-90, Th-228, U-238 (Sludge); C-14, Co-60, Cs-137, Eu-152, Eu-154, H-3, Ni-63, Pu-238, Pu-239, Pu-240, Sr-90, U-238 (Solid Waste); Am-241, C-14, Co-60, Cs-137, H-3, I-129, Ni-63, Ru-106, Sr-90, Tc-99, U-233, U-234, U-235, U-238 (GW); Co-60, Cs-137, H-3, I-131, Pu-239, Pu-240, Sr-90, U-234, U-238 (SW)
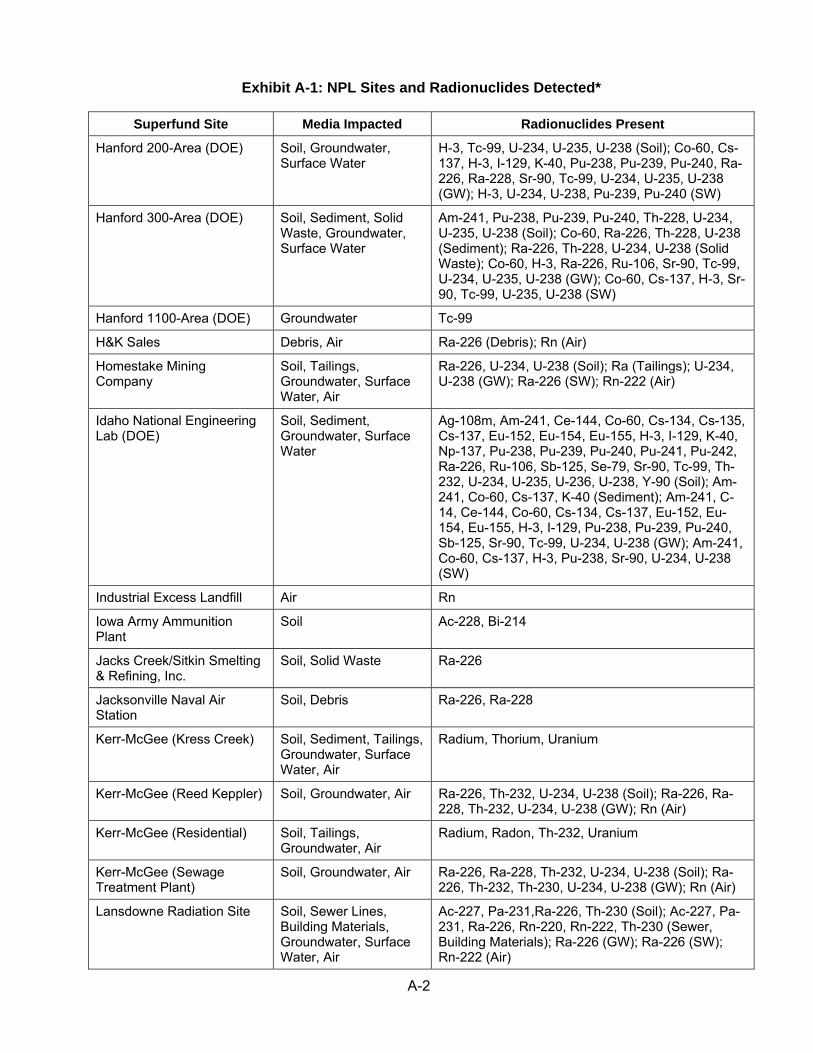
A-2
Exhibit A-1: NPL Sites and Radionuclides Detected*
Superfund Site Media Impacted Radionuclides Present
Hanford 200-Area (DOE) Soil, Groundwater, Surface Water
H-3, Tc-99, U-234, U-235, U-238 (Soil); Co-60, Cs-137, H-3, I-129, K-40, Pu-238, Pu-239, Pu-240, Ra-226, Ra-228, Sr-90, Tc-99, U-234, U-235, U-238 (GW); H-3, U-234, U-238, Pu-239, Pu-240 (SW)
Hanford 300-Area (DOE) Soil, Sediment, Solid Waste, Groundwater, Surface Water
Am-241, Pu-238, Pu-239, Pu-240, Th-228, U-234, U-235, U-238 (Soil); Co-60, Ra-226, Th-228, U-238 (Sediment); Ra-226, Th-228, U-234, U-238 (Solid Waste); Co-60, H-3, Ra-226, Ru-106, Sr-90, Tc-99, U-234, U-235, U-238 (GW); Co-60, Cs-137, H-3, Sr-90, Tc-99, U-235, U-238 (SW)
Hanford 1100-Area (DOE) Groundwater Tc-99
H&K Sales Debris, Air Ra-226 (Debris); Rn (Air)
Homestake Mining Company
Soil, Tailings, Groundwater, Surface Water, Air
Ra-226, U-234, U-238 (Soil); Ra (Tailings); U-234, U-238 (GW); Ra-226 (SW); Rn-222 (Air)
Idaho National Engineering Lab (DOE)
Soil, Sediment, Groundwater, Surface Water
Ag-108m, Am-241, Ce-144, Co-60, Cs-134, Cs-135, Cs-137, Eu-152, Eu-154, Eu-155, H-3, I-129, K-40, Np-137, Pu-238, Pu-239, Pu-240, Pu-241, Pu-242, Ra-226, Ru-106, Sb-125, Se-79, Sr-90, Tc-99, Th-232, U-234, U-235, U-236, U-238, Y-90 (Soil); Am-241, Co-60, Cs-137, K-40 (Sediment); Am-241, C-14, Ce-144, Co-60, Cs-134, Cs-137, Eu-152, Eu-154, Eu-155, H-3, I-129, Pu-238, Pu-239, Pu-240, Sb-125, Sr-90, Tc-99, U-234, U-238 (GW); Am-241, Co-60, Cs-137, H-3, Pu-238, Sr-90, U-234, U-238 (SW)
Industrial Excess Landfill Air Rn
Iowa Army Ammunition Plant
Soil Ac-228, Bi-214
Jacks Creek/Sitkin Smelting & Refining, Inc.
Soil, Solid Waste Ra-226
Jacksonville Naval Air Station
Soil, Debris Ra-226, Ra-228
Kerr-McGee (Kress Creek) Soil, Sediment, Tailings, Groundwater, Surface Water, Air
Radium, Thorium, Uranium
Kerr-McGee (Reed Keppler) Soil, Groundwater, Air Ra-226, Th-232, U-234, U-238 (Soil); Ra-226, Ra-228, Th-232, U-234, U-238 (GW); Rn (Air)
Kerr-McGee (Residential) Soil, Tailings, Groundwater, Air
Radium, Radon, Th-232, Uranium
Kerr-McGee (Sewage Treatment Plant)
Soil, Groundwater, Air Ra-226, Ra-228, Th-232, U-234, U-238 (Soil); Ra-226, Th-232, Th-230, U-234, U-238 (GW); Rn (Air)
Lansdowne Radiation Site Soil, Sewer Lines, Building Materials, Groundwater, Surface Water, Air
Ac-227, Pa-231,Ra-226, Th-230 (Soil); Ac-227, Pa-231, Ra-226, Rn-220, Rn-222, Th-230 (Sewer, Building Materials); Ra-226 (GW); Ra-226 (SW); Rn-222 (Air)
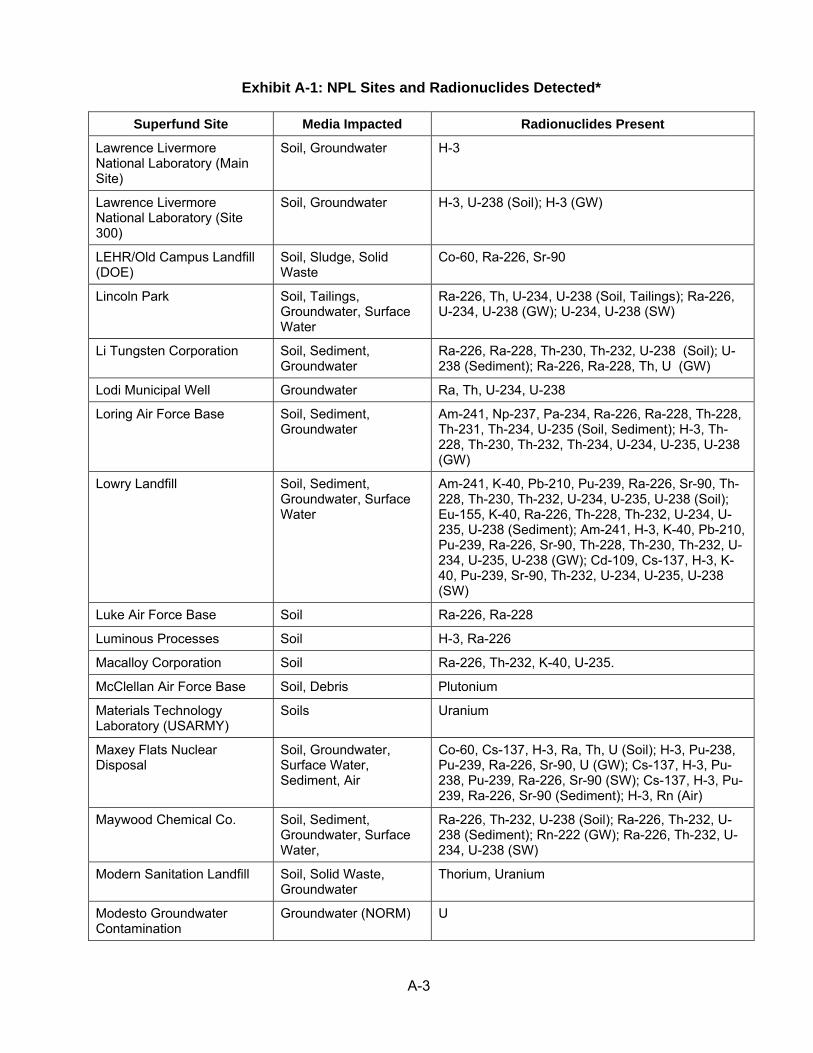
A-3
Exhibit A-1: NPL Sites and Radionuclides Detected*
Superfund Site Media Impacted Radionuclides Present
Lawrence Livermore National Laboratory (Main Site)
Soil, Groundwater H-3
Lawrence Livermore National Laboratory (Site 300)
Soil, Groundwater H-3, U-238 (Soil); H-3 (GW)
LEHR/Old Campus Landfill (DOE)
Soil, Sludge, Solid Waste
Co-60, Ra-226, Sr-90
Lincoln Park Soil, Tailings, Groundwater, Surface Water
Ra-226, Th, U-234, U-238 (Soil, Tailings); Ra-226, U-234, U-238 (GW); U-234, U-238 (SW)
Li Tungsten Corporation Soil, Sediment, Groundwater
Ra-226, Ra-228, Th-230, Th-232, U-238 (Soil); U-238 (Sediment); Ra-226, Ra-228, Th, U (GW)
Lodi Municipal Well Groundwater Ra, Th, U-234, U-238
Loring Air Force Base Soil, Sediment, Groundwater
Am-241, Np-237, Pa-234, Ra-226, Ra-228, Th-228, Th-231, Th-234, U-235 (Soil, Sediment); H-3, Th-228, Th-230, Th-232, Th-234, U-234, U-235, U-238 (GW)
Lowry Landfill Soil, Sediment, Groundwater, Surface Water
Am-241, K-40, Pb-210, Pu-239, Ra-226, Sr-90, Th-228, Th-230, Th-232, U-234, U-235, U-238 (Soil); Eu-155, K-40, Ra-226, Th-228, Th-232, U-234, U-235, U-238 (Sediment); Am-241, H-3, K-40, Pb-210, Pu-239, Ra-226, Sr-90, Th-228, Th-230, Th-232, U-234, U-235, U-238 (GW); Cd-109, Cs-137, H-3, K-40, Pu-239, Sr-90, Th-232, U-234, U-235, U-238 (SW)
Luke Air Force Base Soil Ra-226, Ra-228
Luminous Processes Soil H-3, Ra-226
Macalloy Corporation Soil Ra-226, Th-232, K-40, U-235.
McClellan Air Force Base Soil, Debris Plutonium
Materials Technology Laboratory (USARMY)
Soils Uranium
Maxey Flats Nuclear Disposal
Soil, Groundwater, Surface Water, Sediment, Air
Co-60, Cs-137, H-3, Ra, Th, U (Soil); H-3, Pu-238, Pu-239, Ra-226, Sr-90, U (GW); Cs-137, H-3, Pu-238, Pu-239, Ra-226, Sr-90 (SW); Cs-137, H-3, Pu-239, Ra-226, Sr-90 (Sediment); H-3, Rn (Air)
Maywood Chemical Co. Soil, Sediment, Groundwater, Surface Water,
Ra-226, Th-232, U-238 (Soil); Ra-226, Th-232, U-238 (Sediment); Rn-222 (GW); Ra-226, Th-232, U-234, U-238 (SW)
Modern Sanitation Landfill Soil, Solid Waste, Groundwater
Thorium, Uranium
Modesto Groundwater Contamination
Groundwater (NORM) U
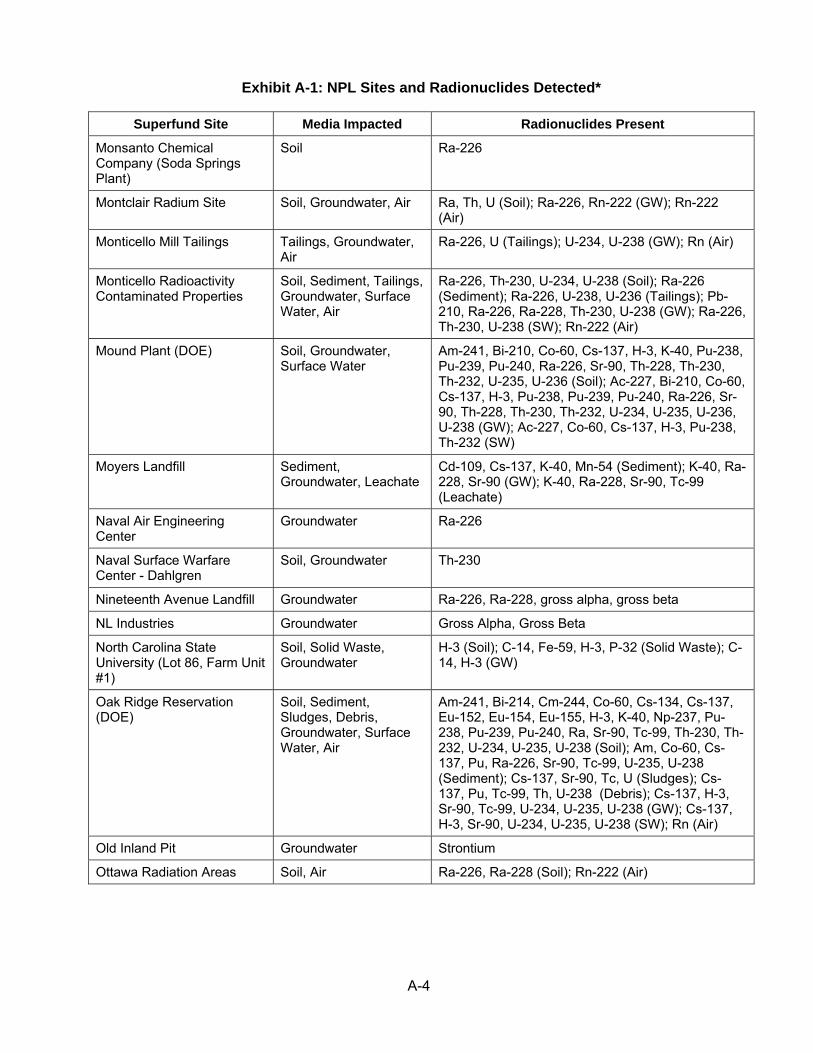
A-4
Exhibit A-1: NPL Sites and Radionuclides Detected*
Superfund Site Media Impacted Radionuclides Present
Monsanto Chemical Company (Soda Springs Plant)
Soil Ra-226
Montclair Radium Site Soil, Groundwater, Air Ra, Th, U (Soil); Ra-226, Rn-222 (GW); Rn-222 (Air)
Monticello Mill Tailings Tailings, Groundwater, Air
Ra-226, U (Tailings); U-234, U-238 (GW); Rn (Air)
Monticello Radioactivity Contaminated Properties
Soil, Sediment, Tailings, Groundwater, Surface Water, Air
Ra-226, Th-230, U-234, U-238 (Soil); Ra-226 (Sediment); Ra-226, U-238, U-236 (Tailings); Pb-210, Ra-226, Ra-228, Th-230, U-238 (GW); Ra-226, Th-230, U-238 (SW); Rn-222 (Air)
Mound Plant (DOE) Soil, Groundwater, Surface Water
Am-241, Bi-210, Co-60, Cs-137, H-3, K-40, Pu-238, Pu-239, Pu-240, Ra-226, Sr-90, Th-228, Th-230, Th-232, U-235, U-236 (Soil); Ac-227, Bi-210, Co-60, Cs-137, H-3, Pu-238, Pu-239, Pu-240, Ra-226, Sr-90, Th-228, Th-230, Th-232, U-234, U-235, U-236, U-238 (GW); Ac-227, Co-60, Cs-137, H-3, Pu-238, Th-232 (SW)
Moyers Landfill Sediment, Groundwater, Leachate
Cd-109, Cs-137, K-40, Mn-54 (Sediment); K-40, Ra-228, Sr-90 (GW); K-40, Ra-228, Sr-90, Tc-99 (Leachate)
Naval Air Engineering Center
Groundwater Ra-226
Naval Surface Warfare Center - Dahlgren
Soil, Groundwater Th-230
Nineteenth Avenue Landfill Groundwater Ra-226, Ra-228, gross alpha, gross beta
NL Industries Groundwater Gross Alpha, Gross Beta
North Carolina State University (Lot 86, Farm Unit #1)
Soil, Solid Waste, Groundwater
H-3 (Soil); C-14, Fe-59, H-3, P-32 (Solid Waste); C-14, H-3 (GW)
Oak Ridge Reservation (DOE)
Soil, Sediment, Sludges, Debris, Groundwater, Surface Water, Air
Am-241, Bi-214, Cm-244, Co-60, Cs-134, Cs-137, Eu-152, Eu-154, Eu-155, H-3, K-40, Np-237, Pu-238, Pu-239, Pu-240, Ra, Sr-90, Tc-99, Th-230, Th-232, U-234, U-235, U-238 (Soil); Am, Co-60, Cs-137, Pu, Ra-226, Sr-90, Tc-99, U-235, U-238 (Sediment); Cs-137, Sr-90, Tc, U (Sludges); Cs-137, Pu, Tc-99, Th, U-238 (Debris); Cs-137, H-3, Sr-90, Tc-99, U-234, U-235, U-238 (GW); Cs-137, H-3, Sr-90, U-234, U-235, U-238 (SW); Rn (Air)
Old Inland Pit Groundwater Strontium
Ottawa Radiation Areas Soil, Air Ra-226, Ra-228 (Soil); Rn-222 (Air)
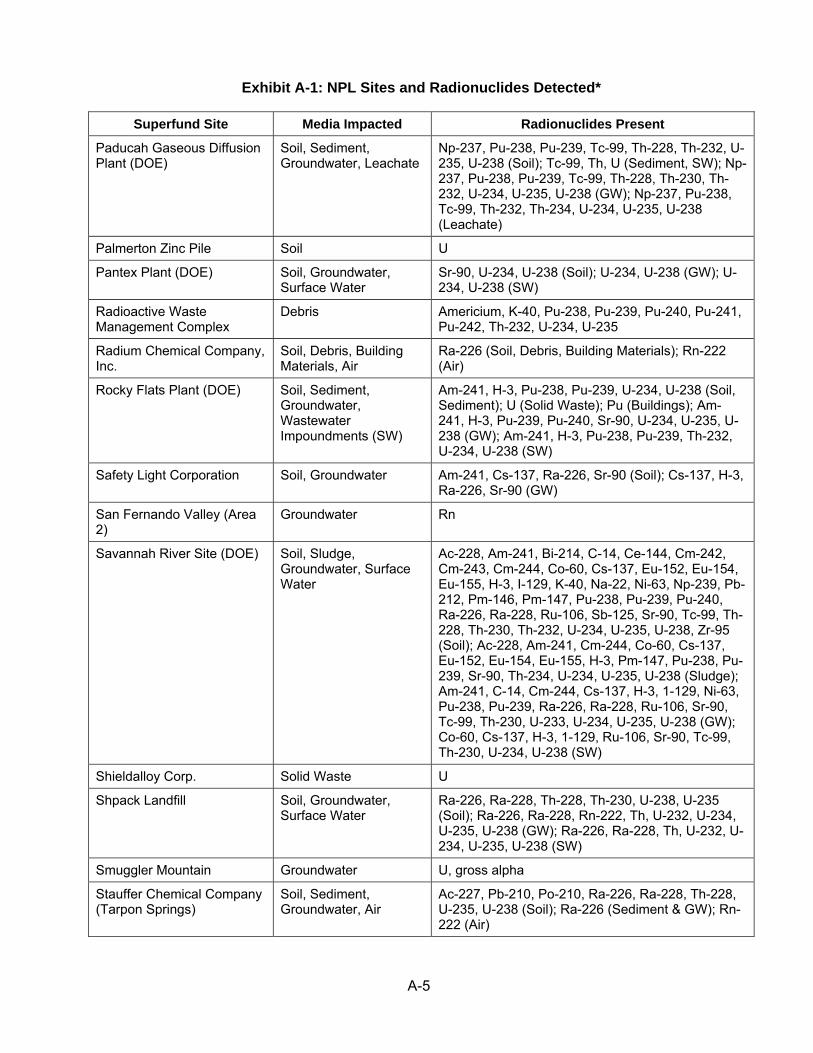
A-5
Exhibit A-1: NPL Sites and Radionuclides Detected*
Superfund Site Media Impacted Radionuclides Present
Paducah Gaseous Diffusion Plant (DOE)
Soil, Sediment, Groundwater, Leachate
Np-237, Pu-238, Pu-239, Tc-99, Th-228, Th-232, U-235, U-238 (Soil); Tc-99, Th, U (Sediment, SW); Np-237, Pu-238, Pu-239, Tc-99, Th-228, Th-230, Th-232, U-234, U-235, U-238 (GW); Np-237, Pu-238, Tc-99, Th-232, Th-234, U-234, U-235, U-238 (Leachate)
Palmerton Zinc Pile Soil U
Pantex Plant (DOE) Soil, Groundwater, Surface Water
Sr-90, U-234, U-238 (Soil); U-234, U-238 (GW); U-234, U-238 (SW)
Radioactive Waste Management Complex
Debris Americium, K-40, Pu-238, Pu-239, Pu-240, Pu-241, Pu-242, Th-232, U-234, U-235
Radium Chemical Company, Inc.
Soil, Debris, Building Materials, Air
Ra-226 (Soil, Debris, Building Materials); Rn-222 (Air)
Rocky Flats Plant (DOE) Soil, Sediment, Groundwater, Wastewater Impoundments (SW)
Am-241, H-3, Pu-238, Pu-239, U-234, U-238 (Soil, Sediment); U (Solid Waste); Pu (Buildings); Am-241, H-3, Pu-239, Pu-240, Sr-90, U-234, U-235, U-238 (GW); Am-241, H-3, Pu-238, Pu-239, Th-232, U-234, U-238 (SW)
Safety Light Corporation Soil, Groundwater Am-241, Cs-137, Ra-226, Sr-90 (Soil); Cs-137, H-3, Ra-226, Sr-90 (GW)
San Fernando Valley (Area 2)
Groundwater Rn
Savannah River Site (DOE) Soil, Sludge, Groundwater, Surface Water
Ac-228, Am-241, Bi-214, C-14, Ce-144, Cm-242, Cm-243, Cm-244, Co-60, Cs-137, Eu-152, Eu-154, Eu-155, H-3, I-129, K-40, Na-22, Ni-63, Np-239, Pb-212, Pm-146, Pm-147, Pu-238, Pu-239, Pu-240, Ra-226, Ra-228, Ru-106, Sb-125, Sr-90, Tc-99, Th-228, Th-230, Th-232, U-234, U-235, U-238, Zr-95 (Soil); Ac-228, Am-241, Cm-244, Co-60, Cs-137, Eu-152, Eu-154, Eu-155, H-3, Pm-147, Pu-238, Pu-239, Sr-90, Th-234, U-234, U-235, U-238 (Sludge); Am-241, C-14, Cm-244, Cs-137, H-3, 1-129, Ni-63, Pu-238, Pu-239, Ra-226, Ra-228, Ru-106, Sr-90, Tc-99, Th-230, U-233, U-234, U-235, U-238 (GW); Co-60, Cs-137, H-3, 1-129, Ru-106, Sr-90, Tc-99, Th-230, U-234, U-238 (SW)
Shieldalloy Corp. Solid Waste U
Shpack Landfill
Soil, Groundwater, Surface Water
Ra-226, Ra-228, Th-228, Th-230, U-238, U-235 (Soil); Ra-226, Ra-228, Rn-222, Th, U-232, U-234, U-235, U-238 (GW); Ra-226, Ra-228, Th, U-232, U-234, U-235, U-238 (SW)
Smuggler Mountain Groundwater U, gross alpha
Stauffer Chemical Company (Tarpon Springs)
Soil, Sediment, Groundwater, Air
Ac-227, Pb-210, Po-210, Ra-226, Ra-228, Th-228, U-235, U-238 (Soil); Ra-226 (Sediment & GW); Rn-222 (Air)
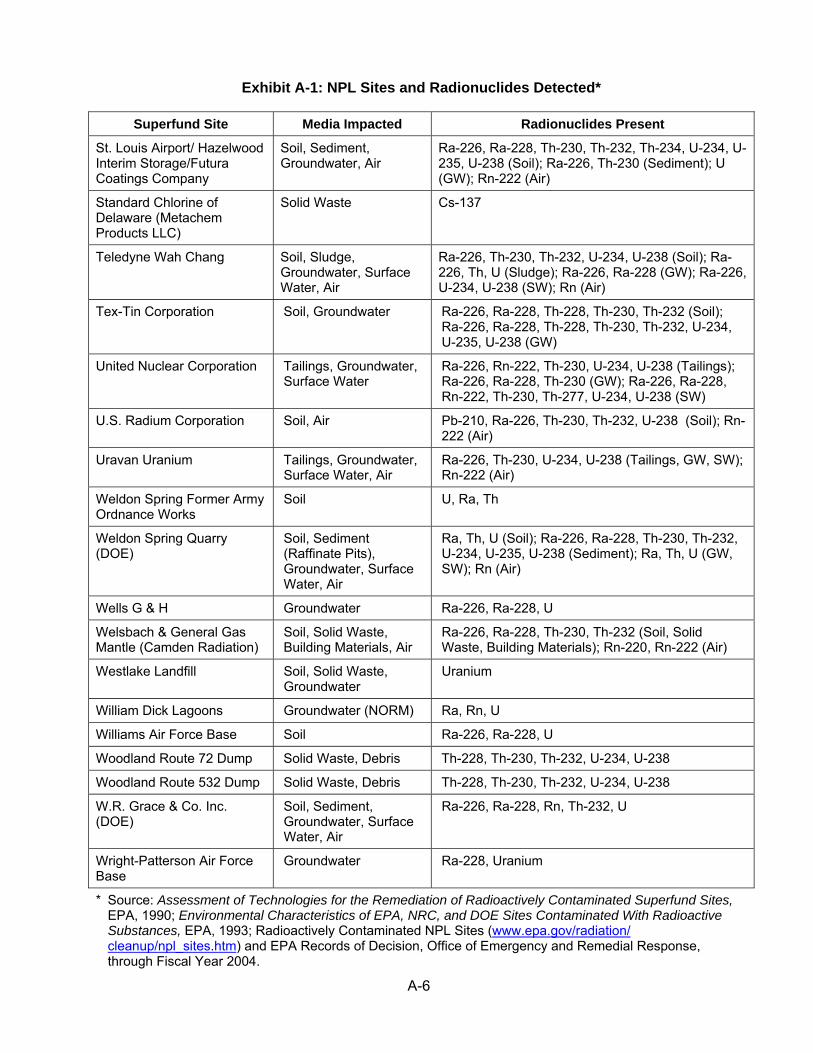
A-6
Exhibit A-1: NPL Sites and Radionuclides Detected*
Superfund Site Media Impacted Radionuclides Present
St. Louis Airport/ Hazelwood Interim Storage/Futura Coatings Company
Soil, Sediment, Groundwater, Air
Ra-226, Ra-228, Th-230, Th-232, Th-234, U-234, U-235, U-238 (Soil); Ra-226, Th-230 (Sediment); U (GW); Rn-222 (Air)
Standard Chlorine of Delaware (Metachem Products LLC)
Solid Waste Cs-137
Teledyne Wah Chang Soil, Sludge, Groundwater, Surface Water, Air
Ra-226, Th-230, Th-232, U-234, U-238 (Soil); Ra-226, Th, U (Sludge); Ra-226, Ra-228 (GW); Ra-226, U-234, U-238 (SW); Rn (Air)
Tex-Tin Corporation Soil, Groundwater Ra-226, Ra-228, Th-228, Th-230, Th-232 (Soil); Ra-226, Ra-228, Th-228, Th-230, Th-232, U-234, U-235, U-238 (GW)
United Nuclear Corporation Tailings, Groundwater, Surface Water
Ra-226, Rn-222, Th-230, U-234, U-238 (Tailings); Ra-226, Ra-228, Th-230 (GW); Ra-226, Ra-228, Rn-222, Th-230, Th-277, U-234, U-238 (SW)
U.S. Radium Corporation Soil, Air Pb-210, Ra-226, Th-230, Th-232, U-238 (Soil); Rn-222 (Air)
Uravan Uranium Tailings, Groundwater, Surface Water, Air
Ra-226, Th-230, U-234, U-238 (Tailings, GW, SW); Rn-222 (Air)
Weldon Spring Former Army Ordnance Works
Soil U, Ra, Th
Weldon Spring Quarry (DOE)
Soil, Sediment (Raffinate Pits), Groundwater, Surface Water, Air
Ra, Th, U (Soil); Ra-226, Ra-228, Th-230, Th-232, U-234, U-235, U-238 (Sediment); Ra, Th, U (GW, SW); Rn (Air)
Wells G & H Groundwater Ra-226, Ra-228, U
Welsbach & General Gas Mantle (Camden Radiation)
Soil, Solid Waste, Building Materials, Air
Ra-226, Ra-228, Th-230, Th-232 (Soil, Solid Waste, Building Materials); Rn-220, Rn-222 (Air)
Westlake Landfill Soil, Solid Waste, Groundwater
Uranium
William Dick Lagoons Groundwater (NORM) Ra, Rn, U
Williams Air Force Base Soil Ra-226, Ra-228, U
Woodland Route 72 Dump Solid Waste, Debris Th-228, Th-230, Th-232, U-234, U-238
Woodland Route 532 Dump Solid Waste, Debris Th-228, Th-230, Th-232, U-234, U-238
W.R. Grace & Co. Inc. (DOE)
Soil, Sediment, Groundwater, Surface Water, Air
Ra-226, Ra-228, Rn, Th-232, U
Wright-Patterson Air Force Base
Groundwater Ra-228, Uranium
* Source: Assessment of Technologies for the Remediation of Radioactively Contaminated Superfund Sites, EPA, 1990; Environmental Characteristics of EPA, NRC, and DOE Sites Contaminated With Radioactive Substances, EPA, 1993; Radioactively Contaminated NPL Sites (www.epa.gov/radiation/ cleanup/npl_sites.htm) and EPA Records of Decision, Office of Emergency and Remedial Response, through Fiscal Year 2004.
APPENDIX B
RADIOACTIVE CONTAMINATION: BASIC CONCEPTS AND TERMS

B-1
RADIOACTIVE CONTAMINATION: BASIC CONCEPTS & TERMS
Types of Radioactive Waste
Although there are hundreds of known radioactive isotopes, only a small fraction of these are likely to be seen at contaminated sites. This effect is due to the fact that many isotopes are nearly impossible to create without exotic scientific equipment and many others have extremely short half-lives and therefore do not exist long enough to make it outside the facility where they were created. Among the radioactive isotopes likely to be encountered in disposal and remediation sites are naturally occurring radioactive material such as uranium-238, thorium-232, thorium-230, radium-226, and radon -222; radioactive fission products such as cesium-137 and strontium-90; and products of neutron bombardment such as cobalt-60. The radioactive isotopes in place at one particular site will depend on the source of the material spilled or disposed of there.
Radioactive isotopes originate from both manufactured and natural sources. Nuclear reactors and particle accelerators, for example, can generate radioactive isotopes by forcefully de-stabilizing their nuclei in a process known as fissioning (splitting of the atom). Fissioning can split larger atoms, such as uranium or plutonium, into multiple, smaller, radioactive elements. Reactors also can create radioactive isotopes from stable elements by causing additional neutrons to be absorbed into their nuclei, which can result in an unstable (energy-emitting) configuration. This is called neutron activation. Additionally, particle accelerators, cyclotrons, and similar machines can create radioactive isotopes from stable elements by bombarding their nucleus with a variety of particles. This process is often used to create medical isotopes.
The development and use of radioactive materials inevitably results in the production of radioactive waste. The treatment and disposal of the potentially harmful waste is a matter of much concern and controversy. Again, the management of this waste has led to the development of definitions and authorities to assign responsibility for their handling. Exhibit B-1 is a summary of categories and definitions, and the authority from which it is cited. The technologies presented in this Guide are most likely to be applicable to low-level, Naturally-occurring and Accelerator-produced Radioactive Material (NARM)/Naturally-Occurring Radioactive Material (NORM), and mixed waste.
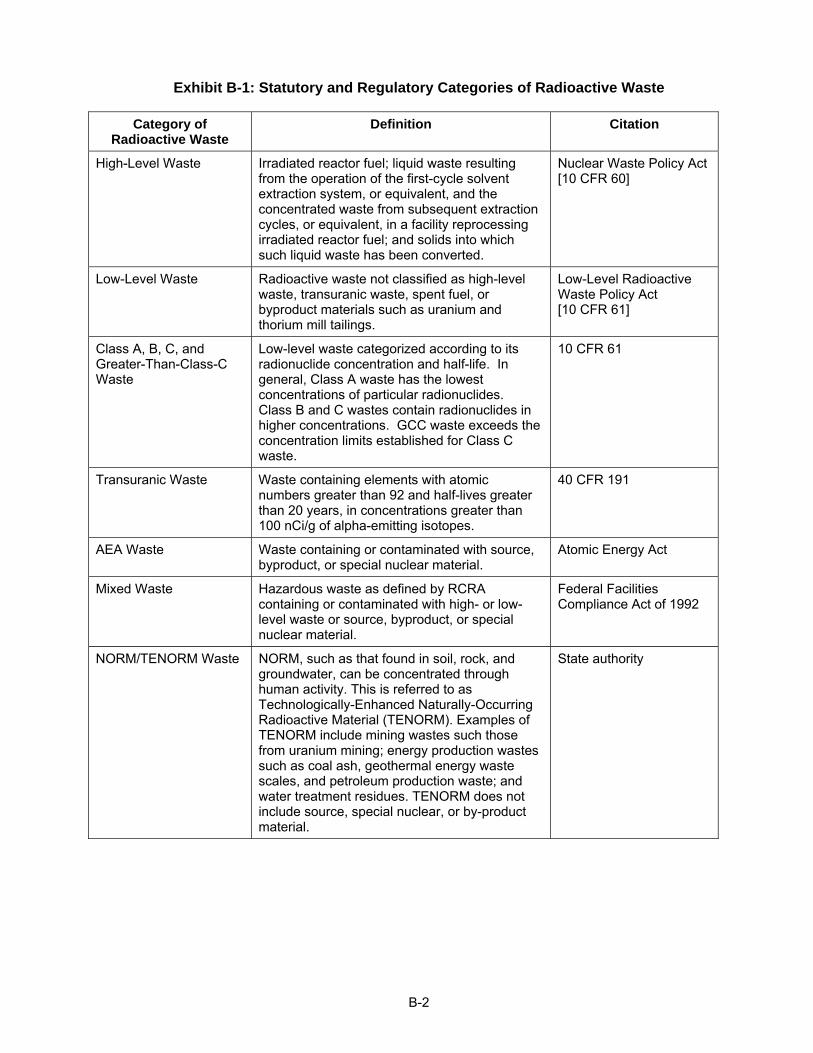
B-2
Exhibit B-1: Statutory and Regulatory Categories of Radioactive Waste
Category of Radioactive Waste
Definition Citation
High-Level Waste Irradiated reactor fuel; liquid waste resulting from the operation of the first-cycle solvent extraction system, or equivalent, and the concentrated waste from subsequent extraction cycles, or equivalent, in a facility reprocessing irradiated reactor fuel; and solids into which such liquid waste has been converted.
Nuclear Waste Policy Act [10 CFR 60]
Low-Level Waste Radioactive waste not classified as high-level waste, transuranic waste, spent fuel, or byproduct materials such as uranium and thorium mill tailings.
Low-Level Radioactive Waste Policy Act [10 CFR 61]
Class A, B, C, and Greater-Than-Class-C Waste
Low-level waste categorized according to its radionuclide concentration and half-life. In general, Class A waste has the lowest concentrations of particular radionuclides. Class B and C wastes contain radionuclides in higher concentrations. GCC waste exceeds the concentration limits established for Class C waste.
10 CFR 61
Transuranic Waste Waste containing elements with atomic numbers greater than 92 and half-lives greater than 20 years, in concentrations greater than 100 nCi/g of alpha-emitting isotopes.
40 CFR 191
AEA Waste Waste containing or contaminated with source, byproduct, or special nuclear material.
Atomic Energy Act
Mixed Waste Hazardous waste as defined by RCRA containing or contaminated with high- or low-level waste or source, byproduct, or special nuclear material.
Federal Facilities Compliance Act of 1992
NORM/TENORM Waste NORM, such as that found in soil, rock, and groundwater, can be concentrated through human activity. This is referred to as Technologically-Enhanced Naturally-Occurring Radioactive Material (TENORM). Examples of TENORM include mining wastes such those from uranium mining; energy production wastes such as coal ash, geothermal energy waste scales, and petroleum production waste; and water treatment residues. TENORM does not include source, special nuclear, or by-product material.
State authority
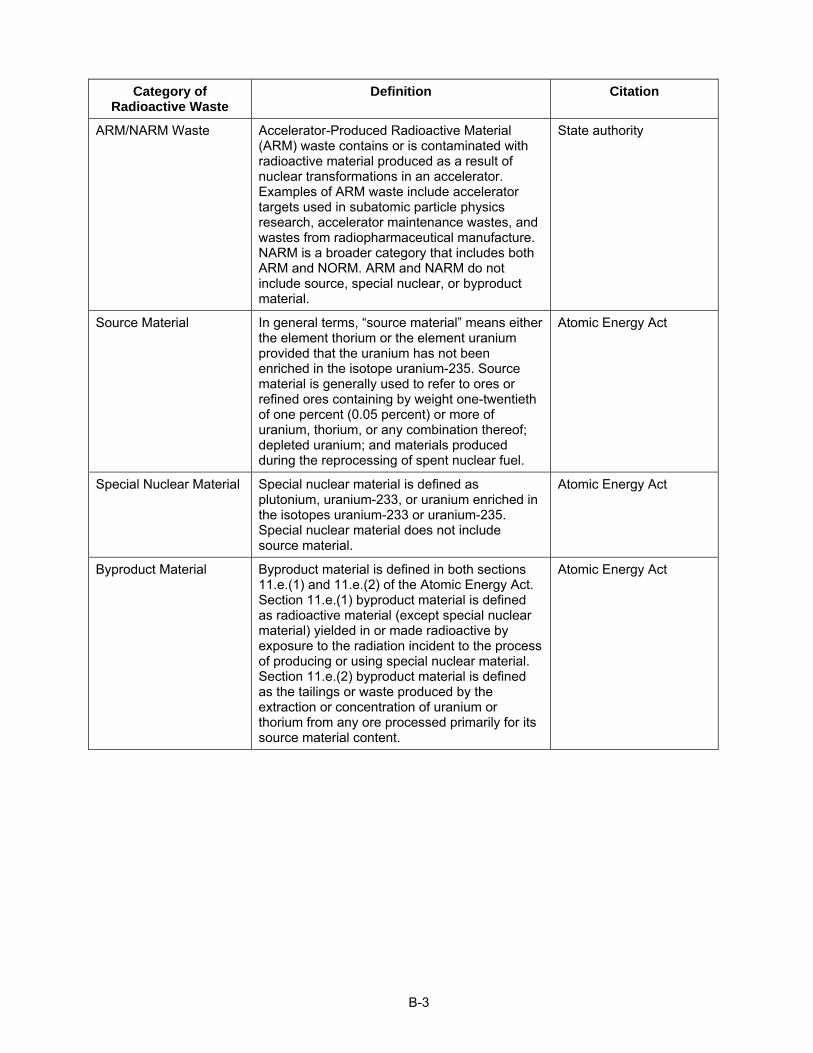
B-3
Category of Radioactive Waste
Definition Citation
ARM/NARM Waste Accelerator-Produced Radioactive Material (ARM) waste contains or is contaminated with radioactive material produced as a result of nuclear transformations in an accelerator. Examples of ARM waste include accelerator targets used in subatomic particle physics research, accelerator maintenance wastes, and wastes from radiopharmaceutical manufacture. NARM is a broader category that includes both ARM and NORM. ARM and NARM do not include source, special nuclear, or byproduct material.
State authority
Source Material In general terms, “source material” means either the element thorium or the element uranium provided that the uranium has not been enriched in the isotope uranium-235. Source material is generally used to refer to ores or refined ores containing by weight one-twentieth of one percent (0.05 percent) or more of uranium, thorium, or any combination thereof; depleted uranium; and materials produced during the reprocessing of spent nuclear fuel.
Atomic Energy Act
Special Nuclear Material Special nuclear material is defined as plutonium, uranium-233, or uranium enriched in the isotopes uranium-233 or uranium-235. Special nuclear material does not include source material.
Atomic Energy Act
Byproduct Material Byproduct material is defined in both sections 11.e.(1) and 11.e.(2) of the Atomic Energy Act. Section 11.e.(1) byproduct material is defined as radioactive material (except special nuclear material) yielded in or made radioactive by exposure to the radiation incident to the process of producing or using special nuclear material. Section 11.e.(2) byproduct material is defined as the tailings or waste produced by the extraction or concentration of uranium or thorium from any ore processed primarily for its source material content.
Atomic Energy Act
B-4
NATURE OF RADIOACTIVITY
Nearly all elements (e.g., oxygen, carbon) in nature can be found in a variety of nuclear compositions. Isotopes, which are different forms of an element, have the same atomic number, but different atomic mass. That is, their nuclei have the same number of protons but different numbers of neutrons. Carbon, for example, contains six protons in its nucleus but can have either six (carbon-12), seven (carbon-13), or eight (carbon-14) neutrons.
Isotopes that are unstable will undergo radioactive decay in order to reach a more stable nuclear configuration. These unstable isotopes are called radioactive isotopes. Radioactive isotopes spontaneously emit energy and particles in the form of alpha (positively charged) or beta (positively or negatively charged) particles, and/or gamma rays (which are similar to X rays in behavior) as part of the radioactive decay process. This emitted or expended energy—radiation—and its spontaneous activity (radioactivity) form its potentially creative or destructive power. Carbon-14, for example, is a radioactive isotope that will decay by emitting a beta particle and form nitrogen-14.
An alpha particle is a positively charged particle, emitted from the nucleus of a decaying radioactive atom (alpha emitters), containing two neutrons and two protons identical to the nucleus of a helium atom. Because alpha particles are “massive” on an atomic scale, they can be easily shielded and are stopped by a sheet of paper. Thus, they cannot penetrate the natural human dead skin layer on external skin. The alpha particles can be dangerous when the alpha emitting atom is inhaled, or if the atom enters the body through a cut, food, or water, and permitted to come in contact with living cells inside the body to ionize the living tissue. The harmful exposure to alpha particles usually occurs mainly through internal pathways and some can occur through external pathways.
A beta particle is essentially either an electron or a positron emitted from the nucleus of a decaying atom. Most beta particles that are produced in the decay of naturally occurring radioisotopes are electrons. Positrons are usually the result of the decay of certain man-made radioisotopes. Beta particles are less massive than alpha particles but are also relatively easy to shield. Some beta particles can penetrate skin. As with alpha emitters, beta emitters cause the most damage when the atom is ingested and allowed to decay inside the body. The harmful exposure to beta particles usually occurs mainly through internal pathways and some can occur through external pathways.
Gamma rays are similar to x rays (although they are produced differently); however, gamma rays are of higher energy and thus have stronger penetrating power. Gamma rays can penetrate and damage critical organs in the body and are the most difficult of the radiation types to shield. The exposure to gamma rays is usually of concern through external pathways but it can also occur through internal pathways.
Included among the naturally occurring radioactive elements are uranium-238, carbon- 14, hydrogen-3 (tritium), thorium-230, radium-226, radon-222, and potassium-40. In addition, radioactive elements can be created as products of the decay of other radioactive isotopes. When the nucleus of uranium-238 decays, for example, it produces thorium-234 (radioactive),
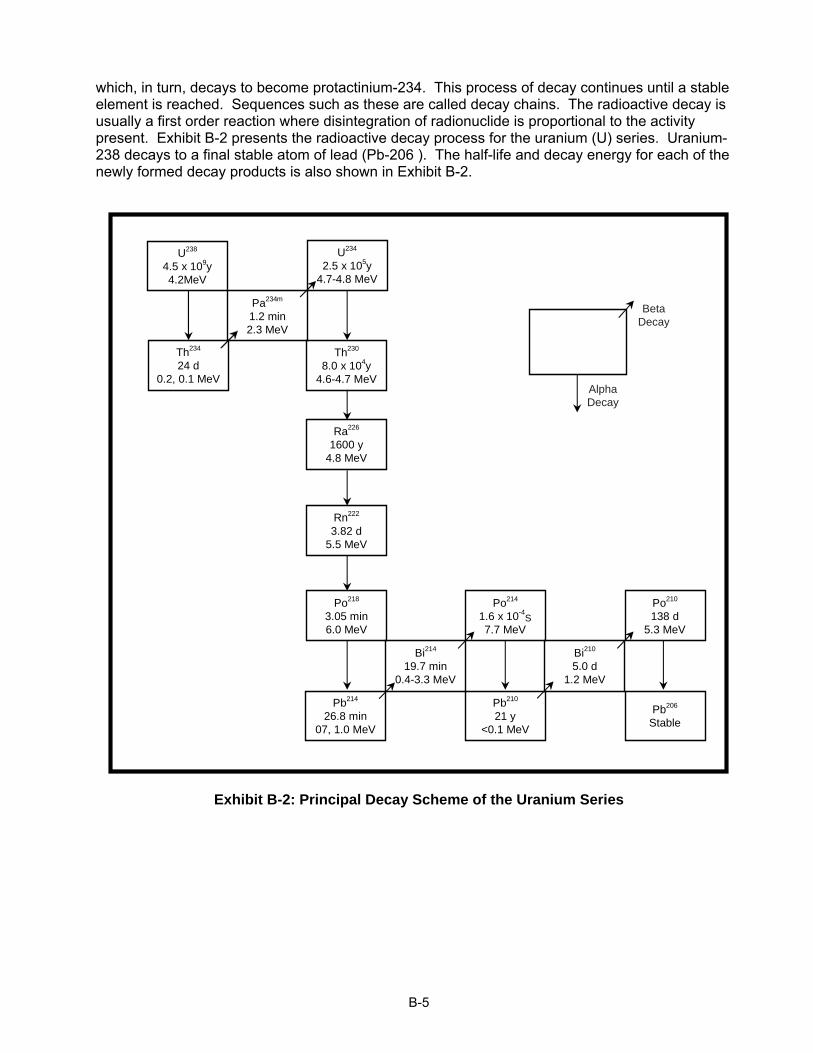
B-5
which, in turn, decays to become protactinium-234. This process of decay continues until a stable element is reached. Sequences such as these are called decay chains. The radioactive decay is usually a first order reaction where disintegration of radionuclide is proportional to the activity present. Exhibit B-2 presents the radioactive decay process for the uranium (U) series. Uranium-238 decays to a final stable atom of lead (Pb-206 ). The half-life and decay energy for each of the newly formed decay products is also shown in Exhibit B-2.
Pa234m
1.2 min2.3 MeV
Th234
24 d0.2, 0.1 MeV
U238
4.5 x 10⁹y4.2MeV
U234
2.5 x 10⁵y4.7-4.8 MeV
Th230
8.0 x 10⁴y4.6-4.7 MeV
Ra226
1600 y4.8 MeV
Rn222
3.82 d5.5 MeV
Pb214
26.8 min07, 1.0 MeV
Pb210
21 y<0.1 MeV
Po218
3.05 min6.0 MeV
Bi214
19.7 min0.4-3.3 MeV
Po214
1.6 x 10⁻⁴S
7.7 MeV
Po210
138 d5.3 MeV
Pb206
Stable
Bi210
5.0 d1.2 MeV
AlphaDecay
BetaDecay
Exhibit B-2: Principal Decay Scheme of the Uranium Series
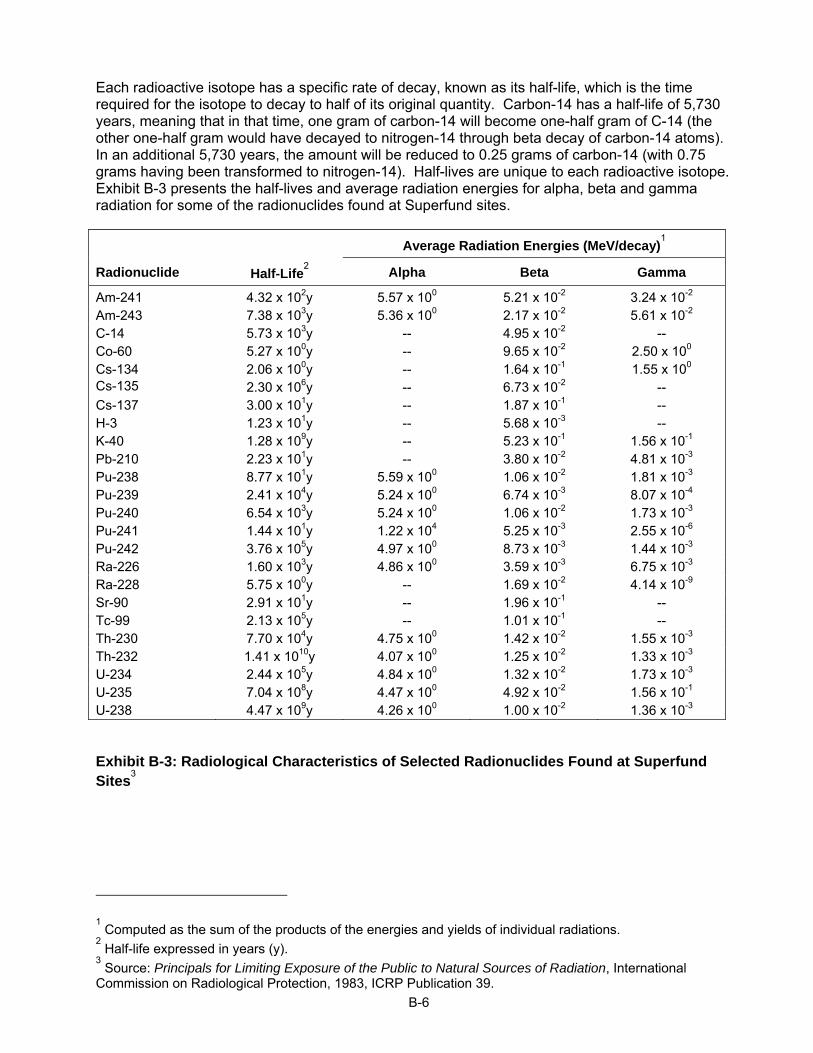
B-6
Each radioactive isotope has a specific rate of decay, known as its half-life, which is the time required for the isotope to decay to half of its original quantity. Carbon-14 has a half-life of 5,730 years, meaning that in that time, one gram of carbon-14 will become one-half gram of C-14 (the other one-half gram would have decayed to nitrogen-14 through beta decay of carbon-14 atoms). In an additional 5,730 years, the amount will be reduced to 0.25 grams of carbon-14 (with 0.75 grams having been transformed to nitrogen-14). Half-lives are unique to each radioactive isotope. Exhibit B-3 presents the half-lives and average radiation energies for alpha, beta and gamma radiation for some of the radionuclides found at Superfund sites.
Average Radiation Energies (MeV/decay)1
Radionuclide Half-Life2 Alpha Beta Gamma
Am-241 4.32 x 10²y 5.57 x 100 5.21 x 10⁻² 3.24 x 10⁻² Am-243 7.38 x 10³y 5.36 x 100 2.17 x 10⁻² 5.61 x 10⁻² C-14 5.73 x 10³y -- 4.95 x 10⁻² -- Co-60 5.27 x 100y -- 9.65 x 10⁻² 2.50 x 100 Cs-134 2.06 x 100y -- 1.64 x 10⁻¹ 1.55 x 100 Cs-135 2.30 x 10⁶y -- 6.73 x 10⁻² -- Cs-137 3.00 x 101y -- 1.87 x 10⁻¹ -- H-3 1.23 x 101y -- 5.68 x 10⁻³ -- K-40 1.28 x 10⁹y -- 5.23 x 10⁻¹ 1.56 x 10⁻¹ Pb-210 2.23 x 101y -- 3.80 x 10⁻² 4.81 x 10⁻³ Pu-238 8.77 x 101y 5.59 x 100 1.06 x 10⁻² 1.81 x 10⁻³ Pu-239 2.41 x 10⁴y 5.24 x 100 6.74 x 10⁻³ 8.07 x 10⁻⁴ Pu-240 6.54 x 10³y 5.24 x 100 1.06 x 10⁻² 1.73 x 10⁻³ Pu-241 1.44 x 101y 1.22 x 10⁴ 5.25 x 10⁻³ 2.55 x 10⁻⁶ Pu-242 3.76 x 10⁵y 4.97 x 100 8.73 x 10⁻³ 1.44 x 10⁻³ Ra-226 1.60 x 10³y 4.86 x 100 3.59 x 10⁻³ 6.75 x 10⁻³ Ra-228 5.75 x 100y -- 1.69 x 10⁻² 4.14 x 10⁻⁹ Sr-90 2.91 x 101y -- 1.96 x 10⁻¹ -- Tc-99 2.13 x 10⁵y -- 1.01 x 10⁻¹ -- Th-230 7.70 x 10⁴y 4.75 x 100 1.42 x 10⁻² 1.55 x 10⁻³ Th-232 1.41 x 10¹⁰y 4.07 x 100 1.25 x 10⁻² 1.33 x 10⁻³ U-234 2.44 x 10⁵y 4.84 x 100 1.32 x 10⁻² 1.73 x 10⁻³ U-235 7.04 x 10⁸y 4.47 x 100 4.92 x 10⁻² 1.56 x 10⁻¹ U-238 4.47 x 10⁹y 4.26 x 100 1.00 x 10⁻² 1.36 x 10⁻³
Exhibit B-3: Radiological Characteristics of Selected Radionuclides Found at Superfund Sites3
1 Computed as the sum of the products of the energies and yields of individual radiations.
2 Half-life expressed in years (y).
3 Source: Principals for Limiting Exposure of the Public to Natural Sources of Radiation, International
Commission on Radiological Protection, 1983, ICRP Publication 39.
B-7
BASIC TERMS, TYPES AND UNITS OF RADIATION
Basic Terms
Activity The quantity of a radioactive nuclide present at a particular time, expressed in terms of the mean rate of nuclear transformations The special name for the SI unit of activity (s-1) is Becquerel (Bq). The conventional unit is the curie (Ci). 1Ci = 3.7 x 10¹⁰ Bq.
Background Radiation The radiation in man’s natural environment, including cosmic rays and radiation (which may vary from location) from the naturally radioactive elements, both outside and inside the bodies of humans and animals. It is also called natural radiation.
Coulomb The amount of electricity transported by a current of one ampere flowing for one second.
Decay Constant The fraction of the amount of a radionuclide that undergoes transition per unit time. Lambda (λ) is the symbol for decay constant.
Dose A general term denoting the quantity of radiation or energy absorbed. For special purposes it must be appropriately qualified. If unqualified, it refers to absorbed dose.
Erg The unit of energy in the centimeter–gram–second system of physical units, that is, one dyne-centimeter. One erg is equal to 10 -7 joule
Ion Atomic particle, atom, or chemical radical bearing an electric charge, either negative or positive.
Ionization The process of adding one or more electrons to, or removing one or more electrons from, atoms or molecules, thereby creating ions. High temperatures, electrical discharges, or nuclear radiations can cause ionization.
Ionizing radiation Any radiation capable of removing electrons from atoms or molecules, thereby producing ions. Examples are alpha and beta particles.
Isotope One of several nuclides having the same number of protons in their nuclei, and hence having the same atomic number, but differing in the number of neutrons, and therefore, in the mass number. Almost identical chemical properties exist between isotopes of a particular element. The use of this term as a synonym for nuclide is to be discouraged.
Non-ionizing radiation Non-ionizing radiation is radiation without enough energy to remove tightly bound electrons from their orbits around atoms. Examples are microwaves and visible light.
B-8
Radiation The emission and propagation of energy through space or through material in the form of electromagnetic waves or particles.
Radioactive Decay The process by which a spontaneous change in nuclear state takes place. This process is accompanied by the emission of energy in various specific combinations of electromagnetic and corpuscular radiation and neutrinos.
Radioactivity The property of certain nuclides of spontaneously emitting particles or gamma radiation during nuclear transformations.
Common Units of Radiation
Becquerel (Bq) The SI unit of radioactivity, defined as the activity of a quantity of radioactive material in which one nucleus decays per second. It has units of s-1.
Curie (Ci) The curie is a unit used to measure a radioactivity. One curie is that quantity of a radioactive material that will have 37,000,000,000 transformations in 1 second. Often radioactivity is expressed in smaller units like: thousandths (mCi), millionths (uCi) or even billionths (nCi) of a curie. The relationship between becquerels and curies is: 3.7 X 10¹⁰ Bq in 1 curie [or 1 Bq = 27 pCi].
Rad (radiation absorbed dose) The conventional unit for absorbed dose of ionizing radiation. One rad is defined as the absorption of 100 ergs per gram (0.01 J/kg) of material. 1 rad - 0.01 Gy. The rad unit can be used for any type of radiation absorbed in any material but does not describe the biological effect on that material.
Rem (roentgen equivalent man) The rem is a unit used to derive a quantity called equivalent dose. This relates the absorbed dose in human tissue to the effective biological damage of the radiation. Not all radiation has the same biological effect, even for the same amount of absorbed dose. Equivalent dose is often expressed in terms of thousandths of a rem, or millirem (mrem). To determine equivalent dose (rem), you multiply absorbed dose (rad) by a quality factor (Q) that is unique to the type of incident radiation.
Roentgen The roentgen is a unit used to measure a quantity called exposure. This can only be used to describe an amount of gamma and x rays, and only in air. One roentgen is equal to depositing 2.58 E-4 coulombs per kg of dry air. It is a measure of the ionizations of the molecules in a mass of air. The main advantage of this unit is that it is easy to measure directly, but it is limited because it is only for deposition in air, and only for gamma and x rays.
B-9
LIST OF ELEMENTS AND SYMBOLS
Actinium Ac Magnesium Mg
Aluminum Al Manganese Mn
Americium Am Mendelevium Md
Antimony Sb Mercury Hg
Argon Ar Molybdenum Mo
Arsenic As Neodymium Nd
Astatine At Neon Ne
Barium Ba Neptunium Np
Berkelium Bk Nickel Ni
Beryllium Be Niobium Nb
Bismuth Bi Nitrogen N
Boron B Nobelium No
Bromine Br Osmium Os
Cadmium Cd Oxygen O
Calcium Ca Palladium Pd
Californium Cf Phosphorus P
Carbon C Platinum Pt
Cerium Ce Plutonium Pu
Cesium Cs Polonium Po
Chlorine Cl Potassium K
Chromium Cr Praseodymium Pr
Cobalt Co Promethium Pm
Copper Cu Protactinium Pa
Curium Cm Radium Ra
Dysprosium Dy Radon Rn
Einsteinium Es Rhenium Re
Erbium Er Rhodium Rh
Europium Eu Rubidium Rb
Fermium Fm Ruthenium Ru
Fluorine F Samarium Sm
Francium Fr Scandium Sc
Gadolinium Gd Selenium Se
Gallium Ga Silicon Si
Germanium Ge Silver Ag
Gold Au Sodium Na
B-10
Hafnium Hf Strontium Sr
Helium He Sulfur S
Holmium Ho Tantalum Ta
Hydrogen H Technetium Tc
Indium In Tellurium Te
Iodine I Terbium Tb
Iridium Ir Thallium Tl
Iron Fe Thorium Th
Krypton Kr Thulium Tm
Lanthanum La Tin Sn
Lawrencium Lr Titanium Ti
Lead Pb Tungsten W
Lithium Li Uranium U
Lutetium Lu Vanadium V
Xenon Xe
Ytterbium Yb
Yttrium Y
Zinc Zn
Zirconium Zr
B-11
Sample Measurement Units, Activity and Mass
Introduction
Typically units of decay rate instead of mass are used to quantify the concentration of radioactive material in soil because the carcinogenic risks of exposure to soils contaminated with radioactive materials are related more to the decay rate of the material than to its mass. For example, one gram of 226Ra has a decay rate (activity) of 3.7x10¹⁰ transformations per second (also referred to as disintegrations per second), while one gram of 137 Cs has a decay rate of 3.2x10¹² transformations per second. Since it is the energy emitted by the radioactive material during radioactive decay and the frequency of the decay that is usually of public health concern, and generally not the chemical properties of the radioactive material, it is more meaningful for health assessment purposes to quantify radioactive material according to decay rate. In addition, radioactive materials are detected and quantified by the type of radiation emitted and number of disintegrations (per unit time), not by their unique chemistry, as is the case for non-radioactive material. For these reasons, the concentration of radioactive material in soil and water is typically expressed in units of decay rate, pCi/g and pCi/l.
When and How to Calculate Mass
Mass units provide insight and information into treatment selection, treatment compatibility, and treatment effiency, particularly for remedial actions involving mixed waste. For example, remediation goals expressed in mass are important for designing and evaluating treatment technologies such as soil separation, pump and treat, as well as subsurface barriers. Typically units for expressing mass in environmental media for soil and water are mg/kg for soil and mg/l for water. These mass units also can be expressed as parts per million (ppm) for soil and water, which is equivalent to mg/kg and mg/l. Soil activity, in pCi/g, may be converted to its mass equivalent of mg/kg, and Maximum Contaminant Levels (MCLs) for water activity in pCi/l may be converted to its mass equivalent mg/l by the following equations:
Soil Mass (mg/kg) = 2.8 x 10⁻¹² x A x T1/2 x soil activity (pCi/g)
MCL (mg/l ) = 2.8 x 10⁻¹⁵ x A x T1/2 x MCL (pCi/l )
Where 2.8 x 10⁻¹² for soil or 2.8 x 10⁻¹⁵ for water is a conversion factor, A is the radionuclide atomic weight in g/mole, and T1/2 is the radionuclide half-life in years. To put the relationship between mass (mg/kg) and activity (pCi/g) into perspective, examine the soil concentration in mg/kg corresponding to a soil activity of 1 pCi/g for a long-lived radionuclide such as 238U and a relatively short-lived one such as 60Co. 238U has a half-life of 4.51 x 10+9 years, so a 1 pCi/g of soil activity would be equivalent to a soil mass of 3 mg/kg. On the other hand, a soil activity of 1 pCi/g soil activity of 60Co, which has a half-life of 5.26 years, is equivalent to about a soil mass of 1 x 10⁻⁹ mg/kg. Most radionuclides, which are a concern for site cleanups, have half-lives ranging from a few years to 10,000 years. Most activities are in fact less than 1 pCi/g so the equivalent masses in mg/kg values are even smaller. Therefore, at either soil levels or MCL levels, the masses of most radionuclides are extremely small values.
Background Information on Using Mass
One important issue associated with using mass to characterize the quantities of radioactive material in the environment is that many elements, such as uranium, have several isotopes of the same element. It is important to recognize that different isotopes will or may have different amounts or types of radioactivity. This will affect specific isotope radio-toxicity and potential risk. For example, if one were to perform atomic absorption analysis of a water sample, and it revealed the
B-12
presences of I mg/kg of uranium234U, or 235U, there would be no way of knowing how much uranium in the sample was238U, or 234U or 235U, all of which are present in the environment naturally and due to anthropogenic activities. The potential public health and environmental impact of a given concentration of uranium in the environment will depend on the specific isotopes of uranium that are present, which could vary considerably depending on whether we are dealing with naturally occurring uranium or uranium that may have been enriched in 235U as part of the uranium fuel cycle or as part of weapons production. It is also important to note that the same mass of each uranium isotope has significantly different levels of radioactivity. A mass of 1 mg/kg of 238U (1 mg of 238U in 1 kg of soil) has an activity of 0.33 pCi/g of 238U. The same mass of 235U (1 mg of 235U in 1 kg of soil) has an activity of 2.1 pCi/g of 235U and 1mg/kg of 234U has an activity of 6,200 pCi/g of 234U.
Also, many radioactive elements are present in the environment along with their stable counterpart. One example is potassium, which is naturally-occurring in the environment, ranging from 0.1 to 1% in limestone to 3.5% in granite. In addition, a typical 70 kg adult contains 130 g of potassium. A very small fraction (0.01%) of this potassium is the naturally-occurring radioactive isotope 40K. If one were to measure the amount of 40K in soil and assume that 40K made up all of the elemental potassium, the mass of the elemental potassium would be underestimated by 10,000 fold.
The potential adverse effects of radioactive material are due to its disintegration rate. Measurement of the mass of a given element present (which usually includes all isotopes, stable and non stable isotopes of that element) may not accurately present the amount of radioactive isotope or isotopes of that given element are present. Therefore, its potential radio-toxicity and health risk may be greatly overestimated or underestimated.
Use of Mass in Remediation and Technology Selection
The measurement of the radioactivity present often will be a misrepresentation of the total mass of the given element and should not be used alone to calculate the treatment required for remediation technologies, since technologies are essentially chemical /physical. Doing so may underestimate the total mass of the given element and lead to errors in the amount of treatment or reactants required for remediation since technologies are chemically/physically based. For example, to design and implement a subsurface Permeable Reaction Wall for the uranium isotopes described above, it would be necessary to know the total mass of the uranium isotopes as well as the other aqueous reactive elements to calculate the equivalent amounts of sorption or precipitation reactants that would be required to remove or reduce the aqueous uranium species from contaminated groundwater (EPA 2000a & EPA 1999a). The same considerations would be necessary for other groundwater or water treatment technologies for dissolved concentrations of elements and their isotopic forms. For example in a pump and treat groundwater extraction system that utilizes ion exchange (chemical separation) or reverse osmosis (physical separation), chemical mass measurements would be used to determine the amount and type of reactants materials, exchange capacity and effectiveness (EPA 1996). Much the same can be said for mobility limiting or mobility reduction technologies such as chemical solidification /stabilization treatability studies or treatments (EPA, 2000b). Also, mass measurements are important in the determination of partition coefficients, Kd values that are essential in fate and transport, risk assessment modeling, and remediation calculation. Kd values are expressed in mass units for the inorganic element and isotopes (EPA 1999b). Partition coefficients, Kd values, are the same value for all forms of the element and isotopes.
In summary, given that risk of exposure is the basis for remedial actions, mass measurements are often required for determinng, designing and selecting a remediation technology. This contrasts with the need for radiation specific isotopic measurements required in risk and exposure analysis. Users should note the different applications and perspectives with their corresponding measurements units of mass and activity.
B-13
References
U.S. EPA. 1996. Technology Screening Guide for Radioactively-Contaminated Site. EPA-402-R-96/017. Office of Radiation and Indoor Air, Washington, DC.
U.S. EPA. 2000. Field Demonstration of Permeable Reactive Barriers to Remove Dissolved Uranium From Groundwater, Fry Canyon, Utah, September 1997 through Septermber 1998, Interim Report. EPA 402-C-00-001. Office of Radiation and Indoor Air, Washington, DC.
U.S. EPA. 1996b. Understanding Variation inPartition coefficient, Kd, Values. Volume 1 & 2. EPA-402-R-99-004A PB2000 108438 and EPA-402-R-99-004A PB2000 108439. Office of Radiation and Indoor Air, Washington, DC.
U.S. EPA. 2000a. In Situ Permeable Reactive Barriers: Application and Deployment. Training Manual. EPA-542-B-00-001/ Office of Solid Waste and Emergency Response, Washington, DC.
U.S. EPA. 2000b. Testing Stabilzation/Solidification Processes for Mixed Wasste. EPA-402-R-00-008. Office of Radiation and Indoor Air, Washington, DC.
B-14
THIS PAGE INTENTIONALLY LEFT BLANK
APPENDIX C
SUGGESTED READING LIST

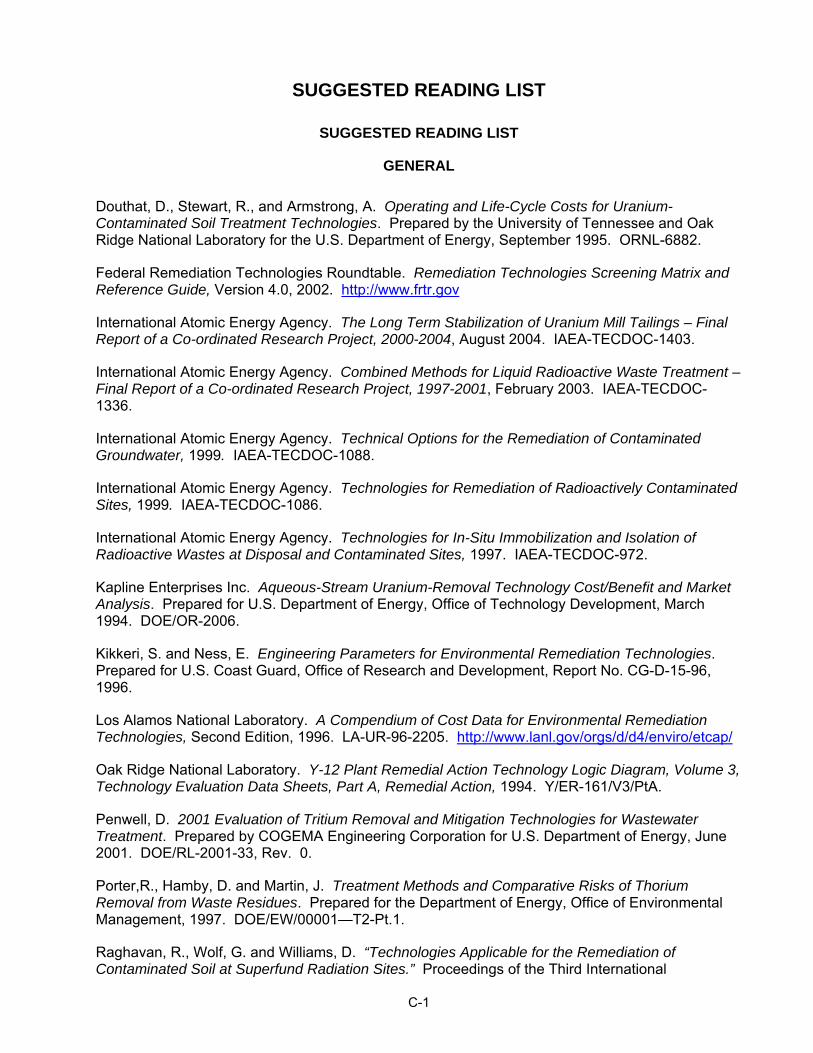
C-1
SUGGESTED READING LIST
SUGGESTED READING LIST
GENERAL
Douthat, D., Stewart, R., and Armstrong, A. Operating and Life-Cycle Costs for Uranium-Contaminated Soil Treatment Technologies. Prepared by the University of Tennessee and Oak Ridge National Laboratory for the U.S. Department of Energy, September 1995. ORNL-6882.
Federal Remediation Technologies Roundtable. Remediation Technologies Screening Matrix and Reference Guide, Version 4.0, 2002. http://www.frtr.gov
International Atomic Energy Agency. The Long Term Stabilization of Uranium Mill Tailings – Final Report of a Co-ordinated Research Project, 2000-2004, August 2004. IAEA-TECDOC-1403.
International Atomic Energy Agency. Combined Methods for Liquid Radioactive Waste Treatment – Final Report of a Co-ordinated Research Project, 1997-2001, February 2003. IAEA-TECDOC-1336.
International Atomic Energy Agency. Technical Options for the Remediation of Contaminated Groundwater, 1999. IAEA-TECDOC-1088.
International Atomic Energy Agency. Technologies for Remediation of Radioactively Contaminated Sites, 1999. IAEA-TECDOC-1086.
International Atomic Energy Agency. Technologies for In-Situ Immobilization and Isolation of Radioactive Wastes at Disposal and Contaminated Sites, 1997. IAEA-TECDOC-972.
Kapline Enterprises Inc. Aqueous-Stream Uranium-Removal Technology Cost/Benefit and Market Analysis. Prepared for U.S. Department of Energy, Office of Technology Development, March 1994. DOE/OR-2006.
Kikkeri, S. and Ness, E. Engineering Parameters for Environmental Remediation Technologies. Prepared for U.S. Coast Guard, Office of Research and Development, Report No. CG-D-15-96, 1996.
Los Alamos National Laboratory. A Compendium of Cost Data for Environmental Remediation Technologies, Second Edition, 1996. LA-UR-96-2205. http://www.lanl.gov/orgs/d/d4/enviro/etcap/
Oak Ridge National Laboratory. Y-12 Plant Remedial Action Technology Logic Diagram, Volume 3, Technology Evaluation Data Sheets, Part A, Remedial Action, 1994. Y/ER-161/V3/PtA.
Penwell, D. 2001 Evaluation of Tritium Removal and Mitigation Technologies for Wastewater Treatment. Prepared by COGEMA Engineering Corporation for U.S. Department of Energy, June 2001. DOE/RL-2001-33, Rev. 0.
Porter,R., Hamby, D. and Martin, J. Treatment Methods and Comparative Risks of Thorium Removal from Waste Residues. Prepared for the Department of Energy, Office of Environmental Management, 1997. DOE/EW/00001—T2-Pt.1.
Raghavan, R., Wolf, G. and Williams, D. “Technologies Applicable for the Remediation of Contaminated Soil at Superfund Radiation Sites.” Proceedings of the Third International
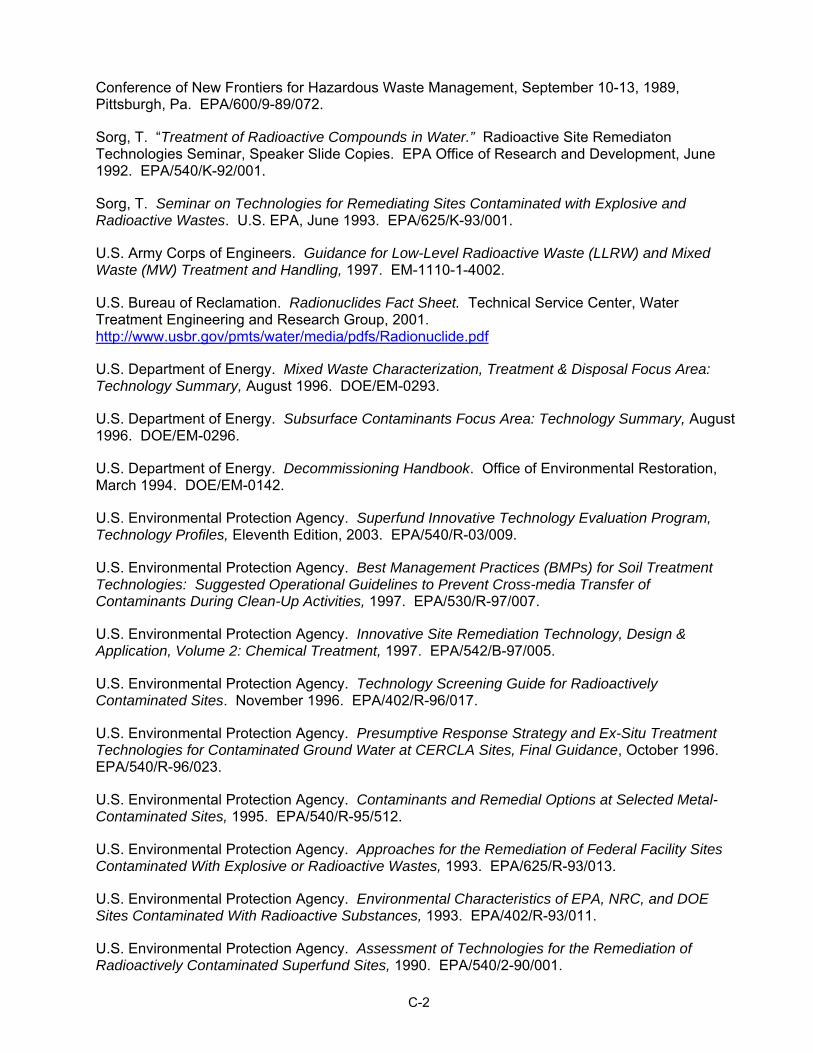
C-2
Conference of New Frontiers for Hazardous Waste Management, September 10-13, 1989, Pittsburgh, Pa. EPA/600/9-89/072.
Sorg, T. “Treatment of Radioactive Compounds in Water.” Radioactive Site Remediaton Technologies Seminar, Speaker Slide Copies. EPA Office of Research and Development, June 1992. EPA/540/K-92/001.
Sorg, T. Seminar on Technologies for Remediating Sites Contaminated with Explosive and Radioactive Wastes. U.S. EPA, June 1993. EPA/625/K-93/001.
U.S. Army Corps of Engineers. Guidance for Low-Level Radioactive Waste (LLRW) and Mixed Waste (MW) Treatment and Handling, 1997. EM-1110-1-4002.
U.S. Bureau of Reclamation. Radionuclides Fact Sheet. Technical Service Center, Water Treatment Engineering and Research Group, 2001. http://www.usbr.gov/pmts/water/media/pdfs/Radionuclide.pdf
U.S. Department of Energy. Mixed Waste Characterization, Treatment & Disposal Focus Area: Technology Summary, August 1996. DOE/EM-0293.
U.S. Department of Energy. Subsurface Contaminants Focus Area: Technology Summary, August 1996. DOE/EM-0296.
U.S. Department of Energy. Decommissioning Handbook. Office of Environmental Restoration, March 1994. DOE/EM-0142.
U.S. Environmental Protection Agency. Superfund Innovative Technology Evaluation Program, Technology Profiles, Eleventh Edition, 2003. EPA/540/R-03/009.
U.S. Environmental Protection Agency. Best Management Practices (BMPs) for Soil Treatment Technologies: Suggested Operational Guidelines to Prevent Cross-media Transfer of Contaminants During Clean-Up Activities, 1997. EPA/530/R-97/007.
U.S. Environmental Protection Agency. Innovative Site Remediation Technology, Design & Application, Volume 2: Chemical Treatment, 1997. EPA/542/B-97/005.
U.S. Environmental Protection Agency. Technology Screening Guide for Radioactively Contaminated Sites. November 1996. EPA/402/R-96/017.
U.S. Environmental Protection Agency. Presumptive Response Strategy and Ex-Situ Treatment Technologies for Contaminated Ground Water at CERCLA Sites, Final Guidance, October 1996. EPA/540/R-96/023.
U.S. Environmental Protection Agency. Contaminants and Remedial Options at Selected Metal-Contaminated Sites, 1995. EPA/540/R-95/512.
U.S. Environmental Protection Agency. Approaches for the Remediation of Federal Facility Sites Contaminated With Explosive or Radioactive Wastes, 1993. EPA/625/R-93/013.
U.S. Environmental Protection Agency. Environmental Characteristics of EPA, NRC, and DOE Sites Contaminated With Radioactive Substances, 1993. EPA/402/R-93/011.
U.S. Environmental Protection Agency. Assessment of Technologies for the Remediation of Radioactively Contaminated Superfund Sites, 1990. EPA/540/2-90/001.
C-3
U.S. Environmental Protection Agency. Technological Approaches to the Cleanup of Radiologically Contaminated Superfund Sites, 1988. EPA/540/2-88/002.
U.S. Naval Facilities Engineering Command. Remediation Technologies for Typical Contaminants and Media Types at Navy Sites, 1997. http://enviro.nfesc.navy.mil/erb/erb_a/restoration/technologies/sel_tools/shortlist/matrix.html
CONTAINMENT TECHNOLOGIES
CAPPING
Federal Remediation Technologies Roundtable. Remediation Technologies Screening Matrix and Reference Guide, Version 4.0: Landfill Cap, 2002. http://www.frtr.gov/matrix2/section4/4-27.html
Frobel, R. “Geomembranes in Surface Barriers.” Barrier Technologies for Environmental Management: Summary of a Workshop. National Academies Press, Washington, DC., pp. D71-D78, 1995.
Oak Ridge National Laboratory. “Natural, Physical, and Biological Processes Compromise the Long Term Performance of Compacted Soil Caps”. Environmental Restoration Conference, 1995.
U.S. Department of Energy. Innovative Technology Summary Report: Alternative Landfill Cover, 2000. DOE/EM-0558.
U.S. Environmental Protection Agency. Evaluation of Subsurface Engineered Barriers at Waste Sites, 1998. EPA/542/R-98/005.
U.S. Environmental Protection Agency. Engineering Bulletin: Landfill Covers, 1993. EPA/540/S-93/500.
Westinghouse Savannah River Company. Economic Evaluation of Closure CAP Barrier Materials, Volume I and Volume II, 1993. WSRC-RP-93-0878, Rev.1.
LAND ENCAPSULATION
Dwyer, B. Demonstration of Close-Coupled Barriers for Subsurface Containment of Buried Waste. Sandia National Laboratory, Albuquerque, N.M., 1997. SAND97-1193.
Federal Remediation Technologies Roundtable. Remediation Technologies Screening Matrix and Reference Guide, Version 4.0: Excavation, Retrieval, and Off-Site, 2002. http://www.frtr.gov/matrix2/section4/4-29.html
Heiser, J. and Dwyer, B. Summary Report on Close-Coupled Subsurface Barrier Technology, Initial Field Trials to Full-Scale Demonstration. Brookhaven National Laboratory, Upton, N.Y., 1997. BNL-52531.
U.S. Department of Energy. Cost and Performance Report, Pit 6 Landfill Operable Unit, Lawrence Livermore National Laboratory Site 300, 1997. UCRL-AR-128480.
U.S. Nuclear Regulatory Commission. 10CFR 61.51 – Disposal Site Design for Land Disposal. U.S Government Printing Office, Washington, DC, 2004
C-4
CRYOGENIC BARRIERS
Arctic Foundations Inc. Cryogenic Barrier Demonstration Project, Final Report, March 2000. DOE Office of Scientific and Technical Information ID No. 760626.
Fremond, M. “Ground Freezing 94.” Proceedings of the Seventh International Symposium on Ground Freezing, Nancy, France, 1994.
U.S. Department of Energy. Innovative Technology Summary Report: Frozen Soil Barrier, 1999. DOE/EM-0483.
U.S. Department of Energy. Innovative Technology Summary Report: Frozen Soil Barrier Technology, 1995. DOE/EM-0273.
U.S. Environmental Protection Agency. SITE Technology Capsule: Artic Foundations Inc., Freeze Barrier System, 2004. EPA/540/R-03/508a.
VERTICAL BARRIERS
Federal Remediation Technologies Roundtable. Remediation Technologies Screening Matrix and Reference Guide, Version 4.0: Physical Barriers, 2002. http://www.frtr.gov/matrix2/section4/4-53.html
Gerber, M. and Fayer, M. In-situ Remediation Integrated Program: Evaluation and Assessment of Containment Technology. Prepared by Pacific Northwest Laboratory for U.S. DOE, 1994. DOE-EM-0201.
Heiser, J. and Dwyer, B. Summary Report on Close-Coupled Subsurface Barrier Technology, Initial Field Trials to Full-Scale Demonstration. Brookhaven National Laboratory, Upton, N.Y., 1997. BNL-52531.
International Atomic Energy Agency. Performance of Engineered Barrier Materials in Near Surface Disposal Facilities for Radioactive Wastes, 2001. IAEA-TECDOC-1255.
International Atomic Energy Agency. Technologies for In-Situ Immobilization and Isolation of Radioactive Wastes at Disposal and Contaminated Sites, 1997. IAEA-TECDOC-972.
Nicholson, P., Jasperse, B., and Fisher, M. “Economic Alternatives for Containment Barriers.” Proceedings of the International Containment Technology Conference, St. Petersburg, Fla., February 1997.
Siskind, B. and Heiser, J. Regulatory Issues and Assumptions Associated with Barriers in the Vadose Zone Surrounding Buried Waste. Brookhaven National Laboratory, Upton, N.Y., 1993. BNL-48749.
U.S. Army Corps of Engineers. Grouting Technology, 1984. EM-1110-2-3506.
U.S. Department of Energy. Innovative Technology Summary Report: Cement Bentonite Thin Diaphragm Wall, 2000. DOE/EM-0551.
U.S. Environmental Protection Agency. Evaluation of Subsurface Engineered Barriers at Waste Sites, 1998. EPA/542/R-98/005.
C-5
U.S. Environmental Protection Agency. Engineering Bulletin: Slurry Walls, 1992. EPA/540/S-92/008.
SOLIDIFICATION/STABILIZATION TECHNOLOGIES
CEMENT SOLIDIFICATION/STABILIZATION
American National Standards Institute/American Nuclear Society. Measurement of the Leachability of Solidified Low-Level Radioactive Waste by a Short-Term Procedure, 2003. ANSI/ANS 16.1-2003.
Dwyer, B., Heiser, J., and Gilbert, J. Demonstration of In-Situ Stabilization of Buried Waste at Pit G-11 at the Brookhaven National Laboratory Glass Pits Disposal Site. Sandia National Laboratories, 1999. SAND98-2842.
Federal Remediation Technologies Roundtable. Remediation Technologies Screening Matrix and Reference Guide, Version 4.0: Solidification/Stabilization (Ex-Situ), 2002. http://www.frtr.gov/matrix2/section4/4-21.html
Federal Remediation Technologies Roundtable. Remediation Technologies Screening Matrix and Reference Guide, Version 4.0: Solidification/Stabilization (In-Situ), 2002. http://www.frtr.gov/matrix2/section4/4-8.html
Long, J., Huff, D., and Naudts, A. “A Case Study – Using a Multi-Grout Barrier to Control 90Sr Release at ORNL.” Proceedings of the International Containment Technology Conference, St. Petersburg, Fla., February, 1997.
Loomis, G. and Farnsworth, R. “Field Application of Innovative Grouting Agents for In-Situ Stabilization of Buried Waste Sites.” Proceedings of the International Containment Technology Conference, St. Petersburg, Fla., February, 1997.
Nakagawa, P. Soil Stabilization/Solidification Grout Mix Design Study for the C-, K-, L-, and P-Reactor Seepage Basins Closure Final Report. Westinghouse Savannah River Company, Savannah River Site, 1999. WSRC-RP-99-4075, Rev. 1.
U.S. Department of Energy. Innovative Technology Summary Report: Stabilization Using Phosphate Bonded Ceramics, 1999. DOE/EM-0486.
U.S. Environmental Protection Agency. Innovative Site Remediation Technology, Design & Application, Volume 4: Stabilization/Solidification, 1997. EPA/542/B-97/007.
U.S. Environmental Protection Agency. Engineering Bulletin: Solidification/Stabilization of Organics and Inorganics, 1993. EPA/540/S-92/015.
U.S. Environmental Protection Agency. Superfund Innovative Technology Evaluation Program: International Waste Technologies/Geo-Con In-situ Stabilization/Solidification, Applications Analysis Report, 1990. EPA/540/A5-89/004.
C-6
CHEMICAL SOLIDIFICATION/STABILIZATION
Federal Remediation Technologies Roundtable. Remediation Technologies Screening Matrix and Reference Guide, Version 4.0: Solidification/Stabilization (Ex-Situ), 2002. http://www.frtr.gov/matrix2/section4/4-21.html
Federal Remediation Technologies Roundtable. Remediation Technologies Screening Matrix and Reference Guide, Version 4.0: Solidification/Stabilization (In-Situ), 2002. http://www.frtr.gov/matrix2/section4/4-8.html
Heiser, J. and Milian, L. Laboratory Evaluation of Performance and Durability of Polymer Grouts for Subsurface Hydraulic/Diffusion Barriers. Brookhaven National Laboratory, Upton, N.Y., 1994. BNL-61292.
International Atomic Energy Agency. Technologies for In-Situ Immobilization and Isolation of Radioactive Wastes at Disposal and Contaminated Sites, 1997. IAEA-TECDOC-972.
Kalb, P. “Polyethylene Encapsulation.” Hazardous and Radioactive Waste Treatment Technologies Handbook, Oh, C., Ed. CRC Press, Boca Raton, Fla., 2001. BNL-68581.
Kalb, P. “Sulfur Polymer Encapsulation.” Hazardous and Radioactive Waste Treatment Technologies Handbook, Oh, C., Ed. CRC Press, Boca Raton, Fla., 2001. BNL-68585.
Kalb, P., Adams, J., and Milian, L. Sulfur Polymer Stabilization/Solidification (SPSS) Treatment of Mixed-Waste Mercury Recovered from Environmental Restoration Activities at BNL. Brookhaven National Laboratory, Upton, N.Y., 2001. BNL-52614.
U.S. Department of Energy. Innovative Technology Summary Report: Polyethylene Macroencapsulation, 1998. OST Reference # 30.
U.S. Environmental Protection Agency. Innovative Site Remediation Technology, Design & Application, Volume 4: Stabilization/Solidification, 1997. EPA/542/B-97/007.
U.S. Environmental Protection Agency. Innovative Site Remediation Technology, Volume 4: Stabilization/Solidification, 1994. EPA/542/B-94/001.
U.S. Environmental Protection Agency. Engineering Bulletin: Solidification/Stabilization of Organics and Inorganics, 1993. EPA/540/S-92/015.
CHEMICAL SEPARATION TECHNOLOGIES
SOLVENT/CHEMICAL EXTRACTION
Atomic Energy of Canada Ltd. Soil Treatment to Remove Uranium and Related Mixed Radioactive Contaminants, Final Report, September 1992 – October 1995. Prepared for the U.S. Department of Energy, 1996. DOE/MC/28245—5291.
Federal Remediation Technologies Roundtable. Remediation Technologies Screening Matrix and Reference Guide, Version 4.0: Chemical Extraction, 2002. http://www.frtr.gov/matrix2/section4/4-15.html
C-7
Kulpa, J. and Hughes, H. “Deployment of Chemical Extraction Soil Treatment on Uranium Contaminated Soil.” Presented at: The Annual International Conference on Soils, Sediments and Water, University of Massachusetts, Amherst, Massachusetts, October, 2001.
Los Alamos National Laboratory. Los Alamos National Laboratory, Environmental Science and Technology Program, Environmental Problem-Solving Through Science and Technology Website: Remediation of Uranium Contaminated Soils, 2003. http://www-emtd.lanl.gov/TD/Remediation/RemediationOfUraniumSoils.html
U.S. Department of Energy. Cost and Performance Report, Chemical Extraction for Uranium Contaminated Soil, RMI Titanium Company Extrusion Plant, Ashtabula, Ohio. Innovative Treatment Remediation Demonstration. U.S. DOE, July 1998.
U.S. Department of Energy. Effective Separation and Processing Integrated Program (ESP-IP), 1994. DOE/EM-0126P.
U.S. Environmental Protection Agency. Emerging Technology Summary: Acid Extraction Treatment System for Treatment of Metal Contaminated Soils, 1994. EPS/540/SR-94/513.
ION EXCHANGE
Federal Remediation Technologies Roundtable. Remediation Technologies Screening Matrix and Reference Guide, Version 4.0:Ion Exchange, 2002. http://www.frtr.gov/matrix2/section4/4-49.html
Fryxell, G. Final Report: Actinide-Specific Interfacial Chemistry of Monolayer Coated Mesoporous Ceramics. Prepared by Pacific Northwest National Laboratory for U.S. Department of Energy, Report No. EMSP-65370, September 2001.
Jeppson, D., Collins, G., Furlong, L., and Stockinger, S. “Separation of Tritium From Wastewater”. Presented at: Waste Management 2000 Conference, February 27 - March 3, 2000, Tucson, Ariz. Prepared for U.S. Department of Energy, 2000. HNF-4906-FP, Rev. 0.
Oji, L., Thompson, M., Peterson, K., May, C., and Kafka, T. Cesium Removal from R-Reactor Building Disassembly Basin Using 3M® Empore Web-Membrane Filter Technology. Prepared by Westinghouse Savannah River Company for U.S. Department of Energy, 1998. WSRC-TR-98-00209.
Serkiz, S., Rebout, S., Bell, N., Kanzleiter, J., Bohrer, S., Lovekamp, J., and Faulk, G. Reengineering Water Treatment Units for Removal of Sr-90, I-129, Tc-99, and Uranium from Contaminated Groundwater at the DOE’s Savannah River Site. Prepared by Westinghouse Savannah River Company for U.S. Department of Energy, 2000. WSRC-MS-2000-00097.
U.S. Department of Energy. Innovative Technology Summary Report: 3M Selective Separation Cartridges. Industry Programs and Subsurface Contaminants Focus Area, 2001. DOE/EM-0606.
Water Remediation Technology. Pilot Study Report for Z-92TM Uranium Treatment Process Conducted at the Mountain Water & Sanitation District, Conifer, Colo., Revised November 11, 2004. http://www.wrtnet.com
Water Remediation Technology. Pilot Study Report for Z-88TM Radium Treatment Process Conducted at the Richland Special Utility District Richland Springs, Texas, May 18, 2004. http://www.wrtnet.com
C-8
CHEMICAL PRECIPITATION
Federal Remediation Technologies Roundtable. Remediation Technologies Screening Matrix and Reference Guide, Version 4.0: Precipitation/Coagulation/ Flocculation, 2002. http://www.frtr.gov/matrix2/section4/4-50.html
Serkiz. S., Rebout, S., Bell, N., Kanzleiter, J., Bohrer, S., Lovekamp, J., and Faulk, G. Reengineering Water Treatment Units for Removal of Sr-90, I-129, Tc-99, and Uranium from Contaminated Groundwater at the DOE’s Savannah River Site. Prepared by Westinghouse Savannah River Company for U.S. Department of Energy, 2000. WSRC-MS-2000-00097.
Sorg, T. “Treatment of Radioactive Compounds in Water.” Radioactive Site Remediaton Technologies Seminar, Speaker Slide Copies. EPA Office of Research and Development, June 1992. EPA/540/K-92/001.
Sorg, T. “Methods for Removing Uranium From Drinking Water.” Journal of the American Water Works Association, July 1988. 80(7):105-111.
U.S. Bureau of Reclamation. Radionuclides Fact Sheet. Technical Service Center, Water Treatment Engineering and Research Group. Denver, Colo., 2001. http://www.usbr.gov/pmts/water/media/pdfs/Radionuclide.pdf
PERMEABLE REACTIVE BARRIERS
Barton, W., Craig, P., and Stone, W. “Two Passive Groundwater Treatment Installations at DOE Facilities.” Proceedings of: International Containment Technology Conference, February 9-12, 1997, St. Peterburg, Fla.
Dwyer, B. Design, Construction and Monitoring of a Permeable Reactive Barrier Technology for Use at Rocky Flats Environmental Technology Site (RFETS). Prepared by Sandia National Laboratories for the U.S. DOE, November 2000. Sandia Report SAND2000-2702.
Federal Remediation Technologies Roundtable. Remediation Technologies Screening Matrix and Reference Guide, Version 4.0: Passive/Reactive Treatment Walls, 2002. http://www.frtr.gov/matrix2/section4/4-41.html
Federal Remediation Technologies Roundtable. Evaluation of Permeable Reactive Barrier Performance, Revised Report, December 2002. http://www.frtr.gov/pdf/2-prb_performance.pdf
Holdsworth, T. “Iron Reactive Barrier Used at Rock Flats Site.” Ground Water Currents, Issue No. 39, U.S. EPA, April 2001. EPA/542/N-01/005.
Korte, N. Zero-Valent Iron Permeable Reactive Barriers: A Review of Performance. Prepared by Oak Ridge National Laboratory for the U.S. DOE, April 2001. ORNL/TM-2000/345.
Remediation Technologies Development Forum. Rocky Flats Environmental Technology Site (Mound Site), Golden, Colo. Permeable Barriers Action Team, Permeable Reactive Barrier Installation Profiles, 2001. http://www.rtdf.org.public/permbarr/prbsumms/profile.cfm?mid=85
Remediation Technologies Development Forum. Rocky Flats Environmental Technology Site (Solar Ponds Plume), Golden, Colo. Permeable Barriers Action Team, Permeable Reactive Barrier Installation Profiles, 2001. http://www.rtdf.org.public/permbarr/prbsumms/profile.cfm?mid=87
U.S. Department of Energy. Innovative Technology Summary Report: Permeable Reactive
C-9
Treatment (PeRT) Wall for Rads and Metals. Subsurface Contaminants Focus Area, September 2000. DOE/EM-0557.
U.S. Department of Energy. Innovative Technology Summary Report: Passive Reactive Barrier. Subsurface Contaminants Focus Area, March 2002. DOE/EM-0623.
U.S. Environmental Protection Agency. “Evaluating Performance of the Monticello PRB in Treating Uranium and Metals.” Technology News and Trends, July 2003. EPA CLU-IN Newsletter. http://clu-in.org
U.S. Environmental Protection Agency. Cost and Performance Report – Permeable Reactive Barriers Interim Summary Report: Permeable Reactive Barriers Using Continuous Walls to Treat Metals, May 2002. Office of Solid Waste and Emergency Response, Technology Innovation Office.
U.S. Environmental Protection Agency. Field Demonstration of Permeable Reactive Barriers to Remove Dissolved Uranium From Groundwater, Fry Canyon, Utah, September 1997 through September 1998, Interim Report. Office of Air and Radiation, November 2000. EPA/402/C-00/001.
U.S. Environmental Protection Agency. Permeable Reactive Barrier Technologies for Contaminant Remediation. Office of Research and Development, Office of Solid Waste and Emergency Response, September 1998. EPA/600/R-98/125.
U.S. Naval Facilities Engineering Command. Tech Data Sheet: Advances in Permeable Reactive Barrier Technologies, August 2002. Washington, DC. NFESC TDS-2089-ENV.
Vidic, R. Permeable Reactive Barrier: Case Study Review. Ground-Water Remediation Technologies Analysis Center, November 2001. Technology Evaluation Report TE-01-01.
Wilkin, R. and Puls, R. Capstone Report on the Application, Monitoring, and Performance of Permeable Reactive Barriers for Ground-Water Remediation: Volume 1 – Performance Evaluations at Two Sites. U.S. EPA, National Risk Management Research Laboratory, August 2003. EPA/600/R-03/045a.
PHYSICAL SEPARATION TECHNOLOGIES
DRY SOIL SEPARATION
Defense Nuclear Agency. Johnston Atoll Plutonium Cleanup Project, Contract Bridge Report. Contract DNA-001-90-C-0119, April 1995. DNA-TR-93-169.
Federal Remediation Technologies Roundtable. Remediation Technologies Screening Matrix and Reference Guide, Version 4.0: Separation, 2002. http://www.frtr.gov/matrix2/section4/4-18.html
U.S. Department of Energy. Cost and Performance Report: ThermoRetech’s Segmented Gate System, Brookhaven National Laboratory, Area of Concern 16, Suffolk County, N.Y. Prepared by Sandia National Laboratories, February 2001.
U.S. Department of Energy. Cost and Performance Report: Thermo Nutech’s Segmented Gate System, Los Alamos National Laboratory, Technical Area 33, Los Alamos, N.M. Prepared by Sandia National Laboratories, November 1999.
C-10
U.S. Department of Energy. Cost and Performance Report: Thermo NUtech’s Segmented Gate System, Pantex Plant, Firing Site 5, Amarillo, Texas. Prepared by Sandia National Laboratories, March 1999.
U.S. Department of Energy. Cost and Performance Report: Thermo NUtech’s Segmented Gate System, Sandia National Laboratories, ER Site 16, Albuquerque, N.M. Prepared by Sandia National Laboratories, January 1999.
U.S. Department of Energy. Cost and Performance Report: Thermo NUtech’s Segmented Gate System, Tonapah Test Range, Clean Slate 2, Tonapah, Nev. Prepared by Sandia National Laboratories. July 1999.
U.S. Department of Energy. Cost and Performance Report: Thermo NUtech’s Segmented Gate System, Idaho National Engineering and Environmental Laboratory, Auxiliary Reactor Area-23, Idaho Falls, Idaho. Prepared by Sandia National Laboratories, November 1999.
U.S. Department of Energy. Technology Deployment: Segmented Gate System (SGS). Accelerated Site Technology Deployment Program, August 1998.
SOIL WASHING
Argonne National Laboratory. Soil Washing as a Potential Remediation Technology for Contaminated DOE Sites, March 1993. DE93-009205.
Fristad, W. and Jones, C. “Soil Washing and TerrametTM Lead Leaching/Recovery Process at the Twin Cities Army Ammunition Plant.” Proceedings of the Fifth Forum on Innovative Hazardous Waste Treatment Technologies: Domestic and International. U.S. EPA, May 3-5, 1994, Chicago, Ill. EPA/540/R-94/503.
Interstate Technology and Regulatory Council. Technical and Regulatory Guidelines for Soil Washing, December 1997. http://www.itrcweb.org/
Oak Ridge National Laboratory. Soil Washing for Volume Reduction. Technology Oak Ridge National Laboratory. Soil Washing for Volume Reduction. Technology Demonstration Summary, 1995. http://mfnl.xjtu.edu.cn/gov-doe-ornl/K25/techdemo/soilwash.htm
Speckin, P., Tool, A., Skryness, R., Connelly, D., Marquis, B., and Mendonca, M. “Pilot Demonstration for Radiological Waste Volume Reduction.” Presented at: USACE Environmental Development Workshop, April 16 – 20, 2001, Portland, Ore.
Suer, A. Soil Washing Technology Evaluation. Westinghouse Savannah River Company, April 1995. WSRC-TR-95-0183.
U.S. Department of Energy. Innovative Technology Summary Report: Mobilization, Extraction, and Removal of Radionuclides, 2001a. DOE/EM-0559.
U.S. Department of Energy. Results of a Soil Washing Demonstration Project for Low-Level Radioactively Contaminated Soil, 1996. DOE/OR/21949-404.
U.S. Environmental Protection Agency. Innovative Site Remediation Technology, Design & Application, Volume 3: Liquid Extraction Technologies, May 1998. EPA/542/B-97/006.
U.S. Environmental Protection Agency. Guide for Conducting Treatability Studies Under CERCLA: Soil Washing – Quick Reference Fact Sheet, 1991. EPA/540/2-91/020B.
C-11
United Kingdom Atomic Energy Agency. The Technology of Decommissioning and Liabilities Management, Site Investigation, Remediation and Restoration: Rock and Soil Washing Trials. Webpage publication, 2004. http://www.ukaea.org.uk/reports/tdecomm/Tech_rock-soil.pdf
FLOTATION
Misra, M., Mehta, R. and Lan, P. Remediation of Radium from Contaminated Soil. University of Nevada, Reno. Prepared for U.S. EPA National Risk Management Research Laboratory, December 2001. EPA/600/R-01/099.
Organization for Economic Cooperation and Development. Uranium Extraction Technology, 1983. OECD, Paris.
Ralcevic, D. “Decontamination of Elliot Lake Tailings.” CIM Bulletin 72(808), pp. 109-115, 1979.
U.S. Department of Energy. Proceedings from the Remediation of Radioactive Surface Soils Workshop, August 14-15, 2001, Las Vegas, Nev. Hosted by U.S. DOE National Nuclear Security Administration, Nevada Operations Office, 2001. DOE/NV-798.
MEMBRANE FILTRATION
Clifford, D., Vijjeswarapu, W., and Subramoniuan, S. “Evaluating Various Adsorbents and Membranes for Removing Radium from Groundwater.” Journal of the American Water Works Association. 80(7):94-104, July 1988.
Dow Chemical Company. Nanofiltration for Municipal Water Treatment, September 26, 2000. Dow Chemical website. http://www.dow.com/liquidseps/news/NF-Backgrounder.htm
Stepan, D., Moe, T., and Collings, M. Task 9 – Centrifugal Membrane Filtration, Semi-Annual Report, April 1 – September 30, 1996. Prepared by Energy and Environmental Research Center, University of North Dakota, for the U.S. Department of Energy, 1996. DOE/MC/31388 – 5500.
U.S. Environmental Protection Agency. “Atomic Energy of Canada, Limited (Chemical Treatment and Ultrafiltration).” Superfund Innovative Technology Evaluation Program, Technology Profiles, Tenth Edition, August 2000. EPA/540/C-99/500.
U.S. Environmental Protection Agency. Applications Analysis Report: E.I. DuPont De Nemours & Company/Oberlin Filter Company Microfiltration Technology, October 1991. EPA/540/A5-90/007.
CARBON ADSORPTION
Federal Remediation Technologies Roundtable. Remediation Technologies Screening Matrix and Reference Guide, Version 4.0: Adsoprtion/Absorption, 2002. http://www.frtr.gov/matrix2/section4/4-44.html
Federal Remediation Technologies Roundtable. Remediation Technologies Screening Matrix and Reference Guide, Version 4.0: Granulated Activated Carbon (GAC)/Liquid Phase Carbon Adsoprtion, 2002. http://www.frtr.gov/matrix2/section4/4-47.html
Patel, R. and Clifford, D. Project Summary: Radium Removal from Water by Manganese Dioxide Adsorption and Diatomaceous Earth Filtration. Prepared for U.S. EPA, March 1992. EPA/600/S2-91/063.
C-12
U.S. Environmental Protection Agency. A Citizen’s Guide to Activated Carbon Treatment, December 2001. EPA/542/F-01/020.
AERATION
Civardi, J. and DeWitt, C. “Township Project Tackles High Radon Levels.” WaterWorld, Volume 20, Issue 7, July 2004.
Kinner, N., Malley, J., Clement, J., Quern, P., Schell, G. Project Summary: Radon Removal Techniques for Small Community Public Water Supplies. Prepared for U.S. EPA, November, 1990. EPA/600/S2-90/036.
Science Applications International Corporation. Technologies and Costs for the Removal of Radon From Drinking Water. Prepared for U.S. EPA, Office of Ground Water and Drinking Water, May 1999. http://www.epa.gov/safewater/radon/techcost.pdf
USFilter. General Filter Aerators. Vendor brochure GF-AER-BR-0702, 2002. http://www.usfilter.com
VITRIFICATION TECHNOLOGIES
IN-SITU VITRIFICATION
Blundy, R. and Zionkowski, P. Final Report for the Demonstration of Plasma In-Situ Vitrification at the 904-65G K-Reactor Seepage Basin. Westinghouse Savannah River Company, December 1997. WSRC-RP-97-405, Rev. 0.
Coel-Roback, B., Lowery, P., Springer, M., Thompson, L., and Huddleston, G. “Non-Traditional In-Situ Vitrification – A Technology Demonstration at Los Alamos National Laboratory.” Presented at: Waste Management 2003 Conference, February 23 - 27, 2003, Tucson, Ariz.
Oak Ridge National Laboratory. In-Situ Vitrification Demonstration at Pit 1, Oak Ridge National Laboratory, Volume 1: Results of Treatability Study, 1997. ORNL/ER-425/V1.
U.S. Department of Energy. “In-Situ Vitrification of Contaminated Soils.” Technology Catalogue, Second Edition, April 1995. DOE/EM-0235.
U.S. Environmental Protection Agency. Geosafe Corporation In-situ Vitrification, Innovative Technology Evaluation Report, March 1995. EPA/540/R-94/520.
U.S. Environmental Protection Agency. “Geosafe Corporation (In-Situ Vitrification).” Superfund Innovative Technology Evaluation Program, Technology Profiles, Seventh Edition, November 1994. EPA/540/R-94/526.
U.S. Environmental Protection Agency. Engineering Bulletin: In-situ Vitrification Treatment, October 1994. EPA/540/S-94/504.
U.S. Environmental Protection Agency. Handbook: Vitrification Technologies for Treatment of Hazardous and Radioactive Waste, 1992. EPA/625/R-92/002.
C-13
EX-SITU VITRIFICATION
Hoffeiner, W., Chrubasik, A., and Eschenbach, R. “Volume Reduction and Vitrification of Nuclear Waste With Thermal Plasma.” Proceedings of the 1993 International Conference on Nuclear Waste Management and Environmental Remediation, Volume 3, September 5 - 11, 1993. Prague, Czech Republic.
Marra, S., O’Driscoll, R., Fellinger, T., Ray, J., Patel, P., and Occhipinti, J. DWPF Vitrification – Transition to the Second Batch of HLW Radioactive Sludge. Westinghouse Savannah River Company, 1999. WSRC-MS-99-00141.
U.S. Department of Energy. Waste Vitrification Systems Lessons Learned. Office of the Deputy Assistant Secretary for Nuclear and Facility Safety, March 1999. http://www.eh.doe.gov/ll/WasteVit.pdf
U.S. Department of Energy. Innovative Technology Summary Report: Plasma Hearth Process. Mixed Waste Focus Area, November 1998. OST Reference # 26.
U.S. Department of Energy. Innovative Technology Summary Report:Transportable Vitrification System. Mixed Waste Focus Area, September 1998. OST Reference # 222.
U.S. Environmental Protection Agency. Handbook: Vitrification Technologies for Treatment of Hazardous and Radioactive Waste, 1992. EPA/625/R-92/002.
U.S. Environmental Protection Agency. Babcock & Wilcox Cyclone Furnace Vitrification Technology, Applications Analysis Report, August 1992. EPA/540/AR-92/017.
U.S. Environmental Protection Agency. Retech Inc., Plasma Centrifugal Furnace, Applications Analysis Report, June 1992. EPA/540/A5-91/007.
Wittle, J. Waste Stabilization Using DC Graphite Arc Technology. Presentation made in Korea, March 2001. Electro-Pyrolysis Inc. Website. www.electropyrolysis.com.
BIOLOGICAL TREATMENT TECHNOLOGIES
PHYTOREMEDIATION
Brookhaven National Laboratory. Operable Unit V - Peconic River: Determination of Phytoextraction and Harvesting Efficiency of Several Dominant Emergent Wetland Plants – Contaminated Sediment in the Peconic River, Brookhaven National Laboratory, Upton, N.Y., January 17, 2003. Prepared for U.S. DOE by BNL, Environmental Management Directorate.
Comis, D. “Phytoremediation: Using Plants to Clean Up Soils.” Agricultural Research, June 2000.
Dushenkov, S., Vasudev, D., Kapulnik, Y., Gleba, D., Fleisher, D., Ting, K., and Ensley, B. “Removal of Uranium From Water Using Terrestrial Plants.” Environmental Science and Technology, 1997. Vol. 31, No.12, pp. 3468 – 3474.
Entry, J., Watrud, L., and Reeves, M. “Accumulation of 137Cs and 90Sr From Contaminated Soil by Three Grass Species Inoculated With Mycorrhizal Fungi.” Environmental Pollution, 1999. Vol. 104, Iss. 3, pp. 449 – 457.
C-14
Federal Remediation Technologies Roundtable. Remediation Technologies Screening Matrix and Reference Guide, Version 4.0: Phytoremediation, 2002. http://www.frtr.gov/matrix2/section4/4-3.html
Hitchcock, D., Rebel, K., Barton, C., Seaman, J., Riha, S., and Blake, J. “Estimating Efficiencies of Tritium Phytoremediation at the Savannah River Site.” Proceeding of The Annual International Conference on Soils, Sediments, and Water. University of Massachusetts, October 22 – 24, 2002. Phytoremediation Poster Session. http://www.umasssoils.com/posters2002/phytoremediation.htm
Huang, J., Blaylock, M., Kapulnik, Y., and Ensley, B. “Phytoremediation of Uranium-Contaminated Soils: Role of Organic Acids in Triggering Uranium Hyperaccumulation in Plants.” Environmental Science and Technology, Vol. 32, Iss. 13, pp. 2004 – 2008, 1998.
Lee, S. “Phytoremediation Application for Radionuclide Removal at Argonne National Laboratory West”. Summary of the Phytoremediation State of the Science Conference, Boston, Massachusetts, May 1-2, 2000, November 2001. EPA/625/R-01/011a.
Lewis, C. and Van Pelt, R. Natural Remediation at Savannah River Site. Prepared by Bechtel Savannah River Inc. for U.S. DOE, January, 2002. WSRC-MS-2002-00075.
Negri, M., Hinchman, R. Wozniak, J. “Capturing a ‘Mixed’ Contaminant Plume: Tritium Phytoevaporation at Argonne National Laboratory East”. Summary of the Phytoremediation State of the Science Conference, Boston, Mass., May 1-2, 2000, November 2001. EPA/625/R-01/011a.
Pivetz, B. Ground Water Issue: Phytoremediation of Contaminated Soil and Ground Water at Hazardous Waste Sites. Prepared for U.S. EPA, Office of Solid Waste and Emergency Response, February 2001. EPA/540/S-01/500.
Rock, S. “Introduction to Phytoremediation.” The Standard Handbook of Hazardous Waste Treatment and Disposal, Second Edition, 1997. H. Freeman, Editor. McGraw-Hill Inc.
Schnoor, J. Phytoremediation of Soil and Groundwater. Prepared for the Ground-Water Remediation Technologies Analysis Center, March 2002. Technology Evaluation Report TE-02-01.
U.S. Department of Energy. “Phytoremediation: Natural Attenuation That Really Works.” TIE Quarterly. Volume 6 (1), Spring 1997.
U.S. Environmental Protection Agency. Deployment of Phytotechnology in the 317/319 Area at Argonne National Laboratory-East: Innovative Technology Evaluation Report, December 2003. EPA/540/R-05/011.
U.S. Environmental Protection Agency. EPA Superfund Record of Decision: Idaho National Engineering Laboratory (USDOE), EPA ID: ID4890008952, OU 21, Idaho Falls, ID, 09/29/1998, 1998. EPA/ROD/R10-98/061.
United Kingdom Atomic Energy Authority. “Phytoremediation of Radioactively Contaminated Soils.” The Technology of Decommissioning and Liabilities Management - Site Investigation, Remediation, and Restoration, 2002. http://www.ukaea.org.uk/reports/tdecomm/Tech_phytoremediation.pdf
C-15
NATURAL ATTENUATION TECHNOLOGIES
MONITORED NATURAL ATTENUATION
Brady, P., Spalding, B., Krupka, K., Waters, R., Zhang, P., Borns, D., and Brady, W. Site Screening and Technical Guidance for Monitored Natural Attenuation at DOE Sites. Prepared for the U.S. DOE by Sandia National Laboratories, March, 1999. Sandia Report SAND99-0464.
Federal Remediation Technologies Roundtable. Remediation Technologies Screening Matrix and Reference Guide, Version 4.0: Monitored Natural Attenuation, 2002. http://www.frtr.gov/matrix2/section4/4-32.html
Krupka, K. and Martin, W. Subsurface Contaminant Focus Area: Monitored Natural Attenuation (MNA) – Programmatic, Technical, and Regulatory Issues. Prepared for U.S. DOE by Pacific Northwest National Laboratory, July 2001. PNNL-13569.
U.S. Department of Energy. Decision-Making Framework Guide for the Evaluation and Selection of Monitored Natural Attenuation Remedies at Department of Energy Sites. Office of Environmental Restoration, May 13, 1999. http://web.em.doe.gov/framework/frame.pdf
U.S. Department of Energy. Monitored Natural Attenuation Operations, Monitoring, and Maintenance Plan for Test Area North, Operable Unit 1-07B. U.S. DOE Idaho Operations Office, June 2003. DOE/ID-11066, Rev. 0.
U.S. Environmental Protection Agency. EPA Superfund Record of Decision: Weldon Spring Quarry/Plant/Pits (USDOE/Army), EPA ID: MO3210090004, OU 6, St. Charles County, MO, 02/20/2004. EPA/ROD/R07-04/036, 2004.
U.S. Environmental Protection Agency. EPA Superfund Record of Decision: Savannah River Site (USDOE), EPA ID: SC1890008989, OU 12, Aiken, S.C., 03/10/2004. EPA/ROD/R04-04/007, 2004.
U.S. Environmental Protection Agency. Use of Monitored Natural Attenuation at Superfund, RCRA Corrective Action, and Underground Storage Tank Sites. Office of Solid Waste and Emergency Response, April 1999. OSWER Directive 9200.4-17P. http://www.eh.doe.gov/oepa/guidance/rcra/mna-memo2.pdf
U.S. Environmental Protection Agency. EPA Superfund Explanation of Significant Differences: Teledyne Wah Chang, EPA ID: ORD050955848, OU 01, Albany, Ore., 10/08/1996. EPA/ESD/R10-97/082, 1997.
U.S. Environmental Protection Agency. EPA Superfund Record of Decision: Hanford 300-Area (USDOE), EPA ID: WA2890090077, OU 01, 02, Benton County, Wash., 07/17/1996. EPA/ROD/R10-96/143, 1996.
Waters, R., Brady, P., and Borns, D. “Natural Attenuation of Metals and Radionuclides – An Overview of the Sandia/DOE Approach.” Presented at: Waste Management 1998 Conference, March 1 - 5, 1998, Tucson, Ariz.
C-16
EMERGING TECHNOLOGIES
ELECTROKINETICS
Booher, W., Lindgren, E. and Brady, P. Electrokinetic Removal of Uranium from Contaminated, Unsaturated Soils. Prepared by Sandia National Laboratories for U.S. DOE, January 1997. Sandia Report SAND97-0122.
Federal Remediation Technologies Roundtable. Remediation Technologies Screening Matrix and Reference Guide, Version 4.0: Electrokinetic Separation, 2002. http://www.frtr.gov/matrix2/section4/4-4.html
Lomasney, H., SenGupta, A., and Yachmenev, V. Electrokinetic Decontamination of Concrete. Prepared for U.S. DOE, Morgantown Energy Technology Center by Isotron Corporation, 1996. DOE Paper Number DOE/MC/30162-97/C0804.
U.S. Environmental Protection Agency. Superfund Innovative Technology Evaluation (SITE) Emerging Technology Bulletin: Electrokinetic Soil Processing, Electrokinetics Inc., March 1995. EPA/540/F-95/504.
SUPER CRITICAL FLUID EXTRACTION
Fox, R. and Mincher, B. Supercritical Fluid Extraction of Plutonium and Americium from Soil. Prepared by Idaho National Engineering and Environmental Laboratory. Presented at Spectrum 2002, August 4 – 8, 2002. INEL/CON-02-00725.
Hendrickson, D., Biyani, R., Brown, C., and Teter, W. Hanford/Rocky Flats Collaboration on Development of Supercritical Carbon Dioxide Extraction to Treat Mixed Waste. Prepared by Westinghouse Hanford Company for U.S. DOE, November 1995. WHC-EP-0892.
Wai, C. “Supercritical Fluid Extraction of Radionuclides – A Green Technology for Nuclear Waste Management.” Presented at the DOE Environmental Management Science Program Symposium on Nuclear Waste Management. Session: Separations Chemistry and Technology, Paper No. 86. 226th American Chemical Society National Meeting, September 2003.
MAGNETIC SEPARATION
Papelis, C., Jacobson, R., Miller, F., and Shaulis, L. Evaluation of Technologies for Volume Reduction of Plutonium-Contaminated Soils from the Nevada Test Site. Prepared by the Desert Research Institute, University of Nevada for U.S. DOE, June 1996. DOE/NV/10845-57.
Schake, A., Avens, L., Hill, D., Padilla, D., Prenger, F., Romero, D., Tolt, T., and Worl, L. Magnetic Separation for Environmental Remediation. Prepared by Los Alamos National Laboratory for U.S. DOE, 1994. LA-UR-94-3373.
S.G. Frantz Company Inc. Separation of Particles at a Magnetic Barrier – Magnetic Separation. Vendor information/technology overview on EPA REACHIT website, 2004. http://epareachit.org.
U.S. Environmental Protection Agency. “Selentec Environmental Technologies Inc. (Selentec MAG*SEPSM Technology).” Technology Profiles, Eleventh Edition, Volume 1, Demonstration Program. Office of Research and Development, September 2003. EPA/540/R-03/501.
C-17
BACTERIAL REDUCTION
Abdelouas, A., Lutze, W., Gong, W., Nuttall, E., Strietelmeier, B., and Travis, B. “Biological Reduction of Uranium in Groundwater and Subsurface Soil.” The Science of the Total Environment, April 2000. Vol. 250, Iss. 1-3, pp 21 – 35.
Anderson, R., Vrionis, H., Ortiz-Bernad, I., Resch, C., Long, P., Dayvault, R., Karp, K., Marutzky, S., Metzler, D., Peacock, A., White, D., Lowe, M., and Lovley, D. “Stimulating the In-situ Activity of Geobacter Species to Remove Uranium from the Groundwater of a Uranium-Contaminated Aquifer.” Applied and Environmental Microbiology, October 2003. Vol. 69, No. 10, pp. 5884 – 5891.
Barkay, T. and Schaefer, J. “Metal and Radionuclide Bioremediation: Issues, Considerations and Potentials.” Current Opinion in Microbiology, 2001. Vol. 4, pp. 318 – 323.
Francis, A. Bioremediation of Uranium Contaminated Soils and Wastes. Prepared by Brookhaven National Laboratory for U.S. DOE, September 17, 1998. BNL – 65782.
Lloyd, J. and Lovley, D. “Microbial Detoxification of Metals and Radionuclides.” Current Opinion in Biotechnology, 2001. Vol. 12, pp. 248 – 253.
Lloyd, J., Sole, V., Van Praagh, C., and Lovley, D. “Direct and Fe(II)-mediated Reduction of Technetium by Fe(III)-reducing Bacteria.” Applied and Environmental Microbiology, September 2000. Vol. 66, No. 9, pp. 3743 – 3749.
U.S. Department of Energy. Bioremediation of Metals and Radionuclides - What It Is and How It Works. Second Edition. Prepared by Lawrence Berkeley National Laboratory for the U.S. DOE, Office of Biological and Environmental Research, Natural and Accelerated Bioremediation Research Program, 2003. LBNL-42595 (2003).
IN-SITU GASEOUS REDUCTION
Deng, B., Thornton, E., Cantrell, K., Olsen, K., and Amonette, J. Interfacial Reduction-Oxidation Mechanisms Governing Fate and Transport of Contaminants in the Vadose Zone. Prepared by the University of Missouri-Columbia and Pacific Northwest National Laboratory for the U.S. DOE, January 2004. DOE/ER/15011.
U.S. Department of Energy. Innovative Technology Summary Report: In-situ Gaseous Reduction System. Subsurface Contaminants Focus Area, April 2000. DOE/EM-0521.
U.S. Department of Energy. Contaminant Plumes Containment and Remediation Focus Area, Technology Summary, June 1995. Office of Environmental Management. DOE/EM-0248.

C-18
THIS PAGE INTENTIONALLY LEFT BLANK
APPENDIX D
DEFINITION OF TREATMENT

D-1
DEFINITION OF TREATMENT
Radioactive contamination can be treated by a variety of technologies. The concept of treatment is not solely dependent on whether contamination is destroyed, but can also involve removing or stabilizing the contaminant. This concept of treatment is discussed in the National Oil and Hazardous Substances Pollution Contingency Plan (NCP) under §300.5 as follows:
"Treatment technology" means any unit operation or series of unit operations that alters the composition of a hazardous substance or pollutant or contaminant through chemical, biological, or physical means so as to reduce toxicity, mobility, or volume of the contaminated materials being treated. Treatment technologies are an alternative to land disposal of hazardous wastes without treatment.
The NCP further states that:
EPA expects to use treatment to address the principal threats posed by a site, wherever practicable. Principal threats for which treatment is most likely to be appropriate include liquids, areas contaminated with high concentrations of toxic compounds, and highly mobile materials. “(See § 300.430 (a) (iii) (A))
The preamble to the NCP provides further clarification of treatment:
This goal [treatment expectation] reflects CERCLA's preference for achieving protection through the use of treatment technologies that destroy or reduce the inherent hazards posed by wastes and result in remedies that are highly reliable over time. The purpose of treatment in the Superfund program is to significantly reduce the toxicity and/or mobility of the contaminants posing a significant threat (i.e., "contaminants of concern") wherever practicable to reduce the need for long-term management of hazardous material. EPA will seek to reduce hazards (i.e., toxicity and/or mobility) to levels that ensure that contaminated material remaining on-site can be reliably controlled over time through engineering and/or institutional controls.
Further, the Superfund program also uses as a guideline for effective treatment the range of 90 to 99 percent reduction in the concentration or mobility of contaminants of concern (see preamble discussion below on "reduction of toxicity, mobility or volume" under § 300.430(e)(9)). Although it is most important that treatment technologies achieve the remediation goals developed specifically for each site (which may be greater or less than the treatment guidelines), EPA believes that, in general, treatment technologies or treatment trains that cannot achieve this level of performance on a consistent basis are not sufficiently effective and generally will not be appropriate. [See 55 FR 8701]
Thus, treatment is defined by whether the technology can or will alter the “...the composition of a hazardous substance or pollutant or contaminant through chemical, biological, or physical means so as to reduce toxicity, mobility, or volume of the contaminated materials being treated.” Furthermore, such technology should generally achieve a standard of treatment of 90 to 99 percent reduction in concentration or mobility.
From an environmental media standpoint, treatment can include: stabilization (e.g., fixation), thermal treatment, dehalogenation, soil washing, etc. It typically does not include waste capping in place by itself. While this latter technology reduces the mobility of the contaminant, it does not do so by treating the actual contaminated media for the most part.
In a similar manner, treatment of surface contamination includes those activities that remove,
D-2
destroy, or stabilize the material on the surface. These can include, for purposes of this guidance, the various washing or abrasive technologies that remove the contaminant from the surface. It can also include a stabilization technology that chemically or physically bond with the contaminant and prevent the contaminant from migrating from the area. Applying shielding material, while a remediation technology that can facilitate achieving protectiveness or ARAR goals by limiting direct exposure and inhibiting resuspension of degraded material, normally would not be considered a treatment technology.
Under CERCLA, the concept of treatment is the same for organic, inorganic or radioactive contaminants. While some forms of treatment might in fact be capable of destroying or modifying the chemical composition, other forms of treatment might immobilize the contaminant or might remove the contaminant from the media, and thus mitigate the former potential exposure pathway. Contaminated materials can be treated to remove the contaminant from the material. The contaminant and associated treatment residuals might require further treatment for final waste management.

![Master Thesis Kim Bini-201306025[1] · Radioactively!Labeled!TitaniaNanoparticles!for!Skin Penetration! Master’of’Science’Thesis’in’Materials’Chemistry’and’Nanotechnology’](https://cdn.vdocuments.site/doc/165x107/606e394b73a4280b626ed04d/master-thesis-kim-bini-2013060251-radioactivelylabeledtitaniananoparticlesforskin.jpg)


