Research ArticleSurprise Bug Report Prediction Utilizing OptimizedIntegration with Imbalanced Learning Strategy
Hui Li 12 Yang Qu 1 Shikai Guo 12 Guofeng Gao1 Rong Chen 1 and Guo Chen 3
1Information Science and Technology College Dalian Maritime University Dalian 116026 China2Collaborative Innovation Center for Transport Studies of Dalian Maritime University Dalian 116026 China3Marine Electrical Engineering College Dalian Maritime University Dalian 116026 China
Correspondence should be addressed to Shikai Guo shikaiguodlmueducn
Received 30 July 2019 Revised 2 December 2019 Accepted 24 January 2020 Published 19 February 2020
Academic Editor Saleh Mobayen
Copyright copy 2020 Hui Li et al +is is an open access article distributed under the Creative Commons Attribution License whichpermits unrestricted use distribution and reproduction in any medium provided the original work is properly cited
In software projects a large number of bugs are usually reported to bug repositories Due to the limited budge and work force thedevelopers oftenmay not have enough time and ability to inspect all the reported bugs and thus they often focus on inspecting andrepairing the highly impacting bugs Among the high-impact bugs surprise bugs are reported to be a fatal threat to the softwaresystems though they only account for a small proportion +erefore the identification of surprise bugs becomes an importantwork in practices In recent years some methods have been proposed by the researchers to identify surprise bugs Unfortunatelythe performance of these methods in identifying surprise bugs is still not satisfied for the software projects+emain reason is thatsurprise bugs only occupy a small percentage of all the bugs and it is difficult to identify these surprise bugs from the imbalanceddistribution In order to overcome the imbalanced category distribution of the bugs a method based on machine learning topredict surprise bugs is presented in this paper+is method takes into account the textual features of the bug reports and employsan imbalanced learning strategy to balance the datasets of the bug reports +en these datasets after balancing are used to trainthree selected classifiers which are built by three different classification algorithms and predict the datasets with unknown type Inparticular an ensemble method named optimization integration is proposed to generate a unique and best result according to theresults produced by the three classifiers +is ensemble method is able to adjust the ability of the classifier to detect differentcategories based on the characteristics of different projects and integrate the advantages of three classifiers +e experimentsperformed on the datasets from 4 software projects show that this method performs better than the previous methods in terms ofdetecting surprise bugs
1 Introduction
With the rapidly increasing complexity in the organizationsof software projects utilizing software repositories to testand maintain software systems gains popularity in softwareengineering domain [1 2] +e developers need to obtainfeedback about defects which exists in the released systemthrough bug reports However the number of bug reports isso large that the developers could hardly manage [3] Forexample one of the famous crowdsourced testing platformsnamed Baidu Crowdsourced Testing Platform releasesapproximately 100 projects per month and receives 1000 testreports per day on average [4] At the same time hugeamounts of test reports bring the rapidly increasing test tasks
for the software projects It is reported that inspecting 1000bug reports takes nearly half a working week for a developeron average at present [5] Due to tight schedules and limitedhuman resources developers often do not have enough timeto inspect all bugs equally Developers often need to con-centrate on bugs which have high impact (have greater threatto the software system) which are used to refer to the bugswhich appear at unexpected time or locations and bringmore unexpected effects (ie surprise bugs) +erefore it isunrealistic to carefully review all the bug reports and assignthem to the suitable developers [6 7] Ostrand et al reportedthat about 20 of the code files contains 80 of the defectsand different defects have different negative impact onsoftware systems [8] +us in order to alleviate the working
HindawiComplexityVolume 2020 Article ID 8509821 14 pageshttpsdoiorg10115520208509821
pressure of the developers providing an effective methodthat assisting developers to detect which bugs have greaterthreat to the software systems is very essential [9ndash14] +esebugs with higher priority to be fixed are named high-impactbugs [15]
In recent years more and more approaches have beenproposed to detect high-impact bugs For further in-vestigating the classification method of detecting high-im-pact bugs Ohira et al manually sorted out high-impact bugsfrom the datasets of four open-source projects (AmbariCamel Derby and Wicket) [16] +ese datasets contain sixkinds of bugs which are surprise bugs breakage bugsdormant bugs security bugs blocker bugs and performancebugs Shihab et al proposed a model to identify if a code filecontains a breakage or surprise bug [17] Yang et al pro-posed a method to identify high-impact bugs throughcombinations of classification algorithms and imbalancedlearning strategies [18] Although many classificationmethods have been able to predict high-impact bugs theperformance of the models are still unsatisfied and thusthese methods are not suitable to be applied to softwareprojects now [19ndash23]
Among the high-impact bugs surprise bugs can bringdevelopers a huge negative impact on the development andmaintenance of software systems though surprise bugsusually appear accidentally in timings and locations and onlyaccount for 2 of all the bugs [17] Aiming to assist de-velopers to detect bugs that are more threat to softwaresystems we focus on the surprise bugs and propose a clas-sification method through Optimized Integration withImbalanced Learning Strategy (OIILS) to identify surprisebugs in this paper As we know the users usually utilize shortor long text descriptions to illustrate the bugs encountered inthe software system +us we extract the textual featuresfrom the textual descriptions available in the bug reports astraining data or testing data In addition it is reported thatthe surprise bugs only account for a small percentage of allthe bugs and thus the impact on software systems repre-sents imbalance distribution in bug reports datasets [8]Obviously imbalanced category distribution has a negativeimpact on the performance of a classifier [24 25] In ourmethod we adopt imbalanced learning strategy namedSMOTE to balance the training data and feed the processedtraining data to the classifiers We also pay attention to thegap between the prediction performances of differentclassifiers for the same dataset +us we utilize differentclassification algorithms to predict surprise bug reports
+e prediction results show that the classifiers representvarious prediction abilities to discover different categories(for instance if a classifier has a strong ability to detect onecategory in binary classification the ability to detect anothercategory is usually weak) and the different classifiers rep-resent various prediction abilities to the same datasets+erefore the ensemble method of integrating the advantageof different classifiers and balancing the ability of eachclassifier becomes a good solution for imbalance data Inother words one can assign higher weight to improve theweak ability of the classifier to detect one category and assignlower weight to reduce the stronger ability in order to get
better classification results Yang et al choose 4 widely usedstrategies (SMOTE Random Undersampling (RUS) Ran-dom Oversampling (ROS) and Cost-Matrix Adjuster(CMA)) for dealing with imbalanced data and 4 textclassification algorithms (Naive Bayes (NB) Naive BayesMultinominal (NBM) Support Vector Machine (SVM) andK-nearest Neighbors (KNN)) to identify high-impact bugreports [18] In the method of OIILS we evaluate 7 strategies(NB J48 KNN Random Tree (RT) Random Forest (RF)NBM and SVM) to build the classifiers and then choosethree classifiers (KNN J48 and NBM) based on the ex-perimental results and balance the ability of each classifierSpecifically we first utilize training data to feed the objectiveclassifier and predict hypothetically unlabeled bugs intraining data in the weight training phase We obtain theprobability of each category for each bug and utilize weightsto adjust them respectively To obtain a higher accuracy wetreat the process of detecting the most suitable weights asa linear programming problem and the constraint solvernamed CPLEX is used to address this problem [27] In theweight adjustment phase we adjust the probability of eachcategory through the weights obtained in the above step andobtain an optimized result for each classifier Finally weinfer an ultimate result through the results produced bythree classifiers based on the principle of the minimum
We investigate the validity of OIILS experimentally onfour datasets provided +ese datasets are respectively from4 open source projects and contains 2844 bugs+e details ofthese datasets and the related category distributions areshown in Table 1 including the number of surprise bugs(surprise) the number of ordinary bugs (Ordinary) thetotally number of the bugs (Total) and the high-impact bugsas a percentage of all the bugs (Percentage) In addition it isrevealed that the surprise bugs rarely appear in all bugs andcategory distribution in different projects are unique +eexperimental results show the classification algorithmsutilized in our method achieve better prediction perfor-mance Meanwhile the comparison experiments with thepossible combinations of all classification algorithms andimbalanced learning strategies show that the combination ofalgorithms and imbalanced learning strategy presented inthis work achieves the best performance Finally it is provedthat the ensemble method we propose outperforms otherclassic ensemble methods and the average improvement ofF-Measure is between 629 and 266
+e contributions of this work are as follows
(i) We combine imbalanced learning strategy withmulticlassification algorithms to overcome imbal-anced problem of datasets and take advantage ofdifferent abilities of three classification algorithms
(ii) We propose an ensemble method named OptimizedIntegration with imbalanced learning strategy thatcan balance the ability of detecting different cate-gories for each classifier based on the characteristicsof the experimental data and integrate advantages ofdifferent classification algorithms +e ensemblemethod considers the optimization weight problemas a linear programming problem and utilizes the
2 Complexity
constraint solver named CPLEX to obtain the mostsuitable weights for higher accuracy of the results
(iii) We evaluate our method based on 4 open-sourceprojects which contain 2844 bugs And the results ofexperiments show that each part of our method isfeasible and outperforms other correspondingclassification algorithms
+e rest of this paper is constructed as follows Back-ground is presented in Section 2 Section 3 describes themethod of optimized multiclassifier integration In Section4 we illustrate the experimental datasets evaluation metrics4 research questions and corresponding experimental set-tings Section 5 presents the results of each research questionand analysis based on the experimental results Finallyconclusion and threats to validity are illustrated in Section 6and Section 7 respectively
2 Background
21 RelatedWork In order to ensure the quality of softwaresystems the software companies invest a large number ofwork force and capital costs for software testing anddebugging +us many software projects including open-source projects and commercial software projects utilizesoftware bug tracking systems in order to conveniently andefficiently manage the bug reports [28] As software testingprogresses a great number of bug reports are submitteddaily to the bug tracking system For example during theten-year period fromOctober 2001 to October 2010 Bugzillareceived a total of 333371 bug reports on Eclipse projectswhich were submitted by 34917 testers participating in theproject Meanwhile in Mozilla project a total of 643615 bugreports were submitted as of December 31 2011 Due to thelarge number of bug reports submitted everyday the task ofinspecting bug reports has become more and more time-consuming+us the researchers put forwardmanymethodsto reduce the lengthy process of reporting in the past tenyears We illustrated these methods mainly as follows
211 Content Optimization Optimization is a widely usedmethod to solve quantitative problems in many disciplines[29ndash31]
Beetenburg et al studied the contents of test reportscollected the contents of test reports submitted by peoplewith different roles and abilities in different projects orplatforms and then reported that there are some differencesbetween these bug reports [32] +us the researchersestablished a supervised learningmodel based on the contentof the developer submitting the bug report aiming to obtainthe information from the bug reports provide suggestions to
the developers on the content of the bug reports and im-prove the quality of the test reports Demeyer and Lankanfinoticed that the specific bug reports fields may contain someerrors such as wrong components [33] +us they utilizeddata mining techniques to predict possible errors in testreports Wu et al reported that the bug report information isusually incomplete thus they proposed a method namedBUGMINER to determine the key information in bug re-ports and utilize it to check whether the information ofnewly submitted bug report is complete [34] +ough manyresearchers propose many methods to optimize the contentof bug reports the applicability of these methods still un-satisfied and overcoming limitation of methods is one of thechallenges in the future work
212 Severity Prediction Severity is the estimate to theimportance of the bugs by its own feedback [22] Somesystems demand high security and fault tolerant so it isnecessary to accurately assess the severity of the defects(bugs) possibly lying in the systems [35 36] Aiming toachieve this goal Menzies andMarcus proposed and appliedan automated predictive approach using text-mining andmachine learning for mission-critical systems [37]According to the severity labels utilized in NASA theydivided all bugs into five levels +ey first preprocess wordsextracted from the descriptions of bug reports such as re-moving stop words and remaining stemming +en theyselect Top-k words by information gain and treated them asfeatures to represent bug reports At last they use RIPPERrule learner to classify bug reports with unlabeled severityLamkanfi et al used four classification algorithms forcomparing the severity of prediction [38] Tian et alsummarized the work of their predecessors and proposed aninformation retrieval method which uses text and nontextualcharacter information to predict the severity of bug reports[39] In the process of this method the severity is assigned bysubmitters subjectively Each submitter considers the se-verity of the bug reports by different experience and un-derstanding but this inevitably brings the subjective andinaccurate evaluation to the severity of the bug reports +usa reasonable specification is required to improve accuracythat submitters assign severity
213 Priority Prediction Evaluating the priority of the bugreports is a very important work in software testing Yu et alutilized neural networks to speed up the training process inorder to reduce the error rate during the evaluation [40]Kanwal and Mapbool conducted prioritization of bug re-ports based on SVM and NaivendashBayes classificationMeanwhile they reported that SVM performs better inpredicting the priority of bug reports by utilizing textualfeatures [41] Tian et al presented a method of automaticallyselecting the appropriate classification algorithm to predictthe priority of the bug report based on machine learningframework and classification standard [42] Gao et alpresented an integration method to identify high-prioritybug reports [43]
Table 1 +e distribution of categories in different projects
Projects Surprise Ordinary Total PercentageAmbari 266 605 871 3054Camel 228 351 579 3938Derby 111 620 731 1518Wicket 242 421 663 3650
Complexity 3
Besides the methods above some methods ware pre-sented to alleviate the heavy work of bug report processingsuch as detecting duplicate bug reports [44ndash48] working onmisclassification about bug reports [49 50] and bug reportassignment [51 52] However previous studies only usesingle classifier for prediction but ignore the differences inthe ability of each classifier to detect various projects andcategories In this work considering the various perfor-mance of classifiers and unique distribution of category inprojects we propose a method to make use of the com-plementary characteristics between classifiers +is methodis also optimized according to the data distribution of dif-ferent projects to achieve the best effect
22 Motivation Ohira et al collected the datasets of high-impact bugs by reviewing 4000 bug reports [16] +eycategorize datasets into six different kinds of bugs which aresurprise bugs dormant bugs blocker bugs security bugsperformance bugs and breakage bugs [15] In this work wepay attention to surprise bugs
+e surprise bugs we investigate are collected from fourApache open-source projects which are Ambari CamelDerby and Wicket +e four datasets contain 2844 bugstotally As shown in Table 1 it can be seen that surprise bugsaccount for only about one-third or less of the entiredatasets Obviously imbalanced data distribution in datasetshas a negative impact on the classification performance ofthe classifier [15] In order to solve this problem the en-semble method OIILS is designed
3 Methods
In this section the method of OIILS will be described Firstwe demonstrate the overall framework of OIILS +en wedivide our method into four submodules including textfeature extraction module data balancing module multi-classifier module and optimization integration module
In feature extraction module we extract text futureswhich can describe the information of the bugs in order totrain the machine learning classifiers In data balancingmodule we adopt imbalanced learning strategy to balancethe imbalanced datasets aiming to help classification al-gorithms promote the prediction results In multiclassifiermodule we use various classification algorithms to buildclassifiers respectively and train the datasets which havebeen balanced in data balancing module then utilize theseclassifiers to produce prediction results In optimizationintegration module we present the ensemble method ofOIILS to predict the impact of each bug report based on theresults generated by multiclassifier module In other wordswe double the number of training data belonging tominorityclass
31 Overall Framework +e overview of OIILS is illustratedin Figure 1 OIILS runs in two phases training phase andprediction phase
In the training phase we collect a number of bug reportswith known type as input And then we extract the text
features that can represent the information of each bugreport Second we utilize imbalanced learning strategy tobalance the training data Finally we employ three classi-fication algorithms to build classifiers and utilize them totrain the training data balanced in data balancing modulerespectively
In the prediction phase OIILS obtains some bug reportswith unknown type We utilize text feature extractionmodule to extract the text features of the unlabeled reports+en different classifiers that we trained in the trainingphase are used to predict these bug reports respectively andwe separately obtain the prediction results of these classi-fiers At last we adopt the ensemble method to produce thefinal prediction of each bug reports
+en the details of each module will be demonstrated inthe following four subsections
32 Text Feature Extraction Module +e target of textfeature extraction module is to collect the text features thatcould characterize each bug report First we extract textdescriptions from summary and description fields of bugreports since these two fields could provide useful in-formation about bugs +en we utilize word segmentationto segment descriptions into words In order to reduce noisydata we remove stop words numbers and punctuationmarks that contain little meaning It is reported that de-velopers generally utilize semantically related words thatconsist the same root word [42] +us we finally applyIterated Lovins Stemmer [53] to collapse various forms ofthe same word to their stem for harmonizing words withsimilar meanings
After the steps illustrated above the number of wordscontained in each bug report is obviously less than beforeWe treat each stemmed word that appears in bug reports asa textual feature and transform these words to textual featurevector For bug report set BR we express the ith bug reportbri by the following formula
bri t1 t2 t3 tn( 1113857 (1)
where tj denotes the existence of the jth word If the jth wordexists the value of tj is 1 otherwise 0 And n denotes thenumber of textual features
33 Data Balancing Module Imbalanced distribution ofcategory in datasets is an important problem for machinelearning In generally imbalanced data causes poor per-formance in almost all classification algorithms +us manyinvestigators adopt imbalanced learning strategies to processthe imbalanced dataset in order to assist classifiers inavoiding to bias the majority class when training dataset[54 55] In addition some previous studies have proved thatthe classification results achieve better after utilizing im-balanced learning strategy to preprocess the datasets in mostcases [56 57]
Imbalanced learning strategies mainly contain two typeswhich are sampling methods and cost-sensitive methods InOIILS we adopt a classic oversampling method named
4 Complexity
SMOTE (short for Synthetic Minority OversamplingTechnique) +is method is more sophisticated than tradi-tional oversampling methods because it could create someartificial data which belongs to minority class based onspecific strategy [58] Firstly SMOTE identifies its K mostsimilar neighbors for each bug belonging to minority classaccording to the value of textual feature vector NextSMOTE links this bug and its K neighbors in the multidi-mensional feature space and selects a point randomly inthese line segments respectively +ese K artificial points areassumed to be the new data which belongs to minoritycategory +us SMOTE will produce Klowast n artificial pointsto assist classifiers to train the features of minority class ifa dataset contains n bugs belonging to minority class In ourmethod we let K 1
34 Multiclassifier Module As we know different classifi-cation algorithms perform different prediction abilities ondifferent datasets And the effect of utilizing different clas-sification algorithms to predict the same dataset is alsodifferent In addition there is a certain randomness in thenew artificial data constructed by the imbalanced learningstrategy named SMOTE In order to improve the classifi-cation stability we integrate different classification algo-rithms In training phase we employ these algorithms tobuild classifiers respectively And then we use them to trainthe datasets which are balanced by SMOTE in data balancingmodule In the testing phase we utilize these classifiers topredict bug reports with unknown type and obtain theprobability of each category
35 Optimization Integration Module In the above step wehave introduced that OIILS contains various classificationalgorithms and gain different prediction results In order tointegrate the advantages of each classification algorithmeffectively we propose an ensemble method named Opti-mization Integration Optimization Integration consists ofthree phases which are the weight training phase weightadjustment phase and minimum selection phase
+e input of Algorithm 1 is the training data theprobability of majority class and minority class for each bugand the constraint solving model +e output of this algo-rithm is the category of each bug
Lines 3ndash20 is the weight training phase In this phase themost suitable weights are obtained by constraint solving Inlines 21ndash25 we use the weights to adjust the originalprobability on majority class and minority class re-spectively of each bug Finally we choose the maximize oneamong different probabilities about majority class and mi-nority class as the class probability of each bug and use thisto determine the category of each bug
351 Weight Training Phase Due to the different abilities ofdetecting minority category for different classification al-gorithms the constraint solver named CPLEX is used toadjust the weight of the abilities for different classificationalgorithms to identify the priority of the bug report and thenimprove the prediction accuracy of each classifier [59]
It is well-known that the classifier determines the cat-egory of the target by comparing the probabilities that thetarget belongs to different categories +e objective functionthat we establish is to determine the weights W0 W1 that canbalance the ability of detecting two categories in a classifierso as to correspond the prediction results of bug reports tothe probability distribution above as much as possible Weutilize the data after balancing in the data balancing moduleas training data Firstly we extract the features of thetraining data and fed these features to the classifier +en weconvert the category of bri in training data to the corre-sponding value Ci according to the following equation
Ci minus 1 if BRi belongs tominority class
1 if BRi belongs tomajority class1113896 (2)
As shown in equation (2) if a bug belongs to minorityclass the number of this category corresponds to minus 1 oth-erwise 1 +en we assume the bugs in training data areunlabeled and utilize the classifier to predict them Given p0
i p1
i are defined as the probability of two categories which
Imbalanced learning strategy
Training set
KNN
J48
NBM Testing set
Optimization integration module
Results
Results
Results
Results
Results
Results
Optimization Minimum selection
Prediction result
Artifical training set
Multiclassifier module
Figure 1 Overview of OIILS
Complexity 5
produced by the classifier predicting the ith bug reportwhere p0
i is the probability of bug report bri belonging tomajority class and p1
i denotes the probability of minorityclass Finally we establish the subobjective function as
SubOBJi W0 lowast p0
i minus W1 lowast p1i( 1113857lowast Ci
W0 lowast p0i minus W1 lowast p1
i
11138681113868111386811138681113868111386811138681113868
(3)
It indicates that the subobjective function only containstwo results If the prediction result of the ith bug afteradjusting is true the value of SubOBJi is 1 otherwise thevalue of SubOBJi is minus 1 +us we demonstrate the objectivefunction in the following equation
OBJ 1113944n
i1SubOBJi (4)
After establishing the objective function in the linearprogramming problem we need to obtain the maximumvalue of the weights in order to harvest the highest
achievable accuracy of the classifier To address the problemCPLEX is used to obtain the most suitable weights In ad-dition the value of weight should be within a reasonablerange and the weights we set is to balance the ability ofa classifier essentially In other words we need to enhancethe ability to detect a category and simultaneously reduce theability to detect the other category for a classifier+us someconstraints are added for constraining the weights +econstraints are given as follows
W0 + W1 1
0ltW0 lt 1
0ltW1 lt 1
(5)
352 Weight Adjustment Phase After training the weightswe obtain the most suitable weights W0 and W1 for eachclassifier +en the weights are used to adjust the prediction
Require Training data (the data after balancing) the probability P0i and P1
i of each bug the constraint solving modelILP OBJCONSTRAINTSEnsure +e category of each bug
(1) Ci 0 Initialization(2) W0 05 W1 05 Initializes the weights(3) lowastWeight training phaselowast(4) for each BRi
(5) if BRi belongs to minority class(6) Ci minus 1(7) else(8) Ci 1(9) end if(10) end for(11) OBJ⟵maximize1113936
ni1 SubOBJi
(12) lowastLet the objective function be maximizing the highest achievable accuracy of the classifierlowast(13) lowastGenerate all the CONSTRAINTSlowast(14) CONSTRAINTS ⟵W0 + W1 1(15) CONSTRAINTS ⟵ 0ltW0 lt 1(16) CONSTRAINTS ⟵ 0ltW1 lt 1(17) lowast+e ILP formulation is built successfullylowast(18) for each classifier(19) W0 W1⟵ ILP Obtain the most suitable weights by optimization(20) end for(21) lowastWeight adjustment phaselowast(22) for each BRido(23) W0 times P0
i P0i is the original majority probability of BRi
(24) W1 times P1i P1
i is the original majority probability of BRi(25) end for(26) lowastMinimum selectionlowast(27) for each BRido(28) Pmin
0 ⟵ minimum value of majority class probabilities(29) Pmin
1 ⟵ minimum value of majority class probabilities(30) if Pmin
0 gtPmin1
(31) Category of BRi⟵ majority class(32) else(33) Category of BRi⟵ minority class(34) end if(35) end for(36) return the category of each bug report
ALGORITHM 1 OIILS algorithm
6 Complexity
results generated by corresponding classifiers We utilizecorresponding W0 to adjust the probability p0
i of the ma-jority class and utilize corresponding W1 to adjust theprobability p1
i of the minority class for the ith bug Table 2presents the details of adjustment
353 Minimum Selection Phase After the adjustment weobtain three sets of predicted results and each set containsthe probabilities of two categories +us there are somedifferent probabilities about majority class and differentprobabilities about minority class for a bug We set pmin
0 topresent the minimum value among all of the probabilitiesabout majority class and set pmin
1 to present the minimumvalue of minority class probabilities+us each bug containspmin0 and pmin
1 about majority class and minority class Atlast OIILS utilizes the category represented by the maxi-mum value of pmin
0 and pmin1 to determine the final type of
this bug report
4 Experiment Design
In this section we evaluate OIILS through a serial of ex-periments by four open-source projects and the experi-mental datasets are introduced in Section 22 We usestratified sampling to split surprise bugs of each projects intofive segments and 4 of them are used as training datasetrandomly while the remaining one is used as the testingdataset +e evaluation metrics are shown in Section 41+en we design four research questions to investigate theperformance of OIILS in Section 42 Finally we describe theexperiment design to figure out these questions in the lastsubsection
41 Evaluation Metrics In order to measure the effective-ness of surprise bug classification methods we utilize threemetrics precision recall and F-Measure [60] +e threemetrics are widely used for evaluating classificationalgorithms
Table 3 shows four results of classification True positive(TP) denotes a bug is predicted correctly as a surprise bugFalse positive (FP) denotes a bug is predicted mistakenly asa surprise bug +e definitions of true negative (TN) andfalse negative (FN) are similar with true positive and falsepositive TP FP TN and FN in mathematical formulasbelow express the total number of each classification resultrespectively
Precision signifies the proportion of bugs observed assurprise bugs that are predicted correctly Precision can beexpressed as
Precision TP
TP + FP (6)
Recall signifies the proportion of bugs predicted assurprise bugs to all bugs observed as surprise bugs Recall canbe expressed as
Recall TP
TP + FN (7)
F-Measure is the harmonic mean of precision and recallIt is used to balance the discrepancy between precision andrecall F-Measure can be expressed as
F minus Measure 2lowast PrecisionlowastRecallPrecision + Recall
(8)
42 Research Questions In the experiment we evaluateOIILS by addressing the following research questions
RQ1 Which classification algorithm works well inclassifying surprise bugs
+e answer to RQ1 helps us evaluate whether classifi-cation algorithms are appropriate for identifying surprisebugs in all surprise bugs and explains one of the reasons whywe select J48 KNN and NBM in OIILS
RQ2 Can the combination of classification algorithms ofOIILS perform better than other combinations of classifi-cation algorithms
+e answer to RQ2 helps us assess the performance ofeach combination of different classification algorithms andshows that the combination of classification algorithms inOIILS performs best
RQ3 Can OIILS outperform classification algorithmwith imbalanced learning strategy
+e answer to RQ3 helps us determine whether OIILSoutperform different combinations of classification algo-rithms and imbalanced the learning strategy
RQ4 How accurate is the ensemble method of OIILScompared with the classic ensemble methods includingAdaboost Bagging and Vote
+e answer to RQ4 helps us determine whether OIILSperforms better than classic ensemble methods such asAdaboost Bagging and Vote +e result can demonstratethat OIILS is able to integrate the advantages of eachclassification algorithm
43 Experiment Setting
431 RQ1 Experiment Setting We first employ NB J48KNN RT RF NBM and SVM to build the classifiers andfeed the training datasets generated to them respectively
Table 3 +e definitions of precision recall and F-Measure forsurprise bugs
Predicted surprisebug
Predicted ordinarybug
Observed surprisebug TP FN
Observed ordinarybug FP TN
Table 2 +e rule of utilizing weights to adjust prediction result
Majority class Minority classWeight W0 W1Original probability p0
i p1i
Adjusted probability W0 lowast p0i W1 lowast p1
i
Complexity 7
+en we use different classifiers to classify the testingdatasets which are randomly generated Finally we evaluateeach classification algorithm by three metrics which areprecision recall and F-Measure and select some appropriateclassification algorithms for integrating
432 RQ2 Experiment Setting We select 5 classificationalgorithms based on the result of RQ1 which are NB J48KNN RT and NBM +en we randomly select threeclassification algorithms in five classification algorithmsmentioned above to combine All of the combinations areshown in Table 4 We utilize these 10 groups to replace thecombination of algorithms in OIILS respectively andpredict the generated testing datasets Finally we evaluateeach group of algorithms through three metrics mentionedabove and determine whether the combination of classifi-cation in OIILS represents the best performance
433 RQ3 Experiment Setting To compare OIILS withdifferent combinations of imbalanced learning strategy andclassification algorithm we concentrate on four imbalancedlearning strategies which are random undersampling (RUS)random oversampling (ROS) cost-matrix adjuster (CMA)and SMOTE [55 61] +en we utilize the imbalancedlearning strategies mentioned above to balance the gener-ated training datasets Next we select the five classificationalgorithms which are NB J48 KNN RT and NBM to buildclassifiers We utilize five classifiers to train the four types ofbalanced training datasets respectively and predict thegenerated testing datasets Finally we evaluate 20 predictionresults by precision recall and F-Measure and investigatewhether OIILS outperforms the methods that simply use thecombination of imbalanced learning strategies and classi-fication algorithms
434 RQ4 Experiment Setting We compare OIILS withsome classic ensemble methods [62ndash65] First we useSMOTE to balance the generated training datasets andutilize KNN as the basic classification algorithm because thecombination of SMOTE and KNN achieves the best per-formance among all the combinations +en we use twoensemble methods which are Adaboost and Bagging inWeka to integrate the basic classification algorithm re-spectively and predict the testing datasets generated ran-domly We also use three classification algorithms which arethe same as classification algorithms in OIILS to predict thetesting dataset respectively and produce a final predictionby Vote We compare these results and the results generatedby OIILS through three metrics mentioned above and de-termine whether OIILS canmakemore use of the advantagesof each classification algorithm than other ensemblemethods
5 Results and Discussions
In this section we analyze the four experimental results todemonstrate the answers of four research questions
51 Addressing RQ1 RQ1 Which classification algorithmworks well in classifying surprise bugs
Table 5 illustrates the performance of seven classificationalgorithms All of the classification algorithms are demon-strated in the first row and three evaluation metrics ofprediction results about four testing projects and averagevalues are shown in the first column
Based on the average values of each classification al-gorithm it can be seen that using NB to predict surprise bugscan achieve 0347 of F-Measure on average and outperformsother classification algorithms In addition RF achieves theworst performance except SVM only 0196 of F-Measure onaverage +e investigations on the gap between RF and otheralgorithms in terms of F-Measure also show that althoughRF performs better in precision its value of recall is lowerWe believe that detecting more surprise bugs from all thebugs has more practical significance than detecting littlesurprise bugs with high accuracy for helping developerimprove efficiency Finally we can see that SVM is linear andnot applicable for predicting datasets with fuzzy boundaryIn this experiment SVM seems to have no ability to detectsurprise bugs
According to the prediction results of each project bydifferent classification algorithms it can be seen that theprediction performance by using classification algorithms(except SVM) is different +erefore it is unsuitable topredict all surprise bugs with one single classification al-gorithm +e comparison of seven classification algorithmsshows that NB performs more stable on F-Measure thanothers and its range is 30ndash40 Besides we can see thata severe fluctuation exists between classification results ofRT RT achieves minimum F-Measure which is only 91and the maximum is 515
In addition it can be seen that the results of Cameloutperform other projects and the results of Derby have theworst performance based on the comprehensive perfor-mance of all the projects We investigated the gap betweenresults of each project and found that the distribution ofcategory in each project is significantly different We can seefrom Table 1 that Camel represents the most balanceddistribution among four projects Camel contains 228 sur-prise bugs accounting for 3938 of the total number Butthe category distribution in the project named Derby is themost imbalanced and the surprise bugs account for only1518 Extremely imbalanced data bring a great challengeof predicting and it is the reason why Derby produces thepoor classification results
In summary the performance of classification algo-rithms is still not satisfied for us due to the instability andlow accuracy +us it is difficult to select the most
Table 4 Combinations of classification algorithms
Group Algorithms Group AlgorithmsG1 NB J48 KNN G6 NB RT NBMG2 NB J48 RT G7 J48 KNN RTG3 NB J48 NBM G8 J48 KNN NBMG4 NB KNN RT G9 J48 RT NBMG5 NB KNN NBM G10 KNN RT NBM
8 Complexity
appropriate classification algorithm to detect surprise bugsIn addition we can see that RF and SVM are not appropriatefor predicting surprise bugs according to the results of RFand SVM which achieve lower performance than other al-gorithms +erefore in the following experiments we focuson 5 classification algorithms which are NB J48 KNN RTand NBM
52 Addressing RQ2 RQ2 Can the combination of classi-fication algorithms in OIILS perform better than othercombinations of classification algorithms
Table 6 illustrates the performance of 10 groups ofclassification algorithmsWe demonstrate each combinationof classification algorithms in the first row and demonstrateprediction performance of four projects through precisionrecall and F-Measure in the first column
According to the average results of 10 groups thecombination of algorithms in OIILS (the group of G8)achieves 0490 of F-Measure on average and achieves the bestperformance in terms of F-Measure We compare G8 withthe classification algorithm named NB which achieves bestperformance (0347) among all of the algorithms mentionedabove in Table 5 +e comparison result shows that G8increases by 15613 in terms of recall on average and4121 in terms of F-Measure on average than NB and itindicates that the combination for OIILS can improve theability of detecting surprise bugs with single algorithmsubstantially Additionally it can be seen that differentcombinations of classification algorithms represent differentperformance on predicting surprise bugs For instance G3only achieves 0328 of average F-Measure and the perfor-mance is even worse than the performance of simply uti-lizing NB It follows that improper combination ofclassification algorithms may worsen the performance ofbasic algorithms
According to the performance results that each groupclassifies Ambari project we can see that G9 achieves thebest performance (0492) in terms of F-Measure while theperformance of G3 G5 and G6 is worse than other groups
+e investigation on these groups shows that only thesegroups contain NB and NBM +e poor performance ofthese groups may result from the weak complementaritybetween NB and NBM and it is difficult to promote eachother
Meanwhile it can be seen that the performance of all thegroups predicting the projects named Camel is better thanother projects +is is caused by two reasons +e one is thateach algorithm predicts that Camel is better than otherprojects while the other is that algorithm integration furtherexpands the advantages of the classification algorithmsAdditionally it can be seen that G1 G4 G5 G7 and G10achieves 1 of recall in terms of recall In other words thealgorithms of these groups can cover all of the surprise bugs
After the above analysis it can be seen that the combinedperformance of the three classification algorithms used inOIILS is the best in all combinations
53 Addressing RQ3 RQ3 Can OIILS outperform classifi-cation algorithm with imbalanced learning strategies
Table 7 presents the prediction results of OIILS and 4combinations by every 2 classification algorithms thatperform best under each imbalanced learning strategies +ecombinations are listed in the first row and the evaluation ofprediction results for each project and average is demon-strated in the first column
According to the average results of each combination ofclassification algorithm and imbalanced learning strategySMOTE+KNN achieves the best performance in terms ofrecall and F-Measure among all the combinations SMO-TE+KNN achieves 0820 of recall and 0456 of F-Measureon average and they are higher than those of RUS+ J48 by5355 and 1429 respectively For each projects SMO-TE+KNN achieves 07 sim 09 of recall and performs betterthan other combinations substantially +us SMO-TE+KNN is more appropriate for predicting surprise bugsthan other combinations
Based on the analysis above we compare the perfor-mance of SMOTE+KNN with OIILS It can be seen that
Table 5 +e performance of seven classification algorithms
Projects Evaluation NB J48 KNN RT RF NBM SVM
AmbariPrecision 0273 0178 0268 0389 0412 0303 NullRecall 034 0151 0208 0396 0132 0189 0
F-Measure 0303 0163 0234 0393 02 0233 Null
CamelPrecision 0457 0271 0357 049 0482 0392 NullRecall 0348 0283 0326 0544 0283 0435 0
F-Measure 0395 0277 0341 0516 0356 0412 Null
DerbyPrecision 0333 0278 0182 0095 0333 05 NullRecall 0409 0227 0091 0091 0046 0136 0
F-Measure 0367 025 0121 0093 008 0214 Null
WicketPrecision 0341 0373 0311 035 0263 05 NullRecall 0306 0388 0286 0429 0102 0245 0
F-Measure 0323 038 0298 0385 0147 0329 NullavgPrecision 0351 0275 028 0331 0372 0424 NullavgRecall 0351 0262 0228 0365 0141 0251 0
avgF-Measure 0347 0268 0249 0347 0196 0297 Null
Complexity 9
OIILS achieves 0899 in terms of recall on average and 049 interms of F-Measure on average and increases by 963 onaverage recall and 746 on average F-Measure thanSMOTE+KNN respectively We can see that OIILS ach-ieves 0793 0978 0826 and 10 in terms of recall for eachprojects and increases by 1801 915 325 and 941than SMOTE+KNN respectively In addition OIILS ach-ieves 0447 0577 0359 and 0577 in terms of F-Measureand increases by 1231 646 287 and 745 comparedto SMOTE+KNN respectively It also can be seen fromTable 7 that OIILS achieves about 10 in terms of recall whenpredicting Camel and Wicket projects and achieves 09 and08 in terms of recall in other projects In other words OIILScan detect all the surprise bugs in projects which are rela-tively balanced and can detect most surprise bugs in projectswhich are relatively imbalanced
From the experiment results we could see that each partof our method is feasible and outperforms other corre-sponding classification algorithms because OIILS couldcombine imbalanced learning strategy withmulticlassification
algorithms to overcome imbalance of datasets and takeadvantage of different abilities of three classificationalgorithms
54 Addressing RQ4 RQ4 How accurate is the ensemblemethod of OIILS compared with the classic ensemblemethods including Adaboost Bagging and Vote
Table 8 illustrates the performance of four ensemblemethods We demonstrate Adaboost Bagging Vote andOIILS in the first row and demonstrate the prediction resultsof the four projects and the corresponding average values inthe first column
We compare OIILS with three classic ensemble methodsnamed Adaboost Bagging and Vote It can be seen fromTable 8 that OIILS respectively achieves 0339 and 0899 interms of precision and recall on average improves the bestprecision of other ensemble methods by 561 and improvesthe highest value of recall among classic ensemble methodsby 601 And OIILS achieves 049 in terms of F-Measure on
Table 7 +e prediction results of OIILS and 4 combinations
Projects EvaluationRUS ROS CMA SMOTE
OIILSJ48 RT RT NBM NB NBM KNN NBM
AmbariPrecision 0316 0326 0275 0339 0307 0293 0283 0301 0311Recall 0453 0585 0264 0415 0434 0415 0672 0362 0793
F-Measure 0372 0419 0269 0373 0359 0344 0398 0328 0447
CamelPrecision 0429 0389 0404 045 0447 0423 0389 0428 0409Recall 0522 0457 0457 0587 037 0652 0896 0604 0978
F-Measure 0471 042 0429 0509 0405 0513 0542 0501 0577
DerbyPrecision 0173 0165 0286 0308 0143 0235 0223 0358 0229Recall 0609 0565 0261 0174 0174 0174 08 013 0826
F-Measure 0269 0255 0273 0222 0157 02 0349 0191 0359
WicketPrecision 0429 0333 0333 0447 0365 0447 0381 0472 0405Recall 0551 0469 0327 0347 0388 0429 0914 042 1
F-Measure 0482 039 033 0391 0376 0438 0537 0445 0577avgPrecision 0337 0303 0324 0386 0316 035 0319 039 0339avgRecall 0534 0519 0327 0381 0341 0418 082 0379 0899
avgF-Measure 0399 0371 0325 0374 0324 0374 0456 0366 049
Table 6 +e performance of 10 groups of classification algorithms
Projects Evaluation G1 G2 G3 G4 G5 G6 G7 G8 G9 G10
AmbariPrecision 0308 0378 0382 0305 028 0329 0313 0311 0425 0301Recall 083 0698 0491 0868 0698 0509 0887 0793 0585 083
F-Measure 0449 049 043 0451 04 04 0463 0447 0492 0442
CamelPrecision 0414 0433 0385 0414 0414 0424 0414 0409 0439 0414Recall 1 063 0326 1 1 0609 1 0978 063 1
F-Measure 0586 0513 0353 0586 0586 05 0586 0577 0518 0586
DerbyPrecision 0211 0143 0143 0208 0218 0182 0215 0229 0206 0222Recall 0826 0304 0217 087 0826 0348 087 0826 0304 087
F-Measure 0336 0194 0172 0336 0346 0239 0345 0359 0246 0354
WicketPrecision 0398 0392 037 0378 0397 0397 0383 0405 0385 0381Recall 1 0633 0347 098 098 0592 1 1 051 098
F-Measure 057 0484 0358 0546 0565 0475 0554 0577 0439 0549avgPrecision 0333 0336 032 0326 0328 0333 0331 0339 0364 033avgRecall 0914 0566 0345 0929 0876 0514 0939 0899 0508 092
avgF-Measure 0485 0421 0328 048 0474 0404 0487 049 0424 0483
10 Complexity
average and improves the best F-Measure of other methodsby 629 In addition we can see that the ensemble methodnamed Vote achieves the worst performance among the fourensemble methods Obviously the values of recall and F-Measure that Vote achieves are only about 60 of otherensemble methods
For the purpose of finding out the reason of the worseperformance of other ensemble methods such as Vote weinvestigate which classification algorithms are integrated inthese methods As mentioned in Section 51 differentclassification algorithms represent different predictionperformance For Vote it is integrated by three algorithmswhich are J48 KNN and NBM and it can be seen theexperimental results that KNN outperforms other algo-rithms obviously after adopting SMOTE +us J48 andNBM bring a negative impact on the way of voting due to thepoor performance of classifying
+en we investigate why Vote does not perform well Asdiscussed in Section 51 different classification algorithmsproduce different prediction results based on same datasetsIn this experiment we use Vote to integrate three algorithmswhich are J48 KNN and NBM and we can see that KNNoutperforms other algorithms obviously after adoptingSMOTE according to the experimental results+us J48 andNBM bring a negative impact on the way of voting due to thepoor performance of classifying
+e experimental results show that OIILS could balancethe ability of detecting different categories for each classifierbased on the characteristics of the experimental data andintegrate advantages of different classification algorithms+e ensemble method considers the optimization weightproblem as a linear programming problem and utilizes theconstraint solver named CPLEX to obtain the most suitableweights for higher accuracy of the results
6 Conclusions
In this paper we present a method named OIILS to identifysurprise bugsWe consider textual feature of bug reports andutilize imbalanced learning strategy to assist classifiers for
prediction +en we use three classification algorithms tobuild classifiers utilize these classifiers to train the samedatasets which are balanced and predict and test by thetesting datasets We also preset an ensemble method namedOptimization Integration to combine the advantages of eachclassifier Firstly we set the weights to adjust the ability ofdetecting different categories based on the characteristics ofprojects for each classifier +en we adjust the probabilitiesof predicted results in order to obtain higher accuracyFinally we assign a label to each bug report to describe theextent of its impact according to the principle of the min-imum value
We have compared many basic classification algorithmsfor predicting imbalanced datasets to prove that classifica-tion algorithms used in OIILS is optimal+en we have listedall the combinations of different classification algorithmsand the prediction results prove that the combination ofOIILS achieves the best performance Next we have utilizedfour different imbalanced learning strategies and five clas-sification algorithms to combine for predicting the testingdatasets obtained in this experimental study +e predictionresults show that the SMOTE used in OIILS outperformsother combinations Finally experimental results also provethat OIILS performs with higher accuracy of integrationthan classic ensemble methods
With the help of OIILS software project managers canidentify the surprise bugs and assign these bugs to the de-velopers to fix them in priority Once the developers receivebug repair tasks they will repair the surprise bugs as soon aspossible and check the related code rigorously It is sure thatthe software system quality can be better improved if thesurprise bugs are repaired OIILS can be easily used insoftware projects+e project managers can collect historicalbug reports as training datasets train the model check thevalidity and then apply it to identify surprise bugs from thenewly submitted bug reports
Additionally OIILS could be benefit to the study ofsurprise bug identifications in software practices Assembledwith optimized integration and imbalance learning strategyOIILS can improve the performance of surprise bug
Table 8 +e performance of four ensemble methods
Projects Evaluation Adaboost Bagging Vote OIILS
AmbariPrecision 0298 0295 0276 0311Recall 0736 0717 0396 0793
F-Measure 0424 0418 0326 0447
CamelPrecision 0387 0383 0373 0409Recall 0891 0891 0674 0978
F-Measure 0539 0536 0481 0577
DerbyPrecision 0213 0207 0222 0229Recall 0826 0783 0261 0826
F-Measure 0339 0327 024 0359
WicketPrecision 038 04 0405 0405Recall 0939 0939 0653 1
F-Measure 0541 0561 05 0577avgPrecision 032 0321 0319 0339avgRecall 0848 0833 0496 0899
avgF-Measure 0461 0461 0387 049
Complexity 11
identification based on the experimental results on thedatasets of real software projects However the performanceof OIILS is different for the selected software projects moreor less and the problem has not been solved thoroughly+us further studies on surprise bug identification are stillneeded in the future
In the future work we plan to perform experiments withmore imbalanced datasets and more open-source projectsWe also plan to improve accuracy of OIILS without losingrecall of minority category
Finally we plan to employ or design a more stableimbalanced learning strategy to make up the instability ofSMOTE because the artificial datasets are produced ran-domly according to the data which belongs to minoritycategory
7 Threats to Validity
Our method and experiment design still contain somethreats We illustrate these threats as follows
71 Conclusion Validity +e experiments evaluate OIILSthough three metrics which are precision recall and F-Measure Although utilizing accuracy to evaluate the per-formance of predicting imbalanced datasets is lack ofpractical significance it is still an important indicator toassess the classification ability +us the evaluation metricsin the experiments that completely ignore accuracy may notevaluate each prediction performance comprehensively
72 Internal Validity +ere are four open-source projectsused as datasets in the experiments and we divide eachdataset into five parts randomly For all of the experimentswe fix one of these parts as testing data and the remainingparts as training data However the performance of a clas-sification algorithm predicting different datasets is different+us the fixed training data and testing data used in theseexperiments may not completely show the performance ofeach classification algorithm
73 Construct Validity +e type of bugs we concerned inthis work is surprise bugs and the surprise bugs are fromfour open-source projectsWe investigated the other types ofbugs in these projects and noticed that the category dis-tribution of surprise bugs is more balanced than other typesof bugs Meanwhile different category distribution maycause different performance for imbalanced learning strat-egy +erefore evaluating the performance of predictingimbalanced data through only one type of bugs may not beenough
74 External Validity We adopt imbalanced learningstrategy named SMOTE in OIILS to balance the trainingdatasets As we know SMOTE generates artificial datarandomly based on initial data which belongs to minoritycategory However the artificial data generated are different
in each experiment +us the performance of OIILS mayrandomly fluctuate due to SMOTE
Data Availability
+e data are available by contacting Dr Guo via email atshikaiguodlmueducn
Conflicts of Interest
+e manuscript has no conflicts of interest
Authorsrsquo Contributions
+e idea of this work is provided by Shikai Guo the code ofthis model is written by Guofeng Gao data collection andexperiments are conducted by Yang Qu and the manuscriptis written by Hui Li Prof Rong Chen and Prof Chen Guoprovidedmany suggestions onmodel design andmanuscriptrevisions
Acknowledgments
+is work was supported by the National Natural ScienceFoundation of China (Nos 61602077 61902050 6167212261771087 51879027 51579024 and 71831002) Program forInnovative Research Team in University of Ministry ofEducation of China (No IRT17R13) High Education Sci-ence and Technology Planning Program of ShandongProvincial Education Department (Nos J18KA340 andJ18KA385) the Fundamental Research Funds for theCentral Universities (Nos 3132019355 3132019501 and3132019502) and Next-Generation Internet InnovationProject of CERNET (Nos NGII20181205 NGII20190627and NGII20181203)
References
[1] X Xia D Lo X Wang and B Zhou ldquoAccurate developerrecommendation for bug resolutionrdquo in Proceedings of theWorking Conference on Reverse Engineering pp 72ndash81Koblenz Germany October 2013
[2] W Pan H Ming C K Chang Z Yang and D-K KimldquoElementRank ranking java software classes and packagesusing a multilayer complex network-based approachrdquo IEEETransactions on Software Engineering 2019
[3] T Xie L Zhang X Xiao Y-F Xiong and D Hao ldquoCo-operative software testing and analysis advances and chal-lengesrdquo Journal of Computer Science and Technology vol 29no 4 pp 713ndash723 2014
[4] Q Wang S Wang Q Cui Q Wang M Li and J ZhaildquoLocal-based active classification of test report to assistcrowdsourced testingrdquo in Proceedings of the IEEEACM In-ternational Conference on Automated Software Engineeringpp 190ndash201 Singapore September 2016
[5] J Wang Q Cui Q Wang and S Wang ldquoTowards effectivelytest report classification to assist crowdsourced testingrdquo inProceeding of the ACMIEEE International Symposium onEmpirical Software Engineering and Measurement CiudadReal Spain September 2016
[6] M R Karim A Ihara X Yang H Iida and K MatsumotoldquoUnderstanding key features of high-impact bug reportsrdquo in
12 Complexity
Proceedings of the International Workshop on EmpiricalSoftware Engineering in Practice pp 53ndash58 Tokyo Japan2017
[7] H Li G Gao R Chen X Ge and S Guo ldquo+e influenceranking for testers in bug tracking systemsrdquo InternationalJournal of Software Engineering and Knowledge Engineeringvol 29 no 1 pp 1ndash21 2019
[8] T J Ostrand E J Weyuker and R M Bell ldquoWhere the bugsarerdquo in Proceedings of the ACM Sigsoft International Sym-posium on Software Testing and Analysis pp 86ndash96 BostonMA USA 2004
[9] M DrsquoAmbros M Lanza and R Robbes ldquoAn extensivecomparison of bug prediction approachesrdquo in Proceedings ofthe IEEE Working Conference on Mining Software Re-positories pp 31ndash41 Cape Town South Africa May 2010
[10] F Rahman and P Devanbu ldquoHow and why process metricsare betterrdquo in Proceedings of the International Conference onSoftware Engineering pp 432ndash441 San Francisco CA USA2013
[11] J Nam S J Pan and S Kim ldquoTransfer defect learningrdquo inProceedings of the International Conference on Software En-gineering pp 382ndash391 San Francisco CA USA May 2013
[12] Y Kamei E Shihab B Adams et al ldquoA large-scale empiricalstudy of just-in-time quality assurancerdquo IEEE Transactions onSoftware Engineering vol 39 no 6 pp 757ndash773 2013
[13] W Pan B Song K Li and K Zhang ldquoIdentifying key classesin object-oriented software using generalizedk-core de-compositionrdquo Future Generation Computer Systems vol 81pp 188ndash202 2018
[14] X Yang D Lo X Xia Y Zhang and J Sun ldquoDeep learningfor just-in-time defect predictionrdquo in Proceedings of the IEEEInternational Conference on Software Quality Reliability andSecurity pp 17ndash26 Vancouver Canada August 2015
[15] X Yang D Lo Q Huang X Xia and J Sun ldquoAutomatedidentification of high impact bug reports leveraging imbal-anced learning strategiesrdquo in Proceedings of the ComputerSoftware and Applications Conference pp 227ndash232 AtlantaGA USA June 2016
[16] M Ohira Y Kashiwa Y Yamatani et al ldquoA dataset of highimpact bugs manually-classified issue reportsrdquo in Proceedingsof the IEEE Working Conference on Mining Software Re-positories pp 518ndash521 Florence Italy May 2015
[17] E Shihab A Mockus Y Kamei B Adams and A E HassanldquoHigh-impact defects a study of breakage and surprise de-fectsrdquo in Proceedings of the ACM Sigsoft Symposium amp theEuropean Conference on Foundations of Software Engineeringpp 300ndash310 Szeged Hungary September 2011
[18] X-L Yang D Lo X Xia Q Huang and J-L Sun ldquoHigh-impact bug report identification with imbalanced learningstrategiesrdquo Journal of Computer Science and Technologyvol 32 no 1 pp 181ndash198 2017
[19] A Lamkanfi S Demeyer E Giger and B Goethals ldquoPre-dicting the severity of a reported bugrdquo in Proceedings of theIEEE Working Conference on Mining Software Repositoriespp 1ndash10 Cape Town South Africa May 2010
[20] X Xia D Lo M Wen E Shihab and B Zhou ldquoAn empiricalstudy of bug report field reassignmentrdquo in Proceedings of theIEEE Conference on Software Maintenance Reengineeringand Reverse Engineering pp 174ndash183 Antwerp Belgium2014
[21] S Guo R Chen M Wei H Li and Y Liu ldquoEnsemble datareduction techniques and multi-RSMOTE via fuzzy integralfor bug report classificationrdquo IEEE ACCESS vol 6pp 45934ndash45950 2018
[22] S Guo R Chen H Li T Zhang and Y Liu ldquoIdentify severitybug report with distribution imbalance by CR-SMOTE andELMrdquo International Journal of Software Engineering andKnowledge Engineering vol 29 no 6 pp 139ndash175 2019
[23] R Chen S K Guo X Z Wang and T L Zhang ldquoFusion ofmulti-RSMOTE with fuzzy integral to classify bug reportswith an imbalanced severity distributionrdquo IEEE Transactionson Fuzzy Systems vol 27 no 12 pp 2406ndash2420 2019
[24] V Lopez A Fernandez S Garcıa V Palade and F HerreraldquoAn insight into classification with imbalanced data empiricalresults and current trends on using data intrinsic charac-teristicsrdquo Information Sciences vol 250 no 11 pp 113ndash1412013
[25] H Li X Yang Y Li L-Y Hao and T-L Zhang ldquoEvolu-tionary extreme learning machine with sparse cost matrix forimbalanced learningrdquo ISA Transactions 2019
[26] N Bhargava and G Sharma ldquoDecision tree analysis on J48algorithm for data miningrdquo International Journal of AdvancedResearch in Computer Science and Software Engineering vol 3no 6 pp 1114ndash1119 2013
[27] IBM ILOG CPLEX Optimizer 2018 httpswwwibmcomanalyticsdata-scienceprescriptive-analyticscplex-optimizer
[28] J Anvik L Hiew and G C Murphy ldquoWho should fix thisbugrdquo in Proceedings of the International conference onSoftware Engineering pp 361ndash370 Shanghai China 2006
[29] W Deng J Xu and H Zhao ldquoAn improved ant colonyoptimization algorithm based on hybrid strategies forscheduling problemrdquo IEEE ACCESS vol 7 pp 20281ndash202922019
[30] W Deng H Zhao X Yang J Xiong M Sun and B LildquoStudy on an improved adaptive PSO algorithm for solvingmulti-objective gate assignmentrdquo Applied Soft Computingvol 59 pp 288ndash302 2017
[31] W Deng H Zhao L Zou G Li X Yang and D Wu ldquoAnovel collaborative optimization algorithm in solving com-plex optimization problemsrdquo Soft Computing vol 21 no 15pp 4387ndash4398 2017
[32] N Bettenburg S Just R Premraj and T ZimmermannldquoQuality of bug reports in eclipserdquo in Proceedings of theOOPSLA Workshop on Eclipse Technology Exchange pp 21ndash25 Montreal Canada 2007
[33] S Demeyer and A Lamkanfi ldquoPredicting reassignments ofbug reportsmdashan exploratory investigationrdquo in Proceedings ofthe European Conference on Software Maintenance andReengineering pp 327ndash330 Genova Italy March 2013
[34] L Wu B Xie G E Kaiser and R J Passonneau ldquoBUG-MINER software reliability analysis via data mining of bugreportsrdquo in Proceedings of the International Conference onSoftware Engineering Knowledge Engineering pp 95ndash100Miami Beach FL USA 2011
[35] L-Y Hao H Zhang W Yue and H Li ldquoQuantized slidingmode control of unmanned marine vehicles various thrusterfaults tolerated with a unified modelrdquo IEEE Transactions onSystems Man and Cybernetics Systems 2020
[36] L-Y Hao H Zhang W Yue and H Li ldquoFault-tolerantcompensation control based on sliding mode technique ofunmanned marine vehicles subject to unknown persistentocean disturbancesrdquo International Journal of Control Auto-mation and Systems 2019
[37] T Menzies and AMarcus ldquoAutomated severity assessment ofsoftware defect reportsrdquo in Proceedings of the IEEE In-ternational Conference on Software Maintenance pp 346ndash355 Beijing China September-October 2008
Complexity 13
[38] A Lamkanfi S Demeyer Q D Soetens and T VerdonckldquoComparing mining algorithms for predicting the severity ofa reported bugrdquo in Proceedings of the European Conference onSoftware Maintenance and Reengineering pp 249ndash258Oldenburg Germany 2011
[39] Y Tian D Lo and C Sun ldquoInformation retrieval basednearest neighbor classification for fine-grained bug severitypredictionrdquo in Proceedings of the Working Conference onReverse Engineering pp 215ndash224 Kingston Canada 2012
[40] L Yu W T Tsai W Zhao and F Wu ldquoPredicting defectpriority based on neural networksrdquo in Proceedings of theInternational Conference on Advanced Data Mining amp Ap-plications pp 356ndash367 Chongqing China November 2010
[41] J Kanwal and O Maqbool ldquoBug prioritization to facilitatebug report triagerdquo Journal of Computer Science and Tech-nology vol 27 no 2 pp 397ndash412 2012
[42] Y Tian D Lo and C Sun ldquoDrone predicting priority ofreported bugs by multi-factor analysisrdquo in Proceedings of theIEEE International Conference on Software Maintenancepp 200ndash209 Eindhoven Netherlands September 2013
[43] G Gao H Li R Chen X Ge and S Guo ldquoIdentification ofhigh priority bug reports via integration methodrdquo in Pro-ceedings of the CCF Conference on Big Data pp 336ndash349XirsquoAn China 2018
[44] A Sureka and P Jalote ldquoDetecting duplicate bug report usingcharacter N-gram-based featuresrdquo in Proceeding of the AsiaPacific Software Engineering Conference pp 366ndash374 SydneyAustralia 2011
[45] C Sun D Lo S C Khoo and J Jiang ldquoTowards more ac-curate retrieval of duplicate bug reportsrdquo in Proceedings of theIEEEACM International Conference on Automated SoftwareEngineering pp 253ndash262 Lawrence KS USA November2011
[46] Y Tian C Sun and D Lo ldquoImproved duplicate bug reportidentificationrdquo in Proceedings of the European Conference onSoftware Maintenance and Reengineering pp 385ndash390Szeged Hungary 2012
[47] L Feng L Song C Sha and X Gong ldquoPractical duplicate bugreports detection in a large web-based development com-munityrdquo in Proceedings of the Asia-Pacific Web Conferencepp 709ndash720 Sydney Australia 2013
[48] A Alipour A Hindle and E Stroulia ldquoA contextual approachtowards more accurate duplicate bug report detectionrdquo inProceedings of the Working Conference on Mining SoftwareRepositories pp 183ndash192 San Francisco CA USA 2013
[49] N Pingclasai H Hata and K I Matsumoto ldquoClassifying bugreports to bugs and other requests using topic modelingrdquo inProceedings of the Asia-Pacific Software Engineering Confer-ence pp 13ndash18 Bangkok +ailand 2014
[50] K Herzig S Just and A Zeller ldquoItrsquos not a bug itrsquos a featurehow misclassification impacts bug predictionrdquo in Proceedingsof the International Conference on Software Engineeringpp 392ndash401 San Francisco CA USA 2013
[51] M Alenezi K Magel and S Banitaan ldquoEfficient bug triagingusing text miningrdquo Journal of Software vol 8 no 9pp 2185ndash2190 2013
[52] R Shokripour J Anvik Z M Kasirun and S Zamani ldquoWhyso complicated Simple term filtering and weighting for lo-cation-based bug report assignment recommendationrdquo inProceedings of the Working Conference on Mining SoftwareRepositories pp 2ndash11 San Francisco CA USA 2013
[53] J B Lovins ldquoDevelopment of a stemming algorithmrdquo Me-chanical Translation and Computational Linguistics vol 11no 6 pp 22ndash31 1968
[54] S Wang and X Yao ldquoUsing class imbalance learning forsoftware defect predictionrdquo IEEE Transactions on Reliabilityvol 62 no 2 pp 434ndash443 2013
[55] H He and E A Garcia ldquoLearning from imbalanced datardquoIEEE Transactions on Knowledge Data Engineering vol 21no 9 pp 1263ndash1284 2009
[56] Y Kamei A Monden S Matsumoto T Kakimoto andK I Matsumoto ldquo+e effects of over and under sampling onfault-prone module detectionrdquo in Proceedings of the In-ternational Symposium on Empirical Software Engineering andMeasurement pp 196ndash204 Madrid Spain 2007
[57] T M Khoshgoftaar X Yuan and E B Allen ldquoBalancingmisclassification rates in classification-tree models of softwarequalityrdquo Empirical Software Engineering vol 5 no 4pp 313ndash330 2000
[58] N V Chawla K W Bowyer L O Hall andW P Kegelmeyer ldquoSMOTE synthetic minority over-sam-pling techniquerdquo Journal of Artificial Intelligence Researchvol 16 no 1 pp 321ndash357 2002
[59] Y Liu X Wang Z Zhai R Chen B Zhang and Y JiangldquoTimely daily activity recognition from headmost sensoreventsrdquo ISA Transactions vol 94 pp 379ndash390 2019
[60] C G Weng and J Poon ldquoA new evaluation measure forimbalanced datasetsrdquo in Proceedings of the Australasian DataMining Conference pp 27ndash32 Glenelg Australia 2008
[61] J Han and M Kamber Data Mining Concepts andTechniquesrsquo Morgan Kaufmann Publishers Inc BurlingtonMA USA 2nd edition 2006
[62] S B Kotsianti and D Kanellopoulos ldquoCombining baggingboosting and dagging for classification problemsrdquo in Pro-ceedings of the Knowledge-Based Intelligent Information andEngineering Systems and Italian Workshop on Neural Net-works pp 493ndash500 Vietri sul Mare Italy 2007
[63] L Rokach ldquoEnsemble-based classifiersrdquo Artificial IntelligenceReview vol 33 no 1-2 pp 1ndash39 2010
[64] G Wang J Sun J Ma K Xu and J Gu ldquoSentiment clas-sification the contribution of ensemble learningrdquo DecisionSupport Systems vol 57 no 1 pp 77ndash93 2014
[65] A G Karegowda M A Jayaram and A S ManjunathldquoCascading k-means with ensemble learning enhanced cat-egorization of diabetic datardquo Journal of Intelligent Systemsvol 21 no 3 pp 237ndash253 2012
14 Complexity
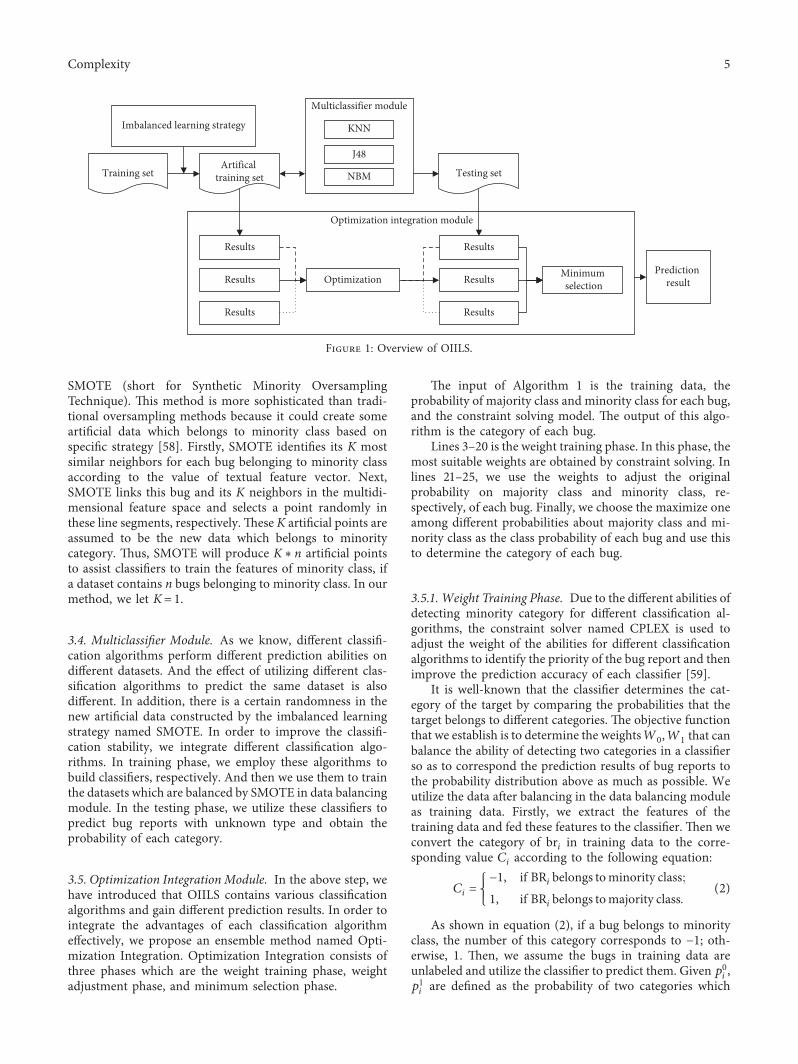
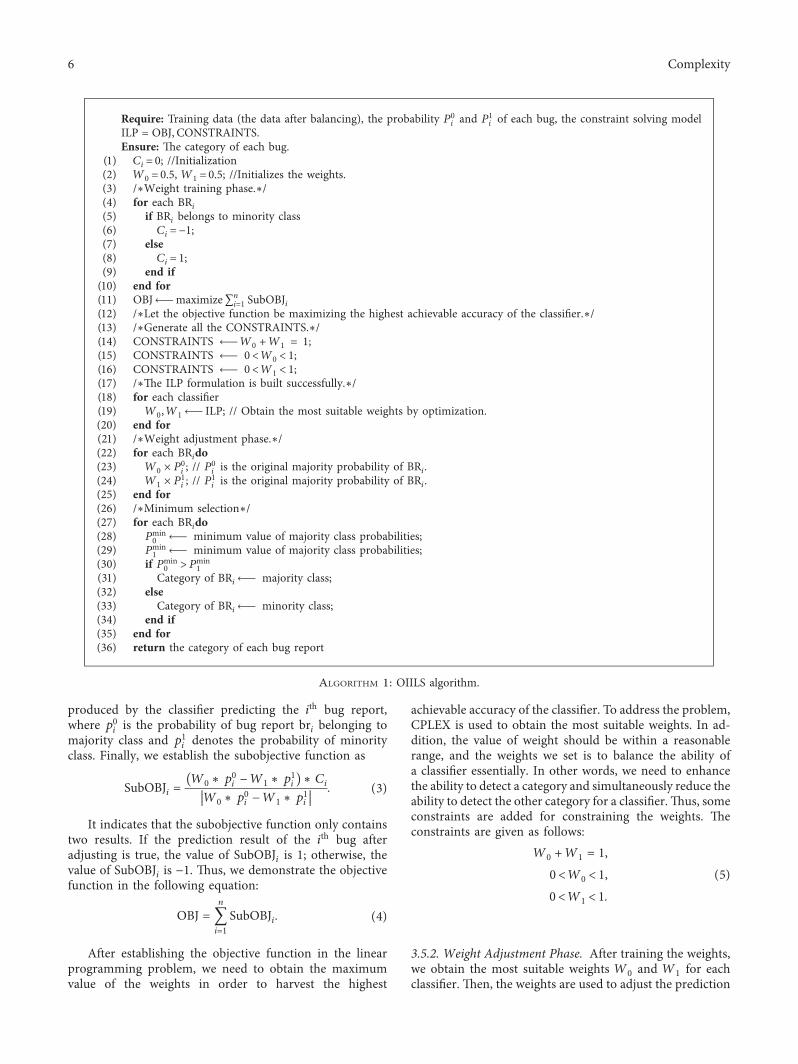
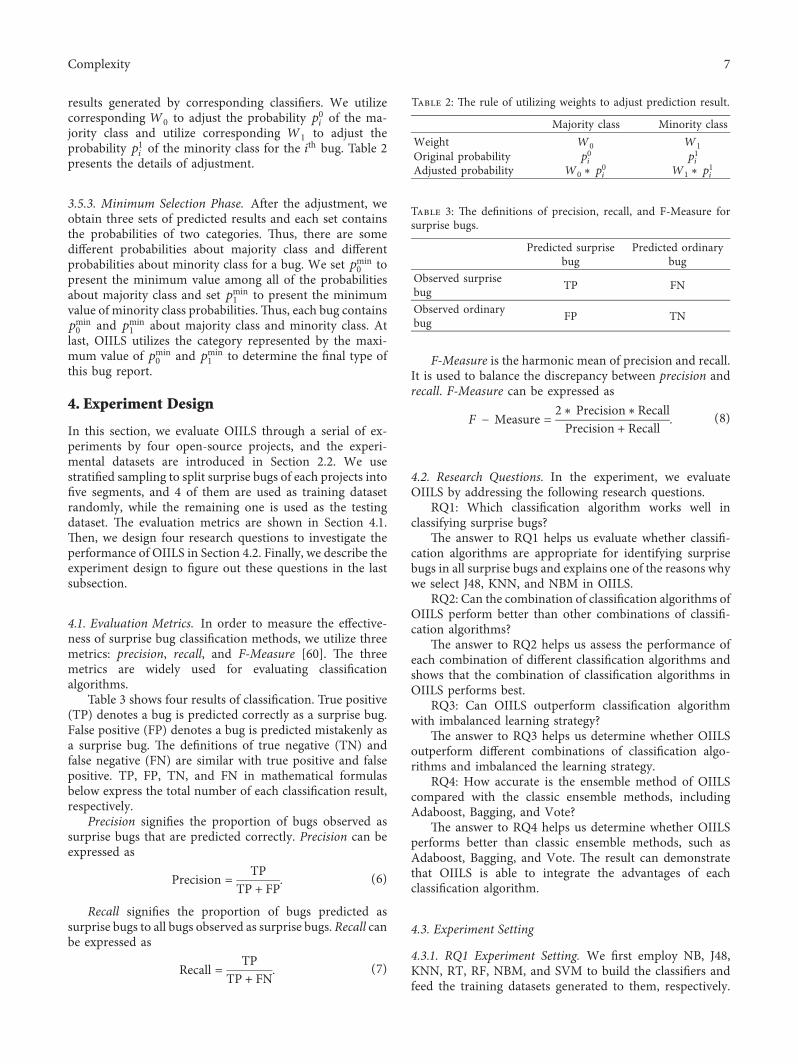
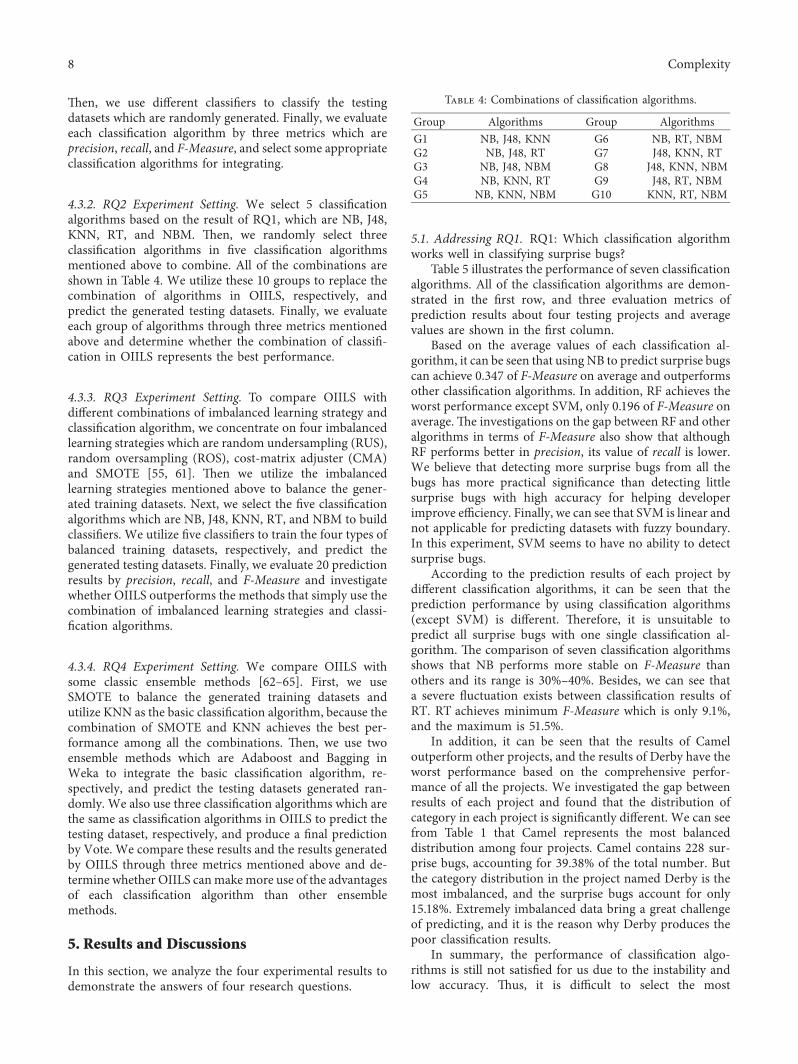
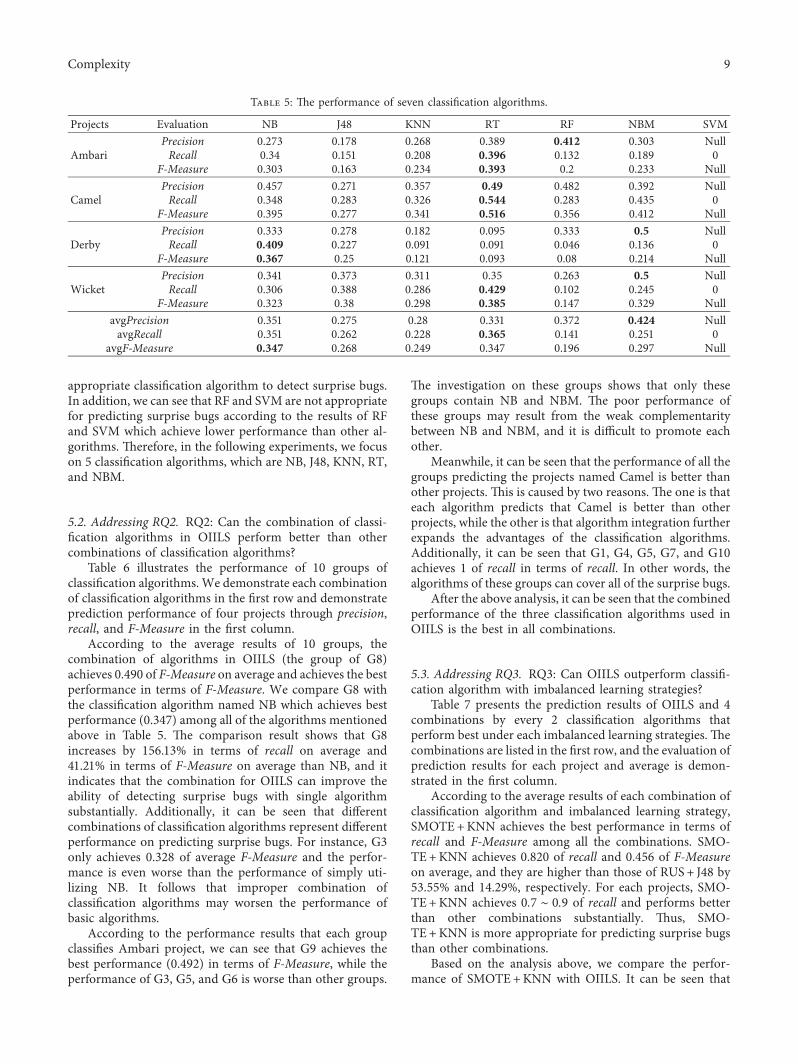
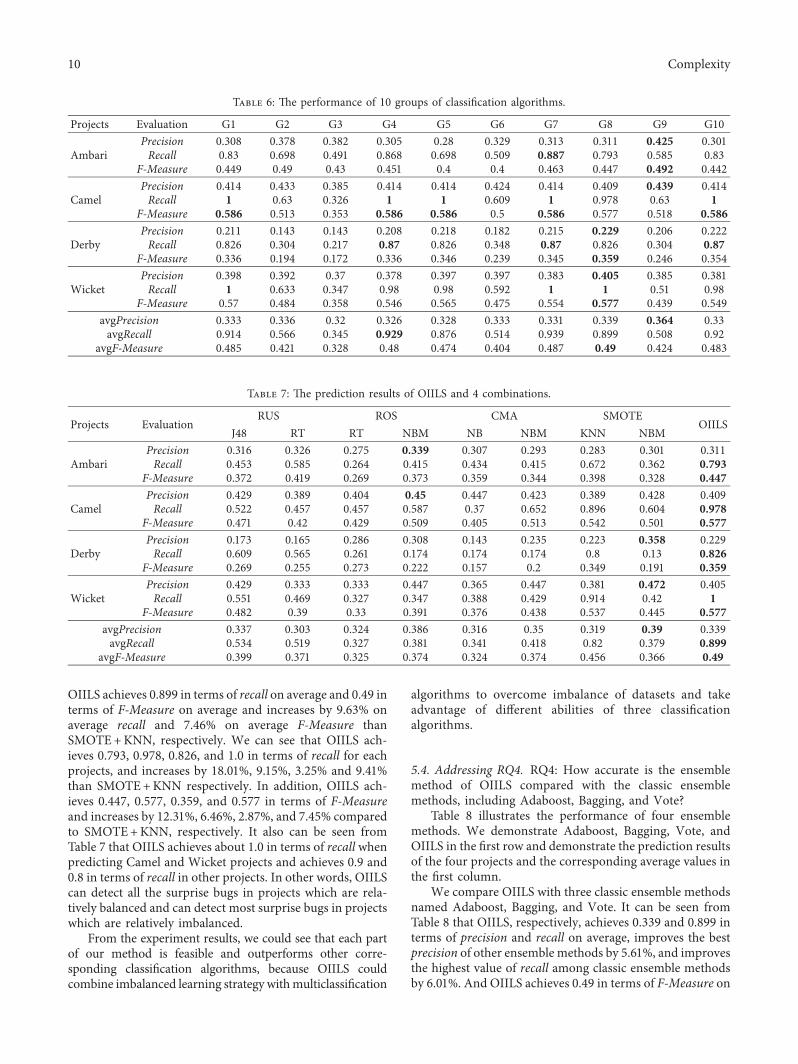
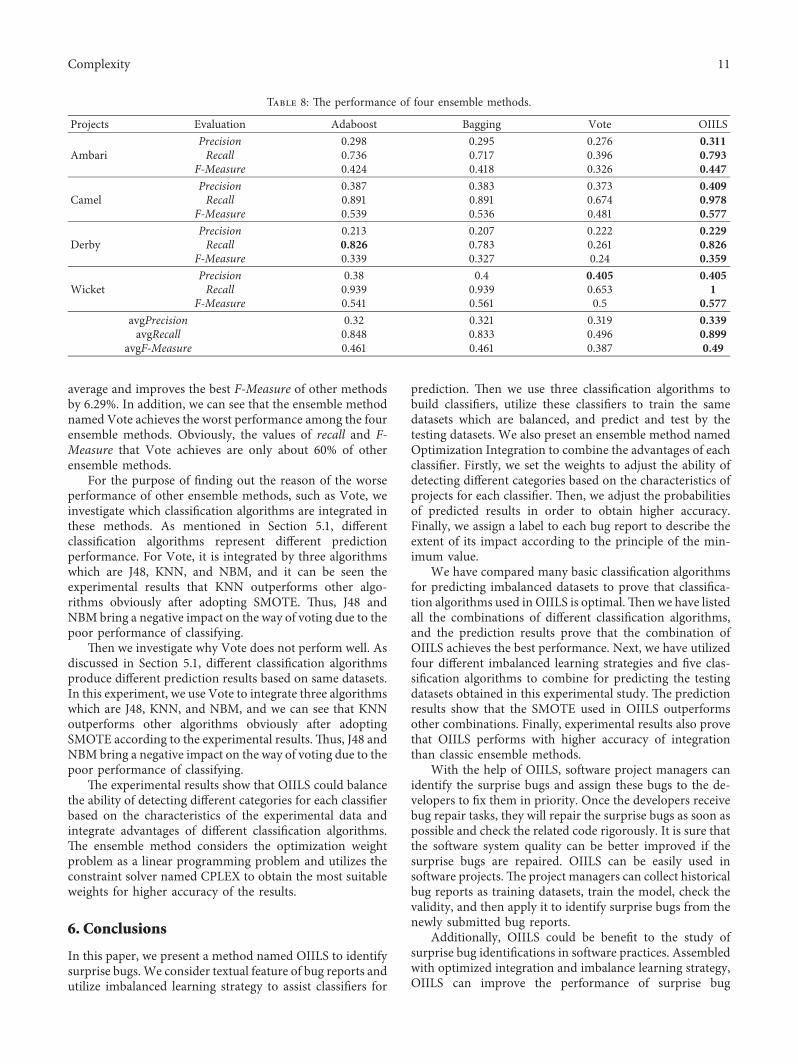


