
STOCK MARKET LINKAGES IN EMERGING MARKETS:IMPLICATIONS FOR INTERNATIONAL PORTFOLIO
DIVESRIFICATION
Kate Phylaktis* Fabiola RavazzoloCity University Business School City University Business School
London London
JEL Classification Number: F36, G15
Keywords: Capital market linkages; emerging markets; common stochastic trends;international portfolio diversification
Abstract
This paper examines stock market linkages of a group of Pacific-Basin countries withU.S. and Japan by estimating the multivariate cointegration model in both theautoregressive and moving average forms over the period 1980-1998. Recursiveestimation helps identify the evolution of the linkages. The results for the 1980sindicate that the relaxation of foreign ownership restrictions was not sufficient toattract foreign investors' attention and that other factors must have affected theportfolio diversification decision. The results of the 1990s suggest that the relaxationof the restrictions might have strengthened international market interrelations.Country Funds have provided access to highly regulated capital markets.
* Correspondence to: Kate Phylaktis, City university Business School, FrobisherCrescent, Barbican Centre, London EC2Y 8HB.Tel: 020-70408735; Fax: 020-70408881; and Email: [email protected].

2
1. Introduction
Financial literature has presented a strong emphasis on the interaction amongst
international stock markets. The interest has increased considerably following the
abolition of foreign exchange controls in both mature and emerging markets, the
technological developments in communications and trading systems, and the
introduction of innovative financial products, such as Country Funds and American
Depository Receipts, which have created more opportunities for global international
investments. In particular, the new remunerative emerging equity markets have
attracted the attention of international fund managers as an opportunity for portfolio
diversification and have also intensified the curiosity of academics in exploring
international market linkages.1
The earliest studies on international stock market linkages have focused on the
identification of short-term benefits of international portfolio diversification. For
example, Levy and Sarnat (1970) and Solnik (1974), examined short-term correlations
of returns across national markets and pointed out the existence of substantial
possibilities to diversify internationally. More recently, Eun and Shim (1989), Hamao
The authors wish to thank an anonymous referee, Geert Bekaert and Roy Batchelor
for helpful comments. They also received useful suggestions from the participants of
the European Financial Management Association in Lugano, the Multinational
Finance Association in Garda, the Oxford University and City University Business
School workshops. The authors gratefully acknowledge financial support from the
Emerging Markets Group, at City University Business School, London.
1 See e.g. Hawawini (1994) for evidence on the increasing flow of funds to new
capital markets and the importance of these markets to portfolio management.
3
et al. (1990), Koch and Koch (1991), Roll (1992), Longin and Solnik (1995),
exploited more sophisticated econometric techniques to measure cross-country
correlations, and found evidence of significant linkages between stock markets around
the world. Other studies have focused on the evolution of linkages of emerging
capital markets. Studies such as Harvey (1995), but particularly Bekaert and Harvey
(1995), examined one period returns and the conditional means and variances of one
period returns by examining a one factor asset pricing model, which did not assume
the degree of segmentation to be constant through time. They allowed conditionally
expected returns in a country to be affected by their covariance with a world
benchmark portfolio and by the variance of the country returns. If the market was
perfectly integrated then only covariance counted, while if the market was completely
segmented then the variance was the relevant measure of market risk. Bekaert and
Harvey (1995) used a conditional regime-switching model to account for periods
when national markets were segmented from world capital markets and when they
became integrated later in the sample.
Other studies have measured financial linkages (see Phylaktis and Ravazzolo
(2001)) by analysing the covariance of excess returns on national stock markets of
emerging economies. A major advantage of this framework is that by examining the
comovement of future returns aggregated over a long horizon instead of the
comovement of one period expected returns one can detect small but persistent
movements in expected returns and more accurately measure the degree of financial
integration than one period stock return regression models.
Another group of studies has concentrated on examining financial links
amongst stock markets by using either bivariate or multivariate cointegration
methodology. Taylor and Tonks (1989) were the first to apply bivariate cointegration
4
on the UK and U.S. markets to test the importance of the latter after the abolition of
foreign exchange controls in 1979;2 while Kasa (1992) was the first to apply
multivariate cointegration method to five well-established financial markets in order
to estimate the permanent and transitory components of stock price series and
examine the existence of a single common stochastic trend as a driver of the
cointegrated system. When markets share a single common stochastic trend, then this
means that these markets are perfectly correlated over long horizons and there are
limited gains to international diversification.
In the current study, we apply Kasa's (1992) approach and examine the
potential inter-relationships amongst the trending behaviour of the stock price indices
of a group of Pacific-Basin countries, Japan and U.S. These capital markets have
attracted a substantial proportion of international capital flows to emerging markets.
In 1996, 48 percent of net private capital flows to all emerging market economies3
was directed to the Asian4 capital markets. Our analysis is conducted in the light of
2 Other researchers, such as, Arshanapalli and Doukas (1993), have used bivariate
cointagretion to explore changes in patterns of dynamic interactions among national
stock market indices following the October 1987 crash.
3 See "World Economic Outlook", (October 1999) published by the International
Monetary Fund. Net capital flows comprise net direct investment, net portfolio
investment, and other long- and short-term net investment flows, including official
and private borrowing. Emerging markets include developing countries, countries in
transition, and Korea, Singapore, Taiwan Province of China, and Israel. Data for
Hong Kong are not available.
4 It includes the economies of Indonesia, Korea, Malaysia, Philippines, Singapore,
Taiwan, and Thailand.

5
Richards' (1995) comments on the selection of the correct order of VAR systems; and
the use of a more sophisticated technique in the estimation of the common stochastic
trend system, which is equivalent to the permanent component of stock prices, as
recommended by Gonzalo and Granger (1995). Richards (1995) criticised Kasa
(1992) for using extra lags to capture the possible effect of mean reversion in equity
prices and make the error terms from the VARs more consistent with the
Gaussian/i.i.d. assumption under which the Johansen methodology is derived. He
noted that serial correlation was not present in the lower order VARs estimated by
Kasa and that the inclusion of extra lags to remove the non-normality of residuals was
inappropriate. He suggested the use of the Akaike and Schwartz information criteria,
(AIC) and (SIC) respectively, for the selection of the correct order VAR systems.5 In
fact, when he repeated Kasa's estimation and in addition corrected for small sample
bias, number of variables and lags as recommended by Reimers (1992) and Gregory
(1994), he found that the five stock markets were not cointegrated in contrast to the
results of Kasa that there were four cointegrating vectors and one single common
stochastic trend.
As mentioned before the multivariate cointegration analysis will be applied in
the current paper to a group of Pacific-Basin countries and the U.S. In particular, the
objective is to identify how the financial links have evolved during the 1980s and
1990s and whether they bear any relationship to the existence of foreign exchange
restrictions. As Bekaert and Harvey (2000) point out liberalisation may not be
enough to induce foreign investors to actually invest in the country. Home bias or
other concerns, such as lack of information on company stocks, may impede
5 Reimers (1992) finds also that the SIC does well in selecting the lag length.

6
international investment.6 On the other hand, economic integration between countries
may provide a channel for linking stock markets even in the presence of foreign
exchange controls.7 Economic integration between countries implies a comovement
in their output, corporate earnings and consequently in their stock markets.8
We will be examining the financial links of these markets by estimating the
multivariate cointegration model in both the autoregressive and moving average
forms.9 The autoregressive form allows us to examine the long-run relationships of
these markets, and the moving average form the relative importance of each market to
the common trend or, alternatively, the relative importance of the trend to each
market. Finally, we apply the recursive analysis to the cointegrating system
developed by Hansen and Johansen (1998) in order to identify the evolution of
linkages of these capital markets during the 1980s and 1990s. That constitutes a
novel approach to examining this issue. The same technique allows us to examine the
effects of the Asian crisis of mid 1997 on the financial linkages of the region.
6 See also Levine and Zervos (1996).
7 Support for this proposition can be found in Phylaktis and Ravazzolo (2001). They
find overwhelming evidence that economic integration always accompanies financial
integration.
8 The long-run positive relationship between economic activity and stock prices has
been confirmed theoretically and empirically (see e.g. Cheung and Ng (1998), Canova
and DeNicole (1995), Roll (1992), and Schwert (1990)).
9 Although in our analysis we did not explicitly take into account the relative size of
each market, we would expect large markets with high capitalisation to provide more
opportunities to international investors, and that may foster closer financial links with
other markets.
7
The analysis in the paper has implications for international portfolio
diversification. If stock markets share a common trend, that implies that the markets
move together and anyone market will be representative of the behaviour of that
group of markets. That is the markets are driven by common shocks, which have a
permanent effect, providing limited long-term gains to international diversification.
If, however, there are persistent deviations from the common trend, then international
investors might make short term speculative investments based on the forecast that the
market will revert to its long-term relationship with the world market. The
methodology used in this paper, that is, the moving average representation of the
multivariate cointegration model, allows us to estimate the transitory component of
each market and explore possible short-term diversification benefits.
The paper is structured as follows. Section 2 explains the multivariate
cointegration model in autoregressive (AR) and moving average (MA) forms. It also
introduces the recursive-based method to test for the evolution of stock market
linkages. Section 3 reports the empirical results of the analysis of the cointegration
space and the complementary common trend system. The final section summarises
the main findings and offers some concluding remarks.
2. The multivariate cointegration model
2.1 The autoregressive (AR) representation
Financial literature affirms that stock price levels are non-stationary. In operating
with non-stationary variables one can focus on the first differences of time series and
apply the basic regression analysis to study potential links between their short-term
movements. Otherwise, one can use the cointegration technique, introduced by

8
Granger (1981) and developed by Engle and Granger (1987), to analyse relationships
amongst series, which overcomes the problem of non-stationarity and allows the
investigation into both the levels and first differences of stock prices.
In the current study, we apply the multivariate cointegration analysis of
Johansen (1988, 1991) to investigate the linkages amongst a group of stock price
levels by looking for the existence of potential linear combinations amongst them.
Consider a vector Yt that contains p variables. If all p variables are integrated
of order one, I(1), then the VAR(k) model can be written in the error-correction form
as:
∆ Yt = ΠYt-1 + ∑−
=−∆Γ
1
1
k
iiti Y + µ + θDt + εt, (1)
where k is the order of the VAR system; µ is a vector of constants; Dt is a vector of
seasonal dummies orthogonal to the constant; and εt is i.i.d. errors. The matrix Π, in
equation (1) is defined as αβ', where α and β are (p × r) matrices; it has rank equal to
r; and it can be written as Π = -(I - A1 - …. - Ak); and the matrix Γi = - (I - A1 - …. -
Ai), with i = 1, .., k.
As shown in Johansen and Juselius (1990), the estimation procedure is
simplified by reformulating model (1) as:
R0t = αβ' R1t + error, t = 1, …, T. (2)
The vector R0t and R1t obtained as residuals from the auxiliary regressions:
∆Yt = ttt RDBzB 0211ˆˆ ++∆ − (3)
and
Yt-1 = ttt RDBzB 1413
ˆˆ ++∆ − , (4)
where B1, B2, B3 and B4 are estimated by ordinary least squares regressions. The
maximum likelihood estimator of β is found by solving the equation
9
0011
001011 =− − SSSSλ , (5)
which gives the eigenvalues pλλ ˆ...1̂ ff and the corresponding eigenvectors
)ˆ,...,ˆ(ˆ1 pvvV = normalized such that IVSV =ˆ'ˆ
11 . The matrices S11, S10 and S00 are
appropriately defined covariance matrices (for further details, see Johansen and
Juselius (1990)). The eigenvalues iλ̂ correspond to the squared canonical correlations
between the "levels" residuals and the "difference" residuals, as defined above. The
eigenvectors iv̂ determine the linear combinations ti zv 'ˆ , i =1, k-1.
The Johansen likelihood ratio test statistic of the null hypothesis that there are
at most r cointegrating vectors 0 ≤ r ≤ p, and thus (p-r) common stochastic trends is
trace = -T )ˆ1ln(1
∑+=
−p
riiλ , (6)
where iλ̂ 's are the p-r smallest squared canonical correlations as described above.
In this study, we define Yt as composed of p elements, which represent the
stock price indices of a selected group of financial markets.10 We use the trace
statistic to test if the system of p markets is cointegrated and identify the number of
long-run relationships they share. We perform the exclusion statistic tests on the
coefficients of the cointegrating vectors related to each stock market to examine
whether it is participating to the cointegration space.11 If the null hypothesis of
exclusion of the market from the cointegration space is rejected, then that confirms
the existence of close links amongst the markets in the system. In the case where the
10 The data representing the stock price indices are transformed by natural logarithms.
11 The test statistic is a χ2 distributed with r degrees of freedom.

10
null hypothesis is accepted it is concluded that there is no cointegration amongst the
group of markets and therefore no close financial links.12
2.2 The recursive estimation of the trace test statistics
The selection of the cointegrating rank is one of the most sensitive steps in the
cointegration analysis. Stepthon and Larsen (1991) have shown that Johansen's test
may be characterised by sample dependency. This is specifically relevant to our study
for two reasons. First, the liberalisation of stock markets could have attracted the
interest of international investors and affected the amount of capital inflows to those
markets inducing an increase in the degree of comovements with the rest of the
financial world. Secondly, the Asian financial crisis in mid 1997 might have
temporarily affected the links amongst international stock markets, as previously
verified by work on the 1987 stock market crash and the Mexican crisis (see e.g.
Dwyer and Hafer (1988), Hardouvelis (1988), King and Wadhwani (1990), and Roll
(1989) on the 1987 crash; and Calvo and Reinhard (1996) on the Mexican crisis).
Moreover, the application of this analysis could be exploited to identify when
financial links strengthened and whether that coincided with events of liberalisation.
We apply the recursive estimation suggested by Hansen and Johansen (1998)
in the estimation of cointegrated VAR models, using estimates from the Johansen
FIML technique under two VAR representations. In the "Z-representation" all the
parameters of VECM are re-estimated during the recursions, while under the "R-
12 It should be noted that Kasa (1992) did not present these exclusion tests on the
coefficients of the cointegrating vectors and as a result it is not clear whether all
markets contributed to the cointegration space.

11
representation" the short-run parameters are kept fixed to their full sample values and
only the long-run parameters are re-estimated.
We perform the trace tests to visually inspect the time path of these statistics
and identify potential changes in the rank r over time or during the Asian crisis. From
equation (6) each Trace test is calculated as
Tracej = T )ˆ1ln(∑=
−p
jiiλ , j = 1, …, p-1, (7)
and each statistic is scaled by the 90% quantile of the trace distribution derived for the
select model.13 For a specific t, we identify the rank r as the number of Tracej
statistics presenting an upward slope and above the critical value of one, which
indicates the 10 percent statistical significance. Thus, when estimating the model
recursively on a group of stock markets, which is in the process of moving together,
the convergence should show up in an increasing number of cointegration vectors
being accepted as the system is being increasingly driven by the same common
stochastic trends.
2.3 The moving average (MA) representation of cointegrated systems
The study of a cointegrated system can be conducted in a dual way. This is
because of a direct relationship between the number of stationary relations, r, of a p-
dimension system, and the number of linearly independent non-stationary relations, p-
r, defined as common trends. As introduced by Stock and Watson (1988), if a
cointegrated system of p variables present r linear combinations, then the p
13 The model does not include exogenous variables or dummies. In case of inclusion
of these variables the critical value has to be computed again.
12
components share p-r common trends. Thus, if four stock markets are found to share
3 linear combinations, then these markets share one (4-3) common trend.
The duality between the number of cointegration relations and common trends
is useful for a full understanding of the generating mechanism of our system of stock
markets. While the autoregressive form is informative about the long-run
relationships amongst the stock markets, which is useful in identifying if a group of
financial markets is linked together, the moving average form is informative about the
underlying stochastic and deterministic trends and helpful in recognizing the
components driving the system of markets.
The moving average representation of model (1) is given by:
∆Yt = C(L)(εt + µ + φDt), (8)
where C(L) can be developed as C(L) = C(1) + (1-L) C~ (L), (see Engle and Granger
(1987)). In integrated form (8) is given by:
Yt = Y0 + ))((~
11t
t
iti
t
ii DLCDCtCC φεφµε ++++ ∑∑
==
, (9)
where C = C(1) and C~ (L) = (1-L) -1[C(L)-C(1)].
As shown in Johansen (1991) the link to the AR form of the model is given by
C = β⊥(α⊥'(-I + Γ1)β⊥)-1α⊥', (10)
where α⊥ and β⊥ are the orthogonal complements of α and β, respectively. The
matrix α⊥, of order p × (p-r), reports the coefficients of the common trends indicating
the contribution of each component to the stochastic vector; and the matrix β⊥, of
order p × (p-r), includes the loading factors indicating the effect of each common

13
trend on each variable. The matrix C determines how the non-stationary part of the
process Yt is generated from the underlying stochastic and deterministic trends.14
Gonzalo and Granger (1995) show that the matrix C also identifies the
permanent component of a system. A simple decomposition of Yt into its transitory
and common trend components based on the estimators from the cointegration tests, is
Yt = α(β'α)-1Xt + β⊥(α⊥'β⊥)-1Zt, (11)
where Xt = β'Yt is defined as the stationary or transitory process (which is actually the
deviation from the cointegration relationship), Zt = α⊥ 'Yt is defined as the non-
stationary permanent component.15 Gonzalo and Granger (1995) demonstrated that
this non-stationary permanent component in the decomposition (11) corresponds to
the common trend of the Stock-Watson decomposition through the Wold
representation of ∆Yt,
∆Yt = C(L)εt = C(1) εt + tLC ε)(~∆ , (12)
where C(1) is defined as in equation (10) for the model (1) and )(~
LC is defined as in
equation (9).16
14 From equation (1) it is easy to verify that the choice of variables in Dt can affect the
statistical description of the trend component in Yt. To make sure that there are no
seasonal trend effects in the model, in case there are fixed seasonal effects in the data,
we use centered seasonal dummies.
15 See also Park (1990) for a similar decomposition of Yt.
16 It should be noted that this correspondence applies by imposing the condition that
the permanent component is a linear combination of the variables and that the
transitory component does not have any permanent effect on the variables.

14
In our analysis, we estimate the moving average representation of the
cointegrated system in order to investigate the non-stationary or permanent
component, which drives the set of capital markets in the long-run.
3. The empirical evidence of integration
3.1 Data
The sample of countries examined in the paper includes: Japan, U.S., Hong
Kong, South Korea, Malaysia, Singapore, Taiwan and Thailand.17 The sample period
covers from January 1980 to December 1998. The data consist of end of the month
observations of stock market index prices (1990=100) expressed in local currency.
The data were obtained from Datastream. The stock market index prices used are as
follows: the Hang Seng Price Index for Hong Kong; the Nikkei 225 for Japan; the
Korean Stock Exchange composite for Korea; the Kuala Lumpur Stock Exchange
Composite Price Index for Malaysia; the Singapore Straits Times Price Index for
Singapore; the Taiwan Stock Exchange weighted - price index for Taiwan; the
Bangkok S.E.T. Price Index for Thailand; and the Standard and Poor's 500
Composition Index for the U.S.
The analysis in the paper was repeated using stock price indices expressed in
local currencies, in U.S. dollars and in real U.S. dollars (named real terms in the rest
of the paper). The logarithm of stock market index price expressed in U.S. dollars
was computed as PBCt
it eSP lnln − , where i
tSP was the stock market index price for
17 It was our intention to include Indonesia and the Philippines as well. However,
because data were available only from May 1983 for Indonesia and January 1986 for
the Philippines, we excluded these two countries.
15
country i, and PBCte was the nominal exchange rate defined as local currency per U.S.
dollar. The logarithm of stock market index price expressed in U.S. dollars and in
real terms was defined as ln itSP - ln PBC
te - ln UStCPI , where i
tSP is defined as above
and UStCPI is the U.S. consumer price index. 18
3.2 Criteria for selecting potential groups of closely linked stock markets
Strong links amongst capital markets are expected to be found when there is a
high degree of openness. However, previous studies on international linkages have
found surprising results. For instance, Bekaert and Harvey (1995) when analysing the
time-varying integration of twelve emerging markets for the period December 1975 to
the end of 1992, found that some markets appeared more integrated than one might
have expected based on prior knowledge of investment restrictions, such as ownership
restrictions and taxes.19 Phylaktis and Ravazzolo (2000) in analysing potential
linkages between stock prices and exchange rate dynamics for a group of Pacific-
Basin markets show lack of comovement during the eighties for the free stock
markets of Hong Kong and Singapore. In contrast, in the same study the authors
found that markets were closely linked during the nineties even in countries such as
Indonesia, Philippines and Thailand, where capital markets still had foreign exchange
restrictions. This evidence underlines the fact that capital market liberalisation is
neither a necessary nor a sufficient condition for close international financial market
linkages and that other factors might exert an effect, such as information availability,
18 Calculating the stock market index in U.S. dollars eliminates the location inflation.
However, the U.S. inflation remains in the stock price level.
19 For instance the markets of Korea, Taiwan and Thailand.

16
accounting standards, and investor protection; and specific emerging equity market
risks, such as liquidity, political or currency risks (see Bekaert (1995). At the same
time, there can also be a situation in which foreign investors use alternative vehicles,
such as Country Funds, to enter equity markets with foreign restrictions.
Based on these observations we select the group of countries to examine the
presence of linkages by adopting the following criteria. First, we select the free
capital markets. In the case where no linkages are found amongst these markets and
the ones of Japan and the U.S., we use an alternative criterion. We consider equity
markets in which foreign ownership restrictions are still in existence, but there are
alternative financial vehicles to allow foreign investors to invest in them. Bekaert and
Harvey (2000), Bekaert (1995) and Chang, Eun and Kolodny (1995) suggest Country
Funds as an alternative channel for entering restricted capital markets.
Information regarding the date of official liberalisation as reported by the
International Finance Corporation (IFC) and the date of the First Country Fund (FCF)
and American Depository Receipts (ADRs) is given in Table 1. The IFC date is based
on the Investibility index, which represents the ratio of the market capitalisation of
stocks that foreigners can legally hold to total market capitalisation. A large jump in
the Index is evidence of an official liberalisation. What is clear is that all countries
had either liberalised or started the process of liberalisation by the beginning of the
1990's.20 Thus, dividing the sample period into two sub-periods, the pre-liberalisation
ending in December 1989, and the post-liberalisation sub-period covering the period
between January 1990 and December 1998, seems appropriate for examining the
effect of stock market liberalisation on financial links between the countries. It
20 Table 1 gives also the extent of some of the main direct and indirect barriers at the
end of 1989.
17
should be noted that in the case of favourable results to close financial linkages the
application of recursive estimation will provide us with further details of their
evolution over time.
3.3 The analysis of the cointegration space
Before testing for cointegration we tested for unit roots in all stock market
indices expressed in local currencies, in U.S. dollars, and in real terms. The results
are not presented but can be made available by the authors. We used the Augmented
Dickey Fuller test with and without trend as recommended by Engle and Granger
(1987) and the Phillips and Perron (1988) test again with and without trend. We
found that the null hypothesis of a unit root for the first difference can be rejected for
all series. On the other hand, the null hypothesis of a unit root in levels was accepted
in all cases.21 Thus, like most financial series, the stock market levels are I(1), which
means that first differencing is required to achieve stationarity.
We proceeded to test for cointegration for the selected group of Pacific Basin
stock markets and the financial markets of Japan and the U.S. We use the Johansen
trace statistic, which is corrected for small sample bias (see Reimers (1992)).22 Thus,
21 Lags were added in order to induce whiteness of the residuals.
22 The trace test appears to be more robust to nonnormality of errors compared to the
maximal eigenvalue (see Cheung and Lai (1993) for Monte Carlo results on this
issue).

18
we use (T - pk) in equation (6) instead of T. The lag length was one and was chosen
by applying the (AIC) and (SIC) on the undifferenced VAR models.23
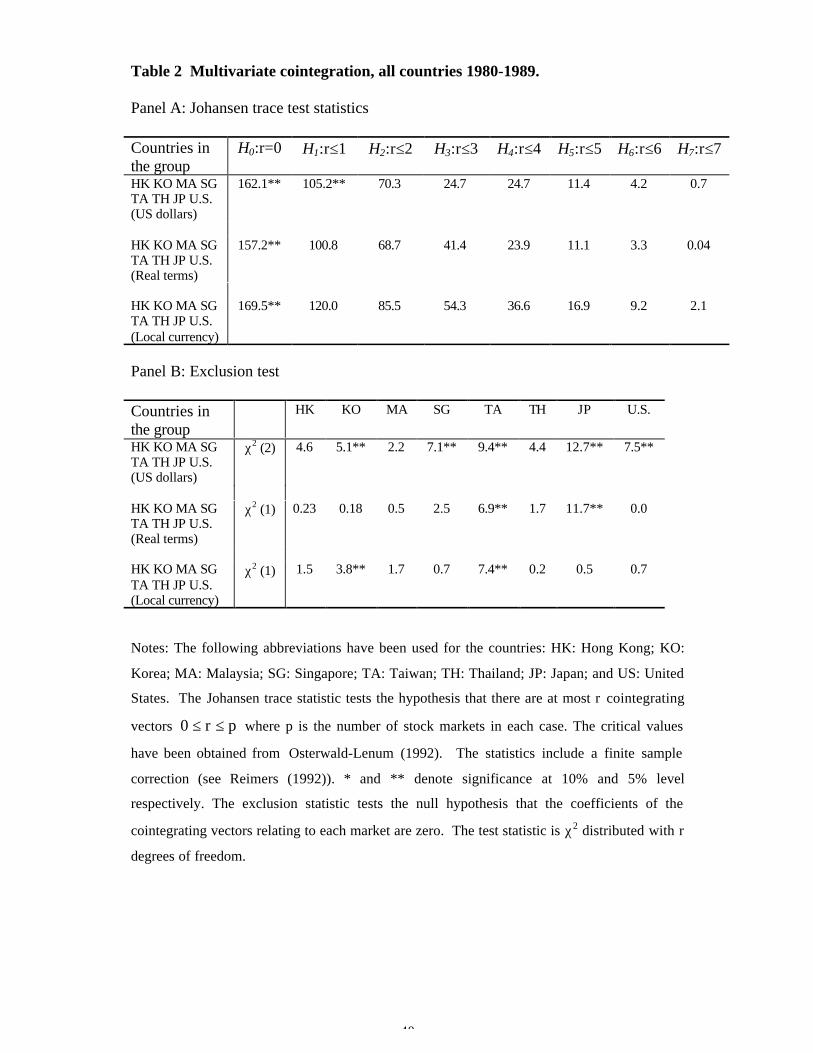
We started our investigation by testing for the presence of cointegration for the
period 1980 to 1989 amongst all the Pacific Basin capital markets of our sample, i.e.
Hong Kong, Korea, Malaysia, Singapore, Taiwan, Thailand and the established
financial markets of Japan and the U.S. The analysis was performed for three
different cases: the stock price indices expressed in U.S. dollars, the stock price
indices expressed in U.S. dollars and deflated by the U.S. consumer price index as has
been used by Kasa (1992) and the stock price indices expressed in local currency.
The results of the Johansen trace tests are reported in panel A of Table II and suggest
the selection of two cointegrating vectors for the system when indices are expressed
in U.S. dollars and one cointegrating vector for the systems when indices are
expressed in real terms and local currency. The results of the exclusion tests are
reported in panel B of Table 2 and show that when indices are expressed in U.S.
dollars the stock markets of Hong Kong, Malaysia and Thailand can be excluded from
the system, or in others words they do not participate to the cointegration space. The
exclusion tests for the system when indices are expressed in real terms show that only
Taiwan and Japan cannot be excluded from the cointegration space; and finally the
results of the exclusion tests for the system when the indices are expressed in local
currency show that only Korea and Taiwan cannot be excluded from the cointegration
space. Thus, the findings indicate lack of linkages amongst the group of Pacific Basin
23 To test the sensitivity of the results to the selection of k the analysis was repeated
by using higher number of lags. We obtained similar results to the ones of a lower-
order VAR system.
19
capital markets of Hong Kong, Korea, Malaysia, Singapore, Taiwan, Thailand and the
developed equity markets of Japan and U.S. in all three cases.
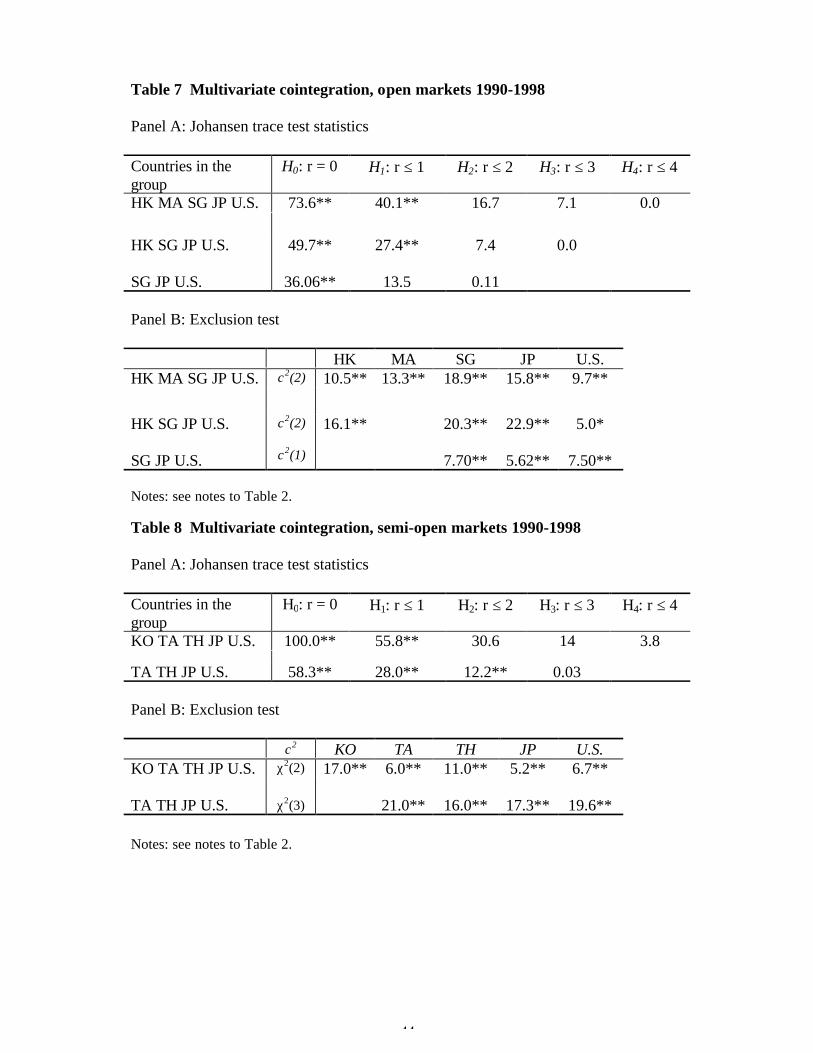
We proceeded the analysis by selecting smaller groups of capital markets to
investigate for the presence of cointegration using the criteria discussed in section
3.2.24 We tested first to see whether the open equity markets of Hong Kong,
Malaysia, and Singapore are cointegrated with Japan and U.S. The results of the
Johansen trace tests are reported in panel A of Table 3 and show lack of cointegration
amongst this group of countries. Since the openness of the Malaysian capital market
only started in the late eighties and might have affected the cointegration results
amongst the considered group of countries, we repeated the tests including only the
countries of Hong Kong, Singapore, Japan and the U.S. In this case also the results
do not reveal stock market linkages. The exclusion tests reported in panel B of Table
3, show that Hong Kong does not enter into the cointegration space highlighting an
interesting point, namely that the lack of foreign exchange restrictions might not be a
sufficient condition for links amongst stock markets.25 The existence of de facto
barriers may discourage foreign investors from entering financial markets e.g. lack of
sufficient information, as suggested by Levine and Zervos (1996), or of specific
24 For the sub-groups we present and discuss the results only for the case in which
stock price indices are expressed in U.S. dollars. The findings for the alternative
definitions present strong similarities.
25 This result for Hong Kong was rather surprising in view of the fixed parity of the
Hong Kong dollar with US dollar as part of Hong Kong’s currency board
arrangements established in 1983. The pegging to the dollar should have increased
the transmission mechanism of shocks between the countries (see Frankel et al
(2002)) and should have influenced positively their financial links.

20
country risks, such as the liquidity, political, economic policy and currency risks, and
macroeconomic instability, as noted by Chuhan (1994) and Bekaert (1995). In our
opinion the most relevant factor for Hong Kong was the political risk. Hong Kong
suffered from frequent political shocks during that period relating to the question of
its democracy after 1997, to China’s human rights developments and political
reforms, as well as to China’s most favoured-nation trade status. Discussions between
China and UK about Hong Kong’s political status started in the early 1980’s with a
formula been worked out of “one country, two systems” in 1984. In 1989 the
Tienanmen Democracy Movement took place dashing hopes of short-term political
reforms. Following that there was a deterioration in the Sino-US relations with US
threatening to cancel China’s most-favoured nation (MFN) trading status, which
would have affected Hong Kong’s foreign trade and its position as China’s window to
the West. In October 1992, there was additional political uncertainty, when Hong
Kong’s new governor, Chris Patten, introduced new democratic reform measures,
which infuriated China, who threatened to abandon its 1984 agreement with Britain.
The above political instability had an effect on the stock market as shown by e.g. Kim
and Mei (2001), who demonstrated that unexpected return jumps and changes in stock
market volatility were associated with political news relating to the above events.
However, such factors could not have applied to the case of Singapore. For
this reason we proceeded to test for the presence of cointegration in the group of
markets of Singapore Japan and the US. The results show the existence of one
cointegrating vector and that all markets participate in the cointegration space, thus
confirming that the three stock markets are linked (see Table 3).
We next adopted an alternative criterion in the selection of potential countries
for stock market linkages as discussed in section 3.2. We selected the countries of

21
Korea, Taiwan and Thailand as potential candidates for close linkages because they
had Country Funds from the middle of the eighties, which allowed foreigners to invest
in their markets. For example, by the early 1990’s Korea had 17 US dollar
denominated country funds and 17 non-US dollar country funds, while Thailand had
26 closed-end and 11 open-end Thai funds trading worldwide. Taiwan, on the other
hand, had 9 open-end funds and 4 investment trusts.26 According to Kaminsky, Lyons
and Schmukler (2001) in 1995 holdings of dedicated Emerging Funds in Korea were
10.3 billion US dollars and had 6% of the market capitalisation. The respective
figures for Taiwan were 4.6 and 2 and for Thailand 9.8 and 7.27 According to the
authors these figures should only be taken as an indication because they exclude
holdings of global funds, which account for a substantially larger share of the stock
market capitalisation of the emerging market. What should be noted, however, is that
although the typical size of a country fund may be very small relative to the total
market capitalisation of the emerging market, its introduction may drive up the prices
of local companies reducing the cost of capital and essentially rendering the local
26 See Bekaert and Harvey (1995). UK investment trusts are the equivalent of US
closed-end funds.
27 Data on dedicated funds come from Emerging Market Funds Research, which
collects aggregate data of emerging market mutual funds. They track the net cash
flows of nearly 1,400 international emerging market equity funds, with an average
position of about $120 billion in 1996. The data cover both US-registered and
offshore funds as well as funds registered in Luxembourg, the UK, Ireland, Cayman
Islands, Canada and Switzerland. It includes both open and closed-end funds.

22
market partially integrated with global markets. This has been shown to be the case
theoretically by Errunza, Senbet and Hogan (1998).28
The results of the trace statistics, when considering the system of five markets
of Korea, Taiwan, Thailand, Japan and the U.S., show the presence of one
cointegrating vector (see panel A, Table 4). However, the exclusion tests, reported in
panel B of the same Table, shows that the Korean stock market does not participate in
the cointegration space. This may indicate that the lack of cointegration of this
system of five variables could be due to the presence of the Korean capital market in
the group. Therefore, we repeated the analysis excluding the Korean market. The
trace tests reported in panel A of Table 4, indicate the presence of one cointegrating
vector and the exclusion tests, reported in panel B of the same Table, show that all
four countries participate in the cointegration space and therefore that the capital
markets of Taiwan, Thailand, Japan and U.S. are linked during the eighties. On the
one hand, these findings underline the importance of Country Funds as a channel for
international investors to enter highly regulated capital markets and on the other hand,
the exclusion of Korea from that group of markets highlights that other conditions
have to be met for that to be the case. Thus, we explored whether various types of
risk existed at the time, which put Korea apart from Thailand and Taiwan. Table 5
summarises information on some emerging market specific risks, which might shed
light on this issue.
Panel A presents information on company stocks since lack of information
might have discouraged foreign investors from investing in those markets. As it can
be seen there is no difference amongst the three countries. Panel B presents
28 Tandon (1997) using an event study of returns around country fund launchings
presents empirical evidence that seems to support this statement.

23
information on macro-economic instability and currency risk. It seems that all three
countries have experienced very high rates of economic growth, which increased even
more in the second half of the 1980’s. Regarding inflation, however, it looks as if
Thailand and especially Taiwan have performed better throughout the 1980’s than
Korea. As one would have expected this was reflected on the stability of their
exchange rates, with the volatility of the Korean Won being substantially greater than
that of the Thai Baht and the Taiwanese dollar.29 The higher exchange rate volatility
in Korea seems to have affected investment flows. For example, net foreign direct
investment fell from 0.7 billion dollars in 1988 to –0.3 by 1992, in contrast to the
other countries, where there was an increase.30 Finally, Panel C gives information on
stock market turnover ratio as an indicator of the liquidity of the markets. As Chuhan
(1994) underlines, institutional investors are interested in highly liquid markets even
when there are access limitations to the markets. It seems that Taiwan was the most
liquid market during that period followed by Thailand and then Korea. In conclusion,
the above information shows that possibly macroeconomic instability and a less liquid
market might have influenced the behaviour of the Korean market.
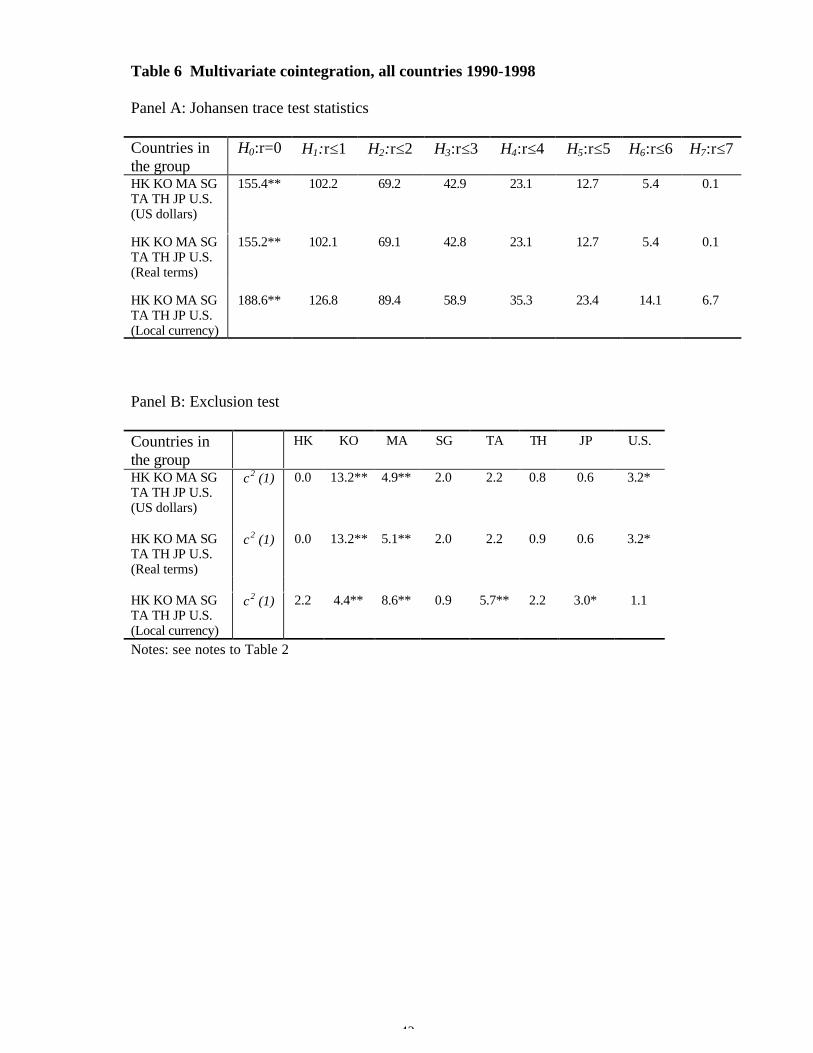
We continued our analysis by computing the trace statistics and exclusion tests
for the subperiod 1990 to 1998 for the same groups of countries, which were
considered for the subperiod 1980 to 1989. The finding for all countries, is given for
indices expressed in US dollars, in real terms and in local currencies; for the groups of
open countries; and for the groups of the semi-open countries are (see panels A and B
of Table 6, 7 and 8 respectively). While for this period also there is lack of
29 For more information on the Korean economy and financial policies see Fry
(1995).
30 IMF, World Economic Outlook.

24
cointegration amongst the group of all countries, we found cointegration for the group
of open countries, which were found not to be cointegrated during the eighties, and
the group of semi-open countries. Furthermore, there is a general increase in the
number of cointegrating vectors shared by the semi-open economies. The capital
markets of Taiwan, Thailand, Japan and US, which were sharing one cointegrating
vector and three common trends in the pre-liberalisation period, now, in the post-
liberalization period, share three cointegrating vectors and only one common trend.
This indicates an increase in the degree of linkages of these stock markets during the
recent period of more open capital markets.
Based on this evidence, we continued our analysis and performed the recursive
estimation of the group of countries presenting the highest degree of international
comovements since the early eighties, namely that consisting of Taiwan, Thailand,
Japan and the U.S.
3.3 The recursive trace test statistics
We examine the time path of the trace statistics recursively estimated to find
when exactly the stock markets of Taiwan, Thailand, Japan and the U.S. started to be
linked together. As described in section 2.3, each trace statistics is scaled by the 90%
quantile of the trace distribution derived for the model. The number of trace statistics
showing an upward behavior and above the critical value of one, indicates the number
r of cointegrating vectors shared by the cointegrated system.
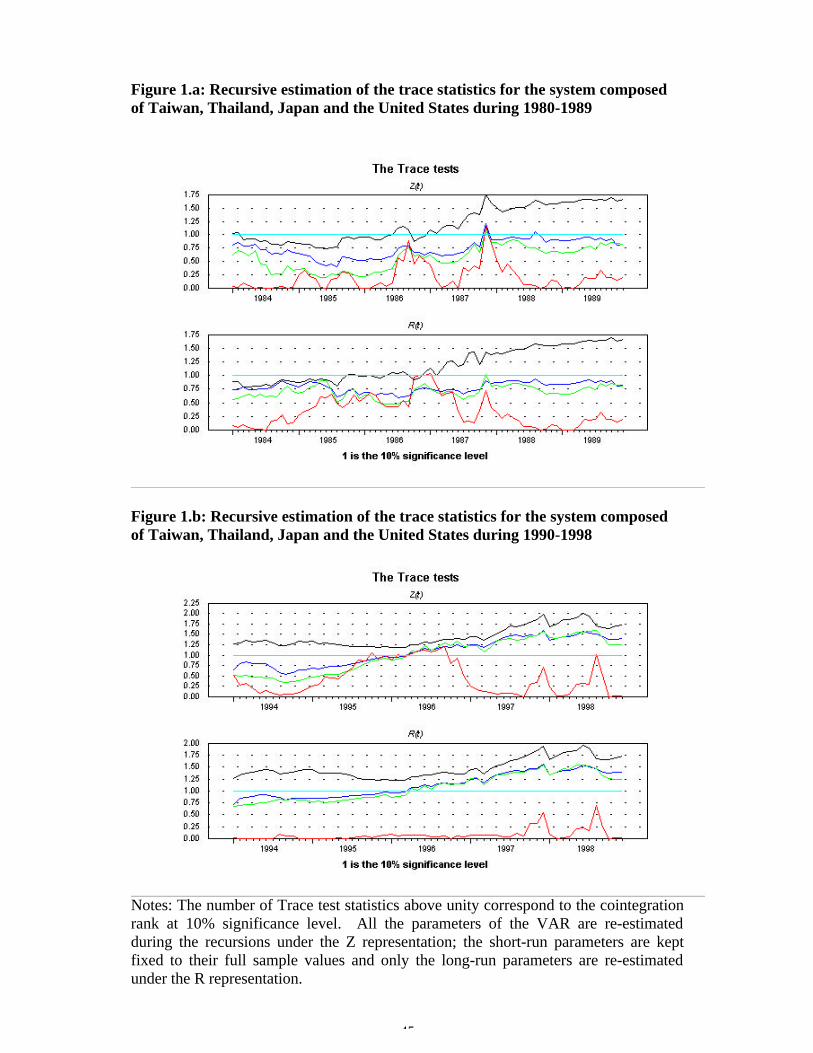
Figures 1.a reports these statistics for the period 1980 to 1989. Only one trace
statistic presents an upward trend in the period of the analysis and that assumes a
value just above one at the end of the 1985, beginning of 1986. It considerably
increased in the second half of 1986. This indicates that the linkages of these stock

25
markets started between the end of 1985 and the middle of 1986. This period
corresponds to the introduction of the First Country Fund for Thailand (July 1985)
and of the three Country Funds for Taiwan (May 1986). Thus, the analysis indicates
that financial links with world markets increased with the introduction of a vehicle of
investment, which was accessible to foreign investors.
Looking now at the recursive estimation during the nineties we observe one
statistic to be above one for the full period of the nineties and another two statistics to
have an upward behaviour and reach the line of one at the beginning of 1996 (see
figure 1.b). The three statistics continued to show an upward trend until the end of
1997. This evidence suggests that the stock markets of these countries were strongly
linked in the period preceding the Asian crisis of mid 1997. The Asian crisis might
have fostered these links but does not seem to have had a substantial effect. This is
confirmed by looking at the R(t) representation, which keeps short-run dynamics
constant and presents a similar behaviour to Z(t) representation. Unlike other crises,
which have been found to cause an increase in market links, the Asian crisis
concerned a group of countries, which was already integrated prior to the crisis, not
only financially but economically as well.31
In conclusion, the recursive analysis suggests that First Country Funds have
been an important channel for international investors to enter equity markets, in which
foreign ownership restrictions are still in existence. In particular, it shows that stock
market started in the period of the introduction of the First Country Funds.
Furthermore, it shows that the Asian crisis of mid 1997 did not have a substantial
effect on the financial links of these countries.
31 See Phylaktis and Ravazzolo (2001). This substantial degree of stock market
linkages may have contributed to the generation of the contagion effect in 1997.
26
3.4 The analysis of common trends
We estimate the moving average process of a cointegrated system in order to
investigate the non-stationary common trend or permanent component, which drives
our set of capital markets. We conduct the analysis by considering the two subperiods
of 1980 to 1989 and 1990 to 1998 in order to investigate possible changes in the
potential driver of the system.
The system of the capital markets of Taiwan, Thailand, Japan and U.S share
one cointegrating vector and three common trends during the period of 1980-89. The
estimation of the common trend mechanism for this subperiod is reported in Table 9,
where panel A indicates the estimated coefficients of each common trend; and panel
B the loading factors for each common trend. Looking at panel A, we can identify
that the Thai stock market provides the major contribution to the first common trend,
while the United States and Japan to the second and third common trends,
respectively. Focusing on panel B, which reports the loading factors of each common
trend, we can note that for all common trends, the Taiwanese stock market reacts most
to common trend movements followed by the Thai and the Japanese stock markets.
In contrast, the stock price index of the U.S. is the least affected by common trend
comovements.
For the period 1990 to 1998 the same group of countries share three
cointegrating vectors and one common trend. The results of the estimated common
trend system are reported in Table 10. Panel A indicates that the only common trend
shared by the group of countries is dominated equally by the Thai and Japanese stock
markets. In contrast, Taiwan is the stock market most affected by this common
stochastic trend. If we make the normalisation that the sum of the common trend

27
coefficients is unity then we see that the Thai and Japanese stock markets receive a
weight of about 41 percent, while the U.S. market has a share of only 17 percent.
These results are somewhat surprising because they do not reflect relative market
capitalisation. For instance, at the end of 1995 the market capitalisation was 187,206
US$ million for Taiwan; 141,507 US$ million for Thailand; 3,667,292 US$ million
for Japan and 6,857,622 US$ million for U.S. A factor, which could be influencing
the results, is the role of persistent movements in real exchange rates. Further
research should attempt to incorporate real exchange rate dynamics.
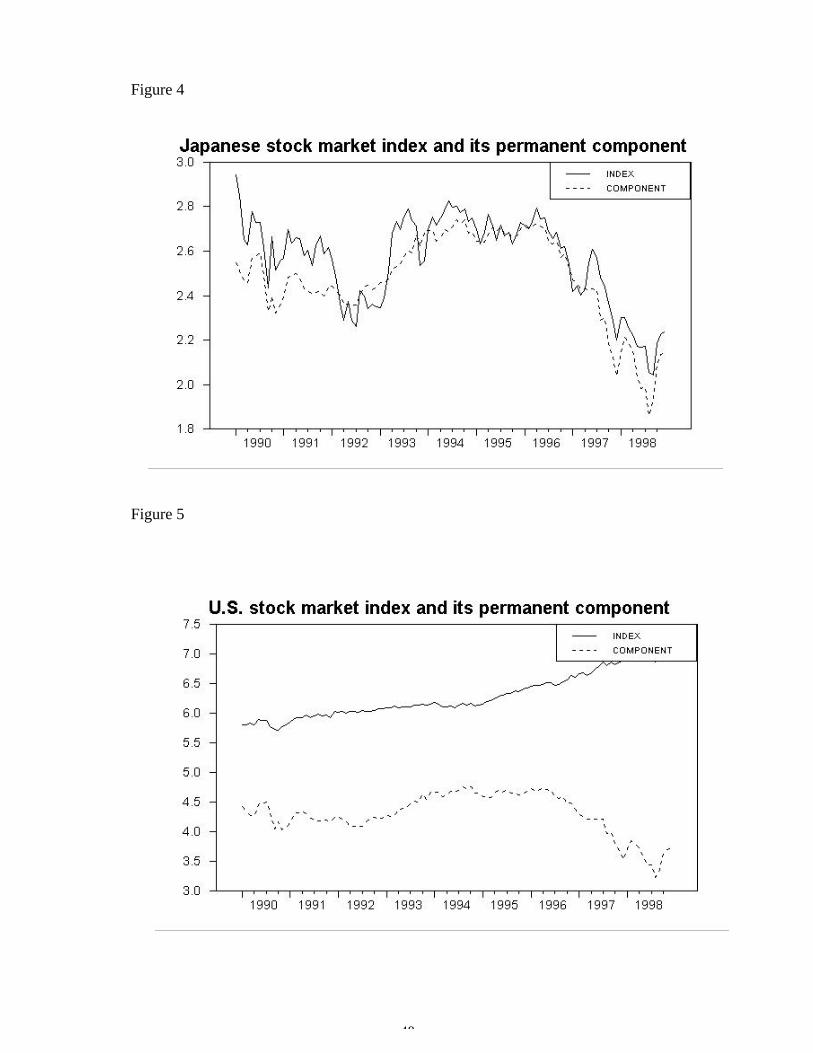
A different approach to investigate the relative importance of the trend to the
various markets during this period is to compare the plots of the permanent
component of each market, which corresponds to the common trend as shown by
Gonzalo and Granger (1995), and the actual stock price behaviour. The plots are
presented in Figures 2 to 5.32 As it is suggested by the weights in the common trend,
the trend or permanent component tracks closely the stock market behaviour in
Thailand and Japan throughout the period. In contrast, the trend tracks closely the
stock markets of Taiwan and U.S. only up to the beginning of 1996, i.e. before the
onset of the Asian crisis. Subsequently, the transitory component becomes important.
This confirms the fact that both markets were not affected as much by the Asian crisis
as the other two countries.
Thus, the results show that the stock market of Taiwan has not been a driver
of our set of capital markets and has been responding to the common trend. On the
other hand, Thailand and Japan have been the main drivers, while U.S. contribution
has remained small.
32 It should be noted that the trend may lie consistently above or below the stock
price series because the stock price indices are in different units.
28
4. Conclusion
In this paper, we have investigated the linkages and dynamic interactions
amongst a group of Pacific-Basin stock markets and the industrialized countries of
Japan and U.S. Our main objective was to examine whether these financial linkages
were affected by the existence of foreign exchange restrictions. Furthermore, we
wanted to investigate, whether alternative financial vehicles, such as Country Funds,
provide a channel through which international investors access capital markets.
We have examined these issues by applying the multivariate cointegration
model in the autoregressive and moving average form in terms of stable long-run
comovements and common stochastic trends driving the system. We performed the
recursive-based estimation to date the beginning of the linkages and the effects of the
Asian crisis on them and that constitutes a novel approach to the examination of these
issues. Our main findings are as follows:
First, we found that all the stock markets under investigation were not linked
together for either the 80s or the 90s. Similar results were found for the open markets
of Honk Kong and Malaysia for the 80s. This evidence suggests that the relaxation of
foreign exchange restrictions is not sufficient to attract international investors'
attention and strengthen international market interrelations. There exist other factors,
possibly related to information availability, accounting standards, or liquidity and
political risk, which may affect the portfolio diversification decision. In the specific
case of Hong Kong, a high political risk might have been the reason for its lack of
long-run comovement with other Pacific Basin markets and US. On the other hand,
the increase in financial links for open and semi-open markets in the second sub-

29
period suggests that the relaxation of foreign ownership restrictions might have
enhanced links with world markets.
Secondly, we found close financial links for Taiwan and Thailand with both
Japan and U.S., during the first sub-period in which foreign ownership and other
restrictions were in place. The results of the recursive analysis detect that the first
forms of linkages correspond to the period of the introduction of First Country Funds.
This underlines the importance of alternative financial instruments to access emerging
equity markets and increase their financial links with world markets. It confirms
evidence found that country funds provide statistically significant diversification
benefits.33 The results for Korea, however, point out that even in this case as it is with
the official opening of the capital market, other conditions have to be met for markets
to be closely linked.
Thirdly, the recursive analysis for the most recent period indicates that the
Asian crisis did not have a substantial effect on the degree of linkages of these
markets.
Finally, the estimated common trends mechanisms show that neither Japan,
nor the U.S. has a unique influence in the Pacific Rim. U.S. plays a role, but small in
magnitude, while Japan plays a more significant role, but is equally important as that
of Thailand. Plotting the permanent component of each market, which corresponds to
the common trend, and the actual stock price behaviour, we find that the difference of
the two - the transitory component - to be substantial for Taiwan and US in the post
1996 period, thus offering short-run diversification opportunities to international
investors.
33 See Bekaert and Urias (1999) and Chang et al. (1995).
30
The analysis in the paper of stock market linkages in these emerging markets
has indicated that international investors have opportunities for portfolio
diversification by investing in most of the Pacific Basin countries. On the one hand,
the results for the open economies show that although the linkages have increased in
recent years, they do not seem to respond to a common world growth factor, but to be
affected by national factors, leaving room for long-term gains by investing in these
markets. On the other hand, the results for the semi-open economies show that
although long-term diversification benefits from exposure to these markets might be
limited, short-run benefits might exist due to substantial transitory fluctuations.
31
References
Arshanapalli, B. and J. Doukas, 1993, International stock market linkages: evidence
from the pre- and post-October 1987 period, Journal of Banking and Finance 17, 193-
208.
Bekaert, G., 1995, Market integration and investment barriers in emerging equity
markets, World Bank Economic Review 9, 75-107.
Bekaert, G. and C.R. Harvey, 1995, Time-Varying world market integration, Journal
of Finance 50, 403-444.
Bekaert, G. and C.R. Harvey, 1998, Capital flows and the behaviour of emerging
market equity returns, NBER Working Paper 6669.
Bekaert, G. and C.R. Harvey, 2000, Foreign speculation and emerging equity markets,
Journal of Finance 55, 565-613.
Bekaert, G. and M.S. Urias, 1999, Is there a free lunch in emerging market equities?
The Journal of Portfolio Management Spring, 83-95.
Calvo, S. and C.M. Reinhart, 1996, Capital flows to Latin America: is there evidence of
contagion effects, in: G. Calvo, M. Goldstein and E. Hochreiter, eds., Private capital
flows to emerging markets after the Mexican crisis, (Washington DC:IIE).

32
Canova, F. and G. DeNicole, 1995, Stock markets and real activity: a structural
approach, European Economic Review 39, 981-1015.
Chang, E., C.S. Eun and R. Kolodny, 1995, International diversification through closed-
end country funds, Journal of Banking and Finance 19, 1237-1263.
Cheung, Y.W. and K.S. Lai, 1993, Finite-sample sizes of Johansen's likelihood ratio for
cointegration, Oxford Bulletin of Economics and Statistics 55, 313-328.
Cheung Y.W. and L.K. Ng, 1998, International evidence on stock market and
aggregate economic activity, Journal of Empirical Finance 5, 281-296.
Chuhan, P., 1994, Are institutional investors an important source of portfolio
investment in emerging markets? World Bank Working Paper 1243.
Dwyer, G.P. and R.W. Hafer, 1988, Are national stock markets linked? Federal
Reserve Bank of St. Louis Review 70, 3-14.
Engle, R.F. and C.W.J. Granger, 1987, Cointegration and error correction:
representation, estimation and testing, Econometrica 55, 251-277.
Errunza, V., L. Senbet, and K. Hogan, 1998, The pricing of country funds from
emerging markets: theory and evidence, International Journal of Theoretical and
Applied Finance 1, 111-143.
33
Eun, C.S. and S. Shim, 1989, International transmission of stock market movements,
Journal of Financial and Qualitative Analysis 24, 241-256.
Frankel, J., S.L. Schmukler and L. Serven, 2002, Global transmission of interest rates:
monetary independence and currency regime, World Bank Working Paper 2424.
Fry, M., 1995, Money, interest and banking in economic development (Johns Hopkins
University Press).
Gonzalo, J. and C.W.J. Granger, 1995, Estimation of common long-memory
components in cointegrated systems, Journal of Business and Economics Statistics 13,
27-36.
Granger, C.W.J., 1981, Some properties of time series data and their use in econometric
model specifications, Journal of Econometrics 28, 121-136.
Gregory, A.W., 1994, Testing for cointegration in linear quadratic models, Journal of
Business and Economic Statistics 12, 347-360.
Hamao, Y., R. Masulis and V. Ng, 1990, Correlations in price changes and volatility
across international stock markets, Review of Financial Studies 3, 281-308.
Hansen H. and S. Johansen, 1998, Some tests for parameter constancy in cointegrated
VAR-models, Working Paper, University of Copenhagen, Institute of Mathematical
Statistics.
34
Hardouvelis, G., 1988, Evidence on stock market bubbles: Japan, the United States and
Great Britain, Federal Reserve Bank of New York, Quarterly Review 13, 4-16.
Harvey, C.R., 1995, Predictable risk return in emerging markets, Review of Financial
Studies 8, 773-816.
Hawawini, G., 1994, Equity price behaviour: some evidence from markets around the
World, Journal of Banking and Finance 18, 603-620.
Johansen, S., 1988, Statistical analysis of cointegration vectors, Journal of Economic
Dynamics and Control 12, 231-254.
Johansen, S., 1991, Estimation and hypothesis testing of cointegration vectors in
Gaussian vector autoregressive models, Econometrica 59, 1551-1581.
Johansen, S. and K. Juselius, 1990, Maximum likelihood estimation and inference on
cointegration - with applications to the demand for money, Oxford Bulletin of
Economics and Statistics 52, 169-210.
Kaminsky, G.L., R.K. Lyons, and S.L. Schmukler, 2001, Mutual fund investment in
emerging markets: an overview, The World Bank Economic Review 15, 315-340.
Kasa, K., 1992, Common stochastic trends in international stock markets, Journal of
Monetary Economics 29, 95-124.
35
Kim, H.Y. and J.P.Mei, 2001, What makes the stock market jump? An analysis of
political risk on Hong Kong stock returns, Journal of International Money and
Finance, 20, 1003-1016.
King, M.A. and S. Wadhwani, 1990, Transmission of volatility between stock
markets, Review of Financial Studies 3, 5-33.
Kock, P.D. and T.W. Kock, 1991, Evolution in dynamic linkages across daily national
stock indexes, Journal of International Money and Finance 10, 231-251.
Levine, R. and S. Zervos, 1996, Capital control liberalisation and stock market
development, Policy Research Working Paper, The World Bank, 1622.
Levy, H. and M. Sarnat, 1970, International diversification of investment portfolios,
American Economic Review 60, 668-675.
Longin, F. and B. Solnik, 1995, Is the correlation in international equity returns
constant: 1960-1990? Journal of International Money and Finance 14, 3-26.
Osterwald-Lenum, M., 1992, A note with quantiles of the asymptotic distribution of the
maximum likelihood cointegration test statistics, Oxford Bulletin of Economic and
Statistics 54, 461-471.
Park, J.Y., 1990, Disequilibrium inputs analysis, Working Paper, Cornell University.

36
Phylaktis, K. and F. Ravazzolo, 2000, Stock prices and exchange rate dynamics,
Mimeo, City University Business School.
Phylaktis, K. and F. Ravazzolo, 2001, Measuring financial and economic integration
with equity prices in emerging markets, Mimeo, City University Business School.
Phillips P. and P. Perron, 1988, Testing for unit root in time series regression,
Biometrica 75, 335-346.
Reimers, H.E., 1992, Comparisons of tests for multivariate cointegration, Statistical
Papers 33, 335-346.
Richards, A.J, 1995, Comovements in national stock market returns: Evidence of
predictability, but not cointegration, Journal of Monetary Economics 36, 631-654.
Roll, R., 1989, The International Crash of October 1989, in R.W. Kamphuis et al. eds.,
Black Monday and the future of financial markets (Dow Jones-Irwin), 35-70.
Roll, R., 1992, Industrial structure and the comparative behaviour of international stock
market indices, Journal of Finance 47, 3-41.
Schwert, G.W., 1990, Stock returns and real activity: a century of evidence, Journal of
Finance 45, 1237-1257.

37
Solnik, B.H., 1974, Why do not diversify internationally rather than domestically?
Financial Analyst Journal 30, 48-54.
Stepthon, P.S. and K.S. Larsen, 1991, Tests of exchange market efficiency: fragile
evidence from cointegration tests, Journal of International Money and Finance 10, 561-
570.
Stock, J.H. and M.W. Watson, 1988, Testing for common trends, Journal of the
American Statistical Association 83, 1097-1107.
Tandon, K., 1997, External financing in emerging markets: an analysis of market
responses, Emerging Markets Quarterly 1, 63-74.
Taylor, M.P. and I. Tonks, 1989, The internationalisation of stock markets and the
abolition of U.K. exchange control, The Review of Economics and Statistics 71, 332-
336.

38
Table 1
A: Different signals of liberalisationCountry IFC official
liberalisationFirst Country
FundFirst ADR
introductionHong Kong 01.73 - -Korea 01.92 08.84 11.90Malaysia 12.88 12.87 08.92Singapore 06.78 - -Taiwan 01.91 05.86 12.91Thailand 09.87 07.85 01.91
B: Emerging stock markets - direct and indirect barriers for institutionalinvestors (end-1989)
ForeignownershipLimit
DividendsRepatriation
CapitalRepatriation
WithholdingTaxes onDividend
Taxes onCapital Gains
Hong Kong 100% Free Free 0% 0%Japan 100%(25%)a Free Free 20%
(0-15%)0%
Korea 10%(8%)b SomeRestrictionsc
SomeRestrictionsc
25%(10-21.5%)
0%(11-27%e)
Malaysia 100%d Free Free 35%(0%) 0%Singapore 100% Free Free 0.0% 0%Taiwanf, g Special Funds
onlyhFree Free 20% 0.6%
Thailand 49% (25%)i Freek Free 20%(10) 25%(10)
Notes: The Table is based on the information provided in the International Financial
Corporation' s (IFC) Factbook, the Euromoney annual report, the Exchange Arrangements
and Restrictions, IMF and Bekaert and Harvey (1998). Percentages shown in brackets apply
only to approved new Country Funds, where these may be different from normal treatment.
The IFC official liberalisation date is based on the investibility index, which represents the
ratio of the market capitalisation of stocks that foreigners can legally hold to total market
capitalisation. A large jump in the index is taken as evidence of an official liberalisation.a The foreign ownership limit is up to 100% in case of companies classified as “non-
strategic”. The limit is reduced to 25% in case of “national interest” companies such as
mining, agriculture, nuclear power, gas, railways, banks, aircraft, pharmaceutical industries
and oil refineries. Direct inward investment in a listed corporation, which represents more
than 10% of the corporation’s issued capital when aggregated with the existing holdings of
the investor and its related parties, or in the acquisition of shares in any non-listed
corporation, requires a specific report to be filed with the Ministry of Finance and other
Ministries prior to the transactions.b Foreign ownership restriction of up to 10% of market capitalisation for “non-limited”
industries and of up to 8% of market capitalisation for “limited” industries.
39
c The repatriation of initial capital, capital gains and dividends is subject to approval by the
Ministry of Finance.d Foreign acquisition of investments exceeding M$ 5 million in value or equivalent of 15% or
more of voting power in a Malaysian company requires the prior approval of the Foreign
Investment Committee.e Of net gains or gross sales proceeds respectively.f Existence of transaction taxes on gross transaction value.g Available only to investors in approved investment vehicles.h Foreign investors who open an account in a local brokerage house may only invest in four
listed funds – Kwang Hua Growth Fund, NITC Fuyuan Fund and Citizen Fund. Domestic
residents are allowed to remit outwards up to US$5 million per annum.i Foreign investors are allowed to hold up to 49% of companies listed on the SET with the
exception of the commercial banks and finance companies, where foreign ownership is
restricted to 25% of the capital.k A report is required for the repatriation of dividends and capital gains.
40
Table 2 Multivariate cointegration, all countries 1980-1989.
Panel A: Johansen trace test statistics
Countries inthe group
H0:r=0 H1:r≤1 H2:r≤2 H3:r≤3 H4:r≤4 H5:r≤5 H6:r≤6 H7:r≤7
HK KO MA SGTA TH JP U.S.(US dollars)
162.1** 105.2** 70.3 24.7 24.7 11.4 4.2 0.7
HK KO MA SGTA TH JP U.S.(Real terms)
157.2** 100.8 68.7 41.4 23.9 11.1 3.3 0.04
HK KO MA SGTA TH JP U.S.(Local currency)
169.5** 120.0 85.5 54.3 36.6 16.9 9.2 2.1
Panel B: Exclusion test
Countries inthe group
HK KO MA SG TA TH JP U.S.
HK KO MA SGTA TH JP U.S.(US dollars)
χ2 (2) 4.6 5.1** 2.2 7.1** 9.4** 4.4 12.7** 7.5**
HK KO MA SGTA TH JP U.S.(Real terms)
χ2 (1) 0.23 0.18 0.5 2.5 6.9** 1.7 11.7** 0.0
HK KO MA SGTA TH JP U.S.(Local currency)
χ2 (1) 1.5 3.8** 1.7 0.7 7.4** 0.2 0.5 0.7
Notes: The following abbreviations have been used for the countries: HK: Hong Kong; KO:
Korea; MA: Malaysia; SG: Singapore; TA: Taiwan; TH: Thailand; JP: Japan; and US: United
States. The Johansen trace statistic tests the hypothesis that there are at most r cointegrating
vectors pr0 ≤≤ where p is the number of stock markets in each case. The critical values
have been obtained from Osterwald-Lenum (1992). The statistics include a finite sample
correction (see Reimers (1992)). * and ** denote significance at 10% and 5% level
respectively. The exclusion statistic tests the null hypothesis that the coefficients of the
cointegrating vectors relating to each market are zero. The test statistic is χ2 distributed with r
degrees of freedom.

41
Table 3 Multivariate cointegration, open markets 1980-1989
Panel A: Johansen trace test statistics
Countries in thegroup
H0: r = 0 H1: r ≤ 1 H2: r ≤ 2 H3: r ≤ 3 H4: r ≤ 4
HK MA SG JP U.S. 51.2 18.4 9.0 1.6 0.0
HK SG JP U.S.
SG JP U.S.
38.1*
28.23**
6.3
1.14
2.1
0.23
0.0
Panel B: Exclusion test
HK MA SG JP U.S.HK MA SG JP U.S. - - - - -
HK SG JP U.S.
SG JP U.S.
χ2(1)
χ2(1)
2.34 15.3**
18.66**
4.9**
5.21**
19.5**
19.93**
Notes: see notes to Table 2.
Table 4 Multivariate cointegration, semi-open markets 1980-1989
Panel A: Johansen trace test statistics
Countries H0: r = 0 H1: r ≤ 1 H2: r ≤ 2 H3: r ≤ 3 H4: r ≤ 4KO TA TH JP U.S. 90.5** 34.2 20.8 8.5 0.5
TA TH JP U.S. 57.3** 16.6 7.8 0.5
Panel B: Exclusion test
KO TA TH JP U.S.KO TA TH JP U.S. χ2(1) 0.5 16** 3.5** 3.4** 5.0**
TA TH JP U.S. χ2(1) 17.5** 9.8** 16.1** 17.7**
Notes: see notes to Table 2.

42
Table 5 Information on emerging market specific risks (end-1989)
Panel A: Emerging markets information and investor protectionSecuritiesExchangepublications
(1)
Regularpublication ofPrice/Earningsand Price/Dividends
(2)
MarketCommentariesin English
(3)
Companybrokeragereports
(4)
InterimStatement
(5)
Accountingstandards
(6)
Investorprotection
(7)
Korea AMWD C LR,IR LR,IR S G GSThailand AQMWD C LR,IR LR,IR Q A ASTawain AMWD C LR,IR LR,IR Q P PS
Notes: Emerging Stock Markets Factbook published by International Finance Corporation(1) A=Annual, Q=Quarterly, M=Monthly, W=Weekly, D=Daily(2) P=Published, C=Comprehensive and published internationally(3) and (4) LR=Prepared by local broker or analysts; IR=Prepared by international brokers or analysts(5) Q=Quarterly results must be published, S=Semiannual results must be published(6) and (7) G=Good of international acceptable quality; A=Adequate; P=Poor, requires reform;S=Functioning Securities Commission or similar government agency concentrating on regulatingmarket activity
Panel B: Stock market turnover ratios1984 1987 1990
Korea 62.17 75.73 68.67Thailand 25.23 93.59 95.90Taiwan 82.86 172.95 709.96
Notes: Emerging Stock Markets Factbook published by International Finance Corporation
Panel C: Macroeconomic indicators
Real economic growth
(%)
Inflation rate
(%)
Exchange ratevolatility
(standard deviation)1981-84 1985-89 1981-84 1985-89 1981-84 1985-89
Korea 8.98 9.40 2.85 4.22 71.72 84.75Thailand 5.68 9.02 2.30 3.18 1.41 0.69Taiwan 10.20 11.95 0.40 1.38 1.71 5.38
Notes: See section 3.1.
43
Table 6 Multivariate cointegration, all countries 1990-1998
Panel A: Johansen trace test statistics
Countries inthe group
H0:r=0 H1:r≤1 H2:r≤2 H3:r≤3 H4:r≤4 H5:r≤5 H6:r≤6 H7:r≤7
HK KO MA SGTA TH JP U.S.(US dollars)
155.4** 102.2 69.2 42.9 23.1 12.7 5.4 0.1
HK KO MA SGTA TH JP U.S.(Real terms)
155.2** 102.1 69.1 42.8 23.1 12.7 5.4 0.1
HK KO MA SGTA TH JP U.S.(Local currency)
188.6** 126.8 89.4 58.9 35.3 23.4 14.1 6.7
Panel B: Exclusion test
Countries inthe group
HK KO MA SG TA TH JP U.S.
HK KO MA SGTA TH JP U.S.(US dollars)
χ2 (1) 0.0 13.2** 4.9** 2.0 2.2 0.8 0.6 3.2*
HK KO MA SGTA TH JP U.S.(Real terms)
χ2 (1) 0.0 13.2** 5.1** 2.0 2.2 0.9 0.6 3.2*
HK KO MA SGTA TH JP U.S.(Local currency)
χ2 (1) 2.2 4.4** 8.6** 0.9 5.7** 2.2 3.0* 1.1
Notes: see notes to Table 2
44
Table 7 Multivariate cointegration, open markets 1990-1998
Panel A: Johansen trace test statistics
Countries in thegroup
H0: r = 0 H1: r ≤ 1 H2: r ≤ 2 H3: r ≤ 3 H4: r ≤ 4
HK MA SG JP U.S. 73.6** 40.1** 16.7 7.1 0.0
HK SG JP U.S.
SG JP U.S.
49.7**
36.06**
27.4**
13.5
7.4
0.11
0.0
Panel B: Exclusion test
HK MA SG JP U.S.HK MA SG JP U.S. χ2(2) 10.5** 13.3** 18.9** 15.8** 9.7**
HK SG JP U.S.
SG JP U.S.
χ2(2)
χ2(1)
16.1** 20.3**
7.70**
22.9**
5.62**
5.0*
7.50**
Notes: see notes to Table 2.
Table 8 Multivariate cointegration, semi-open markets 1990-1998
Panel A: Johansen trace test statistics
Countries in thegroup
H0: r = 0 H1: r ≤ 1 H2: r ≤ 2 H3: r ≤ 3 H4: r ≤ 4
KO TA TH JP U.S. 100.0** 55.8** 30.6 14 3.8
TA TH JP U.S. 58.3** 28.0** 12.2** 0.03
Panel B: Exclusion test
χ2 KO TA TH JP U.S.KO TA TH JP U.S. χ2(2) 17.0** 6.0** 11.0** 5.2** 6.7**
TA TH JP U.S. χ2(3) 21.0** 16.0** 17.3** 19.6**
Notes: see notes to Table 2.
45
Figure 1.a: Recursive estimation of the trace statistics for the system composedof Taiwan, Thailand, Japan and the United States during 1980-1989
Figure 1.b: Recursive estimation of the trace statistics for the system composedof Taiwan, Thailand, Japan and the United States during 1990-1998
Notes: The number of Trace test statistics above unity correspond to the cointegrationrank at 10% significance level. All the parameters of the VAR are re-estimatedduring the recursions under the Z representation; the short-run parameters are keptfixed to their full sample values and only the long-run parameters are re-estimatedunder the R representation.

46
Table 9 Orthogonal complement of the cointegration space with onecointegrating vector for the group of Taiwan, Thailand, Japan and U.S. during1980-89
Panel A: Estimates of the common trend matrix ( α⊥)
Taiwan Thailand Japan United StatesCommon trend 1 -0.137 0.889 -0.407 -0.160Common trend 2 0.110 -0.123 0.080 -0.983Common trend 3 0.435 -0.315 -0.843 0.019
Panel B: Estimates of the matrix (β⊥)
Common trend 1 Common trend 2 Common trend 3Taiwan 5.154 -4.192 -6.454Thailand 3.645 -2.073 -3.831
Japan 1.407 -1.791 -3.442United States 0.419 -1.506 -0.734
Notes: The elements of α⊥ indicate the weight of each market to the trend; β⊥ givesthe relative importance of the trend to each market.
Table 10 Orthogonal complement of the cointegration space with threecointegrating vectors for the group of Taiwan, Thailand, Japan and U.S. during1990-98
Panel A: Estimates of the common trend matrix ( α⊥)
Taiwan Thailand Japan United StatesCommon trend 1 0.025 -0.675 -0.681 -0.282
Panel B: Estimates of the matrix (β⊥)
Common trend 1Taiwan -0.998Thailand -0.672
Japan -0.391United States -0.679
Notes: See Notes to Table 9.

47
Figures 2 to 5: Stock price index decomposition for the system Taiwan,Thailand, Japan and U.S. over 1990 – 1998
Figure 2
Figure 3
Notes: Each stock price index is decomposed into the permanent and transitorycomponents. The transitory component in each figure is represented by the differencebetween the actual price index and the permanent component.
48
Figure 4
Figure 5


