
Author: Markku Maula
• Literature Review on Cross-Border Venture Capital in the Nordic Region• Review and Analysis of Potential Data Sources of Cross-Border Venture Capital in the Nordic region• Statistical Analysis of Cross-Border Venture Capital in the Nordic Region
Statistics on Cross Border Venture CapitalInvestments in the Nordic Region
December 2010

ii
Participants
Project owners
Marcus Zackrisson, Nordic Innovation Centre (NICe) Hans Christian Bjørne, Nordic Innovation Centre (NICe) Author
Prof. Markku Maula, Advestia Oy Reference group
Zornitsa Pavlova, European Private Equity and Venture Capital Association (EVCA) Vesa Vanhanen, Directorate-General for Enterprise and Industry, European
Commission Jannick Nytoft, Danish Private Equity & Venture Capital Association (DVCA) Krista Rantasaari, Finnish Venture Capital Association (FVCA) Marie Reinius, Swedish Private Equity & Venture Capital Association (SVCA) Knut T. Traaseth, Norwegian Private Equity & Venture Capital Association (NVCA) Gísli Benediktsson, New Business Venture Fund, Iceland

iii
Title: Statistics on Cross Border Venture Capital Investments in the Nordic Region Nordic Innovation Centre (NICe) project number: 10079 Author: Prof. Markku Maula Institution: Advestia Oy Abstract:
Cross-border investments play an important role in the Nordic countries and in Europe in general. However, existing published statistics on cross-border investments are quite limited. More in-depth statistics on cross-border investments would be valuable. Concerning available existing cross-border investment statistics, existing reports (EVCA Nordic Reports and EVCA Year Books) provide a useful basis for understanding the development of cross-border investments in the Nordic countries. Furthermore, their underlying data collected by PEREP_Analytics can be used to create a more detailed picture of cross-border flows. Expanding the cross-border investment and fundraising analyses in the Nordic Report appears as the most feasible approach to produce cost effectively deeper statistical understanding of the development of cross-border activity in the Nordic region. In facilitating cross-border investments in the Nordic region, NICe would have a natural role in supporting more in-depth statistics in cross-border VC as well as platforms for networking and knowledge sharing between Nordic investors and other stakeholders in the ecosystem. Topic/NICe Focus Area: Seed & venture capital (SVC) ISSN: Language: English Pages: 37 Keywords: cross-border venture capital Distributed by:
Nordic Innovation Centre Stensberggata 25 NO-0170 Oslo Norway
Contact person:
Prof. Markku Maula [email protected]
iv
Executive Summary
Cross-border investments play an important role in the Nordic countries and in Europe in general. However, existing published statistics on cross-border investments are quite limited. More in-depth statistics on cross-border investments would be valuable. Concerning available existing cross-border investment statistics, existing reports (EVCA Nordic Reports and EVCA Year Books) provide a useful basis for understanding the development of cross-border investments in the Nordic countries. Furthermore, their underlying data collected by PEREP_Analytics can be used to create a more detailed picture of cross-border flows. Expanding the cross-border investment and fundraising analyses in the Nordic Report appears as the most feasible approach to produce cost effectively deeper statistical understanding of the development of cross-border activity in the Nordic region.
Producing more extensive analyses of cross-border investments in the Nordic countries (or more broadly in Europe) is technically quite straightforward for the team that produces the existing analyses in the Nordic Report if given time and resources. For NICe, to facilitate the production of a more comprehensive analysis of cross-border investments, one potential approach would be to collaborate with the PEREP_Analytics, EVCA and the Nordic VC associations to expand the cross-border investment analysis in the Nordic Report.
Although PEREP_Analytics based cross-border investment statistics have the strongest basis to be considered as official cross-border activity statistics, there is also room and need for other data providers in the Nordic market. Data bases are needed by entrepreneurs to identify potential investors and investors to identify potential targets, partners, and follow-on investors in cross-border VC. This information is available from commercial data bases. In addition, platforms are needed to facilitate matching, interaction, and knowledge sharing between different types of players in cross-border VC context.
In facilitating cross-border investments in the Nordic region, NICe would have a natural role in supporting more in-depth statistics in cross-border VC as well as platforms for networking and knowledge sharing between Nordic investors and other stakeholders in the ecosystem.
v
Table of Contents
Executive Summary ........................................................................................................iv
Table of Contents ............................................................................................................. v
List of Tables ...................................................................................................................vi
List of Figures .................................................................................................................vi
Preface .............................................................................................................................. 1
1 Introduction ............................................................................................................ 2
2 A Literature Review on Cross-Border Venture Capital in the Nordic Region 3
3 A Review and Analysis of Potential Data Sources of Cross-Border VC in the
Nordic region .......................................................................................................... 4
4 A Statistical Analysis of Cross-Border VC in the Nordic Region ...................... 7 4.1 Investments as a Percentage of GDP in Comparison to R&D Expenditures . 7 4.2 Investments by Source Region ....................................................................... 8 4.3 Investments by Country .................................................................................. 9 4.4 Investments by Stage .................................................................................... 11 4.5 Investments by Sector ................................................................................... 12 4.6 Investments by Type of Investor .................................................................. 14 4.7 Investments by Board Positions and Lead Investor Roles............................ 15 4.8 Fundraising by Source Region...................................................................... 17 4.9 Fundraising by Investor Type ....................................................................... 18
5 Conclusions and Recommendations ................................................................... 20 5.1 Conclusions .................................................................................................. 20 5.2 Recommendations......................................................................................... 22
6 References ............................................................................................................. 23
Appendices ..................................................................................................................... 25 Appendix 1: List of Prior Studies on Cross-Border VC in the Nordic Countries .. 25 Appendix 2: Some Useful Links ............................................................................ 29 Appendix 3: Biographical Information of Professor Markku Maula ..................... 30

vi
List of Tables
Table 1 Cross-border flows in the Nordic countries (EVCA 2010a) .......................... 4 Table 2 Comparison of alternative data sources for statistics on cross-border
investments in the Nordic region .................................................................... 5 Table 3 Cross-border VC flows between Nordic countries 2007-2009 ....................... 9 Table 4 Answers to the specified questions ............................................................... 20 Table 5 Summary of studies including data or statistics on cross-border VC in the
Nordic countries............................................................................................ 25
List of Figures
Figure 1 VC investments in Nordic portfolio companies as a percentage of GDP vs. R&D expenditure per GDP ............................................................................. 8
Figure 2 Investments in Nordic portfolio companies by source region ........................ 9 Figure 3 Investments in Nordic portfolio companies by country ............................... 11 Figure 4 Share of foreign investors in investments made in Nordic portfolio
companies by country ................................................................................... 11 Figure 5 Investments in Nordic portfolio companies by investment stage ................. 12 Figure 6 Share of foreign investors in investments made in Nordic portfolio
companies by investment stage .................................................................... 12 Figure 7 Investments in Nordic portfolio companies by sector .................................. 13 Figure 8 Share of foreign investors in investments made in Nordic portfolio
companies by sector ...................................................................................... 13 Figure 9 Investments in Nordic portfolio companies by type of investors ................. 14 Figure 10 Share of foreign investors in investments made in Nordic portfolio
companies by type of investors..................................................................... 14 Figure 11 Investments made in Nordic portfolio companies by source region (#
investments) .................................................................................................. 16 Figure 12 Share of investments with a board position in investments made in Nordic
portfolio companies by source region .......................................................... 16 Figure 13 Share of investments with a lead investor role in investments made in
Nordic portfolio companies by source region .............................................. 17 Figure 14 Fundraising by Nordic VC investors ............................................................ 18 Figure 15 Fundraising by Nordic VC investors by investor type ................................. 19 Figure 16 Share of foreign investments in fundraising by Nordic portfolio companies
by investor type............................................................................................. 19
1
Preface
This report has been prepared for the Nordic Innovation Centre (NICe) to support the work of NICe in facilitating the development of the Nordic venture capital market. I want to thank Marcus Zackrisson and Hans Christian Bjorne of NICe for initiating the study and for their support throughout the study. This work has also benefited greatly from a valuable support from PEREP_Analytics and the European Private Equity and Venture Capital Association (EVCA) who have provided the data used in the analyses. Particular thanks are due to Zornitsa Pavlova of EVCA and Dan Magirescu of PEREP_Analytics. Furthermore, I want to thank the project reference group members Vesa Vanhanen, Directorate-General for Enterprise and Industry, European Commission, Jannick Nytoft, Danish Private Equity & Venture Capital Association, Krista Rantasaari, Finnish Venture Capital Association, Marie Reinius, Swedish Private Equity & Venture Capital Association, Knut T. Traaseth, Norwegian Private Equity & Venture Capital Association, and Gísli Benediktsson, New Business Venture Fund, Iceland for their comments and feedback that have helped improve this study.
2
1 Introduction
This report has been prepared for the Nordic Innovation Centre (NICe) to support the work of NICe in facilitating the development of the Nordic venture capital market. As noted in the “ToR – Statistics on Cross Border Venture Capital Investments in the Nordic Region” document of NICe (dated 2010-07-01), many signals indicate that there are currently challenges in the functioning of the Nordic venture capital market. To address these challenges and to stimulate cross-border venture capital investments in the Nordic region, NICe has observed a need for new knowledge on the amount of existing cross-border venture capital investments to, from, and between the Nordic countries. Therefore, NICe decided to commission a study on statistics on cross border venture capital investments in the Nordic region. As requested, this report is focused on venture capital (defined in this study as capital investments in non-public companies (private equity) targeting seed-, start-ups and growth companies) in the Nordic region with a particular attention on cross-border venture capital investments. In other words, buyouts are excluded from these analyses. This study includes both investments between the Nordic countries as well as inbound/outbound investments to and from countries outside the Nordic region. In addition to investments by VCs in portfolio companies, also fundraising by VCs is included.
The main purpose of this study, as requested in the terms of reference, is to identify available statistics on cross-border venture capital investments in the Nordic region. This study seeks to answer the following questions outlined in the terms of reference:
1. What types of published cross-border venture capital statistics are available?
a. What statistics are collected and by whom and how is it collected (from investors or investees)? If multiple sources; are they in agreement?
b. Does any agency/organization in each country have an official mandate to collect cross-border venture capital investment statistics? Do they record inbound, as well as outbound investments?
c. What is measured, what is included/excluded, and how is it indexed (sectors, phases and types of investments)?
d. How frequent are the statistics updated and how far back in time do they go?
e. Is it in the data possible to derive information on active vs. passive ownership: Is the percentage of ownership for each investment noted, and/or is board representation noted?
f. Are the data comparable between the countries and can it be used for statistical purposes?
2. Aside from the published statistics what unprocessed relevant data is available at the statistical agencies and similar agencies?
3. Which additional statistics or data are needed to get a full overview of cross-border investments in the Nordic countries?
a. If any, how could they be acquired?
4. Are there any policy documents concerning cross-border VC statistics at national level or EU-level
3
The rest of this paper is structured as follows. Section 2 reviews prior studies on cross-border VC. Section 3 provides a review and analysis of the data sources for cross-border VC statistics in the Nordic region. Section 4 provides a statistical analysis of cross-border VC in the Nordic region. Section 5 concludes and provides recommendations.
2 A Literature Review on Cross-Border Venture Capital in
the Nordic Region
There are some prior studies and reports that report statistics on the Nordic venture capital market that can be useful for understanding cross-border investments and fundraising in the region. Identified prior studies that report cross-border statistics, use cross-border data, or otherwise deal with cross-border VC in the Nordic region are listed in Table 4 in Appendix 1. Some of the main studies with published cross-border VC statistics are discussed below in this section.
The first identified major study paying attention to the importance of recognizing internationalization of venture capital and private equity in statistics was the OECD working paper by Baygan and Freudenberg (2000). This study noted the importance of distinguishing the country of management and the country of destination approaches in VC statistics and highlighted the important contribution of foreign investors e.g. in investments made in Finnish and Danish portfolio companies. Equivalent country of management and country of destination approaches have been adopted in the statistics produced by PEREP_Analytics since 2007.
In 2006, Nordic Innovation Center commissioned a report of the Nordic VC and private equity market between years 2003-2005 (Sørheim et al. 2006). Although this report noted the identification of cross-border flows as an important topic for the future, the statistics in the report were mostly constrained to statistics based on the country of management of management approach given data limitations at that time. However, statistics on foreign fundraising were provided divided in domestic, Nordic, European, and other. Nordic Innovation Center has also commissioned and produced several other reports seeking ways to remove obstacles for cross-border investments and to otherwise facilitate cross-border investments (Nordic Innovation Center 2006a, 2006b, 2009, 2010).
Also European Commission has addressed cross-border VC investments in a number of communications and reports it as prepared (European Commission 2007b, 2009) as well as in reports it has commissioned (European Commission 2006, 2007a).1 These reports generally focus on policy measures needed to facilitate cross-border investments and fundraising and do not provide statistics on cross-border investments as such.
Since 2008, the European Private Equity and Venture Capital Association has produced an annual Nordic Report that provides not only some useful overall market statistics, but also some analysis of the cross-border flows. In Table 1, to give a view of the existing published cross-border investment statistics, an analysis of the cross-border flows of the EVCA 2010 Nordic Report is reproduced below. This analysis compares investments made in companies in the Nordic region by investors outside the region and investments made in companies outside the Nordic region by investors inside the region.
1 Many of these reports are available at:
http://ec.europa.eu/enterprise/policies/finance/risk-capital/venture-capital/

4
Table 1 Cross-border flows in the Nordic countries (EVCA 2010a)
The Nordic Report also contains some other analyses splitting investments in the Nordic region in those coming from inside and outside the region as well as providing some basic statistics on fundraising and divestments. Most of the analyses combine both VC and buyouts, but some analyses are also available for VC separately. Overall, the EVCA Nordic Report is clearly the best available published collection of statistics on the VC and private equity activity in the Nordic region.
Overall, although cross-border VC investments have clearly become an increasingly well recognized important phenomenon during the past decade and especially during the past five years since 2005, there are surprisingly few studies that would actually provide statistics on the evolution of cross-border investments in the Nordic countries or elsewhere.
3 A Review and Analysis of Potential Data Sources of
Cross-Border VC in the Nordic region
In this section, a review and analysis of data sources for cross-border VC statistics in the Nordic region is reported. As potential data sources we consider the most promising identified data sources on venture capital and private equity investments that have been used in research on cross-border venture capital or published statistics in the literature review, or which have been otherwise identified as potentially relevant databases. The reviewed data sources include PEREP_Analytics, VentureXpert by Thomson Financial, VentureSource by DowJones, Zephyr by Bureau Van Dijk, Private Equity Insight by Unquote / Incisive Media, CapitalIQ by Standard & Poors, TechnopolisOnline by Technopolis, and Preqin (Private Equity Intelligence). In Table 2, we summarize some of the key dimensions of alternative data sources for statistics on venture capital in the Nordic region.

5
Table 2 Comparison of alternative data sources for statistics on cross-border
investments in the Nordic region
PEREP_Analytics VentureExpert VentureSource Zephyr CapitalIQ TechnopolisOnline
”Official” VC statistics
Yes Not Not Not Not Not
Comprehensive data coverage in the Nordic countries
Yes Yes Yes Yes Yes Not (currently only Finland, but expanding)
Access By agreement Commercial Commercial Commercial Commercial Commercial/ Agreement?
Company names normally available for users
Not Yes Yes Yes Yes Yes
Suitability from the perspective of this evaluation
A source of data for ”official” cross-border VC statistics
An international data source both for deal flow identification and statistics
An international data source both for deal flow identification and statistics
An international data source both for deal flow identification and statistics
An international data source both for deal flow identification and statistics
A platform to support ecosystem development (deal flow identification, complementary data and services, statistics)
Of these databases, PEREP_Analytics is the most official original source of statistics. It is a centralized, non-commercial pan-European private equity database developed as a joint statistical platform of EVCA and 18 national and regional private equity and venture capital associations across Europe, of which four are from the Nordic region: DVCA (Denmark), FVCA (Finland), NVCA (Norway) and SVCA (Sweden). Iceland has not had a VC association during the recent years, but will hopefully have that in the future. Other statistical organizations such as Eurostat use data from PEREP_Analytics as the basis of their venture capital and private equity indicators.
The other reviewed data sources are all developed by commercial organizations. From the perspective of statistics on cross-border venture capital investments in the Nordic countries, the four most comprehensive data bases are VentureXpert by Thomson Financial, VentureSource by DowJones, Zephyr by Bureau Van Dijk, and CapitalIQ by Standard & Poors. Of these, VentureXpert and VentureSource have been used most for scholarly research, especially in the United States. In the Nordic countries, the limited local presence has caused some limitations especially in comprehensiveness of smaller investments. Zephyr has been argued to have a somewhat stronger coverage in the Nordic countries. CapitalIQ has a stronger focus on buyouts and other bigger transactions, so there are some limitations especially in smaller venture capital investments. Earlier mentioned Preqin has a focus primarily on funds and fund investments by limited partners with less focus on information on the investments made by funds in portfolio companies. Private Equity Insight, is also one data provider dedicated to venture capital and private equity, but with less prior use and validation in published scholarly research. TechnopolisOnline is somewhat differently profiled data

6
source with a very close focus on the ecosystem of high growth high tech companies. The coverage of investments in such companies (currently) in Finland is comprehensive with e.g. R&D subsidies included. However, the lack of geographical coverage is currently a limitation for that database.
The timeliness of the data is sufficient in all these databases since they are all updated continuously and/or with frequent surveys.
Major differences exist in the disclosure of company names in the databases. In PEREP_Analytics names of investors and portfolio companies are confidential information for outside analysts or researchers. That is not a problem for statistics, but means that the data cannot be used to e.g. identify deal flow. In commercial databases, names are generally available although for some investments the names are undisclosed.
The comprehensiveness of the data in the Nordic countries is generally the best in PEREP_Analytics, since all European venture capital and private equity companies are surveyed and members of EVCA and/or national VC associations are required to answer. In addition to quarterly surveys of all European venture capital and private companies, there each country has a dedicated analyst who in collaboration with analysts at the national VC associations collects information also from various public sources to ensure the comprehensiveness of the data. In comparison to commercial databases that rely only on voluntary information provision by involved parties and information required to be disclosed by law, PEREP_Analytics, with a mandate from the venture capital associations, has some authority to collect detailed information from private equity investors also concerning deals that these investors would not self select to announce publicly.
One slight limitation in PEREP_Analytics concerns investments made in European companies by investors that do not have an office anywhere in Europe. Information on such investments is only collected using public sources. However, this does not appear to cause a major bias, because investments by foreign (E.g. US or Asian VCs) in Nordic companies are generally well publicized. If they are held undisclosed, they generally are undisclosed also in commercial databases. Also, data on cross-border divestments is limited as the nationality of acquirers in trade sales exits is not available.
Concerning the focus on venture capital and private equity, PEREP_Analytics is a dedicated data source with detailed information on the offices of private equity companies in different countries.2 This and a detailed documented methodology are important for accurate cross-border statistics in a market where many investors have offices in many countries. Some other databases such as Zephyr treat venture capital and private equity more as transactions like M&A and have less detail on the venture capital and private equity investors as special kind of organizations. Also the data on fundraising is more limited.
Of the reviewed data sources, PEREP_Analytics appears to be the most natural choice
2 Accurate tracking of the offices of VC firms in different countries is important for accurate
statistics of cross-border investment flows. However, it is also important to note that as VCs internationalize and become multinational and establish offices in new countries like many major VCs in the Nordic region have done, investments made by these new local offices are no longer calculated as cross-border investments. In other words, this important dimension of the integration of the Nordic VC market is masked in statistics tracking cross-border investments.

7
as the basis for additional cross-border investment statistics. Given the extensive use of PEREP_Analytics as the source of official venture capital and private equity statistics, and the existing annual EVCA Nordic Report providing most of the basic information and some very relevant basic analyses of cross-border activity, some additional cross-border analyses would be quite easy to add.
However, there is also room and need for other commercial data providers in the Nordic market for complementary statistics, but in particular to help entrepreneurs to identify potential investors and investors to identify partners and follow-on investors in cross-border VC. Commercial data bases such as VentureXpert, VentureSource, Zephyr, TechnopolisOnline are very useful for that purpose. In addition, there is also a role for platforms to facilitate matching, interaction and knowledge sharing between different types of players in cross-border VC context. TechnopolisOnline is an example of such a platform.
4 A Statistical Analysis of Cross-Border VC in the Nordic
Region
In this section, a statistical analysis of cross-border VC in the Nordic region is reported. Following a review of potential data sources, PEREP_Analytics was selected as the data source used in this analysis. As requested in the terms of reference, the study will, to the extent possible, separate and sort the statistics between countries, Investment phases (e.g. seed, start-up and expansion), public and private investments, private investments, direct vs. fund of funds investments, Inbound and outbound investments per country, and industry sectors. As requested, the analyses are limited to VC (excluding buyouts). Concerning the methods used in the data collection and the variable definitions, the EVCA 2010 Yearbook and EVCA Nordic Report 2010 are the best sources. It is to be noted that definition of the VC stage was changed in 2009 Yearbook, so VC statistics from older yearbooks are not directly comparable. In these analyses, the latest data is used consistently with the updating since the latest yearbook causing some minor differences between the figures in theses analyses and those published in the 2010 yearbook and the Nordic Report. In the analyses of this study, we want to measure also cross-border activity between the Nordic countries, so foreign is defined to include all investments made by investors located in another country than the target country.
4.1 Investments as a Percentage of GDP in Comparison to R&D Expenditures
Before digging deeper in the analyses of cross-border activity, we first provide an overview of the development of the Nordic VC market by comparing in Figure 1 the relative volume of VC investments (including seed, startup and later stage VC) in Nordic portfolio companies scaled by GDP of the focal Nordic countries and by contrasting this with R&D expenditure divided by GDP.

8
Figure 1 VC investments in Nordic portfolio companies as a percentage of GDP vs.
R&D expenditure per GDP3
This analysis shows that while the relative R&D expenditure has remained rather stable throughout the 2007-2009 period, the relative VC investment has decreased rather significantly in all Nordic countries with available VC statistics. Next, we focus on the analysis of grow-border flows in the Nordic region.
4.2 Investments by Source Region
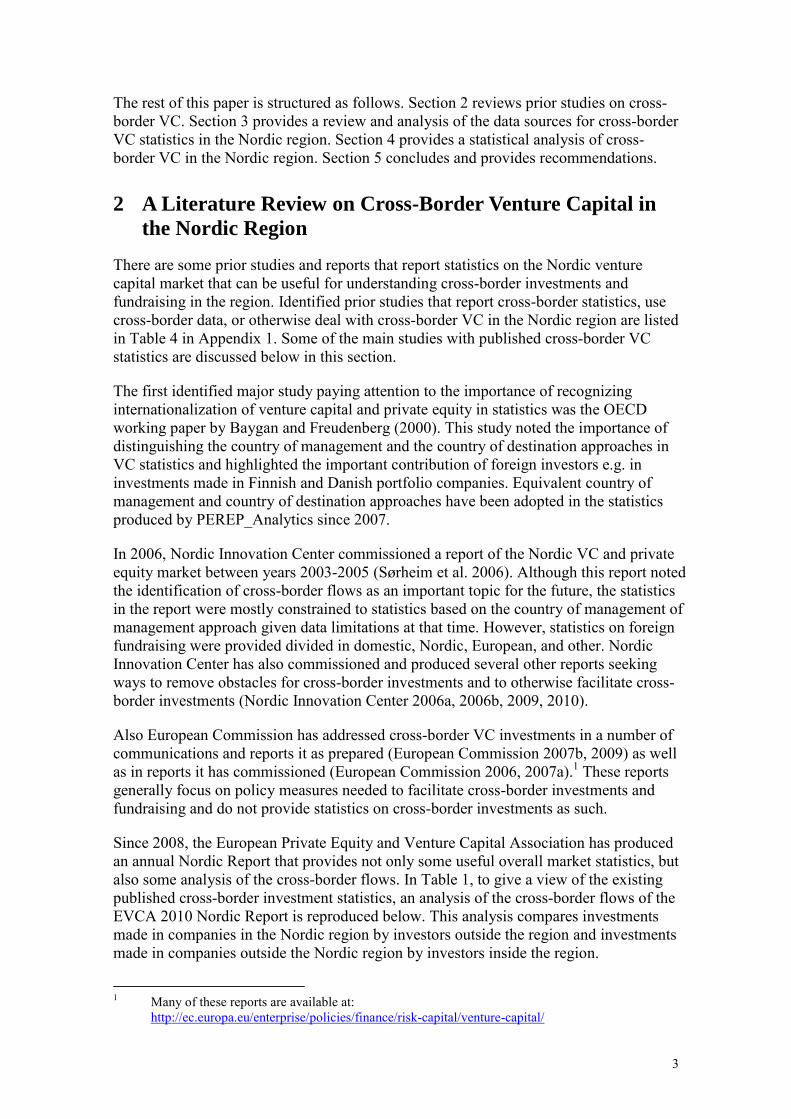
First, Figure 2 reports the sources of investments separately for all the included Nordic countries dividing the sources of investments in domestic, other Nordic countries, other European countries, and investors outside Europe. The figure also reports the shares of foreign investors. This analysis shows that the share of foreign investments has been relatively low, in general some 20% with the share peaking in 2008 and decreasing for 2009. The split of foreign investments also shows, perhaps interestingly, that in general the role of investments from other Nordic countries has been quite low and investments from outside Europe almost nonexistent in most countries and time periods. Most of the foreign investments have come from European investors outside the Nordic region.
3 Data sources PEREP_Analytics and Eurostat
Denmark
Finland
Norway
Sweden
2007
2007
2007
2007
2008
2008
2008
2008
2009
2009
2009
2009
0.00%
0.05%
0.10%
0.15%
0.20%
0.00% 0.50% 1.00% 1.50% 2.00% 2.50% 3.00% 3.50% 4.00% 4.50%
VC
inve
stm
ent
in p
ort
folio
co
mpa
nie
s p
er G
DP
(%)
R&D expenditure per GDP (%)
VC investments in Nordic portfolio companies per GDPvs. R&D expenditure per GDP
9
Figure 2 Investments in Nordic portfolio companies by source region
To get a more detailed understanding of the VC investment flows between the Nordic countries, Table 3 reports the number of investments, investment volumes, and the share of these flows as a percentage of all VC investments received by portfolio companies in the focal Nordic countries. Given the small numbers of investments and to simplify the table, these figures are reported as an aggregate for the years 2007-2009. The analysis shows that Swedish VCs have been the main sources of cross-border VC to other Nordic countries, and that Finnish ventures have benefited relatively most from investments from other countries (15.1% of all investments received by Finnish ventures were from other Nordic countries).
Table 3 Cross-border VC flows between Nordic countries 2007-2009 To Denmark To Finland To Norway To Sweden From Denmark Number of investments 2 1 8 € million 5.9 0.5 6.5 % of all received VC (€) 1.7% 0.1% 0.6% From Finland Number of investments 4 5 24 € million 3.7 8.9 15.0 % of all received VC (€) 0.8% 1.6% 1.4% From Norway Number of investments 10 9 41 € million 14.6 14.9 35.7 % of all received VC (€) 3.0% 4.3% 3.4% From Sweden Number of investments 52 32 24 € million 26.6 31.8 24.5 % of all received VC (€) 5.5% 9.1% 4.4%
4.3 Investments by Country
Next we extend the time period covered to include the first half of 2010 and add some granularity in the analysis e.g. in the time period, investment stages, and industry. Investments are split based on time given the given objective to consider potential indices for the evolution of cross-border VC in the Nordic region. In these analyses, new statistics are provided on half-yearly basis showing separately market based
0%
10%
20%
30%
40%
50%
60%
0
50
100
150
200
250
300
350
400
450
500
2007 2008Denmark
2009 2007 2008Finland
2009 2007 2008Norway
2009 2007 2008Sweden
2009
€m
illio
n
Investments in Nordic portfolio companies by source region (VC only)
Domestic Other Nordic Countries Other European Countries Outside Europe Share of Foreign

10
statistics (all VC investments made in Nordic companies) first with total amounts split in categories (countries, stages, sectors, and type of investors) and then share of foreign investments reported for those categories. These analyses should be useful in understanding the role of foreign investors as the source of finance for portfolio companies in these categories.
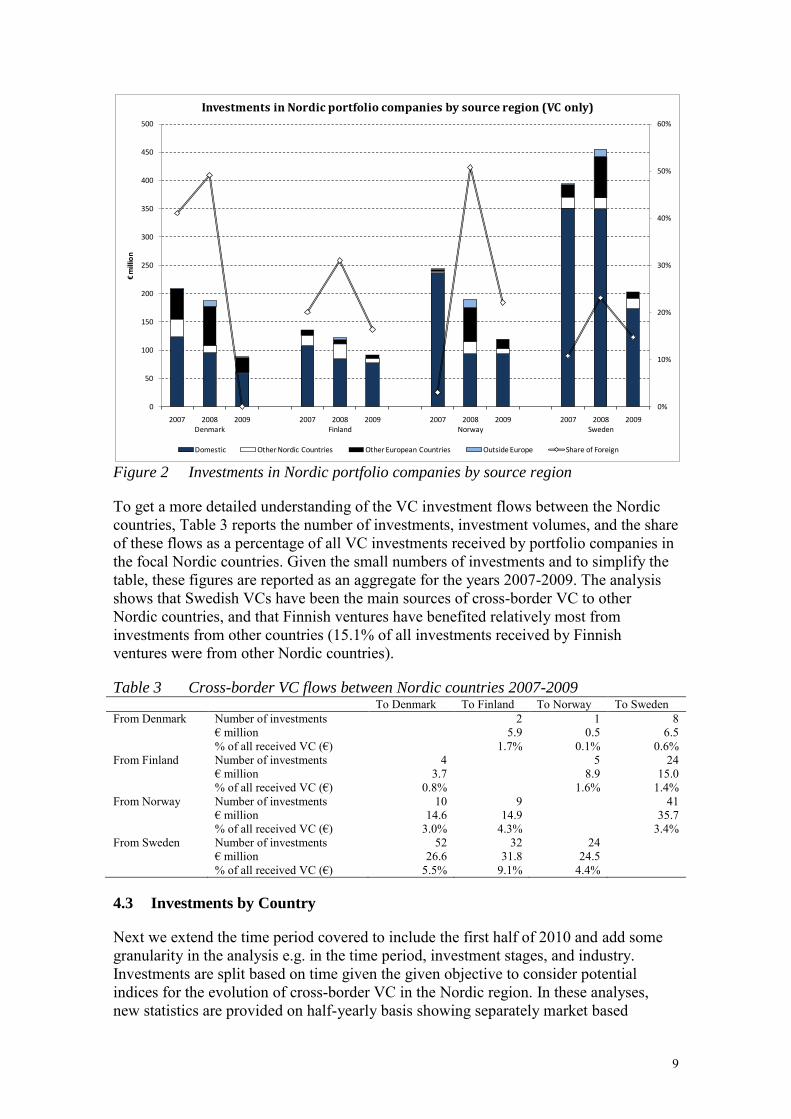
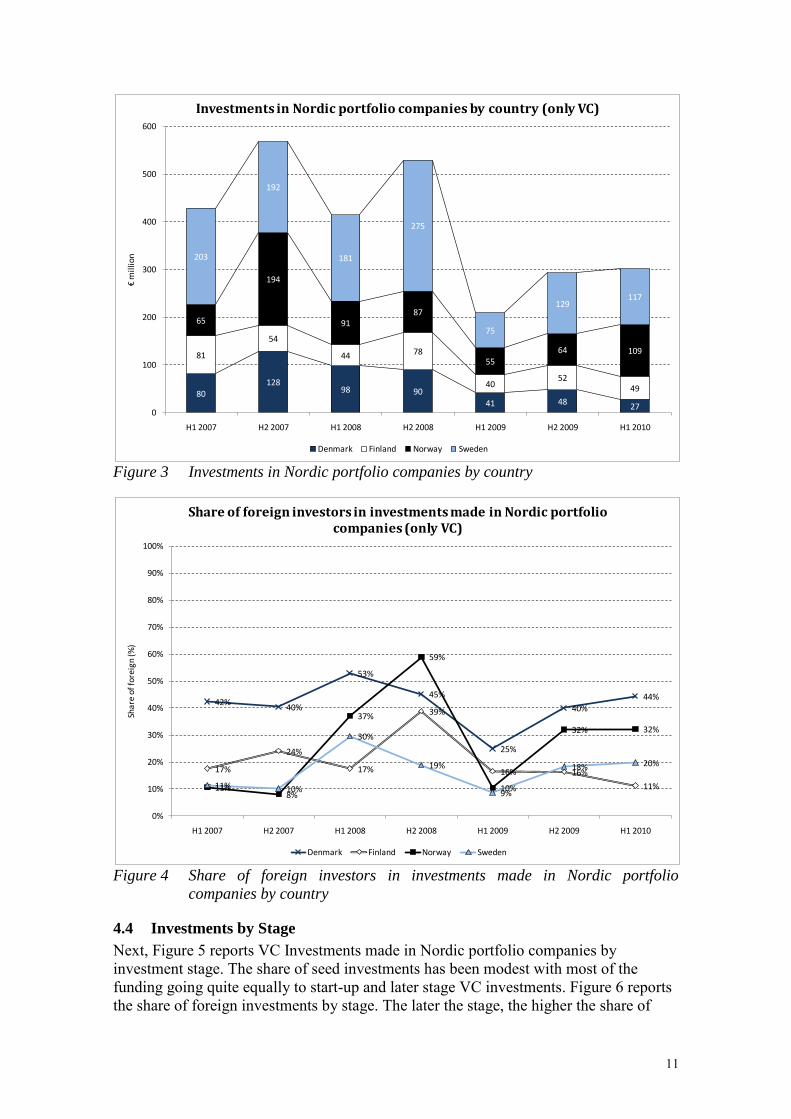
In Figure 3 we split all VC investments received by Nordic portfolio companies by country of portfolio company. This gives an overview of the volumes of investments received by Nordic portfolio companies in half-year periods. In Figure 4 we provide the shares of foreign investors in these categories, i.e. for investments in portfolio companies in these Nordic countries. This analysis shows that ventures in the four biggest Nordic countries have received quite comparable amounts of VC with Swedish ventures receiving somewhat more than Danish, Finnish and Norwegian ones. In Denmark, the role of foreign investors has been generally stronger than in the other countries.
11
Figure 3 Investments in Nordic portfolio companies by country
Figure 4 Share of foreign investors in investments made in Nordic portfolio
companies by country
4.4 Investments by Stage
Next, Figure 5 reports VC Investments made in Nordic portfolio companies by investment stage. The share of seed investments has been modest with most of the funding going quite equally to start-up and later stage VC investments. Figure 6 reports the share of foreign investments by stage. The later the stage, the higher the share of
80128
98 90
41 4827
81
54
44 78
4052
49
65
194
9187
5564 109
203
192
181
275
75
129117
0
100
200
300
400
500
600
H1 2007 H2 2007 H1 2008 H2 2008 H1 2009 H2 2009 H1 2010
€m
illio
n
Investments in Nordic portfolio companies by country (only VC)
Denmark Finland Norway Sweden
42%40%
53%
45%
25%
40%
44%
17%
24%
17%
39%
16% 16%
11%11%8%
37%
59%
10%
32% 32%
11% 10%
30%
19%
9%
18% 20%
0%
10%
20%
30%
40%
50%
60%
70%
80%
90%
100%
H1 2007 H2 2007 H1 2008 H2 2008 H1 2009 H2 2009 H1 2010
Shar
e of
fore
ign
(%)
Share of foreign investors in investments made in Nordic portfolio companies (only VC)
Denmark Finland Norway Sweden

12
foreign investors. Seed investments were almost completely domestic.
Figure 5 Investments in Nordic portfolio companies by investment stage
Figure 6 Share of foreign investors in investments made in Nordic portfolio
companies by investment stage
4.5 Investments by Sector
Figure 7 reports VC Investments made in Nordic portfolio companies by industry sector. Computers and communications, energy, and life sciences related portfolio
27 35 3617 12 14 14
259 245195 251
130154 146
142
288
183
261
68
125 142
0
100
200
300
400
500
600
H1 2007 H2 2007 H1 2008 H2 2008 H1 2009 H2 2009 H1 2010
€m
illio
n
Investments in Nordic portfolio companies by stage (only VC)
Seed Start-Up Later Stage Venture
8%
3%
22%
6%
0%4%
0%
21%17%
37%
44%
14%
25%
15%14%
19%
36%
24%
15%
26%
38%
0%
10%
20%
30%
40%
50%
60%
70%
80%
90%
100%
H1 2007 H2 2007 H1 2008 H2 2008 H1 2009 H2 2009 H1 2010
Shar
e of
fore
ign
(%)
Share of foreign investors in investments made in Nordic portfolio companies by stage (only VC)
Seed Start-Up Later Stage Venture

13
companies received the majority of VC investments, but these sectors did not generally receive higher share of foreign investments than others (Figure 8). In all sectors, most of the funding came normally from domestic investors.
Figure 7 Investments in Nordic portfolio companies by sector
Figure 8 Share of foreign investors in investments made in Nordic portfolio
companies by sector
134 130 142172
59100 113
4882 74
52
53
6965
139
190
104114
72
78 63
109
167
95
192
25
46 61
0
100
200
300
400
500
600
H1 2007 H2 2007 H1 2008 H2 2008 H1 2009 H2 2009 H1 2010
€m
illio
n
Investments in Nordic portfolio companies by country by sector(only VC)
Computer and consumer electronics and communications Energy and environment Life sciences Other
31%
17%
35% 34%
14%
28%
19%
2%0%
20%
56%
8%
17%
22%20%
25%28%
37%
17% 19%
28%
6%
18%
57%
23%
16%
39%36%
0%
10%
20%
30%
40%
50%
60%
70%
80%
90%
100%
H1 2007 H2 2007 H1 2008 H2 2008 H1 2009 H2 2009 H1 2010
Shar
e of
fore
ign
(%)
Share of foreign investors in investments made in Nordic portfolio companies by sector (only VC)
Computer and consumer electronics and communications Energy and environment Life sciences Other
14
4.6 Investments by Type of Investor
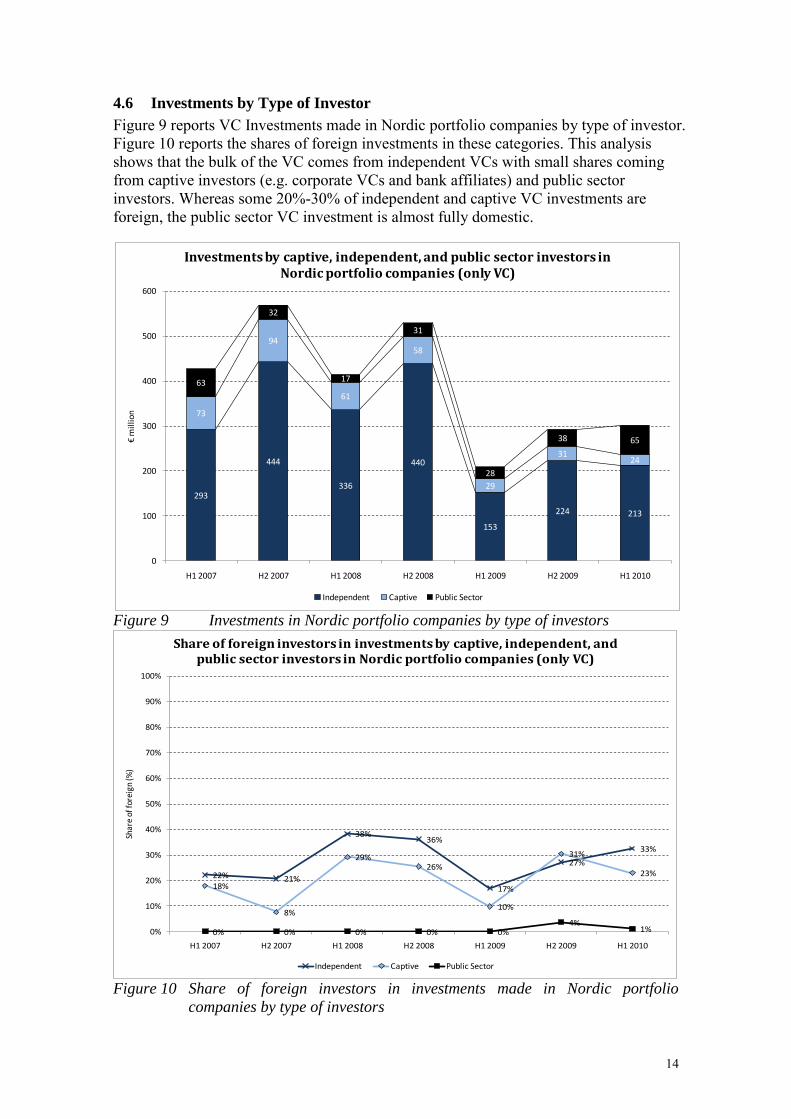
Figure 9 reports VC Investments made in Nordic portfolio companies by type of investor. Figure 10 reports the shares of foreign investments in these categories. This analysis shows that the bulk of the VC comes from independent VCs with small shares coming from captive investors (e.g. corporate VCs and bank affiliates) and public sector investors. Whereas some 20%-30% of independent and captive VC investments are foreign, the public sector VC investment is almost fully domestic.
Figure 9 Investments in Nordic portfolio companies by type of investors
Figure 10 Share of foreign investors in investments made in Nordic portfolio
companies by type of investors
293
444
336
440
153
224 213
73
94
61
58
29
3124
63
32
17
31
28
38 65
0
100
200
300
400
500
600
H1 2007 H2 2007 H1 2008 H2 2008 H1 2009 H2 2009 H1 2010
€m
illio
n
Investments by captive, independent, and public sector investors in Nordic portfolio companies (only VC)
Independent Captive Public Sector
22% 21%
38%36%
17%
27%
33%
18%
8%
29%26%
10%
31%
23%
0% 0% 0% 0% 0%4%
1%0%
10%
20%
30%
40%
50%
60%
70%
80%
90%
100%
H1 2007 H2 2007 H1 2008 H2 2008 H1 2009 H2 2009 H1 2010
Shar
e of
fore
ign
(%)
Share of foreign investors in investments by captive, independent, and public sector investors in Nordic portfolio companies (only VC)
Independent Captive Public Sector

15
4.7 Investments by Board Positions and Lead Investor Roles
Next, given the interest in active ownership by investors, we examine available proxies of active ownership by examining the share of investments with board positions and lead investor roles in domestic and foreign investments. These analyses are made examining the numbers of investments instead of the monetary value of the investments to show the frequency board positions and lead investor roles between domestic and foreign investors.
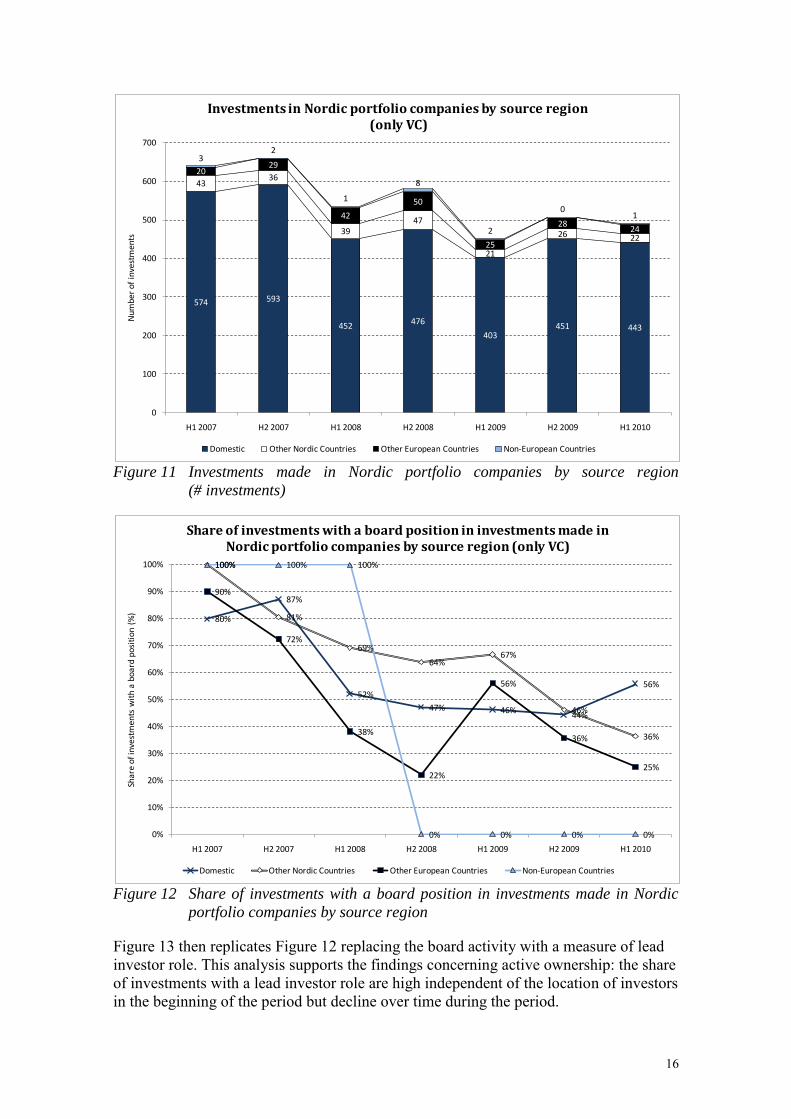
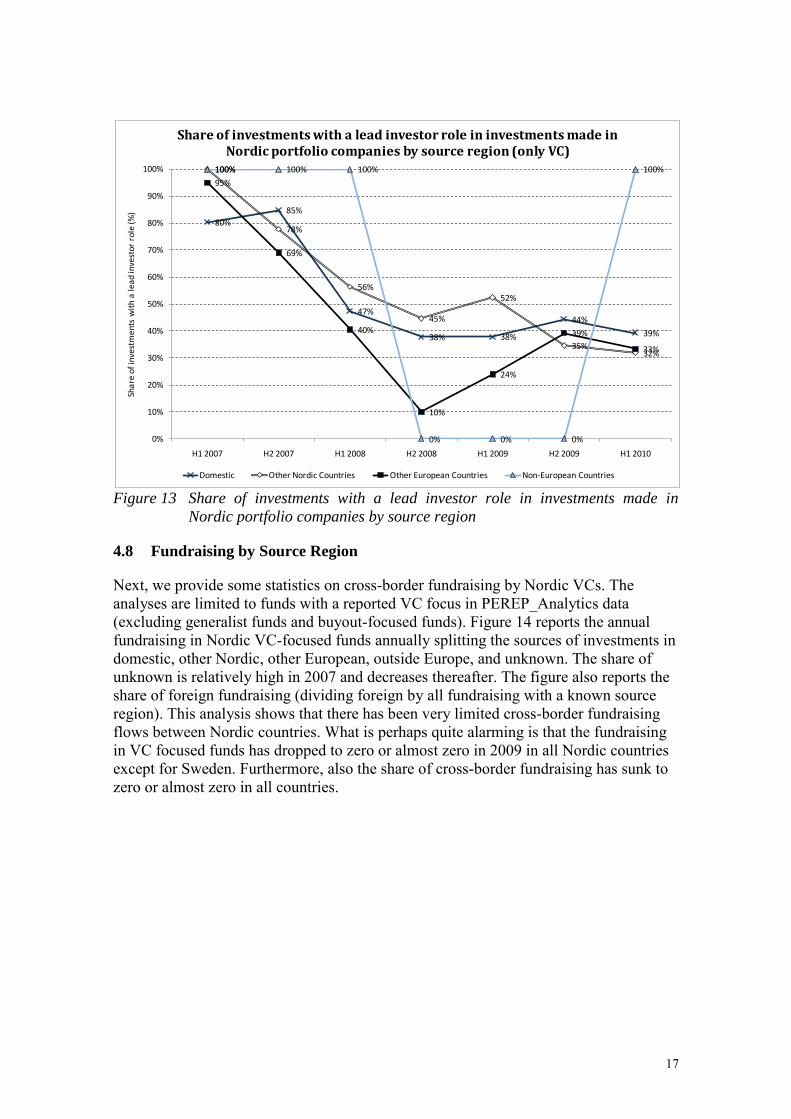
Figure 11 reports the numbers of VC investments received by Nordic companies by source divided in domestic, other Nordic, other European, and non-European. Figure 12 then reports the frequencies of board positions for these investor categories.
This analysis shows that the bulk of the VC in terms of numbers of investments comes from domestic investors with small shares coming from other Nordic and European investors. The role of others is very small. Concerning active ownership, analysis of the share of investments in which board positions are is high independent of the location of investors in the beginning of the period but declines in all groups over time.
16
Figure 11 Investments made in Nordic portfolio companies by source region
(# investments)
Figure 12 Share of investments with a board position in investments made in Nordic
portfolio companies by source region
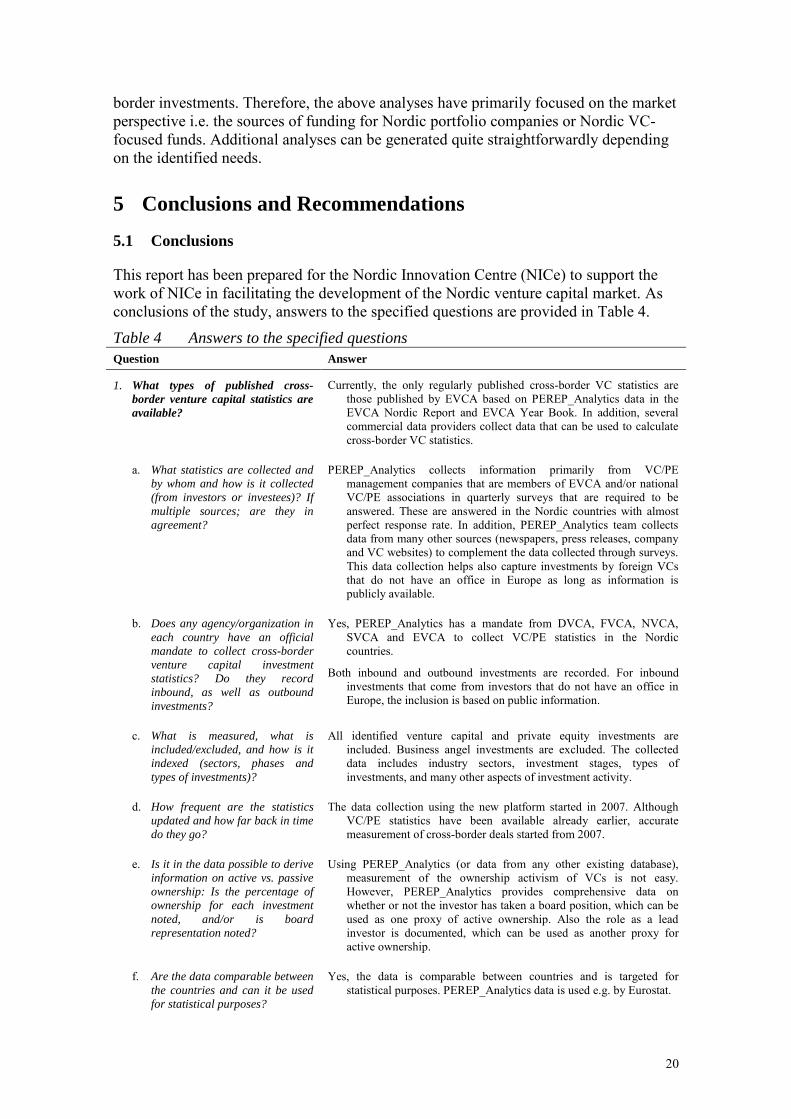
Figure 13 then replicates Figure 12 replacing the board activity with a measure of lead investor role. This analysis supports the findings concerning active ownership: the share of investments with a lead investor role are high independent of the location of investors in the beginning of the period but decline over time during the period.
574 593
452 476
403451 443
4336
3947
21
26 22
2029
42
50
25
2824
32
1
8
2
01
0
100
200
300
400
500
600
700
H1 2007 H2 2007 H1 2008 H2 2008 H1 2009 H2 2009 H1 2010
Num
ber
of in
vest
men
ts
Investments in Nordic portfolio companies by source region(only VC)
Domestic Other Nordic Countries Other European Countries Non-European Countries
80%
87%
52%
47% 46%44%
56%
100%
81%
69%
64%67%
46%
36%
90%
72%
38%
22%
56%
36%
25%
100% 100% 100%
0% 0% 0% 0%0%
10%
20%
30%
40%
50%
60%
70%
80%
90%
100%
H1 2007 H2 2007 H1 2008 H2 2008 H1 2009 H2 2009 H1 2010
Shar
e of
inve
stm
ents
wit
h a
boar
d po
siti
on (
%)
Share of investments with a board position in investments made in Nordic portfolio companies by source region (only VC)
Domestic Other Nordic Countries Other European Countries Non-European Countries
17
Figure 13 Share of investments with a lead investor role in investments made in
Nordic portfolio companies by source region
4.8 Fundraising by Source Region
Next, we provide some statistics on cross-border fundraising by Nordic VCs. The analyses are limited to funds with a reported VC focus in PEREP_Analytics data (excluding generalist funds and buyout-focused funds). Figure 14 reports the annual fundraising in Nordic VC-focused funds annually splitting the sources of investments in domestic, other Nordic, other European, outside Europe, and unknown. The share of unknown is relatively high in 2007 and decreases thereafter. The figure also reports the share of foreign fundraising (dividing foreign by all fundraising with a known source region). This analysis shows that there has been very limited cross-border fundraising flows between Nordic countries. What is perhaps quite alarming is that the fundraising in VC focused funds has dropped to zero or almost zero in 2009 in all Nordic countries except for Sweden. Furthermore, also the share of cross-border fundraising has sunk to zero or almost zero in all countries.
80%
85%
47%
38% 38%
44%
39%
100%
78%
56%
45%
52%
35%32%
95%
69%
40%
10%
24%
39%
33%
100% 100% 100%
0% 0% 0%
100%
0%
10%
20%
30%
40%
50%
60%
70%
80%
90%
100%
H1 2007 H2 2007 H1 2008 H2 2008 H1 2009 H2 2009 H1 2010
Shar
e of
inve
stm
ents
wit
h a
lea
d in
vest
or r
ole
(%)
Share of investments with a lead investor role in investments made in Nordic portfolio companies by source region (only VC)
Domestic Other Nordic Countries Other European Countries Non-European Countries

18
Figure 14 Fundraising by Nordic VC investors
4.9 Fundraising by Investor Type
Figure 15 reports fundraising in Nordic VC-focused funds half-yearly divided by the investor type. For clarity, the figure includes the three largest categories, government agencies, pension funds, and corporate investors, which together contributed 59% of the funds with an identified source. Other sources contributed 10% or less in the following declining order of importance: insurance companies, banks, fund of funds, family offices, other asset managers (including PE houses other than fund of funds), private individuals, capital markets, endowments and foundations, academic institutions, and GP commitment. Figure 16 reports the share of cross-border fundraising in these categories. This analysis shows that overall biggest sources of fundraising for Nordic VC investors have been government agencies, pension funds, and corporate investors with the role of pension funds diminishing in the end of 2008 and the role of government agencies increasing in the beginning of 2009. The share of foreign investments received from these investor types has been quite modest with other investor types making more foreign investments until the beginning of 2009. Thereafter the share of foreign government agencies has increased. The source of this cross-border government fundraising was in Europe outside of the Nordic region.
0%
5%
10%
15%
20%
25%
30%
0
100
200
300
400
500
600
2007 2008Denmark
2009 2007 2008Finland
2009 2007 2008Norway
2009 2007 2008Sweden
2009
Shar
of f
ore
ign
of a
ll kn
ow
n (%
)
€m
illio
n
Fundraising by Nordic VC investors (VC focused funds only)
Domestic Other Nordic Countries Other European Countries Outside Europe Unknown Share of foreign of all known

19
Figure 15 Fundraising by Nordic VC investors by investor type
Figure 16 Share of foreign investments in fundraising by Nordic portfolio companies
by investor type
Overall, PEREP_Analytics data offers very versatile opportunities to conduct different types of analyses and ways to present them. The selected approaches are largely dependent on the purpose they are needed for. From the NICe perspective, one obvious goal is to facilitate the availability of risk capital for innovative Nordic ventures by developing the functioning of the Nordic venture capital market and attracting cross-
10451
13
309 313
92 76
213
104
2
8 2
11 20
120
94
1
106
0
1 4
390
238
126
101
28
7 19
262
62
59
37
16
4096
0
200
400
600
800
1000
1200
H1 2007 H2 2007 H1 2008 H2 2008 H1 2009 H2 2009 H1 2010
€m
illio
n
Fundraising by Nordic VC investors by Investor type (VC focused funds only)
Government agencies Pension funds Corporate investors Other Unknown
0% 0% 0%
5%
0%
29%
17%
8%
18%
0% 0% 0% 0% 0%0%
7%
0%4%
0% 0% 0%
18%15%
27%
22%
0% 0% 0%0%
10%
20%
30%
40%
50%
60%
70%
80%
90%
100%
H1 2007 H2 2007 H1 2008 H2 2008 H1 2009 H2 2009 H1 2010
Shar
e of
fore
ign
(%)
Share of foreign investors in fundraising by Nordic VC investors by investor type (only VC)
Government agencies Pension funds Corporate investors Other
20
border investments. Therefore, the above analyses have primarily focused on the market perspective i.e. the sources of funding for Nordic portfolio companies or Nordic VC-focused funds. Additional analyses can be generated quite straightforwardly depending on the identified needs.
5 Conclusions and Recommendations
5.1 Conclusions
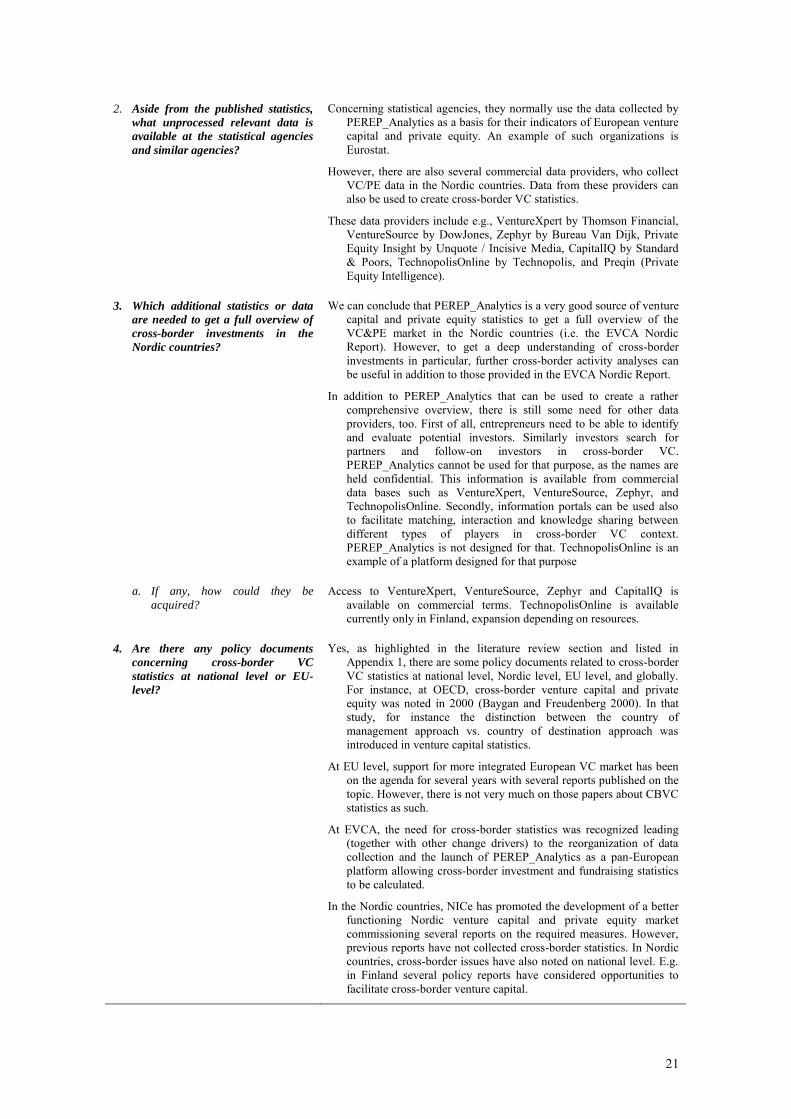
This report has been prepared for the Nordic Innovation Centre (NICe) to support the work of NICe in facilitating the development of the Nordic venture capital market. As conclusions of the study, answers to the specified questions are provided in Table 4.
Table 4 Answers to the specified questions
Question Answer
1. What types of published cross-
border venture capital statistics are
available?
Currently, the only regularly published cross-border VC statistics are those published by EVCA based on PEREP_Analytics data in the EVCA Nordic Report and EVCA Year Book. In addition, several commercial data providers collect data that can be used to calculate cross-border VC statistics.
a. What statistics are collected and
by whom and how is it collected
(from investors or investees)? If
multiple sources; are they in
agreement?
PEREP_Analytics collects information primarily from VC/PE management companies that are members of EVCA and/or national VC/PE associations in quarterly surveys that are required to be answered. These are answered in the Nordic countries with almost perfect response rate. In addition, PEREP_Analytics team collects data from many other sources (newspapers, press releases, company and VC websites) to complement the data collected through surveys. This data collection helps also capture investments by foreign VCs that do not have an office in Europe as long as information is publicly available.
b. Does any agency/organization in
each country have an official
mandate to collect cross-border
venture capital investment
statistics? Do they record
inbound, as well as outbound
investments?
Yes, PEREP_Analytics has a mandate from DVCA, FVCA, NVCA, SVCA and EVCA to collect VC/PE statistics in the Nordic countries.
Both inbound and outbound investments are recorded. For inbound investments that come from investors that do not have an office in Europe, the inclusion is based on public information.
c. What is measured, what is
included/excluded, and how is it
indexed (sectors, phases and
types of investments)?
All identified venture capital and private equity investments are included. Business angel investments are excluded. The collected data includes industry sectors, investment stages, types of investments, and many other aspects of investment activity.
d. How frequent are the statistics
updated and how far back in time
do they go?
The data collection using the new platform started in 2007. Although VC/PE statistics have been available already earlier, accurate measurement of cross-border deals started from 2007.
e. Is it in the data possible to derive
information on active vs. passive
ownership: Is the percentage of
ownership for each investment
noted, and/or is board
representation noted?
Using PEREP_Analytics (or data from any other existing database), measurement of the ownership activism of VCs is not easy. However, PEREP_Analytics provides comprehensive data on whether or not the investor has taken a board position, which can be used as one proxy of active ownership. Also the role as a lead investor is documented, which can be used as another proxy for active ownership.
f. Are the data comparable between
the countries and can it be used
for statistical purposes?
Yes, the data is comparable between countries and is targeted for statistical purposes. PEREP_Analytics data is used e.g. by Eurostat.
21
2. Aside from the published statistics,
what unprocessed relevant data is
available at the statistical agencies
and similar agencies?
Concerning statistical agencies, they normally use the data collected by PEREP_Analytics as a basis for their indicators of European venture capital and private equity. An example of such organizations is Eurostat.
However, there are also several commercial data providers, who collect VC/PE data in the Nordic countries. Data from these providers can also be used to create cross-border VC statistics.
These data providers include e.g., VentureXpert by Thomson Financial, VentureSource by DowJones, Zephyr by Bureau Van Dijk, Private Equity Insight by Unquote / Incisive Media, CapitalIQ by Standard & Poors, TechnopolisOnline by Technopolis, and Preqin (Private Equity Intelligence).
3. Which additional statistics or data
are needed to get a full overview of
cross-border investments in the
Nordic countries?
We can conclude that PEREP_Analytics is a very good source of venture capital and private equity statistics to get a full overview of the VC&PE market in the Nordic countries (i.e. the EVCA Nordic Report). However, to get a deep understanding of cross-border investments in particular, further cross-border activity analyses can be useful in addition to those provided in the EVCA Nordic Report.
In addition to PEREP_Analytics that can be used to create a rather comprehensive overview, there is still some need for other data providers, too. First of all, entrepreneurs need to be able to identify and evaluate potential investors. Similarly investors search for partners and follow-on investors in cross-border VC. PEREP_Analytics cannot be used for that purpose, as the names are held confidential. This information is available from commercial data bases such as VentureXpert, VentureSource, Zephyr, and TechnopolisOnline. Secondly, information portals can be used also to facilitate matching, interaction and knowledge sharing between different types of players in cross-border VC context. PEREP_Analytics is not designed for that. TechnopolisOnline is an example of a platform designed for that purpose
a. If any, how could they be
acquired?
Access to VentureXpert, VentureSource, Zephyr and CapitalIQ is available on commercial terms. TechnopolisOnline is available currently only in Finland, expansion depending on resources.
4. Are there any policy documents
concerning cross-border VC
statistics at national level or EU-
level?
Yes, as highlighted in the literature review section and listed in Appendix 1, there are some policy documents related to cross-border VC statistics at national level, Nordic level, EU level, and globally. For instance, at OECD, cross-border venture capital and private equity was noted in 2000 (Baygan and Freudenberg 2000). In that study, for instance the distinction between the country of management approach vs. country of destination approach was introduced in venture capital statistics.
At EU level, support for more integrated European VC market has been on the agenda for several years with several reports published on the topic. However, there is not very much on those papers about CBVC statistics as such.
At EVCA, the need for cross-border statistics was recognized leading (together with other change drivers) to the reorganization of data collection and the launch of PEREP_Analytics as a pan-European platform allowing cross-border investment and fundraising statistics to be calculated.
In the Nordic countries, NICe has promoted the development of a better functioning Nordic venture capital and private equity market commissioning several reports on the required measures. However, previous reports have not collected cross-border statistics. In Nordic countries, cross-border issues have also noted on national level. E.g. in Finland several policy reports have considered opportunities to facilitate cross-border venture capital.
22
5.2 Recommendations
Concerning available existing cross-border investment statistics, existing reports (EVCA Nordic Reports and EVCA Year Books) provide a useful basis for understanding the development of cross-border investments in the Nordic countries. Furthermore, their underlying data collected by PEREP_Analytics can be used to create a more detailed picture of cross-border VC investment and fundraising flows in the Nordic countries.
Producing more extensive analyses of cross-border investments in the Nordic countries (or in more broadly in Europe) would be quite straightforward for the team that produces the existing analyses. However, it is conceivable that limits in the available time and resources cause limitations in this. Also, given that the report covers both private equity and venture capital and includes also analyses of domestic investment activity, there may be some constraints in how big share of the Nordic report can be devoted to cross-border VC activity analysis. However, there is probably room for some additions. For NICe, to facilitate the production of a more comprehensive analysis of cross-border investments, one potential approach would be to negotiate with the EVCA and PEREP_Analytics as well as the national VC associations on how NICe could help expand the cross-border investment analysis in the Nordic Report. For the policy purposes to develop the Nordic VC market and cross-border flows in the Nordic market, annual frequency is probably enough. As relevant measures, market-based statistics (investments received by Nordic portfolio companies and funds raised by Nordic VC focused funds) are most relevant. Splits by region, stage and industry sector can help identify functioning areas and bottle necks. Splits by investor type can be useful when considering the role of government agencies. Furthermore, analysis of the active ownership can be useful for understanding the role of foreign investors in Nordic companies.
Although PEREP_Analytics based cross-border investment statistics have probably the strongest basis to be considered as official cross-border statistics, there is also room and need for commercial data providers in the Nordic market. Data bases are needed by entrepreneurs to identify potential investors and investors to identify potential targets, partners, and follow-on investors in cross-border VC. This information is available from commercial data bases such as VentureXpert, VentureSource, Zephyr, and TechnopolisOnline. In addition, platforms are needed to facilitate matching, interaction, and knowledge sharing between different types of players in cross-border VC context. TechnopolisOnline is an example of such a platform.
In facilitating cross-border investments in the Nordic region, NICe would have a natural role in supporting more in-depth statistics in cross-border VC as well as platforms for networking and knowledge sharing between Nordic investors and other stakeholders in the ecosystem.

23
6 References
Andersson, T., Napier, G. 2007. The Role of Venture Capital, Global Trends and Issues from a Nordic Perspective. Malmö, Sweden: International Organisation for Knowledge Economy and Enterprise Development (IKED).
Baygan, G., Freudenberg, M. 2000. The internationalization of venture capital activity in OECD countries: Implications for measurement and policy. STI Working Papers - 2000/7. Paris: Organization for Economic Co-operation and Development.
Bottazzi, L., Da Rin, M., Hellmann, T. 2008. What is the Role of Legal Systems in Financial Intermediation? Theory and Evidence. Journal of Financial
Intermediation Forthcoming: Cumming, D., Johan, S. 2007. Regulatory harmonization and the development of
private equity markets. Journal of Banking & Finance 31(10): 3218-3250. Cumming, D., Schmidt, D., Walz, U. 2010. Legality and venture capital governance
around the world. Journal of Business Venturing 25(1): 54-72. Deloitte 2007. Global trends in venture capital 2007 survey. Deloitte Touche Tohmatsu. European Commission 2006. Report of the Alternative Investment Expert Group:
Developing European Private Equity. Brussels, Belgium: European Commission, Directorate General for Internal Market and Services.
European Commission 2007a. Expert group report on removing obstacles to cross-border investments by venture capital funds. Brussels: Directorate General Enterprise and Industry.
European Commission 2007b. Removing obstacles to cross-border investments by venture capital funds. COM(2007) 853 final. Brussels, Belgium: Commission of the European Communities.
European Commission 2009. Summary report of workshops on cross-border venture capital with national experts, industry representatives and researchers Organised by the European Commission in 2008.
EVCA 2008a. Benchmarking European Tax and Legal Environments. European Private Equity & Venture Capital Association.
EVCA 2008b. EVCA 2008 Nordic Report. An EVCA Research Paper - December 2008.
EVCA 2009. EVCA 2009 Nordic Report. An EVCA Research Paper - October 2009. EVCA 2010a. EVCA 2010 Nordic Report. An EVCA Research Paper - October 2010. EVCA 2010b. EVCA Yearbook 2010. European Private Equity and Venture Capital
Association. Groh, A.P., Liechtenstein, H., Canela, M.A. 2008. International allocation determinants
of institutional investments in venture capital and private equity limited partnerships. IESE Working Paper WP no 726.
Maula, M.V.J. 2008. The Nordic Risk Capital Market: A Review to Support Nordic Venture Capital Policy. Report for the Venture Capital Task Force of the Nordic Council of Ministers.
Maula, M.V.J. 2010. Cross-Border Venture Capital and Private Equity, in: D. J. Cumming (Eds.), Venture Capital: Investment Strategies, Structures, and
Policies. John Wiley & Sons, Hoboken, NJ, pp. 473-500. Maula, M.V.J., Murray, G.C. 2003. Finnish Industry Investment Ltd: An International
Evaluation. Publications 1/2003. Helsinki: Ministry of Trade and Industry. Maula, M.V.J., Murray, G.C., Jääskeläinen, M. 2007. Public Financing of Young
Innovative Companies in Finland. MTI Reports 3/2007. Helsinki, Finland:
24
Ministry of Trade and Industry. Meuleman, M., Wright, M. 2011. Cross-border private equity syndication: Institutional
context and learning. Journal of Business Venturing 26(1): 35-48. Meyer, T. 2007. The Public Sector's Role in the Promotion of Venture Capital Markets.
Working paper. Napier, G. 2007. The Danish Risk Capital Market and the Role of Government Policies.
A National Policy Report, prepared for the International Consortium on Entrepreneurship (ICE). Denmark: FORA.
Nordic Innovation Center 2006a. Nordic Investment Fund: Promoting a Common Nordic Venture Capital Market. Oslo, Norway: Nordic Innovation Center.
Nordic Innovation Center 2006b. Obstacles to Nordic Venture Capital Funds: Promoting a Common Nordic Venture Capital Market. November 2006. Oslo, Norway: Nordic Innovation Center.
Nordic Innovation Center 2007. Obstacles to Nordic Venture Capital Funds: Updated Version 2007. September 2007. Oslo, Norway: Nordic Innovation Center.
Nordic Innovation Center 2009. Obstacles to Nordic Venture Capital Funds: Updated Version 2009. September 2007. Oslo, Norway: Nordic Innovation Center.
Nordic Innovation Center 2010. Creating Nordic Success Stories: Enhancing Cooperation on the Nordic Seed Capital Market. September 2007. Oslo, Norway: Nordic Innovation Center.
Rainio, E. 2009. Enhancing the operating conditions and financial resources of emerging growth companies. Ministry of Finance Publications 8/2009. Helsinki, Finland: Ministry of Finance.
Schertler, A., Tykvova, T. 2010. What Lures Cross-Border Venture Capital Inflows? ZEW Discussion Paper No. 10-001. Mannheim:
Sørheim, R., Øystein, L., Havn, K. 2006. Nordic Private Equity - An Industry Analysis. Oslo, Norway: NTNU Entrepreneurship Center.
Tukkinen, R., Maula, M.V.J. 2009. Cross-border private equity fundraising: Evidence from fundraising flows between European countries. Paper under review with the Journal of Corporate Finance.
United Nations Economic Commission for Europe 2007. Financing Innovative Development: Comparative Review of the Experiences of UNECE Countries in Early-Stage Financing. New York and Geneva: UNITED NATIONS.
Unquote 2006. Nordic Report 2006, Tenth Edition. London, UK: Incisive Financial Publishing Ltd.
25
Appendices
Appendix 1: List of Prior Studies on Cross-Border VC in the Nordic Countries
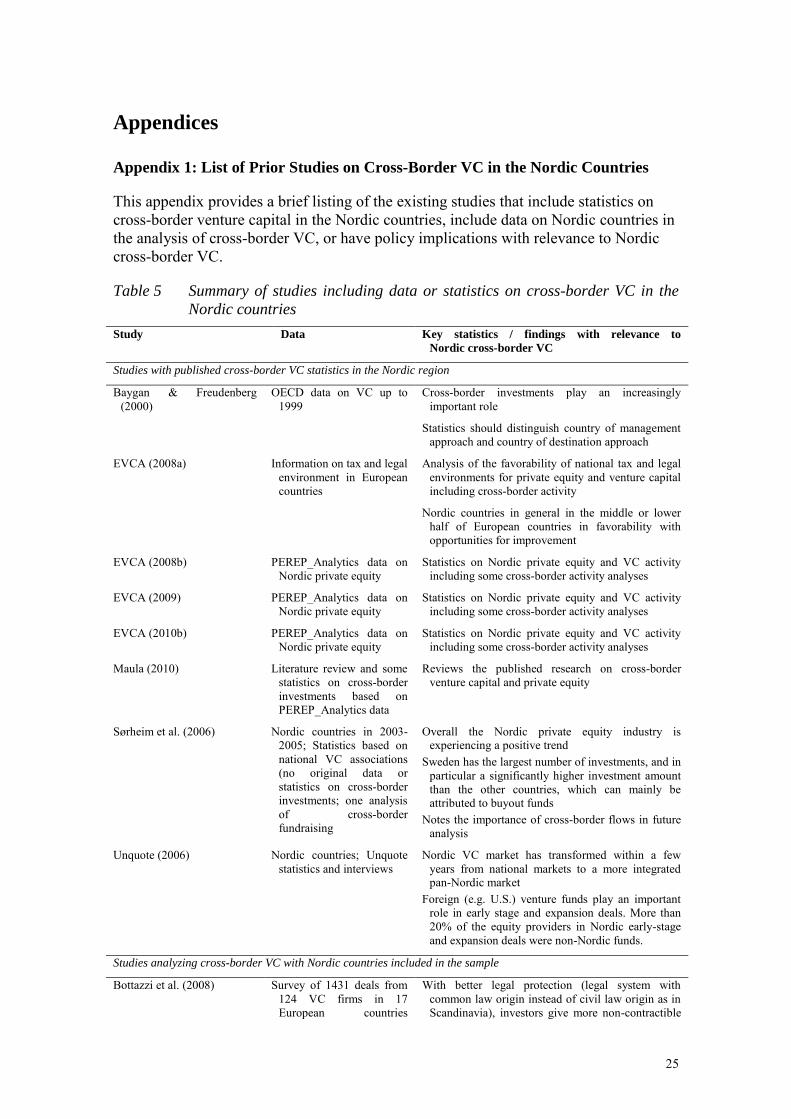
This appendix provides a brief listing of the existing studies that include statistics on cross-border venture capital in the Nordic countries, include data on Nordic countries in the analysis of cross-border VC, or have policy implications with relevance to Nordic cross-border VC.
Table 5 Summary of studies including data or statistics on cross-border VC in the
Nordic countries
Study Data Key statistics / findings with relevance to
Nordic cross-border VC
Studies with published cross-border VC statistics in the Nordic region
Baygan & Freudenberg (2000)
OECD data on VC up to 1999
Cross-border investments play an increasingly important role
Statistics should distinguish country of management approach and country of destination approach
EVCA (2008a) Information on tax and legal environment in European countries
Analysis of the favorability of national tax and legal environments for private equity and venture capital including cross-border activity
Nordic countries in general in the middle or lower half of European countries in favorability with opportunities for improvement
EVCA (2008b) PEREP_Analytics data on Nordic private equity
Statistics on Nordic private equity and VC activity including some cross-border activity analyses
EVCA (2009) PEREP_Analytics data on Nordic private equity
Statistics on Nordic private equity and VC activity including some cross-border activity analyses
EVCA (2010b) PEREP_Analytics data on Nordic private equity
Statistics on Nordic private equity and VC activity including some cross-border activity analyses
Maula (2010) Literature review and some statistics on cross-border investments based on PEREP_Analytics data
Reviews the published research on cross-border venture capital and private equity
Sørheim et al. (2006) Nordic countries in 2003-2005; Statistics based on national VC associations (no original data or statistics on cross-border investments; one analysis of cross-border fundraising
Overall the Nordic private equity industry is experiencing a positive trend
Sweden has the largest number of investments, and in particular a significantly higher investment amount than the other countries, which can mainly be attributed to buyout funds
Notes the importance of cross-border flows in future analysis
Unquote (2006) Nordic countries; Unquote statistics and interviews
Nordic VC market has transformed within a few years from national markets to a more integrated pan-Nordic market
Foreign (e.g. U.S.) venture funds play an important role in early stage and expansion deals. More than 20% of the equity providers in Nordic early-stage and expansion deals were non-Nordic funds.
Studies analyzing cross-border VC with Nordic countries included in the sample
Bottazzi et al. (2008) Survey of 1431 deals from 124 VC firms in 17 European countries
With better legal protection (legal system with common law origin instead of civil law origin as in Scandinavia), investors give more non-contractible

26
(unique survey data, but no published statistics on cross-border investments)
support and demand more downside protection Investor’s legal system is more important than that of
the portfolio company in determining investor behavior
The quality of the investor’s home country legal system plays a critical role in the development of a well-functioning VC market. Adoption of a US-style VC model should become more effective when accompanied by a broader effort to improve the quality of the investor’s legal system
Cumming and Johan (2007) Data from Dutch institutional investors on their domestic and cross-border private equity allocations
Lack of regulatory harmonization has hindered participation in private equity funds
Cumming et al. (2010) Econometric analysis of data from Center of Private Equity Research (CEPRES), Germany 3848 portfolio firms in 39 countries from North and South America, Europe and Asia spanning 1971-2003.
Better laws facilitate faster deal screening and deal origination, a higher probability of syndication and a lower probability of potentially harmful co-investment, and facilitate investor board representation of the investor and the use of securities that do not require periodic cash flows prior to exit.
Scandinavian legal origin was negatively associated with all these aspects suggesting opportunities for improvement in the legal framework for VC
Deloitte (2007) A global survey of general partners of venture capital firms
Cross-border investments were seen as growing with 63 of the VC firms of European respondents already having invested abroad
Groh et al. (2008) A global survey of limited partners in VC/PE funds
Concerning the criteria for international asset allocation, the most important were the protection of property rights, followed by the need to find local quality General Partners, and the quality of management and skills of local entrepreneurs. Furthermore, the expected deal flow plays an important role in the allocation process, while investors fear bribery and corruption. Public funding and subsidies do not play a role at all in the international allocation process. The IPO activity and the size of local public equity markets were not found very important
Meuleman and Wright (2011) Center for Management Buy-out Research (CMBOR) data on buyouts
In cross-border investments, the target market context influences investment behavior including syndication
Schertler & Tykvova (2010) Zephyr data on VC investments in Europe and North America
High expected economic growth and high stock market returns induce cross-border venture capital inflows
Tukkinen and Maula (2009) PEREP:Analytics data on fundraising in Europe 2007-2008
Distance decreases and economic growth and development increases cross-border fundraising.
Studies with policy implications for Nordic cross-border VC
Andersson and Napier (2007) Nordic countries with a particular attention on Denmark and Sweden. Statistics and interviews (no original new cross-border statistics)
National structures and tax and legal environments for venture capital should be developed in the Nordic countries to benefit from globalization and cross-border flows of capital
European Commission (2006)
Expert views supported by statistics
Identifies the importance of cross border flows in Europe
Identifies obstacles for cross-border flows and
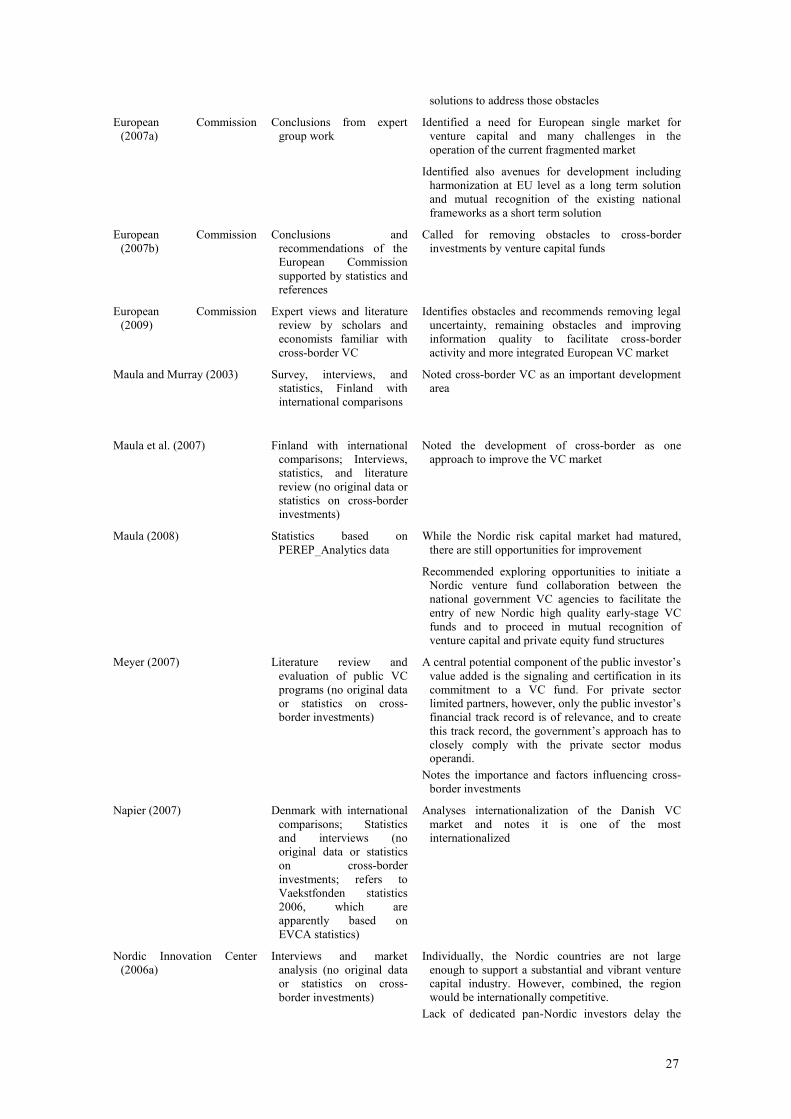
27
solutions to address those obstacles
European Commission (2007a)
Conclusions from expert group work
Identified a need for European single market for venture capital and many challenges in the operation of the current fragmented market
Identified also avenues for development including harmonization at EU level as a long term solution and mutual recognition of the existing national frameworks as a short term solution
European Commission (2007b)
Conclusions and recommendations of the European Commission supported by statistics and references
Called for removing obstacles to cross-border investments by venture capital funds
European Commission (2009)
Expert views and literature review by scholars and economists familiar with cross-border VC
Identifies obstacles and recommends removing legal uncertainty, remaining obstacles and improving information quality to facilitate cross-border activity and more integrated European VC market
Maula and Murray (2003) Survey, interviews, and statistics, Finland with international comparisons
Noted cross-border VC as an important development area
Maula et al. (2007)
Finland with international comparisons; Interviews, statistics, and literature review (no original data or statistics on cross-border investments)
Noted the development of cross-border as one approach to improve the VC market
Maula (2008) Statistics based on PEREP_Analytics data
While the Nordic risk capital market had matured, there are still opportunities for improvement
Recommended exploring opportunities to initiate a Nordic venture fund collaboration between the national government VC agencies to facilitate the entry of new Nordic high quality early-stage VC funds and to proceed in mutual recognition of venture capital and private equity fund structures
Meyer (2007) Literature review and evaluation of public VC programs (no original data or statistics on cross-border investments)
A central potential component of the public investor’s value added is the signaling and certification in its commitment to a VC fund. For private sector limited partners, however, only the public investor’s financial track record is of relevance, and to create this track record, the government’s approach has to closely comply with the private sector modus operandi.
Notes the importance and factors influencing cross-border investments
Napier (2007) Denmark with international comparisons; Statistics and interviews (no original data or statistics on cross-border investments; refers to Vaekstfonden statistics 2006, which are apparently based on EVCA statistics)
Analyses internationalization of the Danish VC market and notes it is one of the most internationalized
Nordic Innovation Center (2006a)
Interviews and market analysis (no original data or statistics on cross-border investments)
Individually, the Nordic countries are not large enough to support a substantial and vibrant venture capital industry. However, combined, the region would be internationally competitive.
Lack of dedicated pan-Nordic investors delay the

28
integration of the Nordic venture capital market A pan-Nordic fund of funds was recommended to
speed up the development
Nordic Innovation Center (2007)
Expert analysis of tax and legal framework for VC in each of the countries (no original data or statistics on cross-border investments)
Most Nordic countries do not have fund structures that could would be competitive in attracting foreign investments because of tax treatment and lack of trust
Denmark had few obstacles for cross-border fundraising, but other Nordic countries had more of them
Finland had made some improvements since 2006, but other Nordic countries had not made improvements
Nordic Innovation Center (2010)
Work group conclusions, expert views, and statistics
Calls for continued Nordic collaboration to facilitate the development of the Nordic VC market and cross-border activity
Rainio (2009) Expert views and statistics Recognizes the importance of cross-border VC
United Nations Economic Commission for Europe (2007)
International comparison of VC policy initiatives; Literature review (no original data or statistics on cross-border investments)
Notes the importance of cross-border investments
29
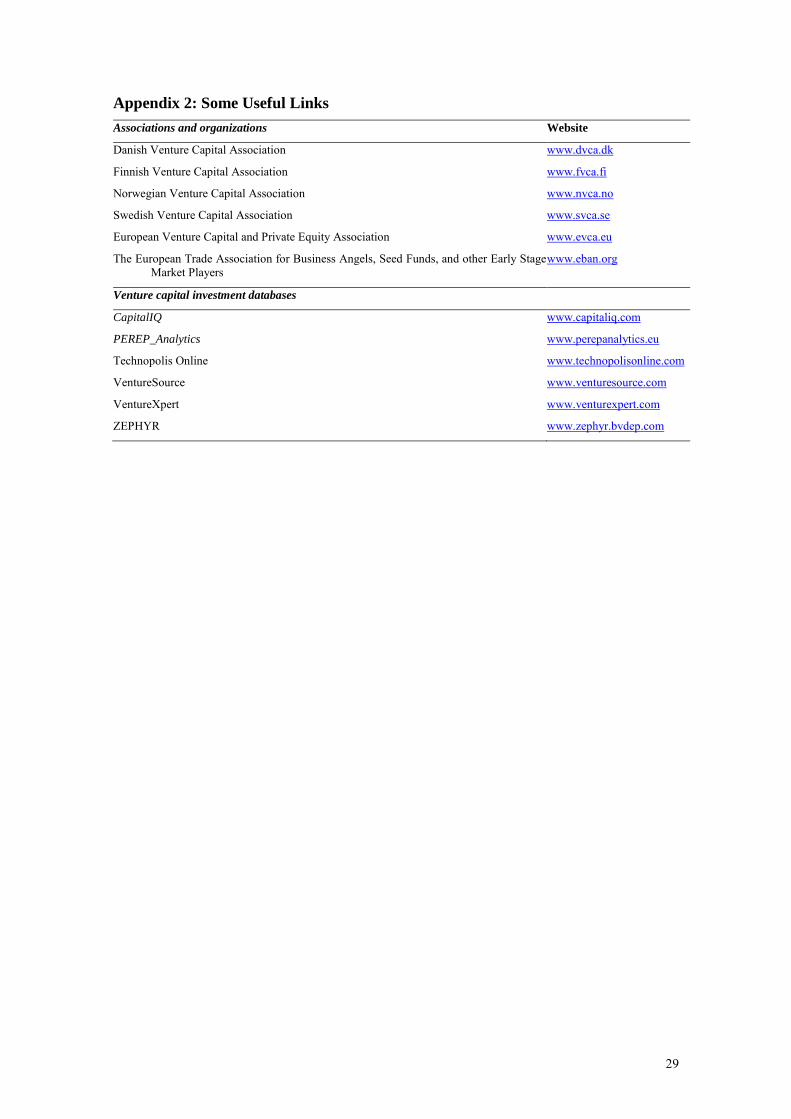
Appendix 2: Some Useful Links
Associations and organizations Website
Danish Venture Capital Association www.dvca.dk
Finnish Venture Capital Association www.fvca.fi
Norwegian Venture Capital Association www.nvca.no
Swedish Venture Capital Association www.svca.se
European Venture Capital and Private Equity Association www.evca.eu
The European Trade Association for Business Angels, Seed Funds, and other Early Stage Market Players
www.eban.org
Venture capital investment databases
CapitalIQ www.capitaliq.com
PEREP_Analytics www.perepanalytics.eu
Technopolis Online www.technopolisonline.com
VentureSource www.venturesource.com
VentureXpert www.venturexpert.com
ZEPHYR www.zephyr.bvdep.com

30
Appendix 3: Biographical Information of Professor Markku Maula
Dr. Markku V. J. Maula is tenured Professor of Venture Capital at Institute of Strategy, Aalto University, Finland. Professor Maula’s research focuses on value creation related issues in business strategy and corporate finance with a particular focus on venture capital and private equity, corporate venturing, technology-based new firms, mergers and acquisitions, and innovation policy. He has received several international awards (e.g. the Heizer doctoral dissertation award from the Academy of Management, Entrepreneurship Division) and has published actively in leading scientific journals in his field including Strategic Management Journal, Journal of Business Venturing, Entrepreneurship Theory & Practice, Strategic Entrepreneurship Journal, and Research Policy. Professor Maula is also a member of several boards and committees as well as an editorial board member in several top journals in his field. In addition to his research and teaching roles, he has acted as an advisor to firms and government agencies in issues related to venture capital, corporate venturing, and innovation policy in several countries. Additional information available at: http://www.tkk.fi/u/mmaula/

Nordic Innovation Centre
Nordic Innovation Centre (NICe) is an institution under the Nordic Council of Ministers facilitating sustainable growth in the Nordic economies.
Our mission is to stimulate innovation, remove barriersand build relations through Nordic cooperation. We encourage innovation in all sectors, build transnational relationships, and contribute to a borderless Nordic business region.
We work with private and public stakeholders to create and coordinate initiatives which help Nordic businesses become more innovative and competitive.
Nordic Innovation Centre is located in Oslo, but has projects and partners in all the Nordic countries.
For more information: www.nordicinnovation.net
Nordic Innovation CentreStensberggata 25NO-0170 OsloNorway
Phone: +47-47 61 44 00Fax: +47-22 56 55 65


