Minnesota Department of Transportation
July 2012
Southeast Minnesota Regional Freight Study

Southeast Minnesota Regional Freight Study
i
TABLE OF CONTENTS EXECUTIVE SUMMARY ......................................................................................................................................... 1
Regional Economic and Freight Profiles
Table of Contents ..................................................................................................................................................... i
List of Exhibits ........................................................................................................................................................ iii
Introduction and Background ................................................................................................................................ 7
Demographic and Economic Trends .................................................................................................................... 8
Population ........................................................................................................................................................... 8
Employment and Economic Growth ................................................................................................................... 10
Industry Concentrations in the Southeastern Region ....................................................................................... 12
Freight Flow Overview ........................................................................................................................................... 13
Directional Flows ................................................................................................................................................ 13
Tonnage versus Value by County ..................................................................................................................... 14
Key Originating Commodities .......................................................................................................................... 16
Key Terminating Commodities ............................................................................................................................ 18
County-Level Commodity Profiles ....................................................................................................................... 19
Dodge County .................................................................................................................................................... 20
Fillmore County ................................................................................................................................................. 21
Freeborn County ................................................................................................................................................ 22
Goodhue County ................................................................................................................................................ 23
Houston County ................................................................................................................................................. 24
Mower County .................................................................................................................................................... 25
Olmsted County ................................................................................................................................................. 26
Rice County ........................................................................................................................................................ 27
Steele County ..................................................................................................................................................... 28
Wabasha County ................................................................................................................................................29
Winona County .................................................................................................................................................. 30
Trends and Issues
Table of Contents ..................................................................................................................................................... i
List of Exhibits .......................................................................................................................................................... 2
Trends and Issues Affecting Freight Transportation in Southeastern Minnesota ............................................ 3
Introduction and Background ............................................................................................................................ 3
Changing Demographics: Older, More Concentrated Populations ................................................................4
Structural Changes to the U.S. Economy ......................................................................................................... 6
Southeast Minnesota Regional Freight Study
ii
The New American Energy Revolution ............................................................................................................18
Changing Trade Patterns and the Panama Canal Expansion ........................................................................ 25
District 6 Special Reports .................................................................................................................................. 31
Frac Sand .......................................................................................................................................................... 31
River Crossings................................................................................................................................................. 31
Southeast Minnesota Regional Freight Study
iii
LIST OF EXHIBITS Exhibit 1: Population Distribution in the Southeastern Minnesota Region by County ................................... 8 Exhibit 2: Southeastern Minnesota Population, 2009 and Projected 2030 ....................................................... 9 Exhibit 3: Population Growth by Age Group in the Southeast Region............................................................. 10 Exhibit 4: Total Employment by Select Industry Sector, District 6 (EDR 10) ................................................... 11 Exhibit 5: Private Sector Employment in the Southeast Region, 2000 and 2010 (with percent change) ...... 12 Exhibit 6: Concentrated Industries in Southeastern Minnesota based on Employment Location Quotient .................................................................................................................................................................................. 13 Exhibit 7: Southeastern Minnesota Directional Flows by Tonnage .................................................................. 14 Exhibit 8: Southeastern Minnesota Direction Freight Flows by Value ............................................................ 14 Exhibit 9: Outbound Commodities by Tonnage and Value in the Southeastern Counties ........................... 15 Exhibit 10: Inbound Commodities by Tonnage and Value in the Southeastern Counties ............................. 16 Exhibit 11: Top Outbound Commodity Groups by Weight in Southeastern Minnesota, 2007 ...................... 16 Exhibit 12: Top Outbound Commodity Groups by Value in the Southeastern Region, 2007 ........................ 17 Exhibit 13: Top Inbound Commodities by Weight in the Southeastern Region, 2007 ................................... 18 Exhibit 14: Top Inbound Commodity Groups by Value in the Southeastern Region, 2007 ........................... 19 Exhibit 15: Population Trends by Age in Minnesota and the Southeast Region ............................................... 5

Southeast Minnesota Regional Freight Study
1
EXECUTIVE SUMMARY
Overview of the Region and its Freight Transportation;
Southeast Minnesota, in particular the area serviced by MnDOT District 6, consists of 11 counties roughly bounded by I-35 on the west, Iowa on the south, the Mississippi River on the east, and the Metro region on the north. Outside of the Twin Cities Metro, it is the second most populous region and the second highest concentration of manufacturing after Central Minnesota. It is the second largest supplier of agricultural products, after Southwest Minnesota, reflecting its long history as an area based on extensive and highly productive farming. Led by Rochester, the second largest urban center in the state, the region is the fastest growing economic area in Minnesota and a key supplier of cutting edge medical technology and services.
It is an important observation of the study that while this part of the state reflects the steady shift away from a manufacturing to a service economy; both sectors contribute significantly to the wealth of this region, along with its agricultural production. The region boasts seven secondary regional trade centers, more than any other economic area of the state, in turn signifying a robust, diverse, and well distributed industrial base that supports a healthy local economy, with good income levels and high employment. In all, the region originates and terminates roughly 14 million tons of goods with a market value exceeding $11 billion, 13% of the commodities attributed to Minnesota enterprise.
The region is well served by the freight transportation network. Interstates and state trunk highways supply heavy-duty and high-capacity routes for commercial trucking. These include I-35 between the Metro and Iowa, I-90 east and west through Albert Lea to La Crosse, Wisconsin, Interregional corridors along Hwy 61 along the river, Hwy 52 from the Metro to Rochester, and Hwy 14 across the area from Winona through Owatonna, and regional connectors including Hwy 63 into Iowa. Extensive rail service is provided by two Class 1 railroads, Canadian Pacific and Union Pacific, and a short line, Progressive Rail. Water transport is served by two public port authorities in Red Wing and Winona, and complimented by the Port of La Crosse. Commercial aviation is available through scheduled service at Rochester, supplemented by other air cargo services at MSP in the Twin Cities and at the La Crosse regional airport.
The region is unique in several ways. Food processing, consisting of everything from meat packing to cereal production and every form of processed and pre-prepared food product, is a key activity in virtually every major city in the area. The Mississippi River shaped the settlement and agricultural market conditions for this region, and continues to be a major economic link for bulk products to a full range of domestic and international markets. Five major highway river crossings along the Mississippi are critical links to Wisconsin, carrying enough commercial and commuter traffic to and from that neighboring state to create a highly inter-dependent economic zone.
Unlike Central Minnesota, whose trade is tightly linked to the Twin Cities, Southeast Minnesota exhibits an unusually high profile in exporting goods to both the U.S and internationally, led by Rochester and including a wide range of other producers and manufacturers across the region. The private sector has excelled in innovative products and processes that include medical technology, genetic products, glass and construction materials, industrial fasteners, fabricated metal and transportation products, and processed foods. The innovation extends to the energy field, from being a major source of wind-powered electrical generation, to a gradual ramping up of alternative fuels production such as ethanol. Cost-
Southeast Minnesota Regional Freight Study
2
effective transportation shares in this attribute as well, with a large number of local third-party logistics (3PL) firms specializing in one-stop expert transportation services, answering the full range of shipping needs for farm and food producers as well as many manufacturers, giving them seamless access across multiple modes and borders to virtually any market in the world.
Findings:
Highway Conditions;
• Road surface and smoothness of ride; A consistent theme shared particularly among equipment fabricators during the interviews and open houses was a concern for pavement condition. While some goods, such as large scale plate glass and machinery sub-systems, were reported to be relatively unaffected by rough pavement, the final assemblies, including wind turbine parts, industrial HVAC units, and electronic assemblies were prone to expensive damage in transit from road-related impacts, stresses, and vibration. Shippers generally rated the current conditions of roads to be good, but had concerns about a possible future decline in highway maintenance on roads at all levels. Most were aware of funding issues and trends.
• Access management and connections to the system; Commercial trucking has steadily grown in the volume of traffic and the size of vehicles. Shippers noted that truck routes and local connections to businesses were adequate for today’s needs, and appreciated cooperation from MnDOT and local jurisdictions in designing new accesses and working with business. Concerns were shared about recognizing the size of semi-tractor-trailer rigs now in common use, often with a total rig length of 70 feet or more, and a total wheelbase of up to 67 feet (WB67), and designing safety features and turn geometry recognizing WB65 or WB67.
• Innovative intersection design; MnDOT has been responding to two issues, the high cost and the safety of improving traditional road intersections at grade, with innovative design, including roundabouts and J-turns. Both innovations are recognized for a significant improvement for safety and reductions in accident severity, under proper conditions. The trucking community has been generally very receptive of these innovations, with the caveat that design should be monitored and given public review in order to easily handle long, heavy commercial vehicles safely, and that crossing traffic consisting of heavy trucks (on the minor route) not be compromised by these installations if significant new truck volumes appear, in turn discouraging use of some routes by large volume commercial shippers and impacting trade levels.
River Crossings;
• Industry in and near the Mississippi River Valley shared a common concern that good access to Wisconsin should be maintained and improved as a priority for MnDOT and WisDOT. Much of the awareness of this issue in the business community springs from the I-35 bridge collapse, MnDOT’s accelerated bridge inspection and replacement program, and in particular the 10-day shutdown of the Winona Bridge in 2011 for preventive maintenance. The shutdown highlighted the fact that almost a fourth of Winona’s labor force commute from Wisconsin, and the concentrated manufacturing and transportation business in Winona faced reduced transportation options, significant cost increases for detours, and reduction in business levels. The local consensus was that these impacts over a long term would be unsustainable, and
Southeast Minnesota Regional Freight Study
3
permanently damage the local economy and lifestyle. Other river communities consistently echoed the concern. The concerns have resulted in MnDOT’s upgrade of inspections and traffic monitoring on these bridges, especially Winona with Weigh-In-Motion devices and monitor cameras.
Ports and Waterways Access;
• South East Minnesota has direct access to two of the five river ports in the state, Red Wing and Winona, with Winona handling significant tonnage inbound and outbound, well over a thousand barge loads in 2012. The region also has easy access to another major port in La Crosse, WI. Water-borne freight has always been a major benefit and competitive advantage for Minnesota, and still accounts for 6% of the state’s tonnage being moved, notably higher than the national average of 4% of total freight tonnage. Both Minnesota ports have good commercial access via State Trunk Highways, local arterials, and Class 1 railroads. After reductions in traffic in the 2003-2008 period, driven in part by grain diversion to ethanol plants in southwestern Minnesota, the facilities have seen gradual increases in growth over recent years. This has been spurred in large part by increased farm production driven by high prices, especially increased acreage brought under cultivation in Wisconsin. A condition exists with the Upper Mississippi lock and dam system that threatens ongoing cost-effective river transportation that has been instrumental to the health of the region’s farm and bulk materials industries. This network of navigation aids maintains a nine-foot deep navigation channel on the river and is the responsibility of the U.S. Army Corps of Engineers. Although authorized for needed lock and dam expansion to maintain the economies of barge traffic, federal funding has been unavailable to implement the expansion projects.
• Port facilities in the two ports, as well as Minnesota’s other public port facilities, collect regular freight tariffs on goods handled across their docks. These are sufficient to pay for operating costs, but do not provide the revenue necessary for major capital improvements. These include items such as replacement dock walls, warehouses, and dock-side dredging. As needs arise, the ports have benefitted from periodic state grants, administered by MnDOT’s Port Development Assistance Program, for facility upgrades and modernization. Port Authorities, port tenants (terminal operators), and shippers have all identified a need for a more formalized state assistance program, with an ongoing funding source, project solicitation guidelines, and removal of some restrictions such as one-time-only funding for local dredging.
Railroad Intermodal Access;
• Rail intermodal traffic, including containers-on -flatcars (COFC) and trailers-on-flatcars (TOFC), represent the fastest growing sector of rail traffic, in particular COFC traffic utilizing double-stacked containers in articulated ‘well cars’ for both international containers and domestic containers, usually moving in dedicated, high-priority trains. The domestic container trade continued its year-to-year growth even during the worst period of the recent recession. Intermodal traffic has the multiple advantages of saving fuel, taking trucks off of highways, and maintaining fast, reliable shipment schedules with little loss or damage. Minnesota has two major intermodal container terminals, both in the Twin Cities, sitting astride the Chicago-to-Pacific Northwest corridor. Many businesses in the region, in particular food processing and wholesale distribution, utilize containerized transport, often coordinated through a 3PL, but have to truck the container cargo to Chicago or Kansas City to access supplies or markets coming
Southeast Minnesota Regional Freight Study
4
through the Ports of Long Beach/Los Angeles, the largest in North America, or the East Coast ports. This presents a real cost and service barrier to many shippers.
• Several intermodal terminal proposals have been identified in the region to address this issue. Class 1 railroads normally site terminals after determining a market potential of 50,000-100,000 lifts (container or trailer moves on or off of a train car) to justify their investment. Alternately, existing trackside road access and a dedicated large customer may justify a smaller operation with minimal investment needed, similar to Canadian National’s small yard operation in Chippewa falls, WI. A private intermodal terminal in Winona has been built on a similar business model, but continues to face challenges of attracting major customers and having only limited support from the servicing railroad. Other proposals by business development agencies in logical ‘crossroads’ areas such as Albert Lea face the same challenges, as well as competitive terminal development interests nearby in Iowa and Minnesota.
Oversize/Overweight Permitted Truck Transport;
• South East Minnesota terminates an unusually large number of over-size/over-weight (OS/OW) truck loads that require special permits for routes and curfews, and often require special services including escorts and heavy equipment such as cranes to accomplish their moves. This includes virtually all moves needed for wind turbine installations, a large and growing electrical energy producer centered in this area and the far southwest of the state. Single shipments can exceed 40 tons per piece, or stretch to 180 feet in length for a single component of the turbines, including generator nacelles, blades, and masts. The south east region also offers routing by default for many loads that may not qualify for shipment across Iowa, for instance, or are detouring through Wisconsin to bypass the Twin Cities’ restricted clearances and congestion. A major national OS/OW carrier is headquartered in the region, and a similarly large OS/OW carrier from St. Cloud also has a high presence in the area. With the aid of these carriers, MnDOT’s Office of Freight and Commercial Vehicle Operations (OFCVO) permit section and planning embarked on an extended project to identify currently preferred routes and their specific characteristics. The resulting map illustrates routes that should not be degraded during local or state-initiated highway projects, and is a resource to help support the OS/OW permit process on both repetitive and new moves. In the case of District 6 and some other local areas, it also points out discontinuities in the current preferred routes, specific physical barriers, and the potential for incremental route improvement during upgrades or reconstruction projects.
New and emerging commodity trends;
• Increase in containerized traffic through the Panama Canal, via the Mississippi River; With the expansion of the Panama Canal to be completed no later than 2014, many projections of new routes for international container shipping have been conjectured. One of the major impacts is a potential for Pacific Rim trade to increase through Gulf Coast ports instead of California, in particular through the Port of New Orleans. Containers for import or export may be trans-loaded between vessels in New Orleans and river barges, then moving throughout the Mississippi and Ohio River systems in the Midwest. This may open new potential barge traffic in Winona and Red Wing as well as the Twin Cities. Given the complexity of possible multi-modal routings through various ports and onto competing railroads and highways, and the volatile nature of transportation pricing, it remains difficult to accurately model how much if any, this major development will impact Minnesota, the southeast region, and the ports.
Southeast Minnesota Regional Freight Study
5
• Agricultural production gains; The southeast region has enjoyed a steady increase in agricultural production from year to year, and produces a third of all Minnesota produce as well as being the state leader in dairy production. This is due largely to improved crop genetics and farm management practices, and is further bolstered by price-driven farming expansion in western Wisconsin that finds a ready outlet through Minnesota. Although a few ethanol plants have been constructed recently in the southeast, the majority of product still goes for food production, animal feed, and export, unlike the southwest Minnesota region. While much of the product is trucked to other areas in processed form, or shipped by truck to plants, rail elevators, and ports outside the region, the river remains the single largest outlet for bulk movements in this area. This emphasizes the combined importance of the ports and bridges to the region, in combination with the rail and trunk highway system for the balance of the area for this key industry.
• Silica sand for hydraulic fracturing of oil and gas fields; South East Minnesota has historically been a major producer of high-quality sand from several different geologic formations for over a century, supplying high-purity silica sand for foundries, glass making, construction, and even electronics. Several million tons a year have been produced from both surface and underground mines. Beginning in 2000, new technologies of horizontal drilling and advanced hydraulic fracturing opened up vast new reserves of oil and gas in deep deposits of heretofore impervious and unproductive shale beds in several areas of the U.S., including Pennsylvania, Texas, Oklahoma, and the Bakken fields in North Dakota. Pure silica sand in Wisconsin and Minnesota proved to have ideal properties to prop open the fractured shale in these deep wells, including consistent size, roundness, and hardness, able to withstand over 12,000 PSI of pressure (previous sands sourced from Arizona and Texas were able to withstand 4,000 PSI in comparison). Sand with these unique properties is now dubbed ‘frac sand’, referring to its use in hydraulic fracturing. Beginning in 2010, the acceleration in shale drilling outstripped the frac sand supply, driving up prices, and created a boom in Wisconsin and Minnesota sand production that extended until the summer of 2012. Sand production in Wisconsin grew from 5 million tons to about 33 million tons annually in 2012, while Minnesota grew but remained with only a fifth of Wisconsin’s active mines and processing plants. Sand began to flow into Winona from Wisconsin to load into rail cars at the Port’s public terminal, supplementing sand being produced from two Winona mines, and originating from 1-3 100-car unit trains per week for destinations around the country. Wabasha is also planning on trans-loading Wisconsin and local sand to rail starting in 2013. The traffic levels of loaded sand trucks across the river bridges, while of local concern by opponents of frac sand and the petroleum industry, consist of legal weight, tarped loads that still represent only a minor fraction of total heavy commercial truck volumes across these bridges. The trunk highway system is designed to carry these loads, but local, light-duty roads have been seriously impacted by high wear levels on the designated routes. MnDOT has supported efforts by local county engineers and officials to negotiate road use maintenance agreements (RUMA’s) with the sand companies to defray their extraordinary costs, based on examples of best practices researched by Winona County and CFIRE, and used in Wisconsin and Ohio. Silica dust has been another point of contention in transporting sand with opponents and environmentalists, with the potential in heavy exposures to cause silicosis and lung cancer. Current industry and state-mandated practices, along with local conditional-use-permit conditions, are adequate to contain
Southeast Minnesota Regional Freight Study
6
all primary and fugitive dust production within all federally-defined particulate contamination levels.
Resulting Actions:
• Road Conditions; OFCVO and District 6 are actively engaging in public outreach, information sharing, and design review with internal agency and local road and intersection project designers.
• Ports and Waterways Access; MnDOT along with the Port Authorities may support a revised Ports Assistance Program, based on policy directions developed in the state’s first Ports and Waterways Plan to be finished by June 30, 2013, and integrated into the State Transportation Plan. The Plan initiative was begun as a result of input provided in large part during the research phase of the freight study.
• Railroad Intermodal Access; OFCVO and the District have been and will continue to work with client agencies such as the Albert Lea Development Agency, private shippers and transporters, developers, and the railroads to determine the business potential of several different terminal business models that may result in establishing rail intermodal service from South East Minnesota to a southern California gateway, and other domestic markets.
• Over-Size/Over-Weight Transport; OFCVO Permit Group, District planners and engineers, and several OS/OW carriers have cooperated in a preferred route mapping exercise, to institutionalize some of the operational knowledge in this subject area and to inform others in and beyond MnDOT who are effected by OS/OW considerations. The map will be posted as information to the MnDOT website in conjunction with this study.
• Emerging Commodity Trends; MnDOT will continue to actively monitor developments in the containerized traffic corridors as the Panama Canal improvements come on stream, in order to respond to new distribution patterns that may emerge. The District and OFCVO will also remain in close touch with the agriculture sector and shipping associations to evaluate the ongoing trends in produce markets and modal selections of the shippers, locally, nationally, and internationally. The transportation of bulk frac sand from mine to processing plant to oil field will continue to be an area of intensive concentration. MnDOT has established formal working associations with Wisconsin and North Dakota to stay abreast of the issues and best practices, and is participating in an interagency task force to evaluate state policy options. MnDOT and the District will provide all possible assistance to local jurisdictions, review mine and plant permits, and aid in traffic and road use studies as requested and appropriate. In OFCVO’s role in providing industry interface with freight shippers, trucking firms, ports, and the railroads, the agency will continue to facilitate discussions and disseminate factual information.
Southeast Minnesota Regional Freight Study
7
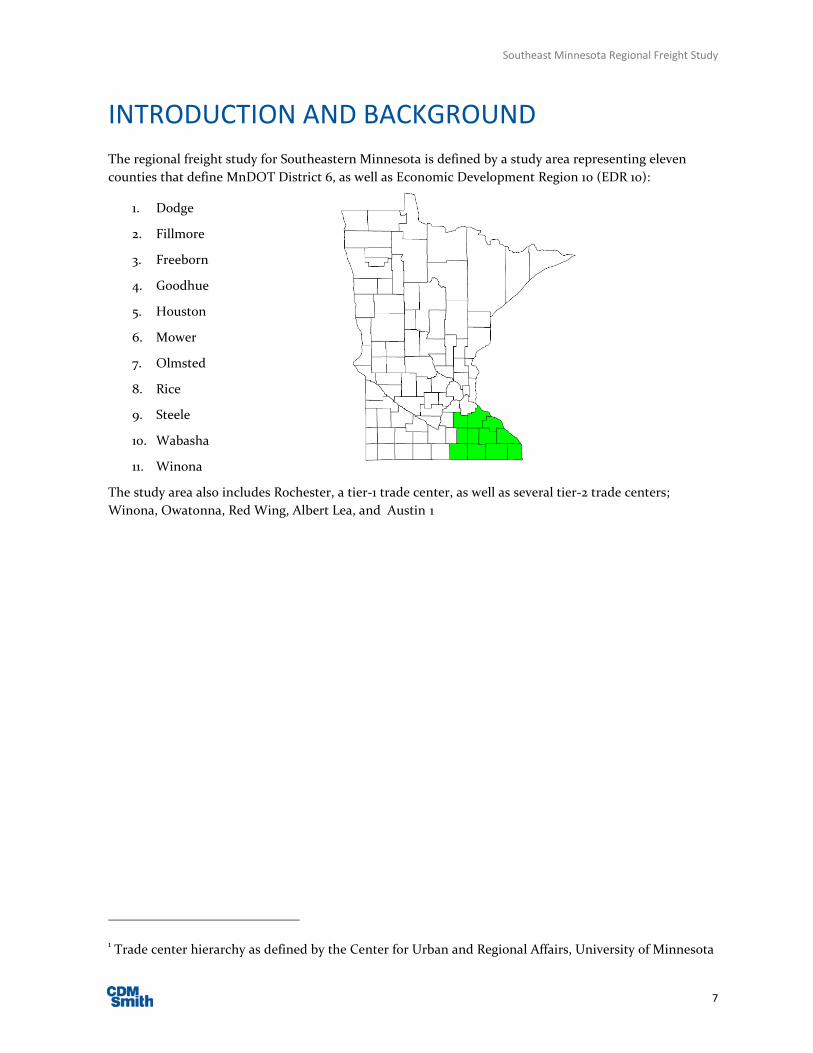
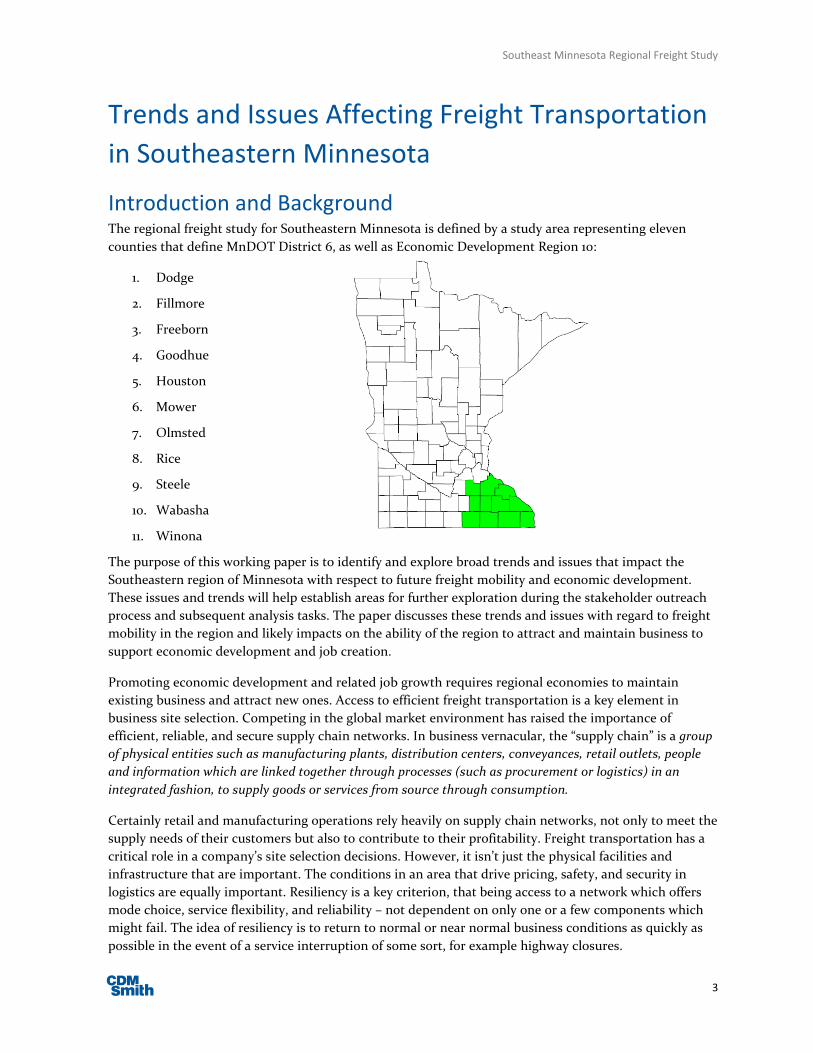
INTRODUCTION AND BACKGROUND The regional freight study for Southeastern Minnesota is defined by a study area representing eleven counties that define MnDOT District 6, as well as Economic Development Region 10 (EDR 10):
1. Dodge
2. Fillmore
3. Freeborn
4. Goodhue
5. Houston
6. Mower
7. Olmsted
8. Rice
9. Steele
10. Wabasha
11. Winona
The study area also includes Rochester, a tier-1 trade center, as well as several tier-2 trade centers; Winona, Owatonna, Red Wing, Albert Lea, and Austin 1
1 Trade center hierarchy as defined by the Center for Urban and Regional Affairs, University of Minnesota
Southeast Minnesota Regional Freight Study
8
DEMOGRAPHIC AND ECONOMIC TRENDS One of the first steps to understanding the importance of freight to Southeastern Minnesota’s regional economy is to understand population and employment growth and the associated impact on economic activities. The national economy in the U.S. has been transitioning for decades; migrating from a resource extraction and durable manufacturing-based economy to a more service-based and high-technology economy today. As a result, Southeastern Minnesota industries in the future may experience growth rates that differ from historical patterns of the past. Therefore, it is important to determine the industries that will remain an integral part of Southeastern Minnesota’s economy going forward. This section summarizes and interprets available demographic and economic data for that purpose and provides a high-level description of the study area’s economy.
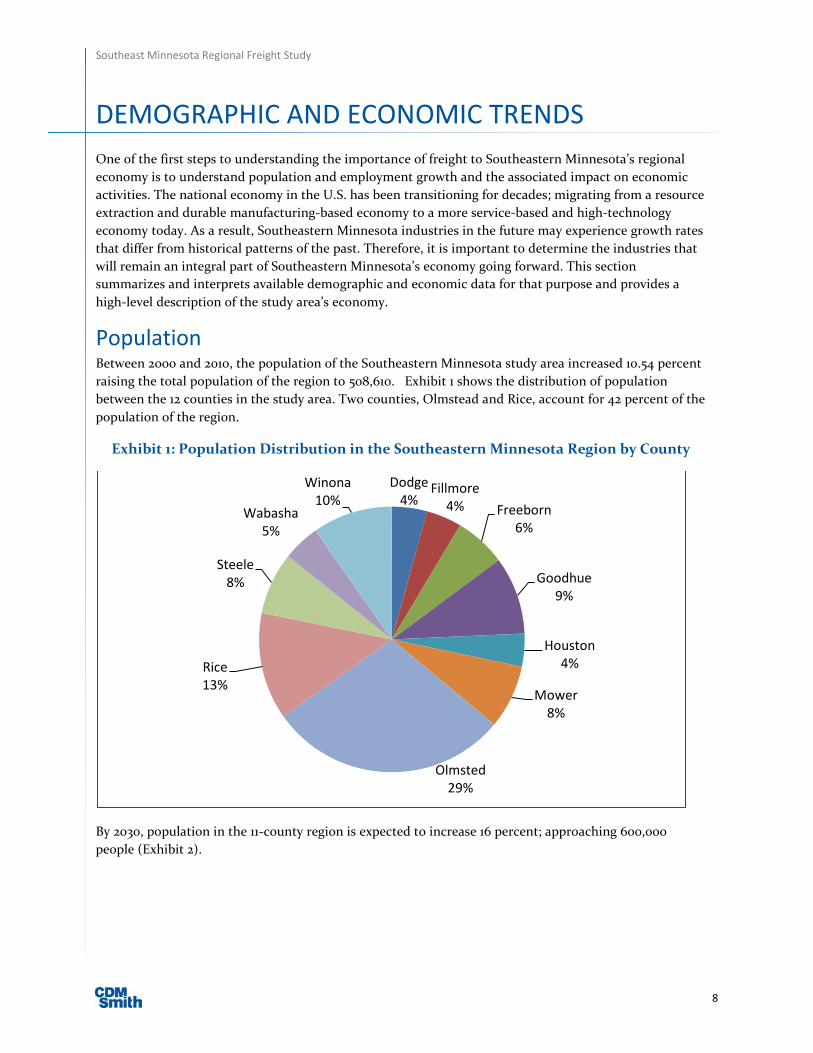
Population Between 2000 and 2010, the population of the Southeastern Minnesota study area increased 10.54 percent raising the total population of the region to 508,610. Exhibit 1 shows the distribution of population between the 12 counties in the study area. Two counties, Olmstead and Rice, account for 42 percent of the population of the region.
Exhibit 1: Population Distribution in the Southeastern Minnesota Region by County
By 2030, population in the 11-county region is expected to increase 16 percent; approaching 600,000 people (Exhibit 2).
Dodge 4%
Fillmore 4% Freeborn
6%
Goodhue 9%
Houston 4%
Mower 8%
Olmsted 29%
Rice 13%
Steele 8%
Wabasha 5%
Winona 10%
Southeast Minnesota Regional Freight Study
9
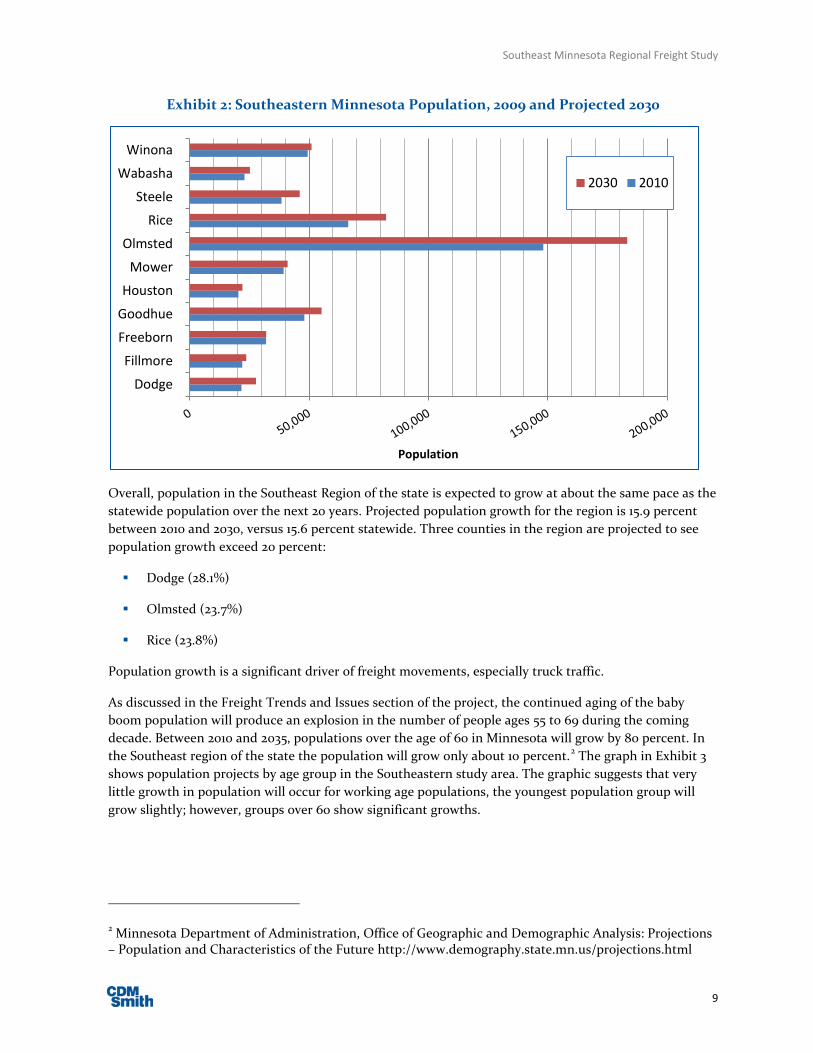
Exhibit 2: Southeastern Minnesota Population, 2009 and Projected 2030
Overall, population in the Southeast Region of the state is expected to grow at about the same pace as the statewide population over the next 20 years. Projected population growth for the region is 15.9 percent between 2010 and 2030, versus 15.6 percent statewide. Three counties in the region are projected to see population growth exceed 20 percent:
Dodge (28.1%)
Olmsted (23.7%)
Rice (23.8%)
Population growth is a significant driver of freight movements, especially truck traffic.
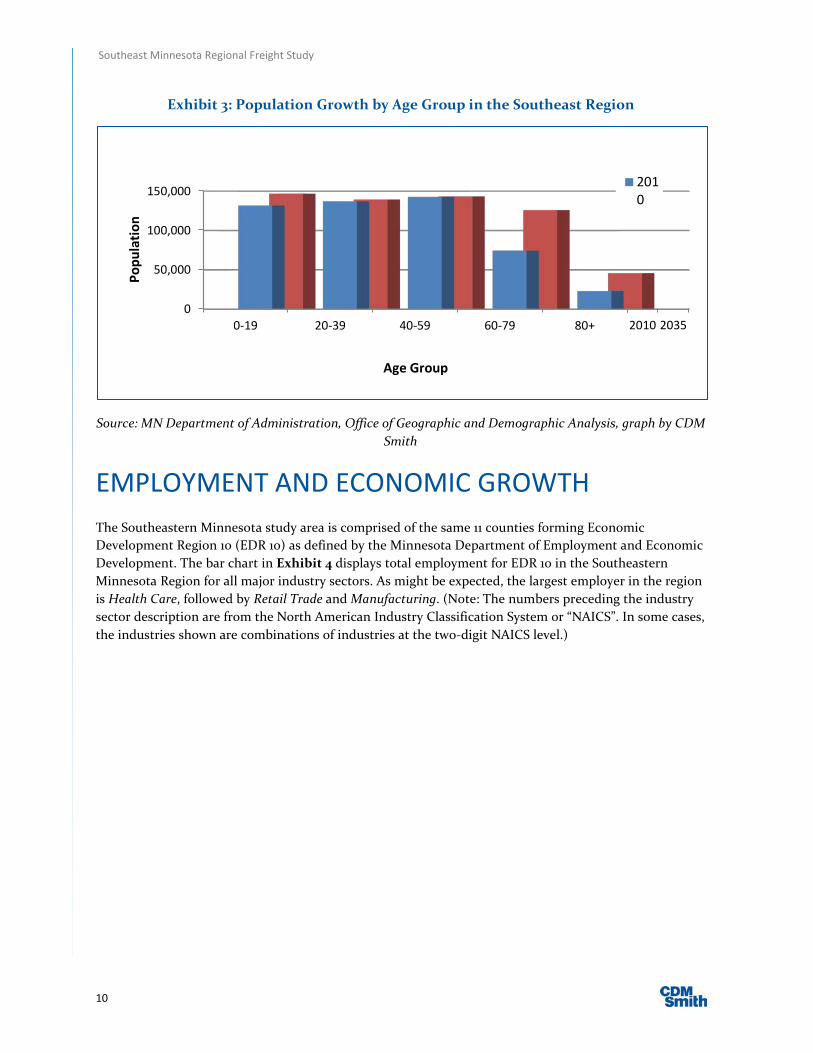
As discussed in the Freight Trends and Issues section of the project, the continued aging of the baby boom population will produce an explosion in the number of people ages 55 to 69 during the coming decade. Between 2010 and 2035, populations over the age of 60 in Minnesota will grow by 80 percent. In the Southeast region of the state the population will grow only about 10 percent.2 The graph in Exhibit 3 shows population projects by age group in the Southeastern study area. The graphic suggests that very little growth in population will occur for working age populations, the youngest population group will grow slightly; however, groups over 60 show significant growths.
2 Minnesota Department of Administration, Office of Geographic and Demographic Analysis: Projections – Population and Characteristics of the Future http://www.demography.state.mn.us/projections.html
Dodge
Fillmore
Freeborn
Goodhue
Houston
Mower
Olmsted
Rice
Steele
Wabasha
Winona
Population
2030 2010
Southeast Minnesota Regional Freight Study
10
Exhibit 3: Population Growth by Age Group in the Southeast Region
Source: MN Department of Administration, Office of Geographic and Demographic Analysis, graph by CDM Smith
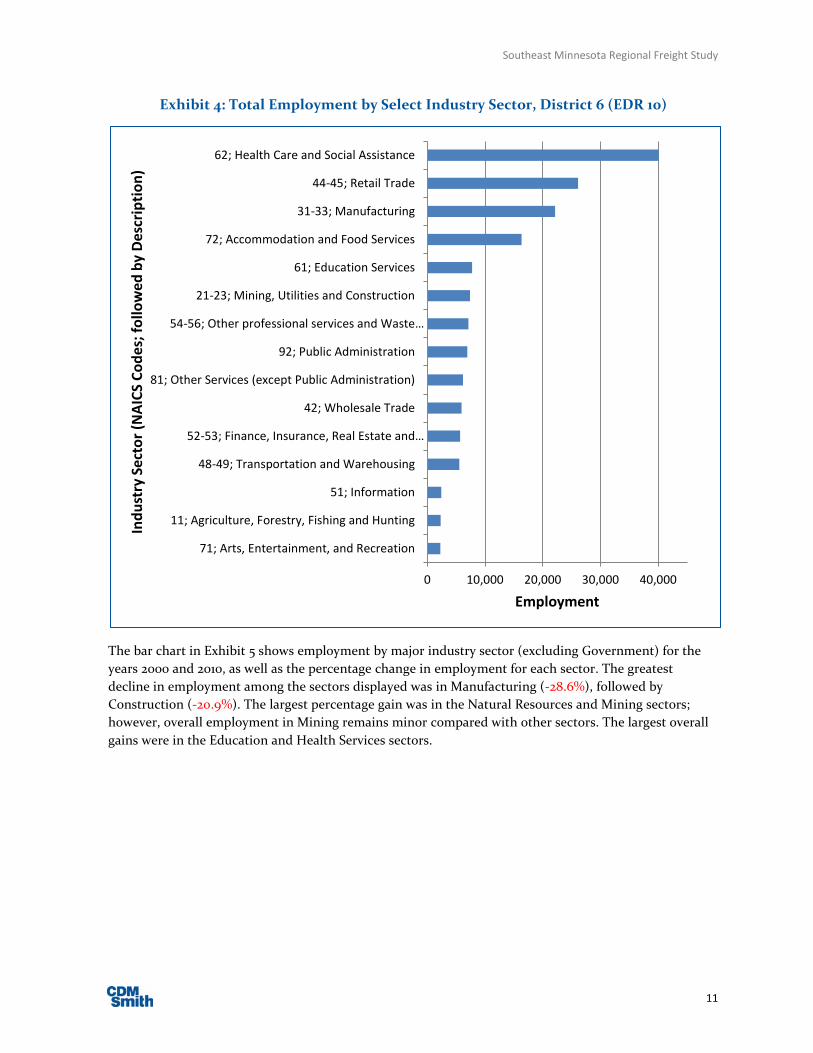
EMPLOYMENT AND ECONOMIC GROWTH The Southeastern Minnesota study area is comprised of the same 11 counties forming Economic Development Region 10 (EDR 10) as defined by the Minnesota Department of Employment and Economic Development. The bar chart in Exhibit 4 displays total employment for EDR 10 in the Southeastern Minnesota Region for all major industry sectors. As might be expected, the largest employer in the region is Health Care, followed by Retail Trade and Manufacturing. (Note: The numbers preceding the industry sector description are from the North American Industry Classification System or “NAICS”. In some cases, the industries shown are combinations of industries at the two-digit NAICS level.)
2010 20350
50,000
100,000
150,000
0-19 20-39 40-59 60-79 80+
Popu
latio
n
Age Group
2010
Southeast Minnesota Regional Freight Study
11
Exhibit 4: Total Employment by Select Industry Sector, District 6 (EDR 10)
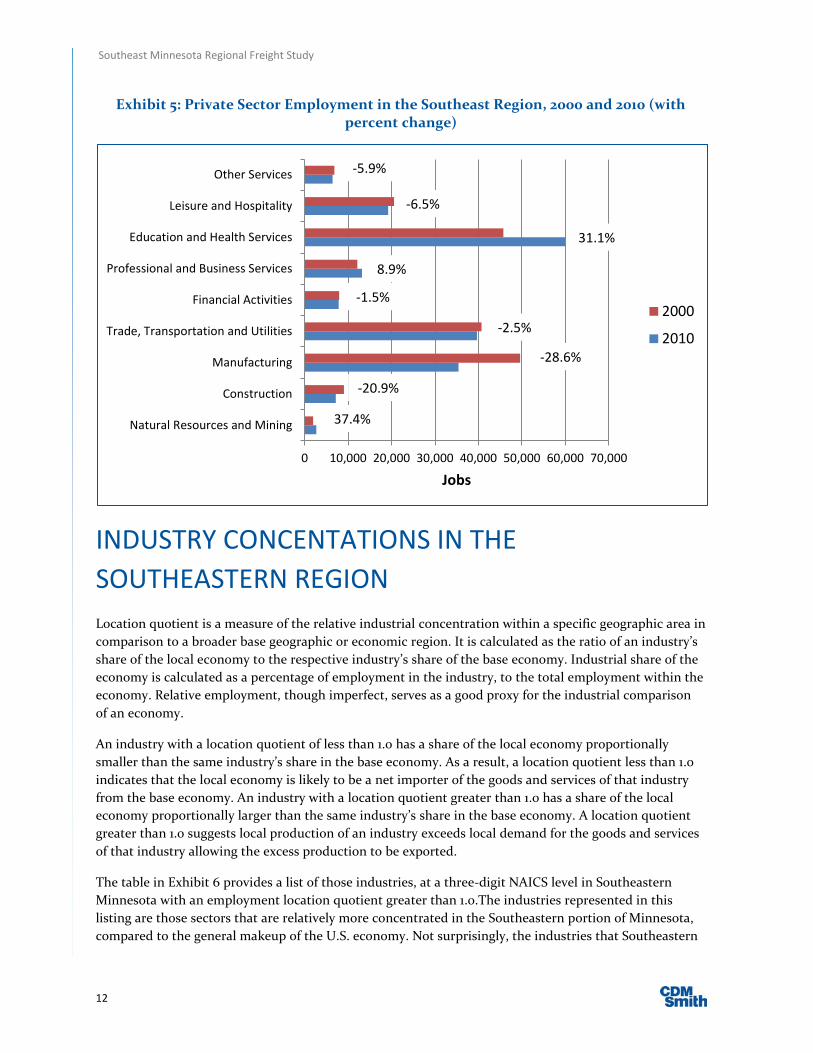
The bar chart in Exhibit 5 shows employment by major industry sector (excluding Government) for the years 2000 and 2010, as well as the percentage change in employment for each sector. The greatest decline in employment among the sectors displayed was in Manufacturing (-28.6%), followed by Construction (-20.9%). The largest percentage gain was in the Natural Resources and Mining sectors; however, overall employment in Mining remains minor compared with other sectors. The largest overall gains were in the Education and Health Services sectors.
0 10,000 20,000 30,000 40,000
71; Arts, Entertainment, and Recreation
11; Agriculture, Forestry, Fishing and Hunting
51; Information
48-49; Transportation and Warehousing
52-53; Finance, Insurance, Real Estate and…
42; Wholesale Trade
81; Other Services (except Public Administration)
92; Public Administration
54-56; Other professional services and Waste…
21-23; Mining, Utilities and Construction
61; Education Services
72; Accommodation and Food Services
31-33; Manufacturing
44-45; Retail Trade
62; Health Care and Social Assistance
Employment
Indu
stry
Sec
tor (
NAI
CS C
odes
; fol
low
ed b
y De
scrip
tion)
Southeast Minnesota Regional Freight Study
12
Exhibit 5: Private Sector Employment in the Southeast Region, 2000 and 2010 (with percent change)
INDUSTRY CONCENTATIONS IN THE SOUTHEASTERN REGION Location quotient is a measure of the relative industrial concentration within a specific geographic area in comparison to a broader base geographic or economic region. It is calculated as the ratio of an industry’s share of the local economy to the respective industry’s share of the base economy. Industrial share of the economy is calculated as a percentage of employment in the industry, to the total employment within the economy. Relative employment, though imperfect, serves as a good proxy for the industrial comparison of an economy.
An industry with a location quotient of less than 1.0 has a share of the local economy proportionally smaller than the same industry’s share in the base economy. As a result, a location quotient less than 1.0 indicates that the local economy is likely to be a net importer of the goods and services of that industry from the base economy. An industry with a location quotient greater than 1.0 has a share of the local economy proportionally larger than the same industry’s share in the base economy. A location quotient greater than 1.0 suggests local production of an industry exceeds local demand for the goods and services of that industry allowing the excess production to be exported.
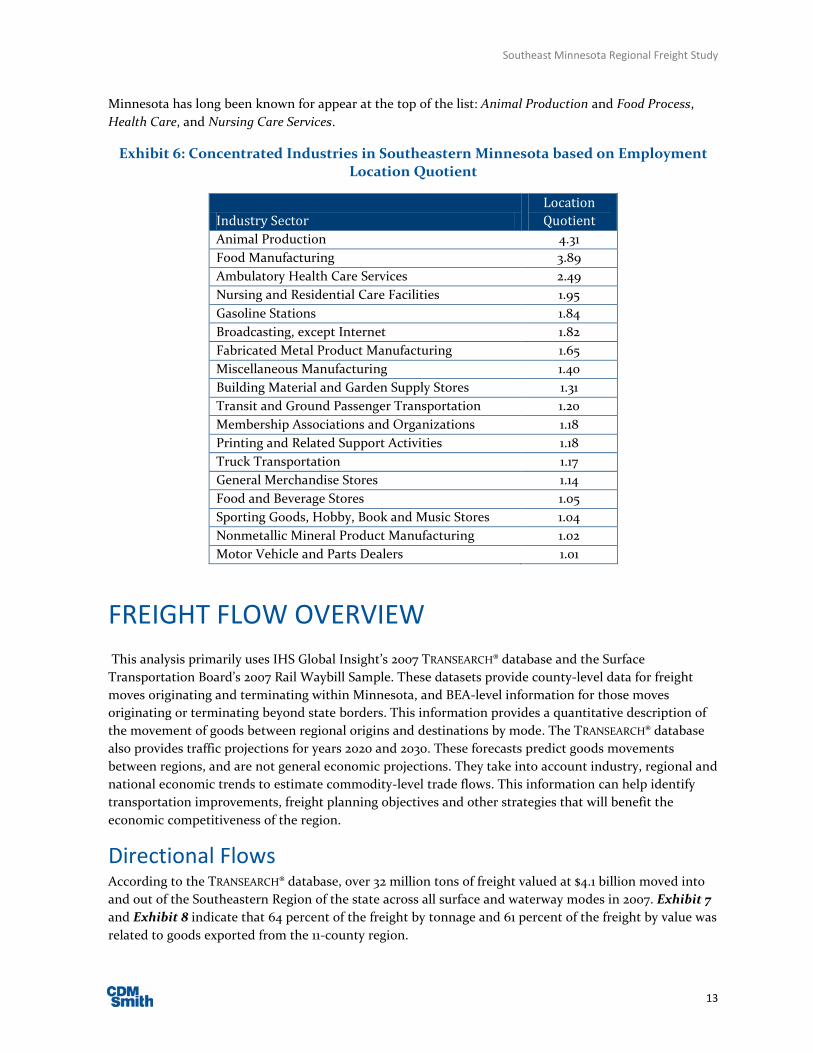
The table in Exhibit 6 provides a list of those industries, at a three-digit NAICS level in Southeastern Minnesota with an employment location quotient greater than 1.0.The industries represented in this listing are those sectors that are relatively more concentrated in the Southeastern portion of Minnesota, compared to the general makeup of the U.S. economy. Not surprisingly, the industries that Southeastern
0 10,000 20,000 30,000 40,000 50,000 60,000 70,000
Natural Resources and Mining
Construction
Manufacturing
Trade, Transportation and Utilities
Financial Activities
Professional and Business Services
Education and Health Services
Leisure and Hospitality
Other Services
Jobs
2000
2010
-5.9%
-6.5%
31.1%
8.9%
-1.5%
-2.5%
-28.6%
-20.9%
37.4%
Southeast Minnesota Regional Freight Study
13
Minnesota has long been known for appear at the top of the list: Animal Production and Food Process, Health Care, and Nursing Care Services.
Exhibit 6: Concentrated Industries in Southeastern Minnesota based on Employment Location Quotient
Industry Sector Location Quotient
Animal Production 4.31 Food Manufacturing 3.89 Ambulatory Health Care Services 2.49 Nursing and Residential Care Facilities 1.95 Gasoline Stations 1.84 Broadcasting, except Internet 1.82 Fabricated Metal Product Manufacturing 1.65 Miscellaneous Manufacturing 1.40 Building Material and Garden Supply Stores 1.31 Transit and Ground Passenger Transportation 1.20 Membership Associations and Organizations 1.18 Printing and Related Support Activities 1.18 Truck Transportation 1.17 General Merchandise Stores 1.14 Food and Beverage Stores 1.05 Sporting Goods, Hobby, Book and Music Stores 1.04 Nonmetallic Mineral Product Manufacturing 1.02 Motor Vehicle and Parts Dealers 1.01
FREIGHT FLOW OVERVIEW This analysis primarily uses IHS Global Insight’s 2007 TRANSEARCH® database and the Surface Transportation Board’s 2007 Rail Waybill Sample. These datasets provide county-level data for freight moves originating and terminating within Minnesota, and BEA-level information for those moves originating or terminating beyond state borders. This information provides a quantitative description of the movement of goods between regional origins and destinations by mode. The TRANSEARCH® database also provides traffic projections for years 2020 and 2030. These forecasts predict goods movements between regions, and are not general economic projections. They take into account industry, regional and national economic trends to estimate commodity-level trade flows. This information can help identify transportation improvements, freight planning objectives and other strategies that will benefit the economic competitiveness of the region.
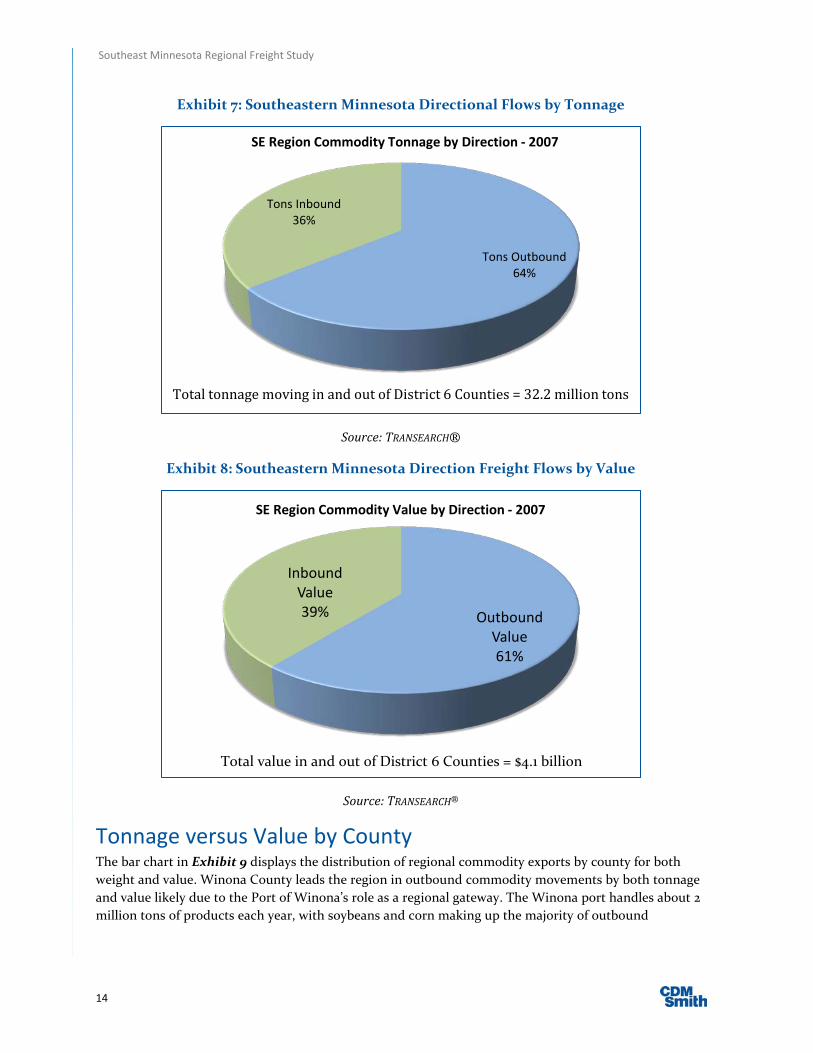
Directional Flows According to the TRANSEARCH® database, over 32 million tons of freight valued at $4.1 billion moved into and out of the Southeastern Region of the state across all surface and waterway modes in 2007. Exhibit 7 and Exhibit 8 indicate that 64 percent of the freight by tonnage and 61 percent of the freight by value was related to goods exported from the 11-county region.
Southeast Minnesota Regional Freight Study
14
Exhibit 7: Southeastern Minnesota Directional Flows by Tonnage
Source: TRANSEARCH®
Exhibit 8: Southeastern Minnesota Direction Freight Flows by Value
Source: TRANSEARCH®
Tonnage versus Value by County The bar chart in Exhibit 9 displays the distribution of regional commodity exports by county for both weight and value. Winona County leads the region in outbound commodity movements by both tonnage and value likely due to the Port of Winona’s role as a regional gateway. The Winona port handles about 2 million tons of products each year, with soybeans and corn making up the majority of outbound
Tons Outbound 64%
Tons Inbound 36%
SE Region Commodity Tonnage by Direction - 2007
Total tonnage moving in and out of District 6 Counties = 32.2 million tons
Outbound Value 61%
Inbound Value 39%
SE Region Commodity Value by Direction - 2007
Total value in and out of District 6 Counties = $4.1 billion

Southeast Minnesota Regional Freight Study
15
products.3 Houston County shows the second highest outbound values by tonnage, but relatively low value goods leaving the county. The La Crescent area of Houston County currently has limestone mining operations and has significant deposits of silica sand that could be mined to support the hydraulic fracturing shade oil and gas extraction process. Steele County, which includes the City of Owatonna, displays the second highest movement of goods export by value.
Exhibit 9: Outbound Commodities by Tonnage and Value in the Southeastern Counties
Source: TRANSEARCH®
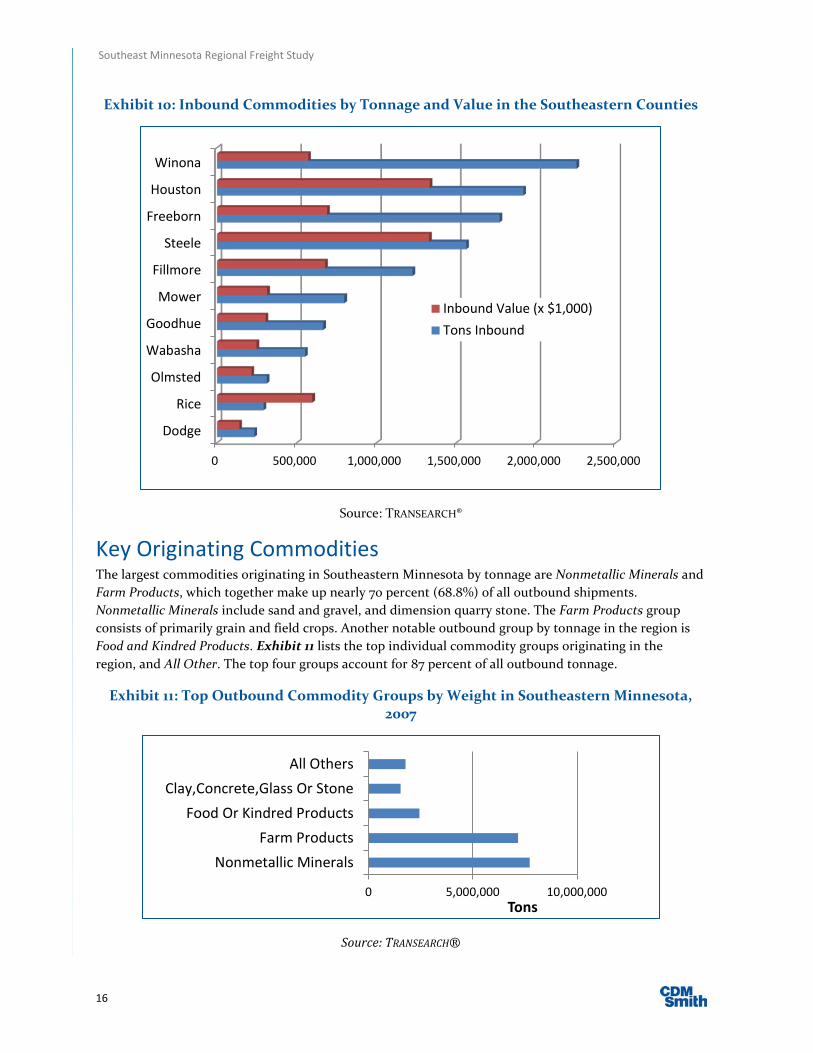
The bar chart in Exhibit 10 displays the distribution of regional commodity imports by county for both weight and value. As with exports, Winona County is also the leading area for inbound commodity movements by tonnage. On the inbound side, the Port of Winona receives fertilizers going to Southern Minnesota farms, as well as coal and road salt used by the City of Winona. Houston and Steele Counties area nearly tied in terms of counties with the highest values of inbound commodities by value.
3 2010 – River Traffic Up This Year, Port Authority of Winona website http://www.portofwinona.com/2010/12/2010-river-traffic-up-this-year/
0 1,000,000 2,000,000 3,000,000 4,000,000 5,000,000
Dodge
Rice
Olmsted
Wabasha
Goodhue
Mower
Fillmore
Steele
Freeborn
Houston
Winona
Outbound Value (x $1,000)
Tons Outbound
Southeast Minnesota Regional Freight Study
16
Exhibit 10: Inbound Commodities by Tonnage and Value in the Southeastern Counties
Source: TRANSEARCH®
Key Originating Commodities The largest commodities originating in Southeastern Minnesota by tonnage are Nonmetallic Minerals and Farm Products, which together make up nearly 70 percent (68.8%) of all outbound shipments. Nonmetallic Minerals include sand and gravel, and dimension quarry stone. The Farm Products group consists of primarily grain and field crops. Another notable outbound group by tonnage in the region is Food and Kindred Products. Exhibit 11 lists the top individual commodity groups originating in the region, and All Other. The top four groups account for 87 percent of all outbound tonnage.
Exhibit 11: Top Outbound Commodity Groups by Weight in Southeastern Minnesota, 2007
Source: TRANSEARCH®
0 500,000 1,000,000 1,500,000 2,000,000 2,500,000
Dodge
Rice
Olmsted
Wabasha
Goodhue
Mower
Fillmore
Steele
Freeborn
Houston
Winona
Inbound Value (x $1,000)Tons Inbound
0 5,000,000 10,000,000
Nonmetallic MineralsFarm Products
Food Or Kindred ProductsClay,Concrete,Glass Or Stone
All Others
Tons
Southeast Minnesota Regional Freight Study
17
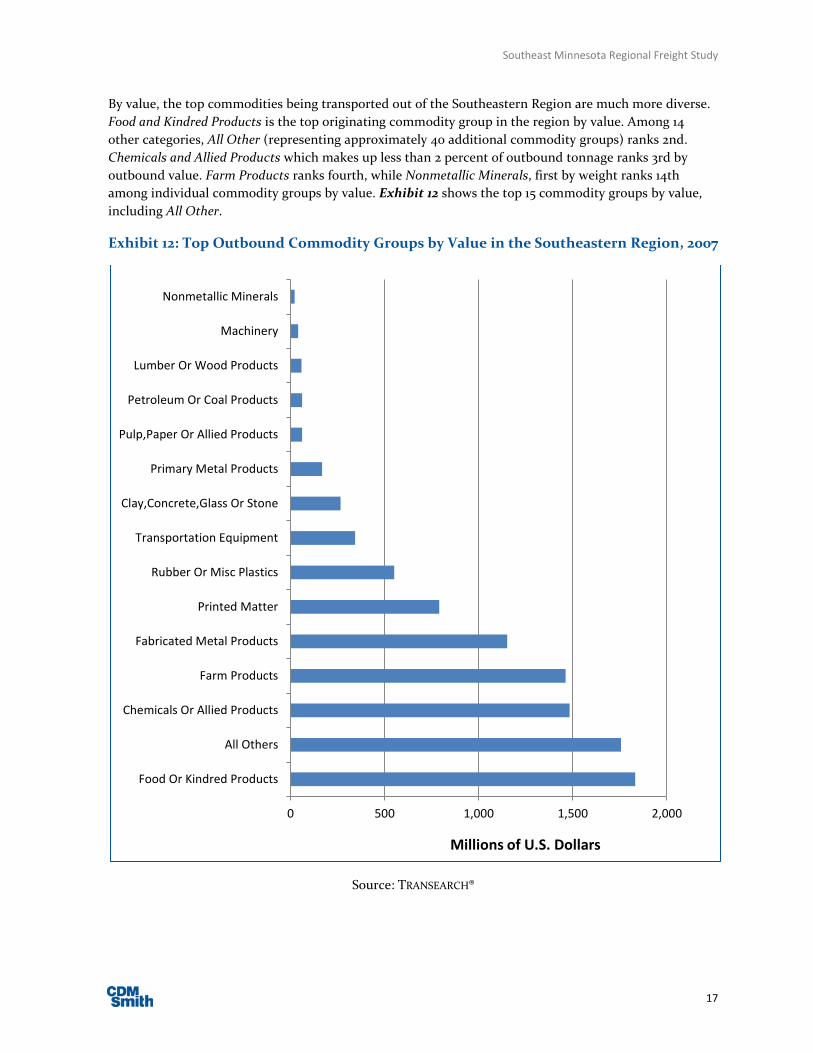
By value, the top commodities being transported out of the Southeastern Region are much more diverse. Food and Kindred Products is the top originating commodity group in the region by value. Among 14 other categories, All Other (representing approximately 40 additional commodity groups) ranks 2nd. Chemicals and Allied Products which makes up less than 2 percent of outbound tonnage ranks 3rd by outbound value. Farm Products ranks fourth, while Nonmetallic Minerals, first by weight ranks 14th among individual commodity groups by value. Exhibit 12 shows the top 15 commodity groups by value, including All Other.
Exhibit 12: Top Outbound Commodity Groups by Value in the Southeastern Region, 2007
Source: TRANSEARCH®
0 500 1,000 1,500 2,000
Food Or Kindred Products
All Others
Chemicals Or Allied Products
Farm Products
Fabricated Metal Products
Printed Matter
Rubber Or Misc Plastics
Transportation Equipment
Clay,Concrete,Glass Or Stone
Primary Metal Products
Pulp,Paper Or Allied Products
Petroleum Or Coal Products
Lumber Or Wood Products
Machinery
Nonmetallic Minerals
Millions of U.S. Dollars

Southeast Minnesota Regional Freight Study
18
KEY TERMINATING COMMODITIES As with originating commodity groups, the largest movements by weight in Southeastern Minnesota are Nonmetallic Minerals and Farm Products; however, the overall volumes are considerably less than outbound volumes. It is possible that some of this tonnage is recounted as terminating values in transload hubs such as the Port of Winona and regional railroad facilities. Unlike originating volumes, outbound commodities by weight exhibit more diversity across products. Exhibit 13 lists the top 8 terminating commodities by tonnage, including All Other.
Exhibit 13: Top Inbound Commodities by Weight in the Southeastern Region, 2007
Source: TRANSEARCH®
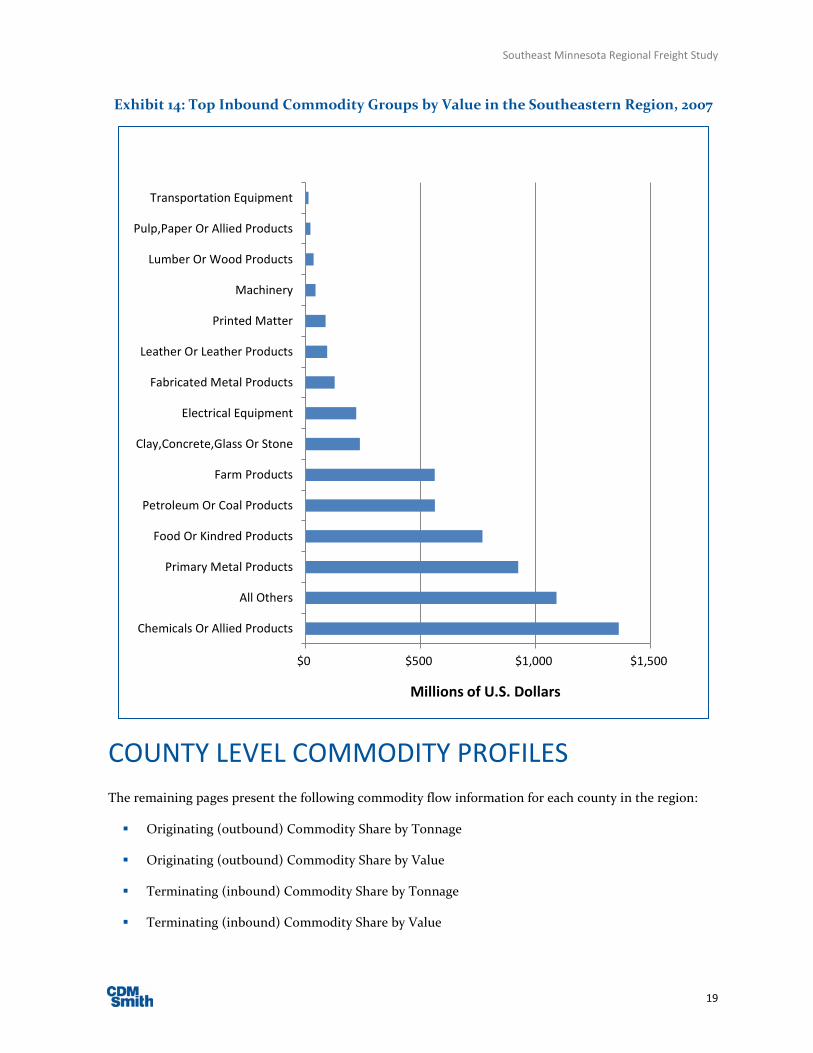
By value, the top commodities being transported into the Southeastern Region are also much more diverse. Chemicals or Allied Products is the largest inbound commodity group in the region by value, likely reflecting chemical and fertilizer inputs to regional agriculture. And, as with outbound commodities by value, All Other representing 40 different commodity groups, ranks 2nd. Primary Metal Products, which accounts for about 15 percent of inbound tonnage, ranks 3rd. Exhibit 14 shows the top 15 commodity groups by value, including All Other.
0 2,500,000 5,000,000
Nonmetallic Minerals
Farm Products
All Others
Food Or Kindred Products
Petroleum Or Coal Products
Chemicals Or Allied Products
Primary Metal Products
Clay,Concrete,Glass Or Stone
Tons
Southeast Minnesota Regional Freight Study
19
Exhibit 14: Top Inbound Commodity Groups by Value in the Southeastern Region, 2007
COUNTY LEVEL COMMODITY PROFILES The remaining pages present the following commodity flow information for each county in the region:
Originating (outbound) Commodity Share by Tonnage
Originating (outbound) Commodity Share by Value
Terminating (inbound) Commodity Share by Tonnage
Terminating (inbound) Commodity Share by Value
$0 $500 $1,000 $1,500
Chemicals Or Allied Products
All Others
Primary Metal Products
Food Or Kindred Products
Petroleum Or Coal Products
Farm Products
Clay,Concrete,Glass Or Stone
Electrical Equipment
Fabricated Metal Products
Leather Or Leather Products
Printed Matter
Machinery
Lumber Or Wood Products
Pulp,Paper Or Allied Products
Transportation Equipment
Millions of U.S. Dollars
Southeast Minnesota Regional Freight Study
20
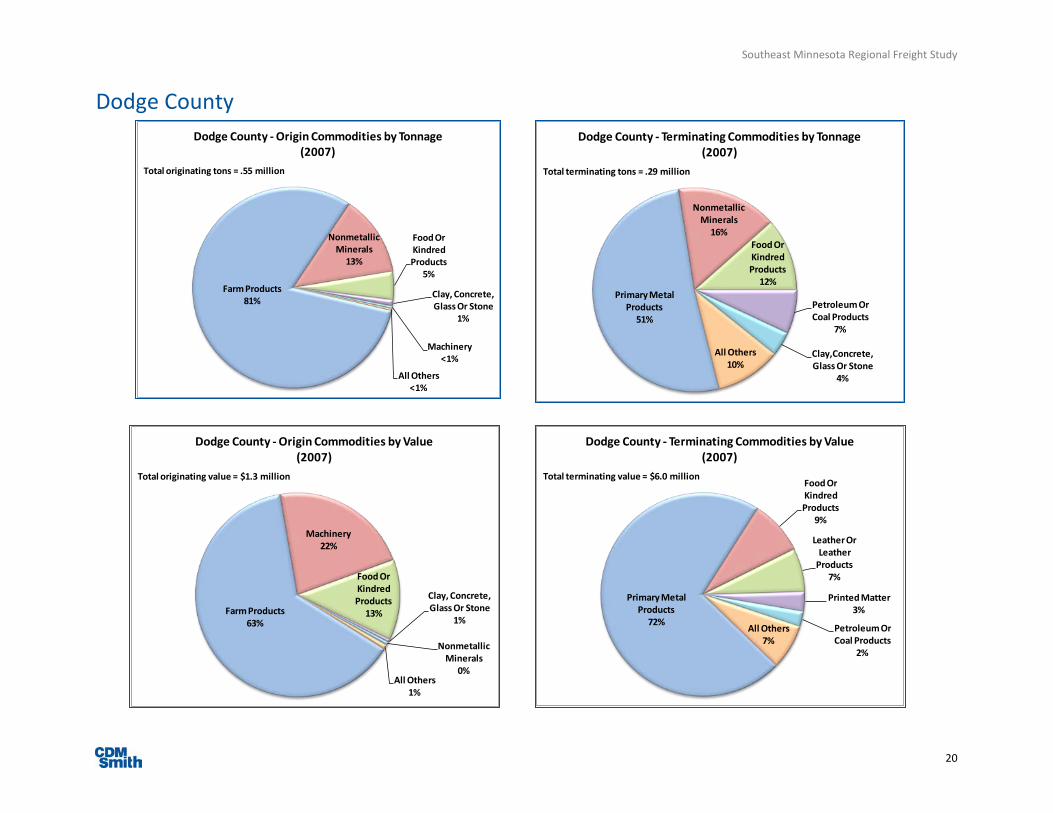
Dodge County
Farm Products81%
Nonmetallic Minerals
13%
Food Or Kindred Products
5%
Clay, Concrete, Glass Or Stone
1%
Machinery<1%
All Others<1%
Dodge County - Origin Commodities by Tonnage (2007)
Total originating tons = .55 million
Primary Metal Products
51%
Nonmetallic Minerals
16%Food Or Kindred Products
12%
Petroleum Or Coal Products
7%
Clay,Concrete, Glass Or Stone
4%
All Others10%
Dodge County - Terminating Commodities by Tonnage (2007)
Total terminating tons = .29 million
Farm Products63%
Machinery22%
Food Or Kindred Products
13%
Clay, Concrete, Glass Or Stone
1%
Nonmetallic Minerals
0%All Others
1%
Dodge County - Origin Commodities by Value (2007)
Total originating value = $1.3 million
Primary Metal Products
72%
Food Or Kindred Products
9%
Leather Or Leather
Products7%
Printed Matter3%
Petroleum Or Coal Products
2%
All Others7%
Dodge County - Terminating Commodities by Value (2007)
Total terminating value = $6.0 million
Southeast Minnesota Regional Freight Study
21
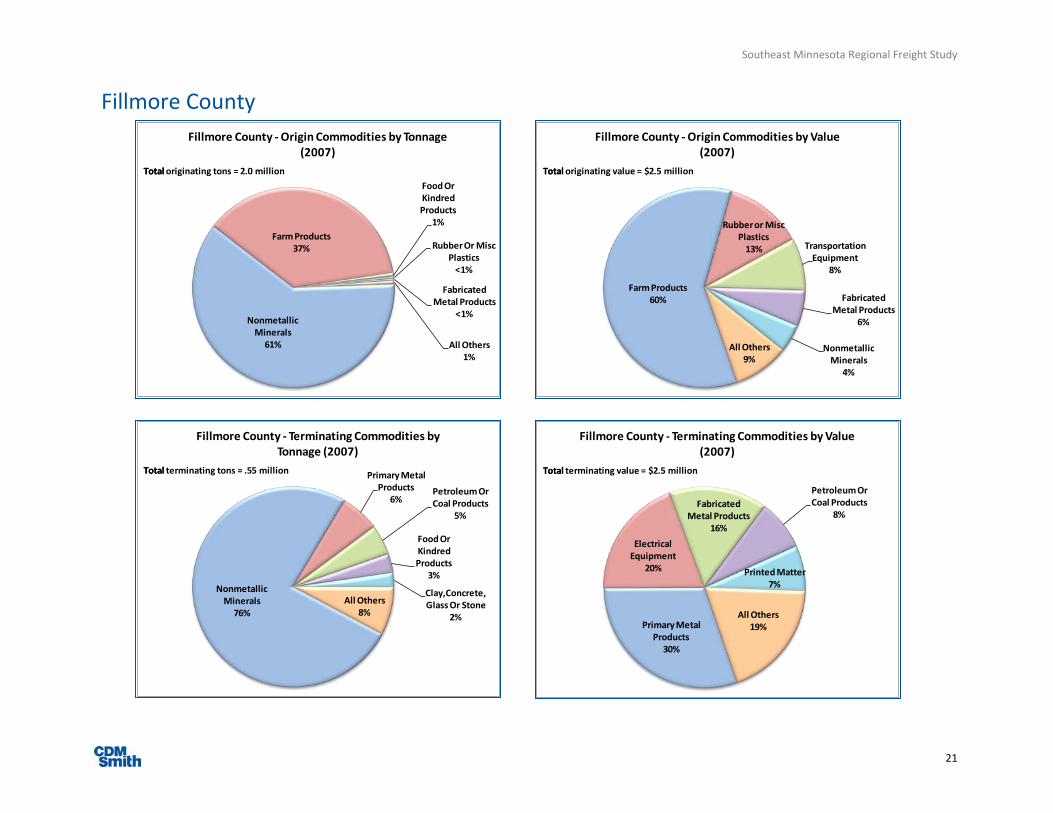
Fillmore County
Nonmetallic Minerals
61%
Farm Products37%
Food Or Kindred Products
1%
Rubber Or Misc Plastics
<1%
Fabricated Metal Products
<1%
All Others1%
Fillmore County - Origin Commodities by Tonnage (2007)
Total originating tons = 2.0 millionTotal
Farm Products60%
Rubber or Misc Plastics
13% Transportation Equipment
8%
Fabricated Metal Products
6%
Nonmetallic Minerals
4%
All Others9%
Fillmore County - Origin Commodities by Value (2007)
Total originating value = $2.5 millionTotal
Nonmetallic Minerals
76%
Primary Metal Products
6%Petroleum Or Coal Products
5%
Food Or Kindred Products
3%
Clay,Concrete, Glass Or Stone
2%
All Others8%
Fillmore County - Terminating Commodities by Tonnage (2007)
Total terminating tons = .55 millionTotal
Primary Metal Products
30%
Electrical Equipment
20%
Fabricated Metal Products
16%
Petroleum Or Coal Products
8%
Printed Matter7%
All Others19%
Fillmore County - Terminating Commodities by Value (2007)
Total terminating value = $2.5 millionTotal

Southeast Minnesota Regional Freight Study
22
Freeborn County
Nonmetallic Minerals
34%
Farm Products34%
Food Or Kindred Products
24%
Chemicals Or Allied Products
4%
Petroleum Or Coal Products
2%
All Others2%
Freeborn County - Origin Commodities by Tonnage (2007)
Total originating tons = 2.9 millionTotal originating tons =
Chemicals Or Allied Products
27%
Food Or Kindred Products
13%Printed Matter
11%
Farm Products10%
Transportation Equipment
9%
All Others30%
Freeborn County - Origin Commodities by Value (2007)
Total originating value = $Total originating value = $1.3 billion
Farm Products67%
Nonmetallic Minerals
18%
Food Or Kindred Products
7%
Petroleum Or Coal Products
3%
Chemicals Or Allied Products
2%
All Others3%
Freeborn County - Terminating Commodities by Tonnage (2007)
Total terminating tons = 2.3 millionTotal
Farm Products25%
Chemicals Or Allied Products
22%
Petroleum Or Coal Products
13%Food Or Kindred Products
10%
Primary Metal Products
9%
All Others21%
Freeborn County - Terminating Commodities by Value (2007)
Total terminating value = $5.7 millionTotal
Southeast Minnesota Regional Freight Study
23
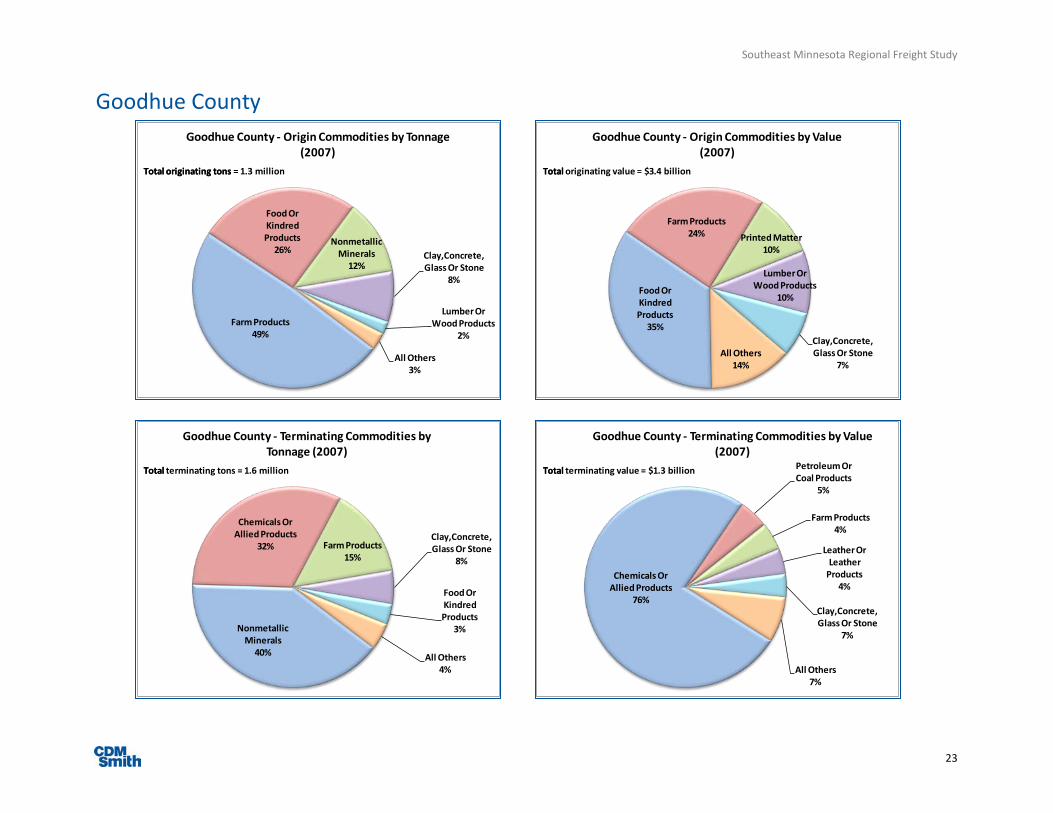
Goodhue County
Farm Products49%
Food Or Kindred Products
26%Nonmetallic
Minerals12%
Clay,Concrete, Glass Or Stone
8%
Lumber Or Wood Products
2%
All Others3%
Goodhue County - Origin Commodities by Tonnage (2007)
Total originating tons = Total originating tons = 1.3 million
Food Or Kindred Products
35%
Farm Products24% Printed Matter
10%
Lumber Or Wood Products
10%
Clay,Concrete, Glass Or Stone
7%All Others
14%
Goodhue County - Origin Commodities by Value (2007)
Total originating value = $3.4 billionTotal
Nonmetallic Minerals
40%
Chemicals Or Allied Products
32% Farm Products15%
Clay,Concrete, Glass Or Stone
8%
Food Or Kindred Products
3%
All Others4%
Goodhue County - Terminating Commodities by Tonnage (2007)
Total terminating tons = 1.6 million Total
Chemicals Or Allied Products
76%
Petroleum Or Coal Products
5%
Farm Products4%
Leather Or Leather
Products4%
Clay,Concrete, Glass Or Stone
7%
All Others7%
Goodhue County - Terminating Commodities by Value (2007)
Total Total terminating value = $1.3 billion
Southeast Minnesota Regional Freight Study
24
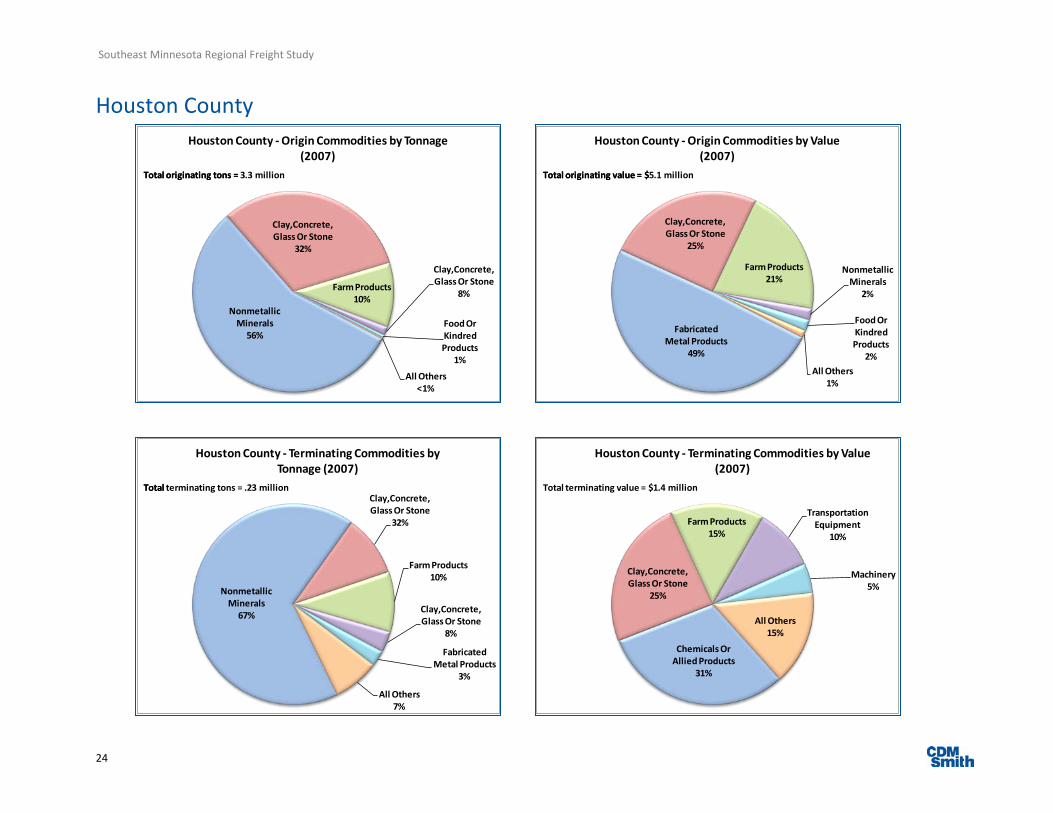
Houston County
Nonmetallic Minerals
56%
Clay,Concrete, Glass Or Stone
32%
Farm Products10%
Clay,Concrete, Glass Or Stone
8%
Food Or Kindred Products
1%
All Others<1%
Houston County - Origin Commodities by Tonnage (2007)
Total originating tons = Total originating tons = 3.3 million
Fabricated Metal Products
49%
Clay,Concrete, Glass Or Stone
25%
Farm Products21%
Nonmetallic Minerals
2%
Food Or Kindred Products
2%All Others
1%
Houston County - Origin Commodities by Value (2007)
Total originating value = $5.1 millionTotal originating value = $
Nonmetallic Minerals
67%
Clay,Concrete, Glass Or Stone
32%
Farm Products10%
Clay,Concrete, Glass Or Stone
8%
Fabricated Metal Products
3%
All Others7%
Houston County - Terminating Commodities by Tonnage (2007)
Total terminating tons = .23 millionTotal
Chemicals Or Allied Products
31%
Clay,Concrete, Glass Or Stone
25%
Farm Products15%
Transportation Equipment
10%
Machinery5%
All Others15%
Houston County - Terminating Commodities by Value (2007)
Total terminating value = $1.4 million
Southeast Minnesota Regional Freight Study
25
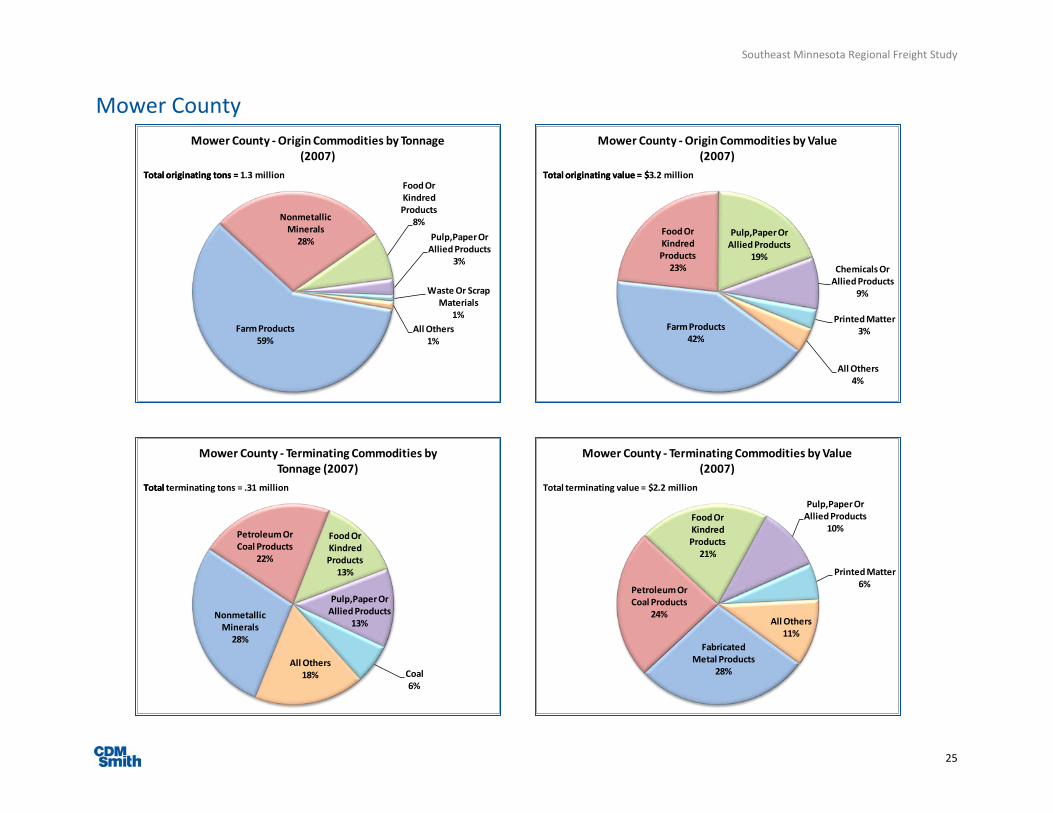
Mower County
Farm Products59%
Nonmetallic Minerals
28%
Food Or Kindred Products
8%Pulp,Paper Or
Allied Products3%
Waste Or Scrap Materials
1%All Others
1%
Mower County - Origin Commodities by Tonnage (2007)
Total originating tons = 1.3 millionTotal originating tons =
Farm Products42%
Food Or Kindred Products
23%
Pulp,Paper Or Allied Products
19%Chemicals Or
Allied Products9%
Printed Matter3%
All Others4%
Mower County - Origin Commodities by Value (2007)
Total originating value = $3.2 millionTotal originating value = $
Nonmetallic Minerals
28%
Petroleum Or Coal Products
22%
Food Or Kindred Products
13%
Pulp,Paper Or Allied Products
13%
Coal6%
All Others18%
Mower County - Terminating Commodities by Tonnage (2007)
Total terminating tons = .31 millionTotal
Fabricated Metal Products
28%
Petroleum Or Coal Products
24%
Food Or Kindred Products
21%
Pulp,Paper Or Allied Products
10%
Printed Matter6%
All Others11%
Mower County - Terminating Commodities by Value (2007)
Total terminating value = $2.2 million
Southeast Minnesota Regional Freight Study
26
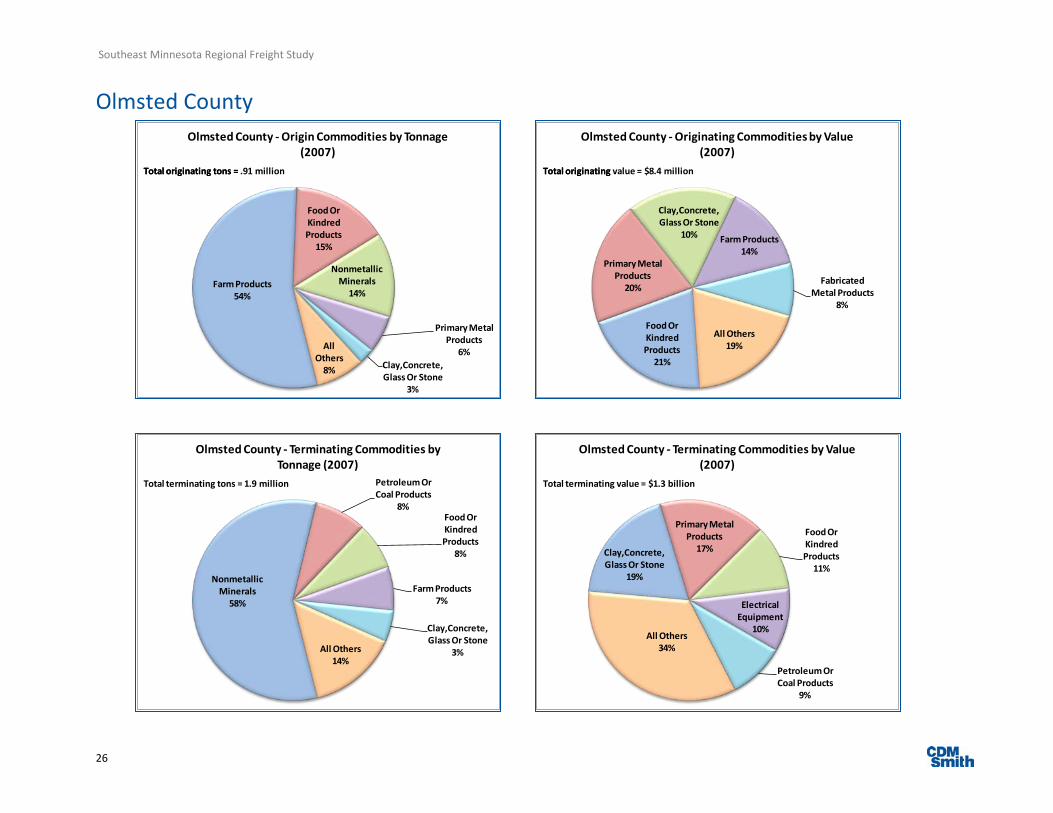
Olmsted County
Farm Products54%
Food Or Kindred Products
15%
Nonmetallic Minerals
14%
Primary Metal Products
6%Clay,Concrete, Glass Or Stone
3%
All Others
8%
Olmsted County - Origin Commodities by Tonnage (2007)
Total originating tons = .91 millionTotal originating tons =
Food Or Kindred Products
21%
Primary Metal Products
20%
Clay,Concrete, Glass Or Stone
10% Farm Products14%
Fabricated Metal Products
8%
All Others19%
Olmsted County - Originating Commodities by Value (2007)
Total originating value = $8.4 millionTotal originating
Nonmetallic Minerals
58%
Petroleum Or Coal Products
8%Food Or Kindred Products
8%
Farm Products7%
Clay,Concrete, Glass Or Stone
3%All Others14%
Olmsted County - Terminating Commodities by Tonnage (2007)
Total terminating tons = 1.9 million
Clay,Concrete, Glass Or Stone
19%
Primary Metal Products
17%
Food Or Kindred Products
11%
Electrical Equipment
10%
Petroleum Or Coal Products
9%
All Others34%
Olmsted County - Terminating Commodities by Value (2007)
Total terminating value = $1.3 billion
Southeast Minnesota Regional Freight Study
27
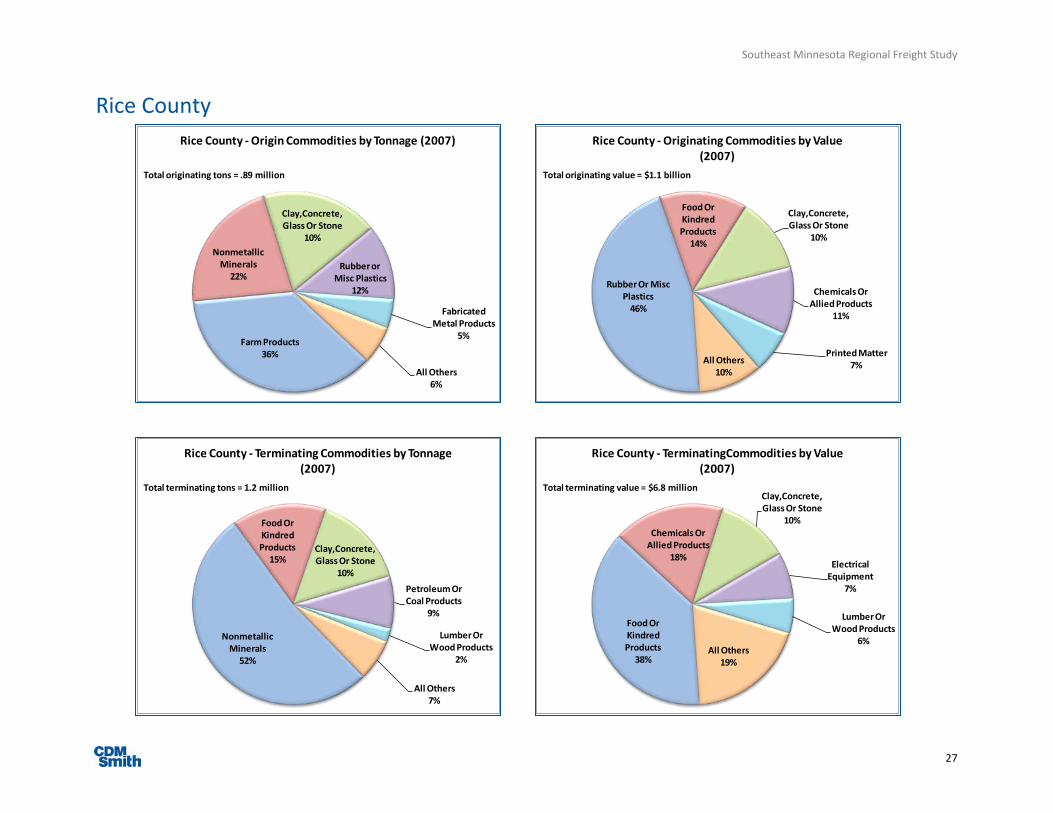
Rice County
Farm Products36%
Nonmetallic Minerals
22%
Clay,Concrete, Glass Or Stone
10%
Rubber orMisc Plastics
12%
Fabricated Metal Products
5%
All Others6%
Rice County - Origin Commodities by Tonnage (2007)
Total originating tons = .89 million
Rubber Or Misc Plastics
46%
Food Or Kindred Products
14%
Clay,Concrete, Glass Or Stone
10%
Chemicals Or Allied Products
11%
Printed Matter7%All Others
10%
Rice County - Originating Commodities by Value (2007)
Total originating value = $1.1 billion
Nonmetallic Minerals
52%
Food Or Kindred Products
15%Clay,Concrete, Glass Or Stone
10%Petroleum Or Coal Products
9%
Lumber Or Wood Products
2%
All Others7%
Rice County - Terminating Commodities by Tonnage (2007)
Total terminating tons = 1.2 million
Food Or Kindred Products
38%
Chemicals Or Allied Products
18%
Clay,Concrete, Glass Or Stone
10%
Electrical Equipment
7%
Lumber Or Wood Products
6%All Others
19%
Rice County - TerminatingCommodities by Value (2007)
Total terminating value = $6.8 million
Southeast Minnesota Regional Freight Study
28
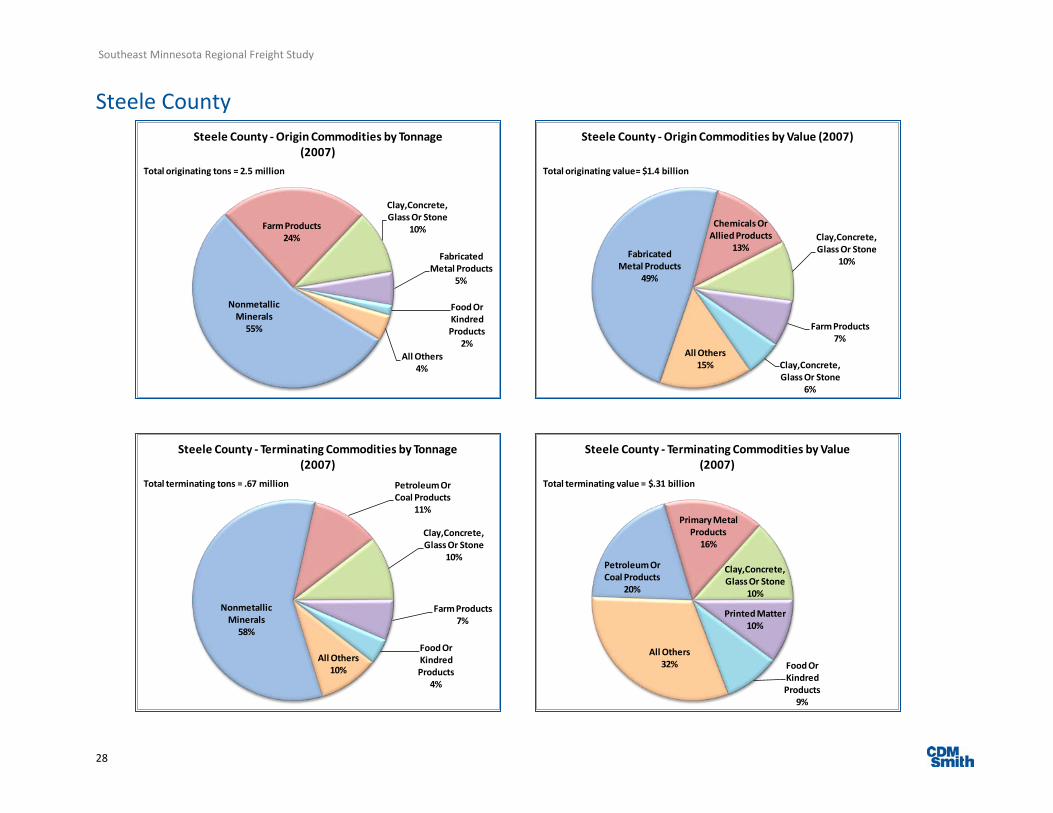
Steele County
Nonmetallic Minerals
55%
Farm Products24%
Clay,Concrete, Glass Or Stone
10%
Fabricated Metal Products
5%
Food Or Kindred Products
2%All Others
4%
Steele County - Origin Commodities by Tonnage (2007)
Total originating tons = 2.5 million
Fabricated Metal Products
49%
Chemicals Or Allied Products
13%Clay,Concrete, Glass Or Stone
10%
Farm Products7%
Clay,Concrete, Glass Or Stone
6%
All Others15%
Steele County - Origin Commodities by Value (2007)
Total originating value= $1.4 billion
Nonmetallic Minerals
58%
Petroleum Or Coal Products
11%
Clay,Concrete, Glass Or Stone
10%
Farm Products7%
Food Or Kindred Products
4%
All Others10%
Steele County - Terminating Commodities by Tonnage (2007)
Total terminating tons = .67 million
Petroleum Or Coal Products
20%
Primary Metal Products
16%
Clay,Concrete, Glass Or Stone
10%
Printed Matter10%
Food Or Kindred Products
9%
All Others32%
Steele County - Terminating Commodities by Value (2007)
Total terminating value = $.31 billion
Southeast Minnesota Regional Freight Study
29
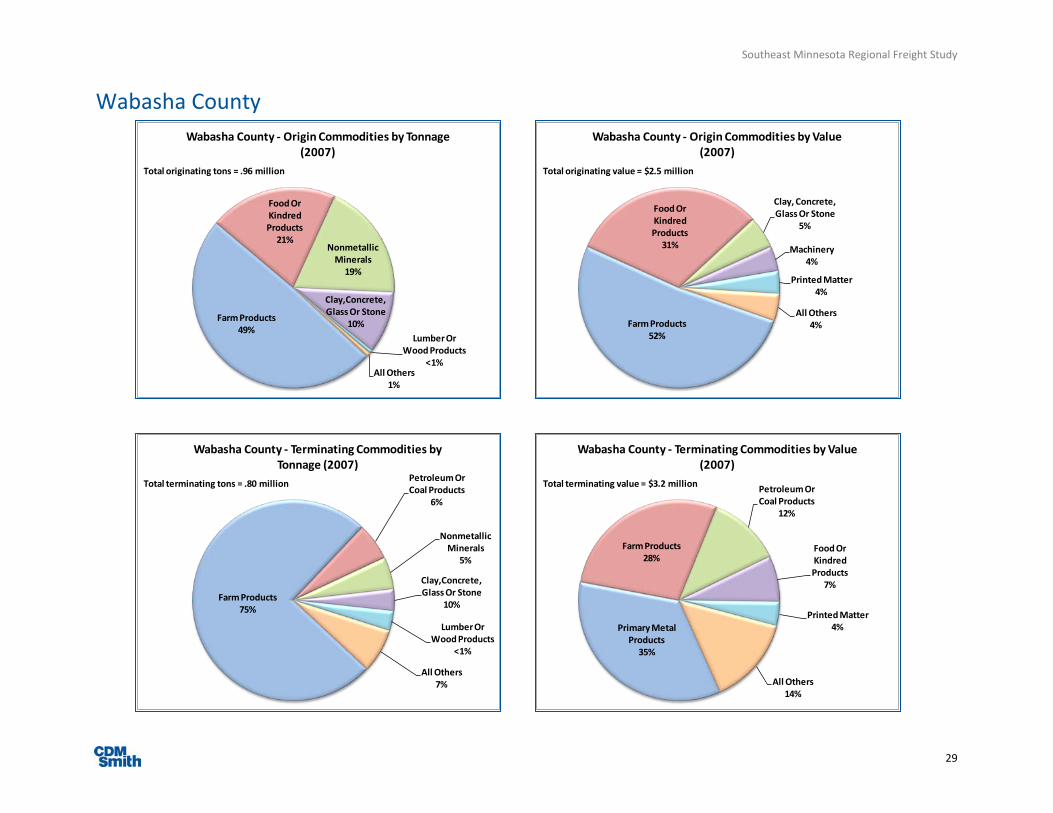
Wabasha County
Farm Products49%
Food Or Kindred Products
21%Nonmetallic
Minerals19%
Clay,Concrete,Glass Or Stone
10%Lumber Or
Wood Products<1%
All Others1%
Wabasha County - Origin Commodities by Tonnage (2007)
Total originating tons = .96 million
Farm Products52%
Food Or Kindred Products
31%
Clay, Concrete, Glass Or Stone
5%
Machinery4%
Printed Matter4%
All Others4%
Wabasha County - Origin Commodities by Value (2007)
Total originating value = $2.5 million
Farm Products75%
Petroleum Or Coal Products
6%
Nonmetallic Minerals
5%
Clay,Concrete,Glass Or Stone
10%
Lumber Or Wood Products
<1%
All Others7%
Wabasha County - Terminating Commodities by Tonnage (2007)
Total terminating tons = .80 million
Primary Metal Products
35%
Farm Products28%
Petroleum Or Coal Products
12%
Food Or Kindred Products
7%
Printed Matter4%
All Others14%
Wabasha County - Terminating Commodities by Value (2007)
Total terminating value = $3.2 million
Southeast Minnesota Regional Freight Study
30
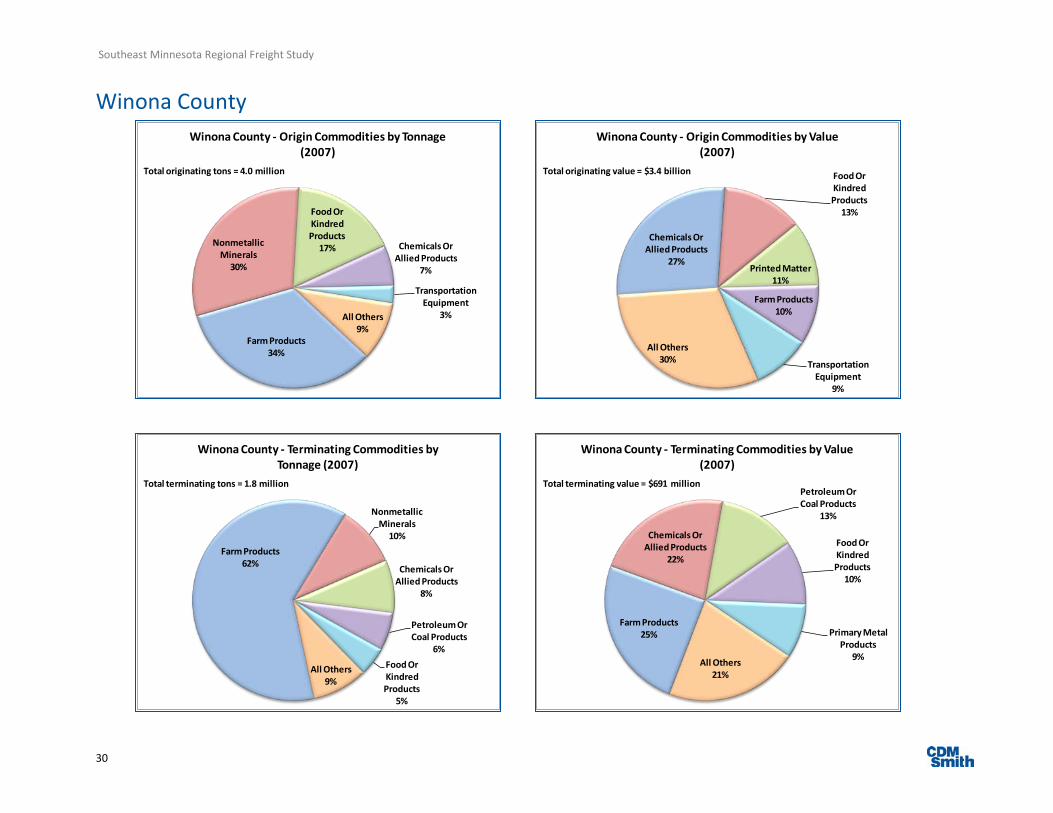
Winona County
Farm Products34%
Nonmetallic Minerals
30%
Food Or Kindred Products
17% Chemicals Or Allied Products
7%
Transportation Equipment
3%All Others9%
Winona County - Origin Commodities by Tonnage (2007)
Total originating tons = 4.0 million
Chemicals Or Allied Products
27%
Food Or Kindred Products
13%
Printed Matter11%
Farm Products10%
Transportation Equipment
9%
All Others30%
Winona County - Origin Commodities by Value (2007)
Total originating value = $3.4 billion
Farm Products62%
Nonmetallic Minerals
10%
Chemicals Or Allied Products
8%
Petroleum Or Coal Products
6%Food Or Kindred Products
5%
All Others9%
Winona County - Terminating Commodities by Tonnage (2007)
Total terminating tons = 1.8 million
Farm Products25%
Chemicals Or Allied Products
22%
Petroleum Or Coal Products
13%
Food Or Kindred Products
10%
Primary Metal Products
9%All Others21%
Winona County - Terminating Commodities by Value (2007)
Total terminating value = $691 million
Southeast Minnesota Regional Freight Study
Minnesota Department of Transportation
July 2012
Southeast Minnesota Regional Freight Study
TRENDS AND ISSUES AFFECTING FREIGHT TRANSPORTATION IN
SOUTHEAST MINNESOTA
2
Table of Contents Table of Contents ..................................................................................................................................................... i
List of Exhibits ......................................................................................................................................................... 2
Trends and Issues Affecting Freight Transportation in Southeastern Minnesota ............................................ 3
Introduction and Background ............................................................................................................................ 3
Changing Demographics: Older, More Concentrated Populations ............................................................... 4
The Emergence of the Ruralplex .................................................................................................................... 5
Structural Changes to the U.S. Economy .......................................................................................................... 6
The Shift from Manufacturing to Services .................................................................................................... 6
The New American Energy Revolution ............................................................................................................18
Changing Trade Patterns and the Panama Canal Expansion ........................................................................ 25
List of Exhibits Exhibit 15: Population Trends by Age in Minnesota and the Southeast Region ............................................... 5 Exhibit 16: Minnesota Ruralplex Regions .............................................................................................................. 5 Exhibit 17: World Merchandise Trade by Major Product Groups....................................................................... 9 Exhibit 18: U.S. Merchandise Trade by Major Product Group ............................................................................ 9 Exhibit 19: U.S. NAFTA Trade, 2004-2011 .............................................................................................................10 Exhibit 20: Minnesota NAFTA Trade, 2004-2011 ................................................................................................. 11 Exhibit 21: Exports of Goods from Minnesota Metro Areas (excluding the Twin Cities), 2010 ...................... 13 Exhibit 22: Rochester’s Export Destinations by International Economic Region ............................................ 13 Exhibit 23: Global Sourcing & Supply Chains: The Boeing 787 Dreamliner ..................................................... 15 Exhibit 24: Logistics and Supply Chain Management Evolution ....................................................................... 17 Exhibit 25: Lower 48 States Shale Oil Plays ........................................................................................................ 19 Exhibit 26: Hydraulic Fracturing Process for Shale Oil and Gas Extraction ................................................... 20 Exhibit 27: Silica Sand Mining Operations in Wisconsin ................................................................................... 21 Exhibit 28: Frack Sand Mining Process – Winona Operations ......................................................................... 22 Exhibit 29: Total Renewable Net Electricity Generation – Minnesota, 2010 ................................................... 24 Exhibit 30: Southeastern Minnesota’s Contribution to State Crop and Livestock Production ..................... 25 Exhibit 31: Grain Container Exports by Originating State ................................................................................. 26 Exhibit 32: North American Landbridge Routes from Coastal Gateways ........................................................ 28 Exhibit 33: U.S. Grain Exports .............................................................................................................................. 29
Southeast Minnesota Regional Freight Study
3
Trends and Issues Affecting Freight Transportation in Southeastern Minnesota
Introduction and Background The regional freight study for Southeastern Minnesota is defined by a study area representing eleven counties that define MnDOT District 6, as well as Economic Development Region 10:
1. Dodge
2. Fillmore
3. Freeborn
4. Goodhue
5. Houston
6. Mower
7. Olmsted
8. Rice
9. Steele
10. Wabasha
11. Winona
The purpose of this working paper is to identify and explore broad trends and issues that impact the Southeastern region of Minnesota with respect to future freight mobility and economic development. These issues and trends will help establish areas for further exploration during the stakeholder outreach process and subsequent analysis tasks. The paper discusses these trends and issues with regard to freight mobility in the region and likely impacts on the ability of the region to attract and maintain business to support economic development and job creation.
Promoting economic development and related job growth requires regional economies to maintain existing business and attract new ones. Access to efficient freight transportation is a key element in business site selection. Competing in the global market environment has raised the importance of efficient, reliable, and secure supply chain networks. In business vernacular, the “supply chain” is a group of physical entities such as manufacturing plants, distribution centers, conveyances, retail outlets, people and information which are linked together through processes (such as procurement or logistics) in an integrated fashion, to supply goods or services from source through consumption.
Certainly retail and manufacturing operations rely heavily on supply chain networks, not only to meet the supply needs of their customers but also to contribute to their profitability. Freight transportation has a critical role in a company’s site selection decisions. However, it isn’t just the physical facilities and infrastructure that are important. The conditions in an area that drive pricing, safety, and security in logistics are equally important. Resiliency is a key criterion, that being access to a network which offers mode choice, service flexibility, and reliability – not dependent on only one or a few components which might fail. The idea of resiliency is to return to normal or near normal business conditions as quickly as possible in the event of a service interruption of some sort, for example highway closures.
Southeast Minnesota Regional Freight Study
4
Changing Demographics: Older, More Concentrated Populations Developed countries, including the U.S. are facing a trend likely to have implications for our economy in the future; an aging population:
“In 1900, nearly two-thirds of Minnesota’s population lived in rural areas (66%) and three-fourths of the rural population lived on a farm (74%). By 2000, after rapid growth in urban areas and little growth in rural areas, only 29 percent of the state population lived in rural Minnesota and only 10 percent of the rural population lived on a farm.”4
The U.S., like much of the world, is in the midst of a long term migration of people choosing to live in more densely populated urban areas: More than four out of five people in the United States live and work in urban areas.5 At the turn of the century, farm populations in Minnesota made up nearly half (49%) of the state’s entire population; today the farm population of Minnesota is less than 3 percent of the total population. Today over 83 percent of the U.S. population live and work in urban areas. In Minnesota, 74 percent of the population is categorized as “urban”.6
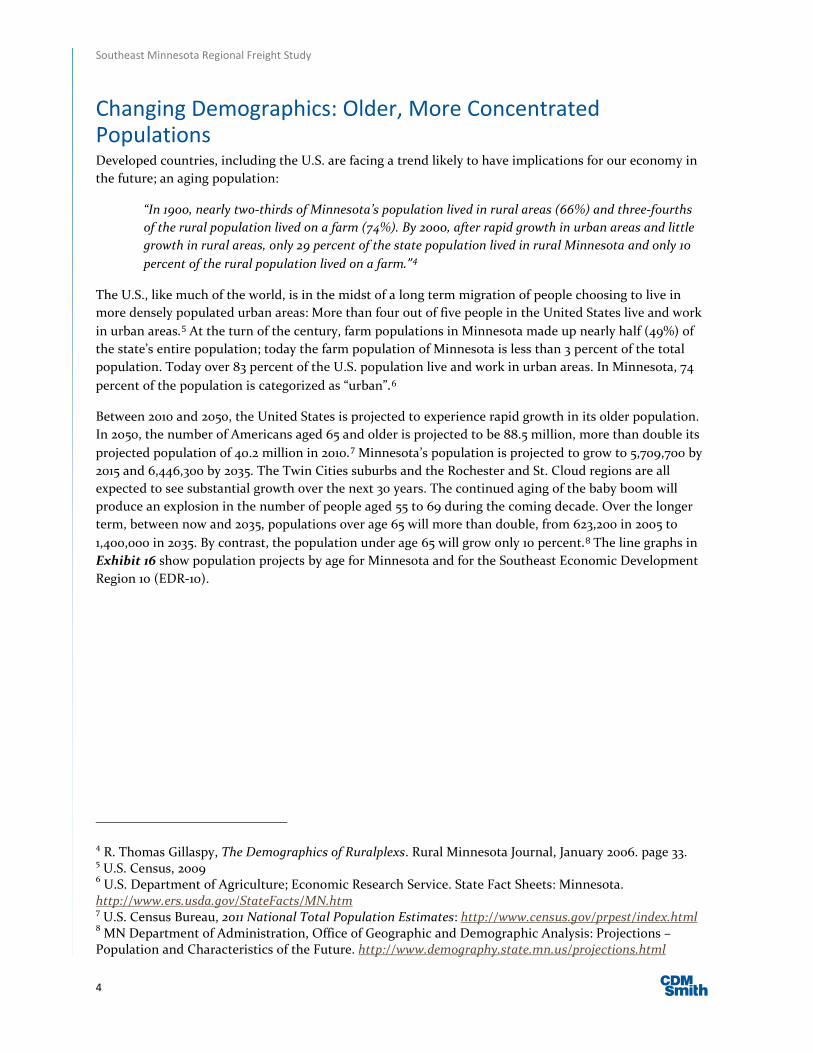
Between 2010 and 2050, the United States is projected to experience rapid growth in its older population. In 2050, the number of Americans aged 65 and older is projected to be 88.5 million, more than double its projected population of 40.2 million in 2010.7 Minnesota’s population is projected to grow to 5,709,700 by 2015 and 6,446,300 by 2035. The Twin Cities suburbs and the Rochester and St. Cloud regions are all expected to see substantial growth over the next 30 years. The continued aging of the baby boom will produce an explosion in the number of people aged 55 to 69 during the coming decade. Over the longer term, between now and 2035, populations over age 65 will more than double, from 623,200 in 2005 to 1,400,000 in 2035. By contrast, the population under age 65 will grow only 10 percent.8 The line graphs in Exhibit 16 show population projects by age for Minnesota and for the Southeast Economic Development Region 10 (EDR-10).
4 R. Thomas Gillaspy, The Demographics of Ruralplexs. Rural Minnesota Journal, January 2006. page 33. 5 U.S. Census, 2009 6 U.S. Department of Agriculture; Economic Research Service. State Fact Sheets: Minnesota. http://www.ers.usda.gov/StateFacts/MN.htm 7 U.S. Census Bureau, 2011 National Total Population Estimates: http://www.census.gov/prpest/index.html 8 MN Department of Administration, Office of Geographic and Demographic Analysis: Projections – Population and Characteristics of the Future. http://www.demography.state.mn.us/projections.html
Southeast Minnesota Regional Freight Study
5
Exhibit 155: Population Trends by Age in Minnesota and the Southeast Region
Source: Minnesota Department of Administration, Office of Geographic and Demographic Analysis Data graphed by CDM Smith – note that the scales for the two graphs differ
In 2010, the eleven counties making up the Southeast region had a population of 508,610 people and represented 9.3 percent of the state’s total population. The statewide and southeast regional population compositions by age are nearly mirror images of one another. The line graphs show current and predicted age population trends, for the population segregated into 20-year groups. While age groups under 60 years of age show modest or no gains over the 25-year forecast period, populations aged 60 to 79 years are predicted to grow approximately 70 percent for both the state and the region, while the population 80 years and older is projected to grow 98 percent in the region, and 111 percent statewide.
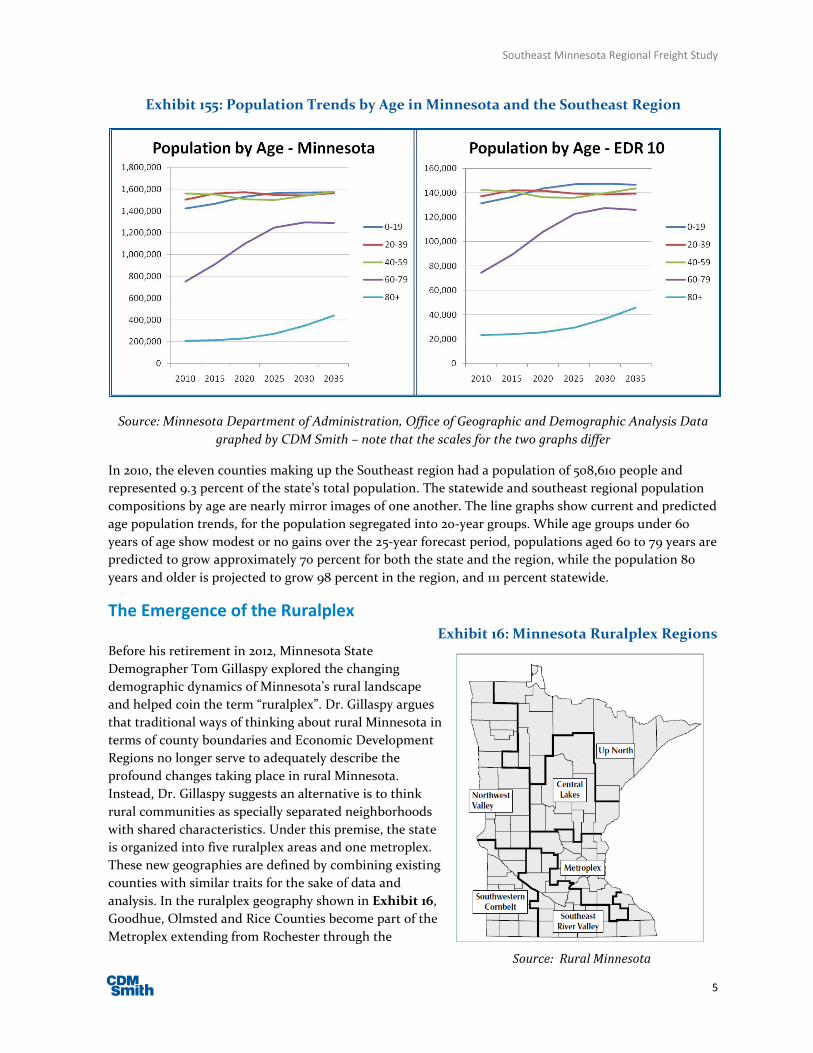
The Emergence of the Ruralplex Exhibit 16: Minnesota Ruralplex Regions
Before his retirement in 2012, Minnesota State Demographer Tom Gillaspy explored the changing demographic dynamics of Minnesota’s rural landscape and helped coin the term “ruralplex”. Dr. Gillaspy argues that traditional ways of thinking about rural Minnesota in terms of county boundaries and Economic Development Regions no longer serve to adequately describe the profound changes taking place in rural Minnesota. Instead, Dr. Gillaspy suggests an alternative is to think rural communities as specially separated neighborhoods with shared characteristics. Under this premise, the state is organized into five ruralplex areas and one metroplex. These new geographies are defined by combining existing counties with similar traits for the sake of data and analysis. In the ruralplex geography shown in Exhibit 16, Goodhue, Olmsted and Rice Counties become part of the Metroplex extending from Rochester through the
Source: Rural Minnesota
Southeast Minnesota Regional Freight Study
6
traditional metro counties up through St. Cloud.
The remaining EDR 10 counties are combined with EDR 6E and EDR 9 to the west and northwest. In a 2006 essay on demographic changes of the Minnesota’s ruralplex regions for the Rural Minnesota Journal, Dr. Gillaspy notes that several regions, including the Southeastern River Valley will see slow labor force growth in the coming years, due to the declining populations in young people. The conclusion drawn from this trend is that “future economic growth will depend almost exclusively on increased per-worker productivity”.9
Structural Changes to the U.S. Economy In our modern global economy, cost-effective, time-sensitive transportation services are increasingly a strategy for competitive advantage in manufacturing, mining, agriculture, and service-based industries. Businesses compete regionally, nationally and globally for raw materials, parts, and labor.
The globalization of the world economy has grown at a rapid pace over the past several decades and virtually all sectors of the U.S. economy now compete against global competitors. Advances in technology and management practices allow U.S. firms to employ strategies that enable customized products for mass-market distribution. In this environment, the ability of state and regional infrastructure managers to deliver robust transportation systems is directly tied to the economic competitiveness and community vitality:
“The changes at work in the American economy are profound. The agricultural and manufacturing economy of the 20th Century has evolved. Services have become the fastest-growing sector of the economy. Logistics and transportation sectors are second…The American economy demands increasing volumes of trade if it is to continue to grow. The economic sectors that remain robust will require far more trade and travel per unit of output than was required 30 years ago.”10
The Shift from Manufacturing to Services In the early 1980s, manufacturing was the leading sector the U.S. economy, roughly equal in economic contribution of the Services and “FIRE” (finance, insurance, and real estate) sectors combined. However, over the course of the past several decades, the services sector of the U.S. economy has significantly outpaced manufacturing growth as a percentage of Gross Domestic Product (GDP). By 2005, the service industries sector had increased its share of the national economy to account for 68 percent of current dollar GDP.11 However, it must be noted that while manufacturing as a share of the U.S. economy has declined, by value the U.S. remains the world’s leading manufacturer: The United States remains by far the world’s leading manufacturer by value of goods produced. It hit a record $1.6 trillion in 2007 – nearly double the $811 billion of 1987. For every $1 of value produced in China factories, the United States generates $2.50.12 By value, the U.S. produces 21 percent of the world’s manufacturing output, while China is second at 15
9 Ibid. Gillaspy, January 2006. 10 Transportation Invest in Our Future: America’s Freight Challenge. American Association of State Highway and Transportation Officials (AASHTO), May 2007. 11 BEA News, Gross Domestic Product by Industry for 2003: www.bea.doc.gov/bea/newsrel 12 New York Times; Is Anything Made in the U.S.A. anymore? You’d be surprised. February 2, 2009
Southeast Minnesota Regional Freight Study
7
percent, and Japan third at 12 percent.13 In terms of manufacturing exports, the European Union and China lead all countries.
Developing countries, by definition, are changing the structure of their economies as well, moving away from sustenance economies toward greater reliance on manufacturing and striving to become globally competitive with developed counties. In general, the U.S. economy is continuing to shift from basic, resource-oriented industries, such as agriculture, mining and basic manufacturing, toward a more diverse industry mix including high value-added industries such as microelectronics, medical technology and aerospace. In turn, demand for moving goods is shifting from bulk movements via rail, truckload and water to small, higher-value shipments via air freight, courier and less-than-truckload. This is particularly true in high-tech industries.
It should also be noted that the U.S. is a net exporter of services and leads the world in service exports:
The United States has been losing ground in terms of its share of global goods exports, as one would expect given the rapid economic growth of many developing countries. Over the last five years, products made in China, India, Brazil, and the Middle Eastern countries have made up an increasing share of world goods exports. The United States, though, is the global leader in service exports; selling $525.8 billion worth to foreign residents in 2008. This represented 13.8 percent of global commercial service exports, making the United States by far the world’s dominant service exporter.
Exports of services cover transportation and related services (e.g., tourism), educational services, intellectual property (royalties and licenses), financial services and other private services. In 2009, the service sector contributed a positive $148.7 billion toward the overall U.S. trade deficit. In terms of Minnesota’s service industry exports: “No official comprehensive state-level export data for services are available. Estimates by DEED show that Minnesota service exports were valued at $9.8 billion in 2009, up 2 percent from 2008.”14 Further, an analysis by the Brookings Institute found that the Minneapolis/St. Paul Metro region ranked 22nd in service export intensity among all metropolitan areas and second among Great Lakes Metropolitan Areas.15
Globalization The “Global Economy” is an often used phrase to describe the increasingly integrated and complex global systems of production and exchange between countries. Over the last several decades, economic activity has been shifting from traditional industrial countries like the U.S. to developing countries such as China, India, Russia, and other engineering economies throughout Asia and South America. The largest share of U.S. GDP is consumption (71%) with an increasing share of U.S. consumption coming from imports. The top countries supply U.S. imported goods are China, Canada, and Mexico. The growing importance of trade in the U.S. economy is a reflection of world economic trends.
13 National Association of Manufacturers. http://www.nam.org/Statistics-And-Data/Facts-About-Manufacturing/Landing.aspx 14 Minnesota Department of Employment and Economic Development (DEED), Minnesota Annual Export Statistics (2010). http://www.positivelyminnesota.com/Data_Publications/Data/Export_Statistics/2010_Stats/Export_Annual_2010.pdf 15 Jennifer Bradley, Emily Istrate and Jonathan Rothwell, Exports in the Great Lakes: How Great Lakes Metros Can Build on Exports and Boost Competitiveness. Brookings Institute; Metropolitan Policy Program. July 2010, pp. 8.

Southeast Minnesota Regional Freight Study
8
Exhibit 17 and Exhibit 18 summarize the growth in trade by major product group since 2000.
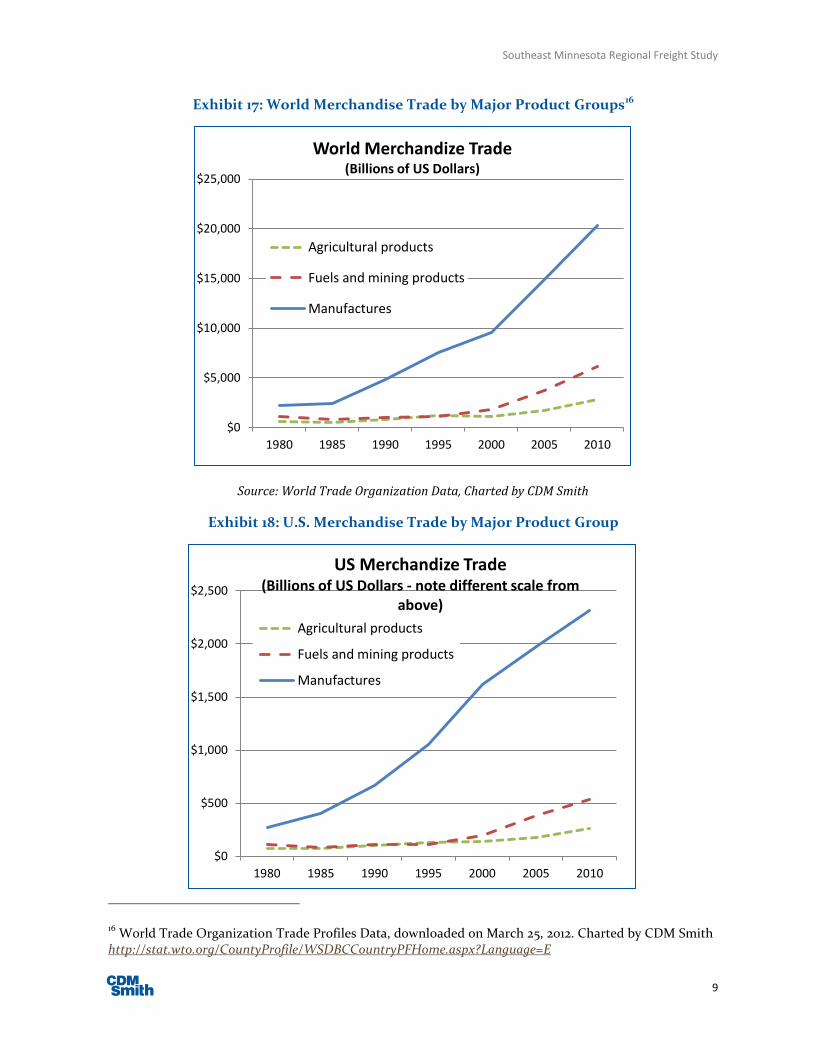
Southeast Minnesota Regional Freight Study
9
Exhibit 17: World Merchandise Trade by Major Product Groups16
Source: World Trade Organization Data, Charted by CDM Smith
Exhibit 18: U.S. Merchandise Trade by Major Product Group
16 World Trade Organization Trade Profiles Data, downloaded on March 25, 2012. Charted by CDM Smith http://stat.wto.org/CountyProfile/WSDBCCountryPFHome.aspx?Language=E
$0
$5,000
$10,000
$15,000
$20,000
$25,000
1980 1985 1990 1995 2000 2005 2010
World Merchandize Trade (Billions of US Dollars)
Agricultural products
Fuels and mining products
Manufactures
$0
$500
$1,000
$1,500
$2,000
$2,500
1980 1985 1990 1995 2000 2005 2010
US Merchandize Trade (Billions of US Dollars - note different scale from
above) Agricultural products
Fuels and mining products
Manufactures
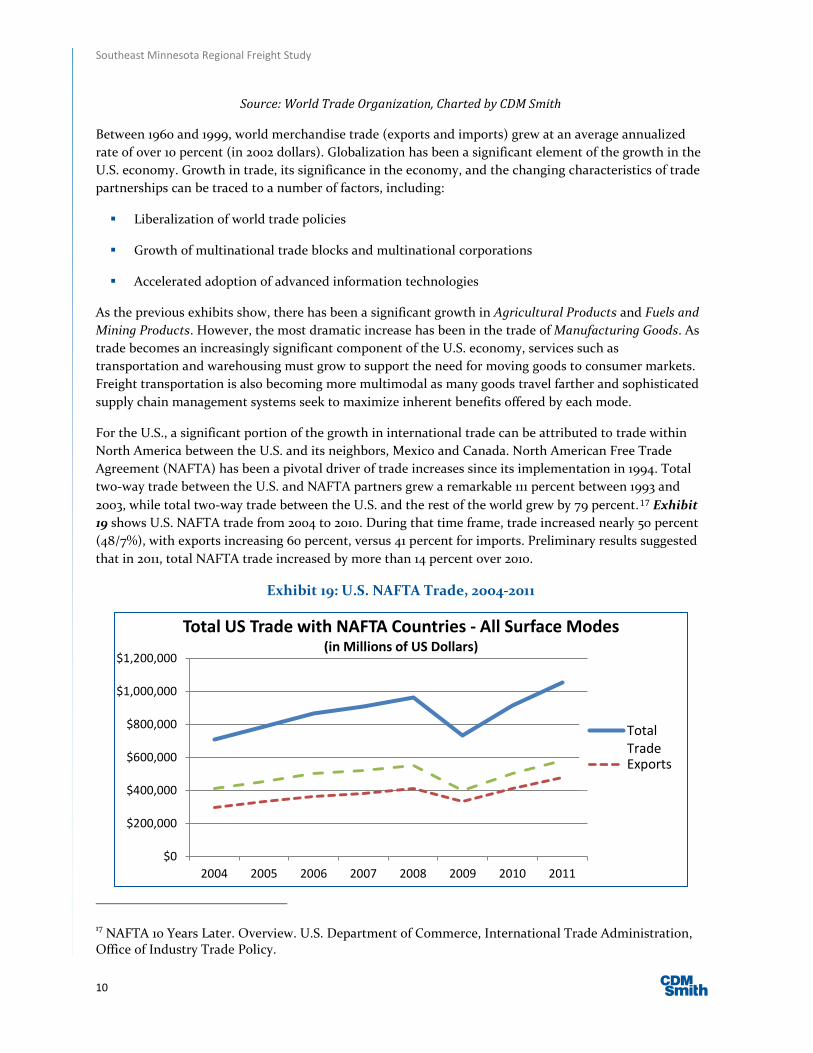
Southeast Minnesota Regional Freight Study
10
Source: World Trade Organization, Charted by CDM Smith
Between 1960 and 1999, world merchandise trade (exports and imports) grew at an average annualized rate of over 10 percent (in 2002 dollars). Globalization has been a significant element of the growth in the U.S. economy. Growth in trade, its significance in the economy, and the changing characteristics of trade partnerships can be traced to a number of factors, including:
Liberalization of world trade policies
Growth of multinational trade blocks and multinational corporations
Accelerated adoption of advanced information technologies
As the previous exhibits show, there has been a significant growth in Agricultural Products and Fuels and Mining Products. However, the most dramatic increase has been in the trade of Manufacturing Goods. As trade becomes an increasingly significant component of the U.S. economy, services such as transportation and warehousing must grow to support the need for moving goods to consumer markets. Freight transportation is also becoming more multimodal as many goods travel farther and sophisticated supply chain management systems seek to maximize inherent benefits offered by each mode.
For the U.S., a significant portion of the growth in international trade can be attributed to trade within North America between the U.S. and its neighbors, Mexico and Canada. North American Free Trade Agreement (NAFTA) has been a pivotal driver of trade increases since its implementation in 1994. Total two-way trade between the U.S. and NAFTA partners grew a remarkable 111 percent between 1993 and 2003, while total two-way trade between the U.S. and the rest of the world grew by 79 percent.17 Exhibit 19 shows U.S. NAFTA trade from 2004 to 2010. During that time frame, trade increased nearly 50 percent (48/7%), with exports increasing 60 percent, versus 41 percent for imports. Preliminary results suggested that in 2011, total NAFTA trade increased by more than 14 percent over 2010.
Exhibit 19: U.S. NAFTA Trade, 2004-2011
17 NAFTA 10 Years Later. Overview. U.S. Department of Commerce, International Trade Administration, Office of Industry Trade Policy.
$0
$200,000
$400,000
$600,000
$800,000
$1,000,000
$1,200,000
2004 2005 2006 2007 2008 2009 2010 2011
Total US Trade with NAFTA Countries - All Surface Modes (in Millions of US Dollars)
TotalTradeExports
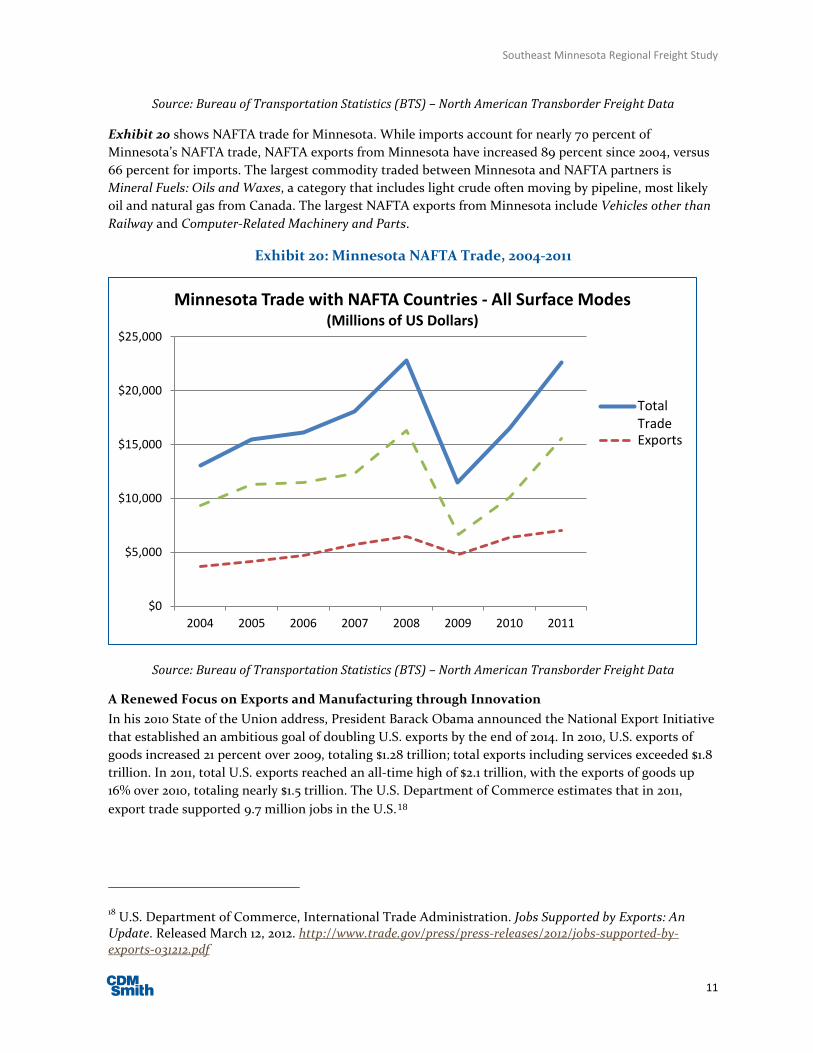
Southeast Minnesota Regional Freight Study
11
Source: Bureau of Transportation Statistics (BTS) – North American Transborder Freight Data
Exhibit 20 shows NAFTA trade for Minnesota. While imports account for nearly 70 percent of Minnesota’s NAFTA trade, NAFTA exports from Minnesota have increased 89 percent since 2004, versus 66 percent for imports. The largest commodity traded between Minnesota and NAFTA partners is Mineral Fuels: Oils and Waxes, a category that includes light crude often moving by pipeline, most likely oil and natural gas from Canada. The largest NAFTA exports from Minnesota include Vehicles other than Railway and Computer-Related Machinery and Parts.
Exhibit 20: Minnesota NAFTA Trade, 2004-2011
Source: Bureau of Transportation Statistics (BTS) – North American Transborder Freight Data
A Renewed Focus on Exports and Manufacturing through Innovation In his 2010 State of the Union address, President Barack Obama announced the National Export Initiative that established an ambitious goal of doubling U.S. exports by the end of 2014. In 2010, U.S. exports of goods increased 21 percent over 2009, totaling $1.28 trillion; total exports including services exceeded $1.8 trillion. In 2011, total U.S. exports reached an all-time high of $2.1 trillion, with the exports of goods up 16% over 2010, totaling nearly $1.5 trillion. The U.S. Department of Commerce estimates that in 2011, export trade supported 9.7 million jobs in the U.S.18
18 U.S. Department of Commerce, International Trade Administration. Jobs Supported by Exports: An Update. Released March 12, 2012. http://www.trade.gov/press/press-releases/2012/jobs-supported-by-exports-031212.pdf
$0
$5,000
$10,000
$15,000
$20,000
$25,000
2004 2005 2006 2007 2008 2009 2010 2011
Minnesota Trade with NAFTA Countries - All Surface Modes (Millions of US Dollars)
TotalTradeExports
Southeast Minnesota Regional Freight Study
12
In Minnesota, total exports for 2010 were estimated at $31 billion, with 55 percent of the state’s exports coming from manufacturing industries.19 In 2010, the Minneapolis/St. Paul metropolitan area exported over $23 billion in goods, more than all other urban areas in the state combined. However, excluding the Twin Cities area, Rochester was the largest exporting metro area in the state, accounting for just under $1 billion in goods exports (Exhibit 21).
19 Ibid. Minnesota DEED, Annual Export Statistics. pp. 13.
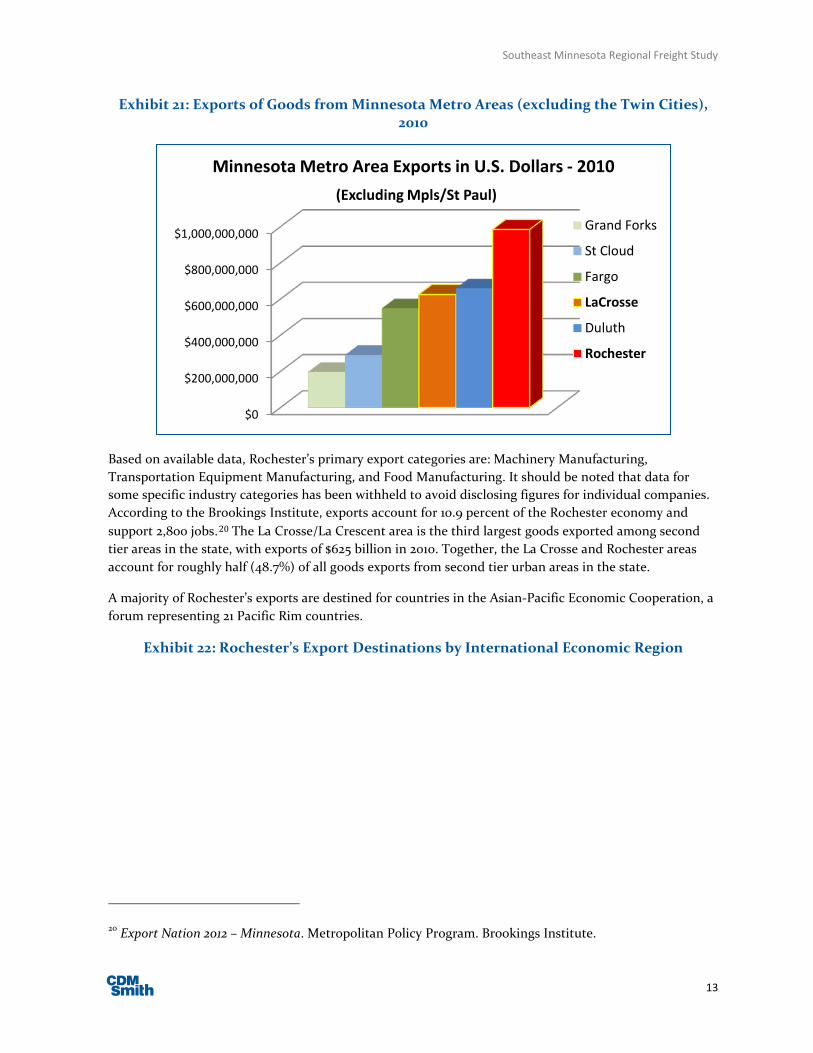
Southeast Minnesota Regional Freight Study
13
Exhibit 21: Exports of Goods from Minnesota Metro Areas (excluding the Twin Cities), 2010
Based on available data, Rochester’s primary export categories are: Machinery Manufacturing, Transportation Equipment Manufacturing, and Food Manufacturing. It should be noted that data for some specific industry categories has been withheld to avoid disclosing figures for individual companies. According to the Brookings Institute, exports account for 10.9 percent of the Rochester economy and support 2,800 jobs.20 The La Crosse/La Crescent area is the third largest goods exported among second tier areas in the state, with exports of $625 billion in 2010. Together, the La Crosse and Rochester areas account for roughly half (48.7%) of all goods exports from second tier urban areas in the state.
A majority of Rochester’s exports are destined for countries in the Asian-Pacific Economic Cooperation, a forum representing 21 Pacific Rim countries.
Exhibit 22: Rochester’s Export Destinations by International Economic Region
20 Export Nation 2012 – Minnesota. Metropolitan Policy Program. Brookings Institute.
$0
$200,000,000
$400,000,000
$600,000,000
$800,000,000
$1,000,000,000
Minnesota Metro Area Exports in U.S. Dollars - 2010 (Excluding Mpls/St Paul)
Grand Forks
St Cloud
Fargo
LaCrosse
Duluth
Rochester
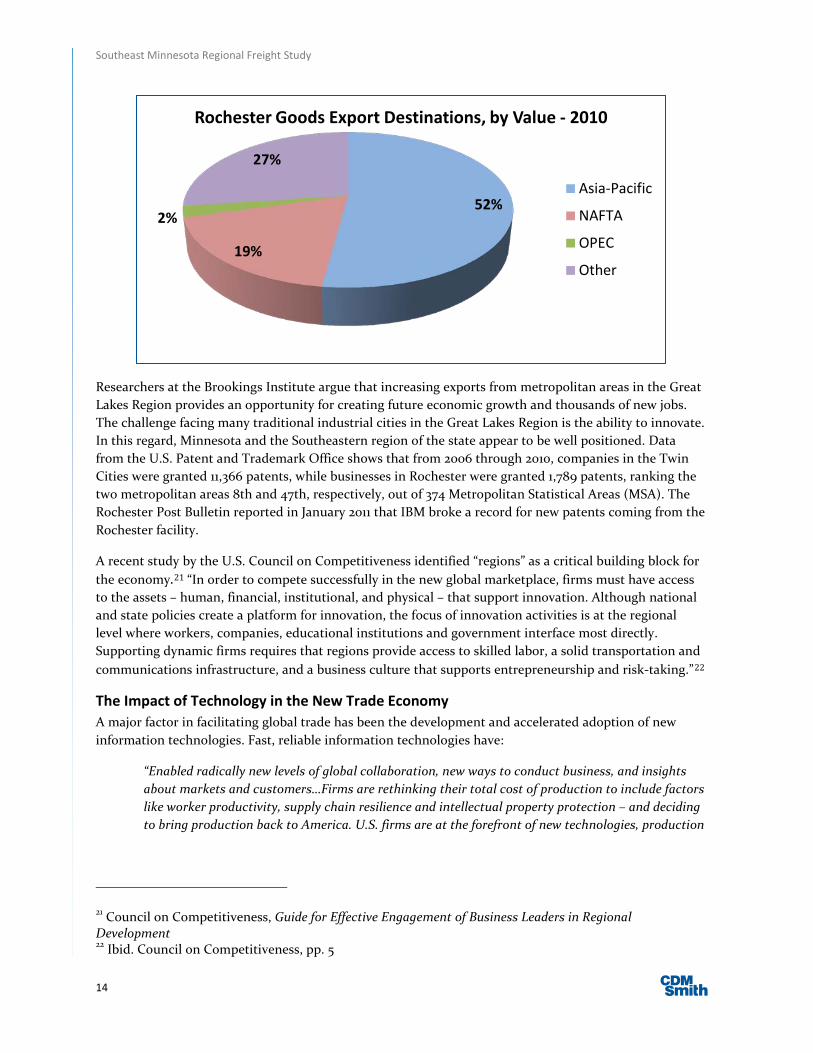
Southeast Minnesota Regional Freight Study
14
Researchers at the Brookings Institute argue that increasing exports from metropolitan areas in the Great Lakes Region provides an opportunity for creating future economic growth and thousands of new jobs. The challenge facing many traditional industrial cities in the Great Lakes Region is the ability to innovate. In this regard, Minnesota and the Southeastern region of the state appear to be well positioned. Data from the U.S. Patent and Trademark Office shows that from 2006 through 2010, companies in the Twin Cities were granted 11,366 patents, while businesses in Rochester were granted 1,789 patents, ranking the two metropolitan areas 8th and 47th, respectively, out of 374 Metropolitan Statistical Areas (MSA). The Rochester Post Bulletin reported in January 2011 that IBM broke a record for new patents coming from the Rochester facility.
A recent study by the U.S. Council on Competitiveness identified “regions” as a critical building block for the economy.21 “In order to compete successfully in the new global marketplace, firms must have access to the assets – human, financial, institutional, and physical – that support innovation. Although national and state policies create a platform for innovation, the focus of innovation activities is at the regional level where workers, companies, educational institutions and government interface most directly. Supporting dynamic firms requires that regions provide access to skilled labor, a solid transportation and communications infrastructure, and a business culture that supports entrepreneurship and risk-taking.”22
The Impact of Technology in the New Trade Economy A major factor in facilitating global trade has been the development and accelerated adoption of new information technologies. Fast, reliable information technologies have:
“Enabled radically new levels of global collaboration, new ways to conduct business, and insights about markets and customers…Firms are rethinking their total cost of production to include factors like worker productivity, supply chain resilience and intellectual property protection – and deciding to bring production back to America. U.S. firms are at the forefront of new technologies, production
21 Council on Competitiveness, Guide for Effective Engagement of Business Leaders in Regional Development 22 Ibid. Council on Competitiveness, pp. 5
52%
19%
2%
27%
Rochester Goods Export Destinations, by Value - 2010
Asia-Pacific
NAFTA
OPEC
Other
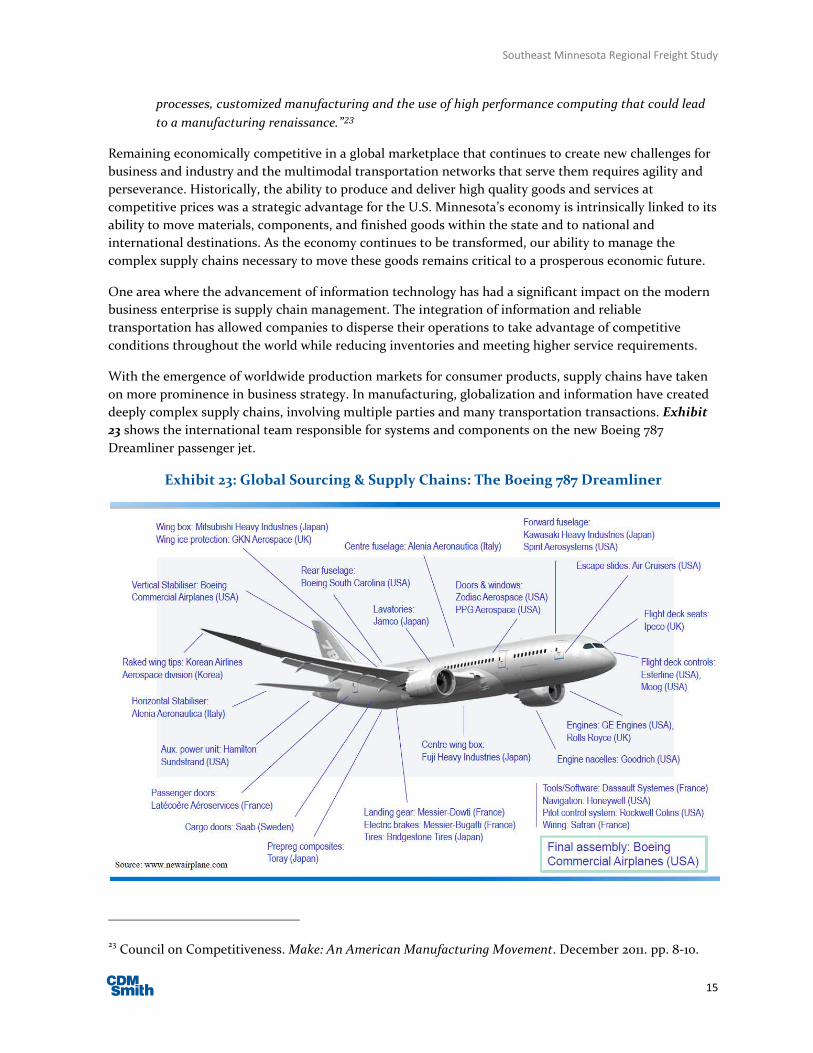
Southeast Minnesota Regional Freight Study
15
processes, customized manufacturing and the use of high performance computing that could lead to a manufacturing renaissance.”23
Remaining economically competitive in a global marketplace that continues to create new challenges for business and industry and the multimodal transportation networks that serve them requires agility and perseverance. Historically, the ability to produce and deliver high quality goods and services at competitive prices was a strategic advantage for the U.S. Minnesota’s economy is intrinsically linked to its ability to move materials, components, and finished goods within the state and to national and international destinations. As the economy continues to be transformed, our ability to manage the complex supply chains necessary to move these goods remains critical to a prosperous economic future.
One area where the advancement of information technology has had a significant impact on the modern business enterprise is supply chain management. The integration of information and reliable transportation has allowed companies to disperse their operations to take advantage of competitive conditions throughout the world while reducing inventories and meeting higher service requirements.
With the emergence of worldwide production markets for consumer products, supply chains have taken on more prominence in business strategy. In manufacturing, globalization and information have created deeply complex supply chains, involving multiple parties and many transportation transactions. Exhibit 23 shows the international team responsible for systems and components on the new Boeing 787 Dreamliner passenger jet.
Exhibit 23: Global Sourcing & Supply Chains: The Boeing 787 Dreamliner
23 Council on Competitiveness. Make: An American Manufacturing Movement. December 2011. pp. 8-10.
Southeast Minnesota Regional Freight Study
16
Picture Source: http://siteresources.worldbank.org/INTTRADERESEARCH/Images/Boeing787.jpg
In WWII, logistics (having the right materials in the right place at the right time) played a key role in the Allied victory. After the war logistics management entered the mainstream of American business practice. Early logistics management focused on delivering finished products to consumers. In the latter half of the Twentieth Century, logistics management became a legitimate business function that continued to evolve toward a more integrated chain linking previously separate functions: material sourcing and procurement, manufacturing, inventory management, distribution, and transportation. As the science of logistics evolved into what is today, supply chain management, businesses refocused from just delivering products and reducing inventory, to using supply chain strategies to create a competitive advantage and contribute to the bottom line. Exhibit 24 provides a simplistic depiction of the logistics, supply chain evolution.
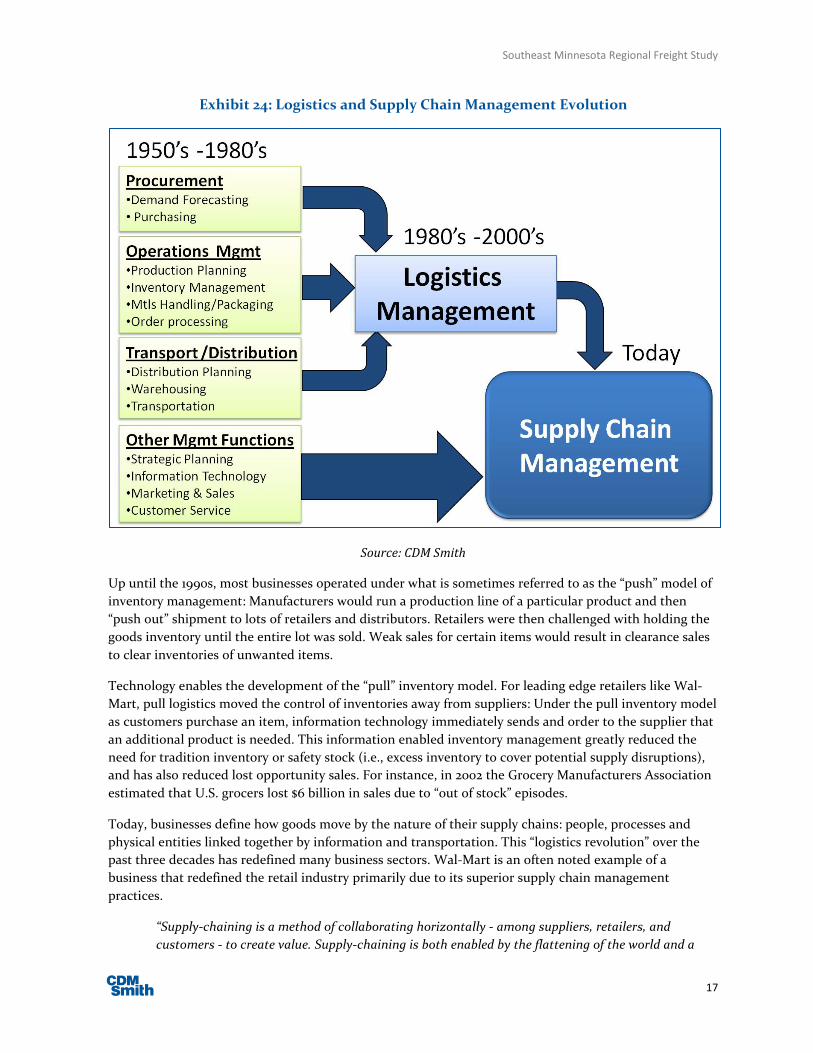
Southeast Minnesota Regional Freight Study
17
Exhibit 24: Logistics and Supply Chain Management Evolution
Source: CDM Smith
Up until the 1990s, most businesses operated under what is sometimes referred to as the “push” model of inventory management: Manufacturers would run a production line of a particular product and then “push out” shipment to lots of retailers and distributors. Retailers were then challenged with holding the goods inventory until the entire lot was sold. Weak sales for certain items would result in clearance sales to clear inventories of unwanted items.
Technology enables the development of the “pull” inventory model. For leading edge retailers like Wal-Mart, pull logistics moved the control of inventories away from suppliers: Under the pull inventory model as customers purchase an item, information technology immediately sends and order to the supplier that an additional product is needed. This information enabled inventory management greatly reduced the need for tradition inventory or safety stock (i.e., excess inventory to cover potential supply disruptions), and has also reduced lost opportunity sales. For instance, in 2002 the Grocery Manufacturers Association estimated that U.S. grocers lost $6 billion in sales due to “out of stock” episodes.
Today, businesses define how goods move by the nature of their supply chains: people, processes and physical entities linked together by information and transportation. This “logistics revolution” over the past three decades has redefined many business sectors. Wal-Mart is an often noted example of a business that redefined the retail industry primarily due to its superior supply chain management practices.
“Supply-chaining is a method of collaborating horizontally - among suppliers, retailers, and customers - to create value. Supply-chaining is both enabled by the flattening of the world and a

Southeast Minnesota Regional Freight Study
18
hugely important flattener itself, because the more they grow and proliferate, the more they force the adoption of common standards between companies (so that every link of every supply chain can interface with the next), the more they eliminate friction at borders, the more they encourage global collaboration.”24
One measure of the productivity resulting from supply chain management over the past several decades is that the cost associated with getting goods from the point of production to the final consumer as a percentage of the economy has gone from about 11 percent of GDP in the mid-1990s, to a low of 7.7 percent in recent years. Each percentage reduction in logistics as a portion of the GDP is equivalent to about $125 billion that is then available to other economic activities.
As electronic-commerce “or e-commerce” (the buying and selling of goods over the internet) is adopted by more of the population, the complexities of fulfilling orders increases. Minnesota based consumer giant Best Buy experienced the complexities of fulfilling e-commerce orders when just days before Christmas 2011, the retailer was forced to tell customers that it could not fill online orders going back as far as November.
The New American Energy Revolution “The great economic revolutions in history occur when new communication technologies converge with new energy systems. New energy revolutions make possible more expansive and integrated trade. Accompanying communication revolutions manage the new complex commercial activities made possible by the new energy flows…Today, Internet technology and renewable energies are beginning to merge to create a new infrastructure for a Third Industrial Revolution (TIR) that will change the way power is distributed in the 21st Century.”25
While this vision of an energy future largely free of dependence on fossil fuels may be desirable, it does not appear to be a reality in the near-term (10 to 15 years). The current trend appears to focus on relieving American’s from dependence on foreign oil through a combination of using new technology for U.S. based oil and gas production, coupled with renewable energy development; what has recently been coined as the “all of the above” policy toward U.S. energy development.
U.S. Shale Oil Plays
The traditional means of extracting crude oil has been accomplished by drilling a bole into geological structures forming oil reservoirs. For most of the Twentieth Century pumping oil from crude oil deposits fuel the world. Early drilling techniques for oil involved vertical wells, however modern drilling favors slant techniques that expose a greater portion of the well pipe in the reservoir and also well heads to be groups together.
As drilling and excavation techniques evolved, the ability to extract oil from unconventional formations has become more feasible and cost effective. While North Dakota had produced oil via vertical drilling since the 1950s, in 2006 the state accounted for about 1 percent of total domestic production, 9th among
24 Thomas Freidman. The World is Flat: A Brief History of the 21st Century. Farrar, Staus and Giroux Publishers, New York. 2005. pp. 129. 25 Jeremy Rifkin. The Third Industrial Revolution: How the Internet, Green Electricity, and 3-D Printing Are Ushering in a Sustainable Era of Distributed Capitalism. The Huffington Post Online (Huff Post Tech – The Blog). March 28, 2012. http://www.huffingtonpost.com/jeremy-rifkin/the-third-industrial-revo_1_b_1386430.html?ref=technology
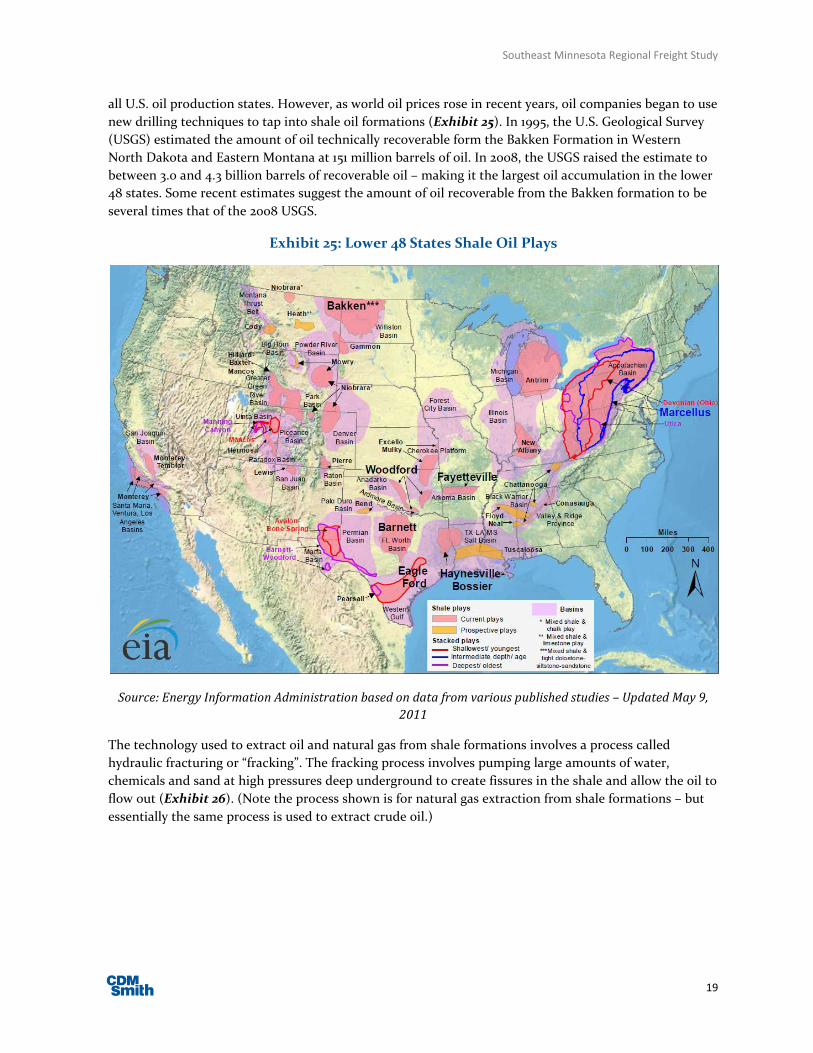
Southeast Minnesota Regional Freight Study
19
all U.S. oil production states. However, as world oil prices rose in recent years, oil companies began to use new drilling techniques to tap into shale oil formations (Exhibit 25). In 1995, the U.S. Geological Survey (USGS) estimated the amount of oil technically recoverable form the Bakken Formation in Western North Dakota and Eastern Montana at 151 million barrels of oil. In 2008, the USGS raised the estimate to between 3.0 and 4.3 billion barrels of recoverable oil – making it the largest oil accumulation in the lower 48 states. Some recent estimates suggest the amount of oil recoverable from the Bakken formation to be several times that of the 2008 USGS.
Exhibit 25: Lower 48 States Shale Oil Plays
Source: Energy Information Administration based on data from various published studies – Updated May 9, 2011
The technology used to extract oil and natural gas from shale formations involves a process called hydraulic fracturing or “fracking”. The fracking process involves pumping large amounts of water, chemicals and sand at high pressures deep underground to create fissures in the shale and allow the oil to flow out (Exhibit 26). (Note the process shown is for natural gas extraction from shale formations – but essentially the same process is used to extract crude oil.)
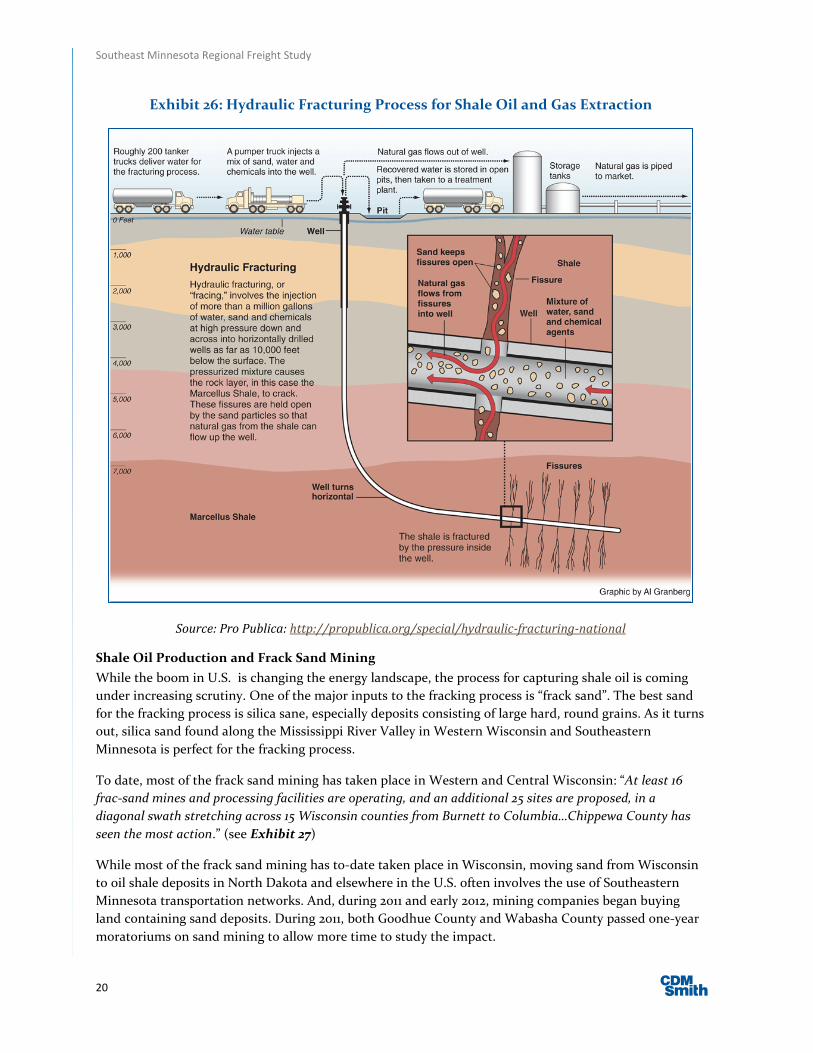
Southeast Minnesota Regional Freight Study
20
Exhibit 26: Hydraulic Fracturing Process for Shale Oil and Gas Extraction
Source: Pro Publica: http://propublica.org/special/hydraulic-fracturing-national
Shale Oil Production and Frack Sand Mining While the boom in U.S. is changing the energy landscape, the process for capturing shale oil is coming under increasing scrutiny. One of the major inputs to the fracking process is “frack sand”. The best sand for the fracking process is silica sane, especially deposits consisting of large hard, round grains. As it turns out, silica sand found along the Mississippi River Valley in Western Wisconsin and Southeastern Minnesota is perfect for the fracking process.
To date, most of the frack sand mining has taken place in Western and Central Wisconsin: “At least 16 frac-sand mines and processing facilities are operating, and an additional 25 sites are proposed, in a diagonal swath stretching across 15 Wisconsin counties from Burnett to Columbia…Chippewa County has seen the most action.” (see Exhibit 27)
While most of the frack sand mining has to-date taken place in Wisconsin, moving sand from Wisconsin to oil shale deposits in North Dakota and elsewhere in the U.S. often involves the use of Southeastern Minnesota transportation networks. And, during 2011 and early 2012, mining companies began buying land containing sand deposits. During 2011, both Goodhue County and Wabasha County passed one-year moratoriums on sand mining to allow more time to study the impact.
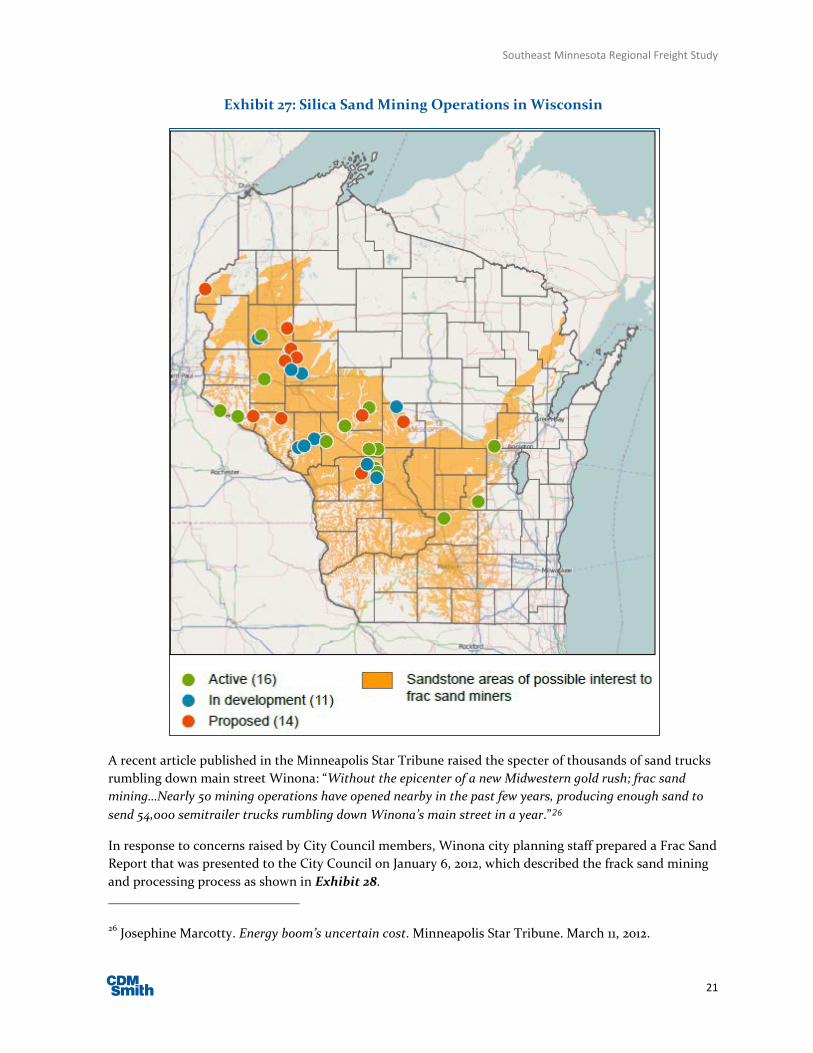
Southeast Minnesota Regional Freight Study
21
Exhibit 27: Silica Sand Mining Operations in Wisconsin
A recent article published in the Minneapolis Star Tribune raised the specter of thousands of sand trucks rumbling down main street Winona: “Without the epicenter of a new Midwestern gold rush; frac sand mining…Nearly 50 mining operations have opened nearby in the past few years, producing enough sand to send 54,000 semitrailer trucks rumbling down Winona’s main street in a year.”26
In response to concerns raised by City Council members, Winona city planning staff prepared a Frac Sand Report that was presented to the City Council on January 6, 2012, which described the frack sand mining and processing process as shown in Exhibit 28.
26 Josephine Marcotty. Energy boom’s uncertain cost. Minneapolis Star Tribune. March 11, 2012.
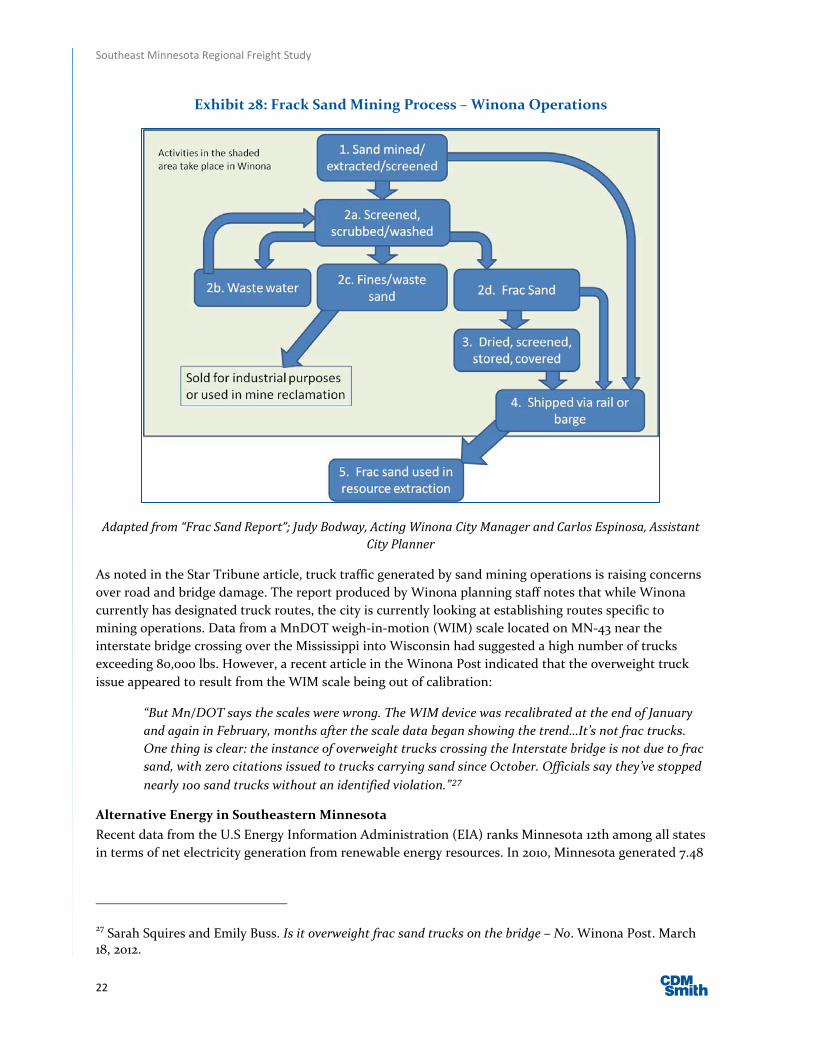
Southeast Minnesota Regional Freight Study
22
Exhibit 28: Frack Sand Mining Process – Winona Operations
Adapted from “Frac Sand Report”; Judy Bodway, Acting Winona City Manager and Carlos Espinosa, Assistant City Planner
As noted in the Star Tribune article, truck traffic generated by sand mining operations is raising concerns over road and bridge damage. The report produced by Winona planning staff notes that while Winona currently has designated truck routes, the city is currently looking at establishing routes specific to mining operations. Data from a MnDOT weigh-in-motion (WIM) scale located on MN-43 near the interstate bridge crossing over the Mississippi into Wisconsin had suggested a high number of trucks exceeding 80,000 lbs. However, a recent article in the Winona Post indicated that the overweight truck issue appeared to result from the WIM scale being out of calibration:
“But Mn/DOT says the scales were wrong. The WIM device was recalibrated at the end of January and again in February, months after the scale data began showing the trend…It’s not frac trucks. One thing is clear: the instance of overweight trucks crossing the Interstate bridge is not due to frac sand, with zero citations issued to trucks carrying sand since October. Officials say they’ve stopped nearly 100 sand trucks without an identified violation.”27
Alternative Energy in Southeastern Minnesota Recent data from the U.S Energy Information Administration (EIA) ranks Minnesota 12th among all states in terms of net electricity generation from renewable energy resources. In 2010, Minnesota generated 7.48
27 Sarah Squires and Emily Buss. Is it overweight frac sand trucks on the bridge – No. Winona Post. March 18, 2012.
Southeast Minnesota Regional Freight Study
23
gigawatt hours of electricity from renewable sources.28 The chart in Exhibit 29 shows Minnesota’s electricity production for 2010 by renewable energy source.
28 U.S. Energy Information Administration, State Renewable Electricity Profiles. March 8, 2012. http://www.eia.gov/renewable/state/
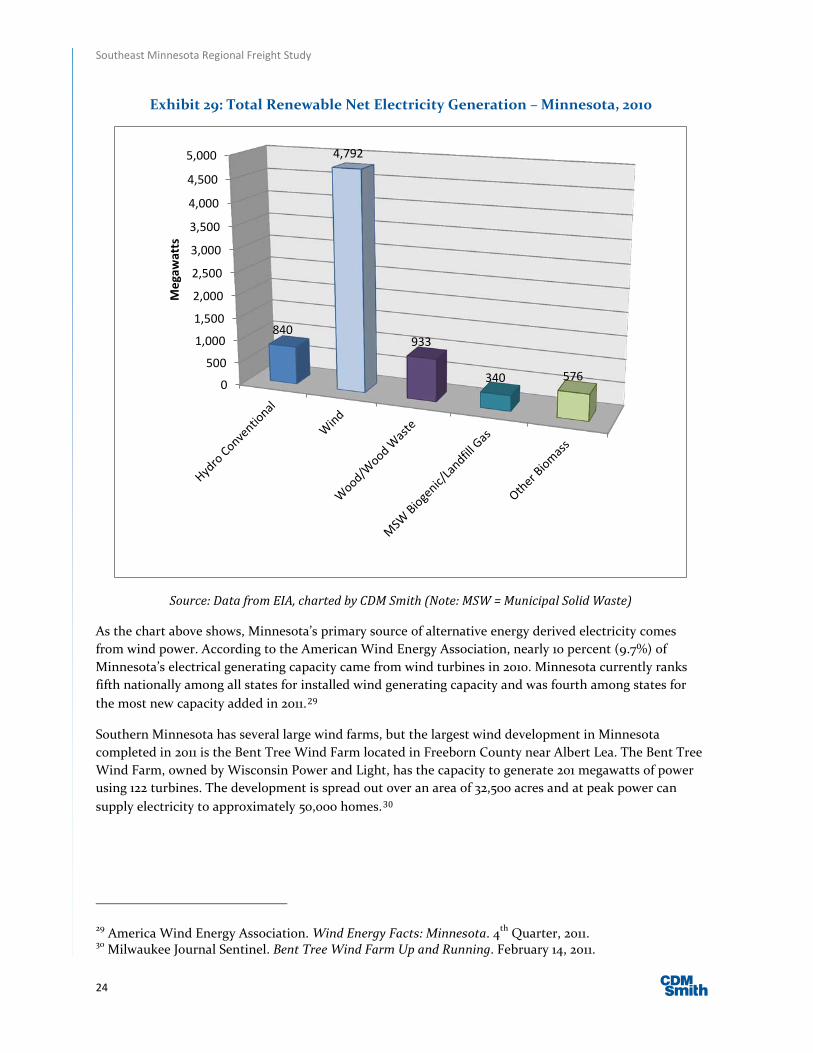
Southeast Minnesota Regional Freight Study
24
Exhibit 29: Total Renewable Net Electricity Generation – Minnesota, 2010
Source: Data from EIA, charted by CDM Smith (Note: MSW = Municipal Solid Waste)
As the chart above shows, Minnesota’s primary source of alternative energy derived electricity comes from wind power. According to the American Wind Energy Association, nearly 10 percent (9.7%) of Minnesota’s electrical generating capacity came from wind turbines in 2010. Minnesota currently ranks fifth nationally among all states for installed wind generating capacity and was fourth among states for the most new capacity added in 2011.29
Southern Minnesota has several large wind farms, but the largest wind development in Minnesota completed in 2011 is the Bent Tree Wind Farm located in Freeborn County near Albert Lea. The Bent Tree Wind Farm, owned by Wisconsin Power and Light, has the capacity to generate 201 megawatts of power using 122 turbines. The development is spread out over an area of 32,500 acres and at peak power can supply electricity to approximately 50,000 homes.30
29 America Wind Energy Association. Wind Energy Facts: Minnesota. 4th Quarter, 2011. 30 Milwaukee Journal Sentinel. Bent Tree Wind Farm Up and Running. February 14, 2011.
0
500
1,000
1,500
2,000
2,500
3,000
3,500
4,000
4,500
5,000
840
4,792
933
340 576
Meg
awat
ts
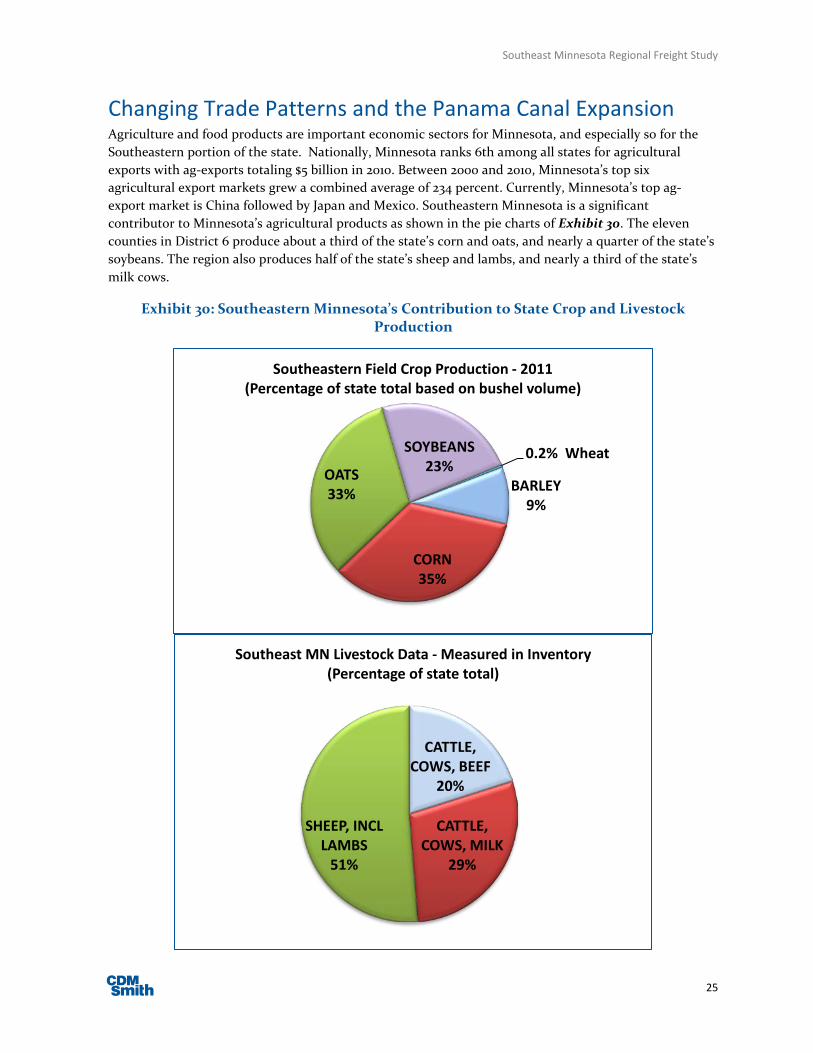
Southeast Minnesota Regional Freight Study
25
Changing Trade Patterns and the Panama Canal Expansion Agriculture and food products are important economic sectors for Minnesota, and especially so for the Southeastern portion of the state. Nationally, Minnesota ranks 6th among all states for agricultural exports with ag-exports totaling $5 billion in 2010. Between 2000 and 2010, Minnesota’s top six agricultural export markets grew a combined average of 234 percent. Currently, Minnesota’s top ag-export market is China followed by Japan and Mexico. Southeastern Minnesota is a significant contributor to Minnesota’s agricultural products as shown in the pie charts of Exhibit 30. The eleven counties in District 6 produce about a third of the state’s corn and oats, and nearly a quarter of the state’s soybeans. The region also produces half of the state’s sheep and lambs, and nearly a third of the state’s milk cows.
Exhibit 30: Southeastern Minnesota’s Contribution to State Crop and Livestock Production
BARLEY 9%
CORN 35%
OATS 33%
SOYBEANS 23%
0.2% Wheat
Southeastern Field Crop Production - 2011 (Percentage of state total based on bushel volume)
CATTLE, COWS, BEEF
20%
CATTLE, COWS, MILK
29%
SHEEP, INCL LAMBS
51%
Southeast MN Livestock Data - Measured in Inventory (Percentage of state total)
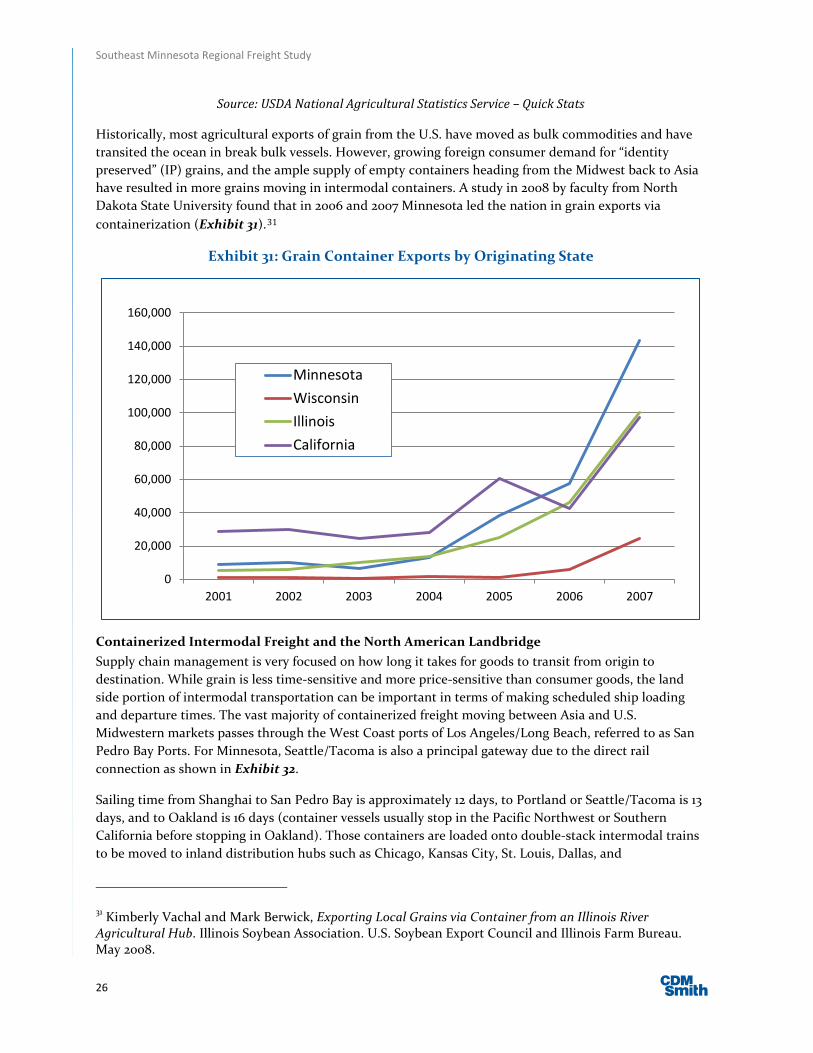
Southeast Minnesota Regional Freight Study
26
Source: USDA National Agricultural Statistics Service – Quick Stats
Historically, most agricultural exports of grain from the U.S. have moved as bulk commodities and have transited the ocean in break bulk vessels. However, growing foreign consumer demand for “identity preserved” (IP) grains, and the ample supply of empty containers heading from the Midwest back to Asia have resulted in more grains moving in intermodal containers. A study in 2008 by faculty from North Dakota State University found that in 2006 and 2007 Minnesota led the nation in grain exports via containerization (Exhibit 31).31
Exhibit 31: Grain Container Exports by Originating State
Containerized Intermodal Freight and the North American Landbridge Supply chain management is very focused on how long it takes for goods to transit from origin to destination. While grain is less time-sensitive and more price-sensitive than consumer goods, the land side portion of intermodal transportation can be important in terms of making scheduled ship loading and departure times. The vast majority of containerized freight moving between Asia and U.S. Midwestern markets passes through the West Coast ports of Los Angeles/Long Beach, referred to as San Pedro Bay Ports. For Minnesota, Seattle/Tacoma is also a principal gateway due to the direct rail connection as shown in Exhibit 32.
Sailing time from Shanghai to San Pedro Bay is approximately 12 days, to Portland or Seattle/Tacoma is 13 days, and to Oakland is 16 days (container vessels usually stop in the Pacific Northwest or Southern California before stopping in Oakland). Those containers are loaded onto double-stack intermodal trains to be moved to inland distribution hubs such as Chicago, Kansas City, St. Louis, Dallas, and
31 Kimberly Vachal and Mark Berwick, Exporting Local Grains via Container from an Illinois River Agricultural Hub. Illinois Soybean Association. U.S. Soybean Export Council and Illinois Farm Bureau. May 2008.
0
20,000
40,000
60,000
80,000
100,000
120,000
140,000
160,000
2001 2002 2003 2004 2005 2006 2007
MinnesotaWisconsinIllinoisCalifornia

Southeast Minnesota Regional Freight Study
27
Minneapolis/St. Paul. Inland distribution hubs serve as gateways to hinterland markets, such as Southeastern Minnesota.
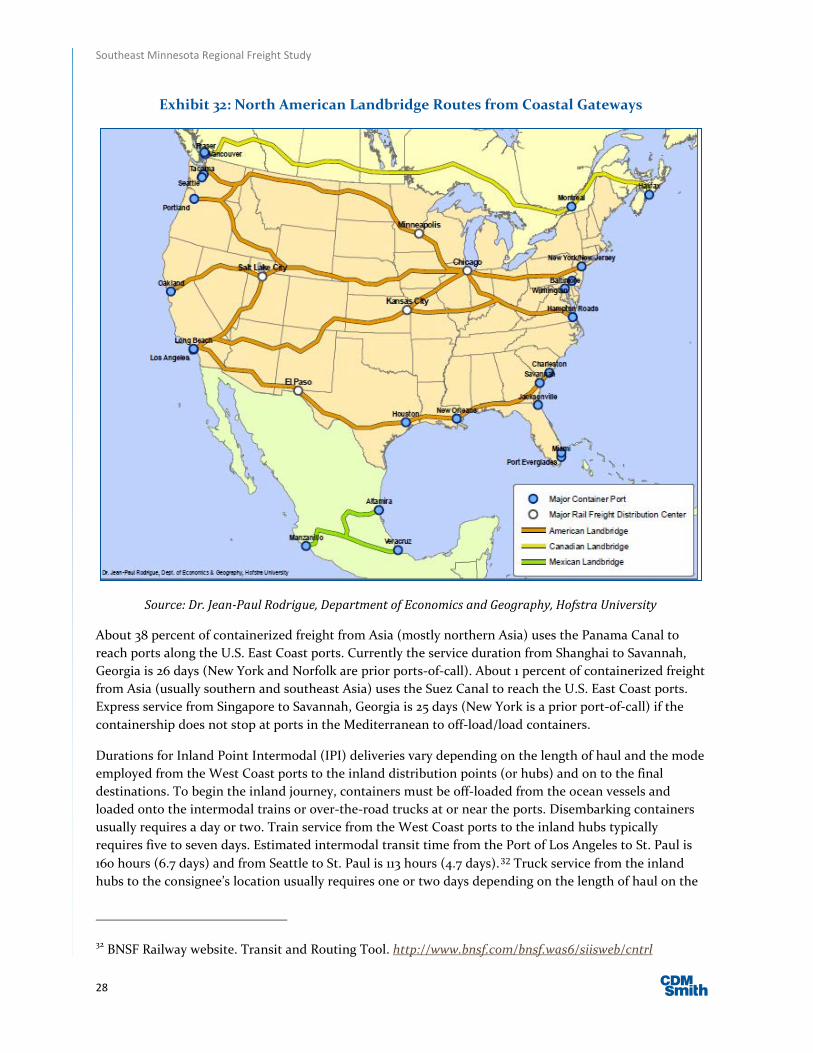
Southeast Minnesota Regional Freight Study
28
Exhibit 32: North American Landbridge Routes from Coastal Gateways
Source: Dr. Jean-Paul Rodrigue, Department of Economics and Geography, Hofstra University
About 38 percent of containerized freight from Asia (mostly northern Asia) uses the Panama Canal to reach ports along the U.S. East Coast ports. Currently the service duration from Shanghai to Savannah, Georgia is 26 days (New York and Norfolk are prior ports-of-call). About 1 percent of containerized freight from Asia (usually southern and southeast Asia) uses the Suez Canal to reach the U.S. East Coast ports. Express service from Singapore to Savannah, Georgia is 25 days (New York is a prior port-of-call) if the containership does not stop at ports in the Mediterranean to off-load/load containers.
Durations for Inland Point Intermodal (IPI) deliveries vary depending on the length of haul and the mode employed from the West Coast ports to the inland distribution points (or hubs) and on to the final destinations. To begin the inland journey, containers must be off-loaded from the ocean vessels and loaded onto the intermodal trains or over-the-road trucks at or near the ports. Disembarking containers usually requires a day or two. Train service from the West Coast ports to the inland hubs typically requires five to seven days. Estimated intermodal transit time from the Port of Los Angeles to St. Paul is 160 hours (6.7 days) and from Seattle to St. Paul is 113 hours (4.7 days).32 Truck service from the inland hubs to the consignee’s location usually requires one or two days depending on the length of haul on the
32 BNSF Railway website. Transit and Routing Tool. http://www.bnsf.com/bnsf.was6/siisweb/cntrl

Southeast Minnesota Regional Freight Study
29
highway. In comparison, express truck service using team-drivers from any of the West Coast ports to most consignee locations in the U.S., although expensive, can be achieved in four to five days.
A relatively recent addition to containerized services from northern Asia to the inland hub of Chicago has to be the introduction of vessel service calling at the Port of Prince Rupert in British Columbia, combined with express intermodal rail service provided by Canadian National Railroad (CN). (Note, this route is not shown on the map in Exhibit 16). Phase I of the service commenced in late 2007 and handled more than 180,000 twenty-foot equivalent units (TEUs) during its first year of operations. It is designed to handle more than 500,000 TEUs. Phase II will enable the port to handle more than 2 million containers per year. Service from Shanghai to Chicago is 18 days (water service from Shanghai to Prince Rupert is 9 ½ days, 1 day for off-loading, 5 ½ days rail duration to Chicago, 1 day rail terminal off-loading, 1 day delivery drayage).
The Impact of the Expanded Panama Canal on Southeastern Minnesota Aside from some industrial products that trade between Minnesota and Europe, it is likely that only a small amount of container freight bound to or departing from Minnesota passes through port facilities on the East Coast. While some Asia trade passes through eastern ports via the Panama Canal, that routing for products moving to or from Minnesota would be very inefficient. East Coast port volumes have grown far slower than has been the case for West Coast ports. One reason for the slower volume growth in the east is that the locks in the Panama Canal limit ship size and the throughput of the canal is limited to approximately 40 vessels per day (14,000 per year). Canal Water Time (CWT), the duration it takes to transit from the Pacific to the Atlantic, averages 15 to 30 hours – including wait time at the locks. The Panama Canal, however, has been a significant gateway for bulk grain movements from the Midwest shipped on the Mississippi River to port facilities in the Gulf Coast (Exhibit 33).
Exhibit 33: U.S. Grain Exports
Southeast Minnesota Regional Freight Study
30
Source: Tim Baird, Jason Bittner, Robert Gollnik and Spencer Gardner33
The Panama Canal Authority is currently expanding the capacity of the Canal, with the completion of new locks scheduled by 2014. The expansion project includes construction of two new sets of locks, one each on the Atlantic and the Pacific sides, as well as the deepening and widening of existing navigation channels. When completed, the expansion will allow for the passage of larger, “post-Panamax” or “New Panamax” vessels. The new lock chambers and expanded channels will accommodate longer, wider and deeper vessels than at present. The container vessels able to transit the expanded Canal will have the capacity of up to approximately 12,000 TEUs, compared to the maximum capacity of about 4,500 TEUs for current Panamax container vessels.
The ability to move more containers or bulk cargo on a given vessel lowers the cost of shipping cargo per TEU (for container trade) or per ton (for bulk trade). The actual amount of cargo that may divert due to Panama Canal expansion will depend on the total cost of the shipment from origin to destination as well as the time sensitivity of the cargo:
“Although there is considerable uncertainty among grain transportation professionals and industry observers on the effects of the Panama Canal expansion, it is likely that the expansion project will result in faster transit times and lower waiting times, lowering the time costs of the all-water route for grain. Growth in grain export volumes from the Pacific Northwest and Gulf Coast is anticipated to outpace California’s volumes, and increasing quantities of specialty grains will be moved in containerized modes. In the longer term, the ability of the new set of locks to move much larger vessels may prove significant to exporters’ decisions to ship grain from Gulf Coast ports. However, limitations on the size of vessels that Gulf and East Coast ports can accommodate will, in the near term, limit opportunities for grain exporters to use post-Panamax bulk and container ships.”34
33 Tim Baird, Jason Bittner, Robert Gollnik and Spencer Gardner. Understanding the Consequences of the Panama Canal Expansion on Midwest Grain and Agricultural Exports. 34 Ibid. Baird, Bittner and Gollnik.
Southeast Minnesota Regional Freight Study
31
DISTRICT 6 SPECIAL REPORTS Frac Sand The emergence of a relevant and significant new commodity market for South East Minnesota, non-metallic minerals production of pure silica sand.
In 2000, several commercially successful oil wells were drilled into deep oil-bearing shale beds at several locations in the United States. These wells used a new large-scale application of existing technologies to exploit what had previously been considered unproducable hydrocarbon deposits. The two key technologies are directional drilling and hydraulic fracturing, the latter of which requires “proppants” to literally prop open hydraulically generated rock fractures to allow free flows of gas and oil. High quality, extremely hard and round granules of silica sand make a very desirable proppant for this application. The largest deposits of this specific grade and type of silica sand exist primarily in Wisconsin, Illinois, and Minnesota.
Shale oil and gas fields are characterized by liquid and gaseous petroleum hydrocarbons literally locked into what is normally considered a dense and impermeable rock matrix of sedimental shale. The impermeability of the continuous beds of shale deep underground mean that the trapped hydrocarbons cannot migrate to permeable “traps” or “domes” that would collect and concentrate the upwardly-migrating oil and gas into conventional oil deposits. These concentrated pockets of oil are similar to all of the oil fields prospected for and developed since the 1859 Drake well was drilled in Pennsylvania, signaling the start of the modern petroleum industry.
Other “unconventional” oil sources have been exploited over the last century as temporary shortages or new techniques have suggested the economic viability of other sources. Several of these attempts include coal gasification, refining of mined oil shale, and refining oil and tar sands. Of these various attempts at economic oil production, only the open-pit mining of tar sands, particularly in Canada, has been successful. The advent of shale oil and gas drilling has significantly changed the entire face of petroleum production in North America and around the world. A notable outcome has been the discussion of energy independence for the United States from imported petroleum for the first time since the U.S. became a net importer of oil in the late 1950’s. Projected recoverable oil deposits in North American shale beds may be greater than all the oil in known conventional deposits in the Middle East. This has very positive ramifications for the U.S. concerning our long term balance of trade and geopolitical dependence on vulnerable oil sources and trade routes, while also having potentially negative impacts on developing alternative, environmentally friendly energy sources.
Figure 1: United States Shale Oil and Gas Fields
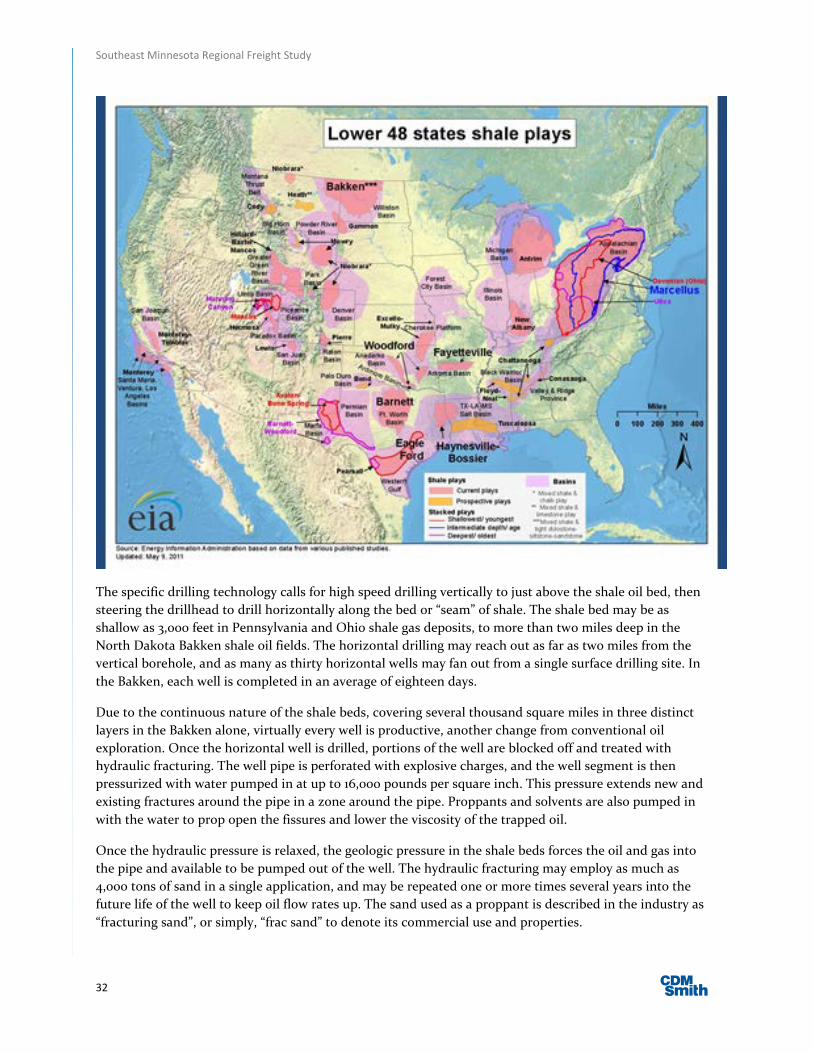
Southeast Minnesota Regional Freight Study
32
The specific drilling technology calls for high speed drilling vertically to just above the shale oil bed, then steering the drillhead to drill horizontally along the bed or “seam” of shale. The shale bed may be as shallow as 3,000 feet in Pennsylvania and Ohio shale gas deposits, to more than two miles deep in the North Dakota Bakken shale oil fields. The horizontal drilling may reach out as far as two miles from the vertical borehole, and as many as thirty horizontal wells may fan out from a single surface drilling site. In the Bakken, each well is completed in an average of eighteen days.
Due to the continuous nature of the shale beds, covering several thousand square miles in three distinct layers in the Bakken alone, virtually every well is productive, another change from conventional oil exploration. Once the horizontal well is drilled, portions of the well are blocked off and treated with hydraulic fracturing. The well pipe is perforated with explosive charges, and the well segment is then pressurized with water pumped in at up to 16,000 pounds per square inch. This pressure extends new and existing fractures around the pipe in a zone around the pipe. Proppants and solvents are also pumped in with the water to prop open the fissures and lower the viscosity of the trapped oil.
Once the hydraulic pressure is relaxed, the geologic pressure in the shale beds forces the oil and gas into the pipe and available to be pumped out of the well. The hydraulic fracturing may employ as much as 4,000 tons of sand in a single application, and may be repeated one or more times several years into the future life of the well to keep oil flow rates up. The sand used as a proppant is described in the industry as “fracturing sand”, or simply, “frac sand” to denote its commercial use and properties.
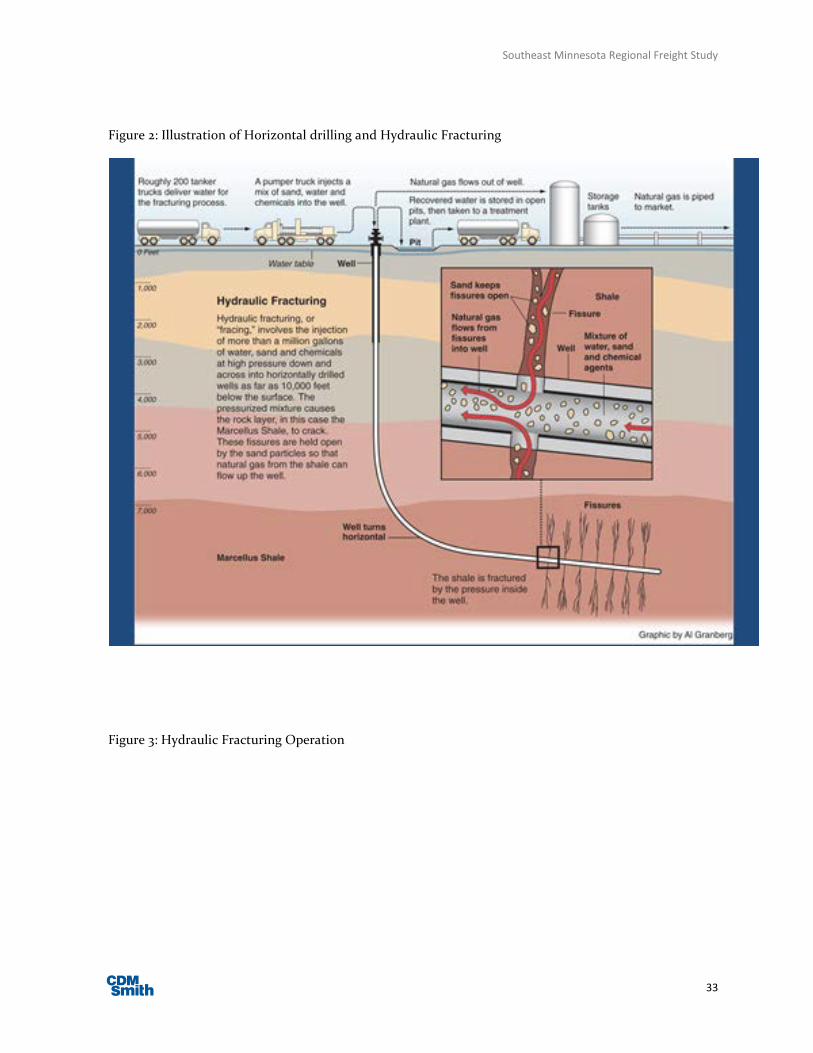
Southeast Minnesota Regional Freight Study
33
Figure 2: Illustration of Horizontal drilling and Hydraulic Fracturing
Figure 3: Hydraulic Fracturing Operation
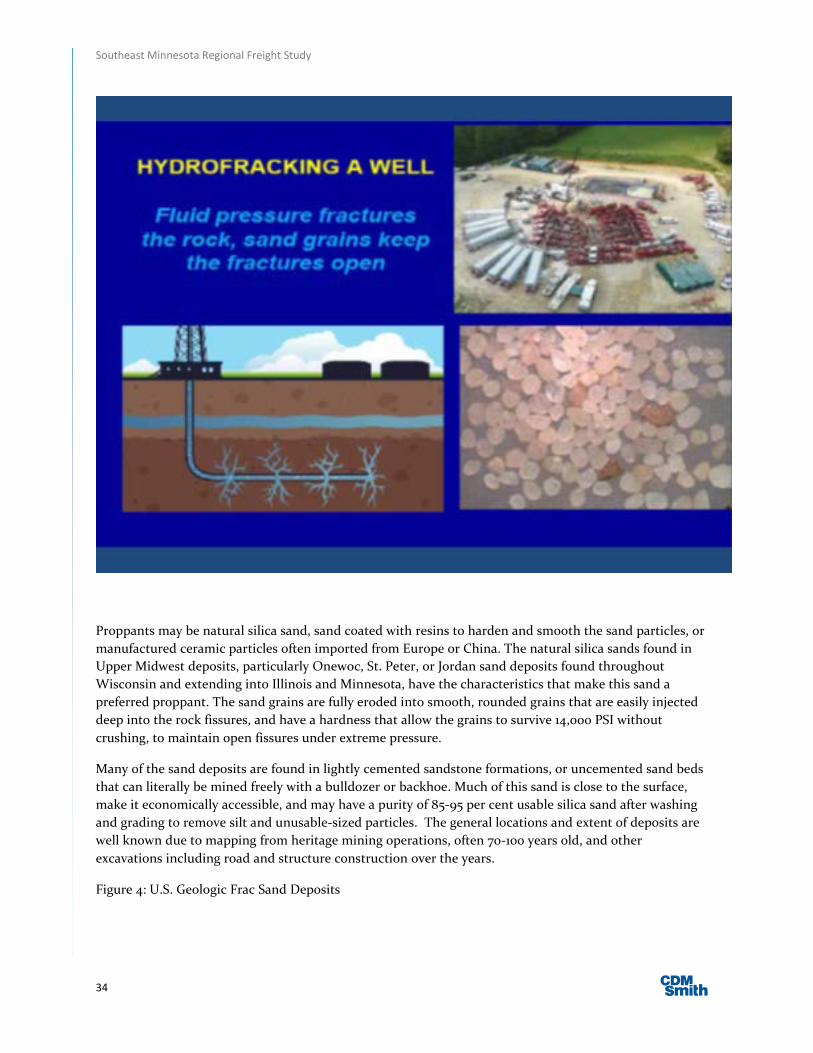
Southeast Minnesota Regional Freight Study
34
Proppants may be natural silica sand, sand coated with resins to harden and smooth the sand particles, or manufactured ceramic particles often imported from Europe or China. The natural silica sands found in Upper Midwest deposits, particularly Onewoc, St. Peter, or Jordan sand deposits found throughout Wisconsin and extending into Illinois and Minnesota, have the characteristics that make this sand a preferred proppant. The sand grains are fully eroded into smooth, rounded grains that are easily injected deep into the rock fissures, and have a hardness that allow the grains to survive 14,000 PSI without crushing, to maintain open fissures under extreme pressure.
Many of the sand deposits are found in lightly cemented sandstone formations, or uncemented sand beds that can literally be mined freely with a bulldozer or backhoe. Much of this sand is close to the surface, make it economically accessible, and may have a purity of 85-95 per cent usable silica sand after washing and grading to remove silt and unusable-sized particles. The general locations and extent of deposits are well known due to mapping from heritage mining operations, often 70-100 years old, and other excavations including road and structure construction over the years.
Figure 4: U.S. Geologic Frac Sand Deposits
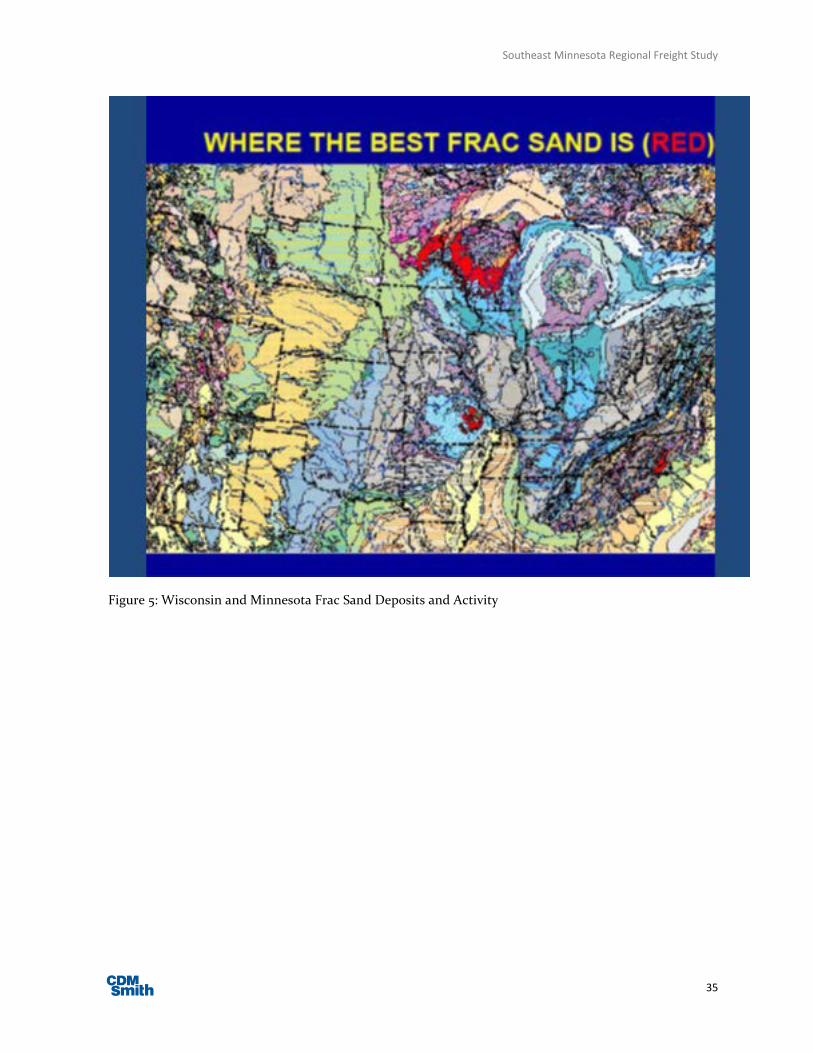
Southeast Minnesota Regional Freight Study
35
Figure 5: Wisconsin and Minnesota Frac Sand Deposits and Activity
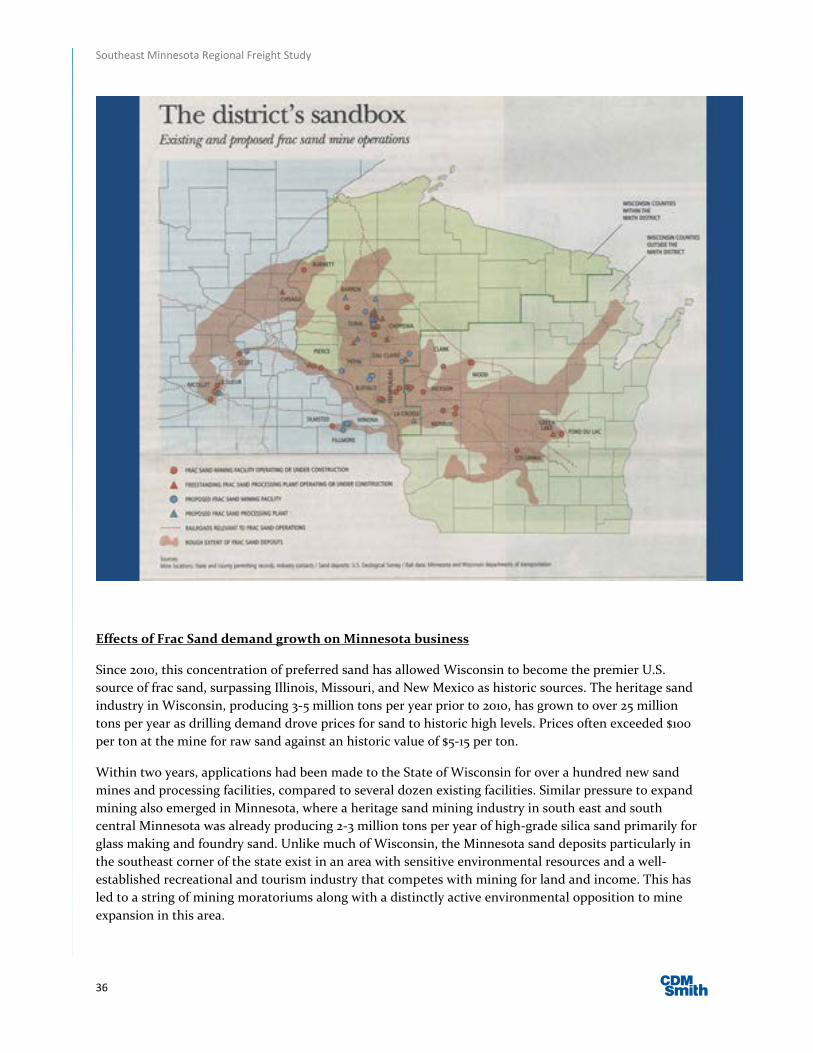
Southeast Minnesota Regional Freight Study
36
Effects of Frac Sand demand growth on Minnesota business
Since 2010, this concentration of preferred sand has allowed Wisconsin to become the premier U.S. source of frac sand, surpassing Illinois, Missouri, and New Mexico as historic sources. The heritage sand industry in Wisconsin, producing 3-5 million tons per year prior to 2010, has grown to over 25 million tons per year as drilling demand drove prices for sand to historic high levels. Prices often exceeded $100 per ton at the mine for raw sand against an historic value of $5-15 per ton.
Within two years, applications had been made to the State of Wisconsin for over a hundred new sand mines and processing facilities, compared to several dozen existing facilities. Similar pressure to expand mining also emerged in Minnesota, where a heritage sand mining industry in south east and south central Minnesota was already producing 2-3 million tons per year of high-grade silica sand primarily for glass making and foundry sand. Unlike much of Wisconsin, the Minnesota sand deposits particularly in the southeast corner of the state exist in an area with sensitive environmental resources and a well-established recreational and tourism industry that competes with mining for land and income. This has led to a string of mining moratoriums along with a distinctly active environmental opposition to mine expansion in this area.
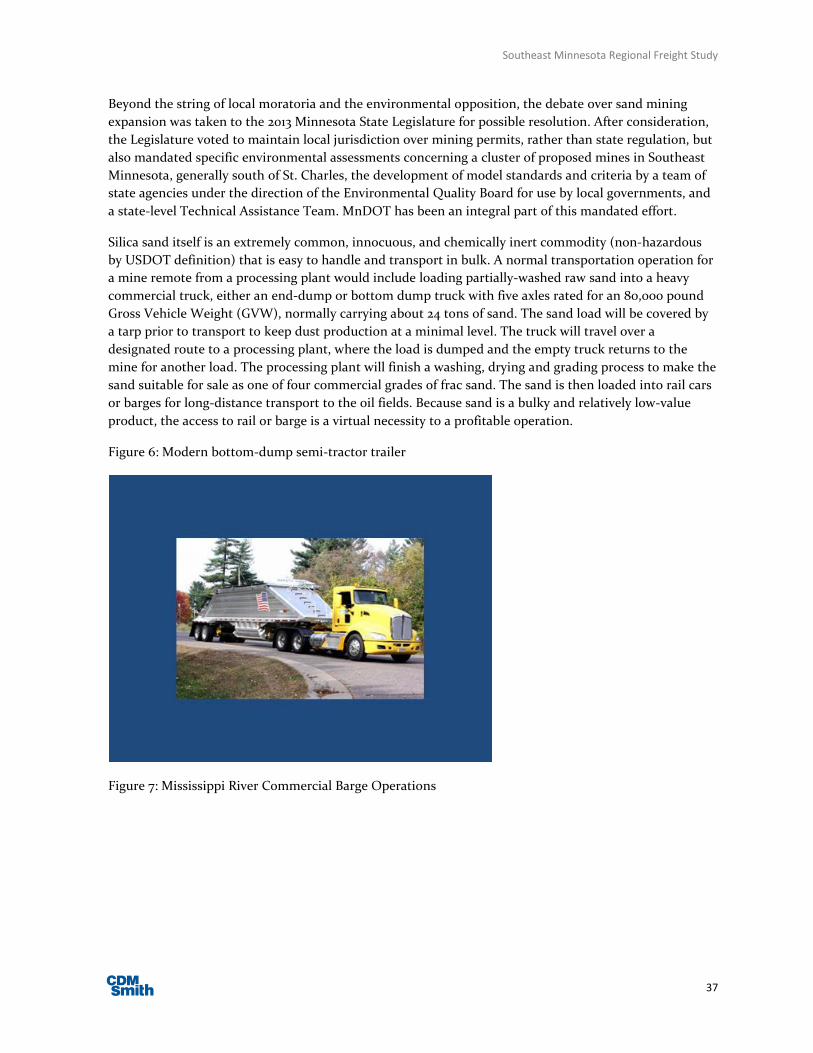
Southeast Minnesota Regional Freight Study
37
Beyond the string of local moratoria and the environmental opposition, the debate over sand mining expansion was taken to the 2013 Minnesota State Legislature for possible resolution. After consideration, the Legislature voted to maintain local jurisdiction over mining permits, rather than state regulation, but also mandated specific environmental assessments concerning a cluster of proposed mines in Southeast Minnesota, generally south of St. Charles, the development of model standards and criteria by a team of state agencies under the direction of the Environmental Quality Board for use by local governments, and a state-level Technical Assistance Team. MnDOT has been an integral part of this mandated effort.
Silica sand itself is an extremely common, innocuous, and chemically inert commodity (non-hazardous by USDOT definition) that is easy to handle and transport in bulk. A normal transportation operation for a mine remote from a processing plant would include loading partially-washed raw sand into a heavy commercial truck, either an end-dump or bottom dump truck with five axles rated for an 80,000 pound Gross Vehicle Weight (GVW), normally carrying about 24 tons of sand. The sand load will be covered by a tarp prior to transport to keep dust production at a minimal level. The truck will travel over a designated route to a processing plant, where the load is dumped and the empty truck returns to the mine for another load. The processing plant will finish a washing, drying and grading process to make the sand suitable for sale as one of four commercial grades of frac sand. The sand is then loaded into rail cars or barges for long-distance transport to the oil fields. Because sand is a bulky and relatively low-value product, the access to rail or barge is a virtual necessity to a profitable operation.
Figure 6: Modern bottom-dump semi-tractor trailer
Figure 7: Mississippi River Commercial Barge Operations
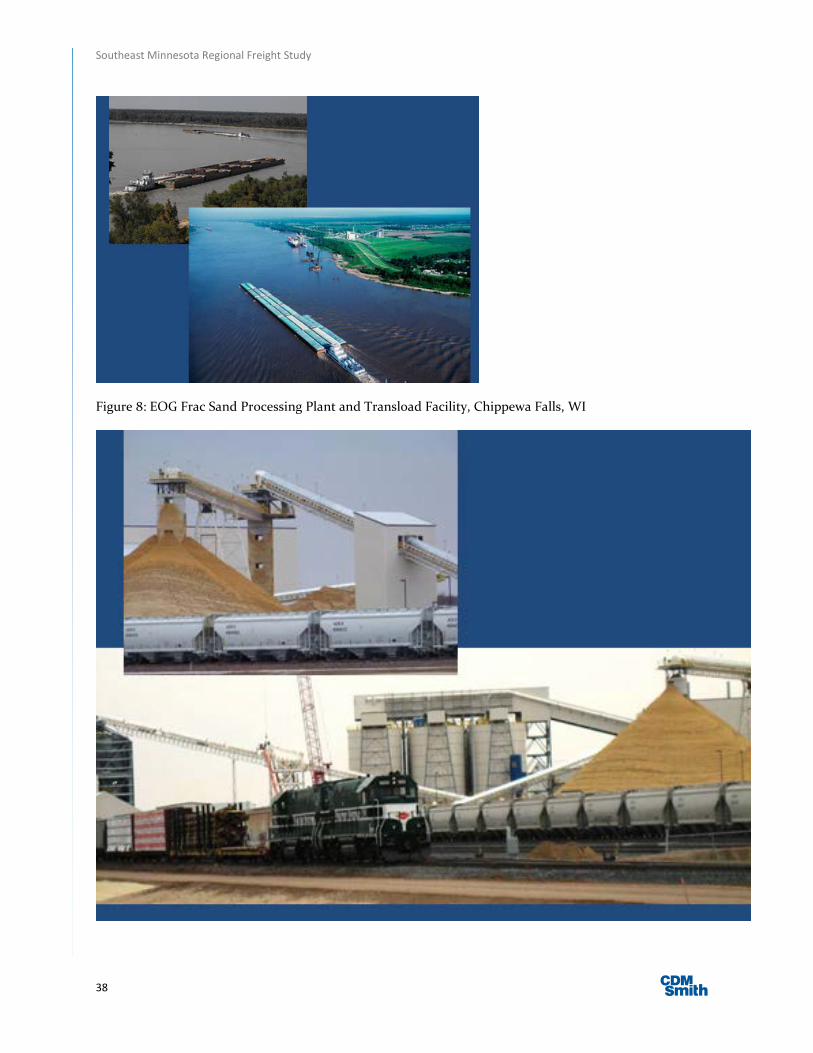
Southeast Minnesota Regional Freight Study
38
Figure 8: EOG Frac Sand Processing Plant and Transload Facility, Chippewa Falls, WI
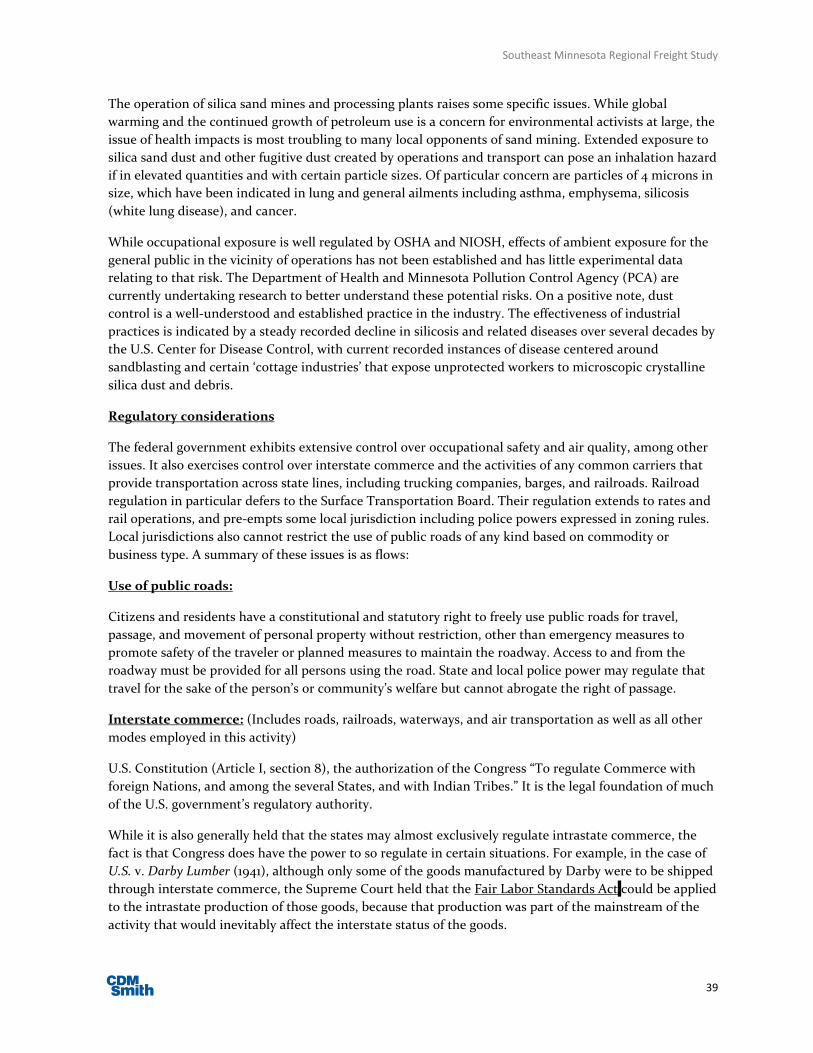
Southeast Minnesota Regional Freight Study
39
The operation of silica sand mines and processing plants raises some specific issues. While global warming and the continued growth of petroleum use is a concern for environmental activists at large, the issue of health impacts is most troubling to many local opponents of sand mining. Extended exposure to silica sand dust and other fugitive dust created by operations and transport can pose an inhalation hazard if in elevated quantities and with certain particle sizes. Of particular concern are particles of 4 microns in size, which have been indicated in lung and general ailments including asthma, emphysema, silicosis (white lung disease), and cancer.
While occupational exposure is well regulated by OSHA and NIOSH, effects of ambient exposure for the general public in the vicinity of operations has not been established and has little experimental data relating to that risk. The Department of Health and Minnesota Pollution Control Agency (PCA) are currently undertaking research to better understand these potential risks. On a positive note, dust control is a well-understood and established practice in the industry. The effectiveness of industrial practices is indicated by a steady recorded decline in silicosis and related diseases over several decades by the U.S. Center for Disease Control, with current recorded instances of disease centered around sandblasting and certain ‘cottage industries’ that expose unprotected workers to microscopic crystalline silica dust and debris.
Regulatory considerations
The federal government exhibits extensive control over occupational safety and air quality, among other issues. It also exercises control over interstate commerce and the activities of any common carriers that provide transportation across state lines, including trucking companies, barges, and railroads. Railroad regulation in particular defers to the Surface Transportation Board. Their regulation extends to rates and rail operations, and pre-empts some local jurisdiction including police powers expressed in zoning rules. Local jurisdictions also cannot restrict the use of public roads of any kind based on commodity or business type. A summary of these issues is as flows:
Use of public roads:
Citizens and residents have a constitutional and statutory right to freely use public roads for travel, passage, and movement of personal property without restriction, other than emergency measures to promote safety of the traveler or planned measures to maintain the roadway. Access to and from the roadway must be provided for all persons using the road. State and local police power may regulate that travel for the sake of the person’s or community’s welfare but cannot abrogate the right of passage.
Interstate commerce: (Includes roads, railroads, waterways, and air transportation as well as all other modes employed in this activity)
U.S. Constitution (Article I, section 8), the authorization of the Congress “To regulate Commerce with foreign Nations, and among the several States, and with Indian Tribes.” It is the legal foundation of much of the U.S. government’s regulatory authority.
While it is also generally held that the states may almost exclusively regulate intrastate commerce, the fact is that Congress does have the power to so regulate in certain situations. For example, in the case of U.S. v. Darby Lumber (1941), although only some of the goods manufactured by Darby were to be shipped through interstate commerce, the Supreme Court held that the Fair Labor Standards Act could be applied to the intrastate production of those goods, because that production was part of the mainstream of the activity that would inevitably affect the interstate status of the goods.
Southeast Minnesota Regional Freight Study
40
This was a departure from earlier instances in which the court had been more likely to invest the states with implied powers of regulation that were not to be impeded by the federal government; for example, in Cooley v. Board of Wardens of the Port of Philadelphia (1852), the state of Pennsylvania held that it had the right, under the act of 1789, to regulate matters concerning pilots on its waterways, including the port of Philadelphia. The court agreed that Congress had never intended to deprive the states of all power to regulate commerce, and where no such federal legislation exists, the states retain this power until Congress, at a later date, enacts further legislation to restrict them.
Road Wear and Safety
Besides the air quality issue of dust production, two other direct transportation issues relate to road wear and safety. Road wear, unlike most heavy commercial traffic generators like distribution centers, elevators, and quarries that have a dispersed traffic pattern radiating away from the generator, is normally concentrated on a single truck route between the mine site and the processing or transload plant. This intensive and continuous use over several years can literally destroy a lightly designed and constructed local road, up to and including road structure and bridge collapse.
This same effect is not considered a problem for most heavily constructed state and federal roads and bridges, but can become a disastrous financial and transportation impact on a local jurisdiction if special compensation is not provided. Minnesota has established information on road wear and costs, thanks to research undertaken as a result of road impacts occurring during installation of multiple wind generators in the southeast and southwest regions of the state.
The Minnesota County Engineers Association (MCEA) commissioned a study by the Local Road Research Board (LRRB) and Mankato State University to determine allocatable costs for heavy truck use on light-duty roads. They quantified the cost impacts of overloads as well as normal heavy truck traffic, measured in Equivalent Single Axle Loadings or ESAL’s. A normal legal heavy commercial truck with a full load may have an ESAL of 1.8, and a light car may have an ESAL of .001, while an overloaded truck even if moving under special permit may have an ESAL of 2-8 or more. This measure is contained in a Cost Calculator developed from the research and available to local road users and engineers on MnDOT’s public website.
The ESAL effects, coupled with an engineering assessment based on a road’s design life, can be the grounds for determining the actual cost per ton mile of an intensive use such as a mine-to-plant haul. The haul route may see from 50 to 250 loaded trucks per day. As a comparison, Wisconsin DOT has recorded an average of 70 loads per day being generated by the average Wisconsin mine. On a lightly constructed road, this wear may induce a cost of up to 22 cents per ton per mile to repair or replace the road and structures. A normal local road budget for a county or a township may average as little as $25,000 per mile per year for replacement, and a an aggregate removal tax available to counties may generate 15 cents per ton, regardless of length of haul or road condition. Either revenue source is inadequate for the local jurisdiction in an intensive road wear situation, and the aggregate tax may also disqualify the local jurisdiction from pursuing any other compensation agreement to keep the road open.
Based on industry practice in Wisconsin, Ohio, and Pennsylvania as well as other states, a negotiated agreement between the sand operator and the local government may be used to compensate for the actual wear. Whether a Road Use Maintenance Agreement (RUMA), lump sum payments, or cost sharing for road crews and projects, the negotiated compensation will serve to keep the local jurisdiction financially whole and guarantee continued transportation access for the mine owner. In consultation with both Wisconsin and Minnesota county engineers, and expressed most clearly by Winona County recommendations, the basic concept is “to cover fully allocated expenses by payment or fee under a
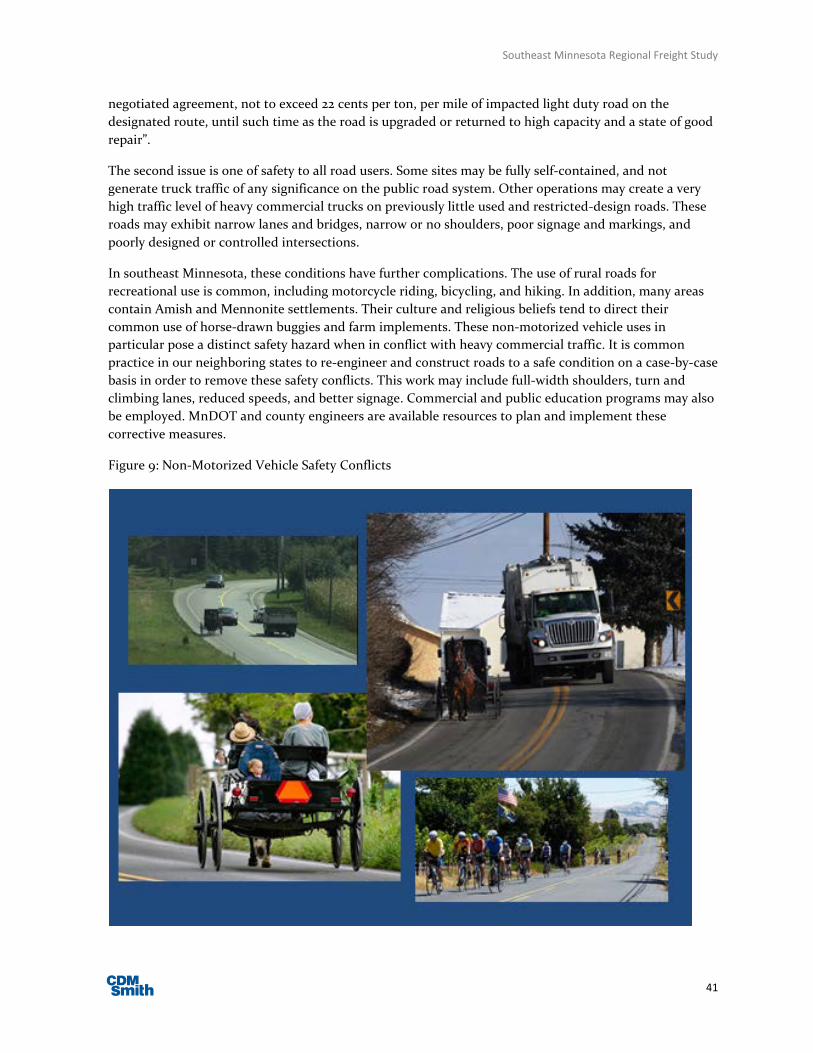
Southeast Minnesota Regional Freight Study
41
negotiated agreement, not to exceed 22 cents per ton, per mile of impacted light duty road on the designated route, until such time as the road is upgraded or returned to high capacity and a state of good repair”.
The second issue is one of safety to all road users. Some sites may be fully self-contained, and not generate truck traffic of any significance on the public road system. Other operations may create a very high traffic level of heavy commercial trucks on previously little used and restricted-design roads. These roads may exhibit narrow lanes and bridges, narrow or no shoulders, poor signage and markings, and poorly designed or controlled intersections.
In southeast Minnesota, these conditions have further complications. The use of rural roads for recreational use is common, including motorcycle riding, bicycling, and hiking. In addition, many areas contain Amish and Mennonite settlements. Their culture and religious beliefs tend to direct their common use of horse-drawn buggies and farm implements. These non-motorized vehicle uses in particular pose a distinct safety hazard when in conflict with heavy commercial traffic. It is common practice in our neighboring states to re-engineer and construct roads to a safe condition on a case-by-case basis in order to remove these safety conflicts. This work may include full-width shoulders, turn and climbing lanes, reduced speeds, and better signage. Commercial and public education programs may also be employed. MnDOT and county engineers are available resources to plan and implement these corrective measures.
Figure 9: Non-Motorized Vehicle Safety Conflicts
Southeast Minnesota Regional Freight Study
42
Minnesota DOT has established position papers on the issue of frac sand transportation that summarizes much of this information. It is reproduced below. An additional source of more detailed information is MnDOT’s public website, under “Freight Planning”. Finally, the EQB public website contains a resource library and the Model Standards that the inter-agency task force has developed.
“Silica (Frac) Sand Mining and Processing: Background and Issues Involved in Transportation”: Minnesota Department of Transportation
The recent technological innovations that have allowed the oil industry to exploit massive oil and gas deposits in deep shale formations within the U.S. have already created major impacts, reducing our dependence on foreign oil and dropping natural gas prices. Hydraulic fracturing, using sand to prop open artificial fissures in the shale, depends heavily on special grade sands that exist in Illinois, Wisconsin, and Minnesota. While Wisconsin already has 10 times the mining activity of Minnesota, state residents here have valid concerns around this rapid expansion of non-metallic mineral production and its transport. MnDOT is addressing a specific set of issues that as follows:
• Transportation safety is a significant impact resulting from frequent heavy truck and rail trips, and is being addressed in road design, traffic safety, and grade crossing safety initiatives.
• Local, light duty roads are being most rapidly and directly impacted by concentrated truck traffic. Local jurisdictions have limited resources to react to the damage, but are negotiating through use permits for private sector compensation.
• Based on experience, observation, and required mitigation, the environmental and occupational safety issues associated with sand transport and processing appear both minimal and manageable through current best practices.
1) Impacts on federal, state trunk, and state aid roadways and bridges
The average silica sand mining operation will move from 250,000 to a million tons of sand per year to a processing and shipping facility, via a prescribed route determined by directness and highway condition and capacity. This equates to a concentrated flow of heavy trucks totaling 70-250 truck trips per day, with half loaded to a full 80,000 pounds GVW.
a) Identified traffic routes and volumes are usually determined in consultation with local road authorities and MnDOT. Road capacity to handle the new traffic and current traffic levels are derived from existing data.
b) Wear produced by concentrated traffic is determined based on design standards and life of a specific road versus the new traffic. County engineers in concert with MnDOT State Aid and engineers have determined benchmark wear impacts and costs.
c) MnDOT and County engineers have authority over road designs, safety configurations, and programmed maintenance.
d) Non-programmed funding for sand-associated repairs on light duty roads is most commonly negotiated between mining interests and local officials. The Federal and State trunk highway system is generally able to handle the increased traffic without significant immediate impact. Because these are public thoroughfares with users engaged in traffic crossing jurisdictional boundaries, including interstate commerce, specific commodity or industry targeted user fees are
Southeast Minnesota Regional Freight Study
43
normally not allowed for non-permit loads. Funding thus is usually attached to mining and conditional use permit fee structures.
2) MnDOT District representatives coordinate with local and county engineers and officials on similar road upkeep issues.
The greatest immediate impacts to mine operations and concentrated heavy truck traffic occur on Local Township and county roads designed for low traffic volumes and 5-9 ton axle loadings. Normal highway funding available to these governmental units is far from adequate to offset the new and immediate needs for road repair and rebuilds. Serious road degradation may occur in the first 1-3 years, versus a life of the mining operations that is expected to extend for 5-30 years.
Minnesota state law allows counties to levy a 15 cent per ton aggregate extraction tax to offset road wear and maintenance issues, but the impacts of intensive, fixed route heavy commercial truck traffic on the scale of silica sand mining operations implemented in this industry far outstrip this revenue source. Research commissioned by the Local Road Research Board (LRRB) and conducted by Mankato State University Department of Engineering quantified the Equivalent Single Axle Load (ESAL) impacts on road life given a specified current condition and design life and suggested a realistic road use fee of 22 cents per ton- mile. The research and a fee calculator was endorsed by the Minnesota County Engineers Association (MCEA) and subsequently posted as a resource on the public MnDOT website.
The Winona County Silica Sand Task Force further refined this fee structure as applied to silica sand trucking to be collected specifically over the mileage of roads identified as deficient in condition or structure, and collected only until such time as the impacted route is brought up to full ten-ton standards. MnDOT OFCVO, MnDOT District 6 Area Transportation Partnership (ATP) and other area highway engineers and officials support this approach to determining negotiated highway impact fees, as well as supplemental lump sum payments, special maintenance cost assessments, and ongoing communication and review between local government and private operator representatives.
3) Regulation of trucks (commercial vehicle operations)
MnDOT is charged with administering and enforcing both state and federal commercial vehicle safety regulations, including inspections and audits. Regulatory and statutory direction also covers several areas that directly apply to silica sand transport.
a) Tarping of loads and other dust prevention; All trucks hauling commodities subject to blowing or dust production, including sand and gravel, must be covered by full tarps at all times on Federal and State highways, and at any speeds over 30 MPH on local Minnesota roads, compliant with M.S.169.81.
b) Condition of equipment must be maintained by the operator at all times to insure safe operations of the vehicle and to minimize risk and impacts to other traffic. This includes condition of tires, brakes, signals, operating controls, installed safety equipment, and potential for spill or leakage of commodities.
c) Legal weight loadings must be observed at all times, to minimize and control wear on roads and bridges. Sand transporters are limited to the default weight limits of 80,000 pounds GVW on five axles without exception. DPS may enforce these limits through ticketing and fines, and both DPS and MnDOT provide safety data to the national driver and carrier data bases, which may trigger
Southeast Minnesota Regional Freight Study
44
probation or suspension of driver and carrier licensing. MnDOT maintains strategically located Weigh-In-Motion scales and cameras to provide observation and protection of key infrastructure, including major bridges, to monitor operations within legal limits.
4) General highway safety, both motorized vehicle and non-motorized shared use on identified mine-haul routes
MnDOT and local authorities have a direct responsibility for the safety of all highway users. Heavy truck traffic on a historically light-use road has the potential to significantly increase safety risks for other users, in particular non-motorized use.
a) Pedestrian, bicycle, and horse & buggy conflicts have been identified in the potential mining areas due to the presence of heavy recreational uses in the region, and local communities such as the Amish who by choice use horse and buggy for normal transportation. Unless specific allowances are made in traffic routing or road design, such as adequate shoulder widths, sight lines, warning signage, and speed limits, these conflicting uses may increase the incidence of serious or fatal accidents.
b) Safety mitigation by design is being pursued by MnDOT and local engineers and road authorities; truck climbing lanes, turn and queuing lanes, shoulders, use separations (trails and paths), and proper signage and signaling all need to be considered to maintain or improve the highway safety environment.
c) Signage and awareness campaigns, trucker advisements, and other educational efforts also fall under the responsibility of MnDOT and local partners to mitigate possible impacts.
5) Rail grade-crossing safety, particularly at processing plants or trans-load sites
Besides commercial truck traffic, major frac sand operations ship virtually all of their production by railroad to the end users in the oil fields. A single site may generate 1-5 full unit trains of 100-125 cars per week, plus return trips, significantly raising the level of road/rail conflicts in many of these rural areas, and adding noticeable rail traffic in urban areas. MnDOT administers the state and federally funded rail grade crossing safety program.
MnDOT is responsible for determining the adequacy and the selection of grade crossing warning devices throughout the state. Additional tracks through existing crossings and creation of new highway rail grade crossings must receive approval from MnDOT prior to use. Significant additional truck traffic over existing crossings may warrant consideration of additional warning devices such as flashing lights and gates, cantilevers and traffic signals.
6) Branch and short line rail upgrades and funding to improve rail condition and safety
Minnesota, along with Wisconsin and Iowa, have a historic record of proactively working to preserve and upgrade local, low-volume rail lines in order to insure market access for rail-oriented and bulk materials, thus supporting the economic vitality of rural communities. New mine operations and processing plants have the potential of pumping tens of millions of dollars per year into the local economy, but require rail access to be economic.
a) Minnesota Rail Service Improvement (MRSI) program has been the state’s vehicle for offering low-interest loans and earmarked grants to local shippers and railroad short lines, to maintain
Southeast Minnesota Regional Freight Study
45
and upgrade lines and promote rail shipping. It is administered by MnDOT Office of Freight & Commercial Vehicle Operations (OFCVO).
7) Rail safety and operations regulation
Rail safety inspection and regulation is authorized to MnDOT to a limited degree by statute and by agreement with the Federal Railroad Administration (FRA)
a) Safety coordination is performed with FRA and state inspectors in safety inspections, hazardous materials handling, infrastructure condition, highway overpass and grade crossing construction, and accident investigation.
b) Regulation of commodity handling, safety, and rates defers to Federal jurisdiction due to its status as interstate commerce. This includes Surface Transportation Board federal commerce regulation, design and safety regulation, and all OSHA and EPA regulations that apply.
8) Responses to transportation-specific inquiries and allegations re: silica sand handling and transport
a) USDOT Hazardous Materials definitions and regulations apply to transportation of silica sand and support materials. This includes advice published in Emergency Response Guidebooks and Material Safety Data Sheets. Silica sand is a dry bulk material easily handled by mechanical devices and shipped in basic open or closed trucks, barges, and hopper cars. Material is chemically inert, and considered non-hazardous. Health hazard limited to gross inhalation of particles or dust. ERG2004, USDOT Research and Special Programs Administration, Office of Hazardous Materials Initiatives and Training (DHM-50); OSHA 29CFR; EPA 40CFR.
b) Material Safety Data Sheet (SMS) definitions note silica sand as an inhalation hazard particularly in occupational exposure. Regular dust inhalation may cause extended health impacts such as asthma and silicosis. Gross inhalation (large volumes, and in dangerous configurations such as sand blasting or rock dust products) may cause immediate distress and injury. MnDOT is tasked in first responder roles to access, provide, and respond in kind to this Haz-Mat data.
c) Handling and transport customs and practices for silica sand are based on proven and routine operations. Efficient handling of large bulk quantities, worker safety, and dust prevention are earmarks of these efforts.
1. Raw sand for frac sand use is characterized by a consistently high percentage of eroded quartzite particles (almost pure SiO2), with less than 20% clays and fines needing separation and less than 1% respirable materials smaller than PM10 (10 microns or less in diameter). The high-quartz content sand grains inherent in this area that are suitable for proppants have a very high hardness rating, able to resist fracturing or crushing at pressures above 12,000 pounds per square inch. This characteristic minimizes dusting caused by contact with machinery surfaces during handling. Moisture content of the mined sand generally runs from 5-8%, aiding handling and naturally binding dust into the mix. The raw mined sand may in certain instances be transferred directly to open hoppers for rail transport to remote processing plants, with the moisture content and consistency of the material and limited train speeds limiting dust propagation during transport.
Southeast Minnesota Regional Freight Study
46
2. Processed frac sand has been washed at a plant to separate clay and fines, dried in bulk kilns to allow sifting and grading, sorted by mesh screens to commercial-spec grain sizes, stored in closed silos, and shipped in covered hoppers to prevent dust production and loss of the commercial product during transport. Workers involved in the drying and sorting processes are intentionally protected from dust respiration by masks, respirators, and protective clothing.
a. Private sector response to transport concerns and other public inquiries are coordinated as appropriate with MnDOT and other jurisdictions, both federal and local. Mining and processing companies in the upper Midwest area have a generally good safety and environmental record, have been responsive to concerns, and are encouraged to continue improving that performance by the government agencies concerned. Ongoing interviews of local officials by MnDOT and WisDOT staff generally confirm this responsiveness to resolving communicated issues and incurred costs.
Occupational safety is important to the corporate viability and profitability of silica sand producers, as is good infrastructure in roads and rail. Center for Disease Control (CDC) has recorded a steady decrease in mortality due to occupational dust exposure, down to 0.66 per million in 2002. Commercial truck drivers transporting the sand, about half the average work force, have a CDC mortality rate of 250 per million, 350 times more hazardous than the effects of silica exposure in the transportation occupations involved. The industry has demonstrated significant strides in worker safety and land reclamation in particular, in response to local concerns and permit regulations where they have been properly established by the local governing bodies.”
River Crossings South East Minnesota is separated from Wisconsin by the Mississippi River, a major geographical feature that serves as state line and active commercial and recreational waterway. While Class I rail mainlines parallel the river on both banks (CP on the west, BNSF on the east), the only rail crossing is the Canadian Pacific bridge between La Crosse, Wisconsin, and La Crescent, Minnesota. This represents and interstate and international link between the Pacific Northwest and Chicago. Highway crossings are much more numerous, and constitute a major direct contributor to the area’s economic health and vitality. Highway crossings exist at Red Wing, Wabasha, Winona, Dresbach (I-90, La Crosse), and La Crescent (La Crosse). These highway bridges are all state or federal highways with operation and maintenance jointly shared between Minnesota DOT and Wisconsin DOT.
With the exception of La Crosse, the Minnesota side of the river is much more heavily populated than the Wisconsin side. Despite that fact, both states are inextricably linked by the river crossings. Wisconsin residents constitute a significant portion of the labor force for Minnesota businesses. According to the cities and the area chambers, 25% of Winona’s labor commutes from Wisconsin daily, while Wabasha reports that a third of their workforce is from Wisconsin. Red Wing reports a similar dependence on Wisconsin commuters. Commercially, Dresbach, Winona, and Red Wing all have notable volumes of heavy commercial truck traffic using the bridges. The I-90 crossing in particular not only is part of the Interstate system, effecting commerce from multiple states, but is also part of Minnesota’s oversize/overweight corridor network. Many of the wind turbine components imported from Europe and
Southeast Minnesota Regional Freight Study
47
landed at Duluth or Milwaukee are transported on this route on their way to south east Minnesota wind farms.
Rail and waterways shipments also utilize the bridges. The Port of Winona is a major generator of cargo shipments for agricultural and industrial commodities, and benefits directly from traffic over the bridge. The private and public terminals in Winona report a consistent growth in Wisconsin agricultural production that moves via rail and water from the Port. Since 2000, the total agricultural tonnage shipped has remained relatively constant, but the portion originating in Wisconsin has grown from a quarter to a half of all bulk grain during the last decade, mostly corn and soybeans.
The silica sand boom, driven by sand use as proppants in hydraulic fracturing of shale oil and gas production in new production fields around the country, has seen a rapid growth of sand processing and export from the Port of Winona, with most of the production of raw sand coming from Wisconsin. While rail shipments were prevalent in 2011-2012, barge shipments have grown steadily over time with 80 barges shipped in 2012 and over 170 barges shipped in 2013. This Port activity, related terminal and trucking employment, and cost-competitive access to distant markets would not be possible without good capacity and uninterrupted connections between product sources and commercial shipping modes and carriers.
Study interviews emphasized the need for uninterrupted and direct access between these neighboring regions. Logistics and trucking firms have located in the area specifically because of route and transportation options. Fastenal, one of the region’s major manufacturers and employers, has a quarter of its labor force and a third of its distribution routes for finished products dependent on daily use of the bridge crossing in Winona. The City of Wabasha and the Port of Red Wing report similar dependence on their river crossings.
The most common comments heard from both Minnesota and Wisconsin stakeholders was concern about upcoming bridge construction. The Dresbach bridge replacement project is underway, and Winona and Red Wing are scheduled for bridge replacements during the next decade. The direct concern from all parties involved was that traffic should not be interrupted during these construction projects. This concern was focused in Winona during the 10-day bridge closure in 2012 for emergency repairs. The disruption created as much as a 60-mile detour situation for many travelers, and would have had significant negative impacts to the city’s economy if it had extended for a longer period. In weighing construction options, MnDOT has chosen to keep the crossing active throughout the term of the project in recognition of its importance to the city’s vitality and the viability of its business community. WisDOT also fully supports this position.
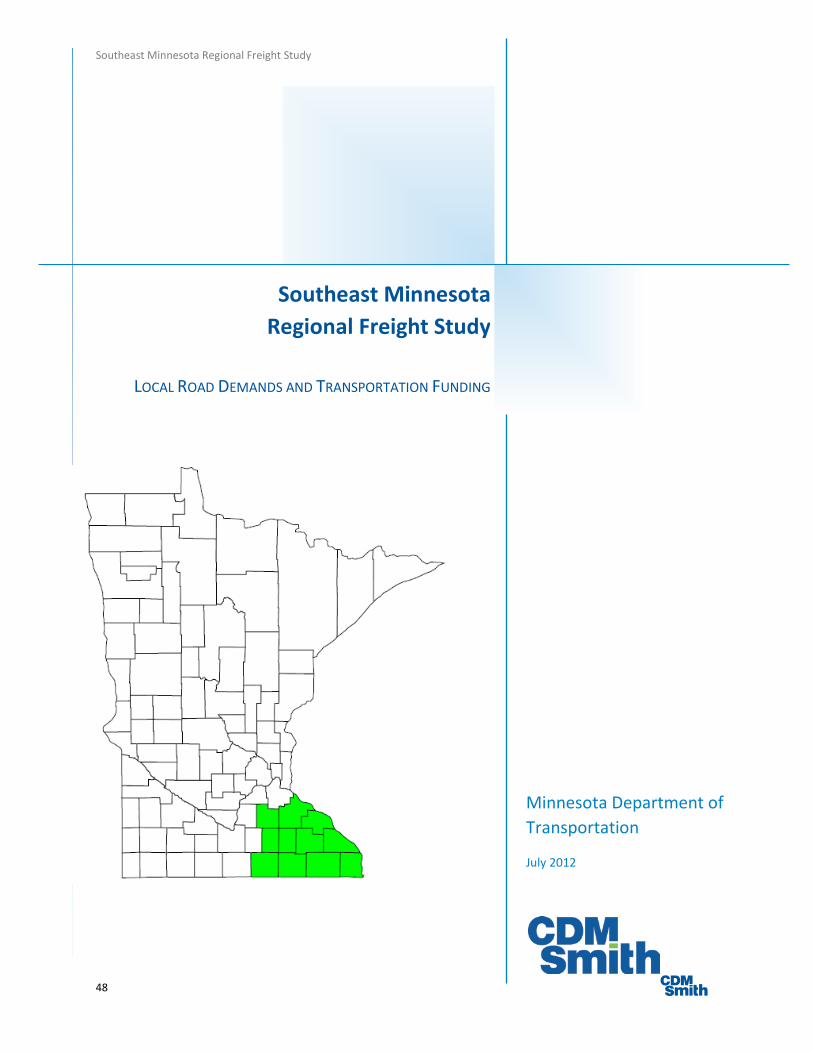
Southeast Minnesota Regional Freight Study
48
Minnesota Department of Transportation
July 2012
Southeast Minnesota Regional Freight Study
LOCAL ROAD DEMANDS AND TRANSPORTATION FUNDING
Southeast Minnesota Regional Freight Study
49
Table of Contents Table of Contents .................................................................................................................................................. 49
List of Exhibits ....................................................................................................................................................... 49
Heavy Loads and Roadway Impacts ..................................................................................................................... 50
Silica Sand: A Potential New Growth Industry for Southeastern Minnesota .................................................. 52
Existing County Regulations and Ordinances ............................................................................................ 52
Summary of Known and Proposed Mining Sites ........................................................................................ 55
Summary of County Regulations on Silica Sand Mining ........................................................................... 56
Transportation Funding: Maintaining Local Roads ........................................................................................... 57
Pavement Performance Basics ...................................................................................................................... 57
Local Road Funding ....................................................................................................................................... 59
Local Road Funding ........................................................................................................................................... 61
Midwestern Diesel Fuel Taxes ..................................................................................................................... 64
Midwestern Overweight Permit Fees .......................................................................................................... 65
Administrative Costs Associated with Various Fee Collection Programs ................................................ 67
Case Studies for Freight Financing ............................................................................................................. 68
Local Road Funding Alternatives ................................................................................................................ 68
References ............................................................................................................................................................... 70
List of Exhibits Exhibit 1: Top Five Originating and Terminating Commodities in SE Minnesota by Tons ........................... 50 Exhibit 2: General Map of Minnesota’s Geology ................................................................................................. 51 Exhibit 3: Summary of Silica Sand Hauling Constraints .................................................................................... 53 Exhibit 4: Existing and Proposed Mine Sites in Southeastern Minnesota ....................................................... 56 Exhibit 5-A: Partially Loaded 5-Axle Tractor Semi-trailer (Class 9 Vehicle) ................................................... 57 Exhibit 5-B: Typical 5-Axle Tractor Semi-trailer (Class 9 Vehicle) ................................................................... 58 Exhibit 5-C: Heavy 5-Axle Tractor Semi-trailer (Class 9 Vehicle) .................................................................... 58 Exhibit 6: Decline in Purchasing Power of Federal Fuel Taxes ......................................................................... 59 Exhibit 7: Actual and Projected Highway Account Receipts, Outlays, and Balances or Shortfalls .............. 60 Exhibit 8: Highway Revenue and Highway Spending by Level of Government .............................................. 62 Exhibit 9: Distribution of State Transportation Revenues ................................................................................ 63 Exhibit 10: Minnesota Lane Miles by Road System ............................................................................................ 63 Exhibit 11: State Imposed Diesel Fuel Tax Rates in Select Midwestern States ................................................ 64 Exhibit 12: Purdue Study Results for Case Study of Annual Permit Fees ......................................................... 65 Exhibit 13: Purdue Case Study Results for Multiple Single Trip Permit Fees .................................................. 67
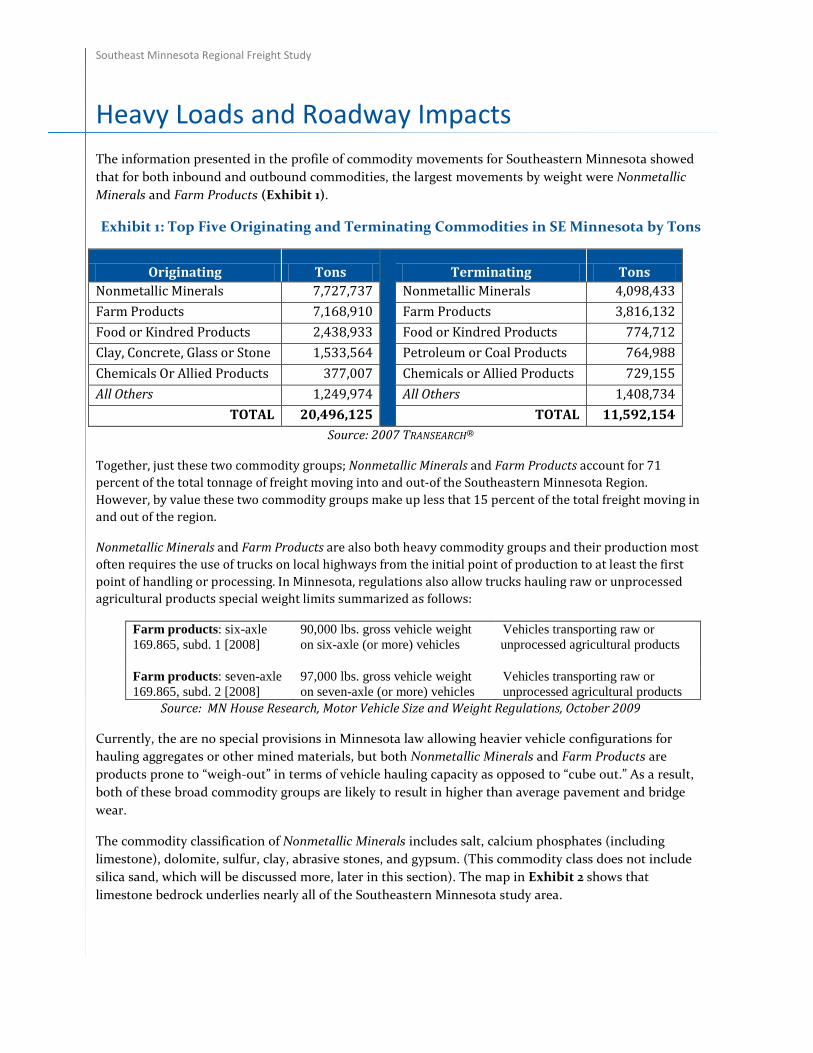
Southeast Minnesota Regional Freight Study
Heavy Loads and Roadway Impacts The information presented in the profile of commodity movements for Southeastern Minnesota showed that for both inbound and outbound commodities, the largest movements by weight were Nonmetallic Minerals and Farm Products (Exhibit 1).
Exhibit 1: Top Five Originating and Terminating Commodities in SE Minnesota by Tons
Originating Tons
Terminating Tons Nonmetallic Minerals 7,727,737 Nonmetallic Minerals 4,098,433 Farm Products 7,168,910 Farm Products 3,816,132 Food or Kindred Products 2,438,933 Food or Kindred Products 774,712 Clay, Concrete, Glass or Stone 1,533,564 Petroleum or Coal Products 764,988 Chemicals Or Allied Products 377,007 Chemicals or Allied Products 729,155 All Others 1,249,974 All Others 1,408,734
TOTAL 20,496,125 TOTAL 11,592,154 Source: 2007 TRANSEARCH®
Together, just these two commodity groups; Nonmetallic Minerals and Farm Products account for 71 percent of the total tonnage of freight moving into and out-of the Southeastern Minnesota Region. However, by value these two commodity groups make up less that 15 percent of the total freight moving in and out of the region.
Nonmetallic Minerals and Farm Products are also both heavy commodity groups and their production most often requires the use of trucks on local highways from the initial point of production to at least the first point of handling or processing. In Minnesota, regulations also allow trucks hauling raw or unprocessed agricultural products special weight limits summarized as follows:
Farm products: six-axle 169.865, subd. 1 [2008]
90,000 lbs. gross vehicle weight on six-axle (or more) vehicles
Vehicles transporting raw or unprocessed agricultural products
Farm products: seven-axle 169.865, subd. 2 [2008]
97,000 lbs. gross vehicle weight on seven-axle (or more) vehicles
Vehicles transporting raw or unprocessed agricultural products
Source: MN House Research, Motor Vehicle Size and Weight Regulations, October 2009
Currently, the are no special provisions in Minnesota law allowing heavier vehicle configurations for hauling aggregates or other mined materials, but both Nonmetallic Minerals and Farm Products are products prone to “weigh-out” in terms of vehicle hauling capacity as opposed to “cube out.” As a result, both of these broad commodity groups are likely to result in higher than average pavement and bridge wear.
The commodity classification of Nonmetallic Minerals includes salt, calcium phosphates (including limestone), dolomite, sulfur, clay, abrasive stones, and gypsum. (This commodity class does not include silica sand, which will be discussed more, later in this section). The map in Exhibit 2 shows that limestone bedrock underlies nearly all of the Southeastern Minnesota study area.
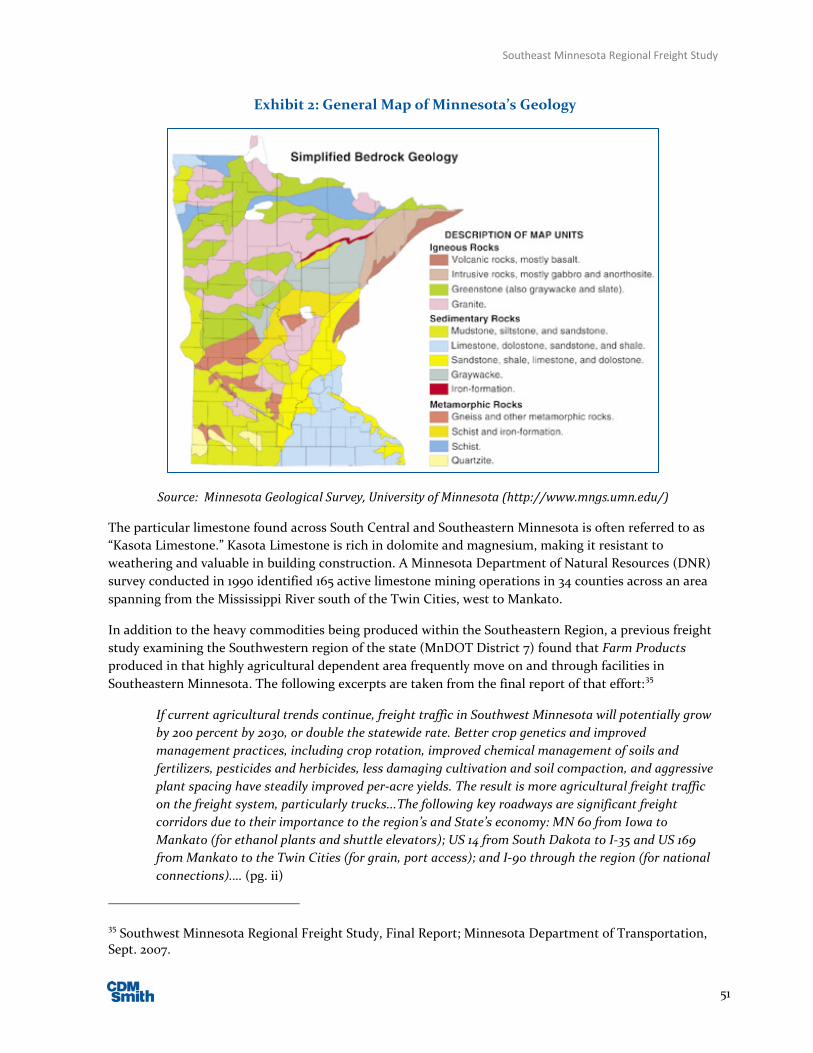
Southeast Minnesota Regional Freight Study
51
Exhibit 2: General Map of Minnesota’s Geology
Source: Minnesota Geological Survey, University of Minnesota (http://www.mngs.umn.edu/)
The particular limestone found across South Central and Southeastern Minnesota is often referred to as “Kasota Limestone.” Kasota Limestone is rich in dolomite and magnesium, making it resistant to weathering and valuable in building construction. A Minnesota Department of Natural Resources (DNR) survey conducted in 1990 identified 165 active limestone mining operations in 34 counties across an area spanning from the Mississippi River south of the Twin Cities, west to Mankato.
In addition to the heavy commodities being produced within the Southeastern Region, a previous freight study examining the Southwestern region of the state (MnDOT District 7) found that Farm Products produced in that highly agricultural dependent area frequently move on and through facilities in Southeastern Minnesota. The following excerpts are taken from the final report of that effort:35
If current agricultural trends continue, freight traffic in Southwest Minnesota will potentially grow by 200 percent by 2030, or double the statewide rate. Better crop genetics and improved management practices, including crop rotation, improved chemical management of soils and fertilizers, pesticides and herbicides, less damaging cultivation and soil compaction, and aggressive plant spacing have steadily improved per-acre yields. The result is more agricultural freight traffic on the freight system, particularly trucks...The following key roadways are significant freight corridors due to their importance to the region’s and State’s economy: MN 60 from Iowa to Mankato (for ethanol plants and shuttle elevators); US 14 from South Dakota to I-35 and US 169 from Mankato to the Twin Cities (for grain, port access); and I-90 through the region (for national connections).… (pg. ii)
35 Southwest Minnesota Regional Freight Study, Final Report; Minnesota Department of Transportation, Sept. 2007.
Southeast Minnesota Regional Freight Study
52
The Ports of Red Wing and Winona on the Mississippi River also serve District 7. Historically, much of the export grain traffic from the Districts’ eastern third moves by truck to elevators of these ports. Fertilizers including lime and urea are also imported to District 7 customers from barges through these cities. (pg. 10)
It is also notable that the Southwestern Minnesota Regional Freight Study identified a trend in modern farm operations towards the use of 5-axle semi-tractor trailers for hauling grain and other materials such as fertilizer. The study noted that large equipment creates potential weight issues, as well as transportation challenges to safe operation in rural areas: An analysis of Minnesota truck registrations estimated that in 2007, approximately 50 percent of heavy commercial vehicles were registered to farm or agricultural businesses, while just 10 years before, single unit two- and three-axle straight trucks were the most common vehicles used for moving products between the farm and elevator. Further, the study noted that over a ten year period, grain transported off the farm in five-axle semi-tractor trailer trucks had increased from 30 percent to over 60 percent.
Silica Sand: A Potential New Growth Industry for Southeastern Minnesota A new economic development opportunity has been creating headlines in Southeastern Minnesota: Sand. The Mississippi River Valley in the southeastern corner of the state has an abundance of sand deposits that happen to hold large grains of round silica sand, making them highly suitable for mining operations that use the hydraulic fracturing process. Mining companies are interested in developing sites in this area and then transporting silica sand for use in extracting oil and natural gas from shale formations. Since shale oil and gas extraction has been growing at a rapid pace in several regions of the U.S., silica sand mining presents a significant economic development opportunity for the Southeastern Region; however, it also presents one more heavy commodity that will require large volumes of trucks using local road systems to bring the sand from mining sites to processing sites and/or rail or barge loading facilities.
Due to community concerns over environment and potential roadway impacts, most of the counties in Southeastern Minnesota with significant silica sand deposits have issued moratoriums on new mining operations to allow time for studies that will help these counties better understand the environmental and infrastructure impacts from increased mining activities. Many of the existing county moratoriums are set to expire in the near term. As these moratoriums end, it is expected that mining companies will quickly file permits to transport sand throughout the region.
To better understand the current issues associated with silica sand mining operations, thirteen counties were contacted in southeastern Minnesota to discuss sand transportation policy and constraints. Findings are summarized below. The silica sand mining industry in Wisconsin is more developed than it is in Minnesota. Other pertinent studies and ordinances used by Wisconsin to regulate sand transportation were also identified.
Existing County Regulations and Ordinances Exhibit 3 summarizes the results of discussions with the 13 counties in Southeastern Minnesota. When possible, copies of studies and ordinances from county engineers were obtained.
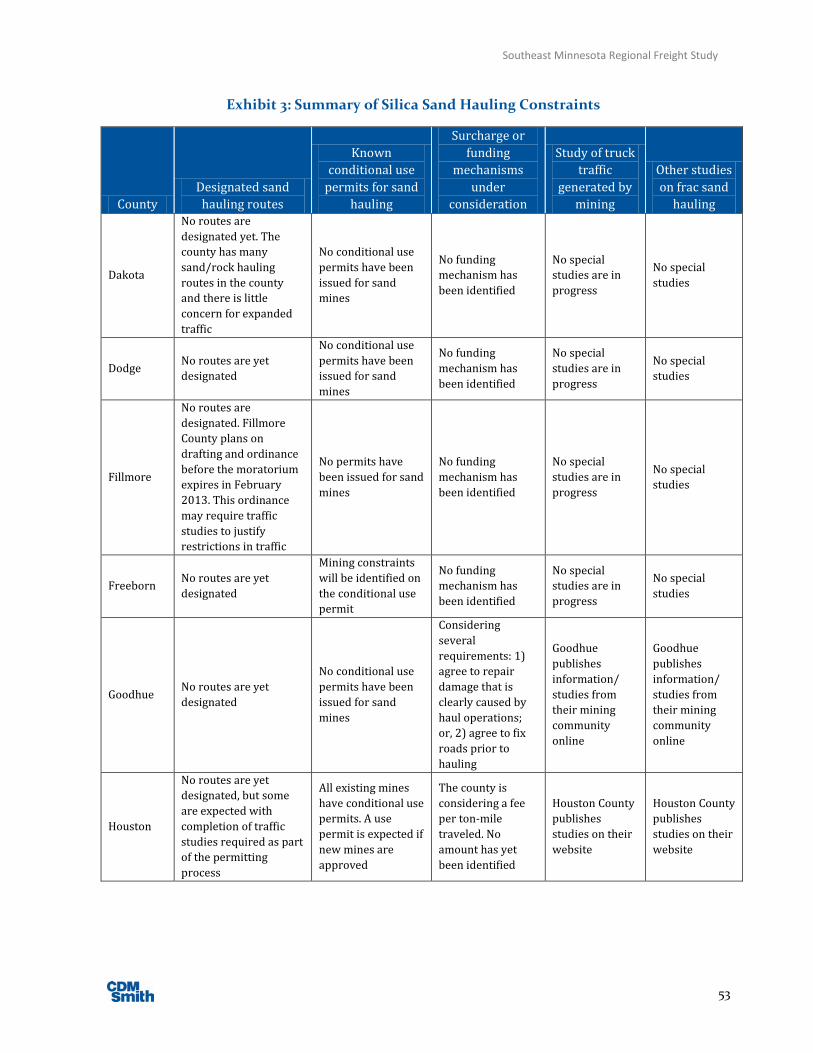
Southeast Minnesota Regional Freight Study
53
Exhibit 3: Summary of Silica Sand Hauling Constraints
County Designated sand hauling routes
Known conditional use
permits for sand hauling
Surcharge or funding
mechanisms under
consideration
Study of truck traffic
generated by mining
Other studies on frac sand
hauling
Dakota
No routes are designated yet. The county has many sand/rock hauling routes in the county and there is little concern for expanded traffic
No conditional use permits have been issued for sand mines
No funding mechanism has been identified
No special studies are in progress
No special studies
Dodge No routes are yet designated
No conditional use permits have been issued for sand mines
No funding mechanism has been identified
No special studies are in progress
No special studies
Fillmore
No routes are designated. Fillmore County plans on drafting and ordinance before the moratorium expires in February 2013. This ordinance may require traffic studies to justify restrictions in traffic
No permits have been issued for sand mines
No funding mechanism has been identified
No special studies are in progress
No special studies
Freeborn No routes are yet designated
Mining constraints will be identified on the conditional use permit
No funding mechanism has been identified
No special studies are in progress
No special studies
Goodhue No routes are yet designated
No conditional use permits have been issued for sand mines
Considering several requirements: 1) agree to repair damage that is clearly caused by haul operations; or, 2) agree to fix roads prior to hauling
Goodhue publishes information/ studies from their mining community online
Goodhue publishes information/ studies from their mining community online
Houston
No routes are yet designated, but some are expected with completion of traffic studies required as part of the permitting process
All existing mines have conditional use permits. A use permit is expected if new mines are approved
The county is considering a fee per ton-mile traveled. No amount has yet been identified
Houston County publishes studies on their website
Houston County publishes studies on their website
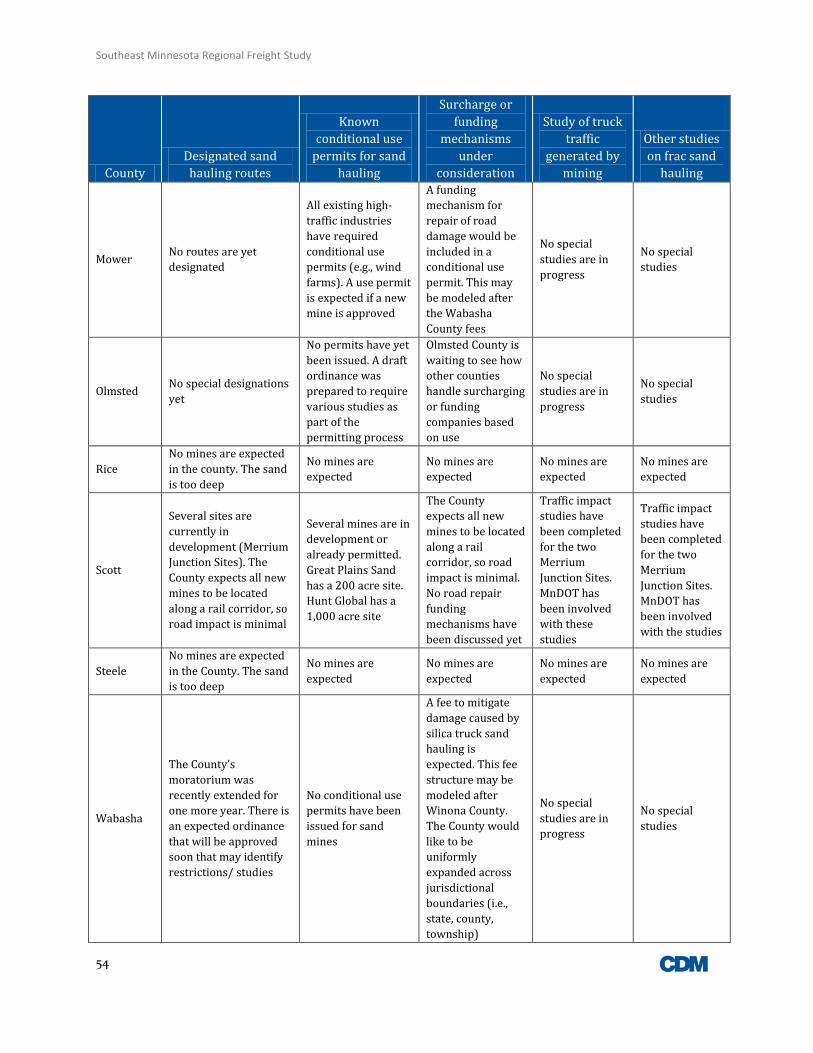
Southeast Minnesota Regional Freight Study
54
County Designated sand hauling routes
Known conditional use
permits for sand hauling
Surcharge or funding
mechanisms under
consideration
Study of truck traffic
generated by mining
Other studies on frac sand
hauling
Mower No routes are yet designated
All existing high-traffic industries have required conditional use permits (e.g., wind farms). A use permit is expected if a new mine is approved
A funding mechanism for repair of road damage would be included in a conditional use permit. This may be modeled after the Wabasha County fees
No special studies are in progress
No special studies
Olmsted No special designations yet
No permits have yet been issued. A draft ordinance was prepared to require various studies as part of the permitting process
Olmsted County is waiting to see how other counties handle surcharging or funding companies based on use
No special studies are in progress
No special studies
Rice No mines are expected in the county. The sand is too deep
No mines are expected
No mines are expected
No mines are expected
No mines are expected
Scott
Several sites are currently in development (Merrium Junction Sites). The County expects all new mines to be located along a rail corridor, so road impact is minimal
Several mines are in development or already permitted. Great Plains Sand has a 200 acre site. Hunt Global has a 1,000 acre site
The County expects all new mines to be located along a rail corridor, so road impact is minimal. No road repair funding mechanisms have been discussed yet
Traffic impact studies have been completed for the two Merrium Junction Sites. MnDOT has been involved with these studies
Traffic impact studies have been completed for the two Merrium Junction Sites. MnDOT has been involved with the studies
Steele No mines are expected in the County. The sand is too deep
No mines are expected
No mines are expected
No mines are expected
No mines are expected
Wabasha
The County’s moratorium was recently extended for one more year. There is an expected ordinance that will be approved soon that may identify restrictions/ studies
No conditional use permits have been issued for sand mines
A fee to mitigate damage caused by silica truck sand hauling is expected. This fee structure may be modeled after Winona County. The County would like to be uniformly expanded across jurisdictional boundaries (i.e., state, county, township)
No special studies are in progress
No special studies
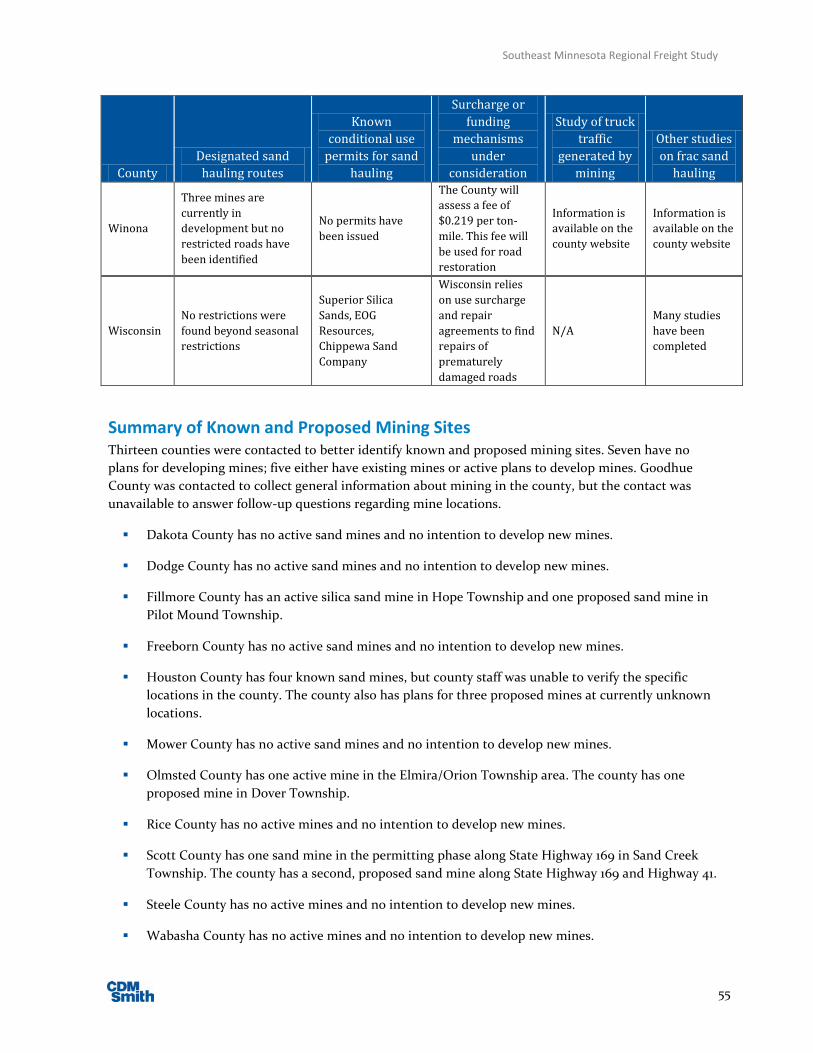
Southeast Minnesota Regional Freight Study
55
County Designated sand hauling routes
Known conditional use
permits for sand hauling
Surcharge or funding
mechanisms under
consideration
Study of truck traffic
generated by mining
Other studies on frac sand
hauling
Winona
Three mines are currently in development but no restricted roads have been identified
No permits have been issued
The County will assess a fee of $0.219 per ton-mile. This fee will be used for road restoration
Information is available on the county website
Information is available on the county website
Wisconsin No restrictions were found beyond seasonal restrictions
Superior Silica Sands, EOG Resources, Chippewa Sand Company
Wisconsin relies on use surcharge and repair agreements to find repairs of prematurely damaged roads
N/A Many studies have been completed
Summary of Known and Proposed Mining Sites Thirteen counties were contacted to better identify known and proposed mining sites. Seven have no plans for developing mines; five either have existing mines or active plans to develop mines. Goodhue County was contacted to collect general information about mining in the county, but the contact was unavailable to answer follow-up questions regarding mine locations.
Dakota County has no active sand mines and no intention to develop new mines.
Dodge County has no active sand mines and no intention to develop new mines.
Fillmore County has an active silica sand mine in Hope Township and one proposed sand mine in Pilot Mound Township.
Freeborn County has no active sand mines and no intention to develop new mines.
Houston County has four known sand mines, but county staff was unable to verify the specific locations in the county. The county also has plans for three proposed mines at currently unknown locations.
Mower County has no active sand mines and no intention to develop new mines.
Olmsted County has one active mine in the Elmira/Orion Township area. The county has one proposed mine in Dover Township.
Rice County has no active mines and no intention to develop new mines.
Scott County has one sand mine in the permitting phase along State Highway 169 in Sand Creek Township. The county has a second, proposed sand mine along State Highway 169 and Highway 41.
Steele County has no active mines and no intention to develop new mines.
Wabasha County has no active mines and no intention to develop new mines.
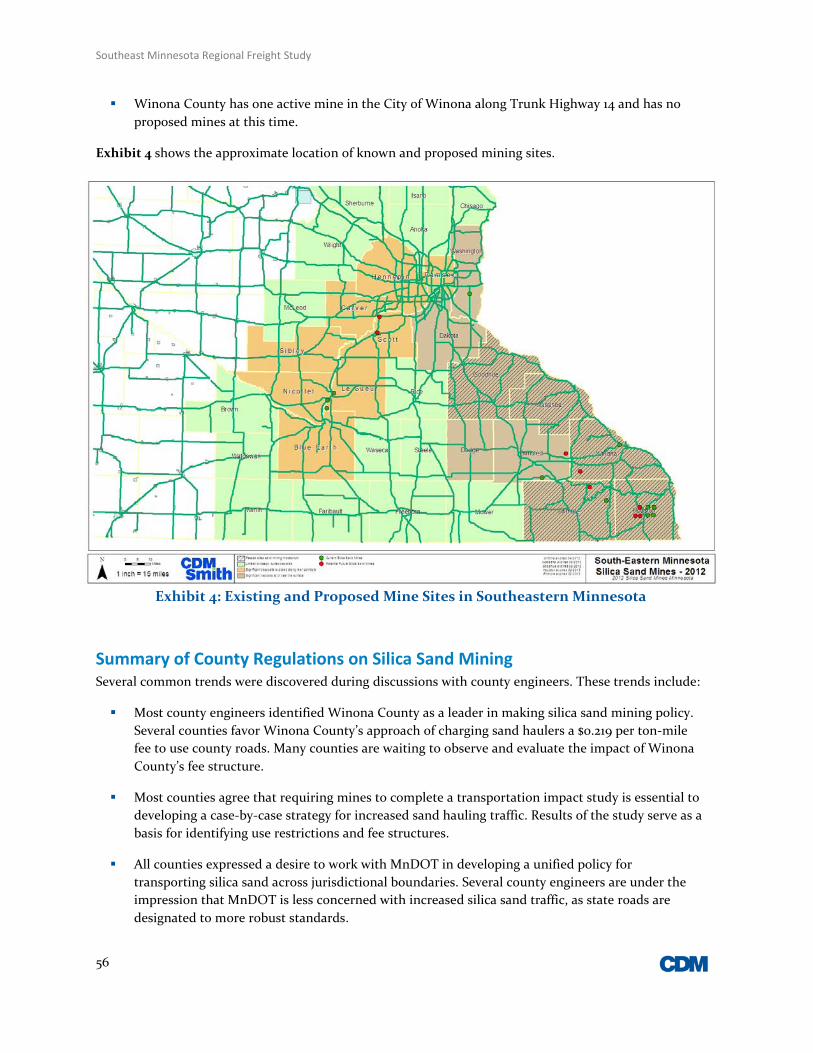
Southeast Minnesota Regional Freight Study
56
Winona County has one active mine in the City of Winona along Trunk Highway 14 and has no proposed mines at this time.
Exhibit 4 shows the approximate location of known and proposed mining sites.
Exhibit 4: Existing and Proposed Mine Sites in Southeastern Minnesota
Summary of County Regulations on Silica Sand Mining Several common trends were discovered during discussions with county engineers. These trends include:
Most county engineers identified Winona County as a leader in making silica sand mining policy. Several counties favor Winona County’s approach of charging sand haulers a $0.219 per ton-mile fee to use county roads. Many counties are waiting to observe and evaluate the impact of Winona County’s fee structure.
Most counties agree that requiring mines to complete a transportation impact study is essential to developing a case-by-case strategy for increased sand hauling traffic. Results of the study serve as a basis for identifying use restrictions and fee structures.
All counties expressed a desire to work with MnDOT in developing a unified policy for transporting silica sand across jurisdictional boundaries. Several county engineers are under the impression that MnDOT is less concerned with increased silica sand traffic, as state roads are designated to more robust standards.
Southeast Minnesota Regional Freight Study
57
Goodhue, Houston, Wabasha and Winona Counties have indicated that mines have recently contacted the county and expressed interest in developing sites.
Rice and Steele County do not expect silica mines to develop in their counties. Silica sand deposits in these counties are too deep to economically mine.
Transportation Funding: Maintaining Local Roads Every year government agencies spend billions of dollars in pavement construction and rehabilitation. Pavements are typically designed to last without major rehabilitation for 20 to 30 years. Pavement consumption, or the wear and tear on a road that leads to rutting and cracking, is driven primarily by heavy axle loads; however, environmental conditions such as freeze-thaw cycles also impact pavement deterioration. Nonetheless, the key input to designing a roadway to last an extended period of time is the number of axle loads the pavement will encounter over its design life. Large truck operations, especially heavy vehicle loads can accelerate pavement stress and deterioration on roadways and shorten the life span of bridges. Generally, highway pavements are impacted by axle and axle group loads directly in contact with the pavement (i.e., the load footprint as opposed to the overall gross vehicle weight). Over time, the accumulated strains (the pavement deformation from all the axle loads) deteriorate pavement condition, eventually resulting in cracking of both rigid and flexible pavements and permanent deformation or rutting in flexible pavements.
Pavement Performance Basics A common metric for examining the relationship between heavy vehicles and pavement wear is the “equivalent standard axle load” (ESAL) originally developed through extensive pavement tests in the 1950s. While newer methods have been developed for pavement design practices, the ESAL metric continues to be widely used to explain the impact of various vehicle axle loads on pavement wear. Using an ESAL approach, the damage or “consumption” of pavement from different vehicle loads are normalized by relating the damage to a standard reference axle weight (18,000 lb. single axle load). The factors can be pavement performance-based (pavement life) or pavement response-based (pavement strain). ESAL factors provide a means of readily assessing the relative damage resulting from loaded commercial vehicles on pavements. The values are calculated to standardize the measurement pavement wear from a wide variety of trucks, carrying a wide range of loads.
When referring to the pavement consumed by a vehicle with two or more axles, the term load equivalency factor (LEF) is used to represent the additive ESALs from each axle or axle group in a vehicle configuration under a given load. In the U.S., pavement design guidelines developed by the American Association of State Highway and Transportation Officials (AASHTO) provide ESAL equations for the two primary pavement types (asphalt or flexible, and concrete or rigid). Many variations of the basic ESAL metrics are also provided to account for pavement thickness and sub-base structure. For the purpose of illustrating how changing axle loads impact pavement wear, Exhibits 5-A through 5-C, provide ESAL and LEF for a rigid pavement for various vehicle load configurations on a standard 5-axle tractor semitrailer combination.
Exhibit 5-A: Partially Loaded 5-Axle Tractor Semi-trailer (Class 9 Vehicle)
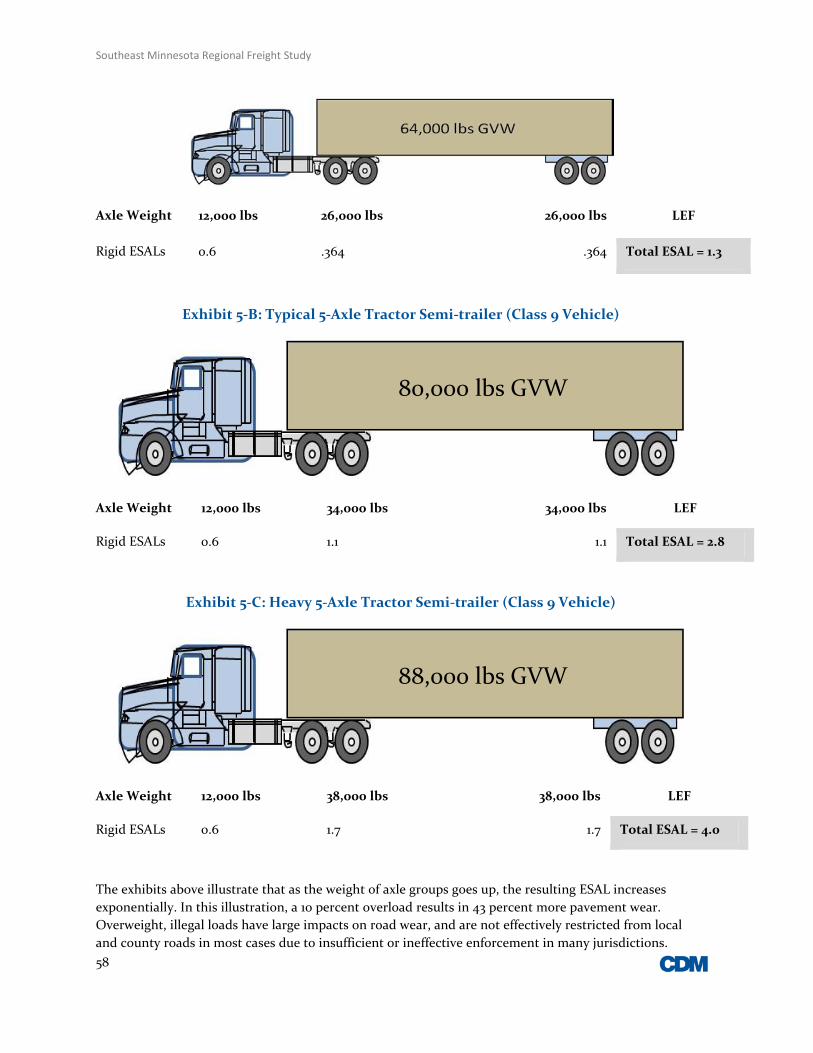
Southeast Minnesota Regional Freight Study
58
Axle Weight 12,000 lbs 26,000 lbs 26,000 lbs LEF
Rigid ESALs 0.6 .364 .364 Total ESAL = 1.3
Exhibit 5-B: Typical 5-Axle Tractor Semi-trailer (Class 9 Vehicle)
Axle Weight 12,000 lbs 34,000 lbs 34,000 lbs LEF
Rigid ESALs 0.6 1.1 1.1 Total ESAL = 2.8
Exhibit 5-C: Heavy 5-Axle Tractor Semi-trailer (Class 9 Vehicle)
Axle Weight 12,000 lbs 38,000 lbs 38,000 lbs LEF
Rigid ESALs 0.6 1.7 1.7 Total ESAL = 4.0
The exhibits above illustrate that as the weight of axle groups goes up, the resulting ESAL increases exponentially. In this illustration, a 10 percent overload results in 43 percent more pavement wear. Overweight, illegal loads have large impacts on road wear, and are not effectively restricted from local and county roads in most cases due to insufficient or ineffective enforcement in many jurisdictions.
80,000 lbs GVW
88,000 lbs GVW
Southeast Minnesota Regional Freight Study
59
County governments have the authority to post weight limits on their roads and enforce them, but the reality is that they often have neither the funds for enforcement, nor the data on heavy commercial vehicle traffic counts and road strength to make accurate decisions on properly managing the system.
Local Road Funding The issue of transportation funding is a complex subject that at the federal level has been the topic of extensive examinations by the Government Accounting Office (GAO), the Congressional Budget Office (CBO), and The National Academy of Sciences, as well as two congressionally appointed bodies: 1) the National Surface Transportation Policy and Revenue Study Commission; and, 2) the National Surface Transportation Infrastructure Financing Commission. Leading up to the congressional reauthorization that recently passed, all of the noted studies came to essentially the same conclusion as expressed by the congressionally appointed Transportation Policy and Revenue Commission:
“The Nation is underinvesting in all modes of transportation. Unless the relative market share for other modes – including rail, bus, and water – grows, even significant increases in highway capacity cannot meet the scale of future projected demand… The declining performance of the surface transportation network – as a result of both inadequate capacity and inefficient management – will choke economic progress, preventing the U.S. economy from growing to its full potential. It is not an overstatement to say that the Nation’s potential for the creation of wealth will depend in great part on the success of its freight efficiency.”36
In a nutshell, the conclusion reached by all of the commissions and special studies requested by Congress boil down to increasing demands versus declining purchasing power. The federal excise tax on fuel in the U.S. is 18.4¢ per gallon on gasoline and 24.4¢ per gallon on diesel fuel. Federal fuel taxes were last increased in 1993, and are not indexed to inflation. Conversely, the cost of highway construction materials like steel, concrete and asphalt have all gone up since the 1990’s, as has the fuel efficiency of cars in recent years. As a result, drivers pay less per mile driven, and federal fuel taxes have experienced a significant loss in purchasing power. The graphic in Exhibit 6 illustrates this decline.
Exhibit 6: Decline in Purchasing Power of Federal Fuel Taxes
36 National Surface Transportation Policy and Revenue Study Commission, Volume 1, pg. 4 http://transportationfortomorrow.com/about/commissioners.htm
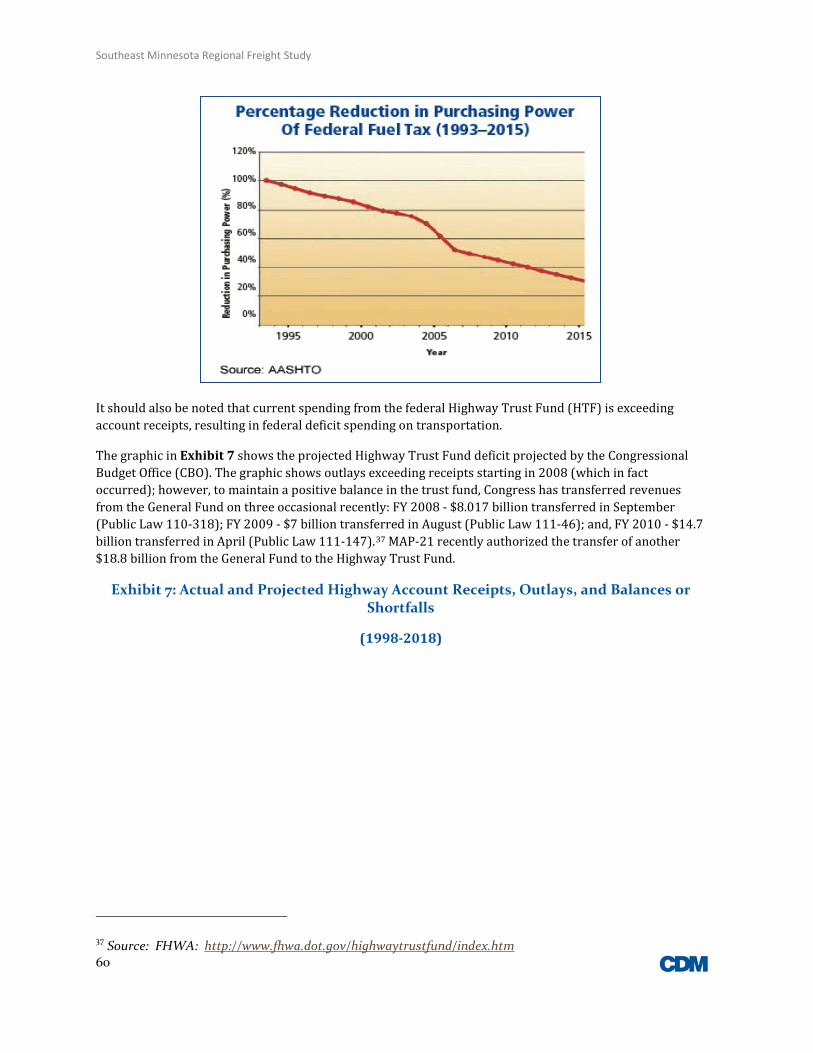
Southeast Minnesota Regional Freight Study
60
It should also be noted that current spending from the federal Highway Trust Fund (HTF) is exceeding account receipts, resulting in federal deficit spending on transportation.
The graphic in Exhibit 7 shows the projected Highway Trust Fund deficit projected by the Congressional Budget Office (CBO). The graphic shows outlays exceeding receipts starting in 2008 (which in fact occurred); however, to maintain a positive balance in the trust fund, Congress has transferred revenues from the General Fund on three occasional recently: FY 2008 - $8.017 billion transferred in September (Public Law 110-318); FY 2009 - $7 billion transferred in August (Public Law 111-46); and, FY 2010 - $14.7 billion transferred in April (Public Law 111-147).37 MAP-21 recently authorized the transfer of another $18.8 billion from the General Fund to the Highway Trust Fund.
Exhibit 7: Actual and Projected Highway Account Receipts, Outlays, and Balances or Shortfalls
(1998-2018)
37 Source: FHWA: http://www.fhwa.dot.gov/highwaytrustfund/index.htm
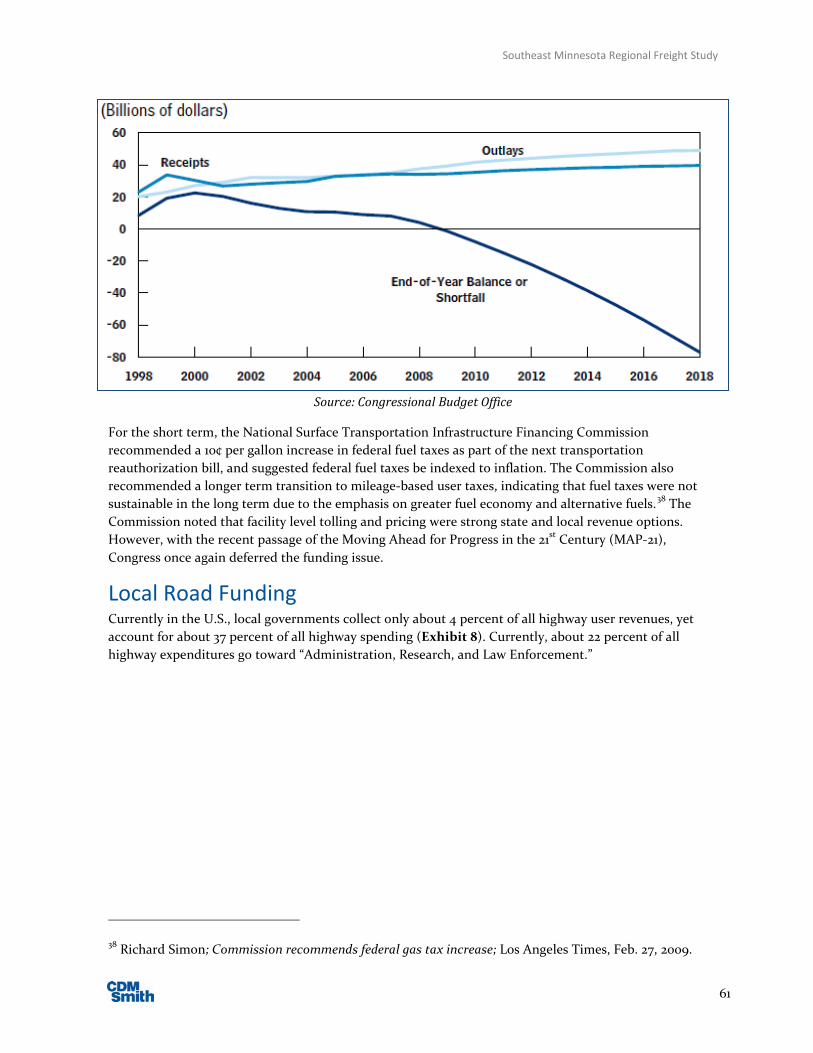
Southeast Minnesota Regional Freight Study
61
Source: Congressional Budget Office
For the short term, the National Surface Transportation Infrastructure Financing Commission recommended a 10¢ per gallon increase in federal fuel taxes as part of the next transportation reauthorization bill, and suggested federal fuel taxes be indexed to inflation. The Commission also recommended a longer term transition to mileage-based user taxes, indicating that fuel taxes were not sustainable in the long term due to the emphasis on greater fuel economy and alternative fuels.38 The Commission noted that facility level tolling and pricing were strong state and local revenue options. However, with the recent passage of the Moving Ahead for Progress in the 21st Century (MAP-21), Congress once again deferred the funding issue.
Local Road Funding Currently in the U.S., local governments collect only about 4 percent of all highway user revenues, yet account for about 37 percent of all highway spending (Exhibit 8). Currently, about 22 percent of all highway expenditures go toward “Administration, Research, and Law Enforcement.”
38 Richard Simon; Commission recommends federal gas tax increase; Los Angeles Times, Feb. 27, 2009.
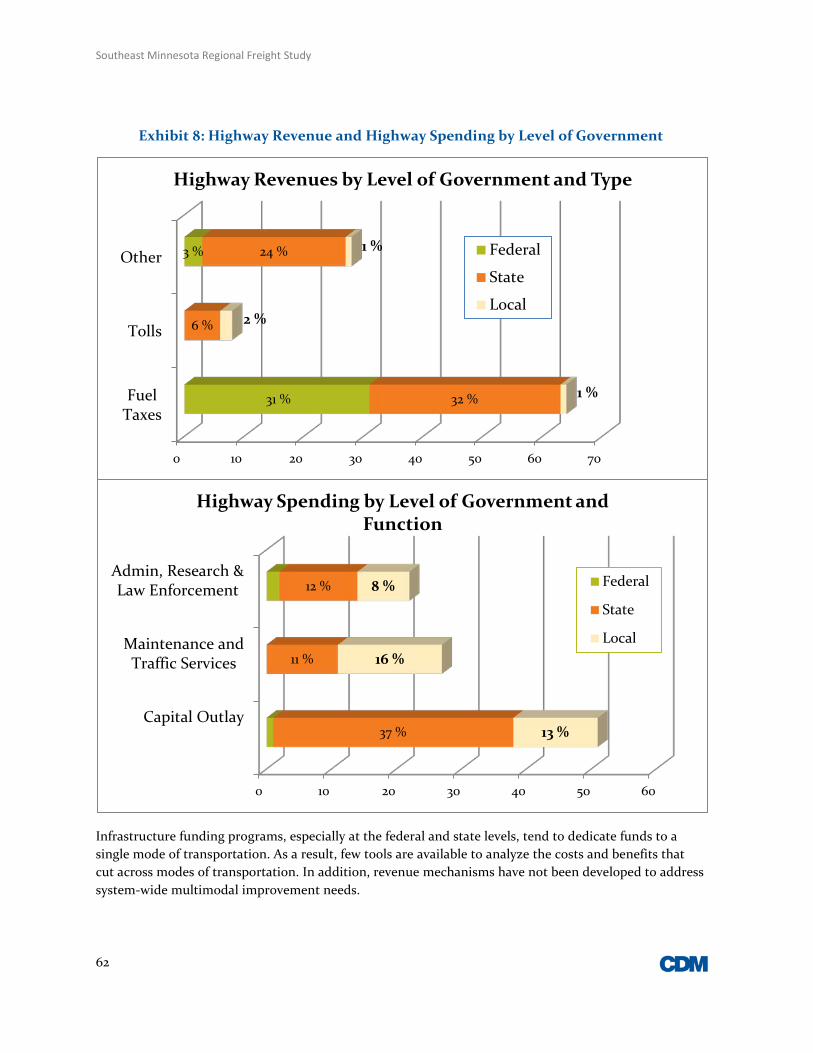
Southeast Minnesota Regional Freight Study
62
Exhibit 8: Highway Revenue and Highway Spending by Level of Government
Infrastructure funding programs, especially at the federal and state levels, tend to dedicate funds to a single mode of transportation. As a result, few tools are available to analyze the costs and benefits that cut across modes of transportation. In addition, revenue mechanisms have not been developed to address system-wide multimodal improvement needs.
0 10 20 30 40 50 60 70
FuelTaxes
Tolls
Other
31 %
3 %
32 %
6 %
24 %
1 %
2 %
1 %
Highway Revenues by Level of Government and Type
Federal
State
Local
0 10 20 30 40 50 60
Capital Outlay
Maintenance andTraffic Services
Admin, Research &Law Enforcement
37 %
11 %
12 %
13 %
16 %
8 %
Highway Spending by Level of Government and Function
Federal
State
Local
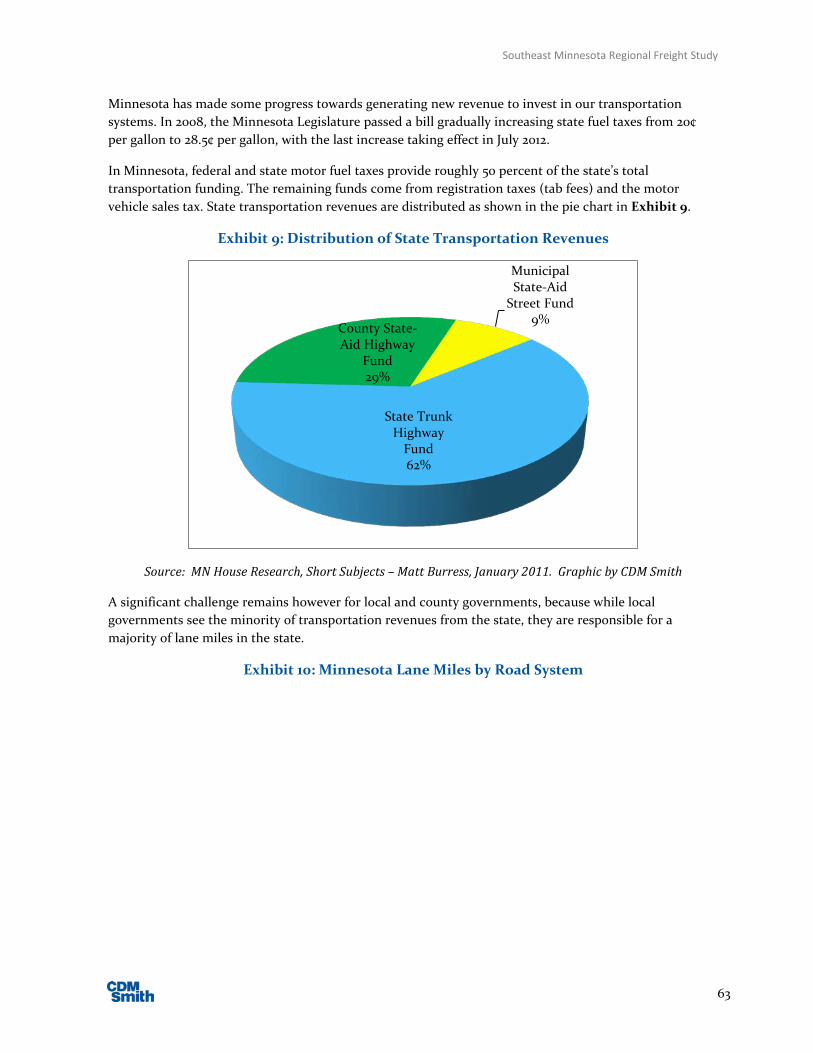
Southeast Minnesota Regional Freight Study
63
Minnesota has made some progress towards generating new revenue to invest in our transportation systems. In 2008, the Minnesota Legislature passed a bill gradually increasing state fuel taxes from 20¢ per gallon to 28.5¢ per gallon, with the last increase taking effect in July 2012.
In Minnesota, federal and state motor fuel taxes provide roughly 50 percent of the state’s total transportation funding. The remaining funds come from registration taxes (tab fees) and the motor vehicle sales tax. State transportation revenues are distributed as shown in the pie chart in Exhibit 9.
Exhibit 9: Distribution of State Transportation Revenues
Source: MN House Research, Short Subjects – Matt Burress, January 2011. Graphic by CDM Smith
A significant challenge remains however for local and county governments, because while local governments see the minority of transportation revenues from the state, they are responsible for a majority of lane miles in the state.
Exhibit 10: Minnesota Lane Miles by Road System
State Trunk Highway
Fund 62%
County State-Aid Highway
Fund 29%
Municipal State-Aid
Street Fund 9%
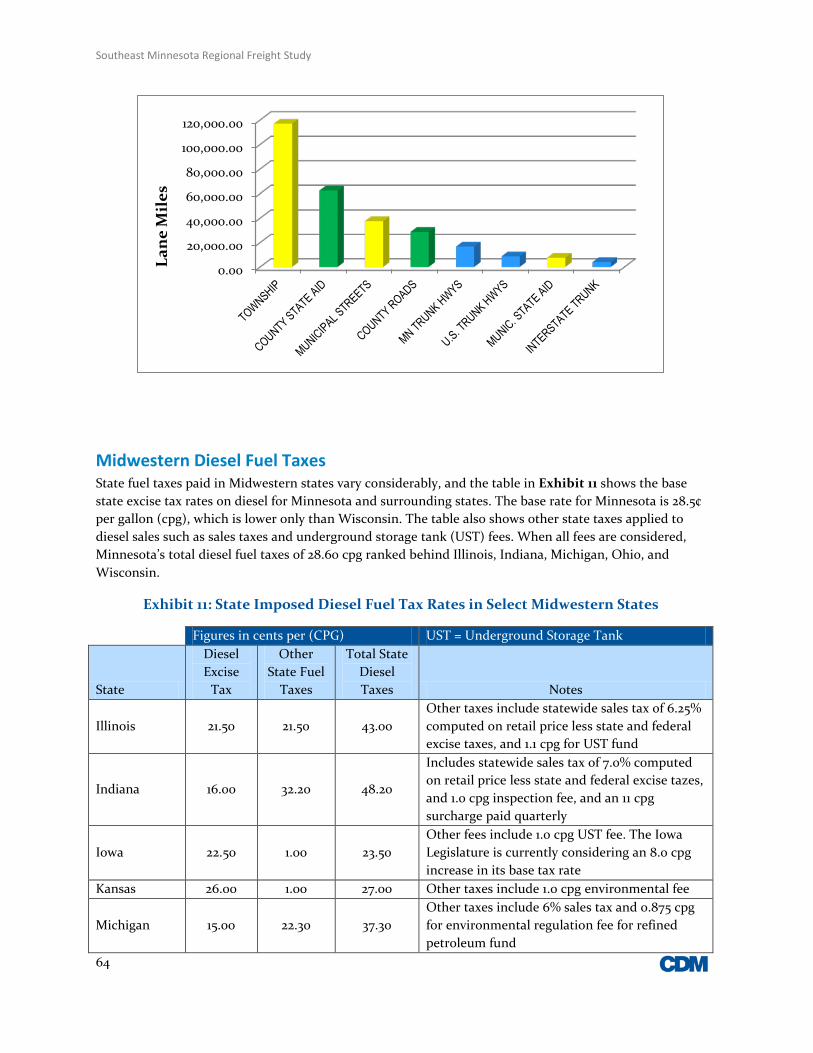
Southeast Minnesota Regional Freight Study
64
Midwestern Diesel Fuel Taxes State fuel taxes paid in Midwestern states vary considerably, and the table in Exhibit 11 shows the base state excise tax rates on diesel for Minnesota and surrounding states. The base rate for Minnesota is 28.5¢ per gallon (cpg), which is lower only than Wisconsin. The table also shows other state taxes applied to diesel sales such as sales taxes and underground storage tank (UST) fees. When all fees are considered, Minnesota’s total diesel fuel taxes of 28.60 cpg ranked behind Illinois, Indiana, Michigan, Ohio, and Wisconsin.
Exhibit 11: State Imposed Diesel Fuel Tax Rates in Select Midwestern States
Figures in cents per (CPG) UST = Underground Storage Tank
State
Diesel Excise
Tax
Other State Fuel
Taxes
Total State Diesel Taxes Notes
Illinois 21.50 21.50 43.00 Other taxes include statewide sales tax of 6.25% computed on retail price less state and federal excise taxes, and 1.1 cpg for UST fund
Indiana 16.00 32.20 48.20
Includes statewide sales tax of 7.0% computed on retail price less state and federal excise tazes, and 1.0 cpg inspection fee, and an 11 cpg surcharge paid quarterly
Iowa 22.50 1.00 23.50 Other fees include 1.0 cpg UST fee. The Iowa Legislature is currently considering an 8.0 cpg increase in its base tax rate
Kansas 26.00 1.00 27.00 Other taxes include 1.0 cpg environmental fee
Michigan 15.00 22.30 37.30 Other taxes include 6% sales tax and 0.875 cpg for environmental regulation fee for refined petroleum fund
0.00
20,000.00
40,000.00
60,000.00
80,000.00
100,000.00
120,000.00
Lane
Mil
es
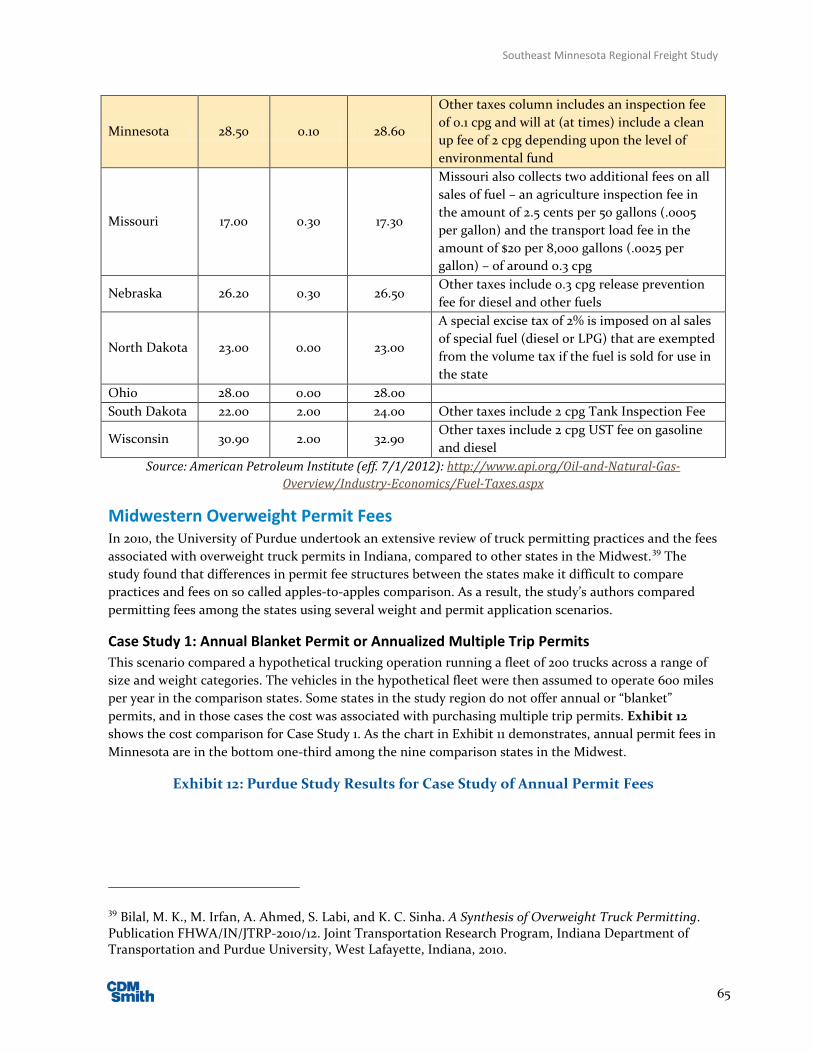
Southeast Minnesota Regional Freight Study
65
Minnesota 28.50 0.10 28.60
Other taxes column includes an inspection fee of 0.1 cpg and will at (at times) include a clean up fee of 2 cpg depending upon the level of environmental fund
Missouri 17.00 0.30 17.30
Missouri also collects two additional fees on all sales of fuel – an agriculture inspection fee in the amount of 2.5 cents per 50 gallons (.0005 per gallon) and the transport load fee in the amount of $20 per 8,000 gallons (.0025 per gallon) – of around 0.3 cpg
Nebraska 26.20 0.30 26.50 Other taxes include 0.3 cpg release prevention fee for diesel and other fuels
North Dakota 23.00 0.00 23.00
A special excise tax of 2% is imposed on al sales of special fuel (diesel or LPG) that are exempted from the volume tax if the fuel is sold for use in the state
Ohio 28.00 0.00 28.00 South Dakota 22.00 2.00 24.00 Other taxes include 2 cpg Tank Inspection Fee
Wisconsin 30.90 2.00 32.90 Other taxes include 2 cpg UST fee on gasoline and diesel
Source: American Petroleum Institute (eff. 7/1/2012): http://www.api.org/Oil-and-Natural-Gas-Overview/Industry-Economics/Fuel-Taxes.aspx
Midwestern Overweight Permit Fees In 2010, the University of Purdue undertook an extensive review of truck permitting practices and the fees associated with overweight truck permits in Indiana, compared to other states in the Midwest.39 The study found that differences in permit fee structures between the states make it difficult to compare practices and fees on so called apples-to-apples comparison. As a result, the study’s authors compared permitting fees among the states using several weight and permit application scenarios.
Case Study 1: Annual Blanket Permit or Annualized Multiple Trip Permits This scenario compared a hypothetical trucking operation running a fleet of 200 trucks across a range of size and weight categories. The vehicles in the hypothetical fleet were then assumed to operate 600 miles per year in the comparison states. Some states in the study region do not offer annual or “blanket” permits, and in those cases the cost was associated with purchasing multiple trip permits. Exhibit 12 shows the cost comparison for Case Study 1. As the chart in Exhibit 11 demonstrates, annual permit fees in Minnesota are in the bottom one-third among the nine comparison states in the Midwest.
Exhibit 12: Purdue Study Results for Case Study of Annual Permit Fees
39 Bilal, M. K., M. Irfan, A. Ahmed, S. Labi, and K. C. Sinha. A Synthesis of Overweight Truck Permitting. Publication FHWA/IN/JTRP-2010/12. Joint Transportation Research Program, Indiana Department of Transportation and Purdue University, West Lafayette, Indiana, 2010.
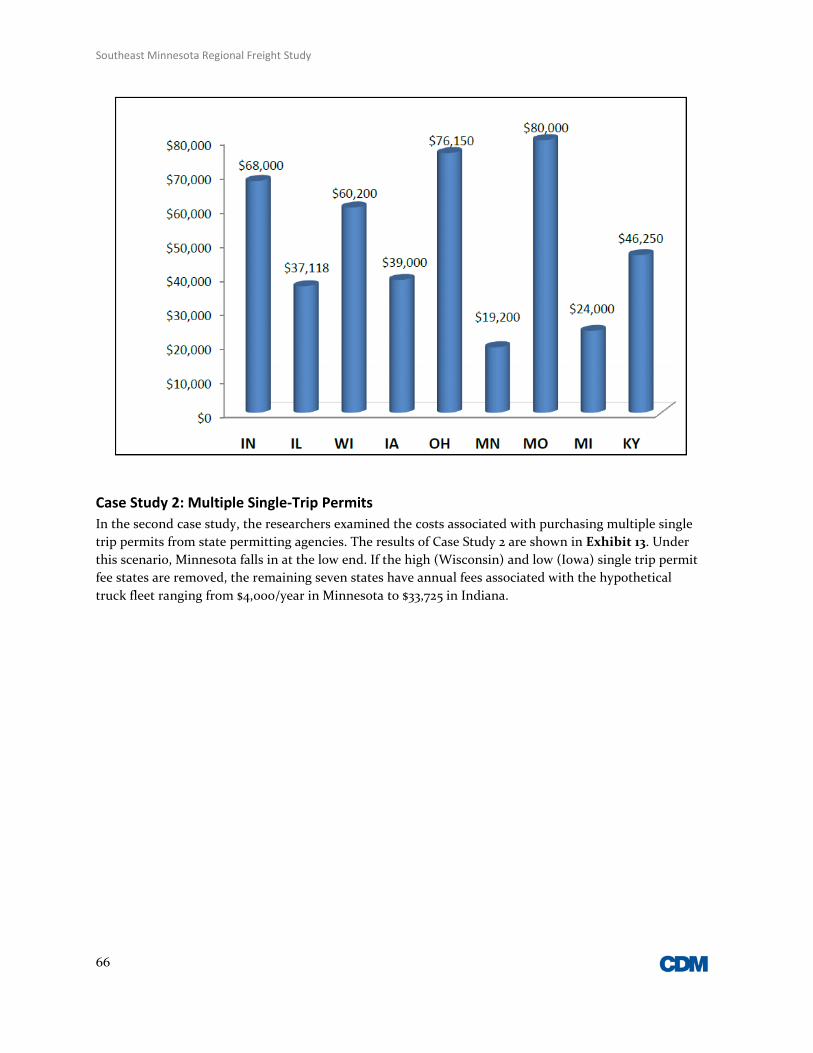
Southeast Minnesota Regional Freight Study
66
Case Study 2: Multiple Single-Trip Permits In the second case study, the researchers examined the costs associated with purchasing multiple single trip permits from state permitting agencies. The results of Case Study 2 are shown in Exhibit 13. Under this scenario, Minnesota falls in at the low end. If the high (Wisconsin) and low (Iowa) single trip permit fee states are removed, the remaining seven states have annual fees associated with the hypothetical truck fleet ranging from $4,000/year in Minnesota to $33,725 in Indiana.
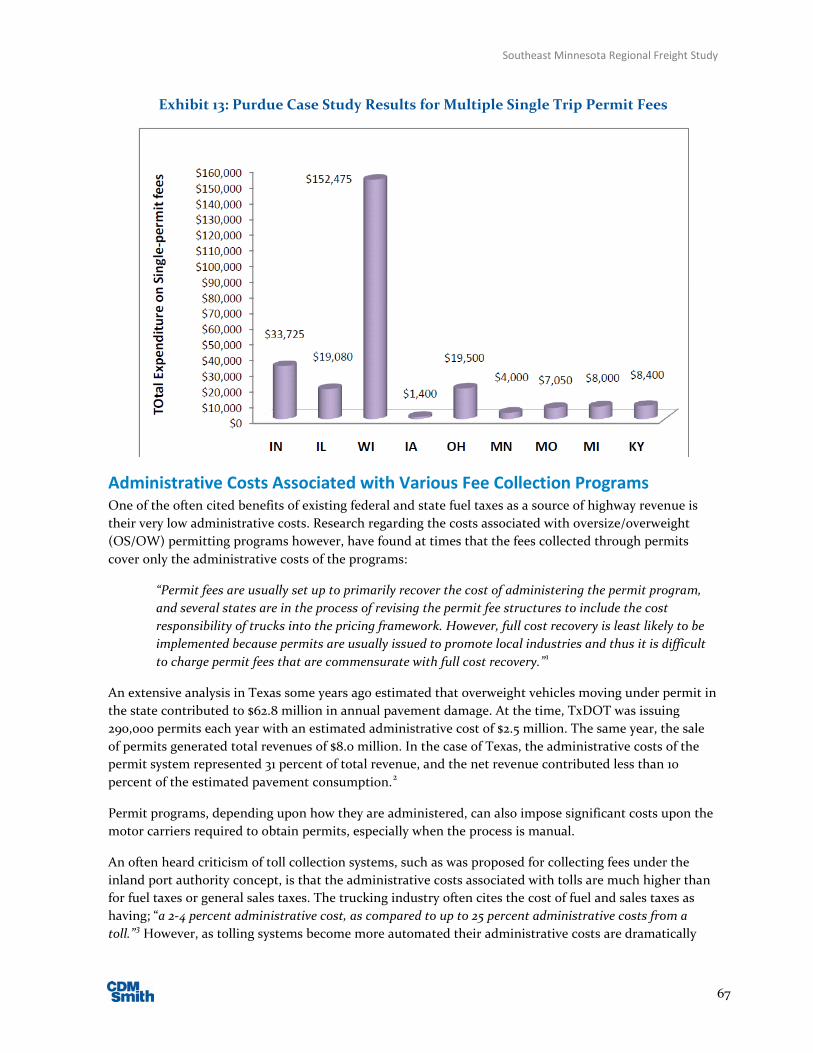
Southeast Minnesota Regional Freight Study
67
Exhibit 13: Purdue Case Study Results for Multiple Single Trip Permit Fees
Administrative Costs Associated with Various Fee Collection Programs One of the often cited benefits of existing federal and state fuel taxes as a source of highway revenue is their very low administrative costs. Research regarding the costs associated with oversize/overweight (OS/OW) permitting programs however, have found at times that the fees collected through permits cover only the administrative costs of the programs:
“Permit fees are usually set up to primarily recover the cost of administering the permit program, and several states are in the process of revising the permit fee structures to include the cost responsibility of trucks into the pricing framework. However, full cost recovery is least likely to be implemented because permits are usually issued to promote local industries and thus it is difficult to charge permit fees that are commensurate with full cost recovery.” 1
An extensive analysis in Texas some years ago estimated that overweight vehicles moving under permit in the state contributed to $62.8 million in annual pavement damage. At the time, TxDOT was issuing 290,000 permits each year with an estimated administrative cost of $2.5 million. The same year, the sale of permits generated total revenues of $8.0 million. In the case of Texas, the administrative costs of the permit system represented 31 percent of total revenue, and the net revenue contributed less than 10 percent of the estimated pavement consumption.2
Permit programs, depending upon how they are administered, can also impose significant costs upon the motor carriers required to obtain permits, especially when the process is manual.
An often heard criticism of toll collection systems, such as was proposed for collecting fees under the inland port authority concept, is that the administrative costs associated with tolls are much higher than for fuel taxes or general sales taxes. The trucking industry often cites the cost of fuel and sales taxes as having; “a 2-4 percent administrative cost, as compared to up to 25 percent administrative costs from a toll.”3 However, as tolling systems become more automated their administrative costs are dramatically
Southeast Minnesota Regional Freight Study
68
falling. In addition, most of the studies previously cited conclude that fuel taxes are not sustainable in the long run due to alternative fuels, higher mpg, and the political resistance to index these fuel taxes to the costs of road maintenance (e.g., politicians have been unwilling to raise fuel taxes on the trucking industry, even though the American Trucking Association has supported higher taxes if dedicated to roadways for many years). It is also true that federal cost allocation studies have found that at least some truck classes have historically not paid fees equivalent to the damage they incur.4
Although under the current distribution of Federal-aid highway program expenditures the overall Federal user fee structure is more equitable than it was in 1982, inequities remain both across different vehicle classes and among vehicles within the same class. Many of the heaviest trucks continue to pay less than their share of highway costs while many light trucks, pickups, and vans pay more than their share of highway costs. At any given weight, trucks with more axles generally have lower cost reliability and pay a larger share of their highway cost responsibility than trucks with fewer axles.
Case Studies for Freight Financing One of the continuing issues facing multimodal transportation development at all levels of government is the lack of dedicated funding programs to support freight infrastructure. At the federal level the most recent reauthorization bill; Moving Ahead for Progress in the 21st Century (MAP-21) fell short of creating a national freight program, but does provide more flexibility to state and local governments to finance freight projects.
It is likely that local governments will continue to be called on to administer a large and possibly increasing share of transportation infrastructure spending. Currently, local governments on average administer 37 percent of all highway spending, while collecting only 4 percent of all highway revenues. Again, on average local governments spend about 8 percent of their highway revenues on administrative and enforcement functions. Local governments traditionally have focused on administering transportation spending on roadways within their jurisdiction.
In many places, there is no effective model or structure for multi-jurisdictional governance. Freight projects often impact multiple jurisdictions and are at a scale larger than can be addressed by the authority vested in any one unit of local government. In addition, freight projects often involve private sector stakeholders without a history of working cooperatively with state and local government on transportation funding decisions. It is likely that moving forward local governments will need to look at financing mechanisms favoring public-private partnerships which leverage federal grant and loan programs through matching funds.
Local Road Funding Alternatives Charge per-use fees: Winona County is a leader in making silica sand mining policy. Several
counties favor Winona County’s approach of charging sand haulers a $0.219 per ton-mile to use county roads. Many counties are waiting to observe and evaluate the impact of Winona County’s fee structure.
User based fees: Strategically locate weigh-in-motion (WIM) scales along key truck routes to move toward a more equitable weight-distance user fee system.
Haul rate fee: Charge a blanket “haul rate” fee for the entire frac mining project.
Southeast Minnesota Regional Freight Study
69
Quantify and charge for damage: Quantify and charge for damage by calculating the number of Equivalent Single Axle Loads (ESALs) mining activity will take out of the roads intended life. Calculate the amount of damage to asphalt-surfaced roads by mining development and sand haulers.
Assessments: Conduct pre- and post-mining condition assessments of the roads. This information will allow the counties to charge for the actual cost incurred to return the road to the previous (or agreed upon) condition.
Aggregate Material Removal Production Tax: Per Minnesota Statutes 2001; 298.75. Aggregate tax; per ton, or per cubic yard charge: 21.5 cents per cubic yard or 15 cents per ton. Note: a county that received this tax is prohibited from imposing any additional host community fees on aggregate production within that county.
Transportation Impact Study: Require mines to complete a transportation impact study to develop a case-by-case strategy for increased sand hauling traffic. Results of the study will serve as a basis for identifying use restrictions and fee structures.
Toll roads: Build toll roads to the mines.
Southeast Minnesota Regional Freight Study
70
Rail Intermodal Container Access Input from various manufacturing and food processing firms in the South East Minnesota region noted a consistent desire for better access to railroad container transportation. The issues revolved around congestion and a poor rate structure for import and export container shipments through the Twin Cities, no direct or expedited service to the Pacific southwest ports of Los Angeles/Long Beach, increasing trucking costs to reach Chicago or Kansas City, and poor equipment availability in terms of empty containers. Several food shippers faced a further complication with the need to access refrigerated equipment. In spite of all these issues, virtually every interested shipper saw a great potential for better market access, especially foreign exports, if additional container terminal capacity or the start-up of a nearby facility could be arranged.
History and Background
Containerization arose from a trucker’s desire for better transportation freedom along the East Coast. Malcolm McLean, despite numerous federal and business roadblocks, started a coastwise shipping business in the mid-1950’s and quickly realized a competitive advantage. His concept of truck vans moving by ship rather than road quickly morphed into a system of standardized, sealed containers, free of rolling gear, to be loaded at specialized terminals onto specially equipped vessels. Loading and unloading cranes became dockside gear instead of ship gear, improving efficiency and simplifying the vessel operations. McLean’s idea became the basis of the first international container shipping firm, Sea Land. By the 1960’s the ocean carriers were adopting the concept wholesale. A direct result was a huge boost on dockside productivity, drastically reduced dwell times for cargo in wharehouses and intermediate transfer points, improved security, and reduced damage to cargo. What began as a premium service soon was driving prices down and opening up a new era in international trade.
Containerization allowed the retirement of a whole industry of intermediate shipping agents who would touch an international shipment and add costs, including truckers, brokers, consolidators, packers, wharehouses, wharf companies, stevedores, ocean shipping carriers, shipping and customs agents, bankers insurer, and foreign agents. Sea Land and others demonstrated a trend toward single source shipping services, aided by the cargo staying in their hands throughout the entire trip. The United States was a driving force in this evolution, particularly with deregulation in the 1980’s, land transportation innovations such as the land bridge and double stack articulated container trains, and electronic transmission of data. This led naturally to the advent of the third-party worldwide logistics provider in the 1990’s, which finally succeeded in making both domestic and international shipping truly seamless and totally reliable, at a competitive price.
Figure 1: Ocean Carrier Marine Container Terminals
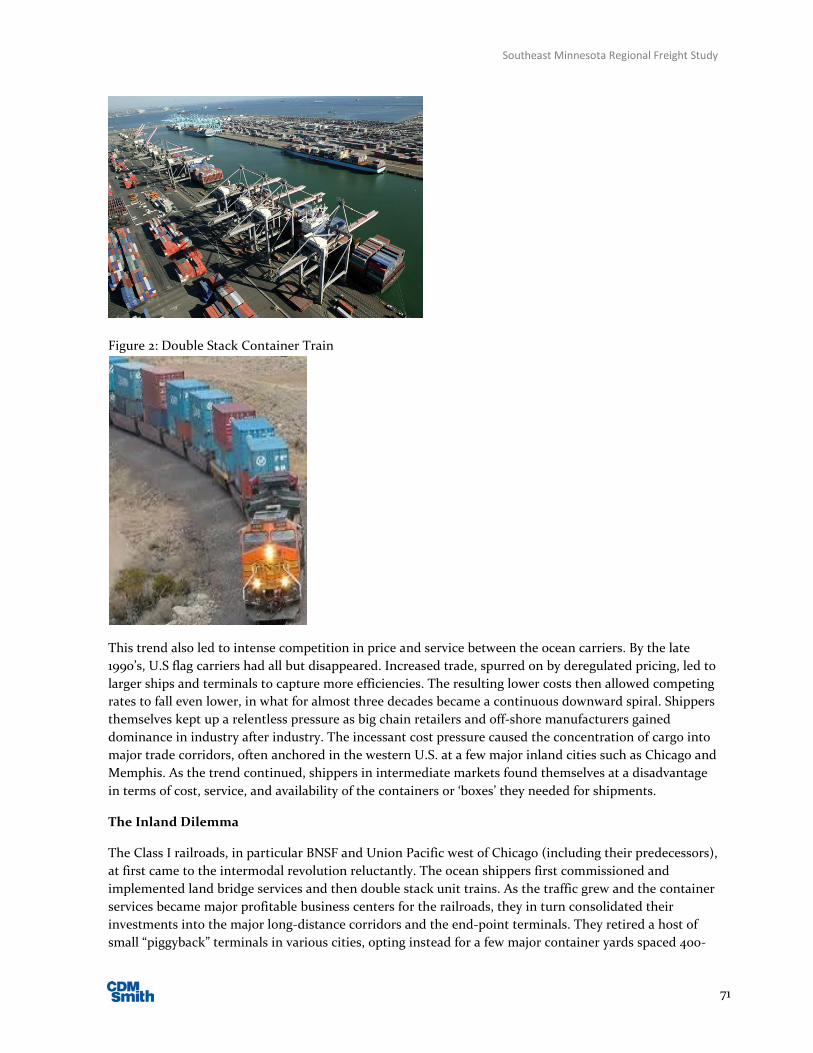
Southeast Minnesota Regional Freight Study
71
Figure 2: Double Stack Container Train
This trend also led to intense competition in price and service between the ocean carriers. By the late 1990’s, U.S flag carriers had all but disappeared. Increased trade, spurred on by deregulated pricing, led to larger ships and terminals to capture more efficiencies. The resulting lower costs then allowed competing rates to fall even lower, in what for almost three decades became a continuous downward spiral. Shippers themselves kept up a relentless pressure as big chain retailers and off-shore manufacturers gained dominance in industry after industry. The incessant cost pressure caused the concentration of cargo into major trade corridors, often anchored in the western U.S. at a few major inland cities such as Chicago and Memphis. As the trend continued, shippers in intermediate markets found themselves at a disadvantage in terms of cost, service, and availability of the containers or ‘boxes’ they needed for shipments.
The Inland Dilemma
The Class I railroads, in particular BNSF and Union Pacific west of Chicago (including their predecessors), at first came to the intermodal revolution reluctantly. The ocean shippers first commissioned and implemented land bridge services and then double stack unit trains. As the traffic grew and the container services became major profitable business centers for the railroads, they in turn consolidated their investments into the major long-distance corridors and the end-point terminals. They retired a host of small “piggyback” terminals in various cities, opting instead for a few major container yards spaced 400-
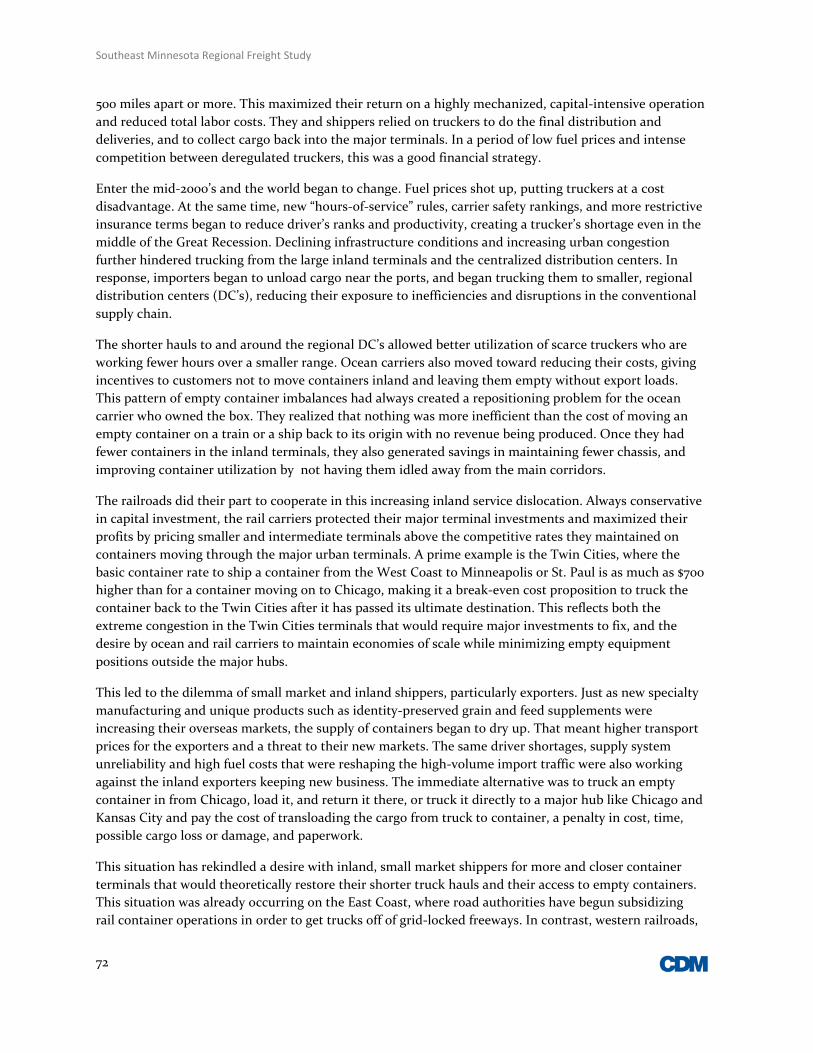
Southeast Minnesota Regional Freight Study
72
500 miles apart or more. This maximized their return on a highly mechanized, capital-intensive operation and reduced total labor costs. They and shippers relied on truckers to do the final distribution and deliveries, and to collect cargo back into the major terminals. In a period of low fuel prices and intense competition between deregulated truckers, this was a good financial strategy.
Enter the mid-2000’s and the world began to change. Fuel prices shot up, putting truckers at a cost disadvantage. At the same time, new “hours-of-service” rules, carrier safety rankings, and more restrictive insurance terms began to reduce driver’s ranks and productivity, creating a trucker’s shortage even in the middle of the Great Recession. Declining infrastructure conditions and increasing urban congestion further hindered trucking from the large inland terminals and the centralized distribution centers. In response, importers began to unload cargo near the ports, and began trucking them to smaller, regional distribution centers (DC’s), reducing their exposure to inefficiencies and disruptions in the conventional supply chain.
The shorter hauls to and around the regional DC’s allowed better utilization of scarce truckers who are working fewer hours over a smaller range. Ocean carriers also moved toward reducing their costs, giving incentives to customers not to move containers inland and leaving them empty without export loads. This pattern of empty container imbalances had always created a repositioning problem for the ocean carrier who owned the box. They realized that nothing was more inefficient than the cost of moving an empty container on a train or a ship back to its origin with no revenue being produced. Once they had fewer containers in the inland terminals, they also generated savings in maintaining fewer chassis, and improving container utilization by not having them idled away from the main corridors.
The railroads did their part to cooperate in this increasing inland service dislocation. Always conservative in capital investment, the rail carriers protected their major terminal investments and maximized their profits by pricing smaller and intermediate terminals above the competitive rates they maintained on containers moving through the major urban terminals. A prime example is the Twin Cities, where the basic container rate to ship a container from the West Coast to Minneapolis or St. Paul is as much as $700 higher than for a container moving on to Chicago, making it a break-even cost proposition to truck the container back to the Twin Cities after it has passed its ultimate destination. This reflects both the extreme congestion in the Twin Cities terminals that would require major investments to fix, and the desire by ocean and rail carriers to maintain economies of scale while minimizing empty equipment positions outside the major hubs.
This led to the dilemma of small market and inland shippers, particularly exporters. Just as new specialty manufacturing and unique products such as identity-preserved grain and feed supplements were increasing their overseas markets, the supply of containers began to dry up. That meant higher transport prices for the exporters and a threat to their new markets. The same driver shortages, supply system unreliability and high fuel costs that were reshaping the high-volume import traffic were also working against the inland exporters keeping new business. The immediate alternative was to truck an empty container in from Chicago, load it, and return it there, or truck it directly to a major hub like Chicago and Kansas City and pay the cost of transloading the cargo from truck to container, a penalty in cost, time, possible cargo loss or damage, and paperwork.
This situation has rekindled a desire with inland, small market shippers for more and closer container terminals that would theoretically restore their shorter truck hauls and their access to empty containers. This situation was already occurring on the East Coast, where road authorities have begun subsidizing rail container operations in order to get trucks off of grid-locked freeways. In contrast, western railroads,
Southeast Minnesota Regional Freight Study
73
heavily invested in their large terminals, high-velocity train networks and short of excess capacity, were hesitant to explore options that might reduce their unit profitability and raise labor and equipment costs.
Possible (alternate) routes to success
In the face of these challenges, some alternatives have proven successful. A possible formula for success is outlined below..
1. Short Line or motivated Class 1 RR;
Not enough can be said about a rail operator with an entrepreneurial spirit who is focused on new business development.
2. Anchor Customer;
A single large import customer can be a key toward paying the bills of a small operation, and generating empty boxes for exporters willing to partner with that business.
3. Realistic service expectation (less than JIT or daily, virtual ramps, cost and operations sharing);
Even if a small terminal is on a major mainline, the railroad may not want to stop a train daily for a few cars. A short line or branch line operation will want to collect enough cargo to make the long haul connection attractive to the Class I. The service expectations of the exporters and importers need to coincide with the efficiency expectations of the carriers.
4. Consistent volume & Consolidator;
The volume of shipments needs consistency to remain not only attractive to the carrier, but predictable in order to maximize efficiency and contain operating costs. This applies to terminal operations as much as to train operations. A local party, possibly a consolidator or third party logistics firm, can serve an invaluable service by coordinating shipments and volumes.
5. Carload lots outbound;
An exporter cannot expect to ship short-distance or less-than truckload lots from the local container terminal. Expectations to the contrary, the local container terminal does not qualify as a full-service shipping point similar to a warehouse or a UPS store.
6. Balance of traffic in and out;
For each container load in, a container load of outbound cargo has to be ready. An imbalance of trade will doom a small terminal much faster than a major container yard.
7. Mix of traffic and customers;
In order to create a consistent and balanced cargo flow, and grow the business, diversification is a key strategy. The larger and more diverse the pool of shippers, the more options present themselves to cover available equipment.
8. Long distance moves (import/export model);
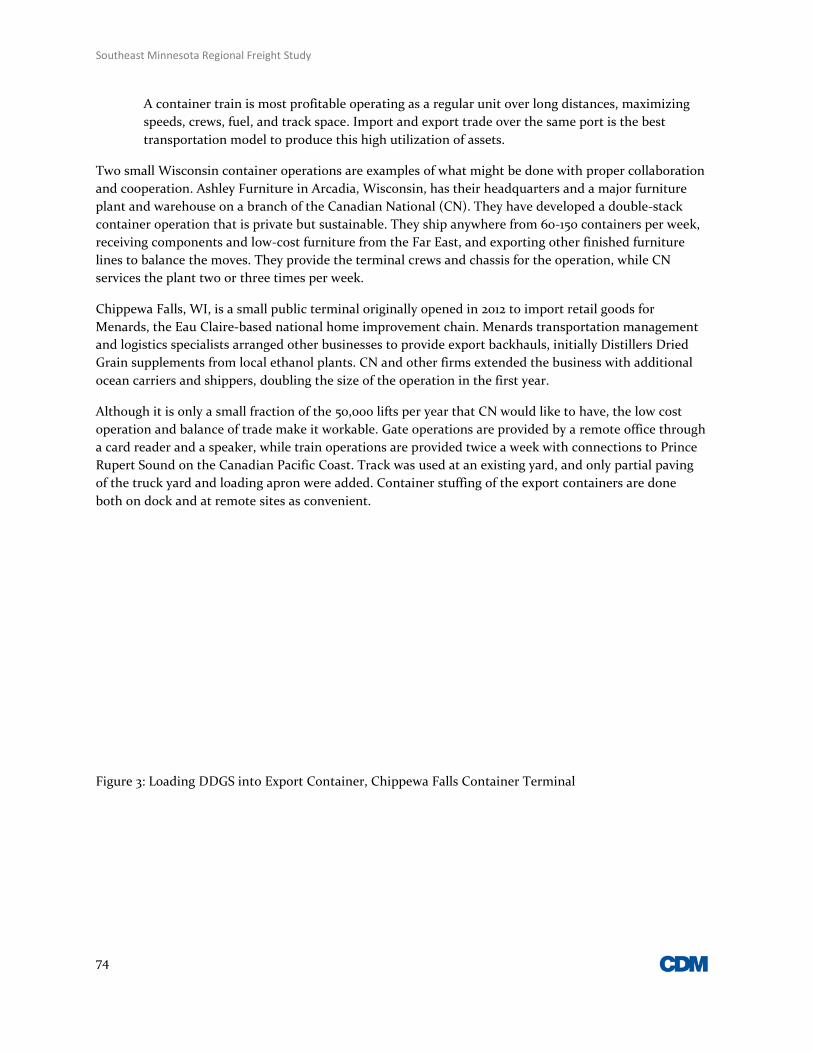
Southeast Minnesota Regional Freight Study
74
A container train is most profitable operating as a regular unit over long distances, maximizing speeds, crews, fuel, and track space. Import and export trade over the same port is the best transportation model to produce this high utilization of assets.
Two small Wisconsin container operations are examples of what might be done with proper collaboration and cooperation. Ashley Furniture in Arcadia, Wisconsin, has their headquarters and a major furniture plant and warehouse on a branch of the Canadian National (CN). They have developed a double-stack container operation that is private but sustainable. They ship anywhere from 60-150 containers per week, receiving components and low-cost furniture from the Far East, and exporting other finished furniture lines to balance the moves. They provide the terminal crews and chassis for the operation, while CN services the plant two or three times per week.
Chippewa Falls, WI, is a small public terminal originally opened in 2012 to import retail goods for Menards, the Eau Claire-based national home improvement chain. Menards transportation management and logistics specialists arranged other businesses to provide export backhauls, initially Distillers Dried Grain supplements from local ethanol plants. CN and other firms extended the business with additional ocean carriers and shippers, doubling the size of the operation in the first year.
Although it is only a small fraction of the 50,000 lifts per year that CN would like to have, the low cost operation and balance of trade make it workable. Gate operations are provided by a remote office through a card reader and a speaker, while train operations are provided twice a week with connections to Prince Rupert Sound on the Canadian Pacific Coast. Track was used at an existing yard, and only partial paving of the truck yard and loading apron were added. Container stuffing of the export containers are done both on dock and at remote sites as convenient.
Figure 3: Loading DDGS into Export Container, Chippewa Falls Container Terminal
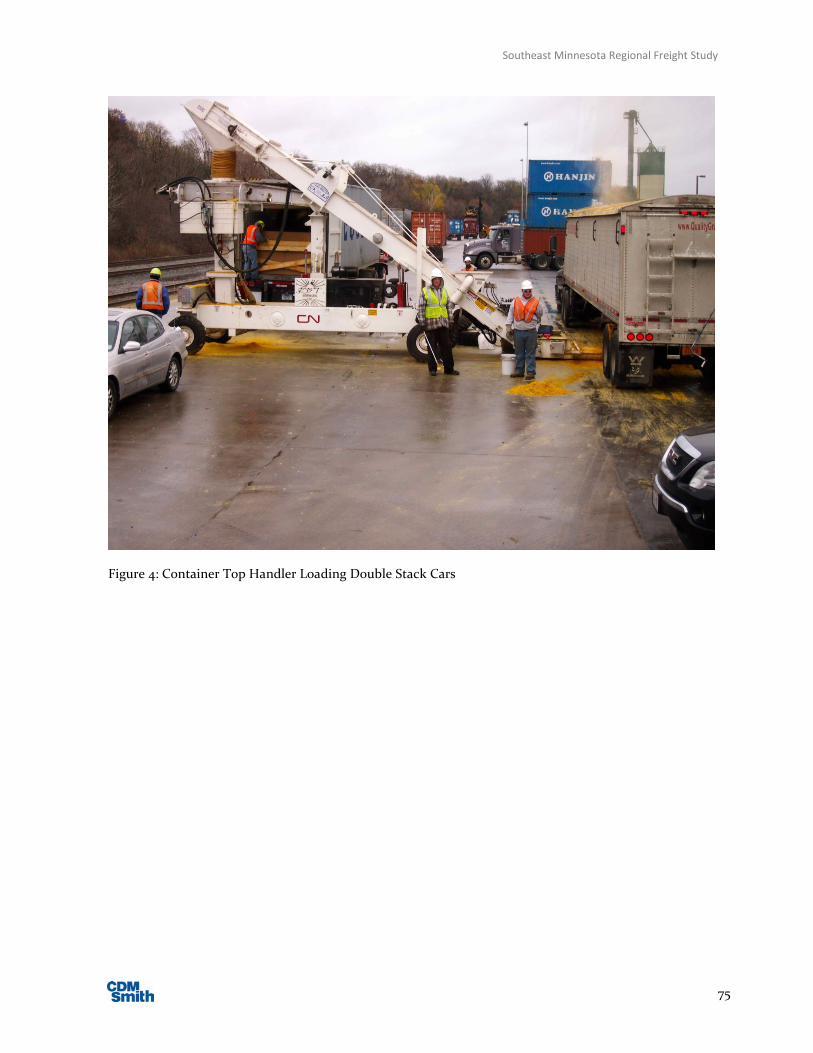
Southeast Minnesota Regional Freight Study
75
Figure 4: Container Top Handler Loading Double Stack Cars
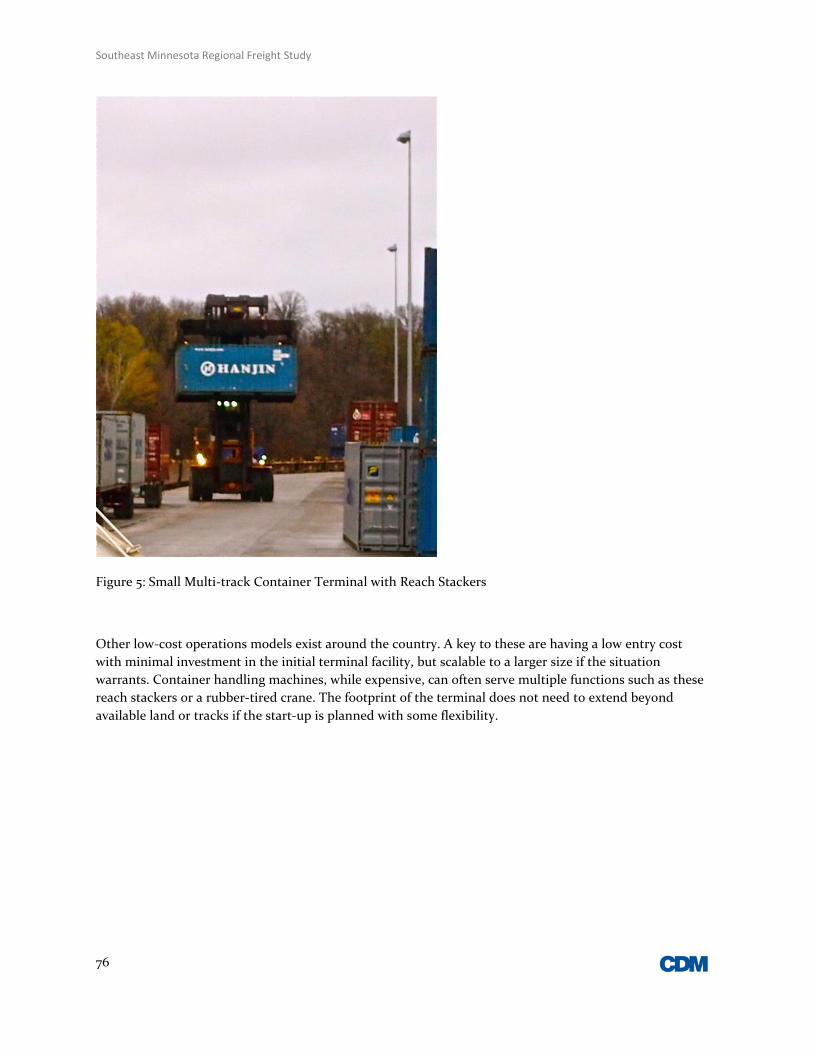
Southeast Minnesota Regional Freight Study
76
Figure 5: Small Multi-track Container Terminal with Reach Stackers
Other low-cost operations models exist around the country. A key to these are having a low entry cost with minimal investment in the initial terminal facility, but scalable to a larger size if the situation warrants. Container handling machines, while expensive, can often serve multiple functions such as these reach stackers or a rubber-tired crane. The footprint of the terminal does not need to extend beyond available land or tracks if the start-up is planned with some flexibility.
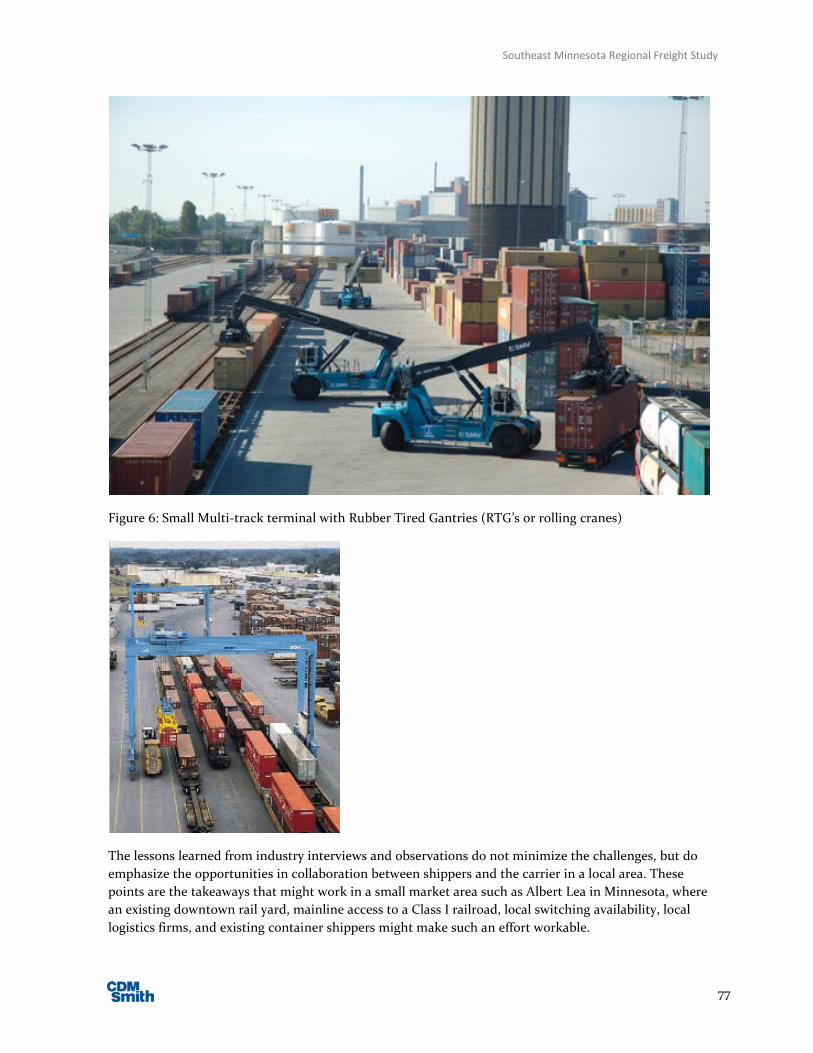
Southeast Minnesota Regional Freight Study
77
Figure 6: Small Multi-track terminal with Rubber Tired Gantries (RTG’s or rolling cranes)
The lessons learned from industry interviews and observations do not minimize the challenges, but do emphasize the opportunities in collaboration between shippers and the carrier in a local area. These points are the takeaways that might work in a small market area such as Albert Lea in Minnesota, where an existing downtown rail yard, mainline access to a Class I railroad, local switching availability, local logistics firms, and existing container shippers might make such an effort workable.
Southeast Minnesota Regional Freight Study
78
Consolidate & Collaborate: Both cargo and shippers need to cooperate and be willing to coordinate efforts
Recognize Costs: The operation has to make economic sense, whether in lowering railroad or terminal costs or establishing long term shipping or service commitments.
Partner: Short lines, shipping lines, economic development agencies, public sector (for the sake of economy-the ‘Big Picture’) should all be at the table and contributing
Utilize Logistics Firms; They have established customers and carrier contracts, and are in a position to generate business for the terminal.
Recognize Limitations of Logistics Firms: They are for-profit businesses and will operate out of self-interest. They cannot substitute for the engagement of the partners.
Look Ahead: Opportunities are coming. As other firms and commodities emerge in an area, it may create the tipping point for a new terminal venture that doesn’t currently exist. The upgrading of rail lines and establishment of new double stack corridors may also be the key to new and sustainable intermediate terminals.
Southeast Minnesota Regional Freight Study
79
Minnesota Department of Transportation
August 2012
Southeast Minnesota Regional Freight Study
REGIONAL BUSINESS INTERVIEWS
Southeast Minnesota Regional Freight Study
80
Table of Contents
Regional Interviews ................................................................................................................................................81
1. Modern Transport and Kohner Materials ...............................................................................................81
2. Mikrut Properties/Seven Rivers Terminal/Port Logistics .................................................................... 83
3. Cenex Harvest States (CHS) .................................................................................................................... 84
4. ADM & ARTCO......................................................................................................................................... 85
5. Fastenal ...................................................................................................................................................... 86
6. MBM Logistics .......................................................................................................................................... 87
7. Crenlo Cab Products ................................................................................................................................ 87
8. McNeilus Truck ........................................................................................................................................ 88
9. McQuay International ............................................................................................................................. 89
Attachment A ......................................................................................................................................................... 92
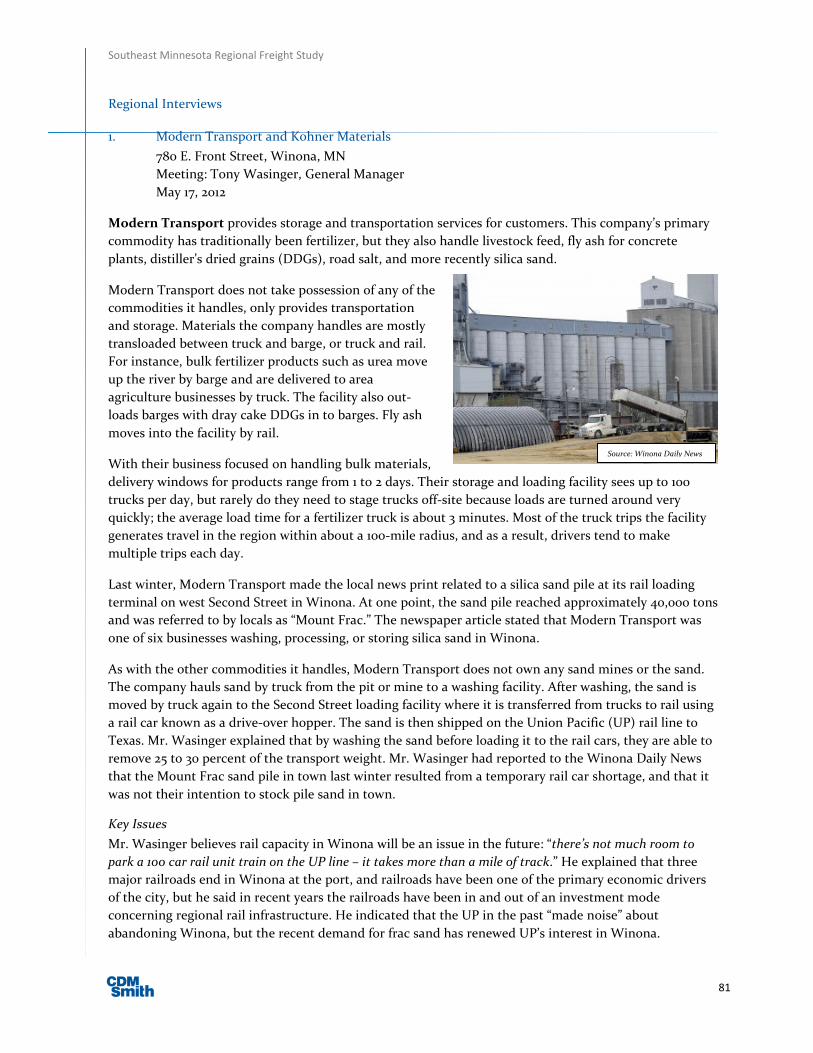
Southeast Minnesota Regional Freight Study
81
Regional Interviews
1. Modern Transport and Kohner Materials 780 E. Front Street, Winona, MN Meeting: Tony Wasinger, General Manager May 17, 2012
Modern Transport provides storage and transportation services for customers. This company’s primary commodity has traditionally been fertilizer, but they also handle livestock feed, fly ash for concrete plants, distiller’s dried grains (DDGs), road salt, and more recently silica sand.
Modern Transport does not take possession of any of the commodities it handles, only provides transportation and storage. Materials the company handles are mostly transloaded between truck and barge, or truck and rail. For instance, bulk fertilizer products such as urea move up the river by barge and are delivered to area agriculture businesses by truck. The facility also out-loads barges with dray cake DDGs in to barges. Fly ash moves into the facility by rail.
With their business focused on handling bulk materials, delivery windows for products range from 1 to 2 days. Their storage and loading facility sees up to 100 trucks per day, but rarely do they need to stage trucks off-site because loads are turned around very quickly; the average load time for a fertilizer truck is about 3 minutes. Most of the truck trips the facility generates travel in the region within about a 100-mile radius, and as a result, drivers tend to make multiple trips each day.
Last winter, Modern Transport made the local news print related to a silica sand pile at its rail loading terminal on west Second Street in Winona. At one point, the sand pile reached approximately 40,000 tons and was referred to by locals as “Mount Frac.” The newspaper article stated that Modern Transport was one of six businesses washing, processing, or storing silica sand in Winona.
As with the other commodities it handles, Modern Transport does not own any sand mines or the sand. The company hauls sand by truck from the pit or mine to a washing facility. After washing, the sand is moved by truck again to the Second Street loading facility where it is transferred from trucks to rail using a rail car known as a drive-over hopper. The sand is then shipped on the Union Pacific (UP) rail line to Texas. Mr. Wasinger explained that by washing the sand before loading it to the rail cars, they are able to remove 25 to 30 percent of the transport weight. Mr. Wasinger had reported to the Winona Daily News that the Mount Frac sand pile in town last winter resulted from a temporary rail car shortage, and that it was not their intention to stock pile sand in town.
Key Issues Mr. Wasinger believes rail capacity in Winona will be an issue in the future: “there’s not much room to park a 100 car rail unit train on the UP line – it takes more than a mile of track.” He explained that three major railroads end in Winona at the port, and railroads have been one of the primary economic drivers of the city, but he said in recent years the railroads have been in and out of an investment mode concerning regional rail infrastructure. He indicated that the UP in the past “made noise” about abandoning Winona, but the recent demand for frac sand has renewed UP’s interest in Winona.
Source: Winona Daily News
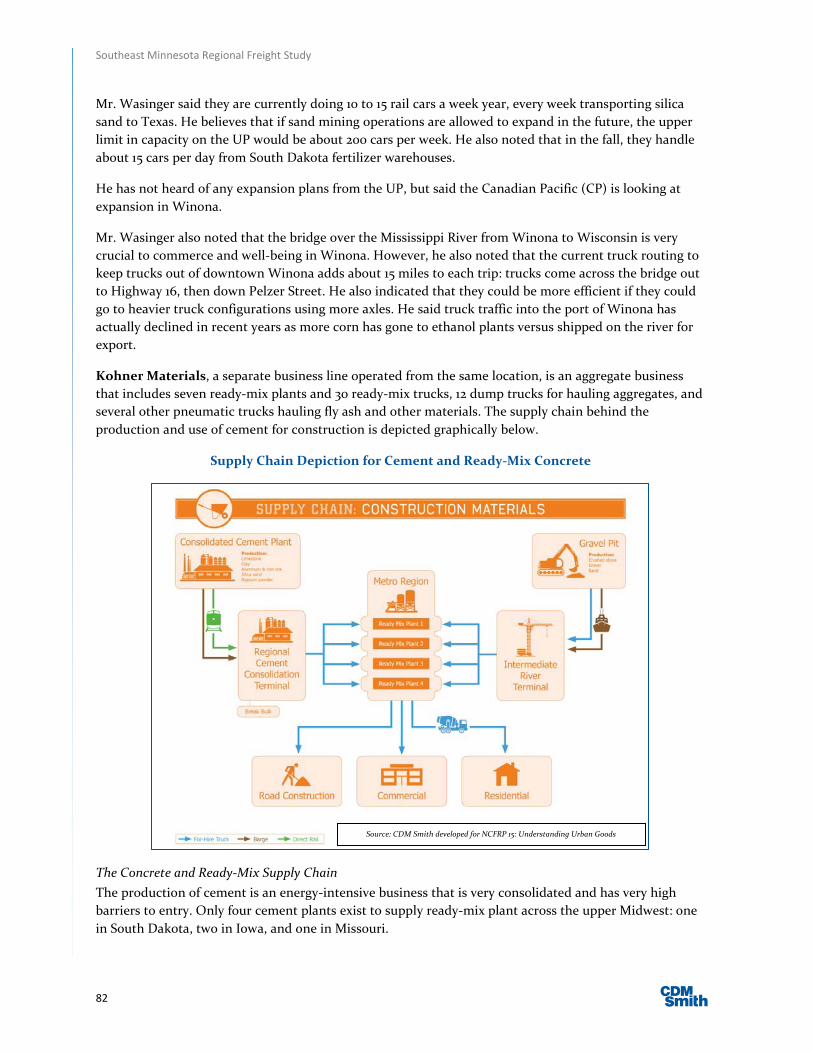
Southeast Minnesota Regional Freight Study
82
Mr. Wasinger said they are currently doing 10 to 15 rail cars a week year, every week transporting silica sand to Texas. He believes that if sand mining operations are allowed to expand in the future, the upper limit in capacity on the UP would be about 200 cars per week. He also noted that in the fall, they handle about 15 cars per day from South Dakota fertilizer warehouses.
He has not heard of any expansion plans from the UP, but said the Canadian Pacific (CP) is looking at expansion in Winona.
Mr. Wasinger also noted that the bridge over the Mississippi River from Winona to Wisconsin is very crucial to commerce and well-being in Winona. However, he also noted that the current truck routing to keep trucks out of downtown Winona adds about 15 miles to each trip: trucks come across the bridge out to Highway 16, then down Pelzer Street. He also indicated that they could be more efficient if they could go to heavier truck configurations using more axles. He said truck traffic into the port of Winona has actually declined in recent years as more corn has gone to ethanol plants versus shipped on the river for export.
Kohner Materials, a separate business line operated from the same location, is an aggregate business that includes seven ready-mix plants and 30 ready-mix trucks, 12 dump trucks for hauling aggregates, and several other pneumatic trucks hauling fly ash and other materials. The supply chain behind the production and use of cement for construction is depicted graphically below.
Supply Chain Depiction for Cement and Ready-Mix Concrete
The Concrete and Ready-Mix Supply Chain The production of cement is an energy-intensive business that is very consolidated and has very high barriers to entry. Only four cement plants exist to supply ready-mix plant across the upper Midwest: one in South Dakota, two in Iowa, and one in Missouri.
Source: CDM Smith developed for NCFRP 15: Understanding Urban Goods
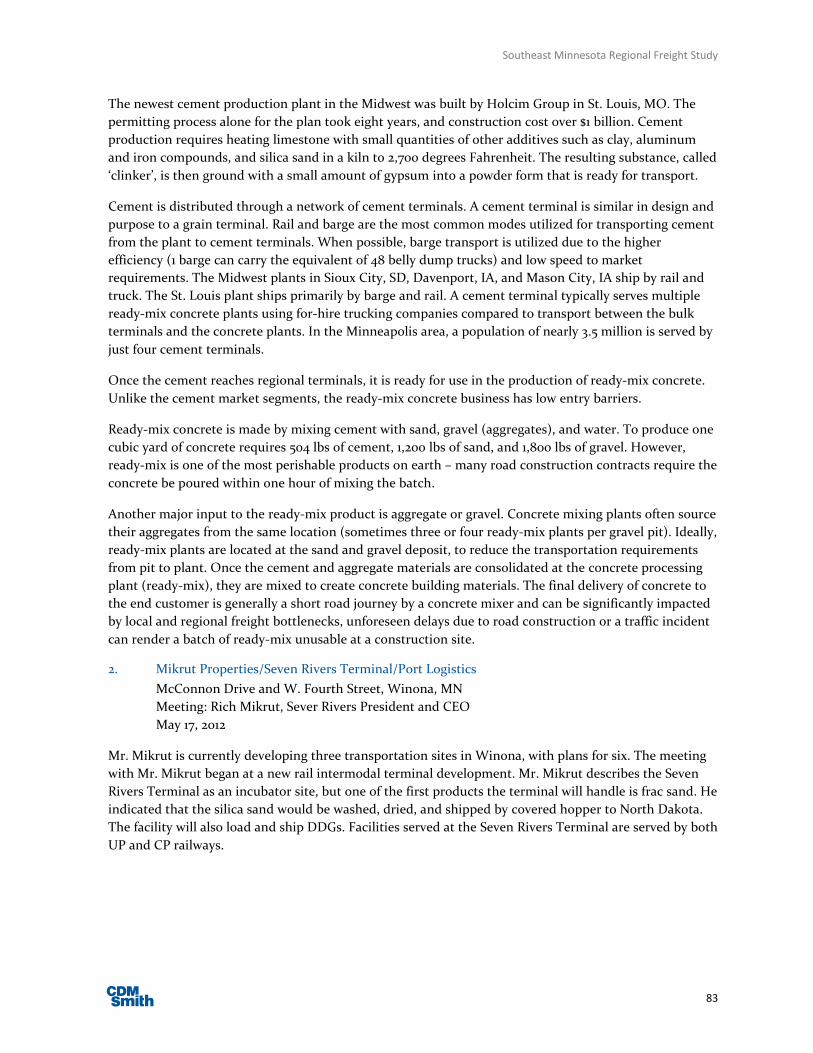
Southeast Minnesota Regional Freight Study
83
The newest cement production plant in the Midwest was built by Holcim Group in St. Louis, MO. The permitting process alone for the plan took eight years, and construction cost over $1 billion. Cement production requires heating limestone with small quantities of other additives such as clay, aluminum and iron compounds, and silica sand in a kiln to 2,700 degrees Fahrenheit. The resulting substance, called ‘clinker’, is then ground with a small amount of gypsum into a powder form that is ready for transport.
Cement is distributed through a network of cement terminals. A cement terminal is similar in design and purpose to a grain terminal. Rail and barge are the most common modes utilized for transporting cement from the plant to cement terminals. When possible, barge transport is utilized due to the higher efficiency (1 barge can carry the equivalent of 48 belly dump trucks) and low speed to market requirements. The Midwest plants in Sioux City, SD, Davenport, IA, and Mason City, IA ship by rail and truck. The St. Louis plant ships primarily by barge and rail. A cement terminal typically serves multiple ready-mix concrete plants using for-hire trucking companies compared to transport between the bulk terminals and the concrete plants. In the Minneapolis area, a population of nearly 3.5 million is served by just four cement terminals.
Once the cement reaches regional terminals, it is ready for use in the production of ready-mix concrete. Unlike the cement market segments, the ready-mix concrete business has low entry barriers.
Ready-mix concrete is made by mixing cement with sand, gravel (aggregates), and water. To produce one cubic yard of concrete requires 504 lbs of cement, 1,200 lbs of sand, and 1,800 lbs of gravel. However, ready-mix is one of the most perishable products on earth – many road construction contracts require the concrete be poured within one hour of mixing the batch.
Another major input to the ready-mix product is aggregate or gravel. Concrete mixing plants often source their aggregates from the same location (sometimes three or four ready-mix plants per gravel pit). Ideally, ready-mix plants are located at the sand and gravel deposit, to reduce the transportation requirements from pit to plant. Once the cement and aggregate materials are consolidated at the concrete processing plant (ready-mix), they are mixed to create concrete building materials. The final delivery of concrete to the end customer is generally a short road journey by a concrete mixer and can be significantly impacted by local and regional freight bottlenecks, unforeseen delays due to road construction or a traffic incident can render a batch of ready-mix unusable at a construction site.
2. Mikrut Properties/Seven Rivers Terminal/Port Logistics McConnon Drive and W. Fourth Street, Winona, MN Meeting: Rich Mikrut, Sever Rivers President and CEO May 17, 2012
Mr. Mikrut is currently developing three transportation sites in Winona, with plans for six. The meeting with Mr. Mikrut began at a new rail intermodal terminal development. Mr. Mikrut describes the Seven Rivers Terminal as an incubator site, but one of the first products the terminal will handle is frac sand. He indicated that the silica sand would be washed, dried, and shipped by covered hopper to North Dakota. The facility will also load and ship DDGs. Facilities served at the Seven Rivers Terminal are served by both UP and CP railways.
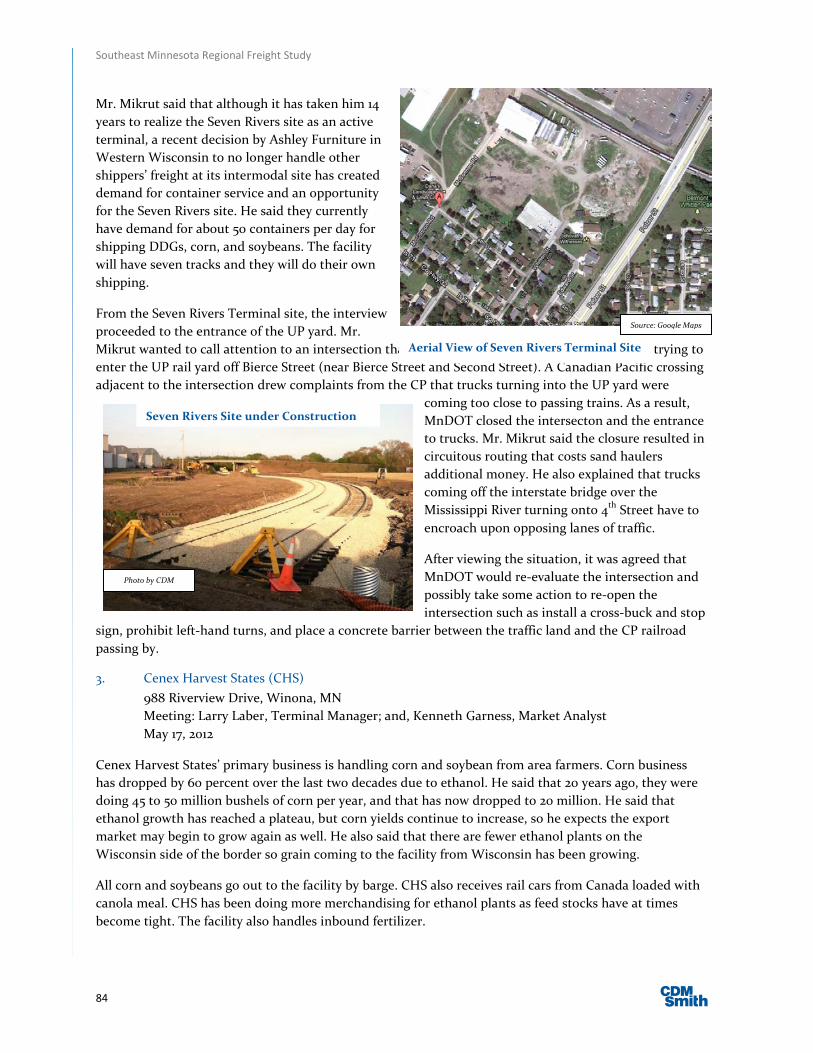
Southeast Minnesota Regional Freight Study
84
Mr. Mikrut said that although it has taken him 14 years to realize the Seven Rivers site as an active terminal, a recent decision by Ashley Furniture in Western Wisconsin to no longer handle other shippers’ freight at its intermodal site has created demand for container service and an opportunity for the Seven Rivers site. He said they currently have demand for about 50 containers per day for shipping DDGs, corn, and soybeans. The facility will have seven tracks and they will do their own shipping.
From the Seven Rivers Terminal site, the interview proceeded to the entrance of the UP yard. Mr. Mikrut wanted to call attention to an intersection that was not designed to accommodate trucks trying to enter the UP rail yard off Bierce Street (near Bierce Street and Second Street). A Canadian Pacific crossing adjacent to the intersection drew complaints from the CP that trucks turning into the UP yard were
coming too close to passing trains. As a result, MnDOT closed the intersecton and the entrance to trucks. Mr. Mikrut said the closure resulted in circuitous routing that costs sand haulers additional money. He also explained that trucks coming off the interstate bridge over the Mississippi River turning onto 4th Street have to encroach upon opposing lanes of traffic.
After viewing the situation, it was agreed that MnDOT would re-evaluate the intersection and possibly take some action to re-open the intersection such as install a cross-buck and stop
sign, prohibit left-hand turns, and place a concrete barrier between the traffic land and the CP railroad passing by.
3. Cenex Harvest States (CHS) 988 Riverview Drive, Winona, MN Meeting: Larry Laber, Terminal Manager; and, Kenneth Garness, Market Analyst May 17, 2012
Cenex Harvest States’ primary business is handling corn and soybean from area farmers. Corn business has dropped by 60 percent over the last two decades due to ethanol. He said that 20 years ago, they were doing 45 to 50 million bushels of corn per year, and that has now dropped to 20 million. He said that ethanol growth has reached a plateau, but corn yields continue to increase, so he expects the export market may begin to grow again as well. He also said that there are fewer ethanol plants on the Wisconsin side of the border so grain coming to the facility from Wisconsin has been growing.
All corn and soybeans go out to the facility by barge. CHS also receives rail cars from Canada loaded with canola meal. CHS has been doing more merchandising for ethanol plants as feed stocks have at times become tight. The facility also handles inbound fertilizer.
Source: Google Maps
Aerial View of Seven Rivers Terminal Site
Seven Rivers Site under Construction
Photo by CDM
Southeast Minnesota Regional Freight Study
85
The facility doesn’t ship anything outbound by rail – Winona has historically been a destination. Currently, the CHS facility sees between 100 and 300 trucks per day depending on the search. They load 1 or 2 barges per day all for international export. Barges leaving Winona loaded with grain proceed downriver to the CHS export elevator at Myrtle Grove, LA where grain is transloaded to ocean-going vessels. Mr. Laber said that CHS is investing an additional $10 million in load-out facilities at Myrtle Grove because they believe bigger ships coming through the Panama Canal will change the business.
He explained that because some buyers are willing to pay a premium for non-GMO grains ($.30 per bushel more), they hold non-GMO grain in a separate tank until they have enough volume to fill a barge.
He said CHS is currently evaluating how they might use or “fit-in” to the new Seven Rivers container loading facility that will open soon.
Mr. Laber said the only issues their facility experiences is some congestion at shift changes, and when volume gets up in to the 300 trucks per day range, trucks have to stage on side streets due to the lack of staging on facility grounds. There is no set schedule for incoming trucks, and due to the bulk nature of the shipping, more orders are made with a 2 to 4 week delivery window.
He did say that the TH-43 river bridge over to Wisconsin is critical to both the residents and businesses in Winona. The bridge supports 1,800 employees who work in Winona each day but live in Buffalo County, Wisconsin. He said that he believes in a few years that grain trucks crossing the bridge will rival the number of sand trucks crossing the bridge. So keeping the bridge open, and in good repair to accommodate the growth in truck and commuter traffic, is critical to the vitality of the community.
4. ADM & ARTCO (ARTCO is a division of ADM that provides transportation services) 1155 Riverview Drive Meeting: Byron Schmidt, Manager; and, Randal Sveum, ARTCO Area Manager May 17, 2012
The ADM facility sources grain from about a 50 to 60 mile radius. Wisconsin grain has been growing – the genetics used by Wisconsin farmers has been getting better and their yields are growing significantly. The facility loads barges with soybeans and corn for export through New Orleans. ADM also loads some rail cars bound to Chicago.
Mr. Schmidt said that due to the volume of grain coming from Wisconsin, the TH-43 bridge is a growing concern, because when the bridge closed, trucks had to detour 80 to 100 miles. He said that they are anticipating 1,400 sand trucks per day will cross the bridge in both directions. He said he has heard some proposals to build rail facilities on the Wisconsin side, because replacing the bridge is not a matter of “if”, it is only a matter of “when.” He said if the bridge closes it would have significant economic impacts to the city.
Mr. Schmidt said that ADM pays out approximately $500 million to regional farmers for crops each year. Most of the trucks hauling grain are farmer-owned and he said some drivers and truck operators have left the area to work in North Dakota.
During peak season, the facility unloads 150 trucks per day, and loads 2 to 3 barges per day. He said their facility can dump 36 trucks per hour at their dual unload facility. Mr. Schmidt said there are a lot of infrastructure needs on the river, including dredging and lock and dam repair/replacement. The upper Mississippi can handle 15 barge tows that must pass through 27 locks. He said the harbor north of TH-43
Southeast Minnesota Regional Freight Study
86
bridge is a bottleneck and that the harbor needs additional dredging. He said that when the lock before the Minneapolis upper harbor closed temporarily they notice a drop in traffic to Minneapolis/St. Paul. He said because the upper river is a seasonal market due to weather, they must be able to handle a year’s worth of volume in 8 months, making it even more important that lock and dam infrastructure be maintained to afford good efficiency when the river is open.
Locally, Mr. Sveum noted that the completion of upgrades to Pelzer Street have been very helpful. He believes some of the public concerns over the high volumes of commodities moving on Riverview Drive would benefit from a public education campaign.
He also noted that the state’s Port Development Program is very important for continued success of the state’s waterway systems.
5. Fastenal 2001 Theurer Boulevard, Winona, MN Meeting: Chris Duffenback, National Logistics Manager; and, Kevin Larson May 17, 2012
Fastenal began first began operations 1967 when company founder Bob Kierlin opened the very first Fastenal store in his hometown of Winona, MN and adopted the business philosophy of "Growth Through Customer Service." Today, Fastenal has over 2,600 store locations and employs over 10,000 people. Each Fastenal store is a local, one-stop source for a spectrum of OEM, MRO and Construction supplies including a broad core inventory of commonly used products, as well as items that are custom-stocked to meet individual customers' needs.
The customer-centered philosophy has resulted in annual average growth of about 20 percent. Fastenal’s largest distribution facility is in Indianapolis where they have installed an Automated Storage Retrieval System (ASRS). However, of the approximately 500 containers Fastenal receives each month from suppliers in Asia, about 20 percent are dropped in the Twin Cities and then unloaded in Winona.
The Fastenal truck fleet operating out of Winona services about 25 routes each night; the fleet of 38 tractor semi-trailer units log approximately 500,000 miles each month. Drivers leave each evening and two-thirds of all the company’s deliveries occur before 7:00 a.m. The Winona fleet services locations such as Fargo, Duluth and Eau Claire, WI. Drivers go out and return, often through the Twin Cities where they pick-up vendor products.
The companies’ distribution system also runs 5,500 pickup trucks. Pick-up trucks make deliveries to individual stores or facilities where the company dispenses products from vending machines. For example, in some manufacturing plants Fastenal vending machines allow employees to pull parts by entering a job number. The system automatically tracks inventory and allows plant managers to track employee use of parts.
A typical store receives a couple of pallets loaded with mixed industrial supplies, weighing on average 8,500 pounds. Mr. Larson said their typical distribution center line-haul trucks weigh out at about 70,000 lbs., while delivery trucks typically weigh less than 60,000 lbs. Weighing out is a concern as they continue to grow, but they have attempted to hold the weight of their trucks under the maximum legal limit by using composite materials for pallets, bubble wrap, etc.
The company operates retail stores in all of North America (U.S., Canada, and Mexico). They also have stores in Europe, Brazil, and Puerto Rico, and are entering the Chinese market.
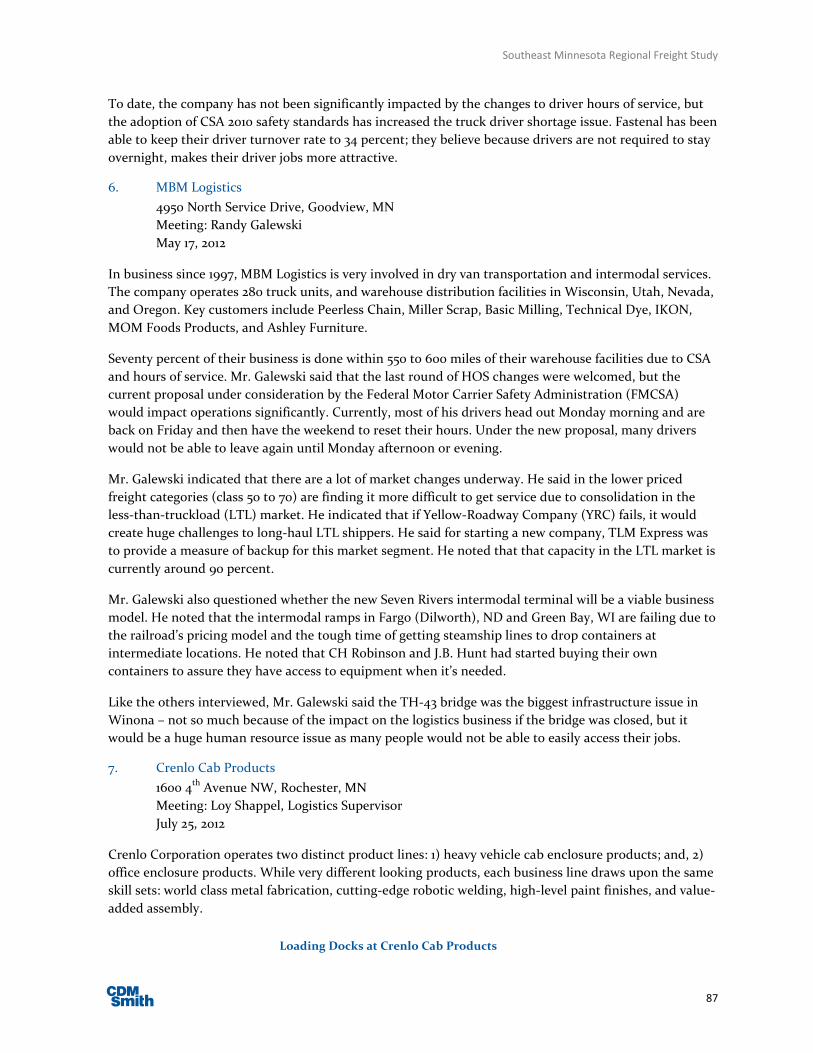
Southeast Minnesota Regional Freight Study
87
To date, the company has not been significantly impacted by the changes to driver hours of service, but the adoption of CSA 2010 safety standards has increased the truck driver shortage issue. Fastenal has been able to keep their driver turnover rate to 34 percent; they believe because drivers are not required to stay overnight, makes their driver jobs more attractive.
6. MBM Logistics 4950 North Service Drive, Goodview, MN Meeting: Randy Galewski May 17, 2012
In business since 1997, MBM Logistics is very involved in dry van transportation and intermodal services. The company operates 280 truck units, and warehouse distribution facilities in Wisconsin, Utah, Nevada, and Oregon. Key customers include Peerless Chain, Miller Scrap, Basic Milling, Technical Dye, IKON, MOM Foods Products, and Ashley Furniture.
Seventy percent of their business is done within 550 to 600 miles of their warehouse facilities due to CSA and hours of service. Mr. Galewski said that the last round of HOS changes were welcomed, but the current proposal under consideration by the Federal Motor Carrier Safety Administration (FMCSA) would impact operations significantly. Currently, most of his drivers head out Monday morning and are back on Friday and then have the weekend to reset their hours. Under the new proposal, many drivers would not be able to leave again until Monday afternoon or evening.
Mr. Galewski indicated that there are a lot of market changes underway. He said in the lower priced freight categories (class 50 to 70) are finding it more difficult to get service due to consolidation in the less-than-truckload (LTL) market. He indicated that if Yellow-Roadway Company (YRC) fails, it would create huge challenges to long-haul LTL shippers. He said for starting a new company, TLM Express was to provide a measure of backup for this market segment. He noted that that capacity in the LTL market is currently around 90 percent.
Mr. Galewski also questioned whether the new Seven Rivers intermodal terminal will be a viable business model. He noted that the intermodal ramps in Fargo (Dilworth), ND and Green Bay, WI are failing due to the railroad’s pricing model and the tough time of getting steamship lines to drop containers at intermediate locations. He noted that CH Robinson and J.B. Hunt had started buying their own containers to assure they have access to equipment when it’s needed.
Like the others interviewed, Mr. Galewski said the TH-43 bridge was the biggest infrastructure issue in Winona – not so much because of the impact on the logistics business if the bridge was closed, but it would be a huge human resource issue as many people would not be able to easily access their jobs.
7. Crenlo Cab Products 1600 4th Avenue NW, Rochester, MN Meeting: Loy Shappel, Logistics Supervisor July 25, 2012
Crenlo Corporation operates two distinct product lines: 1) heavy vehicle cab enclosure products; and, 2) office enclosure products. While very different looking products, each business line draws upon the same skill sets: world class metal fabrication, cutting-edge robotic welding, high-level paint finishes, and value-added assembly.
Loading Docks at Crenlo Cab Products
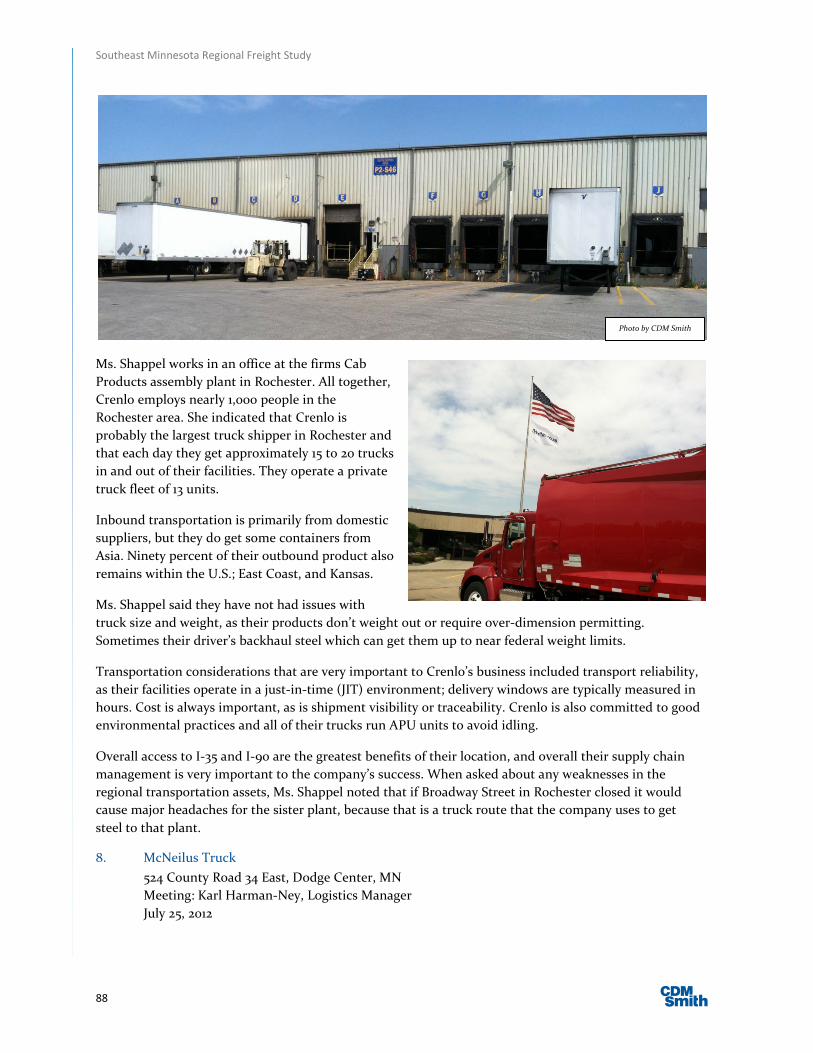
Southeast Minnesota Regional Freight Study
88
Ms. Shappel works in an office at the firms Cab Products assembly plant in Rochester. All together, Crenlo employs nearly 1,000 people in the Rochester area. She indicated that Crenlo is probably the largest truck shipper in Rochester and that each day they get approximately 15 to 20 trucks in and out of their facilities. They operate a private truck fleet of 13 units.
Inbound transportation is primarily from domestic suppliers, but they do get some containers from Asia. Ninety percent of their outbound product also remains within the U.S.; East Coast, and Kansas.
Ms. Shappel said they have not had issues with truck size and weight, as their products don’t weight out or require over-dimension permitting. Sometimes their driver’s backhaul steel which can get them up to near federal weight limits.
Transportation considerations that are very important to Crenlo’s business included transport reliability, as their facilities operate in a just-in-time (JIT) environment; delivery windows are typically measured in hours. Cost is always important, as is shipment visibility or traceability. Crenlo is also committed to good environmental practices and all of their trucks run APU units to avoid idling.
Overall access to I-35 and I-90 are the greatest benefits of their location, and overall their supply chain management is very important to the company’s success. When asked about any weaknesses in the regional transportation assets, Ms. Shappel noted that if Broadway Street in Rochester closed it would cause major headaches for the sister plant, because that is a truck route that the company uses to get steel to that plant.
8. McNeilus Truck 524 County Road 34 East, Dodge Center, MN Meeting: Karl Harman-Ney, Logistics Manager July 25, 2012
Photo by CDM Smith
Southeast Minnesota Regional Freight Study
89
McNeilus Companies is an industry leader in the Concrete Mixer and Refuse truck manufacturing industries. McNeilus mixers have been delivering concrete to virtually every major construction project in the U.S. since 1975. In 1998, McNeilus was purchased by the Oshkosh Truck Corporation, makers of fire trucks and other specialty truck equipment.
The facility is located in Dodge Center; McNeilus Truck is a separate business from McNeilus Steel also located in Dodge Center. The McNeilus Truck plant in Dodge Center fabricates and assembles refuse trucks. The plant employs between 500 and 1,000 employees. McNeilus Truck also maintains 25 facilities across the nation for aftermarket parts and service.
The company purchases chassis and other parts and the trucks are assembled in Dodge Center with a variety of engines and other components. Mrs. Hartman-Ney said that garbage trucks using compressed natural gas (CNG) engines have been McNeilus’ fastest growing market, and currently 60 percent of the trucks going out the door are equipped with CNG engines. Components for fabricating trucks come from nearby McNeilus Steel, Wisconsin, Alabama, Ontario, and South America. Outbound, McNeilus ships trucks to all 50 states, Canada (London Machinery in Ontario another Oshkosh company and strategic partner), and Mexico.
The company produces about 300 trucks per month, and it contracts out all of its transportation services. Outbound freight is primarily finished trucks either driven to the customer or hauled on flatbed trailers. (Also an occasional rail move from the Twin Cities to British Columbia). Inbound freight consists of hundreds of parcel, less-than-truckload, and truckload shipments of parts on a daily basis.
Mrs. Hartman-Ney said that CNG trucks now leaving the plant can be driven to the East Coast because the CNG fueling infrastructure is now in place, but that the route that must be taken is not always the most direct.
California and Seattle are two of the company’s fastest growing markets; however, CNG trucks moving west must be transported by flatbed because the refueling infrastructure does not exist in the Upper Great Plains. Refuse trucks moving on a flatbed require the acquisition for over-height special permits, which often take a long time to get. She said that not only does getting a permit take too long, but permits are not issued on weekends, which is another issue.
The company does sometimes run into maximum weight issues, but these can typically be mitigated by moving axles apart to conform to the federal bridge formula.
The company has season peaks that coincide with the construction season. Following the recession, the lack of housing starts hurt new sales somewhat but after-market parts were very strong. Generally “on-time delivery” is measured in days.
Overall the company has not experienced many transportation issues. At times it has been somewhat difficult to get the right equipment for delivering finished trucks – McNeilus likes to use Removable Goose Neck trailers, but at times this equipment is hard to find.
Regarding the regional infrastructure, I-35 and I-90 were viewed as crucial infrastructure. Trunk Highway 14 has historically been lacking, but with the last segments of the highway either under construction or soon to be under construction to create a 4-lane facility between Rochester and Owatonna, this road should no longer be an issue.
9. McQuay International
Photo by CDM Smith
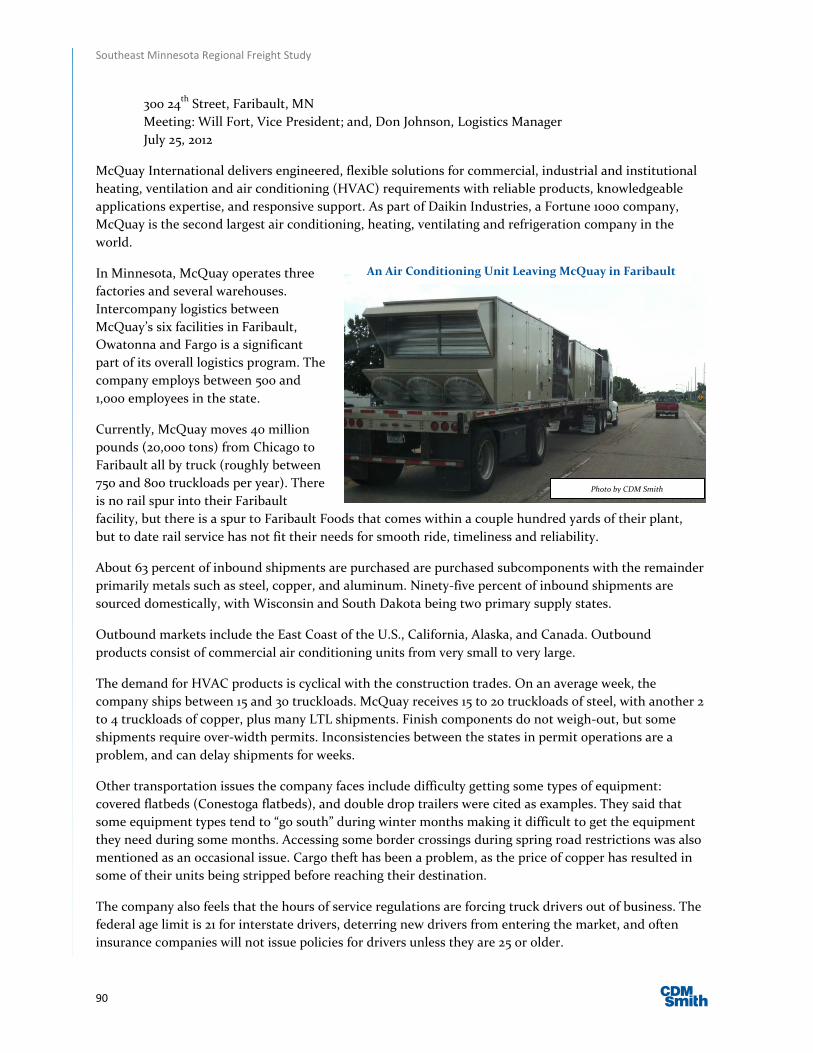
Southeast Minnesota Regional Freight Study
90
300 24th Street, Faribault, MN Meeting: Will Fort, Vice President; and, Don Johnson, Logistics Manager July 25, 2012
McQuay International delivers engineered, flexible solutions for commercial, industrial and institutional heating, ventilation and air conditioning (HVAC) requirements with reliable products, knowledgeable applications expertise, and responsive support. As part of Daikin Industries, a Fortune 1000 company, McQuay is the second largest air conditioning, heating, ventilating and refrigeration company in the world.
In Minnesota, McQuay operates three factories and several warehouses. Intercompany logistics between McQuay’s six facilities in Faribault, Owatonna and Fargo is a significant part of its overall logistics program. The company employs between 500 and 1,000 employees in the state.
Currently, McQuay moves 40 million pounds (20,000 tons) from Chicago to Faribault all by truck (roughly between 750 and 800 truckloads per year). There is no rail spur into their Faribault facility, but there is a spur to Faribault Foods that comes within a couple hundred yards of their plant, but to date rail service has not fit their needs for smooth ride, timeliness and reliability.
About 63 percent of inbound shipments are purchased are purchased subcomponents with the remainder primarily metals such as steel, copper, and aluminum. Ninety-five percent of inbound shipments are sourced domestically, with Wisconsin and South Dakota being two primary supply states.
Outbound markets include the East Coast of the U.S., California, Alaska, and Canada. Outbound products consist of commercial air conditioning units from very small to very large.
The demand for HVAC products is cyclical with the construction trades. On an average week, the company ships between 15 and 30 truckloads. McQuay receives 15 to 20 truckloads of steel, with another 2 to 4 truckloads of copper, plus many LTL shipments. Finish components do not weigh-out, but some shipments require over-width permits. Inconsistencies between the states in permit operations are a problem, and can delay shipments for weeks.
Other transportation issues the company faces include difficulty getting some types of equipment: covered flatbeds (Conestoga flatbeds), and double drop trailers were cited as examples. They said that some equipment types tend to “go south” during winter months making it difficult to get the equipment they need during some months. Accessing some border crossings during spring road restrictions was also mentioned as an occasional issue. Cargo theft has been a problem, as the price of copper has resulted in some of their units being stripped before reaching their destination.
The company also feels that the hours of service regulations are forcing truck drivers out of business. The federal age limit is 21 for interstate drivers, deterring new drivers from entering the market, and often insurance companies will not issue policies for drivers unless they are 25 or older.
An Air Conditioning Unit Leaving McQuay in Faribault
Photo by CDM Smith
Southeast Minnesota Regional Freight Study
91
Rough roads are also an issue for their equipment; not only do rough roads wear out trucks and raise rates, but the company did a study and measured the forces on trucks traveling between Minnesota and California. The study found g-forces of up to 16 Gs from potholes, enough force to ruin copper joints.
Overall, supply chain operations are very important to the company. McQuay ships a wide variety of relatively light-weight products, and transportation makes up 4 to 12 percent of sales depending on the product. The company is constantly reviewing its supply chain to reduce environmental impacts and reduce costs. They have consolidated warehouse space and, whenever possible, consolidate LTL shipments to truckload. However, they currently have a large imbalance of shipments with steel coming by truck from Chicago and little going back, making their rates high. While they have explored rail options, they don’t believe their products would withstand the rougher ride and rocking that rail cars can expose shipments to, and since much of their equipment goes directly to job sites, it would require additional handling.
The company representatives said that driver shortages and artificially high diesel prices are key issues they face. Mr. Johnson believes that fuel tax increases are leading to carriers repeatedly issuing fuel surcharges.
Mr. Johnson provided a page of written comments t the conclusion of the interview, which are included as Attachment A.
Southeast Minnesota Regional Freight Study
92
Attachment A
Additional Comments from McQuay Demands from freight placed on the regional transportation infrastructure?
The local regional carriers have been able to handle all regional shipments with ease at this time.
They are able to meet demands due to the slow economic situation (slowdown); Carriers are able to handle the volumes now but will be stretched to new limits if the economy grows due to the reduction in carriers.
The carriers have reduced in number but are more efficient that prior to the slowdown and are able to take gains but the question is to what limits.
If the economy was to grow to prior levels the shortage of drivers/equipment would be tight. They would probably increase their rates to remove some volumes and deal most directly with current accounts than securing new ones.
Government involvement in continued changes in DOT rules makes it difficult for carriers to set personal business standards only to have them changed later (that is an issue). Such as: Hours of service
Carriers normally are able to adjust over a short period of time if they are not burdened by government
-----------------------------------------------------------------------------------------------------------------------------------------
Hear from the business community what transportation related concerns or issues that we have.
The lack of drivers is a critical issue The Government has allowed the insurance companies to apply heavy rules on carriers (25 years of age and 2 years of experience). Obviously, this is impossible to accomplish by its own description of requirements. The drivers staying in the business are getting older daily thus increasing the shortage by retirements.
Homeland security and DOT testing of drivers does not allow for drivers that may know what they are doing but cannot take computer tests well.
The road systems fall short of the professional level they should be in. Damage to vehicles is a factor on today’s roads.
Unity in state laws is another issue that put more issues on shippers to comply with the laws and increasing rates.
Fuel taxes continue to cause carriers problems thus creating fuel surcharges that must be passed onto consumers. Governments needs to lower state and federal taxes on fuel.
Fuel needs to be stable. Diesel needs to have a time period of at least one month that is stable for shipper, clients and carriers.
How well the region’s transportation assets are serving our needs. Assets by carriers seem to meet all our requirements at present levels.
Southeast Minnesota Regional Freight Study
93
References
1 Edward Fepke, Deepak Gopalakrishna and John Woodrooffe, Performance-Based Oversize and Overweight Permitting System, Transportation Research Record, Volume 1966 / 2006, pages 118-125. Online Feb. 2007. 2 Dan Middleton, Arturo Villarreal and Joseph Blaschke; Evaluation of Oversize/Overweight Permit Policy and Fee Structure. Texas Transportation Institute, November 1988. pg. 62-63. 3Jeremy Truitt, Toll proposed for I-70. The Maneater. January 27, 2012. Quote attributed to Tom Crawford, Missouri Trucking Association. Online at: http://www.themaneater.com/stories/2012/1/27/proposed-changes-i-70-could-raise-cost-travel-miss/ 4 USDOT, FHWA, 1997 Federal Highway Cost Allocation Study, Final Report.


