www.ag.ndsu.edu ■ 1
SF722 (Revised)
July 2014
D.W. FranzenExtension Soil Science Specialist
Soil Fertility Recommendations for Corn
Corn has been a crop in North Dakota for at least 100 years. However, the acres under corn grain production have been relatively small, compared with small-grain crops, until about 20 years ago. Today, corn consistently is planted on more than 3 million acres each year, with most North Dakota counties having signifi cant acreage.
The surge in acreage has been the result of improved corn genetics supported by NDSU corn inbred research, combined with greater rainfall and the increase of long-term no-till acreage in western North Dakota.
Fertilizer recommendations for corn used until recently were published about 40 years ago and have been changed little since then. However, in the past 40 years, yield expectations have at least doubled from about 80 to more than 200 bushels per acre in many fi elds. Tillage practices and the hybrids planted have changed as well.
The changes from previous corn fertility recommendations in this publication are primarily the result of recent assessments of corn yield responses to nitrogen (N) through fi eld experiments using modern hybrids and conditions.
2 ■ SF722 Soil Fertility Recommendations for Corn
Nitrogen The N recommendations in this publication were developed from data accumulated from 2010 through 2013 on 77 North Dakota corn N rate trials. In addition, data from recent N rate studies in northwestern Minnesota, southern Manitoba and the northern tier of counties in South Dakota were used to augment the NDSU data set.
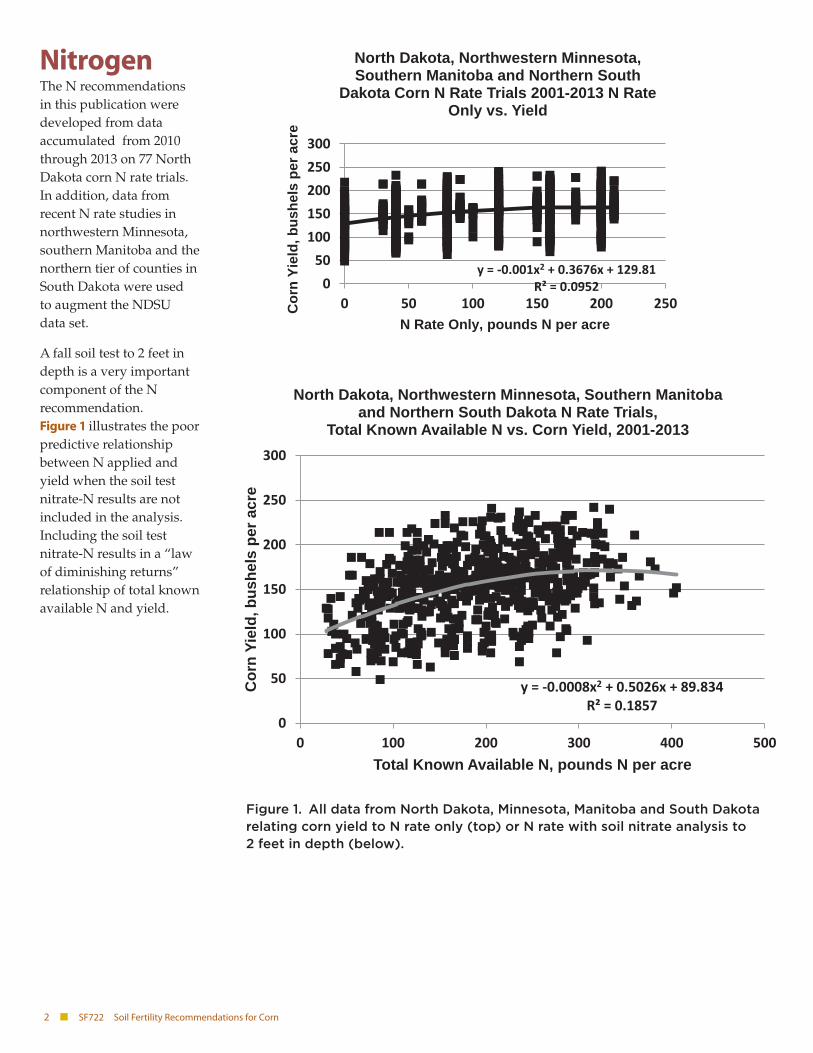
A fall soil test to 2 feet in depth is a very important component of the N recommendation. Figure 1 illustrates the poor predictive relationship between N applied and yield when the soil test nitrate-N results are not included in the analysis. Including the soil test nitrate-N results in a “law of diminishing returns” relationship of total known available N and yield.
y = -0.001x2 + 0.3676x + 129.81 R² = 0.0952 0
50100150200250300
0 50 100 150 200 250Cor
n Yi
eld,
bus
hels
per
acr
e
N Rate Only, pounds N per acre
North Dakota, Northwestern Minnesota, Southern Manitoba and Northern South
Dakota Corn N Rate Trials 2001-2013 N Rate Only vs. Yield
y = -0.0008x2 + 0.5026x + 89.834 R² = 0.1857
0
50
100
150
200
250
300
0 100 200 300 400 500
Cor
n Yi
eld,
bus
hels
per
acr
e
Total Known Available N, pounds N per acre
North Dakota, Northwestern Minnesota, Southern Manitoba and Northern South Dakota N Rate Trials,
Total Known Available N vs. Corn Yield, 2001-2013
Figure 1. All data from North Dakota, Minnesota, Manitoba and South Dakota relating corn yield to N rate only (top) or N rate with soil nitrate analysis to 2 feet in depth (below).
www.ag.ndsu.edu ■ 3
A change from previous recommenda-tions is that N recommendations are not linked directly to expected yield. N recommendation categories within high-clay soils and medium-texture soils are divided into those soils with a historic capability to produce more or less than 160 bushels per acre. However, within the higher productivity categories, N rates have supported more than 240 bushels per acre in my experiments. Yields less than this were caused by too much water or not enough, but not by a defi ciency of N.
Nitrogen recommendations are based on an economic production function that takes into account the yield response of corn to added N, less the cost of the N. This recommen-dation system is called the “Return to N” approach, defi ned by Sawyer and Nafziger (2005).
In our work, we determined the for-mula that related the total available N to yield for each recommendation cat-egory. As available N increases, yield increases until the cost of another pound of N equals the income benefi t for the fraction of a bushel of corn the N will produce.
At some rate of N, yield can decrease with added N. The yield decrease often is related to greater lodging; “green snap,” which is caused by unusually rapid stalk elongation and poor stalk structure that results in stalk breakage during a high wind event; or other physiological factors.
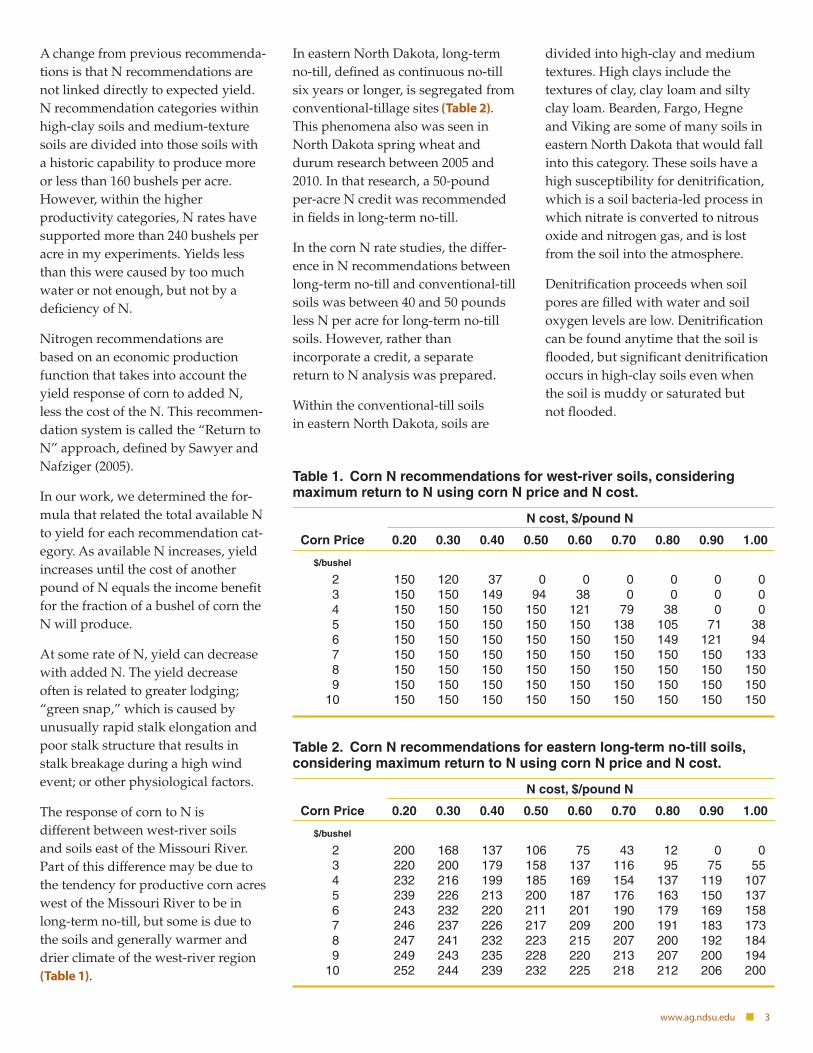
The response of corn to N is different between west-river soils and soils east of the Missouri River. Part of this difference may be due to the tendency for productive corn acres west of the Missouri River to be in long-term no-till, but some is due to the soils and generally warmer and drier climate of the west-river region (Table 1).
In eastern North Dakota, long-term no-till, defi ned as continuous no-till six years or longer, is segregated from conventional-tillage sites (Table 2). This phenomena also was seen in North Dakota spring wheat and durum research between 2005 and 2010. In that research, a 50-pound per-acre N credit was recommended in fi elds in long-term no-till.
In the corn N rate studies, the differ-ence in N recommendations between long-term no-till and conventional-till soils was between 40 and 50 pounds less N per acre for long-term no-till soils. However, rather than incorporate a credit, a separate return to N analysis was prepared.
Within the conventional-till soils in eastern North Dakota, soils are
divided into high-clay and medium textures. High clays include the textures of clay, clay loam and silty clay loam. Bearden, Fargo, Hegne and Viking are some of many soils in eastern North Dakota that would fall into this category. These soils have a high susceptibility for denitrifi cation, which is a soil bacteria-led process in which nitrate is converted to nitrous oxide and nitrogen gas, and is lost from the soil into the atmosphere.
Denitrifi cation proceeds when soil pores are fi lled with water and soil oxygen levels are low. Denitrifi cation can be found anytime that the soil is fl ooded, but signifi cant denitrifi cation occurs in high-clay soils even when the soil is muddy or saturated but not fl ooded.
Table 1. Corn N recommendations for west-river soils, considering maximum return to N using corn N price and N cost.
N cost, $/pound N
Corn Price 0.20 0.30 0.40 0.50 0.60 0.70 0.80 0.90 1.00
$/bushel
2 150 120 37 0 0 0 0 0 0 3 150 150 149 94 38 0 0 0 0 4 150 150 150 150 121 79 38 0 0 5 150 150 150 150 150 138 105 71 38 6 150 150 150 150 150 150 149 121 94 7 150 150 150 150 150 150 150 150 133 8 150 150 150 150 150 150 150 150 150 9 150 150 150 150 150 150 150 150 150 10 150 150 150 150 150 150 150 150 150
Table 2. Corn N recommendations for eastern long-term no-till soils, considering maximum return to N using corn N price and N cost.
N cost, $/pound N
Corn Price 0.20 0.30 0.40 0.50 0.60 0.70 0.80 0.90 1.00
$/bushel
2 200 168 137 106 75 43 12 0 0 3 220 200 179 158 137 116 95 75 55 4 232 216 199 185 169 154 137 119 107 5 239 226 213 200 187 176 163 150 137 6 243 232 220 211 201 190 179 169 158 7 246 237 226 217 209 200 191 183 173 8 247 241 232 223 215 207 200 192 184 9 249 243 235 228 220 213 207 200 194 10 252 244 239 232 225 218 212 206 200
4 ■ SF722 Soil Fertility Recommendations for Corn
Tiling made little difference in our N rate plots on N effi ciency in high-clay soils. Water takes a long time to per-colate through high-clay soils. Some estimates of downward water move-ment are 0.015 inch per hour, or about 1/3 inch per day in a Fargo soil.
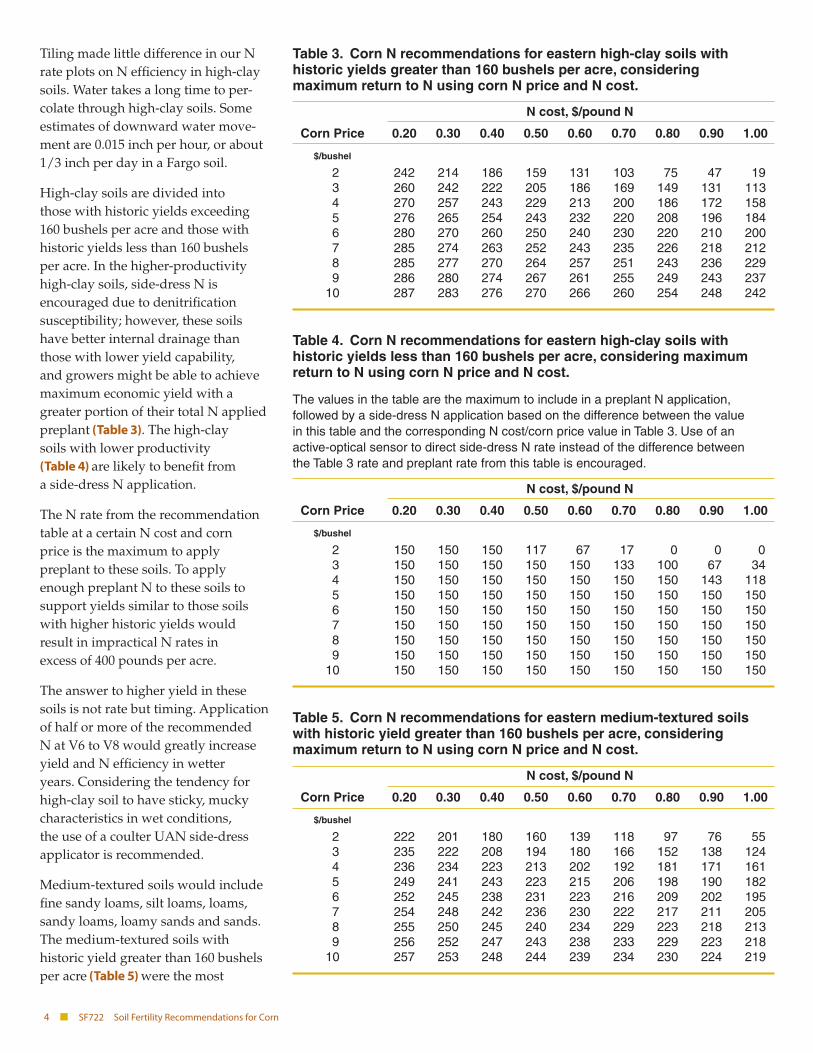
High-clay soils are divided into those with historic yields exceeding 160 bushels per acre and those with historic yields less than 160 bushels per acre. In the higher-productivity high-clay soils, side-dress N is encouraged due to denitrifi cation susceptibility; however, these soils have better internal drainage than those with lower yield capability, and growers might be able to achieve maximum economic yield with a greater portion of their total N applied preplant (Table 3). The high-clay soils with lower productivity (Table 4) are likely to benefi t from a side-dress N application.
The N rate from the recommendation table at a certain N cost and corn price is the maximum to apply preplant to these soils. To apply enough preplant N to these soils to support yields similar to those soils with higher historic yields would result in impractical N rates in excess of 400 pounds per acre.
The answer to higher yield in these soils is not rate but timing. Application of half or more of the recommended N at V6 to V8 would greatly increase yield and N effi ciency in wetter years. Considering the tendency for high-clay soil to have sticky, mucky characteristics in wet conditions, the use of a coulter UAN side-dress applicator is recommended.
Medium-textured soils would include fi ne sandy loams, silt loams, loams, sandy loams, loamy sands and sands. The medium-textured soils with historic yield greater than 160 bushels per acre (Table 5) were the most
Table 3. Corn N recommendations for eastern high-clay soils with historic yields greater than 160 bushels per acre, considering maximum return to N using corn N price and N cost.
N cost, $/pound N
Corn Price 0.20 0.30 0.40 0.50 0.60 0.70 0.80 0.90 1.00
$/bushel
2 242 214 186 159 131 103 75 47 19 3 260 242 222 205 186 169 149 131 113 4 270 257 243 229 213 200 186 172 158 5 276 265 254 243 232 220 208 196 184 6 280 270 260 250 240 230 220 210 200 7 285 274 263 252 243 235 226 218 212 8 285 277 270 264 257 251 243 236 229 9 286 280 274 267 261 255 249 243 237 10 287 283 276 270 266 260 254 248 242
Table 4. Corn N recommendations for eastern high-clay soils with historic yields less than 160 bushels per acre, considering maximum return to N using corn N price and N cost.
The values in the table are the maximum to include in a preplant N application, followed by a side-dress N application based on the difference between the value in this table and the corresponding N cost/corn price value in Table 3. Use of an active-optical sensor to direct side-dress N rate instead of the difference between the Table 3 rate and preplant rate from this table is encouraged.
N cost, $/pound N
Corn Price 0.20 0.30 0.40 0.50 0.60 0.70 0.80 0.90 1.00
$/bushel
2 150 150 150 117 67 17 0 0 0 3 150 150 150 150 150 133 100 67 34 4 150 150 150 150 150 150 150 143 118 5 150 150 150 150 150 150 150 150 150 6 150 150 150 150 150 150 150 150 150 7 150 150 150 150 150 150 150 150 150 8 150 150 150 150 150 150 150 150 150 9 150 150 150 150 150 150 150 150 150 10 150 150 150 150 150 150 150 150 150
Table 5. Corn N recommendations for eastern medium-textured soils with historic yield greater than 160 bushels per acre, considering maximum return to N using corn N price and N cost.
N cost, $/pound N
Corn Price 0.20 0.30 0.40 0.50 0.60 0.70 0.80 0.90 1.00
$/bushel
2 222 201 180 160 139 118 97 76 55 3 235 222 208 194 180 166 152 138 124 4 236 234 223 213 202 192 181 171 161 5 249 241 243 223 215 206 198 190 182 6 252 245 238 231 223 216 209 202 195 7 254 248 242 236 230 222 217 211 205 8 255 250 245 240 234 229 223 218 213 9 256 252 247 243 238 233 229 223 218 10 257 253 248 244 239 234 230 224 219
www.ag.ndsu.edu ■ 5
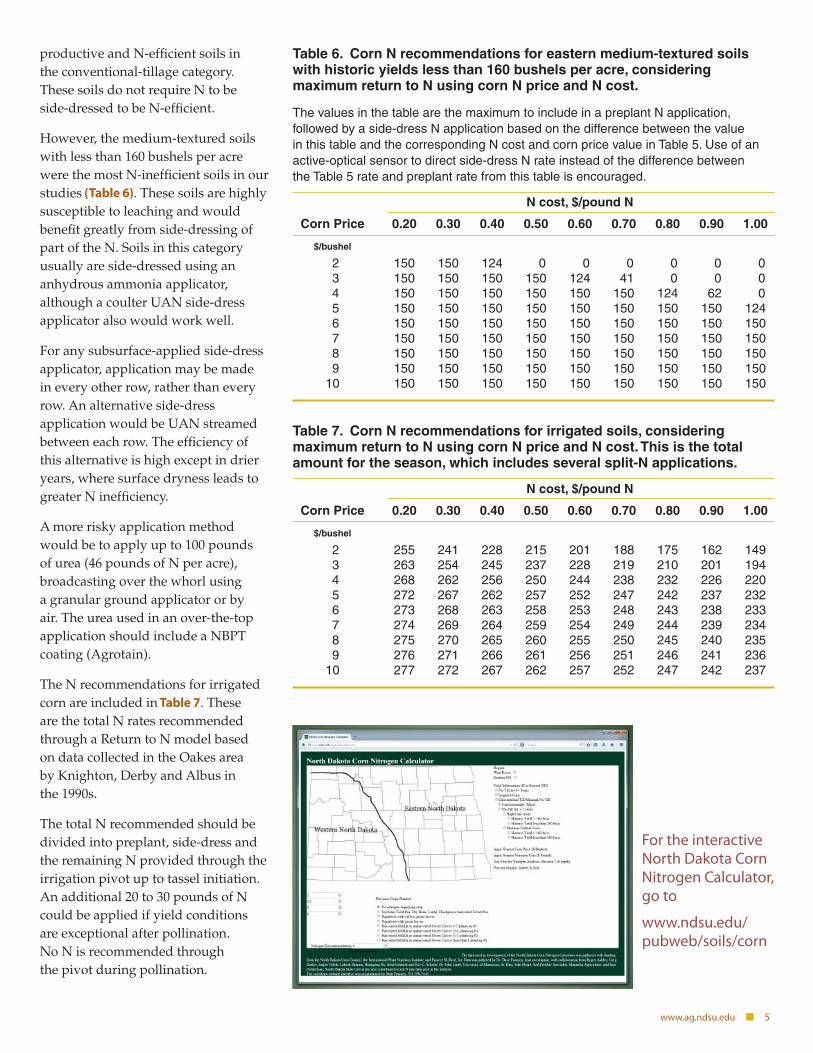
productive and N-effi cient soils in the conventional-tillage category. These soils do not require N to be side-dressed to be N-effi cient.
However, the medium-textured soils with less than 160 bushels per acre were the most N-ineffi cient soils in our studies (Table 6). These soils are highly susceptible to leaching and would benefi t greatly from side-dressing of part of the N. Soils in this category usually are side-dressed using an anhydrous ammonia applicator, although a coulter UAN side-dress applicator also would work well.
For any subsurface-applied side-dress applicator, application may be made in every other row, rather than every row. An alternative side-dress application would be UAN streamed between each row. The effi ciency of this alternative is high except in drier years, where surface dryness leads to greater N ineffi ciency.
A more risky application method would be to apply up to 100 pounds of urea (46 pounds of N per acre), broadcasting over the whorl using a granular ground applicator or by air. The urea used in an over-the-top application should include a NBPT coating (Agrotain).
The N recommendations for irrigated corn are included in Table 7. These are the total N rates recommended through a Return to N model based on data collected in the Oakes area by Knighton, Derby and Albus in the 1990s.
The total N recommended should be divided into preplant, side-dress and the remaining N provided through the irrigation pivot up to tassel initiation. An additional 20 to 30 pounds of N could be applied if yield conditions are exceptional after pollination. No N is recommended through the pivot during pollination.
Table 6. Corn N recommendations for eastern medium-textured soils with historic yields less than 160 bushels per acre, considering maximum return to N using corn N price and N cost.
The values in the table are the maximum to include in a preplant N application, followed by a side-dress N application based on the difference between the value in this table and the corresponding N cost and corn price value in Table 5. Use of an active-optical sensor to direct side-dress N rate instead of the difference between the Table 5 rate and preplant rate from this table is encouraged.
N cost, $/pound N
Corn Price 0.20 0.30 0.40 0.50 0.60 0.70 0.80 0.90 1.00
$/bushel
2 150 150 124 0 0 0 0 0 0 3 150 150 150 150 124 41 0 0 0 4 150 150 150 150 150 150 124 62 0 5 150 150 150 150 150 150 150 150 124 6 150 150 150 150 150 150 150 150 150 7 150 150 150 150 150 150 150 150 150 8 150 150 150 150 150 150 150 150 150 9 150 150 150 150 150 150 150 150 150 10 150 150 150 150 150 150 150 150 150
Table 7. Corn N recommendations for irrigated soils, considering maximum return to N using corn N price and N cost. This is the total amount for the season, which includes several split-N applications.
N cost, $/pound N
Corn Price 0.20 0.30 0.40 0.50 0.60 0.70 0.80 0.90 1.00
$/bushel
2 255 241 228 215 201 188 175 162 149 3 263 254 245 237 228 219 210 201 194 4 268 262 256 250 244 238 232 226 220 5 272 267 262 257 252 247 242 237 232 6 273 268 263 258 253 248 243 238 233 7 274 269 264 259 254 249 244 239 234 8 275 270 265 260 255 250 245 240 235 9 276 271 266 261 256 251 246 241 236 10 277 272 267 262 257 252 247 242 237
For the interactive North Dakota Corn Nitrogen Calculator, go to
www.ndsu.edu/pubweb/soils/corn
6 ■ SF722 Soil Fertility Recommendations for Corn
PhosphorusIn states to the south and east of North Dakota, distinctions are made within states where banded phosphorus (P) would be expected to have a consistent positive yield response and areas where they might not. These distinctions are usually a point north or south of some line within the state.
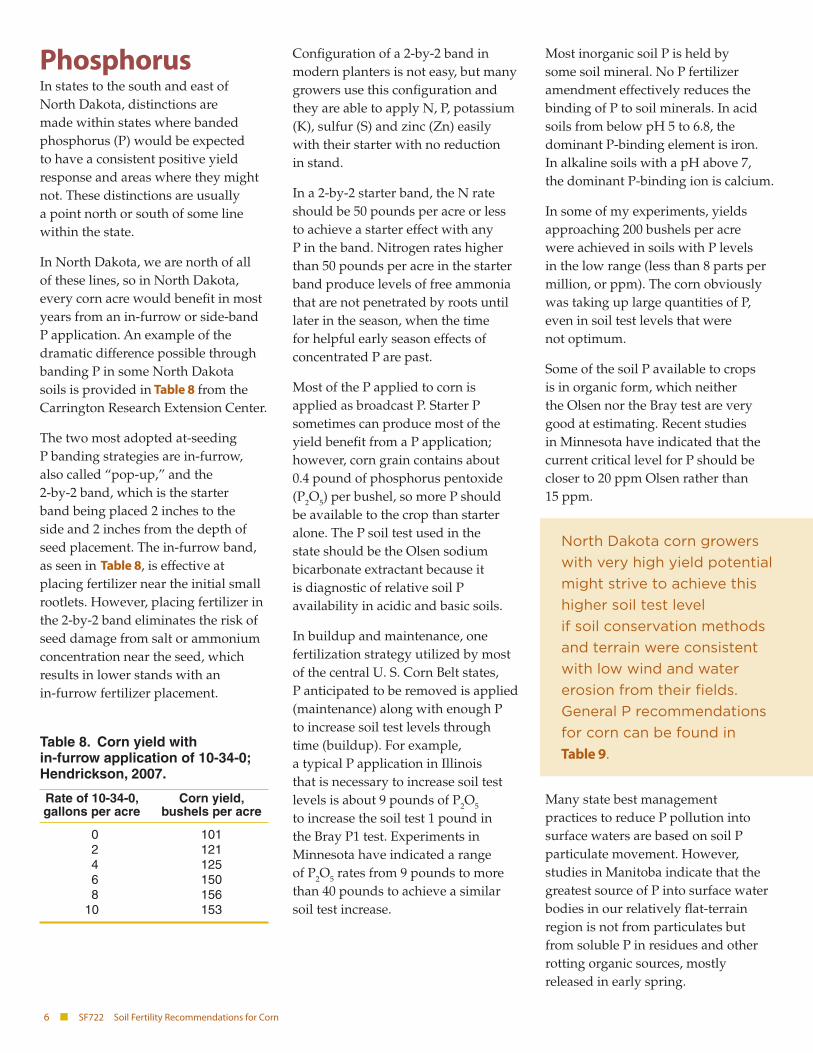
In North Dakota, we are north of all of these lines, so in North Dakota, every corn acre would benefi t in most years from an in-furrow or side-band P application. An example of the dramatic difference possible through banding P in some North Dakota soils is provided in Table 8 from the Carrington Research Extension Center.
The two most adopted at-seeding P banding strategies are in-furrow, also called “pop-up,” and the 2-by-2 band, which is the starter band being placed 2 inches to the side and 2 inches from the depth of seed placement. The in-furrow band, as seen in Table 8, is effective at placing fertilizer near the initial small rootlets. However, placing fertilizer in the 2-by-2 band eliminates the risk of seed damage from salt or ammonium concentration near the seed, which results in lower stands with an in-furrow fertilizer placement.
Confi guration of a 2-by-2 band in modern planters is not easy, but many growers use this confi guration and they are able to apply N, P, potassium (K), sulfur (S) and zinc (Zn) easily with their starter with no reduction in stand.
In a 2-by-2 starter band, the N rate should be 50 pounds per acre or less to achieve a starter effect with any P in the band. Nitrogen rates higher than 50 pounds per acre in the starter band produce levels of free ammonia that are not penetrated by roots until later in the season, when the time for helpful early season effects of concentrated P are past.
Most of the P applied to corn is applied as broadcast P. Starter P sometimes can produce most of the yield benefi t from a P application; however, corn grain contains about 0.4 pound of phosphorus pentoxide (P2O5) per bushel, so more P should be available to the crop than starter alone. The P soil test used in the state should be the Olsen sodium bicarbonate extractant because it is diagnostic of relative soil P availability in acidic and basic soils.
In buildup and maintenance, one fertilization strategy utilized by most of the central U. S. Corn Belt states, P anticipated to be removed is applied (maintenance) along with enough P to increase soil test levels through time (buildup). For example, a typical P application in Illinois that is necessary to increase soil test levels is about 9 pounds of P2O5 to increase the soil test 1 pound in the Bray P1 test. Experiments in Minnesota have indicated a range of P2O5 rates from 9 pounds to more than 40 pounds to achieve a similar soil test increase.
Most inorganic soil P is held by some soil mineral. No P fertilizer amendment effectively reduces the binding of P to soil minerals. In acid soils from below pH 5 to 6.8, the dominant P-binding element is iron. In alkaline soils with a pH above 7, the dominant P-binding ion is calcium.
In some of my experiments, yields approaching 200 bushels per acre were achieved in soils with P levels in the low range (less than 8 parts per million, or ppm). The corn obviously was taking up large quantities of P, even in soil test levels that were not optimum.
Some of the soil P available to crops is in organic form, which neither the Olsen nor the Bray test are very good at estimating. Recent studies in Minnesota have indicated that the current critical level for P should be closer to 20 ppm Olsen rather than 15 ppm.
North Dakota corn growers with very high yield potential might strive to achieve this higher soil test level if soil conservation methods and terrain were consistent with low wind and water erosion from their fi elds. General P recommendations for corn can be found in
Table 9.
Many state best management practices to reduce P pollution into surface waters are based on soil P particulate movement. However, studies in Manitoba indicate that the greatest source of P into surface water bodies in our relatively fl at-terrain region is not from particulates but from soluble P in residues and other rotting organic sources, mostly released in early spring.
Table 8. Corn yield with in-furrow application of 10-34-0; Hendrickson, 2007.
Rate of 10-34-0, Corn yield, gallons per acre bushels per acre
0 101 2 121 4 125 6 150 8 156 10 153
www.ag.ndsu.edu ■ 7
Corn is susceptible to a condition known as “fallow syndrome.” Fallow syndrome is a stunting of corn, and often purpling leaves, and general P defi ciency following a bare fallow, or following crops that do not support mycchorizae. Mycchorizae are a group of soil fungi that have a symbiotic relationship with many plant families, except for the Chenopodiacae (lambsquarter family) and the Cruciferae (mustard family). When corn follows canola (mustard family) or sugar beet (lambsquarter family), the likely result is fallow syndrome.
Prevent-plant acres generally have not resulted in fallow syndrome the following year, probably because, in most cases, these acres are seeded to a cover crop (highly recommended) or weeds grow for a signifi cant portion of the summer, which also promotes mycchorizal populations.
Work in South Dakota indicates that high rates of P fertilizer banded near the seed are necessary to offset the effects of fallow syndrome.
A minimum P fertilizer rate in one study was 150 pounds of 0-46-0 per acre in a 2-X-2 band. Simply increasing an in-furrow 10-34-0 rate from 3 to 6 gallons per acre does not eliminate fallow syndrome.
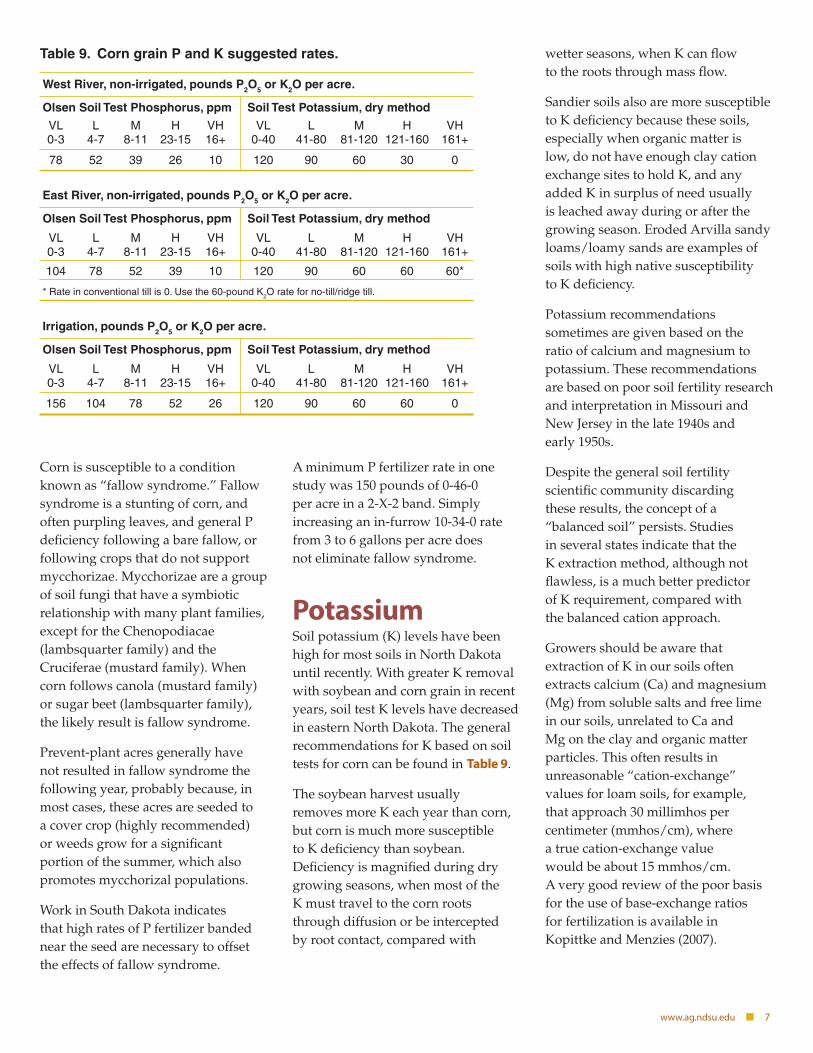
PotassiumSoil potassium (K) levels have been high for most soils in North Dakota until recently. With greater K removal with soybean and corn grain in recent years, soil test K levels have decreased in eastern North Dakota. The general recommendations for K based on soil tests for corn can be found in Table 9.
The soybean harvest usually removes more K each year than corn, but corn is much more susceptible to K defi ciency than soybean. Defi ciency is magnifi ed during dry growing seasons, when most of the K must travel to the corn roots through diffusion or be intercepted by root contact, compared with
wetter seasons, when K can fl ow to the roots through mass fl ow.
Sandier soils also are more susceptible to K defi ciency because these soils, especially when organic matter is low, do not have enough clay cation exchange sites to hold K, and any added K in surplus of need usually is leached away during or after the growing season. Eroded Arvilla sandy loams/loamy sands are examples of soils with high native susceptibility to K defi ciency.
Potassium recommendations sometimes are given based on the ratio of calcium and magnesium to potassium. These recommendations are based on poor soil fertility research and interpretation in Missouri and New Jersey in the late 1940s and early 1950s.
Despite the general soil fertility scientifi c community discarding these results, the concept of a “balanced soil” persists. Studies in several states indicate that the K extraction method, although not fl awless, is a much better predictor of K requirement, compared with the balanced cation approach.
Growers should be aware that extraction of K in our soils often extracts calcium (Ca) and magnesium (Mg) from soluble salts and free lime in our soils, unrelated to Ca and Mg on the clay and organic matter particles. This often results in unreasonable “cation-exchange” values for loam soils, for example, that approach 30 millimhos per centimeter (mmhos/cm), where a true cation-exchange value would be about 15 mmhos/cm. A very good review of the poor basis for the use of base-exchange ratios for fertilization is available in Kopittke and Menzies (2007).
Table 9. Corn grain P and K suggested rates.
West River, non-irrigated, pounds P2O5 or K2O per acre.
Olsen Soil Test Phosphorus, ppm Soil Test Potassium, dry method
VL L M H VH VL L M H VH 0-3 4-7 8-11 23-15 16+ 0-40 41-80 81-120 121-160 161+
78 52 39 26 10 120 90 60 30 0
East River, non-irrigated, pounds P2O5 or K2O per acre.
Olsen Soil Test Phosphorus, ppm Soil Test Potassium, dry method
VL L M H VH VL L M H VH 0-3 4-7 8-11 23-15 16+ 0-40 41-80 81-120 121-160 161+
104 78 52 39 10 120 90 60 60 60*
* Rate in conventional till is 0. Use the 60-pound K2O rate for no-till/ridge till.
Irrigation, pounds P2O5 or K2O per acre.
Olsen Soil Test Phosphorus, ppm Soil Test Potassium, dry method
VL L M H VH VL L M H VH 0-3 4-7 8-11 23-15 16+ 0-40 41-80 81-120 121-160 161+
156 104 78 52 26 120 90 60 60 0
8 ■ SF722 Soil Fertility Recommendations for Corn
SulfurSulfur (S) defi ciency has become an increasing problem for all North Dakota crops due to increased yield demand, increased rainfall compared with previous records, and decreased S in rainwater and erodible conventional-till fi elds, decreasing organic matter levels and thickness of the A horizon through time.
The S soil test is nondiagnostic and is available only because soil testing laboratory clients demand it, not because it is a reliable test. A better predictor of the need for S in a particular spring is to understand the soils and pay attention to rainfall and snow pack between the fall and spring planting season.
In soils with higher clay content and high organic-matter levels, S hardly ever is a problem except in the most extraordinarily wet springs. In medium-textured or coarser soils (loams, sandy loams, loamy sands, sands) with lower organic-matter levels (3 percent or less), particularly on hill/ridge tops and slopes, if rainfall/snowfall is normal or higher in the fall, winter or early spring, the application of at least 10 pounds per acre of S as sulfate or thiosulfate is recommended. These are spring fertilizers and should be applied in the spring. In coarser-textured soils, high rainfall after planting may require a second application.
Application of S as elemental S is not nearly as effective as sulfate or thiosulfate forms. The application of S as elemental S the fall before planting most often is not effective because any sulfate produced by very slow oxidation may be leached away by early spring rains, leaving only immediately unavailable elemental S near the soil surface.
Ammonium thiosulfate should not be applied as a row starter, and any ammonium sulfate applied is subject to similar rate restrictions of N+K2O as other row-placed fertilizers.
Sulfur defi ciency appears in the spring as yellow upper leaves, with lower leaves remaining greener. The pattern of defi ciency usually is related to the landscape, with eroded areas, hilltops and slopes being particularly vulnerable, especially in medium- and coarser-textured soils. Rescue with sulfate or thiosulfate sources such as ammonium sulfate, gypsum or ammonium thiosulfate are effective in correcting defi ciencies, although a preplant application would result in greatest yield improvement.
Liquid solutions should be stream-applied between the rows or applied through an irrigation pivot to avoid serious leaf injury. Dry application on corn up to V4 is possible with little injury. Injury will increase as corn advances in maturity.
ZincCorn is one of four crops regularly grown in North Dakota that have shown yield increases from zinc application when soil levels are low. The critical level of soil test zinc, using the DTPA extraction method, is 1 ppm.
Potential zinc defi ciency may be avoided by a broadcast application of at least 30 pounds per acre of zinc sulfate 36 percent granules or by adding a compatible zinc chelate of ammoniated zinc product to the starter fertilizer at planting.
The broadcast zinc sulfate application will increase soil test zinc levels for more than 10 years, while the starter chelate application will be necessary each year that the fi eld is planted to corn.
Zinc defi ciency is expressed as yellow-striped newer leaves and stunting. The defi ciency can be corrected by a zinc chelate application, although when detected, some yield decrease already has occurred.
Additional nutrient defi ciencies in North Dakota have not been documented.
www.ag.ndsu.edu ■ 9
Corn Nutrient Defi ciency SymptomsA defi ciency symptom is an indication that the crop is not well, but it is not a nutrient diagnosis by itself. For example, corn may show purpling of leaves early in the season, which can be a P defi ciency symptom, but the purpling also can be any soil or environmental condition that reduces the rate of root growth, such as spring compaction, cold soils, very wet soil conditions and a tendency of purpling of certain hybrids.
Therefore, a plant analysis, most often accompanied by a soil sample, except in the case of sulfur, from a “good” area and the “not-as-good” area most often will result in a diagnostic analysis.
The following pages have photos showing mineral defi ciencies in corn.
10 ■ SF722 Soil Fertility Recommendations for Corn
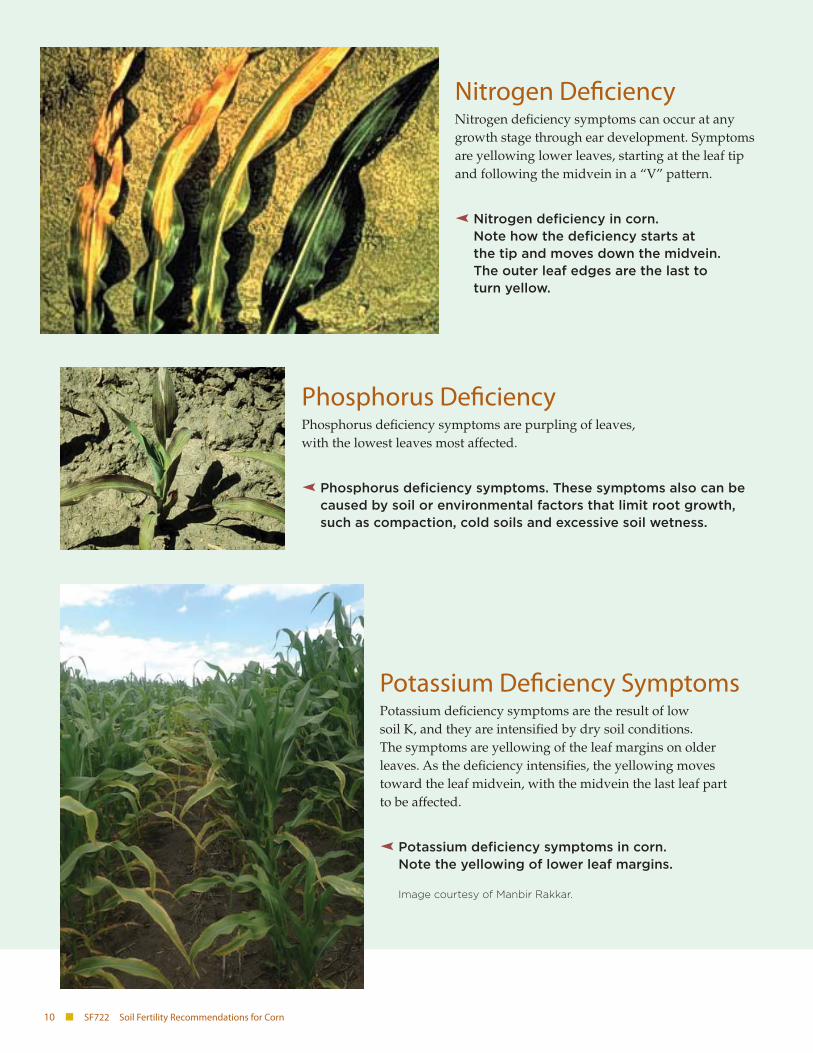
Nitrogen Defi ciencyNitrogen defi ciency symptoms can occur at any growth stage through ear development. Symptoms are yellowing lower leaves, starting at the leaf tip and following the midvein in a “V” pattern.
Q Nitrogen defi ciency in corn. Note how the defi ciency starts at the tip and moves down the midvein. The outer leaf edges are the last to turn yellow.
Phosphorus Defi ciencyPhosphorus defi ciency symptoms are purpling of leaves, with the lowest leaves most affected.
Q Phosphorus defi ciency symptoms. These symptoms also can be caused by soil or environmental factors that limit root growth, such as compaction, cold soils and excessive soil wetness.
Potassium Defi ciency SymptomsPotassium defi ciency symptoms are the result of low soil K, and they are intensifi ed by dry soil conditions. The symptoms are yellowing of the leaf margins on older leaves. As the defi ciency intensifi es, the yellowing moves toward the leaf midvein, with the midvein the last leaf part to be affected.
Q Potassium defi ciency symptoms in corn. Note the yellowing of lower leaf margins.
Image courtesy of Manbir Rakkar.
www.ag.ndsu.edu ■ 11
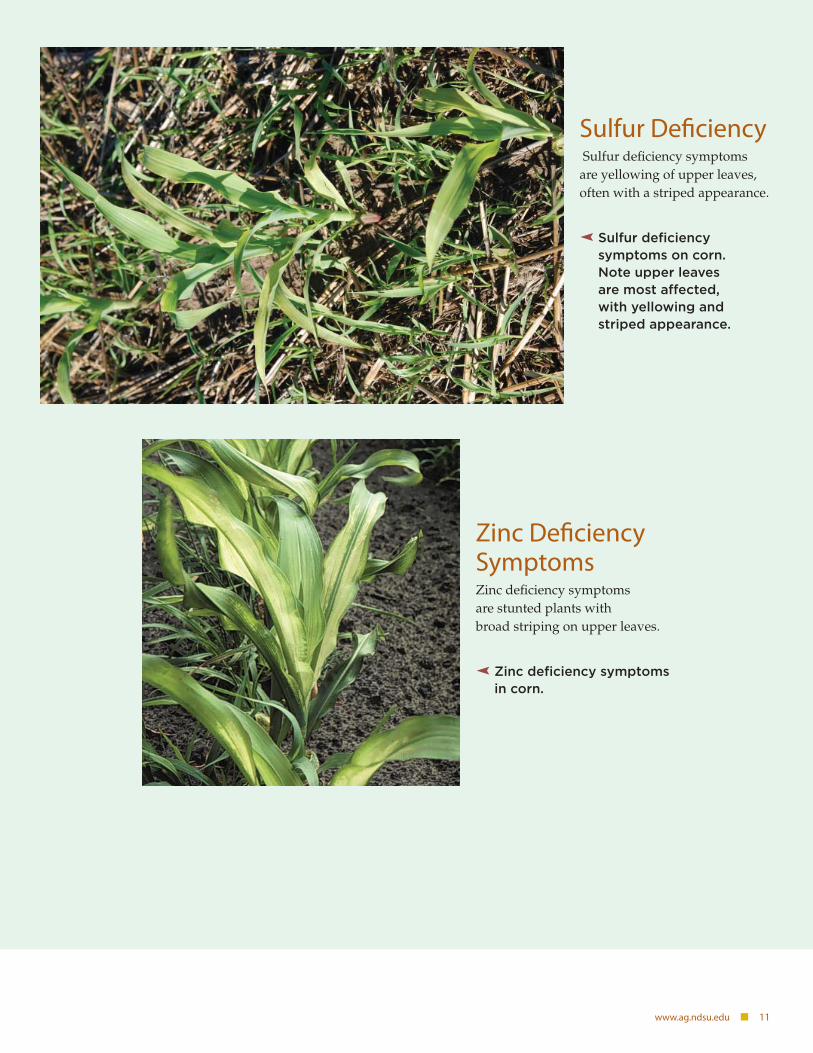
Zinc Defi ciency SymptomsZinc defi ciency symptoms are stunted plants with broad striping on upper leaves.
Q Zinc defi ciency symptoms in corn.
Sulfur Defi ciency Sulfur defi ciency symptoms are yellowing of upper leaves, often with a striped appearance.
Q Sulfur defi ciency symptoms on corn. Note upper leaves are most aff ected, with yellowing and striped appearance.
12 ■ SF722 Soil Fertility Recommendations for Corn
For more information on this and other topics, see www.ag.ndsu.eduNDSU encourages you to use and share this content, but please do so under the conditions of our Creative Commons license.
You may copy, distribute, transmit and adapt this work as long as you give full attribution, don’t use the work for commercial purposes and share your resulting work similarly. For more information, visit www.ag.ndsu.edu/agcomm/creative-commons.
North Dakota State University does not discriminate on the basis of age, color, disability, gender expression/identity, genetic information, marital status, national origin, public assistance status, sex, sexual orientation, status as a U.S. veteran, race or religion. Direct inquiries to the Vice President for Equity, Diversity and Global Outreach, 205 Old Main, (701) 231-7708.
County Commissions, NDSU and U.S. Department of Agriculture Cooperating. This publication will be made available in alternative formats for people with disabilities upon request, (701) 231-7881. 1M-7-14
ReferencesKopittke, P.M., and N.W. Menzies. 2007. A review of the use of the basic cation saturation
ratio and the ‘ideal’ soil. Soil Science Society of America Journal 71:259-265.
Whitney, D.A. 2012. Micronutrients: zinc, iron, manganese and copper (Revised January, 1998). In Recommended Chemical Soil Test Procedures for the North Central Region. North Central Regional Research Publication No. 221 (Revised). http://extension.missouri.edu/explorepdf/specialb/sb1001.pdf


