HYDROLOGICAL PROCESSES, VOL. 7, 317-333 (1993)
SOIL EROSION AND CONSERVATION ON LAND CULTIVATED AND DRAINED FOR AFFORESTATION
P. A. CARLING AND M. S . GLAISTER institute of Freshwater Ecology, Ambleside, Cumbria LA22 OLP, UK
AND T. P. FLINTHAM
Department of Civil Engineering, City University, London, EC1 V OHB, UK
ABSTRACT Erosion of soil from pre-afforestation plough furrows has been measured on four soil types in Scotland for 12 to 18 month periods between 1987 and 1990. Rainfall-run-off was also measured at one site. Run-off is directly proportional to furrow length and rainfall intensity, and for a wide range of intensities (typically > 6mm hr-') a small amount of soil is flushed out of the furrows. However, for furrow spacings of 3.8 m, a critical downslope run-off increment associated with significant soil loss is of the order of 25 cm3 s-' m-I , which is in accord with a storm of five years return period and a maximum intensity of 25mmhr-'. The total run-off volume for any hydrograph is commensurate with the total rainfall in the rainstorm - typically 40-80% by the hydrograph peak and approaching 100% by the end of the hydro- graph; i.e. long term storage is negligible. A positive relationship was recorded between furrow length, slope angle and sediment yield, with deposition predominating in furrows less than 30m in length on slopes less than a few degrees. Soil loss is proportional to the excess streampower expended by the run-off with an exponent in the range 1 - 1.5. For the soils examined, significant differences in soil loss when comparing sites for low power expenditure become undifferen- tiated at high power expenditures. For the rainfall regimes monitored, maximum soil losses were in the region of 40 kg per meter run-length of furrow, when soil peds were ripped from the bed. Laboratory data concerning the critical erosion threshold power and shear stress to erode soil peds are in general accord with the threshold furrow run-lengths defined using the field data for a five year storm and the soil losses observed.
KEY WORDS Forestry Drainage Furrows Soil erosion Erosion control Rainfall-run-off Sediment transport Buffer zones
INTRODUCTION
The usual means of preparing an upland site for afforestation in the UK is to cultivate and drain the area using a combination of downslope furrows and open drains close to the contour. Guidelines exist for the design of forest drainage networks (Pyatt, 1990; Forestry Commission, 1991) and the management of stream courses (Mills, 1980) which, if followed, minimize the likelihood of excessive slope erosion and sedi- ment entering water courses (Carling and Orr, 1990). However, some turbid run-off is inevitable (Robinson and Blyth, 1982; Burt er al., 1983) but should be kept within acceptable limits. Usually, within one or two years, the furrows have revegetated so that the period of potentially high turbidity is not prolonged, although drain erosion can remain a problem. Despite the availability of guidelines, occasions occur when turbid run-off has caused problems for the water supply industry (Austin and Brown, 1982; Stretton, 1984) and claims have been made that drainage damages salmonid fish stocks (Stewart, 1963; Graesser, 1979; Mills, 1985).
Within the UK it is well known that erosive rainstorms can occur at any time of the year (Coppin and Richards, 1990) and so it is impossible to plan drainage work completely to avoid high risk periods.
0885-6087/93/0303 17- I7$13.50 0 1993 by John Wiley & Sons, Ltd.
Received 26 May I992 Accepted 24 August 1992
318 P. A. CARLING, M . S. GLAISTER AND T. P. FLINTHAM
However, there is an opportunity to address the design of drainage networks rigorously using hydraulic principles of open-channel flow. In this paper, soil loss and run-off from furrows have been measured with the specific intention of validating an hydraulic drainage model specifying the spacing, length and gradient of cross-drains to limit potential furrow and drain erosion.
Perspective Areas to be afforested are prepared by ploughing furrows [or mole drains; see Robinson (1990) for a
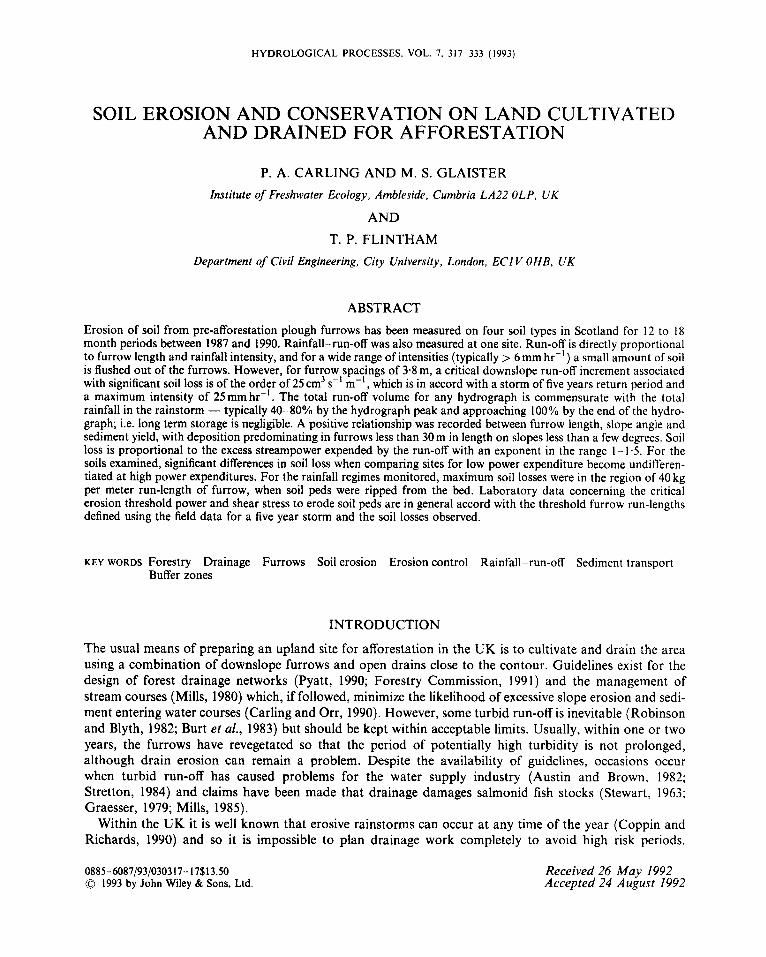
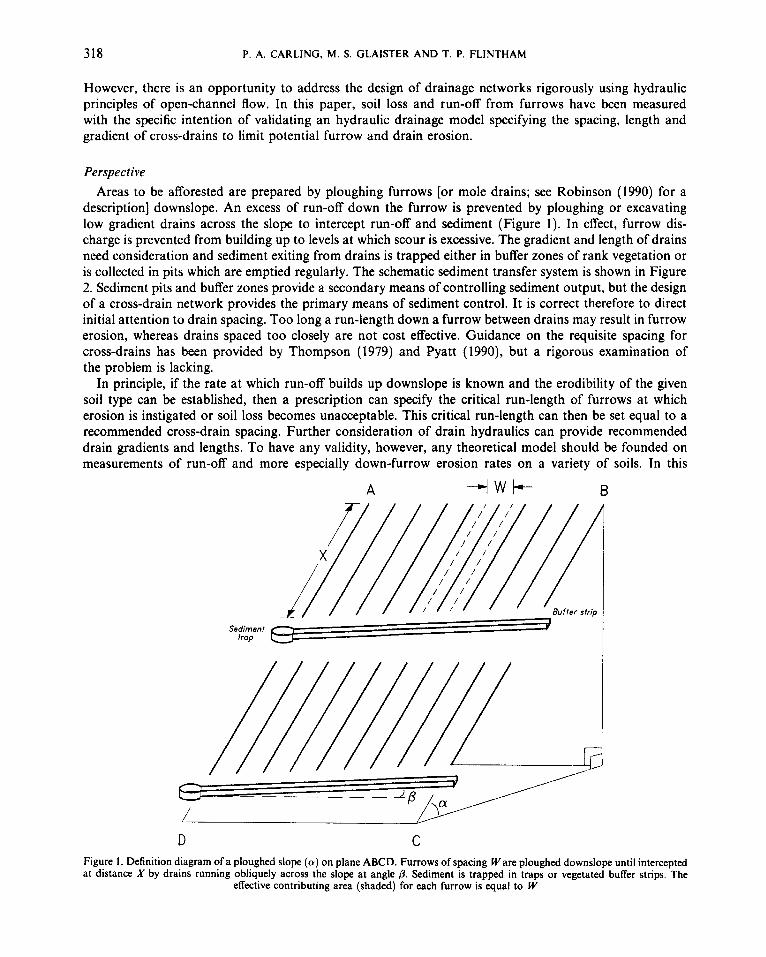
description] downslope. An excess of run-off down the furrow is prevented by ploughing or excavating low gradient drains across the slope to intercept run-off and sediment (Figure 1). In effect, furrow dis- charge is prevented from building up to levels at which scour is excessive. The gradient and length of drains need consideration and sediment exiting from drains is trapped either in buffer zones of rank vegetation or is collected in pits which are emptied regularly. The schematic sediment transfer system is shown in Figure 2. Sediment pits and buffer zones provide a secondary means of controlling sediment output, but the design of a cross-drain network provides the primary means of sediment control. It is correct therefore to direct initial attention to drain spacing. Too long a run-length down a furrow between drains may result in furrow erosion, whereas drains spaced too closely are not cost effective. Guidance on the requisite spacing for cross-drains has been provided by Thompson (1979) and Pyatt (1990), but a rigorous examination of the problem is lacking.
In principle, if the rate at which run-off builds up downslope is known and the erodibility of the given soil type can be established, then a prescription can specify the critical run-length of furrows at which erosion is instigated or soil loss becomes unacceptable. This critical run-length can then be set equal to a recommended cross-drain spacing. Further consideration of drain hydraulics can provide recommended drain gradients and lengths. To have any validity, however, any theoretical model should be founded on measurements of run-off and more especially down-furrow erosion rates on a variety of soils. In this
A B
D C Figure 1. Definition diagram of a ploughed slope (a) on plane ABCD. Furrows of spacing Ware ploughed downslope until intercepted at distance X by drains running obliquely across the slope at angle 0. Sediment is trapped in traps or vegetated buffer strips. The
effective contributing area (shaded) for each furrow is equal to W
SOIL EROSION AND AFFORESTATION 319
t Extt
Figure 2. Schematic sediment transfer network. Rectangular boxes indicate sediment sources and ellipsoids represent sediment control and storage.
paper, the field data used to scale a mathematical model of stable non-eroding drainage networks are reported. A companion paper details the mathematical model ( Flintham and Carling, this volume).
METHODS
Field data on furrow erosion were collected from three different soils (regarded by the Forestry Commis- sion as susceptible to erosion; Table I) between 1987 and 1989 and soil erosion and run-off were monitored
Table I. Site characteristics
Carron: Kintyre (NGR NR 936997); altitude about 250m Soil*: Iron stagnopodzols with 15cm of peat, very stony sandy silt loam texture with fragipan at 50cm depth, in
glacial till of Dalradian quartzite, phyllite and porphyry. Also stagno-orthic gley soils with no peat, moderately stony, gritty sandy loam texture, same parent material as above
Vegetation: MolinialRanunculuslJuncuslPotentiIla rough grassland Slopes: Monotonic 0.1900 and 0.2777
Lambdoughty: Galloway (NGR NX 488970); altitude about 250 m Stagno-orthic gley soil with no peat, moderately stony, gritty, sandy loam texture with fragipan at 40cm depth, in glacial till of granite and Ordovician greywacke
Soil:
Vegetation: MolinialCallunalErica t./Potentilla Slopes: Monotonic 0.1039 and 0.1044
Soil: Scotston: Perthshire (NGR NN 917437); altitude about 425 m
Mainly ferric stagnopodzols (some ironpan stagnopodzol and peaty stagno-orthic gley soil) with usually less than 5cm peat, moderately stony, sandy loam texture with fragipan at about 35cm depth, in glacial till of Dalradian mica schist
Vegetation: Slopes:
Soil:
Vegetation: MolinialJuncus a . & s./Brachythecium Slopes:
CallunalVacciniwm m.lDeschampsia J & c./Galium s. Monotonic 0.0750, 0.1250 and 0.2933
Skible: Kintyre (NGR NR 896605); altitude about 150 m Stagno-orthic gley soil with up to 30cm peat, slightly stony, sandy loam texture, in glacial till of Dalradian mica schist
(see Figure 3) 0.2178, 0.2210, 0.2219, 0.2229, 0.2230 and 0.2259
*Soil notation after Avery (1990).
320 P. A. CARLING, M. S. GLAISTER AND T. P. FLINTHAM
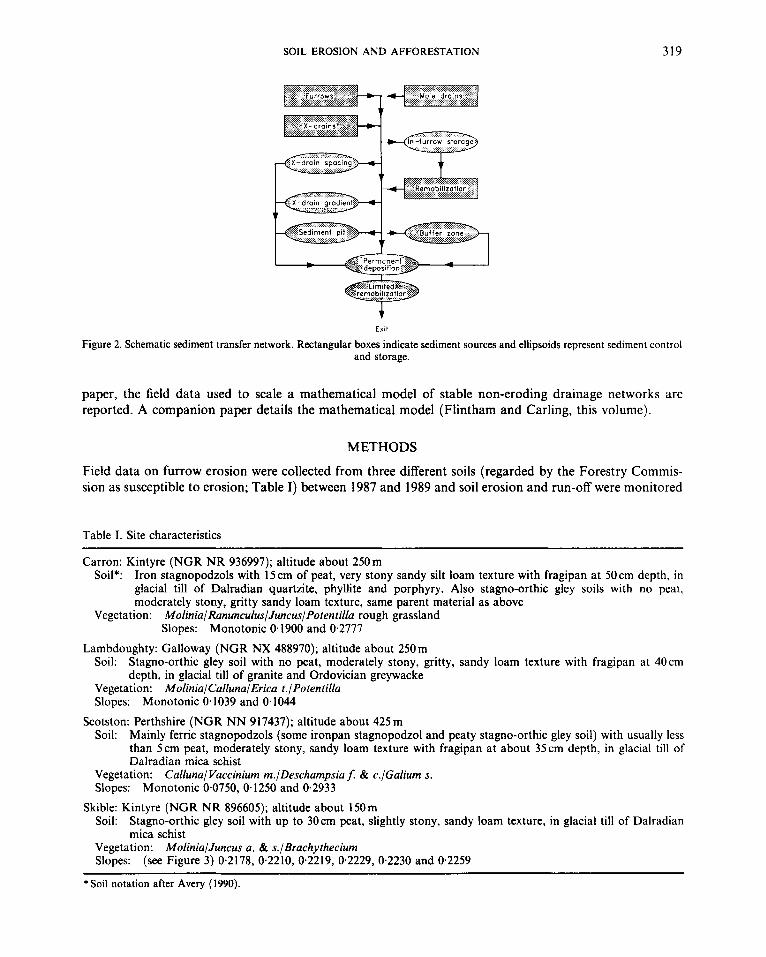
at a further site on a fourth susceptible soil type between 1989 and 1990, where mole drains were addition- ally considered. A total of 15 furrows were monitored in a similar fashion for erosion, and so only the method used at one site is detailed below. The latter site is situated on the north-west facing slopes of Cnoc nan Gabhar in Glen Skible, near Skipness in Kintyre. The soils here are stony surface water gleys of a loamy texture up to 70-t cm deep and underlain by Dalradian mica schist or till (Table I ) . Profiles are poorly drained and vegetation consists primarily of Molina and various species of Juncus. Three separ- ate blocks measuring approximately 200 m downslope by 70 m across the slope were isolated by cutoff drains above and below each site. Each site was selected for uniformity of slope and the slope profile of each furrow was surveyed. At Skible the slope of Block A was lo", whereas that of B and C was 12.5" (Figure 3; the average slopes for the other sites are given in Table I). As well as determining the overall slope profile, the local slope at each measurement station was also recorded and it is these latter data which are used for the hydraulic calculations.
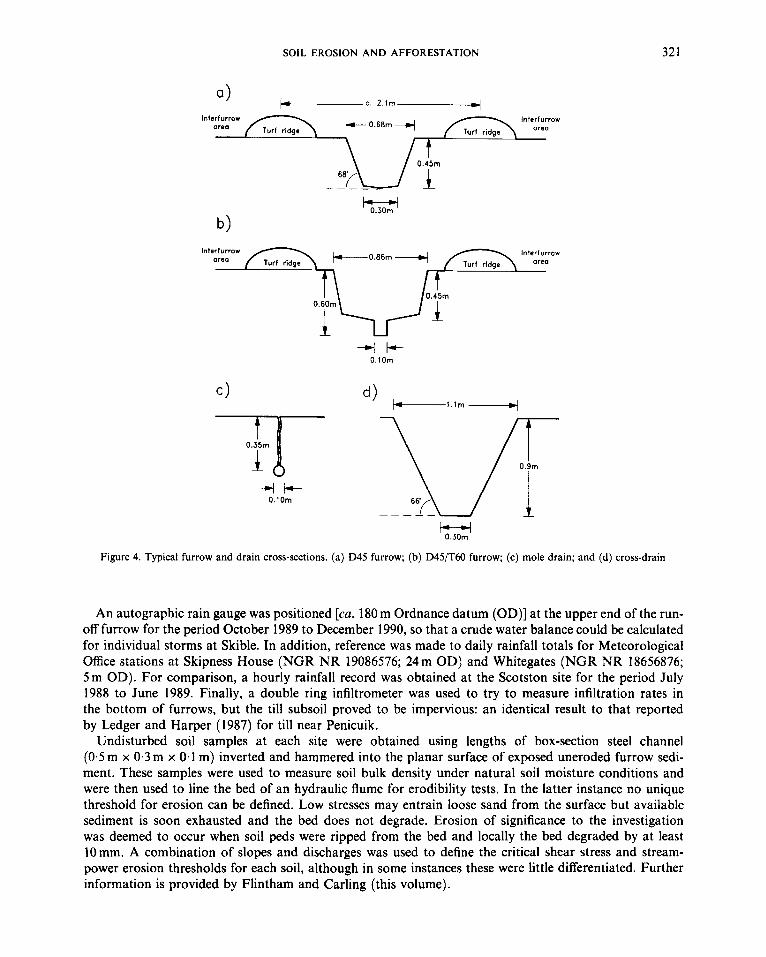
Each block was divided into three strips and ploughed (on 8 and 9 August 1989) down the slope with a D45 and D45/T60 double mouldboard plough or mole plough, giving run-lengths of 200 m. Characteristic cross-sections are shown in Figure 4, where furrow depths ( D ) are 0-45 m and the plough-tine penetrates to 0-60 m ( T ) . Open furrows were spaced 3.8 m apart and mole drains were 2 m apart at a nominal depth of 0.35-0.40 m. Site inspection following ploughing showed that furrow 'turn-out' on block A was poor, with many furrows blocked by turf, and the site consisted to a large extent of shallow peat rather than mineral soil. Consequently this block was abandoned. On blocks B and C, three D45, three D45/T60 furrows and three mole drains (see Figure 4) were selected for measurement of erosion rates, giving nine monitored drainage lines in total. In each furrow three monumented cross-sections 0.5m apart were established at 40, 80, 120, 160 and 195m downslope. Reference pegs were also sited at intervals down the three mole drains. At each furrow station the cross-sectional area (Figure 5) was resurveyed every three months for an 18 month period using a profile frame with 50 vertical measuring rods at 20mm spacings. In each mole drain the depth of the slot was recorded using a single rod. Data for replicate cross-sections were averaged at each station for each survey, and cross-sectional areas calculated. Deposition or erosion along the length of a furrow was recorded as a loss or gain in the total cross-sectional area between surveys (Figure 6).
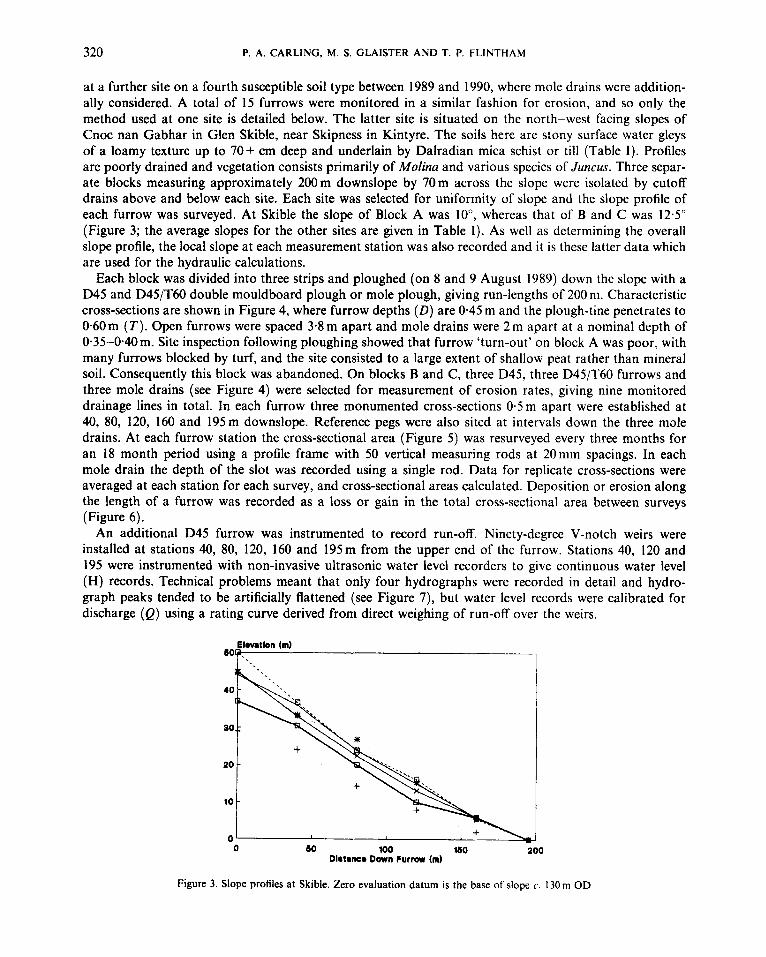
An additional D45 furrow was instrumented to record run-off. Ninety-degree V-notch weirs were installed at stations 40, 80, 120, 160 and 195m from the upper end of the furrow. Stations 40, 120 and 195 were instrumented with non-invasive ultrasonic water level recorders to give continuous water level (H) records. Technical problems meant that only four hydrographs were recorded in detail and hydro- graph peaks tended to be artificially flattened (see Figure 7), but water level records were calibrated for discharge (Q) using a rating curve derived from direct weighing of run-off over the weirs.
E l m t k n (m) bop.
Figure 3. Slope profiles at Skible. Zero evaluation datum is the base of slope c. 130 rn OD
SOIL EROSION AND AFFORESTATION 32 1
Interfurrow Interfurraw Turf ridge
Interfurrow lnlsrf urraw
Turf ridge Turf ridge
l - 4 0.30m
Figure 4. Typical furrow and drain cross-sections. (a) D45 furrow; (b) D45/T60 furrow; (c) mole drain; and (d) cross-drain
An autographic rain gauge was positioned [ca. 180 m Ordnance datum (OD)] at the upper end of the run- off furrow for the period October 1989 to December 1990, so that a crude water balance could be calculated for individual storms at Skible. In addition, reference was made to daily rainfall totals for Meteorological Office stations at Skipness House (NGR NR 19086576; 24m OD) and Whitegates (NGR NR 18656876; 5m OD). For comparison, a hourly rainfall record was obtained at the Scotston site for the period July 1988 to June 1989. Finally, a double ring infiltrometer was used to try to measure infiltration rates in the bottom of furrows, but the till subsoil proved to be impervious: an identical result to that reported by Ledger and Harper (1987) for till near Penicuik.
Undisturbed soil samples at each site were obtained using lengths of box-section steel channel (0.5 m x 0.3 m x 0.1 m) inverted and hammered into the planar surface of exposed uneroded furrow sedi- ment. These samples were used to measure soil bulk density under natural soil moisture conditions and were then used to line the bed of an hydraulic flume for erodibility tests. In the latter instance no unique threshold for erosion can be defined. Low stresses may entrain loose sand from the surface but available sediment is soon exhausted and the bed does not degrade. Erosion of significance to the investigation was deemed to occur when soil peds were ripped from the bed and locally the bed degraded by at least 10mm. A combination of slopes and discharges was used to define the critical shear stress and stream- power erosion thresholds for each soil, although in some instances these were little differentiated. Further information is provided by Flintham and Carling (this volume).
322 P. A. CARLING. M. S. GLAISTER AND T. P. FLINTHAM
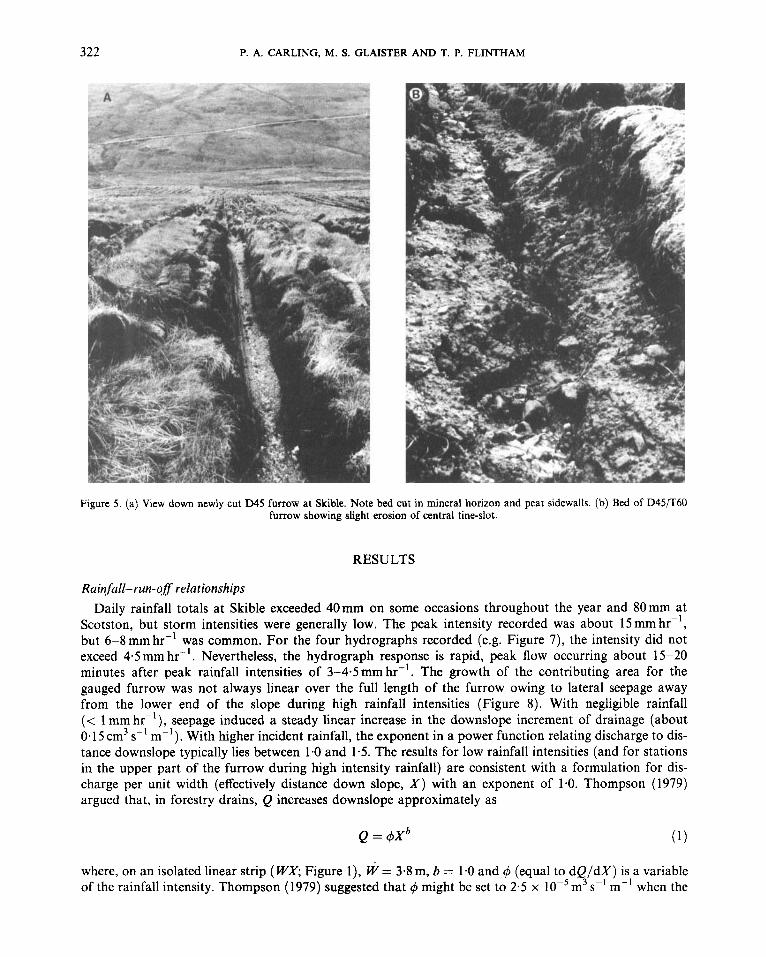
Figure 5 . (a) View down newly cut D45 furrow at Skible. Note bed cut in mineral horizon and peat sidewalls. (b) Bed of D45/T60 furrow showing slight erosion of central tine-slot.
RESULTS
Rainfall- run-ofl relationships Daily rainfall totals at Skible exceeded 40mm on some occasions throughout the year and 80mm at
Scotston, but storm intensities were generally low. The peak intensity recorded was about 15 mm hr-', but 6-8mmhr-' was common. For the four hydrographs recorded (e.g. Figure 7), the intensity did not exceed 4.5 mm hr-' . Nevertheless, the hydrograph response is rapid, peak flow occurring about 15-20 minutes after peak rainfall intensities of 3-4.5mmhr-'. The growth of the contributing area for the gauged furrow was not always linear over the full length of the furrow owing to lateral seepage away from the lower end of the slope during high rainfall intensities (Figure 8). With negligible rainfall (< 1 mm hr-'), seepage induced a steady linear increase in the downslope increment of drainage (about 0.15 cm3 s-' m-I). With higher incident rainfall, the exponent in a power function relating discharge to dis- tance downslope typically lies between 1.0 and 1.5. The results for low rainfall intensities (and for stations in the upper part of the furrow during high intensity rainfall) are consistent with a formulation for dis- charge per unit width (effectively distance down slope, X) with an exponent of 1.0. Thompson (1979) argued that, in forestry drains, Q increases downslope approximately as
Q = + X b
where, on an isolated linear strip (WX; Figure I ) , W = 3-8 m, b = 1.0 and q5 (equal to dQ/dX) is a variable of the rainfall intensity. Thompson (1979) suggested that + might be set to 2.5 x lop5 m3 s-' m-l when the

SOIL EROSION AND AFFORESTATION 323
50 Om (disionce down
cm
0
the slope)
Erosion from \\I 150m 08.12.87 - 23.08.88 - to
Carron Fur row 0 50 100 cm
Figure 6. Block diagram showing example of erosion in furrow at Carron. Station sections at this site were 30m apart
rainfall intensity is 25 mm hr-' (equivalent to the one-hour M5 storm; Institute of Hydrology, 1975) and that this should be the design run-off increment at the threshold of drain erosion. Flintham (1988) also recorded 'maximum' run-off rates of 2-3 x m3 s-' m-' but did not comment on the associated rainfall intensity. Determination of a critical value for q5 from the present data is made difficult by the fact that for high hourly rainfall intensities there is often a component of run-off owing to antecedent rainfall and because the most severe erosion occurred at the beginning of the project just before the rain gauge was installed. Despite these difficulties, the slopes of the curves in Figure 8 indicate that grows monotonically for rainfall intensities up to 2 5 mm hr-' and for the maximum intensities recorded (about 13- I5 mm hr-' ) q5 takes values of 1 x and 1.33 x 10⁻⁵m3s-'m-', respectively, which is consistent with a value of 2.5 x lo-' m3 s-' m-' for 25 mm rainfall intensity. Hudson (1967) argued that 25.4mm hr-' was required for serious erosion within the UK and, consequently, the latter value is adopted here, but further investi- gation is required.
Thompson (1979) argued that, during a storm, only 25% of rainfall runs off immediately. However, furrow run-off is in excess of the 25% prescription selected by Thompson (1979). The proportion of the rainfall already received which had run off by the time the hydrograph peaked was 0.38, 0.46, 0.75 and 0.77, respectively, for the four events shown in Figure 7. This is to be expected from a short monotonic 'isolated' slope segment developed over impervious till (cJ Burt and Gardiner, 1984). At low rainfall intensities some water is stored within the soil, but the infiltration capacity of upland peaty soils is low (typically 0.2 mm hr-'; Jones, 1990), under which circumstances run-off would be expected to be sensitive to incident rainfall and insensitive to antecedent conditions. Interception and evapotranspiration are only significant during dry periods (Ledger and Harper, 1987) so that during wet periods, run-off will closely match rainfall (David and Ledger, 1988).
The analysis presented here may be verified by considering an approximate water balance for the slope. A simple calculation shows that most incident rainfall, on an impervious wet cultivated slope, runs off immediately (Table 11). For example, for the rainfall event of about 7 hours 40 minutes duration on the

~
b
a 4
-
4-
2-
2-
0-
0
-
4-
2-
0-
"
12.0
0 14
.00
10.00
18.0
0 20
.00
22.0
0 0.0
0
2.00
lim
e (H
ours
)
C
d
4-
2-
-3
0
A
.- 0
.6
1 I
40m
-0
0.
00
2.00
4.
00
6.00
8.
00
W.0
0 12
.00
WO
O 1
0.00
18.00
Tim
e (H
ours
)
2
l--d
'Lln
1 -
9.00
16.00
11.0
0 12
.00
13.0
0 14.00
is.0
0 Ti
me
(Hou
rs)
6.00
7
.00
9.00
11.0
0 13
.00
16.0
0 17
.00
19.0
0
Tim
e (H
ours
)
@ 2 Y m
P
2- z U
Figu
re 7
. Rai
nfal
l and
run-
off h
ydro
grap
hs a
t Ski
ble.
The
195
m s
tatio
n un
der-
read
s ow
ing
to se
epag
e lo
sses
in t
he lo
wer
furr
ow. H
ydro
grap
h pe
aks t
end
to be
artif
icia
lly fl
atte
ned
owin
g to
tech
nica
l pro
blem
s. (a
) 28
Sept
embe
r 19
90; (
b) 2
Oct
ober
199
0; (c
) 16
Jan
uary
199
0; (
d) 2
4 D
ecem
ber
1989
. See
Tab
le I
1
SOIL EROSION AND AFFORESTATION 325
1.8 r A
1.4
1.2
1 .o
0.8
0.6
0.4
0.2
0
11.5mmlhr
0 40 80 120 160 195 x (4
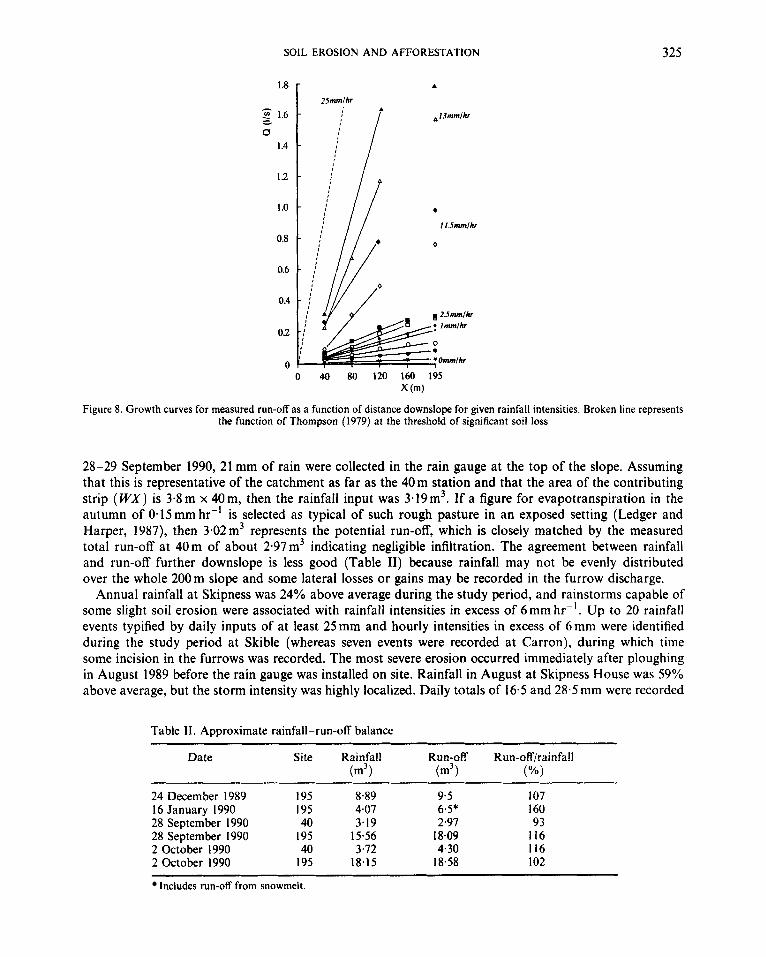
Figure 8. Growth curves for measured run-off as a function of distance downslope for given rainfall intensities. Broken line represents the function of Thompson (1979) at the threshold of significant soil loss
28-29 September 1990, 21 mm of rain were collected in the rain gauge at the top of the slope. Assuming that this is representative of the catchment as far as the 40m station and that the area of the contributing strip ( W X ) is 3-8m x 40m, then the rainfall input was 3.19m3. If a figure for evapotranspiration in the autumn of 0.15mmhrF’ is selected as typical of such rough pasture in an exposed setting (Ledger and Harper, 1987), then 3.02m3 represents the potential run-off, which is closely matched by the measured total run-off at 40 m of about 2.97 m3 indicating negligible infiltration. The agreement between rainfall and run-off further downslope is less good (Table 11) because rainfall may not be evenly distributed over the whole 200m slope and some lateral losses or gains may be recorded in the furrow discharge.
Annual rainfall at Skipness was 24% above average during the study period, and rainstorms capable of some slight soil erosion were associated with rainfall intensities in excess of 6mm hr-’. Up to 20 rainfall events typified by daily inputs of at least 25mm and hourly intensities in excess of 6mm were identified during the study period at Skible (whereas seven events were recorded at Carron), during which time some incision in the furrows was recorded. The most severe erosion occurred immediately after ploughing in August 1989 before the rain gauge was installed on site. Rainfall in August at Skipness House was 59% above average, but the storm intensity was highly localized. Daily totals of 16.5 and 28.5 mm were recorded
Table 11. Approximate rainfall-run-off balance ~~~~~~ ~ ~ - ~ ~~
Date Site Rainfall Run-off Run-off/rainfall (m’) (m’) (Yo)
24 December 1989 195 8.89 9.5 I07 16 January 1990 195 4.07 6.5* 160
28 September 1990 I95 15.56 18.09 116 2 October 1990 40 3.72 4.30 1 I6 2 October 1990 195 18.15 18.58 I02
28 September 1990 40 3.19 2.97 93
Includes run-off from snowmelt.
326 P. A. CARLING, M. S. GLAISTER AND T. P. FLINTHAM
at Whitegates and 11.9 and 18.8mm were recorded at Skipness House during and immediately after ploughing. The greater part of this precipitation probably fell within an hour (as measured run-off of 25 cm3 s-' m-' was associated with similar daily totals), implying that the 25 mm hr-' threshold was exceeded. Subsequent sections report the soil loss resulting from erosive rainstorms.
Mole drain erosion Mole drains were cut at a nominal depth of 35-40cm. After heavy daily rainfall on 8 and 10 August 1989
the depths were resurveyed, following local reports that erosion had occurred. The average depth of drain 1 was 55.6cm (SD 7.22; n = 9), drain 2 was 57.1 cm (SD 10.91; n = 9) and drain 3 was 61.0cm (SD 9.98; n = 9), showing an average increase in depth of about 18cm if the original mole drain was at 40cm. The maximum increase in depth at the time of the survey was 39cm at one station.
At later dates changes in depth were minor, with local deposition noted at some locations. Consequently over the winter of 1989-90, drain 1 decreased in depth on average by 2.5%, drain 2 by 1.2% and drain 3 by 2.9% since the erosion recorded following the August storm, and at the end of the study period the largest increase in depth at any station was 45%.
As the mole runs cannot be inspected it is not possible accurately to calculate the amount of soil lost, but an upper limit can be estimated as follows. If the mole diameter is lOcm, and this is taken as the nominal width of the eroded slot, then an average increase in slot depth of 18 cm owing to the August storm rep- resents a loss of 3.6m3 (7.2 tonnes) from the 200m run-length.
Furrow erosion A range of local slopes between 8" and 18" is represented at Skible, which is similar to that recorded in
the first phase of the investigation (Carron, Lambdoughty and Scotston, about 4-16"). Although at Carron a weak correlation was noted between slope ( S ) and the degree of deposition or erosion, at Skible no con- sistent relationship could be found for any station. Erosion data for some Skible sites, however, showed a weak relationship with distance ( X ) downslope. Better results were obtained considering the product of slope and distance downslope as reported in the following.
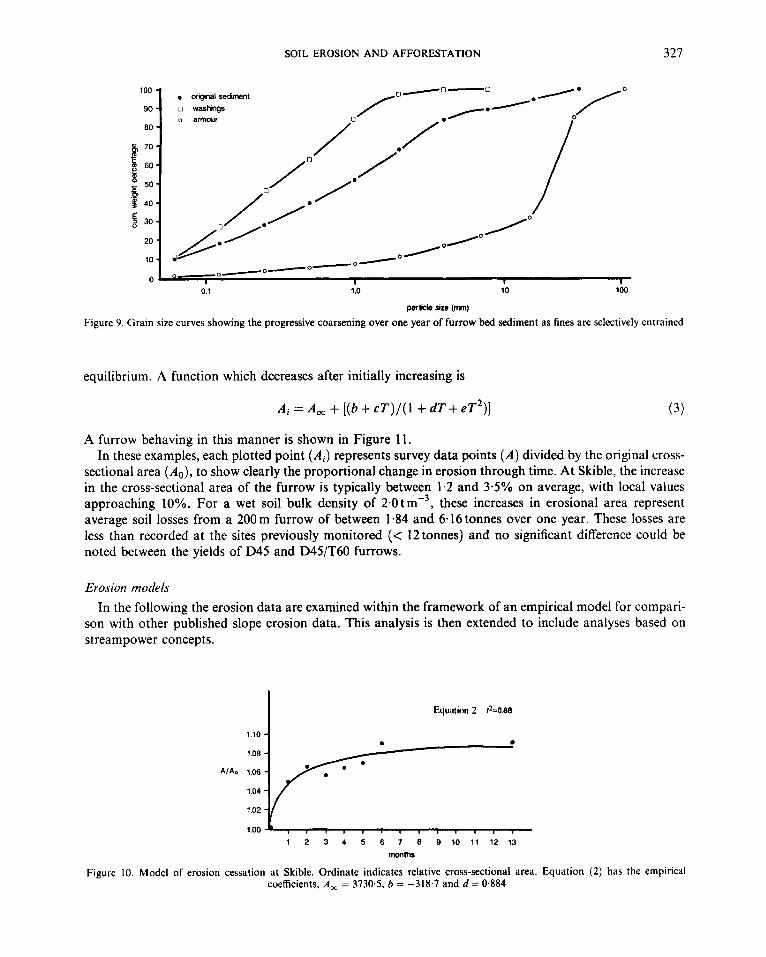
As noted earlier, erosion at Skible began soon after ploughing, following heavy rainfall in August. Indeed, most sites investigated showed a degree of erosion, or erosion alternating with deposition in the first few months following ploughing. However, a condition of stability was approached towards the end of the study period. This was not primarily associated with the encroachment of vegetation, but rather a pro- cess of surface armouring or scouring to a non-erodible horizon. The armouring process consists of the preferential selection of finer particles by furrow run-off, so that the coarser particles remain in situ and are concentrated to provide a protective surface layer which is rarely disturbed by flow. A typical example of the change in grain size distributions is given in Figure 9. Selective entrainment of material with a median grain size of 0.3 mm from the original sediment (d50 = 1.5 mm) left an armour (dso = 20 mm) in place after one year. Furrows ploughed in 1987 were partially vegetated after two years and completely grass-lined by 1991.
Although the rate of incision or deposition depends on the rainfall history, in the absence of renewed incision the decline in the rate of erosion with time can generally be described by some form of exponential function (Thornes, 1990). A disadvantage of this model is that a poor fit can be obtained when high erosion rates rapidly decrease to zero or when infilling occurs after an erosional phase. An alternative erosion model, reflecting a shift to a new equilibrium, is of the form:
A ; = A , + [b/( 1 + dT)] (2)
where b and dare empirical coefficients and at T = 0, Ai = A , + b and at T = 00, A; = A,. As can be seen in the example given in Figure 10, initial rapid erosion during the first six months approaches asymp- totically a new equilibrium cross-sectional area ( A , ) as the furrow stabilizes.
Some furrows begin to fill with sediment after an initial erosive phase and may eventually reach a new
SOIL EROSION AND AFFORESTATION
1.10 -
327
Equatitn 2 r2=0.88
b
0.1 1 a 10 100
partide size (mn)
Figure 9. Grain size curves showing the progressive coarsening over one year of furrow bed sediment as fines are selectively entrained
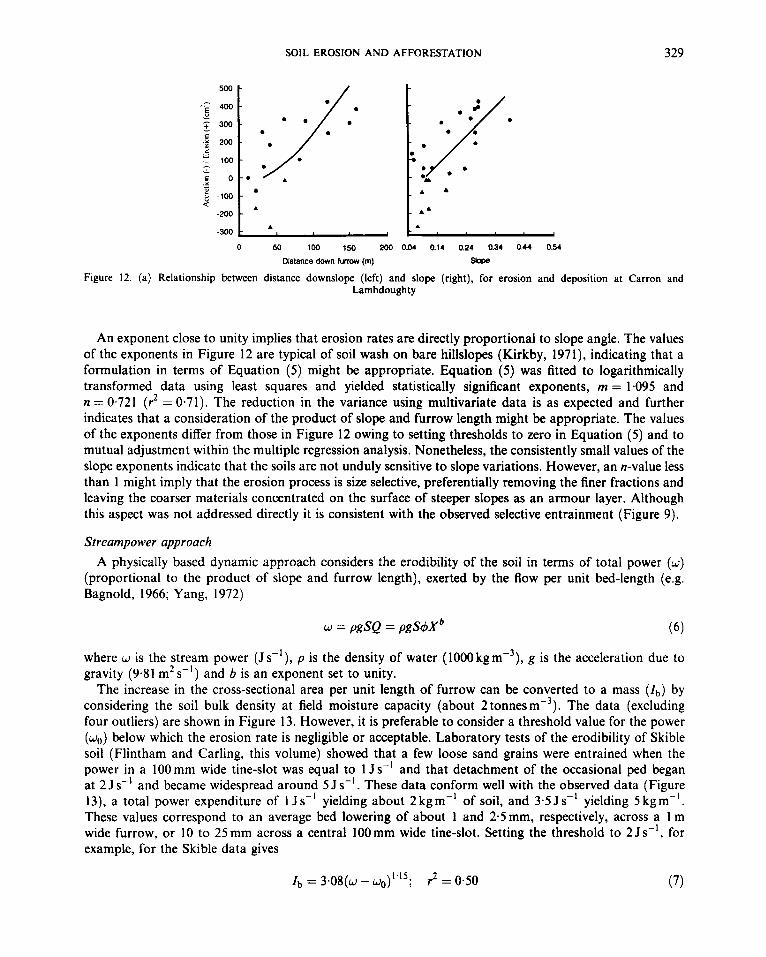
equilibrium. A function which decreases after initially increasing is
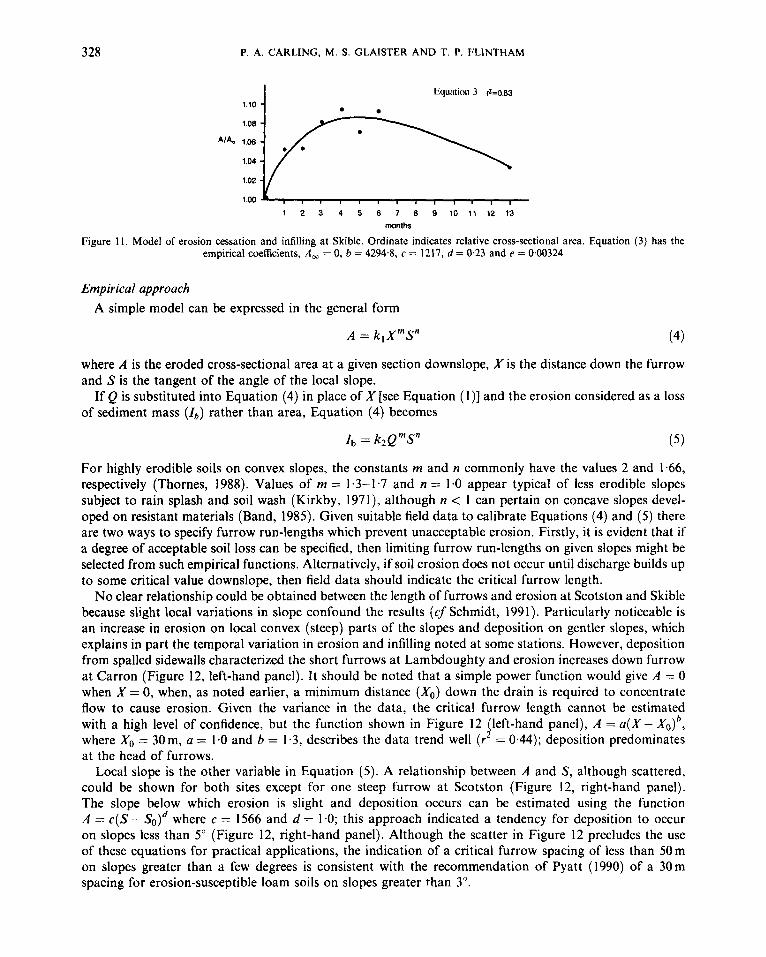
A furrow behaving in this manner is shown in Figure 11. In these examples, each plotted point ( A i ) represents survey data points ( A ) divided by the original cross-
sectional area ( A o ) , to show clearly the proportional change in erosion through time. At Skible, the increase in the cross-sectional area of the furrow is typically between 1.2 and 3.5% on average, with local values approaching 10%. For a wet soil bulk density of 2.0tm-3, these increases in erosional area represent average soil losses from a 200m furrow of between 1.84 and 6.16 tonnes over one year. These losses are less than recorded at the sites previously monitored (< 12tonnes) and no significant difference could be noted between the yields of D45 and D45/T60 furrows.
Erosion models In the following the erosion data are examined within the framework of an empirical model for compari-
son with other published slope erosion data. This analysis is then extended to include analyses based on streampower concepts.
328 P. A. CARLING, M. S. GLAISTER A N D T. P. FLINTHAM
t?quaition 3 rL0.83 1.10 -
1 2 3 4 5 6 7 8 9 1 0 1 1 1 2 1 3 months
Figure 1 1 . Model of erosion cessation and infilling at Skible. Ordinate indicates relative cross-sectional area. Equation (3) has the empirical coefficients, A , = 0, b = 4294.8, c = 1217, d = 0.23 and e = 0.00324
Empirical approach A simple model can be expressed in the general form
where A is the eroded cross-sectional area at a given section downslope, X is the distance down the furrow and S is the tangent of the angle of the local slope.
If Q is substituted into Equation (4) in place of X [see Equation ( I ) ] and the erosion considered as a loss of sediment mass ( I b ) rather than area, Equation (4) becomes
Zb = k2Q"S"
For highly erodible soils on convex slopes, the constants m and n commonly have the values 2 and 1.66, respectively (Thornes, 1988). Values of m = 1-3-1.7 and n = 1.0 appear typical of less erodible slopes subject to rain splash and soil wash (Kirkby, 1971), although n < 1 can pertain on concave slopes devel- oped on resistant materials (Band, 1985). Given suitable field data to calibrate Equations (4) and (5) there are two ways to specify furrow run-lengths which prevent unacceptable erosion. Firstly, it is evident that if a degree of acceptable soil loss can be specified, then limiting furrow run-lengths on given slopes might be selected from such empirical functions. Alternatively, if soil erosion does not occur until discharge builds up to some critical value downslope, then field data should indicate the critical furrow length.
No clear relationship could be obtained between the length of furrows and erosion at Scotston and Skible because slight local variations in slope confound the results (cf Schmidt, 1991). Particularly noticeable is an increase in erosion on local convex (steep) parts of the slopes and deposition on gentler slopes, which explains in part the temporal variation in erosion and infilling noted at some stations. However, deposition from spalled sidewalls characterized the short furrows at Lambdoughty and erosion increases down furrow at Carron (Figure 12, left-hand panel). It should be noted that a simple power function would give A = 0 when X = 0, when, as noted earlier, a minimum distance ( X o ) down the drain is required to concentrate flow to cause erosion. Given the variance in the data, the critical furrow length cannot be estimated with a high level of confidence, but the function shown in Figure 12 (left-hand panel), A = a ( X - X o ) h , where X o = 30m, a = 1.0 and b = 1.3, describes the data trend well (r2 = 0.44); deposition predominates at the head of furrows.
Local slope is the other variable in Equation (5). A relationship between A and S, although scattered, could be shown for both sites except for one steep furrow at Scotston (Figure 12, right-hand panel). The slope below which erosion is slight and deposition occurs can be estimated using the function A = c(S - So)d where c = 1566 and d = 1 .O; this approach indicated a tendency for deposition to occur on slopes less than 5" (Figure 12, right-hand panel). Although the scatter in Figure 12 precludes the use of these equations for practical applications, the indication of a critical furrow spacing of less than 50m on slopes greater than a few degrees is consistent with the recommendation of Pyatt (1990) of a 30m spacing for erosion-susceptible loam soils on slopes greater than 3".
SOIL EROSION AND AFFORESTATION
500
'2 400 - 300 -
c .% 200
5 100
r o - - ._ - 5 -100
-200
329
L
- -
- -
- a
- A -
a
A A -300 I I
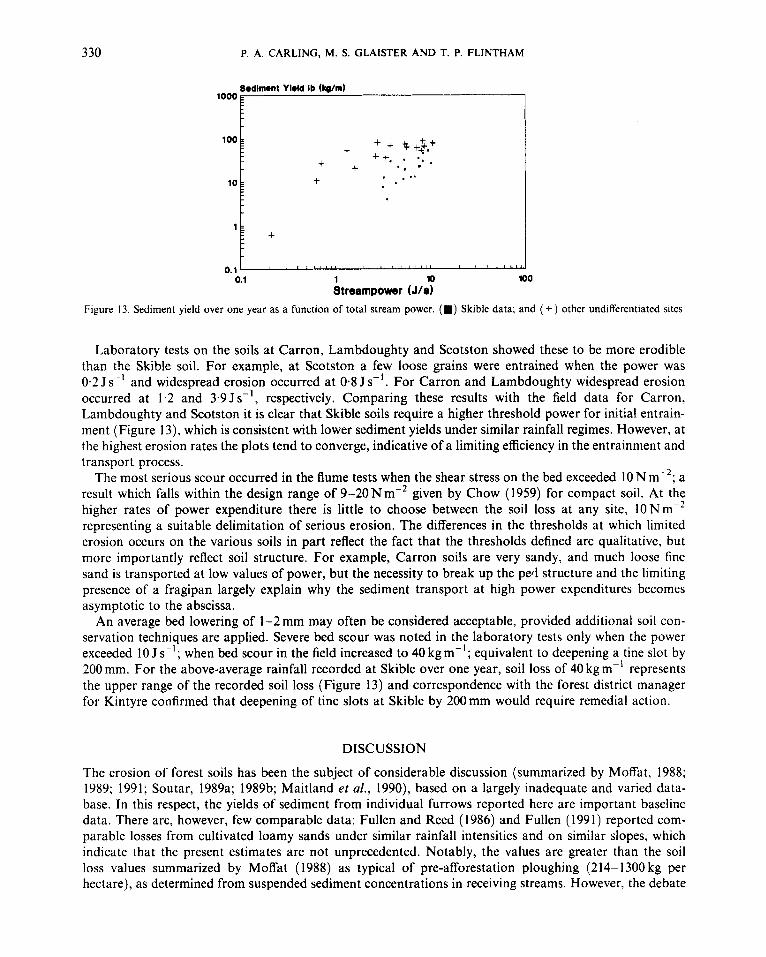
Distance down furrow (m) srope Figure 12. (a) Relationship between distance downslope (left) and slope (right), for erosion and deposition at Carron and
Lambdoughty
0 50 100 150 200 0.04 0.14 0.24 0.34 0.44 0.54
An exponent close to unity implies that erosion rates are directly proportional to slope angle. The values of the exponents in Figure 12 are typical of soil wash on bare hillslopes (Kirkby, 1971), indicating that a formulation in terms of Equation (5) might be appropriate. Equation ( 5 ) was fitted to logarithmically transformed data using least squares and yielded statistically significant exponents, m = 1.095 and n = 0.721 (r2 = 0.71). The reduction in the variance using multivariate data is as expected and further indicates that a consideration of the product of slope and furrow length might be appropriate. The values of the exponents differ from those in Figure 12 owing to setting thresholds to zero in Equation (5) and to mutual adjustment within the multiple regression analysis. Nonetheless, the consistently small values of the slope exponents indicate that the soils are not unduly sensitive to slope variations. However, an n-value less than 1 might imply that the erosion process is size selective, preferentially removing the finer fractions and leaving the coarser materials concentrated on the surface of steeper slopes as an armour layer. Although this aspect was not addressed directly it is consistent with the observed selective entrainment (Figure 9).
Streampower approach A physically based dynamic approach considers the erodibility of the soil in terms of total power (w)
(proportional to the product of slope and furrow length), exerted by the flow per unit bed-length (e.g. Bagnold, 1966; Yang, 1972)
w = pgSQ = pgSq5Xb (6)
where w is the stream power (J s-I), p is the density of water (1000 kgm-3), g is the acceleration due to gravity (9.81 m2 s-I) and b is an exponent set to unity.
The increase in the cross-sectional area per unit length of furrow can be converted to a mass ( Ib ) by considering the soil bulk density at field moisture capacity (about 2 tonnesm-'). The data (excluding four outliers) are shown in Figure 13. However, it is preferable to consider a threshold value for the power (wo) below which the erosion rate is negligible or acceptable. Laboratory tests of the erodibility of Skible soil (Flintham and Carling, this volume) showed that a few loose sand grains were entrained when the power in a 100 mm wide tine-slot was equal to 1 J s-I and that detachment of the occasional ped began at 2 J s-' and became widespread around 5 J s-I. These data conform well with the observed data (Figure 13), a total power expenditure of 1 J s-I yielding about 2 kg m-I of soil, and 3.5 J s-' yielding 5 kg m-' . These values correspond to an average bed lowering of about I and 25mm, respectively, across a 1 m wide furrow, or 10 to 25 mm across a central l00mm wide tine-slot. Setting the threshold to 2 J s-', for example, for the Skible data gives
330
1:
P. A. CARLING, M. S. GLAISTER AND T. P. FLINTHAM
+
8mdlmmnt YImld Ib (kglm)
l o o 0 N
Laboratory tests on the soils at Carron, Lambdoughty and Scotston showed these to be more erodible than the Skible soil. For example, at Scotston a few loose grains were entrained when the power was 0.2 J s-' and widespread erosion occurred at 0.8 J s-I. For Carron and Lambdoughty widespread erosion occurred at 1.2 and 3.9Js-', respectively. Comparing these results with the field data for Carron, Lambdoughty and Scotston it is clear that Skible soils require a higher threshold power for initial entrain- ment (Figure 13), which is consistent with lower sediment yields under similar rainfall regimes. However, at the highest erosion rates the plots tend to converge, indicative of a limiting efficiency in the entrainment and transport process.
The most serious scour occurred in the flume tests when the shear stress on the bed exceeded 10 N m-2; a result which falls within the design range of 9-20Nm-2 given by Chow (1959) for compact soil. At the higher rates of power expenditure there is little to choose between the soil loss at any site, 10Nm-2 representing a suitable delimitation of serious erosion. The differences in the thresholds at which limited erosion occurs on the various soils in part reflect the fact that the thresholds defined are qualitative, but more importantly reflect soil structure. For example, Carron soils are very sandy, and much loose fine sand is transported at low values of power, but the necessity to break up the ped structure and the limiting presence of a fragipan largely explain why the sediment transport at high power expenditures becomes asymptotic to the abscissa.
An average bed lowering of 1-2 mm may often be considered acceptable, provided additional soil con- servation techniques are applied. Severe bed scour was noted in the laboratory tests only when the power exceeded 10 J s-'; when bed scour in the field increased to 40 kgm-I; equivalent to deepening a tine slot by 200 mm. For the above-average rainfall recorded at Skible over one year, soil loss of 40 kg m-' represents the upper range of the recorded soil loss (Figure 13) and correspondence with the forest district manager for Kintyre confirmed that deepening of tine slots at Skible by 200mm would require remedial action.
DISCUSSION
The erosion of forest soils has been the subject of considerable discussion (summarized by MoRdt, 1988; 1989; 1991; Soutar, 1989a; 1989b; Maitland et al., 1990), based on a largely inadequate and varied data- base. In this respect, the yields of sediment from individual furrows reported here are important baseline data. There are, however, few comparable data: Fullen and Reed (1986) and Fullen (1991) reported com- parable losses from cultivated loamy sands under similar rainfall intensities and on similar slopes, which indicate that the present estimates are not unprecedented. Notably, the values are greater than the soil loss values summarized by Moffat (1988) as typical of pre-afforestation ploughing (214-1300 kg per hectare), as determined from suspended sediment concentrations in receiving streams. However, the debate

SOIL EROSION AND AFFORESTATION 33 1
has not been helped by a failure to discriminate between slope and channel processes. It is evident that yields determined from suspended sediment concentrations in receiving streams (e.g. Maitland et al., 1990; their Table 2a) may not adequately represent the amount of soil flushed out of furrows and the efficacy of current conservation practice. At all the sites studied in the present project little sediment appeared to reach stream courses, the implication being that vegetated buffer zones, cross-drains and sumps (effectively designed) can trap large amounts of eroded material. A similar conclusion was reached by Maitland et al. (1990; p. 15) with respect to buffer zones. Nonetheless, as long as furrow ploughing remains the preferred site preparation technique, then attention must be firmly focused on effective drainage design and maintenance (Hornung and Newson, 1986). To this end the following discussion emphasizes soil conservation techniques.
The sediment yield from the Skible furrows is less than that estimated from the mole drains, even though with a closer spacing moles should carry less drainage. Further study is required to decide if this is a reliable result, but the deepening of the mole drains was in no way matched by commensurate deepening of the furrows. However, it has been suggested that mole drains might generate less sediment than open furrows (Francis, 1987), and so some comment is appropriate. Furrows display a greater exposed surface area of bare soil than mole drains, but flow is largely confined to the central few centimetres width and can expand laterally. Consequently, furrows should only produce more sediment if raindrop impact, frost or desic- cation is significant in dislodging sediment. However, on a stony soil the high shear stresses generated by the run-off are likely to be of greater significance with respect to deepening the furrow than rainfall impact. In contrast, flow in mole drains cannot expand laterally across the section and may further fill the pipe, become surcharged and flow under pressure, proving more erosive than open furrow flow. Mole drain runs are also frequently blocked, and although this leads to local deposition of sediment on the vegetated surface, accelerated erosion occurs downslope of obstructions.
The stream power approach used here can be used to estimate the critical drain spacing. For example, if practically no soil loss can be contemplated on the Skible site, then a threshold yield of 5 kg m-' , might be selected. From Equation (7) a yield of this order is associated with an effective power expenditure of 1.5J.s-I. Entering this value in Equation (6), with 4 set to 2.5 x 10-'m3s-' for the M5 storm on a 10" slope indicates a critical drain spacing of 35 m.
Having derived these scaling relationships from the field data it is possible to formulate a drainage design model based on hydraulic principles of in-channel flow. For example, for the present soils 10 N m-2 might be selected as an appropriate threshold shear stress, but for other highly susceptible soils or where soil con- servation has an over-riding importance, a more conservative approach could be used: utilizing a 5 N rn-' threshold or interpolating as required. Present forest drainage guidelines dictate that where soils are suscep- tible then drains should be placed at 30-50m intervals. It is evident in using Equations (6) and (7) that the 50m spacing might be conservative and could be relaxed on more gentle slopes. For example, using the same threshold parameters for a 5 kg m-I yield on a 5" slope indicates a 70 m spacing. Conversely, on steep slopes where soils are particularly susceptible it is not practicable to space drains closer than 30 m, and in these instances the analysis can be used to indicate when other soil conservation or cultivation techniques should be considered. Any model needs to address the variability in soil erodibility, the angle at which furrows and drains are ploughed with respect to slope angle, and the variation in drain geometry and hydraulic roughness for given rainfall regimes. Such a model for stable channels is presented in a com- panion paper (Flintham and Carling, this volume).
CONCLUSIONS
The rate of run-off from an isolated furrow strip is directly proportional to the hourly rainfall intensity for a given rainstorm. The proportionality coefficient increases as a function of the return period of the rain- storm. Storage of run-off on the hillslope during the period of a discrete rainstorm is negligible; conse- quently nearly 100% of rainfall runs off within a few hours. The observed data are consistent with the critical rainstorm to cause erosion being equal to a one hour M5 storm, 25mmhr-', producing 2.5 x lo-' m3 s-' of run-off for every 1 m downslope increment in furrow length.

332 P. A. CARLING, M. S. GLAISTER AND T. P. FLINTHAM
Sediment yield is positively related to furrow length and hillslope angle, expressed in terms of the stream- power exerted by the run-off on erodible soil. The threshold of erosion varies depending on soil type, but under a near-average rainfall regime, the yield becomes asymptotic to a maximum. The maximum sediment yield recorded was in the region of 40kgm-‘, which was associated with a rainstorm believed to equal the M5 storm. However, little sediment seemed to reach receiving stream courses. Little erosion occurs on slopes of less than a few degrees and deposition from sidewall spalling is prominent in furrows less than 30m in length. Erosion ceased within 12 to 18 months as furrows became first armoured and subsequently vegetated.
Streampower relationships can be used to estimate critical furrow run-lengths on given slopes and indi- cate those situations where the present Forestry Commission guidelines for cross-drain spacing are appro- priate. The analysis may also be used to indicate where other soil conservation or cultivation techniques could usefully be employed.
ACKNOWLEDGEMENTS
The project was commissioned and partly funded by the Forestry Commission, and Tilhill Ltd allowed access to the Scotston site. Dr D. G. Pyatt (FC Northern Research Station) is thanked for his continued support, constructive comment and enthusiasm for the investigation. The various Forest District Managers (especially Mr Embleton, Kintyre District) readily provided logistic support. The interpretation expressed herein, however, is that of the authors and does not necessarily represent the views of the Forestry Com- mission or private forestry industry. Ms H. Orr and Mr B. James are thanked for help with field work, while technical staff at City University Engineering Department assisted with the laboratory determination of erosion thresholds.
REFERENCES
Austin, J. N. and Brown, D. 1982. ‘Solids contamination resulting from drainage works in an upland catchment and its removal by
Avery, B. W. 1990. Soils of the British Isles. CAB International, Wallingford. 463 pp. Bagnold, R. A. 1966. ‘An approach to the sediment transport problem from general physics’, CSGS Prof. Pup. 4221. Band, L. 1985. ‘Field parameterization of an empirical sheetwash transport equation’, Cutenu, 12, 281 -290. Burt, T. P. and Gardiner, A. T. 1984. ‘Runoff and sediment production in a small peat-covered catchment: some preliminary results’ in
Burt, T. P., Donohue, M. A., and Vann, A. R. 1983. ‘The effects of forestry drainage operations on upland sediment yields: the results
Carling, P. A. and Orr, H. 1990. ‘Response of benthic macroinvertebrates and salmonid fish in a Scottish stream to preafforestation
Chow, V. T. 1959. Open-Channel Hydruulics. McGraw-Hill International, New York. 680 pp. Coppin, N. J . and Richards, 1. G. 1990. Use of Vegetution in Civil Engineering. CIRIA, Butterworths, London. 292pp. David, J. S. and Ledger, D. C. 1988. ‘Runoff generation in a plough-drained peat bog in southern Scotland’, J . Hylrol.. 99, 187-199. Flintham, T. P. 1988. ‘Flow resistance in ploughed upland drains: narrow channels with uniform or composite roughness’, Unpublished
Flintham, T. P. and Carling, P. A. ‘Design of stable drainage networks in upland forestry plantations’, this volume. Forestry Commission 1991. Forest & Wurer Guidelines. HMSO, London. Francis, I. S. 1987. ‘Blanket peat erosion in mid-Wales. A two catchment study’, Unpubkshed PhD Thesis, University of Wales. Fullen, M. A. 199 I . ‘A comparison of runoff and erosion rates on bare and grassed loamy sand soils’, Soil Use Munuge., 7 , 136- 139. Fullen, M . A. and Reed, A. H. 1986. ‘Rainfall, runoff and erosion on bare arable soils in East Shropshire, England’, Eurrh SurJ
Graesser. N. W. C. 1979. ‘How land improvement can damage Scottish salmon fisheries’, Sulmon Trout Mug., 215, 39-43. Hornung, M. and Newson, M. D. 1986. ’Upland afforestation: influences on stream hydrology and chemistry’. Soil Uxe Munuge., 2 ,
Hudson, N. W. 1967. ‘Why don’t we have soil erosion in England? in Gibb, J. A. C. (ed.), Proceedings of the Agriculrurul Engineering
Institute of Hydrology (UK) 1975. Flood Studies Reporr. Vol. 11. Natural Environment Research Council, pp. 4-5. Jones, J. A. A. 1990. ‘Piping effects in humid lands’ in Higgins, C . G. and Coates, D. R. (Eds), Groundwoter Geomorphology: the Role
Kirkby, M. J. 1971. Hillslope process-response models based on the continuity equation’, Truns. Instif. 5 r . Geogr. Spec. Puhl., 3, 15-30, Ledger, D. C. and Harper, S. E. 1987. ‘The hydrology of a drained, afforested peat bog in southern Scotland’, Truns. R. Soc.
flotation’, J . Inst. War. Engin. Sci., 36, 281-288.
Burt, T. P. and Walling, D. E. (Eds), Catchment Experiments in Fluviul Geomorphology. Geo Books, Norwich. pp. 133-151.
of a storm-based study’, Eurrh Surf. Process. Landforms, 8, 339-346.
drainage’, Unpublished Report to the Atlantic Sulmon Trust. 30 pp.
PhD Thesis, University of Leicester, 312pp.
Process. Lundforms, 11, 413-425.
61-65.
Symposium Silsoe, I 1 Sep. 1967, Puper 5/B/42, 3. Institute of Agricultural Engineering, London.
of Subsurfuce Wuter in Eurth-Surfuce Processes und Lundforms, Geol. Soc. Am. Spec. Pup. 252. pp, 1 I I - 138.
Edinburgh, 78, 297-303.
SOIL EROSION AND AFFORESTATION 333
Maitland, P. S., Newson, M. D., and Best, G. A. 1990. ‘The impact of afforestation and forestry practice on freshwater habitats’, Focus
Mills, D. H. 1980. ‘The management of forest streams’, Forestry Commission Leaflet 78, HMSO, London. Mills, D. H. 1985. ‘The effects of afforestation on salmon and trout rivers and suggestions for their control’ in J. F. Solbe (Ed.). Effecrs
Moffat, A. J. 1988. ‘Forestry and soil erosion in Britain - a review’, Soil Use Manage., 4, 41-44. Moffat, A. J. 1989. ‘Forestry and soil erosion in Britain - a reply’, Soil Use Manage., 5 , 199-200. Moffat, A. J. 1991. ‘Forestry and soil protection in the UK’, Soil Use Manage., 7 , 145-151. Pyatt, D. G. 1990. ‘Forest drainage’, Forestry Commission Res. Inform. Note 196, Forestry Commission, Alice Holt Robinson, M. 1990. ‘Impact of improved land drainage on river flows’, Inst. Hydrol. (UK) Rep. No. 113, Institute of Hydrology,
Robinson, M. and Blyth, K. 1982. ‘The effect of forest drainage operations on upland sediment yields: a case study’, Eurrh Sur$
Schmidt, J. 1991. ‘A mathematical model to simulate rainfall erosion’, in Bork, H.-R., de Ploey, J., and Schick, A. P. (Eds), Erosion,
Soutar, R. G. 1989a. ‘Afforestation, soil erosion and sediment yields in British freshwaters’, Soil Use Manage., 5, 82-86. Soutar, R. G. 1989b. ‘Afforestation, soil erosion and sediment yields in British freshwaters’, Soil Use Manage., 5 , 200. Stewart, L. 1963. Investigations into Migratory Fish Propagation in the Area of the Lancashire River Board, J. B. Barber, Lancaster. Stretton, C. 1984. ‘Water supply and forestry - a conflict of interests: Cray Reservoir, a case study’, J. Inst. Wut. Engin. Sci., 38,
Thompson, D. A. 1979. ‘Forest drainage schemes’, Forestry Commission Leaflet No . 72. HMSO, London. 16pp. Thornes, J. B. 1988. ‘Erosion equilibria under grazing’ in Bentcliff, J., Davidson, D., and Grant, E. (Eds), Conceptual Issues in
Thornes, J. B. 1990. ‘The interaction of erosional and vegetational dynamics in land degradation: spatial outcomes’, in Thornes, J. B.
Yang, C. T. 1972. ‘Unit stream power and sediment transport’, J. Hydr. Div. Am. Soc. Civ. Engin., 99, 1679-1704.
on Nature Conservation Rep. 23, Nature Conservancy Council, Peterborough. 80 pp.
of Land Use on Fresh Waters. WRC, Ellis Horwood, Chichester. pp. 422-431.
Wallingford, 226 pp.
Process. Landforms, 1, 85-90.
Transport and Deposition Processes: Theories and Models, Catena Suppl., 19, pp. 101 -109.
323-330.
Environmental Archaeology. Edinburgh University Press. pp. 193-21 1.
(Ed.), Vegetation and Erosion. Wiley, Chichester. pp. 41-53.


