
Sequential Processivity and CAND1 Regulate SCF Ubiquitin
Ligases
Thesis by
Nathan William Pierce
In Partial Fulfillment of the Requirements
for the Degree of
Doctor of Philosophy
California Institute of Technology
Pasadena, California
2012
(Defended November 10, 2011)

ii
2012
Nathan William Pierce
All Rights Reserved

iii
To my father Terry, my mother Lynne, my wife Terrell, and to myself, for not giving
up on me.

iv
Acknowledgments
There are many people to thank for help getting to this point. First, I would
like to send my deepest regards to the teachers throughout my life who made
science and learning fun and interesting. Second, I would like to thank the people
who wrote my recommendation letters for graduate school including James Nelson,
David K Stevenson, and Gerry Fuller. Without their guidance and support I would
not be here. Third, I would like to thank Caltech itself for accepting me to graduate
school. Despite getting interviews at several schools, I was only accepted to MIT and
Caltech.
I want to thank my family and wife Terrell for constant support throughout
these years. There are many people I have met at Caltech that deserve mention: This
includes Gary Kleiger and Anj Saha for providing key support and discussions
regarding the mechanisms of SCF ubiquitin ligases. Tara Gomez, Natalie Kolawa,
Mike Rome, Kuang-‐Jung Chang, and Ruzbeh Mosadeghi for marching beside me in
the trenches of graduate student life in the Deshaies lab. Eugene Lee for everything
regarding Mass Spec. Willem den Besten for fantastic discussions and knowledge of
molecular and cellular biology. Narimon Honarpour for a sunny disposition and
great insight into future family life. Tsui-‐Fen Chou for great discussions regarding
future scientific life. Rob Oania for always being there when I needed something for
my experiments. Heenam Park and Geoff Smith for pouring fantastic gels
throughout the years. Rati Verma for her limitless knowledge of the UPS field that
she helped create. Daphne Shimoda for help with trying to decide on lunch for group
meeting and trying to schedule the relentlessly busy Ray Deshaies. Senthil

v
Radhakrishnan for comic relief and straight answers. Dane Mohl for critical critiques
of ideas on SCF mechanisms. Xin Zhang for serious science and hilarious lab manner.
Peera Jaru-‐Ampornpan for always telling me to get back to work. Sowmya
Chandrasekar, without whom I would never know what was going on. Thang
Nguyen for adventures in step aerobics and zumba. Ishu Sarogi for her deep
understanding of life’s truer meanings. Kuang Shen for spicy food and spicy science.
David Akopian for his philosophical grasp on this absurd reality. Adler Dillman for
continued friendship down the hall. Aadel Chaudhuri for always keeping it real.
Megan Dobro for several years of awesome skits at the bio retreat. Amy McMahon
for support and friendship. Alex Nisthal for being my roommate. The Woods Hole
Physiology course for fantastic summer in 2010. Beth Larimore for sending me her
unpublished construct for Fbxw7 expression.
I would like to thank the entire Caltech faculty for putting up with me and my
crazy ideas for skits at the annual bio retreat; Ellen Rothenberg and David Chan for
making teaching highly enjoyable; Paul Sternberg for being on my committee; and
Bill Dunphy for being the head of my committee, being a great teacher to work with,
and writing me a recommendation for post-‐doc fellowships.
Most importantly I would like to thank my two advisors Ray Deshaies in the
Division of Biology and Shu-‐ou Shan in the Division of Chemistry. Both are amazing
mentors and all around brilliant scientists of the highest degree in their respective
fields.
vi
Abstract
The modular design of the multi-‐subunit SCF ubiquitin ligases allows for
recognition of a diverse set of target proteins. However, the speed and complexity of
the SCF ubiquitylation reaction have precluded direct experimental tests to
understand how SCF complex formation is regulated and the pathway by which
ubiquitin chains are generated. Herein we introduce new theoretical and
experimental methodologies to address both limitations. First, a quantitative
framework based on product distribution predicts that the really interesting new
gene (RING) E3s SCFCdc4 and SCFβ-‐TrCP work with the E2 Cdc34 to build polyubiquitin
chains on substrates by sequential transfers of single ubiquitins. Measurements
with millisecond time resolution directly demonstrate that substrate
polyubiquitylation proceeds sequentially. Second, we present a novel FRET assay
that enables real-‐time measurements of binding dynamics of the SCFFbxw7 complex.
We find that the Cul1-‐associated protein CAND1 is able to actively remove
Fbxw7/Skp1 from Cul1/Rbx1 by changing the dissociation rate of the complex a
million-‐fold, yet CAND1 does not affect the assembly rate of SCFFbxw7. This activity is
abolished when Cul1 is neddylated. Experiments show that CAND1 accelerates the
rate at which multiple SCF complexes can form. Thus, CAND1 appears to function as
an exchange factor. Lastly, several measurements reveal an extra step in the
ubiquitylation pathway for yeast SCF that implies a substrate induced
conformational change exists for Fbox proteins. These results present an
unprecedented glimpse into the mechanism of RING ubiquitin ligases and their
regulation by CAND1.

vii
Contents
Chapter 1. Introduction 1
Chapter 2. Detection of Sequential Polyubiquitylation 6 on a Millisecond Timescale
Abstract 7
Introduction 8
Results 10
Discussion 21
Methods 24
Chapter 3. CAND1 Functions as an Fbox Exchange Factor 29
Abstract 30
Introduction 31
Results 34
Methods 43
Chapter 4. Unpublished Work 44
Appendices
A. Supplementary Materials for Chapter 2 59
B. Supplementary Materials for Chapter 3 78
Bibliography 80

1
Chapter 1:
Introduction

2
In the past 30 years, the degradation of proteins through the ubiquitin
proteasome system (UPS) has emerged as an essential process that governs a wide
range of biological processes. As such, mutations in many of the basic UPS
components are now understood to serve as the underlying molecular cause of
several diseases and disorders. Understanding the fundamental mechanisms of how
the UPS works gives promise for the development of future treatments.
Discovery of Ubiquitin
Results from early metabolic studies in rats revealed that protein turnover
was extensive and rapid (Schoenheimer et al., 1939). Protein degradation was
initially thought to occur exclusively in the lysosome, an intracellular compartment
with destructively low pH that at the time was known to degrade proteins after
endocytosis. However, several studies indicated that ATP was required for the
specific degradation of certain types of abnormal proteins. This indicated, although
it did not prove, that mechanisms existed outside the context of the lysosome that
were responsible for protein catabolism. The beginnings of the UPS field can be
traced back to the seminal work of Alfred Goldberg at Harvard Medical School.
Goldberg and colleagues established a cell-‐free system in rabbit reticulocyte lysate
that recapitulated the ATP-‐dependent degradation of hemoglobin upon mis-‐
incorporation of the valine analog 2-‐amino-‐3-‐chlorobutyric acid (ClAbu) (Etlinger
and Goldberg, 1977). Using this assay, the lab of Avram Hershko set out to find the
enzymes that were responsible for this activity through biochemical fractionation of
the lysate. The group discovered a small, heat-‐stable protein that was required for

3
activity (Ciechanover et al., 1978). The group of Art Haas quickly discovered that
this protein was in fact ubiquitin, an abundant eukaryotic protein with unknown
function that had been shown to become covalently linked to histone 2A (Wilkinson
et al., 1980; Goldstein et al., 1975; Goldknopf and Busch, 1977). In a now famous
paper, Hershko and Irwin Rose observed radiolabeled ubiquitin attachment to
lysozyme and proposed that ubiquitin attachment to proteins served as an
intermediate to the delivery of proteins to some unknown protease (Hershko et al.,
1980). This served as the reason for the ATP dependence on protein degradation
activity seen in the lysate.
The Ubiqutin Enzymes
In general, a sequential cascade of three enzymes carries out the transfer of
mono-‐ubiquitin to target proteins and the synthesis of polyubiquitin chains: a
ubiquitin activating enzyme (E1), a ubiquitin conjugating enzyme (E2), and a
ubiquitin ligase (E3) (Figure 1.1) (Dye et al., 2007). The E1 enzyme uses ATP to
catalyze the formation of an adenylate conjugate at the C-‐terminus of ubiquitin
(Hershko et al., 1981). This high-‐energy intermediate is hydrolyzed to directly
attach the E1 to ubiquitin through a thiolester linkage between an active site
cysteine on the E1 and the C-‐terminus of ubiquitin (Haas et al., 1982). Almost all
eukaryotic organisms have a single ubiquitin E1, with the exception of humans,
which have two (Jin et al., 2007). Most organisms have around ten E2s. E2s interact
directly with the E1 and the ubiquitin is transferred from the catalytic cysteine of
the E1 to the catalytic cysteine of the E2.

4
Figure 1.1 | The General Scheme for the UPS. Three enzymes work in succession to covalently
attach ubiquitin and ubiquitin chains to target proteins: the ubiquitin activating enzyme (E1), the
ubiquitin conjugating enzyme (E2), and the ubiquitin ligase (E3). The massive multi-‐subunit protease
the proteasome recognizes ubiquitin chains through its receptors, leading to subsequent degradation.
E3 ligases are aptly named because they interact directly with the protein to
be ubiquitylated. There are two main types of E3 ligases. HECT domain E3s accept
ubiquitin from an E2 onto a catalytic cysteine, while RING (really interesting new
gene) E3s catalyze the direct transfer of ubiquitin from an E2 to a lysine on a target
protein (Petroski and Deshaies, 2005a). Cullin-‐RING ubiquitin ligases (CRLs) are the
largest family of E3s and are typified by the SCF complexes, which in humans are
composed of four proteins: the scaffold Cul1, the RING containing Rbx1, the adaptor
Skp1, and a substrate binding protein that contains the Fbox motif (Deshaies and
Joazeiro, 2009). 69 proteins in the human genome have Fbox motifs, and 42 have
been shown to form SCF complexes (Lee et al., 2011). Although this modular design
of SCF complexes allows for recognition of a diverse set of target proteins, how SCF
complex formation is regulated remains unclear
ProteinE3
Ub
Ub
E1 E2
E1 E2
Ub
ATP+
ProteinE3
ProteinUb
UbUb
Ub
Proteasome
Ub

5
The UPS highlights several modern aspects of the understanding of proteins
in biology. First, post-‐translational modifications of proteins serve to expand and
regulate the function of a wide array of cellular processes. Second, degradation of
proteins is a mechanism of control critical for proper cellular signaling and function.
This is pronounced by the vast array of diseases that are currently linked with the
ubiquitin proteasome system.

6
Chapter 2:
Detection of Sequential
Polyubiquitylation on a Millisecond
Timescale*
*This chapter, first published in Nature in 2009, was written by Nathan W. Pierce, Gary Kleiger, Shu-‐ou Shan, and Raymond J.
Deshaies.

7
Abstract
The pathway by which ubiquitin chains are generated on substrate via a
cascade of enzymes consisting of an E1, E2, and E3 remains unclear. Multiple
distinct models involving chain assembly on E2 or substrate have been proposed.
However, the speed and complexity of the reaction have precluded direct
experimental tests to distinguish between potential pathways. Here we introduce
new theoretical and experimental methodologies to address both limitations. A
quantitative framework based on product distribution predicts that the really
interesting new gene (RING) E3s SCFCdc4 and SCFβ-‐TrCP work with the E2 Cdc34 to
build polyubiquitin chains on substrates by sequential transfers of single ubiquitins.
Measurements with millisecond time resolution directly demonstrate that substrate
polyubiquitylation proceeds sequentially. Our results present an unprecedented
glimpse into the mechanism of RING ubiquitin ligases and illuminate the
quantitative parameters that underlie the rate and pattern of ubiquitin chain
assembly.

8
Introduction
Attachment of a polyubiquitin chain with at least four ubiquitins linked
together through their lysine 48 residue (Lys48) targets proteins to the proteasome
for degradation (Thrower et al., 2000). A cascade of three enzymes carries out the
synthesis of polyubiquitin chains: a ubiquitin activating enzyme (E1), a ubiquitin
conjugating enzyme (E2), and a ubiquitin ligase (E3) (Dye et al., 2007). RING (really
interesting new gene) E3s catalyze the direct transfer of ubiquitin from an E2 to a
lysine on a target protein (Petroski and Deshaies, 2005a). SCFCdc4 is the founding
member of the largest family of E3s—the cullin-‐RING ubiquitin ligases (CRLs) that
may comprise the majority of all human ubiquitin ligases (Petroski and Deshaies,
2005a). Thus, unraveling the mechanism of SCF will have broad functional
ramifications for the preponderance of human E3s.
Different pathways for ubiquitin chain assembly by RING E3s have been
envisioned based on indirect evidence. On the one hand, Cdc34-‐SCF ubiquitylates
substrates bearing a single ubiquitin significantly faster than non-‐ubiquitylated
substrates (Saha and Deshaies, 2008; Petroski and Deshaies, 2005b), suggesting that
it processively builds polyubiquitin chains on substrates with an initial slow
transfer of ubiquitin followed by rapid elongation into a Lys48-‐linked polyubiquitin
chain. On the other hand, the E2 Ube2g2, a close relative of Cdc34, collaborates with
the E3 gp78 to build a polyubiquitin chain on its active site cysteine that can be
transferred en bloc to substrate (Ravid and Hochstrasser, 2007; Li et al., 2007).
Various permutations of the en bloc mechanism have been entertained, in which the
chain is built either from proximal to distal end or vice versa (Hochstrasser, 2006; Li

9
et al., 2009; Deshaies and Joazeiro, 2009). Due to the rapid speed of ubiquitin chain
synthesis, intermediates that would reveal the underlying pathway cannot be
kinetically resolved. Thus, it has not been possible to establish definitively the
pathway of chain assembly for any RING E3. Here we introduce new theoretical and
experimental methodologies to address both limitations.
10
Results
Quantitative analysis of product distribution
Processivity emerges from the relationships between reaction and
dissociation rates for different product intermediates (Fersht, 1999). To quantify
the processivity of SCF, we established an assay capable of simultaneously
monitoring the concentrations of substrate and its different ubiquitylated product
intermediates. Our assay consisted of an engineered phosphopeptide substrate
derived from human Cyclin E1 (CycE) and purified Saccharomyces cerevisiae Cdc34-‐
SCFCdc4 (Saha and Deshaies, 2008; Petroski and Deshaies, 2005b; Nash et al., 2001).
CycE was selected because it is a defined, chemically homogeneous substrate that
binds with high affinity to the substrate-‐binding pocket of SCFCdc4 (Nash et al., 2001;
Orlicky et al., 2003). Moreover, intact Cyclin E is a substrate of SCFCdc4 in vivo
(Strohmaier et al., 2001) and the degron from CycE can support turnover in vivo of
an engineered substrate, Sic1, from which the endogenous degrons have been
eliminated (Nash et al., 2001). To examine the simplest system that recapitulated
the processive behavior of Cdc34-‐SCFCdc4, we focused on single turnover reaction
conditions containing an excess of SCFCdc4 over radiolabeled CycE. We initiated
reactions by combining two pre-‐incubated mixtures: the ‘charged E2’ mixture
containing ubiquitin, E1, ATP, and Cdc34 was pre-‐incubated for two minutes to
ensure the formation of saturating concentrations of Cdc34~ubiquitin thioesters
(E2~Ub), and the ‘substrate-‐ligase’ mixture containing SCF and radiolabeled
substrate was pre-‐incubated to ensure the formation of an enzyme-‐substrate
complex. To maximize resolution of ubiquitin conjugates, the reaction products

11
were fractionated on long SDS-‐polyacrylamide gels. Consistent with previous assays
performed with Sic1 (Petroski and Deshaies, 2005b), conjugation of the Nedd8
homologue Rub1 to the Cdc53 subunit of budding yeast SCFCdc4 did not alter the
ubiquitylation kinetics of CycE (Supplementary Figure A.1), and thus all subsequent
SCFCdc4 assays were performed with unmodified E3.
Under these reaction conditions, CycE was extensively polyubiquitylated by
Cdc34-‐SCFCdc4 within 30 seconds (reaction 1, Figure 2.1a), and products containing ≥
6 ubiquitins were visible within 10 seconds (Supplementary Figure A.1). Thus, with
the time resolution offered by manual mixing it was not apparent whether ubiquitin
conjugates were formed by multiple sequential transfers of monoubiquitin or by en-‐
bloc transfer of pre-‐formed chains. However, we reasoned that quantitative analysis
of the length distribution of polyubiquitin chains attached to CycE during a single
encounter with SCF might provide clues to the pathway of chain assembly. To
determine the length distribution we carried out reactions with 1,000-‐fold excess
chase of the unlabeled substrate peptide added to the ‘charged E2’ mixture (reaction
2, Figure 2.1a). Under these conditions, radiolabeled substrate pre-‐bound to SCF
was rapidly ubiquitylated, but upon dissociation further ubiquitylation occurred at a
significantly reduced rate due to competition from the chase peptide. To evaluate
the effectiveness of the chase, we carried out a parallel reaction in which the chase
peptide was added to the ‘substrate-‐ligase’ mixture prior to initiation (reaction 3,
Figure 2.1a). The distribution of products in reaction 3 was subtracted from the
distribution of products in reaction 2 at each time point (Supplementary Figure A.2)
12
13
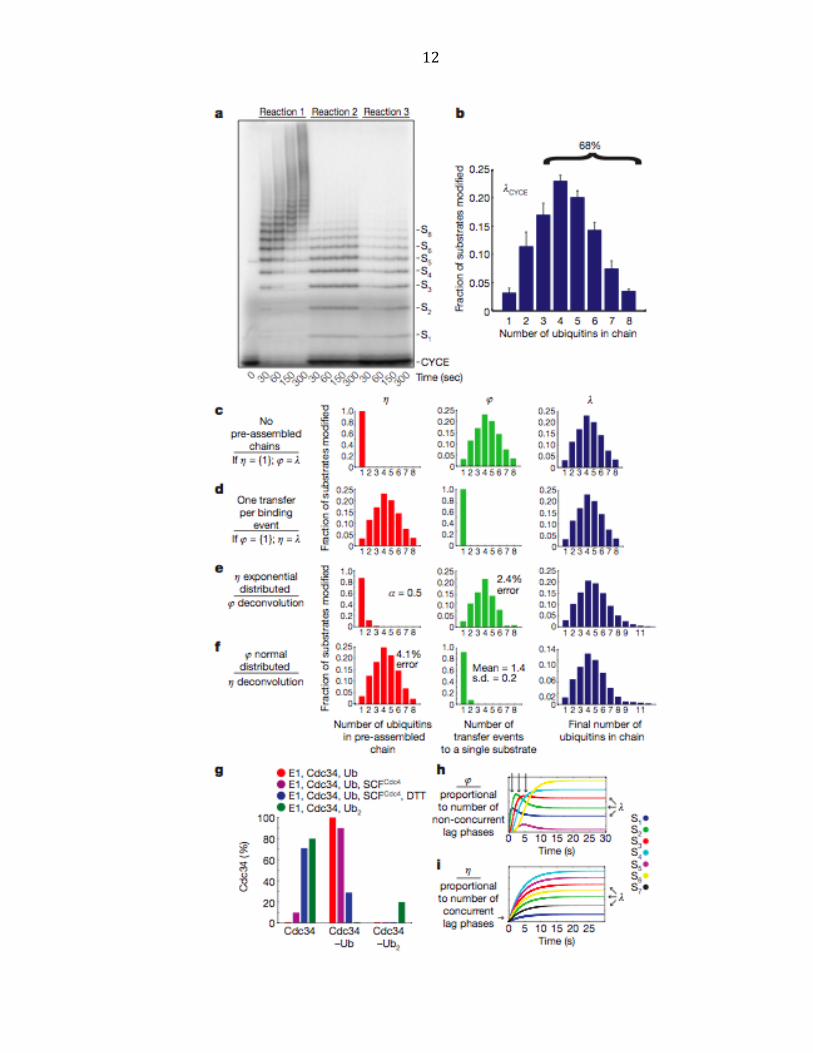
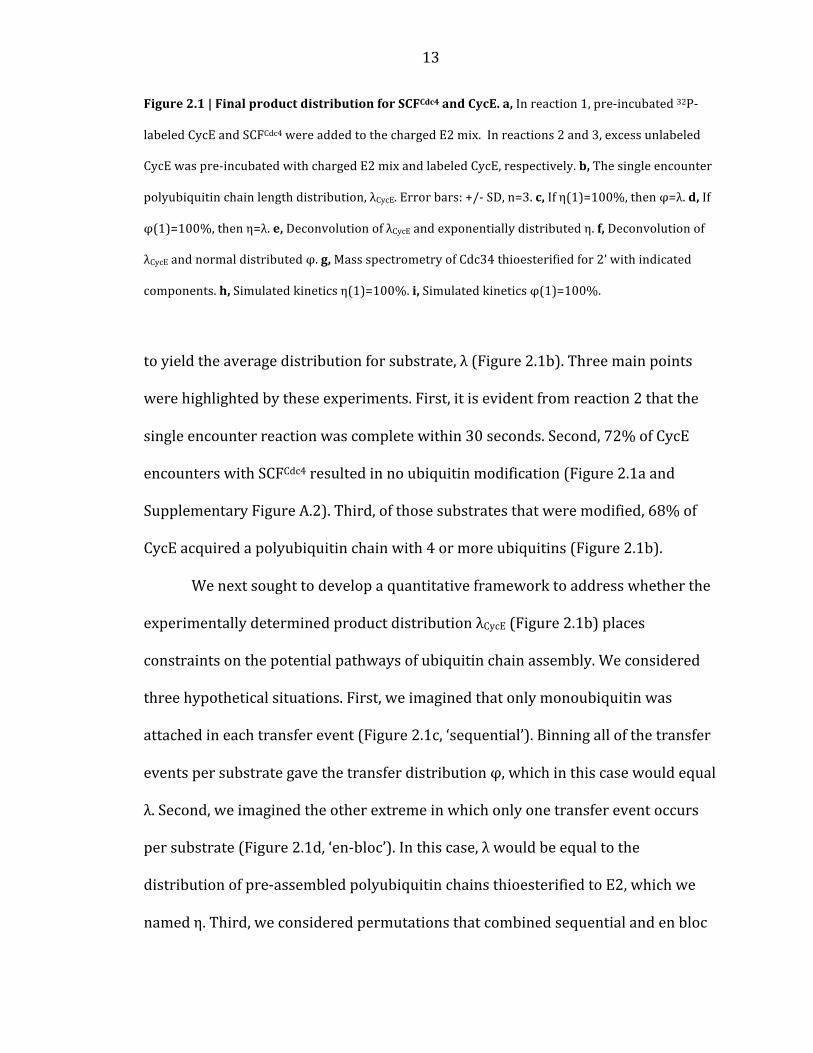
Figure 2.1 | Final product distribution for SCFCdc4 and CycE. a, In reaction 1, pre-‐incubated 32P-‐
labeled CycE and SCFCdc4 were added to the charged E2 mix. In reactions 2 and 3, excess unlabeled
CycE was pre-‐incubated with charged E2 mix and labeled CycE, respectively. b, The single encounter
polyubiquitin chain length distribution, λCycE. Error bars: +/-‐ SD, n=3. c, If η(1)=100%, then φ=λ. d, If
φ(1)=100%, then η=λ. e, Deconvolution of λCycE and exponentially distributed η. f, Deconvolution of
λCycE and normal distributed φ. g, Mass spectrometry of Cdc34 thioesterified for 2’ with indicated
components. h, Simulated kinetics η(1)=100%. i, Simulated kinetics φ(1)=100%.
to yield the average distribution for substrate, λ (Figure 2.1b). Three main points
were highlighted by these experiments. First, it is evident from reaction 2 that the
single encounter reaction was complete within 30 seconds. Second, 72% of CycE
encounters with SCFCdc4 resulted in no ubiquitin modification (Figure 2.1a and
Supplementary Figure A.2). Third, of those substrates that were modified, 68% of
CycE acquired a polyubiquitin chain with 4 or more ubiquitins (Figure 2.1b).
We next sought to develop a quantitative framework to address whether the
experimentally determined product distribution λCycE (Figure 2.1b) places
constraints on the potential pathways of ubiquitin chain assembly. We considered
three hypothetical situations. First, we imagined that only monoubiquitin was
attached in each transfer event (Figure 2.1c, ‘sequential’). Binning all of the transfer
events per substrate gave the transfer distribution φ, which in this case would equal
λ. Second, we imagined the other extreme in which only one transfer event occurs
per substrate (Figure 2.1d, ‘en-‐bloc’). In this case, λ would be equal to the
distribution of pre-‐assembled polyubiquitin chains thioesterified to E2, which we
named η. Third, we considered permutations that combined sequential and en bloc
14
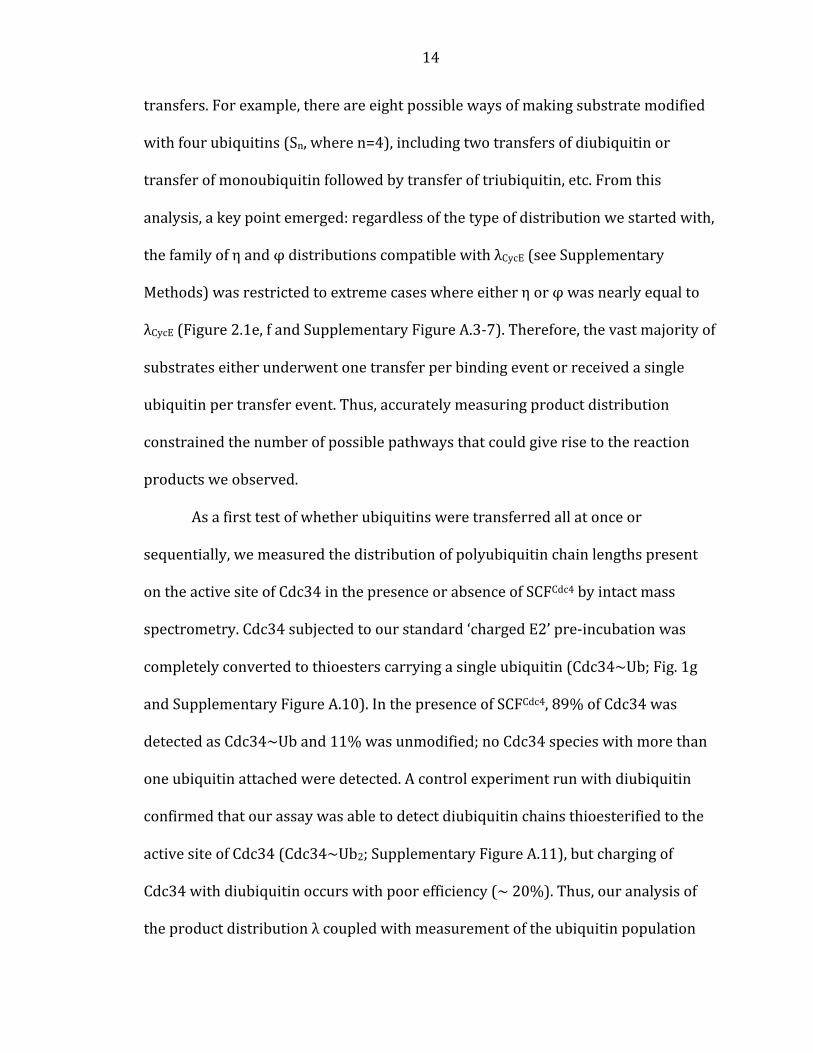
transfers. For example, there are eight possible ways of making substrate modified
with four ubiquitins (Sn, where n=4), including two transfers of diubiquitin or
transfer of monoubiquitin followed by transfer of triubiquitin, etc. From this
analysis, a key point emerged: regardless of the type of distribution we started with,
the family of η and φ distributions compatible with λCycE (see Supplementary
Methods) was restricted to extreme cases where either η or φ was nearly equal to
λCycE (Figure 2.1e, f and Supplementary Figure A.3-‐7). Therefore, the vast majority of
substrates either underwent one transfer per binding event or received a single
ubiquitin per transfer event. Thus, accurately measuring product distribution
constrained the number of possible pathways that could give rise to the reaction
products we observed.
As a first test of whether ubiquitins were transferred all at once or
sequentially, we measured the distribution of polyubiquitin chain lengths present
on the active site of Cdc34 in the presence or absence of SCFCdc4 by intact mass
spectrometry. Cdc34 subjected to our standard ‘charged E2’ pre-‐incubation was
completely converted to thioesters carrying a single ubiquitin (Cdc34~Ub; Fig. 1g
and Supplementary Figure A.10). In the presence of SCFCdc4, 89% of Cdc34 was
detected as Cdc34~Ub and 11% was unmodified; no Cdc34 species with more than
one ubiquitin attached were detected. A control experiment run with diubiquitin
confirmed that our assay was able to detect diubiquitin chains thioesterified to the
active site of Cdc34 (Cdc34~Ub2; Supplementary Figure A.11), but charging of
Cdc34 with diubiquitin occurs with poor efficiency (~ 20%). Thus, our analysis of
the product distribution λ coupled with measurement of the ubiquitin population

15
thioesterified to Cdc34 under our reaction conditions (an estimate of η) strongly
predicts that Cdc34–SCFCdc4 assembles ubiquitin chains on substrate primarily by
sequential transfers of single ubiquitin molecules.
Millisecond kinetics of SCF
As a second, more definitive test of the hypothesis stated above, we sought to
measure directly how the product distribution (Figure 2.1b) developed as a function
of time. During a single encounter between a RING ubiquitin ligase and substrate,
each intermediate should either undergo a transfer event or dissociate. If
monoubiquitin is composed 100% of η as in Figure 2.1c, the products of the reaction
should appear sequentially in time starting with S1 and followed by S2, then S3, etc.
Thus, the appearance of each sequential product should be delayed by a ‘lag’ phase
(Figure 2.1h). In contrast, if a single transfer composed 100% of φ as in Fig. 1d, then
the pattern of ubiquitin chains attached to substrate at the earliest time-‐points
should reveal the distribution of pre-‐assembled chains thioesterified to Cdc34 (Fig.
1i). Thus, products of increasing mass should accumulate sequentially if chain
synthesis is sequential, but should accumulate contemporaneously if chains are
transferred en bloc. Therefore, with sufficient time resolution a single encounter
experiment would provide definitive data to distinguish between the alternative
models. To achieve the necessary time resolution, we performed our single
encounter reactions on a quench flow apparatus that allowed us to take
measurements on a time scale ranging from 10 milliseconds to 30 seconds (Figure
2.2a). To facilitate quantification of S2 and S5 in the CycE reaction, the same reaction

16
from Figure 2.2a was fractionated on a gel with different resolving capabilities
(Supplementary Figure A.12). Three major conclusions arose from these
experiments. First, the product CycE–Ub (S1) was formed starting at the earliest
Figure 2.2 | Millisecond kinetics of a single encounter reaction reveal sequential processivity.
a, To achieve millisecond temporal resolution CycE reactions were performed on a quench flow
apparatus and products were evaluated by SDS-‐PAGE and phosphorimaging. The reaction scheme
matched reaction 2 of Figure 2.1a. The asterisk marks a contaminant. Sn refers to CycE modified with
n ubiquitins. b, Quantification shows successively longer lag phases for each additional ubiquitin
added in the chain. The data was fit using closed form solutions refined by global regression analysis
to a model with η=1. The error bars represent the range of values, n=2.

17
time points (10-‐20 milliseconds) without a lag phase, indicating that E2~Ub binding
to SCF was rapid. This is consistent with stopped-‐flow measurements carried out
with SCFb-‐TrCP and hCdc34 (Kleiger et al., 2009). Second, each new ubiquitylated
product appeared sequentially with non-‐concurrent lag phases (Figure 2.2a, b and
Supplementary Figure A.12). Third, the early reaction products S1-‐S3 ‘overshot’ their
final levels, indicating that these reaction intermediates serve as templates for the
formation of subsequent products, supporting the model that polyubiquitin chains
are built from multiple transfer events (Supplementary Figure A.16). Combined with
the constraints on η and φ calculated above as well as our direct evaluation of the
Cdc34~Ub pool (Figure 2.1g), these data demonstrate that the underlying kinetic
mechanism of our system was principally derived from sequential transfers of single
ubiquitins.
To ensure that our conclusions were not an artifact of the reaction design, we
changed the order of addition in our reactions. SCFCdc4 was pre-‐incubated with the
‘charged E2’ mixture for 2 minutes (in which case 89% of Cdc34 is present in
thioesterified form; Figure 2.1g) and reactions were initiated by combining with
radiolabeled CycE. Products appeared following non-‐concurrent lag phases of
increasing duration (Figure 2.2c), analogous to that observed when the reaction was
initiated by addition of Cdc34~Ub to CycE prebound to SCFCdc4 (Figure 2.2a). Thus,
regardless of whether CycE first encountered Cdc34~Ub–SCF or Cdc34~Ub
encountered CycE–SCF, single ubiquitins were transferred to substrate in a
sequential manner. Interestingly, reactions initiated by addition of CycE were

18
delayed compared with those initiated by addition of Cdc34~Ub, indicating that
Cdc34~Ub productively associates with SCFCdc4 faster than does CycE.
SCFβ-‐TrCP is sequentially processive
We next sought to test whether the sequential processive chain assembly we
observed for SCFCdc4 is unique or illuminates a general principle of SCF ubiquitin
ligase mechanism. To address this issue, we evaluated ubiquitylation of a
phosphopeptide derived from β-‐Catenin (β-‐Cat) by its cognate E2-‐E3 complex,
hCdc34 and human SCFb-‐TrCP. Nedd8 conjugated E3 (N8-‐SCFβ-‐TrCP) was used for these
experiments, because prior work demonstrated a potent stimulation of β-‐Cat
ubiquitylation upon Nedd8 conjugation (Saha and Deshaies, 2009). As was seen
with CycE–SCFCdc4, β-‐Cat was rapidly modified by N8-‐SCFβ-‐TrCP and it was not
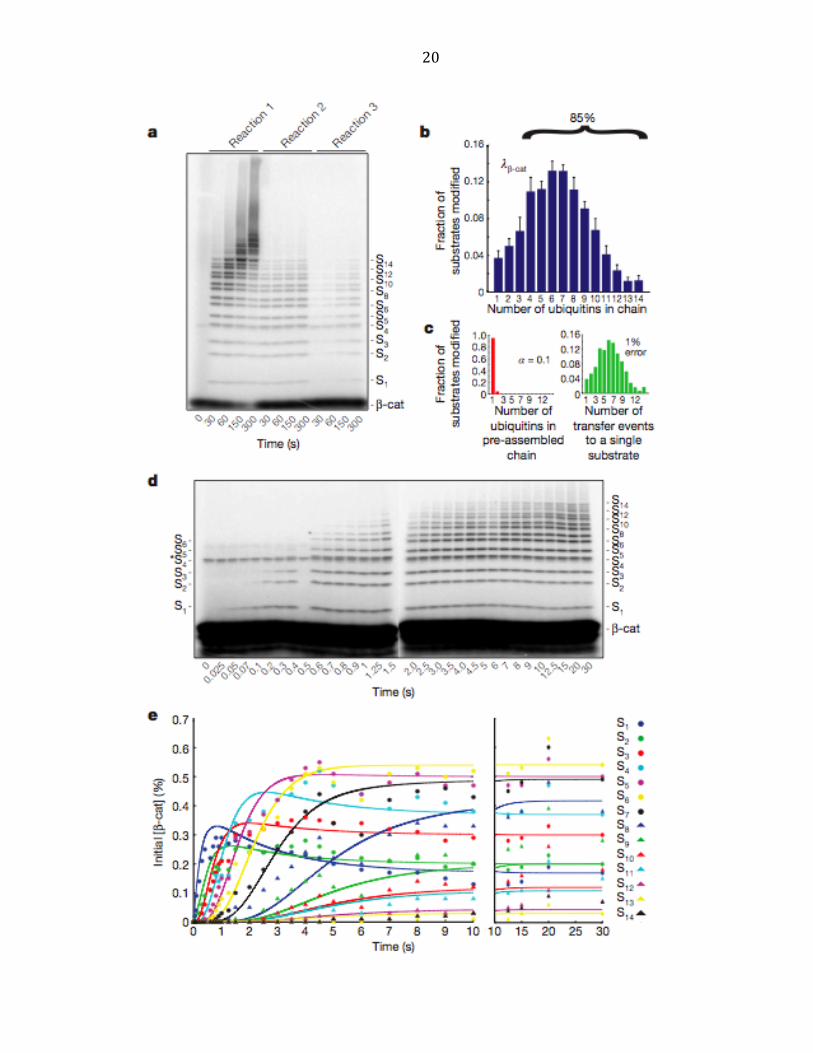
possible to resolve intermediates in chain assembly by manual mixing4 (Figure 2.3a).
Quantification of product distribution λβ-‐Cat revealed that 6% of β-‐Cat molecules
were modified in a single encounter with N8-‐SCFβ-‐TrCP, of which 85% received ≥ 4
ubiquitins (Figure 2.3b and Supplementary Figure A.2). Distribution analysis of λβ-‐Cat
(Figure 2.3c) and kinetic resolution of β-‐Cat ubiquitylation by quench-‐flow (Figure
2.3d, e) revealed sequential appearance of intermediates analogous to those
observed with CycE ubiquitylation by SCFCdc4.
Although the general behavior of SCFCdc4 and N8-‐SCFβ-‐TrCP were similar, the
enzymes differed in the extent to which they converted bound substrate to product
and elongated ubiquitin chains. Using a kinetic model in which monoubiquitin
composed 100% of η, we were able to employ methods borrowed from the study of
19
nucleic acid polymerases (Kati et al., 1992) to extrapolate estimates for the
individual reaction and dissociation rate constants from our single encounter
quench-‐flow experiments (Figure 2.4, Supplementary Figure A.13-‐15).
20
21
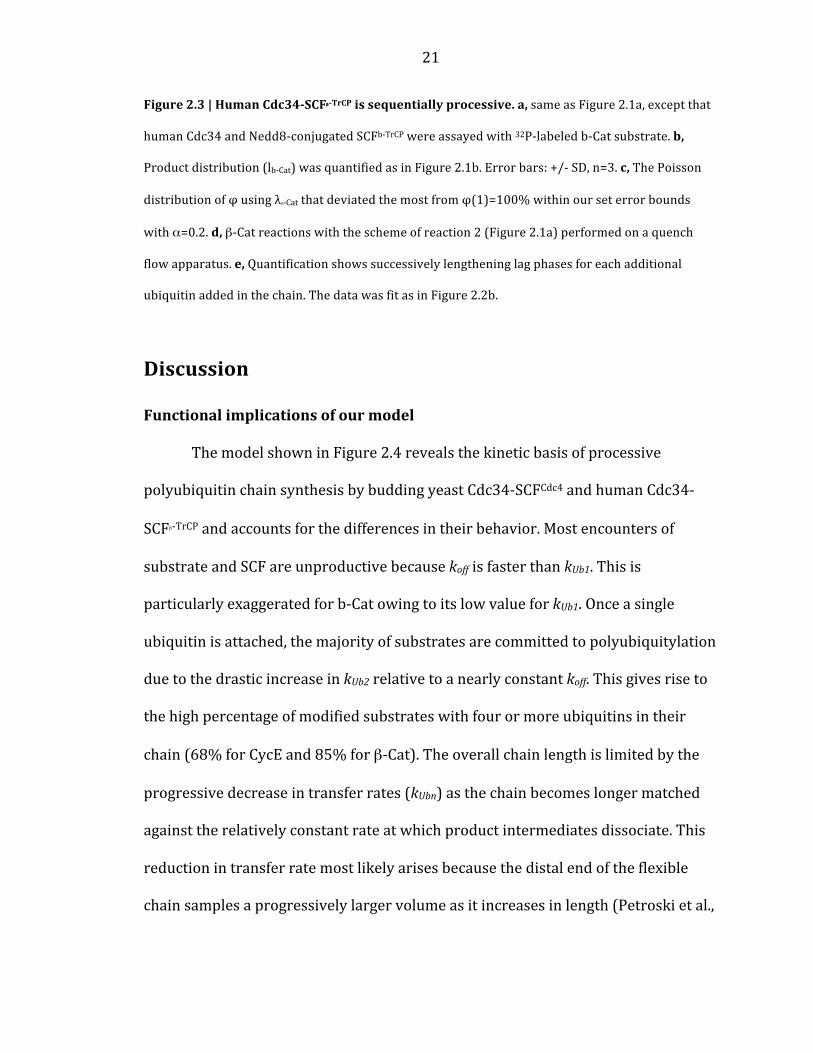
Figure 2.3 | Human Cdc34-‐SCFβ-‐TrCP is sequentially processive. a, same as Figure 2.1a, except that
human Cdc34 and Nedd8-‐conjugated SCFb-‐TrCP were assayed with 32P-‐labeled b-‐Cat substrate. b,
Product distribution (lb-‐Cat) was quantified as in Figure 2.1b. Error bars: +/-‐ SD, n=3. c, The Poisson
distribution of φ using λβ-‐Cat that deviated the most from φ(1)=100% within our set error bounds
with α=0.2. d, β-‐Cat reactions with the scheme of reaction 2 (Figure 2.1a) performed on a quench
flow apparatus. e, Quantification shows successively lengthening lag phases for each additional
ubiquitin added in the chain. The data was fit as in Figure 2.2b.
Discussion
Functional implications of our model
The model shown in Figure 2.4 reveals the kinetic basis of processive
polyubiquitin chain synthesis by budding yeast Cdc34-‐SCFCdc4 and human Cdc34-‐
SCFβ-‐TrCP and accounts for the differences in their behavior. Most encounters of
substrate and SCF are unproductive because koff is faster than kUb1. This is
particularly exaggerated for b-‐Cat owing to its low value for kUb1. Once a single
ubiquitin is attached, the majority of substrates are committed to polyubiquitylation
due to the drastic increase in kUb2 relative to a nearly constant koff. This gives rise to
the high percentage of modified substrates with four or more ubiquitins in their
chain (68% for CycE and 85% for β-‐Cat). The overall chain length is limited by the
progressive decrease in transfer rates (kUbn) as the chain becomes longer matched
against the relatively constant rate at which product intermediates dissociate. This
reduction in transfer rate most likely arises because the distal end of the flexible
chain samples a progressively larger volume as it increases in length (Petroski et al.,
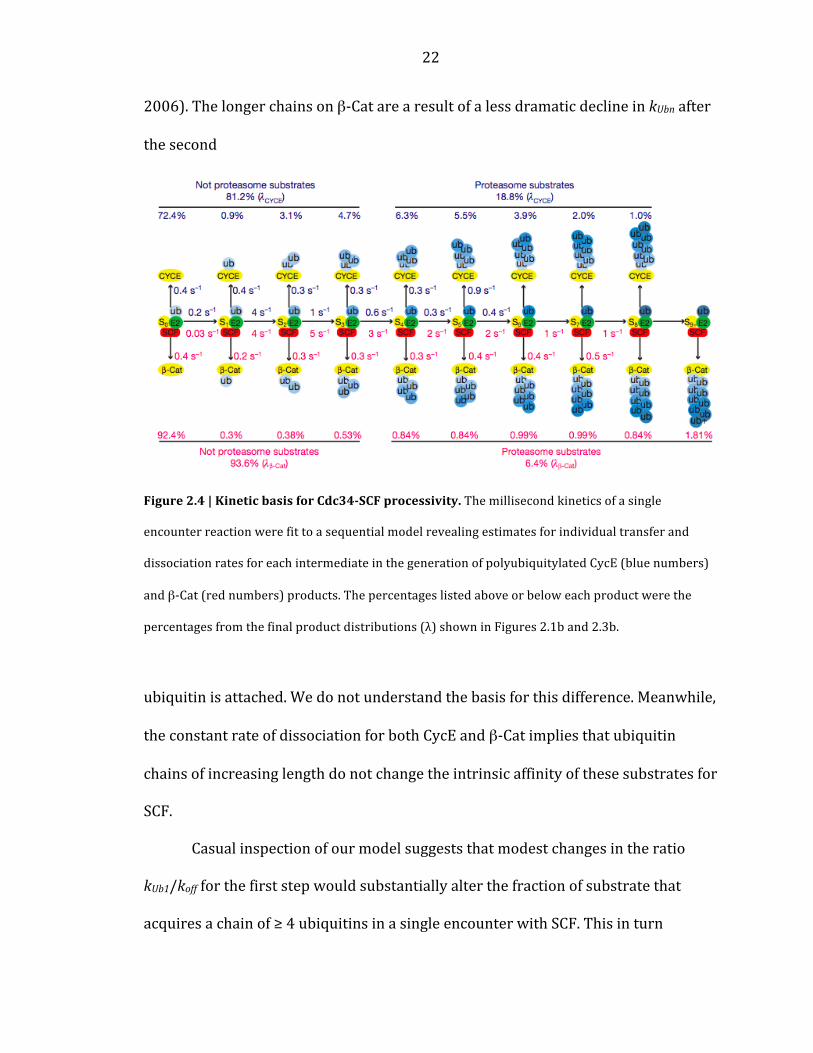
22
2006). The longer chains on β-‐Cat are a result of a less dramatic decline in kUbn after
the second
Figure 2.4 | Kinetic basis for Cdc34-‐SCF processivity. The millisecond kinetics of a single
encounter reaction were fit to a sequential model revealing estimates for individual transfer and
dissociation rates for each intermediate in the generation of polyubiquitylated CycE (blue numbers)
and β-‐Cat (red numbers) products. The percentages listed above or below each product were the
percentages from the final product distributions (λ) shown in Figures 2.1b and 2.3b.
ubiquitin is attached. We do not understand the basis for this difference. Meanwhile,
the constant rate of dissociation for both CycE and β-‐Cat implies that ubiquitin
chains of increasing length do not change the intrinsic affinity of these substrates for
SCF.
Casual inspection of our model suggests that modest changes in the ratio
kUb1/koff for the first step would substantially alter the fraction of substrate that
acquires a chain of ≥ 4 ubiquitins in a single encounter with SCF. This in turn
23
provides a simple basis for SCF to modulate a substrate’s degradation half-‐life (i.e.,
the larger koff is or smaller kUb1 is, the lower the probability that a substrate is
modified in a single encounter with SCF, which would translate to a longer half-‐life).
Comparison of CycE and b-‐Cat, which have distinct kUb1/koff ratios, underscores how
the efficiency and pattern of substrate ubiquitylation can be tuned by these
parameters. Despite these differences, it is remarkable how similar the reaction
parameters are for two different enzymes from organisms separated by over 1
billion years of evolution. In both cases koff was ~ 0.4 sec-‐1 and the fastest rate of
ubiquitin chain elongation was 4-‐5 sec-‐1. This suggests that true substrates are
tuned to dissociate within a few seconds and that a transfer rate of 5 sec-‐1 may be
imposed by a conserved rate-‐limiting step. It will be of great interest to determine
what molecular event enforces this speed limit.
We conclude that polyubiquitin chains are built on SCF substrates by
sequential transfers of single ubiquitins. We establish a mechanistic framework that
can be applied to other CRLs and RING ubiquitin ligases to obtain individual rate
constants for substrate dissociation and ubiquitin transfer at each step in the
process of chain assembly. Our model indicates that the processivity, efficiency, and
pattern of ubiquitylation is governed by the sharp discontinuity in rates between
the first transfer and subsequent transfers, contrasted with the shared dissociation
rate among substrate and product intermediates.

24
Methods
Methods summary
Proteins
CycE and β-‐Cat phosphopeptide were purchased from New England Peptide.
Ubiquitin and K48 diubiquitin were purchased from Boston Biochem. Uba1 and
SCFCdc4 were prepared and purified as described (Petroski and Deshaies, 2005b).
Full-‐length yeast Cdc34 was purified as described (Feldman et al., 1997). His7-‐Rub1
was purified from E. coli inclusion bodies (Saha and Deshaies, 2008) and human E1,
UbcH3B (hCdc34), and Nedd8-‐SCFβ-‐TrCP were prepared and purified as described
(Saha and Deshaies, 2008). Yeast Ubc12 and Ula1–Uba3 were purified as described
(Kamura et al., 1999). Rub1, Ubc12, Ula1–Uba3, and ATP were incubated with
immobilized SCFCdc4 to make Rub1-‐conjugated SCFCdc4. PKA was purchased from
New England Biolabs.
Ubiquitylation assay
CycE (200 nM) or β-‐Cat (2 µM) was incubated with g-‐[32P]-‐ATP (132 nM) and
PKA for 45 minutes at 30°C to make radiolabeled CycE or β-‐Cat. Yeast ubiquitylation
reactions contained ATP (2 mM), ubiquitin (60 µM), Uba1 (0.8 µM), Cdc34 (10 µM),
SCFCdc4 (150 nM), and radiolabeled CycE (10 nM). Human ubiquitylation reactions
contained ATP (2 mM), ubiquitin (60 µM), E1 (1 µM), Cdc34 (10 µM), SCFβ-‐TrCP (500
nM), and radiolabeled β-‐Cat (100 nM). As indicated, single encounter reactions
contained an unlabeled CycE chase (10 µM) or β-‐Cat chase (100 µM). Millisecond
reactions were performed on a quench flow apparatus (Kintek RQF-‐3 Rapid Quench

25
Flow). Reactions contained a buffer previously described (Petroski and Dehsaies,
2005c) at 23°C. Reactions were quenched with SDS-‐PAGE buffer with βME and run
on 20 cm 5-‐20% tricine gels (CycE) or Glycine gels (β-‐Cat) that were quantified with
a phosphor screen (Molecular Devices). Thioester formation assays contained Cdc34
(10 µM), Uba1 (1 µM), ATP (2 mM), ubiquitin or K48 diubiquitin (15 µM), and
SCFCdc4 (100 nM), as indicated. After 2 minutes, reactions were stopped with excess
5% acetic acid and analyzed on an Agilent LC-‐MSD.
Analysis
Deconvolutions and regression were performed in Matlab. Global fitting was
performed with KinTek Global Kinetic Explorer. Mass spec data was processed using
the Chemstation software package.
Full Methods
RDB 2289 with pGEX2-‐T His7-‐Rub1 was made by cloning a His7 tag in place
of the GST tag in RDB 1436. To make Rub1-‐conjugated SCFCdc4, the procedure for
isolating SCFCdc4 was modified (Petroski and Deshaies, 2005c). Instead of eluting
SCFCdc4 from Py conjugated protein A beads after washing, 50 µM Rub1, 10 µM
Ubc12, 1 µM Ula1–Uba3, and 2 mM ATP were incubated together overnight. The
beads were washed before elution.
For all reactions, gels were dried and exposed to Phosphor screens
(Molecular Dynamics). Images were scanned and then quantified in ImageQuant
using a rolling ball background subtraction. For each lane, every band was
quantified as a percent of the total signal in all bands.
26
The relationship between η, φ, and λ was mathematically analogous to the
probability of the sum of multiple dice throws. However, the probability of throwing
each number on the dice was a weighted normalized distribution (analogous to η)
and the number of throws was also a weighted normalized distribution (analogous
to φ). A distribution that is normalized sums to 1. Thus, λ equaled the weighted sum
of multiple discrete convolutions of η with itself as governed by φ, as shown by
example in Supplementary Figure A.3. Knowledge of λ and η allowed us to calculate
φ by multiple weighted deconvolutions, as shown by example in Supplementary
Figure A.4. This was true for calculating η from λ and φ, as shown by example in
Supplementary Figure A.5a. If we assigned a distribution to η, we determined φ by
deconvolutions with λ, and vice versa. Considering normalized distributions of η
that only contain η(1) and η(2), exponential distributions, poisson distributions, and
normal distributions, we varied parameters over a wide range and performed
deconvolutions, as shown by example in Supplementary Figure A.5b. An exponential
distribution is described by a single parameter, here called α. A poisson distribution
is also described by a single parameter, here called α. The normal distribution is
described by two parameters, the mean and the standard deviation (SD).
Parameters were varied starting at 0 and increasing by step sizes of 0.1 until
parameters equaled 10. For the normal distribution, each value of the mean was
held constant while the SD was varied. We sought the distribution which deviated
most from η(1)=100% whose φ did not contain values > 1 or < 0, and that when
convoluted with φ, the sum of λ fell within 0.95 and 1.05, or an error rate of ± 5%
was found. This was repeated for φ. These distributions are shown in

27
Supplementary Figures A.6 and A.7. Random distributions were also considered
(data not shown).
For mass spectrometry analysis, Uba1 (1 μM), Cdc34-‐Δ270 (10 μM), and
ubiquitin or K48 linked di-‐ubiquitin (15 μM, Boston Biochem) were incubated for 2
minutes in reaction buffer (30 mM Tris, pH 7.5, 100 mM NaCl, 5 mM MgCl2, 2 mM
DTT, and 2 mM ATP) in a volume of 10 µl, both in the presence and absence of SCF
(100 nM). Reactions were quenched by the addition of 90 µl 5 % acetic acid.
Quenching was verified by an order of addition reaction where E1 was left out of the
initial incubation and was added following quenching. This resulted in 100%
quenching of the thioester charging reaction. Separation of E2 thioesters in the
presence of SCF was accomplished by the addition of 100 mM DTT after the 2
minute incubation period. The DTT was incubated with the reaction mixture for 5
minutes, followed by the addition of 90 µl of 5 % acetic acid. Detection of proteins
was carried out on an Agilent LC-‐MSD (Agilent, Palo Alto, CA). Mass spectra were
acquired in positive-‐ion mode, scanning from 500 to 1700 m/z. The electrospray
voltage was set to 4 kV and the gas temperature in the spray chamber was
maintained at 350°C. A stationary phase, Zorbax 300SB C3 150×2.1-‐mm column
was used for separation (Agilent; Bodman, Aston, PA). Mobile phase A was 0.2%
formic acid and mobile phase B was 0.2% formic acid, 10% methanol, and 90%
acetonitrile. The flow rate was 0.200 ml/min. After a 25 min delay, the effluent was
directed into the mass spectrometer. Linear gradients started with 5% mobile
phase B and finished at 95% from 25 – 50 min. Data were processed using the
chemstation software package. The sequence of yeast Cdc34-‐Δ270 contains the

28
amino acids from positions 1 to 270 of the yeast Cdc34 sequence followed by the
sequence ARPLHHHHHH, yielding a theoretical molecular mass of 32,245 Daltons.
The theoretical mass of Cdc34-‐Δ270 thioesterified with ubiquitin (40,792) was
calculated by summing the masses of Cdc34-‐Δ270 (32,245) and ubiquitin (8,565)
and subtracting the mass of a water molecule, which is lost during formation of the
thioester bond.
For CycE global fitting with KinTek Global Kinetic Explorer, the average of
two independent experiments was fit to a model with η=1, and the fit for k1 through
k4 used the normalized option, while the rest of the rate constants did not. For β-‐Cat
global fitting, rate constants were fit without normalization. To improve fitting,
neighboring rate constants were constrained by the end point.

29
Chapter 3:
CAND1 Functions as an Fbox
Exchange Factor

30
Abstract
The modular design of the multi-‐subunit SCF ubiquitin ligases allows for
recognition of a diverse set of target proteins. However, how SCF complex formation
is regulated remains unclear. Cullin-‐associated and neddylation-‐dissociated protein
1 (CAND1) is a Cul1-‐associated protein that has been reported to inhibit SCF
complex formation. Nonetheless, the function of CAND1 remains elusive given the
lack of a mechanistic framework for each of its reported activities. Here we present
a novel FRET assay that enables real-‐time measurements of binding dynamics of the
SCFFbxw7 complex. We find that CAND1 is able to actively remove Fbxw7/Skp1 from
Cul1/Rbx1 by changing the dissociation rate of the complex a million-‐fold, yet
CAND1 does not affect the assembly rate of SCF Fbxw7. This activity is abolished when
Cul1 is neddylated. Experiments show that CAND1 accelerates the rate at which
multiple SCF complexes can form. Thus, CAND1 appears to function as an exchange
factor. Our results serve as a basis to resolve the function of CAND1 in vivo.

31
Introduction
Three enzymes work in succession to covalently attach ubiquitin and
ubiquitin chains to target proteins: a ubiquitin activating enzyme (E1), a ubiquitin
conjugating enzyme (E2), and a ubiquitin ligase (E3) (Dye and Schulman, 2007).
The proteasome, a massive multi-‐subunit protease, recognizes and degrades
proteins attached with lysine 48 linked polyubiquitin chains containing at least four
ubiquitins (Thrower et al., 2000). Cullin-‐RING ubiquitin ligases (CRLs) are the
largest family of E3s and are typified by the SCF complexes, which in humans are
composed of four proteins: the scaffold Cul1, the RING containing Rbx1, the adaptor
Skp1, and a substrate binding protein that contains the Fbox motif (Petroski and
Deshaies, 2005a). 69 proteins in the human genome have Fbox motifs, and 42 have
been shown to form SCF complexes (Lee et al., 2011). Although this modular design
of SCF complexes allows for recognition of a diverse set of target proteins, how SCF
complex formation is regulated remains unclear.
Cullin-‐associated and neddylation-‐dissociated protein 1 (CAND1) was
originally isolated as a Cul1 associated protein whose binding was mutually
exclusive with the Fbox/Skp1 sub-‐complex (Liu et al., 2002; Zheng et al., 2002).
CAND1’s dissociation from Cul1/Rbx1 was coupled to the attachment of the
ubiquitin-‐like protein Nedd8 to lysine 720 of Cul1 (Liu et al., 2002; Zheng et al.,
2002). Neddylation of Cul1 activates SCF complexes by inducing a major
conformational rearrangement in Cul1 and stimulates ubiquitin transfer from
associated E2s to Fbox-‐bound target substrates (Saha and Deshaies, 2008; Duda et

32
al., 2008). In vitro, CAND1 acts as an inhibitor of CRL ubiquitylation and neddylation
(Liu et al., 2002; Zheng et al., 2002; Siergiejuk et al., 2009). For these reasons,
CAND1 was recognized as a negative regulator of SCF complex assembly. However,
genetic evidence indicates that CAND1 acts as a positive regulator of CRL function in
vivo. First, knock down of CAND1 by siRNA stimulates assembly of Cul3Keap1 but
reduces its ability to target Nrf2 for degradation (Lo, Hannink 2006). Second, siRNA
against CAND1 stabilizes the SCFSkp2 substrate p27 (Zheng et al., 2002). Lastly,
mutations in CAND1 in plants disrupt auxin and gibberellin signaling through
stabilization of the SCFTir1 substrate IAA7 and the SCFSLY1 substrate RGA,
respectively (Chuang et al., 2004; Feng et al., 2004). These observations gave rise to
the idea that CAND1-‐mediated CRL adaptor recycling was crucial for proper CRL
function (Liu et al., 2002; Cope and Deshaies 2003; Schmidt et al., 2009; Zhang et al.,
2008). Furthermore, the role of CAND1 was envisioned to be coupled to cycles of
neddylation and de-‐neddylation in which CAND1 sequesters a substantial fraction of
naked Cul1/Rbx1 devoid of Fbox/Skp1 and Nedd8 (Deshaies and Cope, 2003).
However, a recent analysis of the CRL network in vivo found that in the absence of
neddylation CAND1 does not sequester Cul1/Rbx1 away from Fbox/Skp1 complexes
(Bennett et al., 2010).
In order to reconcile the above observations, we have constructed the first
kinetic framework for the assembly of a CRL complex in vitro using a novel FRET
assay that enables real-‐time measurements of SCFFbxw7 binding dynamics. CAND1’s
perturbations of these dynamics reveal that CAND1 acts as a Nedd8-‐dependent Fbox
exchange factor. Armed with this knowledge, we establish a biochemical assay

33
involving multiple Fboxes that reconstitutes the activator function of CAND1 in vitro
with pure components. Our biochemical results show for the first time that CAND1
is sufficient for CRL adaptor cycling in vitro and that this activity leads directly to
CAND1-‐mediated stimulation of CRL ubiquitin ligase activity. Further, CAND1’s
exchange factor activity represents a novel form of regulation for protein-‐protein
interactions that thus far has only been seen for protein-‐small-‐molecule interactions,
such as the GEFs.

34
Results
Intrinsic assembly properties of SCFFbxw7
To characterize the assembly properties of SCF complexes, we developed a
real-‐time assay based on FRET that monitors the binding dynamics between the
sub-‐complexes of Fbox/Skp1 and Cul1/Rbx1. The C-‐terminus of the Fbox protein
Fbxw7 was fused to the peptide sequence LPETGG and co-‐expressed recombinantly
with Skp1. After purification, we reacted the complex with the trans-‐peptidase
enzyme Sortase in the presence of the peptide GGGGK-‐TAMRA, producing Fbxw7
covalently labeled with TAMRA (Popp et al., 2009). The trans-‐peptidation reaction
was efficient and did not compromise ubiquitylation activity (Supplementary Figure
B.1a). We observed FRET between Fbxw7-‐TAMRA/Skp1 and Cul1 fused N
terminally to cyan fluorescent protein (CFP) co-‐expressed with Rbx1 (Figure 3.1a).
The rate of complex assembly was determined by monitoring the changes of donor
Cul1 NTD CFP/Rbx1 fluorescence when mixed with varying concentrations of
Fbxw7 TAMRA/Skp1 in a stop flow apparatus. The change in signal was fit to single
exponential curves (Figure 3.1b). The change in the observed rate of the reaction as
a function of acceptor concentration revealed a fast binding rate of 4 x 10⁶ M-‐1 s-‐1
(Figure 3.1c). The FRET observed in our assay could be chased away by excess non-‐
fluorescent Fbox/Skp1 (Figure 3.1d). Using this chase assay, we measured a
dissociation rate for SCFFbxw7 of 9 x 10-‐7 s-‐1 or 0.5 week-‐1 (Figure 3.1e). These
measurements revealed an extraordinarily tight complex with a Kd of 2 x 10-‐13 M
(200 fM). Neddylation of Cul1 did not affect the FRET efficiency in our assay, the
association rate, nor the dissociation rate of SCF complex assembly (Figure 3.1c &

35
Supplemental Figure B.1b-‐d). To extend our finding to other SCF complexes we
attempted to make FRET assays using a similar strategy for Skp2 and β-‐TrCP, but
were unsuccessful (data not shown). In lieu of direct binding data, we designed an
assay that used Fbxw7-‐TAMRA/Skp1 as the chase and monitored gain of FRET
(Supplemental Figure B.1e). An upper limit of 5 x 10-‐5 s-‐1 for the dissociation rate
was found for SCFβ-‐TrCP (Fig. 1f).
Figure 3.1 | FRET Reveals Properties of SCF Assembly. a, Fluorescence emission spectra from
excitation at 430 nm of 70 nM Cul1 NTD CFP/Rbx1, 70 nM Fbxw7-‐TAMRA/Skp1, a mixture of the two,
or buffer alone reveals FRET with 30% efficiency upon complex formation. Normalized to peak donor
emission at 478 nm. b, The change in donor fluorescence versus time in a stop flow apparatus with 5
nM Cul1 NTD CFP/Rbx1 and varying concentrations of Fbxw7 TAMRA/Skp1. Signal changes were fit
to single exponential curves. c, The rate of signal change in b versus the concentration of Fbxw7
TAMRA/Skp1. Fitting the data to (kobs = kon*[Fbxw7] + koff) gave kon of 4 x 10⁶ M-‐1 s-‐1 regardless of
Cul1’s neddylation status. Error bars: +/-‐ SD, n≥3. d, 700 nM Skp2/Skp1 (chase) competes FRET
away if pre-‐incubated with 70 nM Fbxw7 TAMRA/Skp1 before, but not after addition of 70 nM Cul1

36
NTD CFP for 5 min. e, Fluorescence emission at 478 nm versus time after addition of chase to pre-‐
incubated Cul1 NTD CFP/Rbx1 and Fbxw7 TAMRA/Skp1 normalized to peak donor emission in d.
Single exponential fit with a fixed end point of 1 gave koff of 8.5 x 10-‐7 s-‐7. Kd is thus 2 x 10-‐13 M. Error
bars: +/-‐ SD, n=3. f, Fluorescence emission at 478 nm versus time after addition of 210 nM Fbxw7
TAMRA/Skp1 to 70 nM Cul1 NTD CFP pre-‐incubated with 70 nM β-‐TrCP. A single exponential fit gave
koff of 5 x 10-‐5 s-‐1. Error bars: range of values, n=2.
CAND1 increases off rate of Fbxw7/Skp1
It has been reported that Fbox/Skp1 and CAND1 antagonize each other’s
binding to Cul1/Rbx1 (Goldenberg et al., 2004; Siergiejuk et al., 2009). Despite
several attempts, we failed to create a fluorescent assay that measured the binding
of CAND1 to Cul1/Rbx1 (data not shown). Thus, to measure directly CAND1’s affect
on SCF assembly, we added two-‐fold excess CAND1 to a preformed SCFFbxw7 complex
displaying FRET. We observed a significantly reduced amount of FRET after five
minutes, indicating that CAND1 interferes with Fbxw7/Skp1 binding to Cul1/Rbx1
(Figure 3.2a). To ensure that this observation was not an artifact of our FRET assay,
we repeated this measurement but included a chase of unlabeled Fbox/Skp1 when
we added CAND1. The FRET signal was further reduced to no FRET in the same five
minute time span. Importantly, when we repeated these experiments with
neddylated Cul1, CAND1’s effect was eliminated (Figure 3.2b).
These observations are surprising for several reasons. First, the short time
span used here is in direct contrast to the slow off rate observed in Figure 3.1e
indicating that CAND1 is not acting as a competitive inhibitor that must wait for
Fbxw7/Skp1 to dissociate. Second, this implies that CAND1 is an allosteric regulator

37
of SCF complexes that actively remodels them in the absence of any energy input
such as ATP. Third, given that CAND1 has two major binding sites on the N-‐terminus
(NTD) and the C-‐terminus (CTD) of Cul1, these results suggest that disruption of
CAND1’s CTD binding site by the Nedd8-‐induced conformational change
dramatically affects its ability to regulate Fbxw7/Skp1 binding at Cul1’s NTD
(Goldenberg et al., 2004; Duda et al., 2008). This is especially intriguing given that
the NTD of Cul1 when bound to CAND1 or Fbox/Skp1 is nearly structurally identical.
To determine the mechanistic basis of CAND1’s ability to remodel SCF
complexes we measured the loss of FRET in real time upon addition of CAND1 to a
preformed complex in a stop flow apparatus (Figure 3.2c). This loss of FRET fit well
to a single exponential curve. Titration of CAND1 in this assay revealed increasingly
rapid rates of SCF complex dissociation that followed saturation kinetics with a
maximum rate of 1.3 s-‐1 and a half maximal concentration (Km) of 26 nM (Figure
3.2d). To eliminate interference in our signal from re-‐association of Fbxw7/Skp1 to
Cul1/Rbx1, we repeated our measurements with Fbox/Skp1 chase in the reaction
(Figure 3.2d). The maximal rate of CAND1 dependent dissociation remained
unchanged while the Km increased to 53 nM (Figure 3.2d). In agreement with
previous results, SCF complexes formed with neddylated Cul1 showed no
dissociation in response to CAND1 in this assay (Figure 3.2d). However, when the
assay was repeated on longer timescales, CAND1 had a modest 45-‐fold effect on the
dissociation rate if Cul1 is neddylated (Figure 3.2e).
Three main points arise from this analysis. First, the saturation kinetics seen
in this assay reveal the existence of a transient complex that contains CAND1,

38
Cul1/Rbx1, and Fbxw7/Skp1. Second, the Km of 53 nM sets an upper limit on the Kd
between CAND1 and Cul1/Rbx1 in the presence of Fbxw7/Skp1. Third, the maximal
observed rate of 1.3 s-‐1 represents the rate of Fbxw7/Skp1 dissociation from the
transient complex containing CAND1. The difference between the off rate of
Fbxw7/Skp1 from Cul1/Rbx1 with and with out CAND1 is extraordinary. CAND1
actively changes the dissociation rate of SCFFbxw7 a million-‐fold. Neddylation of Cul1
nearly abolishes the effect of CAND1, decreasing the dissociation rate of SCFFbxw7
30,000 fold in the presence of CAND1.
Figure 3.2 | CAND1 Actively Removes Fbxw7/Skp1 By Altering Off Rate. a, As in Figure 3.1a and
Figure 3.1d except with the addition of 150 nM CAND1. b, As in a, except using neddylated Cul1 NTD
CFP. c, The change in donor fluorescence versus time in a stop flow apparatus upon addition of 150
nM CAND1 with 50 nM Cul1 NTD CFP/Rbx1 pre-‐incubated with 50 nM Fbxw7 TAMRA/Skp1. d, The
single exponential observed rates for various CAND1 concentrations mixed with 5 nM Cul1 NTD
CFP/Rbx1 or 5nM neddylated Cul1 NTD CFP/Rbx1 pre-‐incubated with 5 nM Fbxw7 TAMRA/Skp1.
Chase indicates 700 nM Skp2/Skp1. Error bars: +/-‐ SD, n≥3. e, As in Figure 3.1e except with 150 nM

39
CAND1 and 700 nM Skp2/Skp1 chase mixed with 70nM neddylated Cul1 NTD CFP pre-‐incubated
with 70 nM Fbxw7 TAMRA/Skp1. Error bars: range of values, n=2. f, As in Figure 3.1c, except with
150 nM CAND1 pre-‐incubated with 5 nM Cul1 NTD CFP/Rbx1. Error bars: +/-‐ SD, n≥3.
CAND1 only affects SCF dissociation
The above data are consistent with previous observations that lead to the
conclusion that CAND1 functions as a neddylation dependent inhibitor of SCF
complex formation. Yet, the dramatic increase in off-‐rate measured above is not
itself proof that CAND1 is an inhibitor. To determine directly if CAND1 is an
inhibitor, we measured the association rate of Fbxw7 TAMRA/Skp1 and Cul1 NTD
CFP/Rbx1 pre-‐incubated with a saturating concentration of CAND1. Shockingly,
CAND1 did not affect the association rate of SCFFbxw7 (Figure 3.2f). To better
understand how CAND1 specifically modulates the dissociation rate of SCF
complexes and not the associate rate we took advantage of the observation that
CAND1 inhibits neddylation of Cul1/Rbx1 in vitro, and that this inhibition is relieved
by Fbox/Skp1 complexes (Siergiejuk et al., 2009). We designed an assay using
radiolabeled Cul1 to follow neddylation in real time. Near stoichiometric amounts of
CAND1 inhibited neddylation of Cul1. Three different Fbox/Skp1 complexes
suppressed CAND1’s ability to inhibit neddylation in a manner dependent on acidic
loops in Skp1 that are unnecessary for ubiquitylation (Figure 3.3a & Supplementary
Figure B.1f).
Three major points emerge from these experiments. First, CAND1 does not
act as a classic inhibitor of SCF complexes because CAND1 does not block
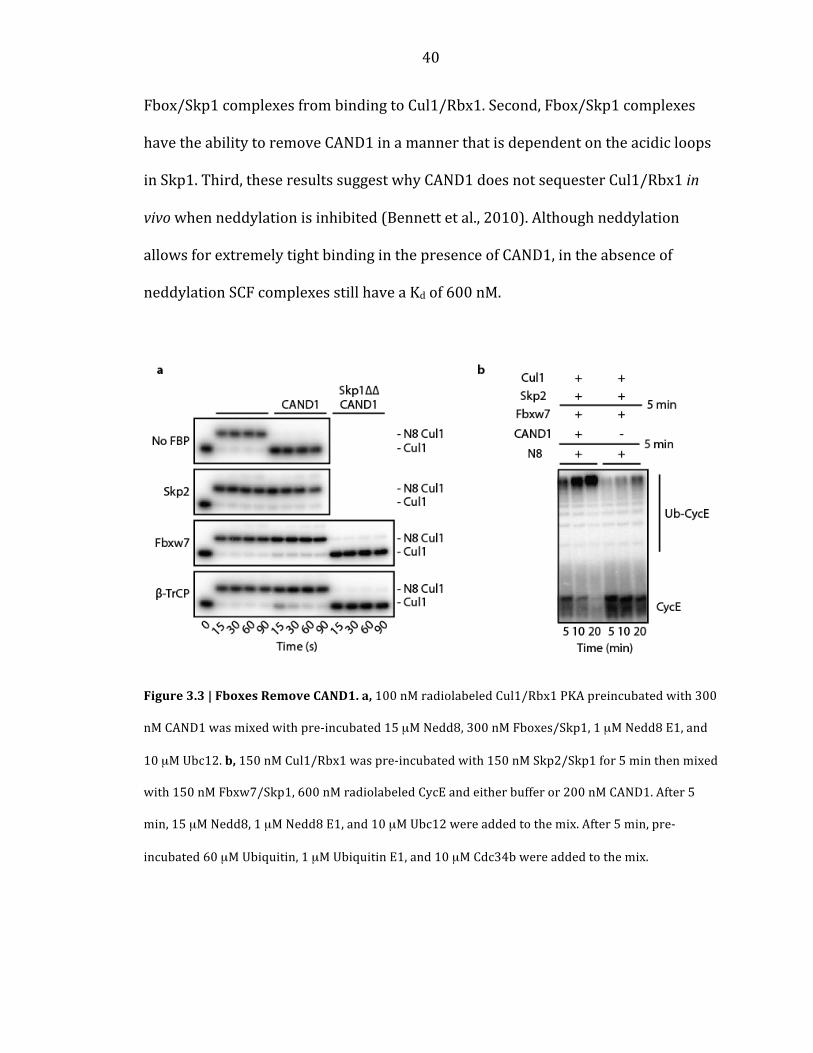
40
Fbox/Skp1 complexes from binding to Cul1/Rbx1. Second, Fbox/Skp1 complexes
have the ability to remove CAND1 in a manner that is dependent on the acidic loops
in Skp1. Third, these results suggest why CAND1 does not sequester Cul1/Rbx1 in
vivo when neddylation is inhibited (Bennett et al., 2010). Although neddylation
allows for extremely tight binding in the presence of CAND1, in the absence of
neddylation SCF complexes still have a Kd of 600 nM.
Figure 3.3 | Fboxes Remove CAND1. a, 100 nM radiolabeled Cul1/Rbx1 PKA preincubated with 300
nM CAND1 was mixed with pre-‐incubated 15 µM Nedd8, 300 nM Fboxes/Skp1, 1 µM Nedd8 E1, and
10 µM Ubc12. b, 150 nM Cul1/Rbx1 was pre-‐incubated with 150 nM Skp2/Skp1 for 5 min then mixed
with 150 nM Fbxw7/Skp1, 600 nM radiolabeled CycE and either buffer or 200 nM CAND1. After 5
min, 15 µM Nedd8, 1 µM Nedd8 E1, and 10 µM Ubc12 were added to the mix. After 5 min, pre-‐
incubated 60 µM Ubiquitin, 1 µM Ubiquitin E1, and 10 µM Cdc34b were added to the mix.

41
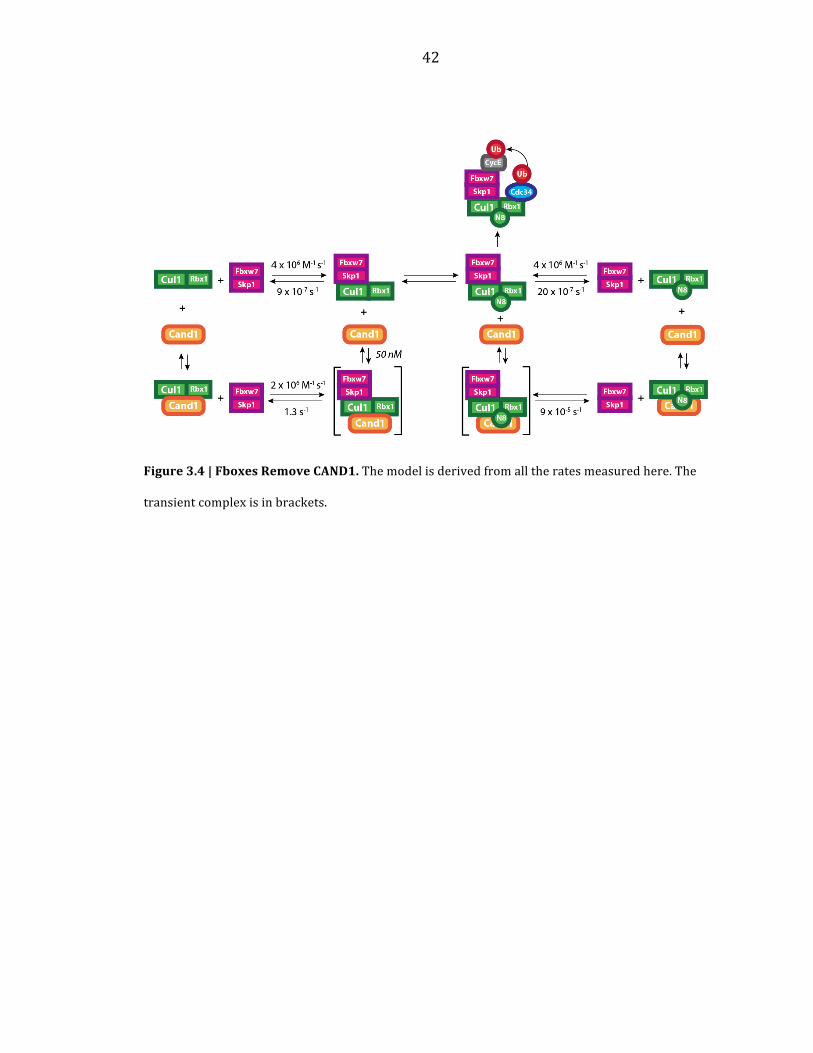
CAND1 functions as an Fbox exchange factor
Inspection of Figure 3.4, which summarizes all the rates measured here,
suggests a manner in which CAND1 can stimulate activity in a purified system. If
multiple Fboxes are used in the same ubiquitylation assay, then pre-‐incubation with
saturating amounts of Fbox/Skp1 relative to Cul1/Rbx1 should reduce the rate of
ubiquitylation of a second Fbox/Skp1. However, addition of CAND1 should allow the
second Fbox/Skp1 complex access to Cul1/Rbx1. Neddylation of the complexes
should then lock them down in respect to CAND1. Under these conditions, CAND1
did in fact stimulate the ubiquitylation assay (Figure 3.3b). Taken together, CAND1
appears to function as an exchange factor that drastically modulates the direct
assembly of SCF complexes in a neddylation dependent manner.
Here we establish the first kinetic framework for the dynamic assembly of
SCF complexes using a direct real time biophysical assay. We conclude that CAND1
is directly involved in the assembly of SCF complexes because it serves as an
exchange factor for Fbox/Skp1 complexes. Our kinetic framework serves as a
starting point to re-‐evaluate the function of CAND1 in vivo. Three ideas emerge from
the synthesis of our kinetic model and genetic studies. First, CAND1 may be
necessary for incorporation of newly synthesized Fboxes if all the Cul1/Rbx1
complexes are saturated. Second, CAND1 may be needed to release ubiquitylated
Fboxes from Cul1/Rbx1 to ensure their proper degradation. Third, CAND1 may
function as an exchange factor that is specifically localized, giving another layer of
control over SCF complex assembly in the cell.
42
Figure 3.4 | Fboxes Remove CAND1. The model is derived from all the rates measured here. The
transient complex is in brackets.
43
Methods
Fluorimeter scans were performed on FluoroLog-‐3 (Jobin Yvon) in a buffer
containing 30 mM Tris pH 7.6, 100 mM NaCl, 0.5 mM DTT, and 1 mg/ml Ovalbumin
(Sigma) in a volume of 250 μl. Mixtures were excited at 430 nm and the emissions
were scanned from 450 nm to 650 nm. Stop flow reactions were performed on a
Kintek stop flow machine in the same buffer as the fluorimeter scans. Ubiquitylation
reactions were performed as described (Pierce et al., 2009). Proteins were purified
as described (Pierce et al., 2009).

44
Chapter 4:
Unpublished Work
45
This chapter is included to provide a summary of the many assays and
experiments that were not taken to completion. Most, but not all, of the experiments
that have found their way into this chapter provide evidence for a conformational
change in SCF upon substrate binding. Likely, this change is occurring in the Fbox
protein and is independent of neddylation status. However, there are several
contradictory results, and the function of this conformational change, if it does exist,
remains a mystery. It is my hope that including this chapter here will stimulate
further work on this topic.
Substrate Induced Conformational Change
The ubiquitylation rates for human SCF complexes show a clear
inconsistency between the multi-‐turnover kcat and the observed single turnover rate
(Saha and Deshaies, 2008). For SCFβ-‐TrCP and Cdc34, the kcat is 0.05 min-‐1 and the kobs
for single turnover is 0.3 min-‐1. For neddylated SCFβ-‐TrCP and Cdc34, the kcat is 0.2
min-‐1 and the kobs for single turnover is 3 min-‐1. When starting with a mono-‐
ubiquitylated substrate, the kcat is 2 min-‐1 and the kobs for single turnover is >20 min-‐
1. Under all conditions tested, the single turnover rate is faster than the multi-‐
turnover, indicating that a step after the transfer of ubiquitin is rate-‐limiting.
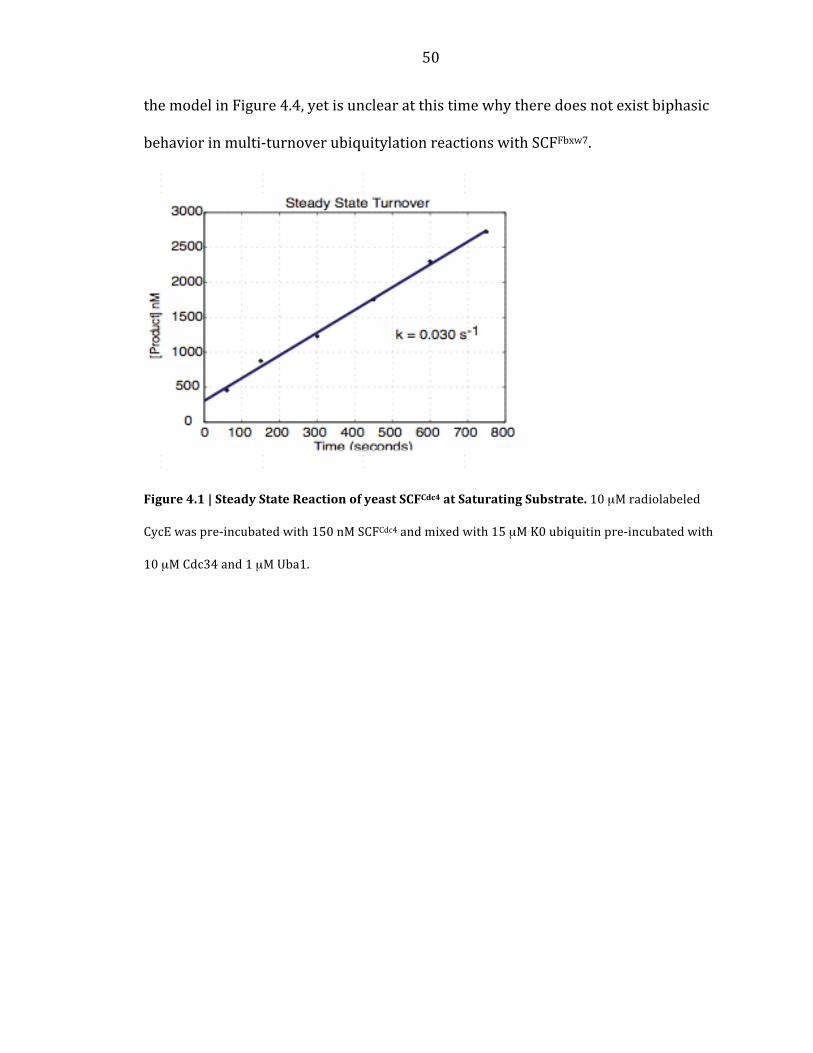
Currently, the origin of this phenomenon remains unclear.
Previously, a yeast single encounter ubiquitylation revealed that the rate-‐
limiting first ubiquitin transfer for SCFCdc4 and its substrate CycE is 0.2 s-‐1 and the off
rate of CycE and its ubiquitylated products is 0.4 s-‐1 (Pierce et al., 2009). To
determine if the above phenomenon seen for human SCF complexes also occurs in
46
yeast SCF complexes, I adapted the yeast ubiquitylation assay previously used for
single encounter reactions to multi-‐turnover reactions (Pierce et al., 2009). At a
saturating concentration of CycE, the multi-‐turnover rate for ubiquitylation was
0.03 s-‐1 (Figure 4.1). Importantly, the positive intercept for the multi-‐turnover
reaction in Figure 4.1 indicates that a burst phase was present in this reaction.
When I repeated the reaction on a quench flow apparatus for higher time resolution
and with a lower concentration of substrate, a clear burst phase emerged (Figure
4.2). The rate constant of the first phase in Figure 4.2 is 0.24 s-‐1, in good agreement
with the rate-‐limiting first ubiquitin transfer. The second phase has a rate constant
of 0.03 s-‐1, consistent with the multi-‐turnover rate constant seen with saturating
substrate. However, these numbers present a conundrum. The off rate of product
and substrate (0.4 s-‐1) is faster than the rate observed here (0.03 s-‐1) indicating that
a step after dissociation and before ubiquitin transfer is rate-‐limiting for the full
enzymatic cycle. Yet, the association of CycE and SCFCdc4 cannot be rate-‐limiting
given that we observe the same rate when we have saturating concentrations of
CycE (Figure 4.1). This indicates that a step between substrate association and
ubiquitin transfer is rate-‐limiting. How then is it possible to see a burst phase? The
reaction set up used here was to pre-‐incubate CycE with SCFCdc4 before the reaction.
Thus, it was possible for any rate-‐limiting step after association but before transfer
to be bypassed at the start of the reaction. This predicted that a lag phase should
occur if CycE and SCFCdc4 were not pre-‐incubated at the beginning of the reaction.
Indeed, in a single turnover reaction, using wild type ubiquitin, a lag phase that
contains a rate of 0.024 s-‐1 was observed (Figure 4.3) (Pierce et al., 2009). An

47
accurate measurement of the association rate of CycE and SCFCdc4, however, has not
been made. In order to reconcile all of the measured rates, I insert an extra step in
between substrate association and ubiquitin transfer (Figure 4.4). Likely, this
represents a conformational change induced by the substrate in SCFCdc4. My sole
attempt to measure this rate directly, was to fluorescently label the only lysine in
CycE and the active site of Cdc34, which is the only cysteine in the protein. I knew
that the lysine in CycE and the cysteine in Cdc34 had to come close to each other for
the first ubiquitin transfer. Thus, I hypothesized that they would FRET. This FRET
signal would likely occur after the rate limiting conformational change, if it existed,
given that it occurred before the ubiquitin transfer. There was a small amount of
FRET seen when Cdc34, SCFCdc4, and CycE were all mixed together, however, there
were also numerous anomalies from several control mixing experiments (Figure
4.5). Despite this I attempted to measure rates directly in the stop flow. The result
was a three phase curve (Figure 4.6). The first phase was a noisy fast single
exponential with an observed rate of 1.8 s-‐1 that likely represents CycE associating
with SCFCdc4 and a low FRET state (i.e. CycE is close enough to Cdc34 to FRET but it
is not efficient). Then comes a lag phase curve in which the two phases fit to exactly
the same rate, 0.017 s-‐1. This high FRET state likely represents CycE moving closer
to the active site of Cdc34. The rates seen here are in agreement with the slow rate
measured in all other assays. However, the reason for a lag phase with identical
rates is unclear. Unfortunately, many of the measurements made here were not
repeated nor assays optimized because I moved to using the human system as a
direct result of comments from reviewers of the Pierce et al., 2009.

48
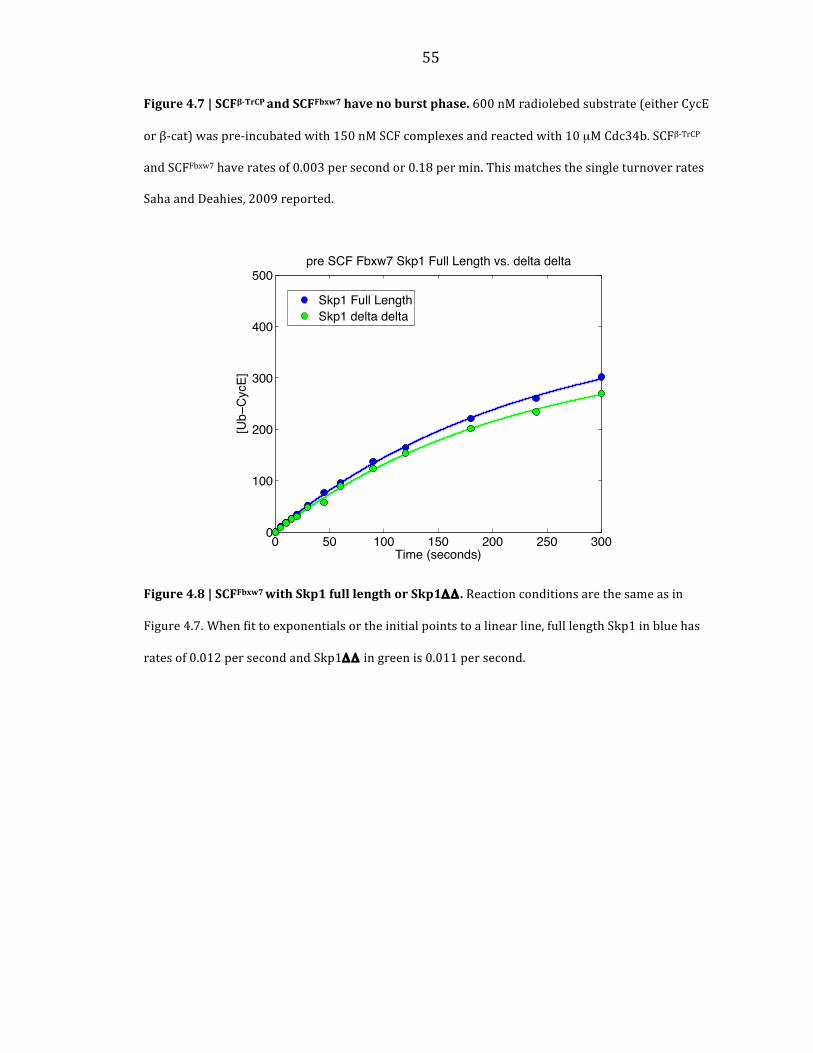
When I repeated multi-‐turnover experiments with human SCFβ-‐TrCP and
SCFFbxw7 no burst phase was seen and both complexes displayed rates of 0.18 min-‐1
(Figure 4.7). This matches the single turnover rate seen in Saha and Deshaies, 2008.
However, these reactions were performed with Fboxes that had been purified with
Skp1ΔΔ. When this was repeated with SCFFbxw7 with full length Skp1 and with
Skp1ΔΔ, the reactions were the same with no burst phase evident (Figure 4.8). Thus,
the dynamics seen with the yeast system did not match the dynamics seen with the
subsequent human system. It is unclear at this time why Saha and Deshaies, 2008
had a difference in multi-‐turnover versus single turnover rates, however, I suspect
that in the multi-‐turnover reactions, substrate was not saturating. The reason for
the burst phase kinetics seen in the yeast system may be explainable by the
observation that the attachment of the Nedd8 homologue Rub1 to Cdc53 does not
increase the rate ubiquitin transfer for SCFCdc4 (Pierce et al., 2009). Given that Rub1
is not essential in this organism in direct contrast to Nedd8 in all other organisms,
the yeast system may have evolved a mechanism for inducing the active
conformation of Cdc53/Rbx1 without Rub1.
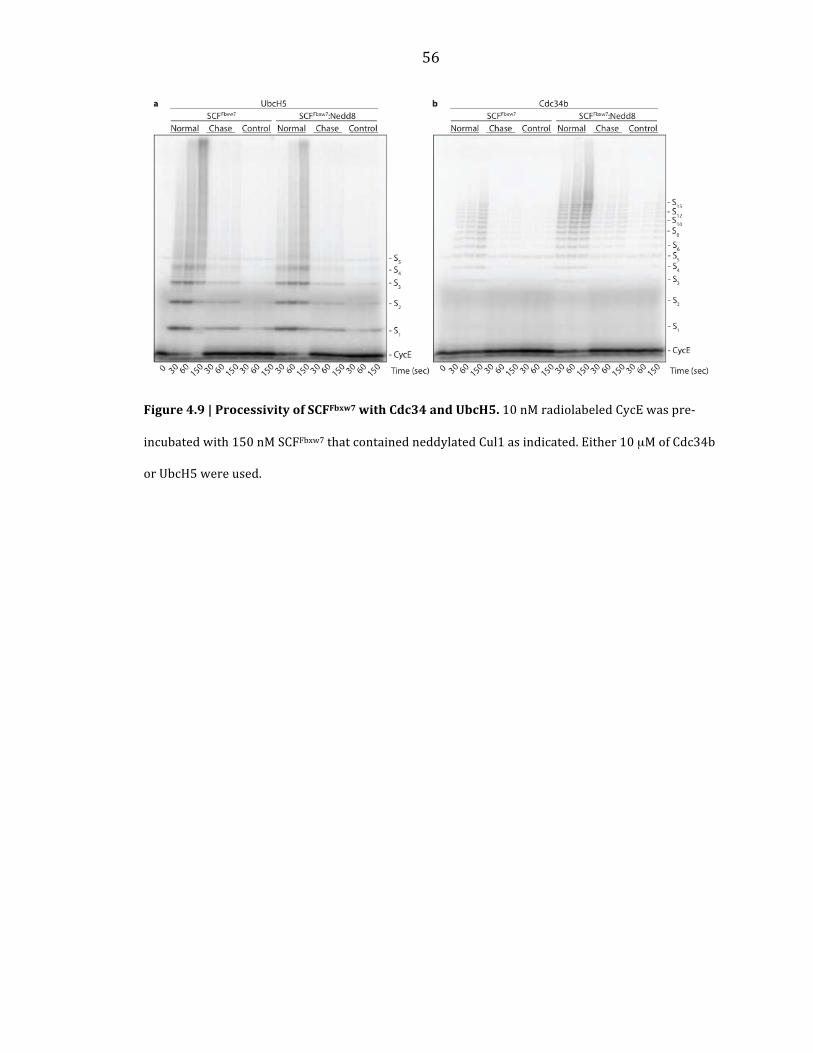
The processive measurements performed in Pierce et al., 2009 did not
include SCFFbxw7. I performed reactions similar to Figure 2.1a (Pierce et al., 2009)
with both naked and neddylated Cul1 using either Cdc34 or UbcH5 (Figure 4.9).
These reactions were fractionated on large gradient gels. As with SCFβ-‐TrCP, the length
of chain was quite long in a single encounter (~15 ubiquitins) when using Cdc34.
The speed of the reaction was stimulated and the processivity increased by
neddylation. UbcH5 reactions on the other hand, were not very processive,

49
containing mainly mono-‐ubiquitylated species in a single encounter. The reactions
in this case were not stimulated much by neddylation.
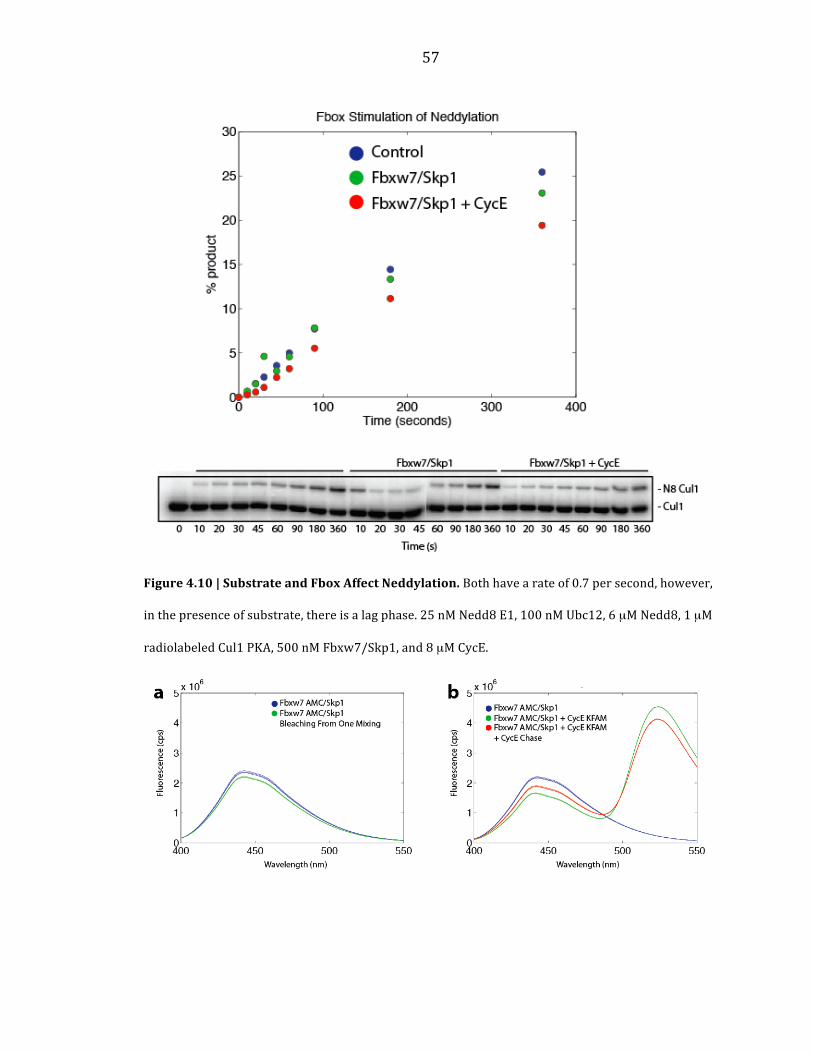
To investigate changes in the neddylation rate of human SCF complexes
based on their composition, I performed steady state measurements with and
without Fbxw7/Skp1 and its substrate CycE (Figure 4.10). The rates measured for
with and without Fbxw7/Skp1 was the same (0.7 s-‐1). However, there was a distinct
lag phase when CycE was included in this reaction. The reason for this observation
remains unclear.
Lastly, the original reason for the developing the fluorescent Fboxes was to
measure the dynamics of substrate binding. Using a CycE substrate synthesized with
a KFAM derivative instead of a PKA site and a Fbxw7 labeled with AMC through a
sortase reaction, I was able to observe a small amount of FRET that could be chased
away with unlabeled CycE (Figure 4.11). The reaction was not optimized and should
be noted that the Fbxw7 AMC/Skp1 did show bleaching that was significant relative
to the signal change (Figure 4.11a). However, the off rate measured in the stop flow
using this assay was 0.2 s-‐1, which is in excellent agreement with the quench flow
assays done with SCFCdc4 and SCFβ-‐TrCP in Pierce et al., 2009 (Figure 4.12, yellow
curve). The on-‐rate measurements, however, were confounded by a significant
bleaching component. However, the rate of the reaction clearly increased with
increasing CycE KFAM acceptor. Importantly, when Fbxw7 AMC/Skp1 was pre-‐
incubated with non-‐labeled CycE, this association reaction was stimulated (Figure
4.12, compare the magenta line with the black line). This behavior was predicted by
50
the model in Figure 4.4, yet is unclear at this time why there does not exist biphasic
behavior in multi-‐turnover ubiquitylation reactions with SCFFbxw7.
Figure 4.1 | Steady State Reaction of yeast SCFCdc4 at Saturating Substrate. 10 µM radiolabeled
CycE was pre-‐incubated with 150 nM SCFCdc4 and mixed with 15 µM K0 ubiquitin pre-‐incubated with
10 µM Cdc34 and 1 µM Uba1.

51
Figure 4.2 | Burst Phase of SCFCdc4 Multi-‐turnover Reaction. 600 nM radiolabeled CycE was pre-‐
incubated with 150 nM SCFCdc4 and mixed with 15 µM K0 ubiquitin pre-‐incubated with 10 µM Cdc34
and 1 µM Uba1. The amplitude of the burst is 120 nM, the faster first phase has a rate of 0.24 s-‐1, and
the slower linear phase has a rate of 0.03 s-‐1.
0 5 10 15 20 25 30 35 400
50
100
150
200
250
Time (seconds)
[P]
nM
Burst Phase

52
Figure 4.3 | A Lag Phase Exists If CycE and SCFCdc4 Are Not Pre-‐incubated. This is the raw data
from Figure 2.2c (Pierce et al., 2009). A clear lag phase can be seen.
Figure 4.4 | Model with conformational change inserted. Inserting a step in between substrate
binding and ubiquitin transfer that can occur during SCFCdc4 and CycE pre-‐incubation allows for a
simple model that explains the dynamics seen.

53
Figure 4.5 | Attempted FRET Measurements for CycE and Cdc34. 200 nM CycE reacted with
BODIPY Fluorescein Succinimidyl Ester and 40 nM Cdc34 reacted with DACM, N-‐(7-‐dimethylamino-‐
4-‐methylcoumarin-‐3-‐yl) maleimide were mixed in several combinations with 100 nM SCFCdc4. Scans
are excited at 380 nm with emission from 420 nm to 600 nm.

54
Figure 4.6 | Association of CycE and Cdc34 in a stop flow. The reaction in Figure 4.5 performed on
the stop apparatus with a filter to follow only the donor signal. Three phases are evident.
0 20 40 60 80 100 1200
50
100
150
200
250
Time (seconds)
[P] nM
Burst Phase
55
Figure 4.7 | SCFβ-‐TrCP and SCFFbxw7 have no burst phase. 600 nM radiolebed substrate (either CycE
or β-‐cat) was pre-‐incubated with 150 nM SCF complexes and reacted with 10 µM Cdc34b. SCFβ-‐TrCP
and SCFFbxw7 have rates of 0.003 per second or 0.18 per min. This matches the single turnover rates
Saha and Deahies, 2009 reported.
Figure 4.8 | SCFFbxw7 with Skp1 full length or Skp1ΔΔ . Reaction conditions are the same as in
Figure 4.7. When fit to exponentials or the initial points to a linear line, full length Skp1 in blue has
rates of 0.012 per second and Skp1ΔΔ in green is 0.011 per second.
! "! #!! #"! $!! $"! %!!!
#!!
$!!
%!!
&!!
"!!
'()*+,-*./01-2
345!67.89
:;*+<6=+=5>?@+<A:#+=BCC+D*0EFG+H-I+1*CFJ+1*CFJ
+
+
<A:#+=BCC+D*0EFG
<A:#+1*CFJ+1*CFJ
56
Figure 4.9 | Processivity of SCFFbxw7 with Cdc34 and UbcH5. 10 nM radiolabeled CycE was pre-‐
incubated with 150 nM SCFFbxw7 that contained neddylated Cul1 as indicated. Either 10 µM of Cdc34b
or UbcH5 were used.
57
Figure 4.10 | Substrate and Fbox Affect Neddylation. Both have a rate of 0.7 per second, however,
in the presence of substrate, there is a lag phase. 25 nM Nedd8 E1, 100 nM Ubc12, 6 µM Nedd8, 1 µM
radiolabeled Cul1 PKA, 500 nM Fbxw7/Skp1, and 8 µM CycE.

58
Figure 4.11 | FRET Between Fbxw7 AMC/Skp1 and CycE KFAM. a, Fluorimeter scans exciting at
380 nm and scanning from 400 to 550 nm. 30 nM Fbxw7 AMC in blue, then mixed to see extent of
bleaching. b, 30 nM Fbxw7 AMC mixed with 580 nM CycE KFAM then 32 µM CycE as chase.
Figure 4.12 | Binding of CycE and Fbxw7 using FRET. 30 nM Fbxw7 AMC/Skp1 mixed with: Blue =
400 nM CycE KFAM, Green = 800 nM CycE KFAM, Red = 1.6 µM CycE KFAM, Magenta = 3.2 µM CycE
KFAM, Black is 130 nM CycE pre-‐incubated 30 nM Fbxw7 AMC then mixed with 3.2 µM CycE KFAM.
Yellow is starting with 3.2 µM CycE KFAM and mixing with excess CycE as a chase gives an off rate of
0.2 per second. Note that the machine was set for two phase time courses with the first phase from 0
to 30 seconds (collect 500 time points) and the second phase from 30 seconds to 120 seconds
(collect 500 time points). Clearly this had an effect on the data, which I attributed to bleaching and
low FRET signal.
! "! #! $! %! &!! &"!!&
!!'(
!!'%
!!')
!!'$
!!'*
!!'#
!!'+
!!'"
!!'&
!
,-./012/345627
89:4;/23/53/
<-56-5=08>?@)0ABC0D560CE3F08AB016454;70&&0*0"!&!

59
Appendix A: Supplementary Materials for Chapter 2
60
- CycE
- 1
- 2
- 3- 4- 5- 6
- 8- 10
10 6030150
300600
Rub1 SCFSCF
0 10 6030150
300600 Time (sec)
Cdc53Cdc53-Rub1Cdc4
Ub
Uba1
Cdc34
SCFCdc4
CycE*
SDS PAGE
!
A B
b
c
d
CycE
KAMLSEQNRASPLPSGLL(pThr)PPQ(pSer)GRRASYHHHHHH{{{{
His TagPKA SitePhosphoDegron
Acetylated AminoTerminus
a
"-Cat
KAWQQQSYLD(pSer)GIH(pSer)GATTTAPRRASY {{{
PKA SitePhosphoDegron
Acetylated AminoTerminus
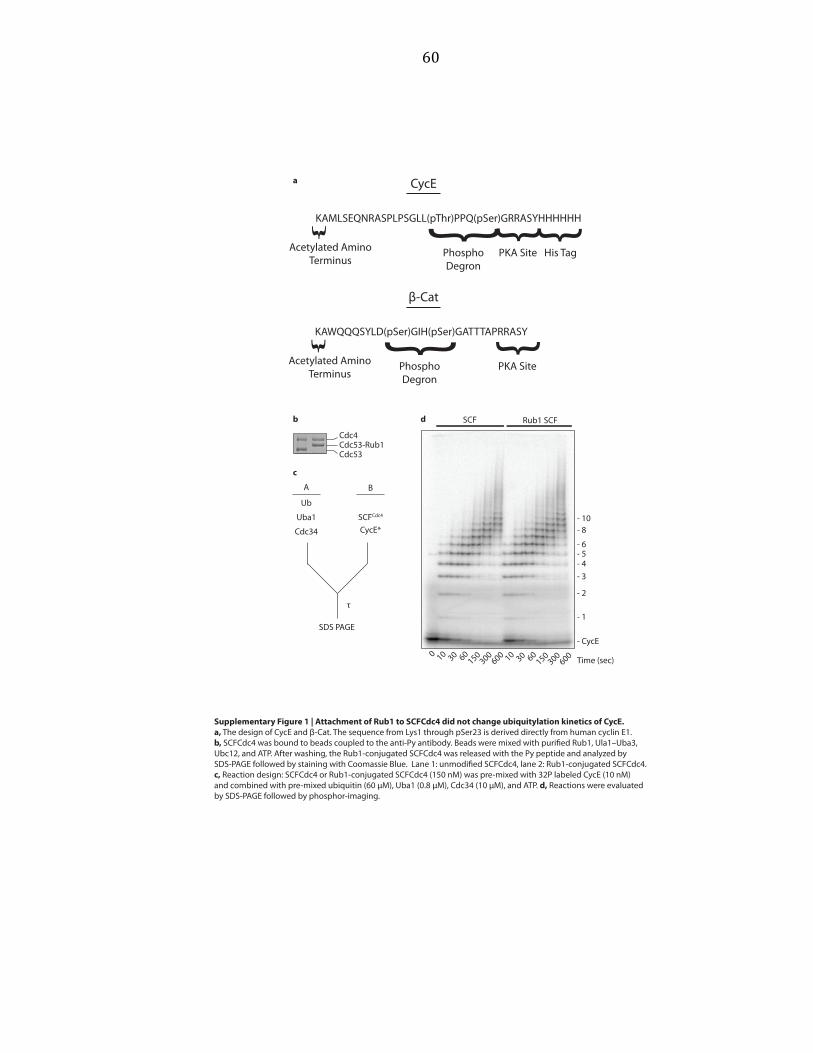
Supplementary Figure 1 | Attachment of Rub1 to SCFCdc4 did not change ubiquitylation kinetics of CycE. a, The design of CycE and "-Cat. The sequence from Lys1 through pSer23 is derived directly from human cyclin E1. b, SCFCdc4 was bound to beads coupled to the anti-Py antibody. Beads were mixed with puri#ed Rub1, Ula1–Uba3, Ubc12, and ATP. After washing, the Rub1-conjugated SCFCdc4 was released with the Py peptide and analyzed by SDS-PAGE followed by staining with Coomassie Blue. Lane 1: unmodi#ed SCFCdc4, lane 2: Rub1-conjugated SCFCdc4. c, Reaction design: SCFCdc4 or Rub1-conjugated SCFCdc4 (150 nM) was pre-mixed with 32P labeled CycE (10 nM) and combined with pre-mixed ubiquitin (60 µM), Uba1 (0.8 µM), Cdc34 (10 µM), and ATP. d, Reactions were evaluated by SDS-PAGE followed by phosphor-imaging.

61
1 2 3 4 5 6 7 8
0.05
0.1
0.15
0.2
0.25
# of ubiquitins in chain
0
30 sec
60 sec
150 sec
300 sec
a b
[SCF:S0] = 0.5 * (Kd + SCF + S0) - [ 0.25 * (Kd + SCF + S0)2 - (SCF*S0) ]0.5
Kd = 90 nM; [SCFCdc4] = 150 nM; [CycE0] = 10 nM;
[SCF:S0] = 6.15 nM or 61.5% of S0; On average 17% of S0 is modi!ed
17% / 61.5% = 27.6% of bound S0 at the beginning of the reaction goes on to get modi!ed
S1 S2 S3 S4 S5 S6 S7 S8
0.032 0.11 0.17 0.23 0.20 0.14 0.075 0.035
72.4% of bound S0 at the beginning of the reaction does not get modi!ed
c
Normalized Average Final Distribution "CycE
1 2 3 4 5 6 7 8# of ubiquitins in chain
fraction of substrates modi!ed
Average
Reaction 2Reaction 1 Reaction 3
- CycE
- 1
- 2
- 3- 4- 5- 6
- 8
6030150
3000 Time (sec)6030150
300 6030150
300
Subtract then Normalize
d
e
±0.0084 ±0.026 ±0.021 ±0.010 ±0.012 ±0.014 ±0.014 ±0.0036
0.04 0.05 0.07 0.11 0.13 0.13 0.11 0.09±0.008 ±0.008 ±0.015 ±0.015 ±0.01 ±0.007 ±0.013 ±0.008
0.07 0.04 0.02 0.01 0.010.11±0.012 ±0.009 ±0.006 ±0.004 ±0.005±0.008
S1 S2 S3 S4 S5 S6 S7 S8 S9 S10 S11 S12 S13 S14
Normalized Average Final Distribution "#-cat
0.05
0.1
0.15
0.2
0.25
0
"CycE
[SCF:S0] = 0.5 * (Kd + SCF + S0) - [ 0.25 * (Kd + SCF + S0)2 - (SCF*S0) ]0.5
Kd = 480 nM; [SCF#-TrCP] = 500 nM; [#-cat0] = 100 nM;
[SCF:S0] = 48.5 nM or 48.5% of S0; On average 3.7% of S0 is modi!ed
3.7% / 48.5% = 7.6% of bound S0 at the beginning of the reaction goes on to get modi!ed
92.4% of bound S0 at the beginning of the reaction does not get modi!ed
f
g
Supplementary Figure 2 | Calculation of !. a, For clarity, Figure 1a is reproduced here. b, The distributions of products in reaction 3 were subtracted from the distribution of products in reaction 2 at each time point and then normalized. c, The average of the distributions shown in b is "CycE. d, The fractional amounts of each product (S1 – S8) that comprise the distribution "CycE. e, The fractional amounts of each product (S1 – S14) that comprise the distribution "#-Cat. f, Calculation of the percent CycE bound to SCFCdc4 at the beginning of the reaction, based on the reported Kd for binding of CycE to Cdc4.21 Combined with the kinetics of Fig. 1a the percent of productive encounters was calculated. g, Calculation of the percent #-Cat bound to SCF#-TrCP at the beginning of the reaction, based on the reported Kd for binding of Ub-#-Cat to #-TrCP.22 Combined with the kinetics of Fig. 1b the percent of productive encounters was calculated.

62
!
0.3 0.7
0.3
0.7
0.09
0.21
0.21
0.49
!(1) !(2)
!(1)
!(2)
!
! "
0.3
0.7
# of ubiquitins in pre-assembled chain
# of transfers events to a single substrate
1 2 3 1 2 3
"(1)
DiscreteConvolution
1 2 3 4
! !
0.8
1.0
0.4
0.6
0
0.2
0.8
1.0
0.4
0.6
0
0.20.25 0.25
0.5
0.09
0.490.42
"
# of transfers events to a single substrate
1 2 3
0.8
1.0
0.4
0.6
0
0.20.25 0.25
0.5
! 1 !
0.3
0.7
1 2 3
0.8
1.0
0.4
0.6
0
0.2
0.4
0.5
0.2
0.3
0
0.1
0.3 0.7
1
!(1) !(2)
(!
0.3 0.7
0.09
0.42
0.027
0.126
0.063
0.294
!(1) !(2)
!)!
(! !)(2)
(! !)(3)
(! !)(4)
"(3)
0.490.147 0.343
1 2 3 4 5 6
0.4
0.5
0.2
0.3
0
0.1 0.027
0.189
0.4410.343
! !!
0.006750.04725
0.110250.08575
0.045
0.210.245
0.075
0.175
0.8
1.0
0.4
0.6
0
0.2
1 2 3
1 2 3 4
0.4
0.5
0.2
0.3
0
0.1
1 2 3 4 5 6
"(2)
0.4
0.5
0.2
0.3
0
0.1
"(1)*!
Weight Each Distribution by "
"(2)*! !
! !!"(3)*
Sum Weighted Convoluted Distributions
+
+
0.4
0.5
0.2
0.3
0
0.1
1 2 3 4 5 6
#
!nal # of ubiquitins in chain
0.4
0.5
0.2
0.3
0
0.1
1 2 3 4 5 6
#
!nal # of ubiquitins in chain
?# equals the weighted sum of multiple discrete convolutions of !
with itself as governed by "
In this example, we use a fake ! and " and calulate #.
{{
{ {
0.075
0.220.21675
0.29225
0.110250.08575
0.075
0.220.21675
0.29225
0.110250.08575
0.3 0.70.25
0.5
0.25
Supplementary Figure 3 | An example of calculating ! from " and #. In this example, we assigned distributions to ! and ". To calculate #, we took multiple convolutions of ! with itself as governed by ". In our example, 25% of substrates underwent one transfer, for which the ! value determines that 30% were a single ubiquitin while 70% were diubiquitin. Thus, we weight the distribution ! by the fraction of a single transfer, "(1)*!. 50% of substrates underwent two transfers. Each of thesetwo transfers selects from the pool of pre-assembled chains, thus we must consider the convolution of ! with itself (!!) and then w eight it by the fraction that receive two transfers, "(2)*!!. This process is repeated for the all indexes of ", each time adding an additional convolution. These weighted distributions sum to give #.

63
! "
0.3
0.7
# of ubiquitins in pre-assembled chain
# of transfers events to a single substrate
1 2 3 1 2 3
0.8
1.0
0.4
0.6
0
0.2
0.8
1.0
0.4
0.6
0
0.20.25 0.25
0.5
0.4
0.5
0.2
0.3
0
0.1
1 2 3 4 5
#
!nal # of ubiquitins in chain
?In this example, we use a fake !
and # and calulate " .
!(1)*"(1) = #(1)
#(1)"(1) =
!(1)
"(1)
1 2 3
0.8
1.0
0.4
0.6
0
0.20.25
=0.075
0.3= 0.25
Thus,
Subtract the contribution of "(1) from #
!
0.3
0.7
1 2 3
0.8
1.0
0.4
0.6
0
0.2
"(1)*!
1 2 3
0.075
0.4
0.5
0.2
0.3
0
0.1
0.175
0.4
0.5
0.2
0.3
0
0.1
1 2 3 4 5
#
0.075
0.220.21675
0.29225
0.11025 - =0.045
0.216750.29225
0.085750.11025
0.08575
0.4
0.5
0.2
0.3
0
0.1
1 2 3
0.075
0.4
0.5
0.2
0.3
0
0.1
0.175
# - "(1)*!
* =
6
6 1 2 3 4 5 6
!(1)*!(1)*"(2) = [# - "(1)*!](2)
[# - "(1)*!](2)"(2) =
!(1)*!(1)=
0.045
0.3*0.3= 0.5
After substracting the contribution of single transfers, the only way to end up with 2 ubiquitins on
substrate is from two transfers of a single ubiquitin.
The only way to end up with 1 ubiquitin on substrate is from a single transfer of a single ubiquitin.
Thus,
"(2)
1 2 3
0.8
1.0
0.4
0.6
0
0.2
0.5 * =1 2 3 4
! !
0.09
0.490.42
0.4
0.5
0.2
0.3
0
0.1
0.075
0.220.21675
0.29225
0.110250.08575
0.045
0.210.245
1 2 3 4
0.4
0.5
0.2
0.3
0
0.1
"(2)*! !
Subtract the contribution
of "(2) from # already corrected for "(1)
0.045
0.216750.29225
0.110250.08575
0.4
0.5
0.2
0.3
0
0.1
# - "(1)*!
1 2 3 4 5 6
- =0.045
0.210.245
1 2 3 4
0.4
0.5
0.2
0.3
0
0.1
"(2)*! !
0.006750.04725
0.110250.08575
1 2 3 4 5 6
# - "(1)*! - "(2)*! !
After substracting the contribution of single and double transfers, the only way to end up with 3 ubiquitins on substrate is from three transfers
of a single ubiquitin.
!(1)*!(1)*!(1)*"(3) =
Thus,
[# - "(1)*! - "(2)*! !](3)
"(3) =!(1)*!(1)*!(1)
=0.00675
0.3*0.3*0.3= 0.25
[# - "(1)*! - "(2)*! !](3)
"(3)
1 2 3
0.8
1.0
0.4
0.6
0
0.2
0.25
1 2 3 4 5 6
0.4
0.5
0.2
0.3
0
0.1 0.027
0.189
0.4410.343
! !!
0.006750.04725
0.110250.08575
1 2 3 4 5 6
0.4
0.5
0.2
0.3
0
0.1
! !!"(3)*
0.006750.04725
0.110250.08575
1 2 3 4 5 6
# - "(1)*! - "(2)*! !
0.4
0.5
0.2
0.3
0
0.1
0.4
0.5
0.2
0.3
0
0.1- = 0
* =
"
1 2 3
0.8
1.0
0.4
0.6
0
0.20.25 0.25
0.5Thus,
"(1)*!

64
Supplementary Figure 4 | An example of calculating ! from " and #. Deconvolution took advantage of the constraints existing on the lowest index of !. Here we used ! and " from the example in Supplementary Figure 3. The only way of creating the species in ! that has a single ubiquitin attached to substrate was by the single transfer of a single ubiquitin. Thus, #(1)*"(1) equals !(1) and #(1) is calculated by division. The contribution of #(1) to ! was then calculated and subtracted from !. The only way remaining to form !(2), is by two transfers of a single ubiquitin. Thus #(2) equals [!-#(1)*"](2)/["(1)*"(1)]. This process is repeated until # is revealed.
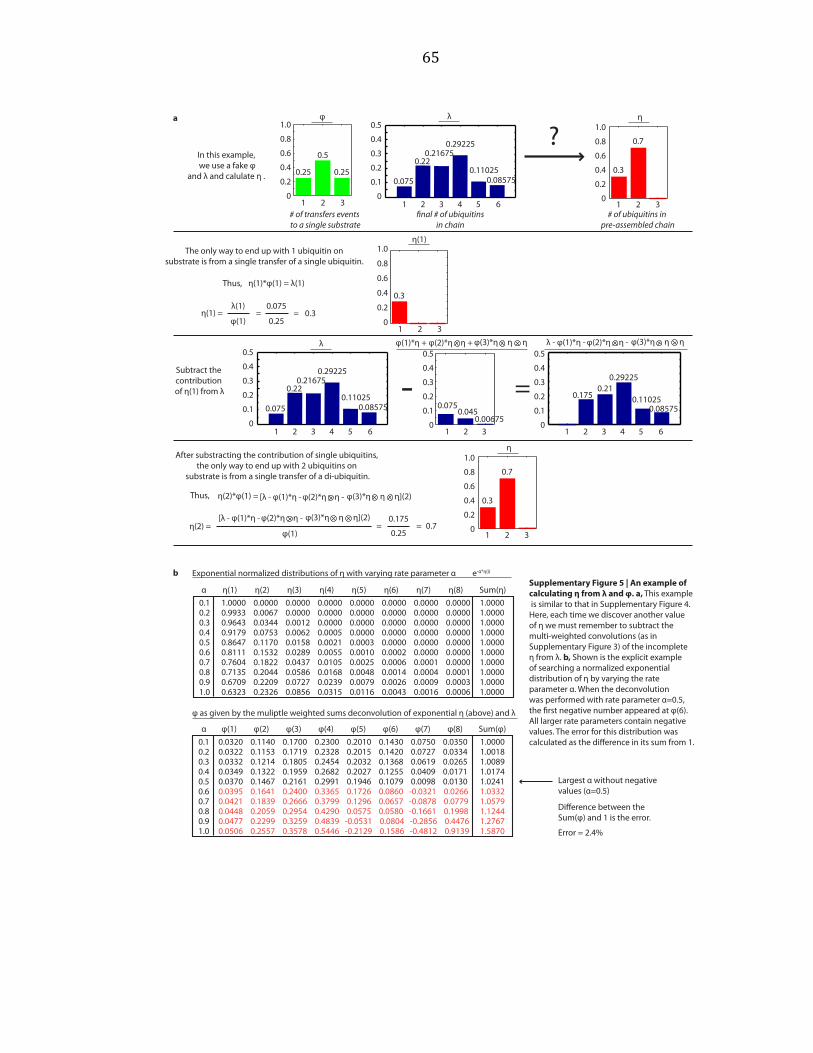
65
!"
0.3
0.7
# of ubiquitins in pre-assembled chain
# of transfers events to a single substrate
1 2 31 2 3
0.8
1.0
0.4
0.6
0
0.2
0.8
1.0
0.4
0.6
0
0.20.25 0.25
0.5
0.4
0.5
0.2
0.3
0
0.1
1 2 3 4 5
#
!nal # of ubiquitins in chain
?In this example, we use a fake "
and # and calulate ! .
!(1)*"(1) = #(1)
#(1)
"(1)!(1) =
!(1)
1 2 3
0.8
1.0
0.4
0.6
0
0.2=0.075
0.3=0.25
Thus,
Subtract the contribution of !(1) from #
# - "(1)*! -
6
!(2)*"(1) =
!(2) = =0.175
0.25= 0.7
After substracting the contribution of single ubiquitins, the only way to end up with 2 ubiquitins on
substrate is from a single transfer of a di-ubiquitin.
The only way to end up with 1 ubiquitin on substrate is from a single transfer of a single ubiquitin.
Thus,
0.075
0.220.21675
0.29225
0.110250.08575
"(2)*! ! - ! !"(3)*!
0.1750.21
0.29225
0.110250.08575
0.4
0.5
0.2
0.3
0
0.1
1 2 3 4 5
#
6
0.075
0.220.21675
0.29225
0.110250.08575
"(1)*! + "(2)*! ! + ! !"(3)*!
0.0750.045
0.00675
[# - "(1)*! -"(2)*! ! - ! !](2)"(3)*!
[# - "(1)*! -"(2)*! ! - ! !](2)"(3)*!
"(1)
!
0.3
0.7
1 2 3
0.8
1.0
0.4
0.6
0
0.2
1 2 3
0.4
0.5
0.2
0.3
0
0.1
1 2 3 4 5 6
- =0.4
0.5
0.2
0.3
0
0.1
Exponential normalized distributions of ! with varying rate parameter $
0.10.20.30.40.50.60.70.80.91.0
0.0320 0.1140 0.1700 0.2300 0.2010 0.1430 0.0750 0.03500.0322 0.1153 0.1719 0.2328 0.2015 0.1420 0.0727 0.03340.0332 0.1214 0.1805 0.2454 0.2032 0.1368 0.0619 0.02650.0349 0.1322 0.1959 0.2682 0.2027 0.1255 0.0409 0.01710.0370 0.1467 0.2161 0.2991 0.1946 0.1079 0.0098 0.01300.0395 0.1641 0.2400 0.3365 0.1726 0.0860 -0.0321 0.02660.0421 0.1839 0.2666 0.3799 0.1296 0.0657 -0.0878 0.07790.0448 0.2059 0.2954 0.4290 0.0575 0.0580 -0.1661 0.19980.0477 0.2299 0.3259 0.4839 -0.0531 0.0804 -0.2856 0.44760.0506 0.2557 0.3578 0.5446 -0.2129 0.1586 -0.4812 0.9139
"(1) "(2) "(3) "(4) "(5) "(6) "(7) "(8)1.00001.00181.00891.01741.02411.03321.05791.12441.27671.5870
Sum(")
0.10.20.30.40.50.60.70.80.91.0
!(1) !(2) !(3) !(4) !(5) !(6) !(7) !(8) Sum(!)1.0000 0.0000 0.0000 0.0000 0.0000 0.0000 0.0000 0.00000.9933 0.0067 0.0000 0.0000 0.0000 0.0000 0.0000 0.00000.9643 0.0344 0.0012 0.0000 0.0000 0.0000 0.0000 0.00000.9179 0.0753 0.0062 0.0005 0.0000 0.0000 0.0000 0.00000.8647 0.1170 0.0158 0.0021 0.0003 0.0000 0.0000 0.00000.8111 0.1532 0.0289 0.0055 0.0010 0.0002 0.0000 0.00000.7604 0.1822 0.0437 0.0105 0.0025 0.0006 0.0001 0.00000.7135 0.2044 0.0586 0.0168 0.0048 0.0014 0.0004 0.00010.6709 0.2209 0.0727 0.0239 0.0079 0.0026 0.0009 0.00030.6323 0.2326 0.0856 0.0315 0.0116 0.0043 0.0016 0.0006
$
$
1.00001.00001.00001.00001.00001.00001.00001.00001.00001.0000
" as given by the muliptle weighted sums deconvolution of exponential ! (above) and #
e-$*!(i)
Largest $ without negative values ($=0.5)
Di%erence between the Sum(") and 1 is the error.
Error = 2.4%
a
b
0.3
Supplementary Figure 5 | An example of calculating ! from " and #. a, This example is similar to that in Supplementary Figure 4. Here, each time we discover another value of ! we must remember to subtract the multi-weighted convolutions (as in Supplementary Figure 3) of the incomplete ! from #. b, Shown is the explicit example of searching a normalized exponential distribution of ! by varying the rate parameter $. When the deconvolution was performed with rate parameter $=0.5, the &rst negative number appeared at "(6). All larger rate parameters contain negative values. The error for this distribution was calculated as the di%erence in its sum from 1.
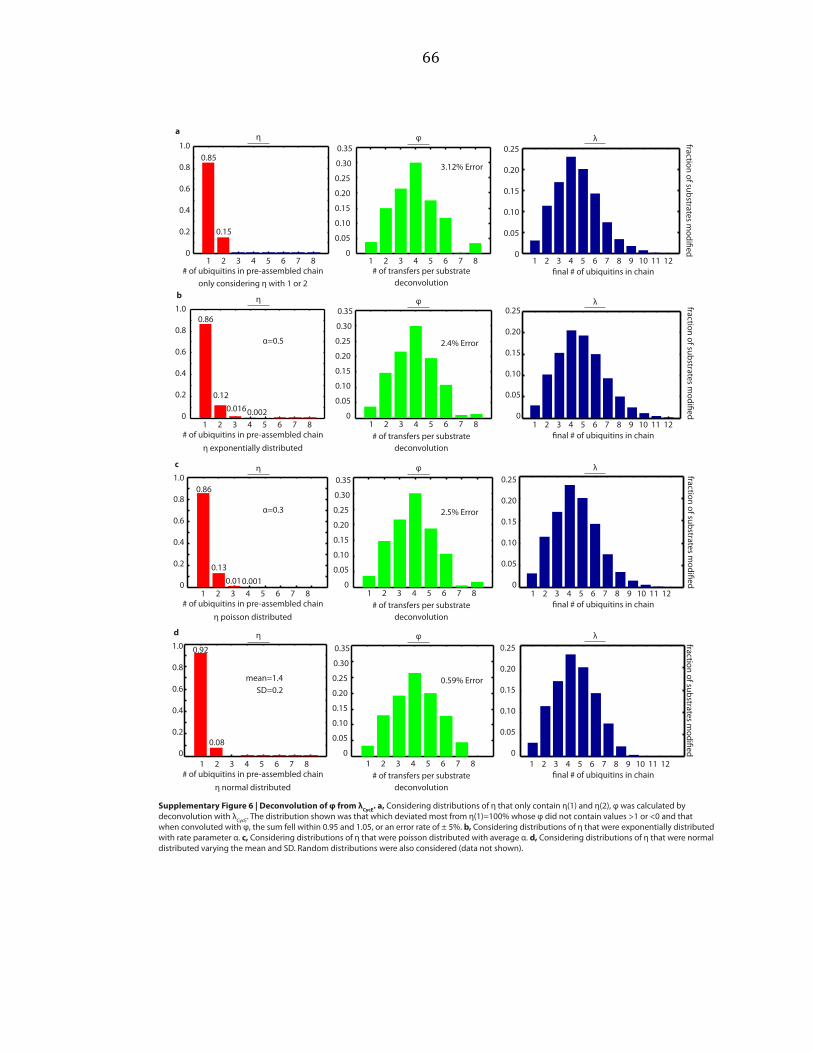
66
only considering ! with 1 or 2
1 2 3 4 5 6 7 8 9 10 1211
3.12% Error 0.20
0.25
0.10
0.15
0
0.05
0.8
1.0
0.4
0.6
0
0.2
0.20
0.25
0.10
0.15
0
0.05
0.30
0.35
1 2 3 4 5 6 7 81 2 3 4 5 6 7 8
! " #a
0.85
0.15
fraction of substrates modi$ed
# of transfers per substrate $nal # of ubiquitins in chain# of ubiquitins in pre-assembled chaindeconvolution
b
0.8
1.0
0.4
0.6
0
0.2
0.20
0.25
0.10
0.15
0
0.05
0.20
0.25
0.10
0.15
0
0.05
0.30
0.35
1 2 3 4 5 6 7 8 9 10 1211$nal # of ubiquitins in chain
1 2 3 4 5 6 7 8# of ubiquitins in pre-assembled chain
! exponentially distributed
%=0.5
0.86
0.120.0160.002
2.4% Error
# of transfers per substratedeconvolution
1 2 3 4 5 6 7 8
! " # fraction of substrates modi$ed
c
0.8
1.0
0.4
0.6
0
0.2
0.20
0.25
0.10
0.15
0
0.05
0.20
0.25
0.10
0.15
0
0.05
0.30
0.35
1 2 3 4 5 6 7 8 9 10 1211$nal # of ubiquitins in chain
1 2 3 4 5 6 7 8# of ubiquitins in pre-assembled chain
! poisson distributed
%=0.3
0.86
0.130.010.001
2.5% Error
# of transfers per substratedeconvolution
1 2 3 4 5 6 7 8
! " #
fraction of substrates modi$ed
d
0.8
1.0
0.4
0.6
0
0.2
0.20
0.25
0.10
0.15
0
0.05
0.20
0.25
0.10
0.15
0
0.05
0.30
0.35
1 2 3 4 5 6 7 8 9 10 1211$nal # of ubiquitins in chain
1 2 3 4 5 6 7 8# of ubiquitins in pre-assembled chain
! normal distributed
mean=1.4
0.92
0.08
0.59% Error
# of transfers per substratedeconvolution
1 2 3 4 5 6 7 8
! " #
fraction of substrates modi$ed
SD=0.2
Supplementary Figure 6 | Deconvolution of ! from "CycE. a, Considering distributions of ! that only contain !(1) and !(2), " was calculated by deconvolution with #CycE. The distribution shown was that which deviated most from !(1)=100% whose " did not contain values >1 or <0 and that when convoluted with ", the sum fell within 0.95 and 1.05, or an error rate of ± 5%. b, Considering distributions of ! that were exponentially distributed with rate parameter %. c, Considering distributions of ! that were poisson distributed with average %. d, Considering distributions of ! that were normal distributed varying the mean and SD. Random distributions were also considered (data not shown).
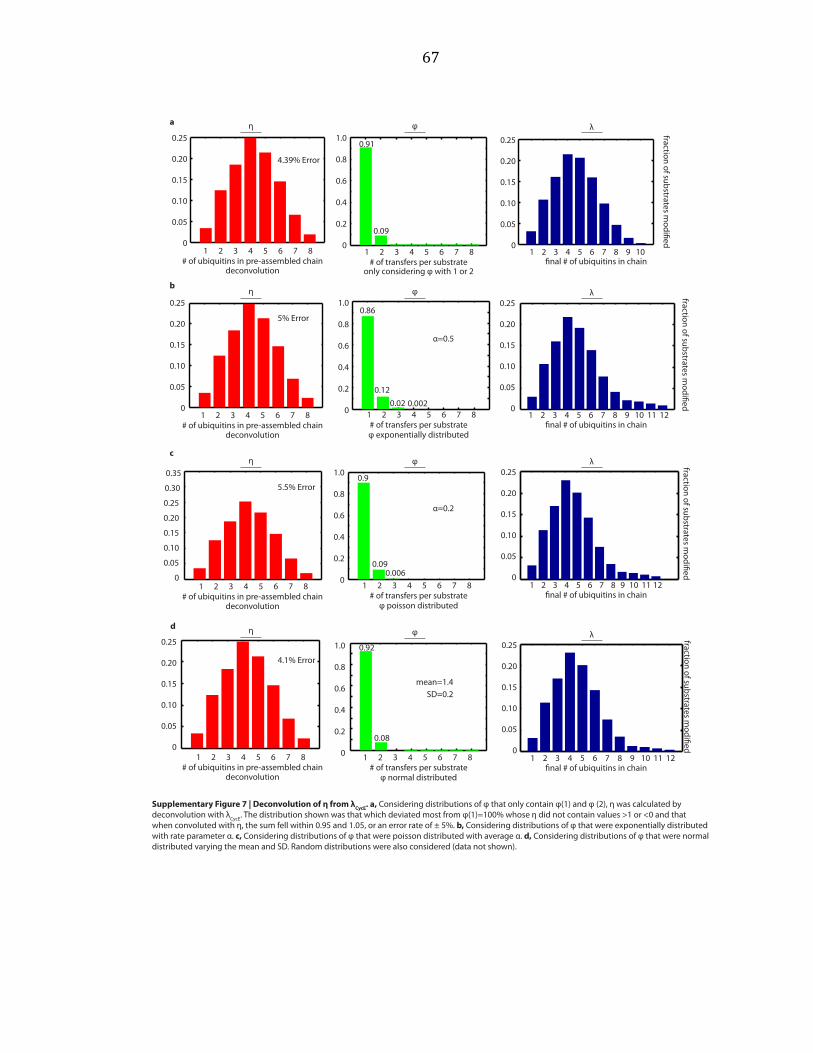
67
0.20
0.25
0.10
0.15
0
0.05
0.8
1.0
0.4
0.6
0
0.2
0.20
0.25
0.10
0.15
0
0.05
1 2 3 4 5 6 7 8 1 2 3 4 5 6 7 8 1 2 3 4 5 6 7 8 9 10
4.39% Error
! " #a
0.91
0.09
only considering " with 1 or 2
fraction of substrates modi$ed
# of ubiquitins in pre-assembled chain # of transfers per substrate $nal # of ubiquitins in chaindeconvolution
1 2 3 4 5 6 7 8 9 10 1211
5% Error0.20
0.25
0.10
0.15
0
0.05
# fraction of substrates modi$ed
$nal # of ubiquitins in chain1 2 3 4 5 6 7 8
"
# of transfers per substratedeconvolution
0.8
1.0
0.4
0.6
0
0.2
1 2 3 4 5 6 7 8
!b
0.86
0.12
# of ubiquitins in pre-assembled chain
0.02 0.002
" exponentially distributed
%=0.5
0.20
0.25
0.10
0.15
0
0.05
0.20
0.25
0.10
0.15
0
0.05
0.30
0.35
deconvolution
1 2 3 4 5 6 7 8# of ubiquitins in pre-assembled chain
1 2 3 4 5 6 7 8
"
# of transfers per substrate
0.8
1.0
0.4
0.6
0
0.2
0.9
0.090.006
" poisson distributed
%=0.2
c!
1 2 3 4 5 6 7 8 9 10 1211
5.5% Error0.20
0.25
0.10
0.15
0
0.05
# fraction of substrates modi$ed
$nal # of ubiquitins in chain
deconvolution
1 2 3 4 5 6 7 8# of ubiquitins in pre-assembled chain
1 2 3 4 5 6 7 8
"
# of transfers per substrate
0.8
1.0
0.4
0.6
0
0.2
" normal distributed
d !
1 2 3 4 5 6 7 8 9 10 1211
4.1% Error0.20
0.25
0.10
0.15
0
0.05
# fraction of substrates modi$ed
$nal # of ubiquitins in chain
0.20
0.25
0.10
0.15
0
0.05
mean=1.4SD=0.2
0.92
0.08
Supplementary Figure 7 | Deconvolution of ! from "CycE. a, Considering distributions of " that only contain "(1) and " (2), ! was calculated by deconvolution with #CycE. The distribution shown was that which deviated most from "(1)=100% whose ! did not contain values >1 or <0 and that when convoluted with !, the sum fell within 0.95 and 1.05, or an error rate of ± 5%. b, Considering distributions of " that were exponentially distributed with rate parameter %. c, Considering distributions of " that were poisson distributed with average %. d, Considering distributions of " that were normal distributed varying the mean and SD. Random distributions were also considered (data not shown).
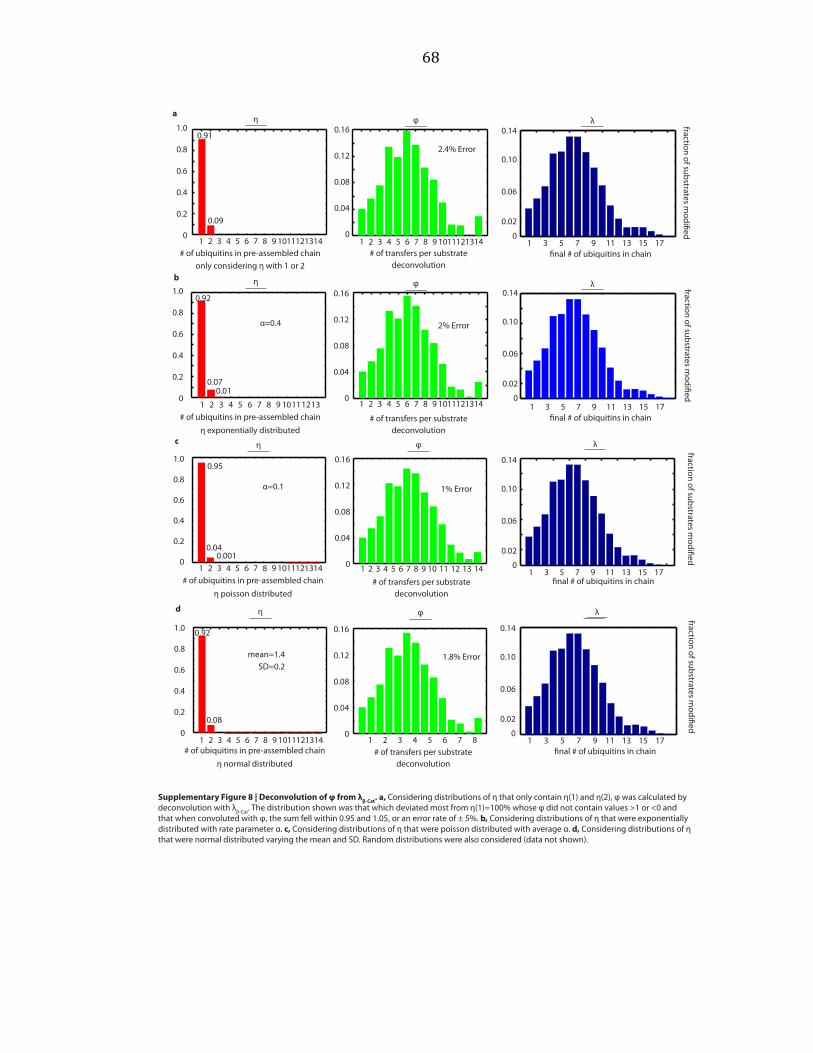
68
d
0.8
1.0
0.4
0.6
0
0.2
!nal # of ubiquitins in chain# of ubiquitins in pre-assembled chain" normal distributed
mean=1.4
0.92
0.08
1.8% Error
# of transfers per substratedeconvolution
1 2 3 4 5 6 7 8
" # $
fraction of substrates modi!ed
SD=0.2
only considering " with 1 or 2
2.4% Error0.8
1.0
0.4
0.6
0
0.2
" # $a
0.91
0.09
fraction of substrates modi!ed
# of transfers per substrate !nal # of ubiquitins in chain# of ubiquitins in pre-assembled chaindeconvolution
b
0.8
1.0
0.4
0.6
0
0.2
0.10
0.14
0.06
0
0.02
0.12
0.04
0.08
0
0.16
1 3 5 7 9 1311!nal # of ubiquitins in chain
1 2 3 4 5 6 7 8# of ubiquitins in pre-assembled chain
" exponentially distributed
%=0.4
0.92
0.070.01
2% Error
# of transfers per substratedeconvolution
" # $ fraction of substrates modi!ed
9 10111213 1 2 3 4 5 6 7 8 9 1011121314 15 17
c
0.8
1.0
0.4
0.6
0
0.2
!nal # of ubiquitins in chain# of ubiquitins in pre-assembled chain" poisson distributed
%=0.1
0.95
0.040.001
1% Error
# of transfers per substratedeconvolution
" # $
fraction of substrates modi!ed
1 2 3 4 5 6 7 8 9 1011121314
0.12
0.04
0.08
0
0.16
1 2 3 4 5 6 7 8 9 10 11 12 13 14 1 3 5 7 9 1311 15 17
0.10
0.14
0.06
0
0.02
1 2 3 4 5 6 7 8 9 1011121314 1 2 3 4 5 6 7 8 9 1011121314
0.12
0.04
0.08
0
0.16
0.10
0.14
0.06
0
0.02
1 3 5 7 9 1311 15 17
1 2 3 4 5 6 7 8 9 1011121314
0.12
0.04
0.08
0
0.16
1 3 5 7 9 1311 15 17
0.10
0.14
0.06
0
0.02
Supplementary Figure 8 | Deconvolution of ! from "#-Cat. a, Considering distributions of " that only contain "(1) and "(2), # was calculated by deconvolution with $&-Cat. The distribution shown was that which deviated most from "(1)=100% whose # did not contain values >1 or <0 and that when convoluted with #, the sum fell within 0.95 and 1.05, or an error rate of ± 5%. b, Considering distributions of " that were exponentially distributed with rate parameter %. c, Considering distributions of " that were poisson distributed with average %. d, Considering distributions of " that were normal distributed varying the mean and SD. Random distributions were also considered (data not shown).
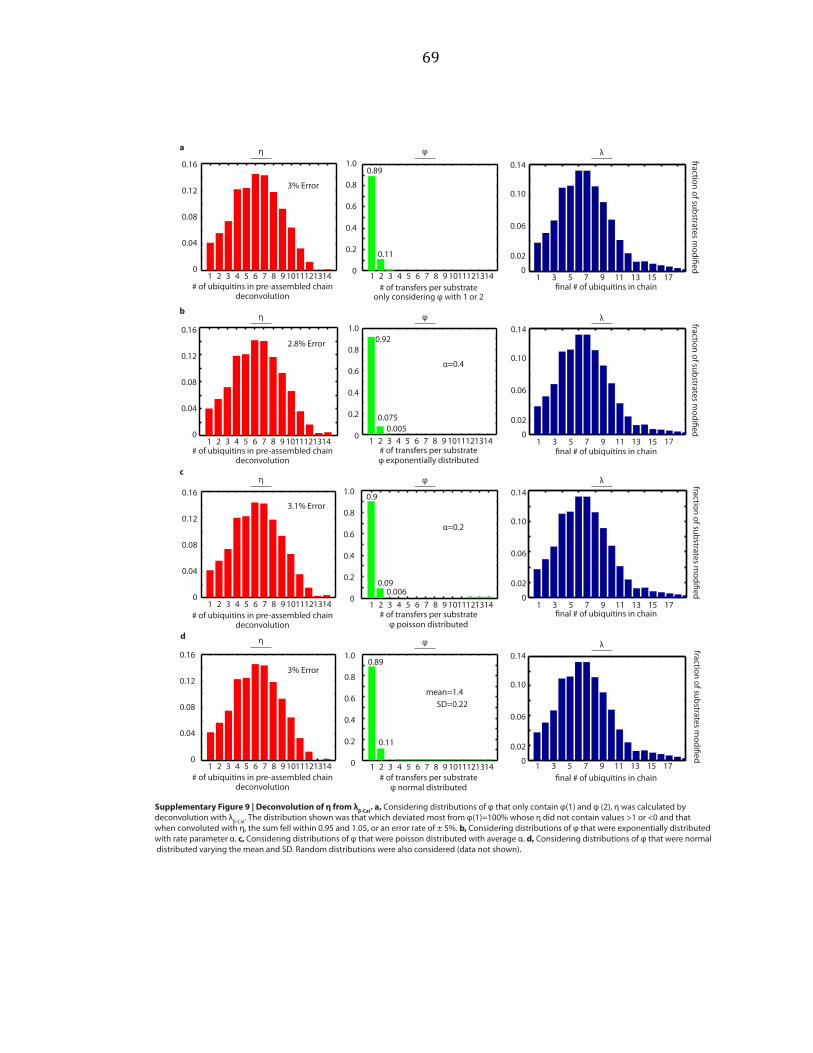
69
0.8
1.0
0.4
0.6
0
0.2
3% Error
! " #a
0.89
0.11
only considering " with 1 or 2
fraction of substrates modi$ed
# of ubiquitins in pre-assembled chain # of transfers per substrate $nal # of ubiquitins in chaindeconvolution
2.8% Error
# fraction of substrates modi$ed
$nal # of ubiquitins in chain
"
# of transfers per substratedeconvolution
0.8
1.0
0.4
0.6
0
0.2
!b
0.92
0.075
# of ubiquitins in pre-assembled chain
0.005
" exponentially distributed
%=0.4
deconvolution# of ubiquitins in pre-assembled chain
"
# of transfers per substrate
0.8
1.0
0.4
0.6
0
0.2
0.9
0.090.006
" poisson distributed
%=0.2
c!
3.1% Error
# fraction of substrates modi$ed
$nal # of ubiquitins in chain
deconvolution# of ubiquitins in pre-assembled chain
"
# of transfers per substrate
0.8
1.0
0.4
0.6
0
0.2
" normal distributed
d !
3% Error
# fraction of substrates modi$ed
$nal # of ubiquitins in chain
mean=1.4SD=0.22
0.89
0.11
1 2 3 4 5 6 7 8 9 1011121314
1 2 3 4 5 6 7 8 9 1011121314
0.12
0.04
0.08
0
0.16
1 2 3 4 5 6 7 8 9 1011121314
0.10
0.14
0.06
0
0.02
1 3 5 7 9 1311 15 17
0.12
0.04
0.08
0
0.16
1 2 3 4 5 6 7 8 9 1011121314 1 2 3 4 5 6 7 8 9 1011121314
0.10
0.14
0.06
0
0.02
1 3 5 7 9 1311 15 17
0.12
0.04
0.08
0
0.16
1 2 3 4 5 6 7 8 9 1011121314 1 2 3 4 5 6 7 8 9 1011121314
0.10
0.14
0.06
0
0.02
1 3 5 7 9 1311 15 17
0.12
0.04
0.08
0
0.16
1 2 3 4 5 6 7 8 9 1011121314
0.10
0.14
0.06
0
0.02
1 3 5 7 9 1311 15 17
Supplementary Figure 9 | Deconvolution of ! from "#-Cat. a, Considering distributions of " that only contain "(1) and " (2), ! was calculated by deconvolution with #&-Cat. The distribution shown was that which deviated most from "(1)=100% whose ! did not contain values >1 or <0 and that when convoluted with !, the sum fell within 0.95 and 1.05, or an error rate of ± 5%. b, Considering distributions of " that were exponentially distributed with rate parameter %. c, Considering distributions of " that were poisson distributed with average %. d, Considering distributions of " that were normal distributed varying the mean and SD. Random distributions were also considered (data not shown).

70
40.0 42.5 45.0 47.5 50.00
1.0x10 7
2.0x10 7
3.0x10 7
4.0x10 7
5.0x10 7Peak 1
Peak 2
Peak 3
Peak 4
Retention (min)
40.0 42.5 45.0 47.5 50.00
1.0x10 7
2.0x10 7
3.0x10 7
Peak 1
Peak 2
Peak 3
Retention (min)
Protein Mass (theoretical) Mass (measured) Abudance Peak
Ubiquitin 8565 8565 1,250,158 1
Cdc34~Ub 40,792 40,792 838,665 2
41,830 137,725 2
40,787 204,375 3
60,559 170,061 3
104,033 147,021 3
106,823 144,456 3
88,303 142,422 3
107,237 134,176 3
80,790 134,085 3
106,427 130,900 3
89,100 125,780 3
79,957 124,787 3
Protein Mass (theoretical) Mass (measured) Abudance Peak
Ubiquitin 8565 8564 1,448,614 1
Ub-DTT 8701 8701 627,263 1
Cdc34~Ub 40,792 40,789 2,267,926 2
Cdc34~Ub 40,792 40,790 1,217,040 3
Cdc34 32,245 32,242 145,616 3
Cdc34~Ub 40,792 40,788 471,765 4
Cdc34 32,245 32,243 326,504 4
60,570 176,801 4
80,775 156,325 4
79,940 153,394 4
60,129 144,097 4
61,003 116,335 4
61,460 112,311 4
59,775 103,833 4
79,121 97,101 4
a b
c
d
Supplementary Figure 10 | Mass spectrometry analysis of Cdc34. a, Chromatograms of mass spectrometry analysis of reaction containing Uba1, yeast Cdc34 and ubiquitin in the presence of ATP. Where possible, species are identi!ed and the masses are compared with the theoretical value. Peak 3 contains multiple species including Uba1 and impurities. The theoretical masses for Cdc34~Ub2 (49,338), Cdc34~Ub3 (57,886), Cdc34~Ub4 (66,433) are not observed. b, Chromatograms of mass spectrometry analysis of reaction containing Uba1, yeast Cdc34 and ubiquitin (Ub) in the presence of ATP and SCFCdc4. Where possible, species are identi!ed and the masses are compared with the theoretical value. Peak 4 contains multiple species including E1 and impurities. c, Analysis of peaks from a. d, Analysis of peaks from b.

71
40 41 42 43 44 45 460
1.0x10 7
2.0x10 7
3.0x10 7
4.0x10 7
5.0x10 7
6.0x10 7
Peak 1
Peak 2
Peak 3
Retention (min)
40 45 50 550
5.0x10 6
1.0x10 7
1.5x10 7
2.0x10 7
2.5x10 7
3.0x10 7
3.5x10 7
Peak 1
Peak 2
Peak 3
Peak 4
Retention (min)
45 46 47 48 49 500
1.0x10 6
2.0x10 6
3.0x10 6
4.0x10 6
Peak 1
Peak 2
Retention (min)
Protein Mass (theoretical) Mass (measured) Abudance Peak
Ub-DTT 8701 8701 4,004,748 1
Cdc34~Ub 40,792 40,790 856,005 2
Cdc34 32,245 32,243 2,104,438 3
Protein Mass (theoretical) Mass (measured) Abudance Peak
Di-ubiquitin 17,111 17,093 1,219,060 1
Cdc34~Ub2 49,338 49,339 358,429 2
Cdc34 32,245 32,244 1,056,240 3
Cdc34 32,245 32,243 342,426 4
114,412 141,956 4
113,442 131,956 4
55,481 113,943 4
115,141 112,219 4
55,890 111,557 4
56,788 106,226 4
112,563 87,983 4
37,546 87,790 4
44,326 81,153 4
Protein Mass (theoretical) Mass (measured) Abudance Peak
16,951 20,405 1
40,816 13,500 1
16,991 10,620 1
16,977 9,508 1
40,861 8524 1
17,008 6,772 1
41,838 6,612 1
40,900 6,249 1
36,023 6,204 1
78,867 6,008 1
109,318 20,828 2
109,554 20,484 2
98,618 19,802 2
66,153 18,346 2
61,032 18,301 2
88,227 17,086 2
37,291 15,688 2
52,670 15,672 2
64,288 15,270 2
80,111 15,003 2
a b
d
e
c
f

72
Supplementary Figure 11 | Mass spectrometry analysis of Cdc34 controls. a, Chromatograms of mass spectrometry analysis of reaction containing E1, Cdc34 and ubiquitin (Ub) in the presence of ATP, SCF and DTT. Where possible, species are identi!ed and the masses are compared with the theoretical value. b, Chromatograms of mass spectrometry analysis of reaction containing E1, Cdc34 and K48 di-ubiquitin in the presence of ATP. Where possible, species are identi!ed and the masses are compared with the theoretical value. Peak 4 contains multiple species including E1 and impurities. c, Chromatograms of mass spectrometry analysis of SCFCdc4 in reaction bu"er. d, Analysis of peaks from a. e, Analysis of peaks from b. f, Analysis of peaks from c.

73
00.01
0.030.02
0.050.07 0.20.1 0.3 0.4 0.5 0.70.6 0.8 0.9
1 -
2 -
3 -4 -* -
1 2 43 5 6 87 912.5 15 30201.5 Time (sec)
- CycE
- 1
- 2
- 3
- 4- 5- 6- 8
10 0.9
S1
S2
S3
S4
S5
S6
S7
S8
b
a
5
1%
2%
3%
4%
0%
5%
6%
43210Time (sec)
% o
f Ini
tial [
CycE
*]
c
S1
S2
S3
S4
S5
S6
S7
S8
S9
S10
S11
S12
S13
S14
0.1%
0.2%
0.3%
0.4%
0%
0.5%
0.6%
% o
f Ini
tial [!-
Cat]
543210Time (sec)
Supplementary Figure 12 | Millisecond kinetics of a single encounter reaction. a, Samples from the same reaction shown in Fig. 2a were run on a 12-24% tricine gel to optimize detection and quanti"cation of S2 and S5. The asterisk marks an unreactive contaminant of the labeled CycE. b, A zoomed plot of Fig. 3b up to 5 seconds. The error of each "t is shown in Supplementary Figure 14. c, A zoomed plot of Fig. 3e up to 5 seconds. The error of each "t is shown in Supplementary Figure 15.

74
61.5k2(1-
k1+k2)e-(k1+k2)t + 61.5
k2
k1+k2
+ (100-61.5)[S0] =
Analytical Closed Form Solutions
61.5 k1( (k3+k4)-(k1+k2) )e-(k1+k2)t[S1]Total = (k1+k2)-(k3+k4)
e-(k3+k4)t+ + 61.5
k1
k1+k2
k4
k3+k4( () )(1- (k3+k4)-(k1+k2)
(k3+k4)e-(k1+k2)t )(k1+k2)-(k3+k4)(k1+k2)e-(k3+k4)t
-
[S2]Total = 61.5 k1k3( ((k3+k4)-(k1+k2))((k5+k6)-(k1+k2)) )e-(k1+k2)t
((k1+k2)-(k3+k4))((k5+k6)-(k3+k4))e-(k3+k4)t
+((k1+k2)-(k5+k6))((k3+k4)-(k5+k6))
e-(k5+k6)t+
+ 61.5k1
k1+k2
k3
k3+k4( () ) (1-
(k3+k4)(k5+k6)e -(k1+k2)t )-k6
k5+k6( ) ((k3+k4)-(k1+k2))((k5+k6)-(k1+k2)) ((k1+k2)-(k3+k4))((k5+k6)-(k3+k4)) ((k1+k2)-(k5+k6))((k3+k4)-(k5+k6))
-(k1+k2)(k3+k4)e -(k5+k6)t(k1+k2)(k5+k6)e -(k3+k4)t
[Sn/2]Total = 61.5k1k3...kn-1( ((k3+k4)-(k1+k2))((k5+k6)-(k1+k2))...((kn-1+kn)-(k1+k2))
)
e-(k1+k2)t
((k1+k2)-(k3+k4))((k5+k6)-(k3+k4))...((kn-1+kn)-(k3+k4))e-(k3+k4)t
+
((k1+k2)-(kn-1+kn))((k3+k4)-(kn-1+kn))...((kn-3+kn-2)-(kn-1+kn))
e-(kn-1+kn)t+...+
+ 61.5k1
k1+k2
k3
k3+k4( () ) (1-
(k3+k4)(k5+k6)...(kn-1+kn)e-(k1+k2)t-
kn
kn-1+kn( )...
((k3+k4)-(k1+k2))((k5+k6)-(k1+k2))...((kn-1+kn)-(k1+k2)) ((k1+k2)-(k3+k4))((k5+k6)-(k3+k4))...((kn-1+kn)-(k3+k4))
(k1+k2)(k5+k6)...(kn-1+kn)e-(k3+k4)t
((k1+k2)-(kn-1+kn))((k3+k4)-(kn-1+kn))...((kn-3+kn-2)-(kn-1+kn))
(k1+k2)(k3+k4)...(kn-3+kn-2)e-(kn-1+kn)t- )
[SCF:S0] = 61.5% at t=0
S0:SCF S1:SCF S2:SCF
S0 + SCF S1 + SCF
k1 k3
k2 k4
S3:SCF S4:SCF
S2 + SCF S3 + SCF
k5 k7
k6 k8
S5:SCF
S4 + SCF S5 + SCF
k9 k11
k10 k12
S6:SCF S7:SCF
S6 + SCF S7 + SCF
k13
k14 k16
S8:SCF
S8 + SCF
k15
k18
Supplementary Figure 13 | Closed form solutions to a kinetic model of a single encounter reaction with !(1)=100%. The analytical solutions were calculated using the method of Laplace transforms. Each new species contributed two new rate constants to the overall scheme.
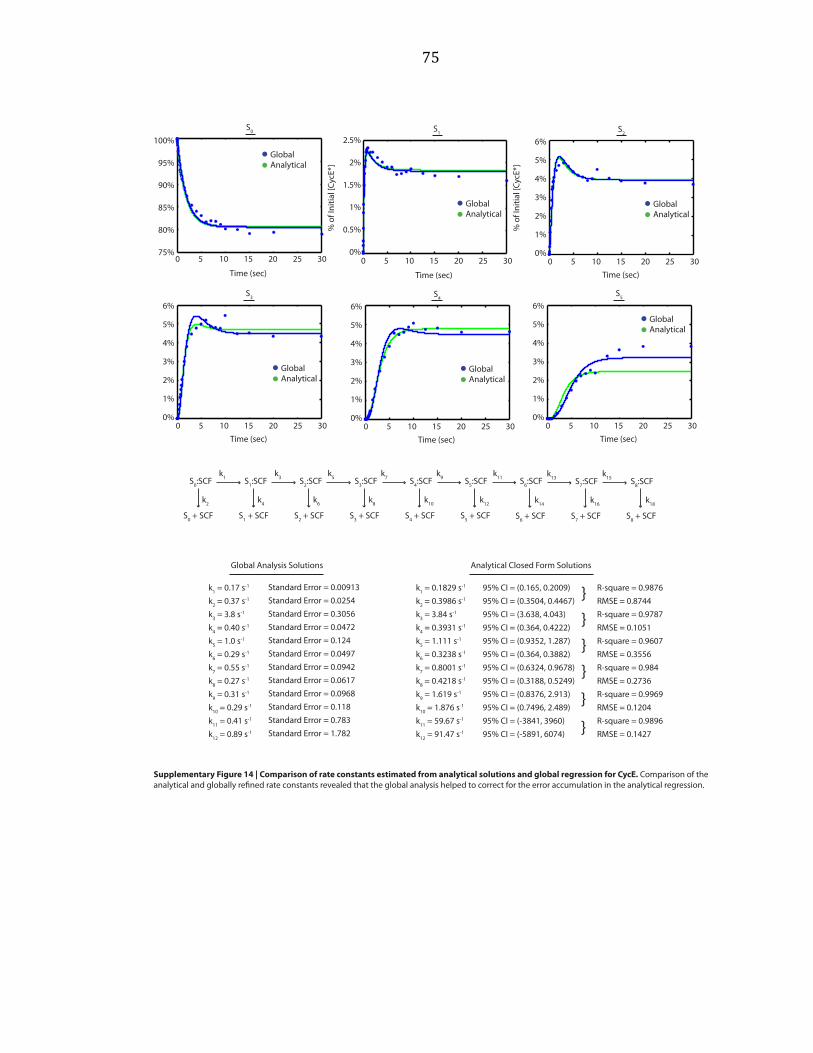
75
0 5 10 15 20 25 3075%
80%
90%
95%
100%
85%
AnalyticalGlobal
% o
f Ini
tial [
CycE
*]
Time (sec)
S0
k2 = 0.3986 s-1
k1 = 0.1829 s-1 R-square = 0.9876RMSE = 0.8744
95% CI = (0.165, 0.2009)95% CI = (0.3504, 0.4467)
k4 = 0.3931 s-1
k3 = 3.84 s-1 R-square = 0.9787RMSE = 0.1051
95% CI = (3.638, 4.043)95% CI = (0.364, 0.4222)
0 5 10 15 20 25 30
Time (sec)
% o
f Ini
tial [
CycE
*]
0%
0.5%
1.5%
2%
2.5%
1%
S1
AnalyticalGlobal
k6 = 0.3238 s-1
k5 = 1.111 s-1 R-square = 0.9607RMSE = 0.3556
95% CI = (0.9352, 1.287)95% CI = (0.364, 0.3882)
0%
1%
3%
4%
5%
2%
6%
0 5 10 15 20 25 30Time (sec)
S2
AnalyticalGlobal
k8 = 0.4218 s-1
k7 = 0.8001 s-1 R-square = 0.984RMSE = 0.2736
95% CI = (0.6324, 0.9678)95% CI = (0.3188, 0.5249)
0%
1%
3%
4%
5%
2%
6%
0 5 10 15 20 25 30Time (sec)
S3
AnalyticalGlobal
}
}
}}
k10 = 1.876 s-1
k9 = 1.619 s-1 R-square = 0.9969RMSE = 0.1204
95% CI = (0.8376, 2.913)95% CI = (0.7496, 2.489)
}
0%
1%
3%
4%
5%
2%
6%
0 5 10 15 20 25 30Time (sec)
S4
AnalyticalGlobal
k12 = 91.47 s-1
k11 = 59.67 s-1 R-square = 0.9896RMSE = 0.1427
95% CI = (-3841, 3960)95% CI = (-5891, 6074) }
0%
1%
3%
4%
5%
2%
6%
0 5 10 15 20 25 30Time (sec)
S5
AnalyticalGlobal
S0:SCF S1:SCF S2:SCF
S0 + SCF S1 + SCF
k1 k3
k2 k4
S3:SCF S4:SCF
S2 + SCF S3 + SCF
k5 k7
k6 k8
S5:SCF
S4 + SCF S5 + SCF
k9 k11
k10 k12
S6:SCF S7:SCF
S6 + SCF S7 + SCF
k13
k14 k16
S8:SCF
S8 + SCF
k15
k18
Analytical Closed Form Solutions
k2 = 0.37 s-1
k1 = 0.17 s-1
k4 = 0.40 s-1
k3 = 3.8 s-1
k6 = 0.29 s-1
k5 = 1.0 s-1
k8 = 0.27 s-1
k7 = 0.55 s-1
k10 = 0.29 s-1
k9 = 0.31 s-1
k12 = 0.89 s-1
k11 = 0.41 s-1
Global Analysis Solutions
Standard Error = 0.00913Standard Error = 0.0254Standard Error = 0.3056Standard Error = 0.0472Standard Error = 0.124Standard Error = 0.0497Standard Error = 0.0942Standard Error = 0.0617Standard Error = 0.0968Standard Error = 0.118Standard Error = 0.783Standard Error = 1.782
Supplementary Figure 14 | Comparison of rate constants estimated from analytical solutions and global regression for CycE. Comparison of the analytical and globally re!ned rate constants revealed that the global analysis helped to correct for the error accumulation in the analytical regression.

76
0 5 10 15 20 25 3095%
96%
98%
99%
100%
97%
AnalyticalGlobal
% o
f Ini
tial [!-
Cat*
]
Time (sec)
S0
k2 = 0.3463 s-1
k1 = 0.02839 s-1 R-square = 0.9634RMSE = 0.2822
95% CI = (0.02413, 0.03266)95% CI = (0.2797, 0.413)
k4 = 0.1926 s-1
k3 = 4.098 s-1 R-square = 0.9112RMSE = 0.0256
95% CI = (3.757, 4.44)95% CI = (0.1628, 0.2224)
0 5 10 15 20 25 30
Time (sec)
% o
f Ini
tial [!-
Cat*
]
0%
0.05%
0.15%
0.25%
0.35%
0.1%
S1
AnalyticalGlobal
k6 = 0.1926 s-1
k5 = 5.849 s-1 R-square = 0.8988RMSE = 0.03
95% CI = (4.942, 6.755)95% CI = (0.3149, 0.479)
0 5 10 15 20 25 30Time (sec)
S2
AnalyticalGlobal
k8 = 0.4682 s-1
k7 = 4.278 s-1 R-square = 0.9488RMSE = 0.03099
95% CI = (3.614, 4.943)95% CI = (0.3779, 0.5585)
0 5 10 15 20 25 30Time (sec)
S3
AnalyticalGlobal
}
}
}}
k10 = 0.5024 s-1
k9 = 2.927 s-1 R-square = 0.9209RMSE = 0.05625
95% CI = (2.092, 3.763)95% CI = (0.3304, 0.6743)
}
0 5 10 15 20 25 30Time (sec)
S4
AnalyticalGlobal
S0:SCF S1:SCF S2:SCF
S0 + SCF S1 + SCF
k1 k3
k2 k4
S3:SCF S4:SCF
S2 + SCF S3 + SCF
k5 k7
k6 k8
S5:SCF
S4 + SCF S5 + SCF
k9 k11
k10 k12
S6:SCF S7:SCF
S6 + SCF S7 + SCF
k13
k14 k16
S8:SCF
S8 + SCF
k15
k18
Analytical Closed Form Solutions
k2 = 0.363 s-1
k1 = 0.03 s-1
k4 = 0.171 s-1
k3 = 3.58 s-1
k6 = 0.265 s-1
k5 = 4.45 s-1
k8 = 0.315 s-1
k7 = 3.22 s-1
k10 = 0.275 s-1
k9 = 2 s-1
k12 = 0.372 s-1
k11 = 1.63 s-1
Global Analysis Solutions
Standard Error = 0.00261Standard Error = 0.0313Standard Error = 0.627Standard Error = 0.0299Standard Error = 1.1Standard Error = 0.0658Standard Error = 0.802Standard Error = 0.0786Standard Error = 0.481Standard Error = 0.0661Standard Error = 0.420Standard Error = 0.0959
k14 = 0.395 s-1
k13 = 1.21 s-1 Standard Error = 0.382Standard Error = 0.125
k16 = 0.467 s-1
k15 = 1.01 s-1 Standard Error = 0.571Standard Error = 0.241
0.3%
0.2%
0%
0.05%
0.15%
0.25%
0.35%
0.1%
0.3%
0.2%
0%
0.05%
0.15%
0.25%
0.35%
0.1%
0.3%
0.2%
0.4%
0%
0.5%
0.6%
0.1%
0.3%
0.2%
0.4%
Supplementary Figure 15 | Comparison of rate constants estimated from analytical solutions and global regression for !-Cat. Comparison of the analytical and globally re"ned rate constants revealed that the global analysis helped to correct for the error accumulation in the analytical regression. The error for the !-Cat regressions are higher versus the CycE regression because of reduced fraction of substrate converted.
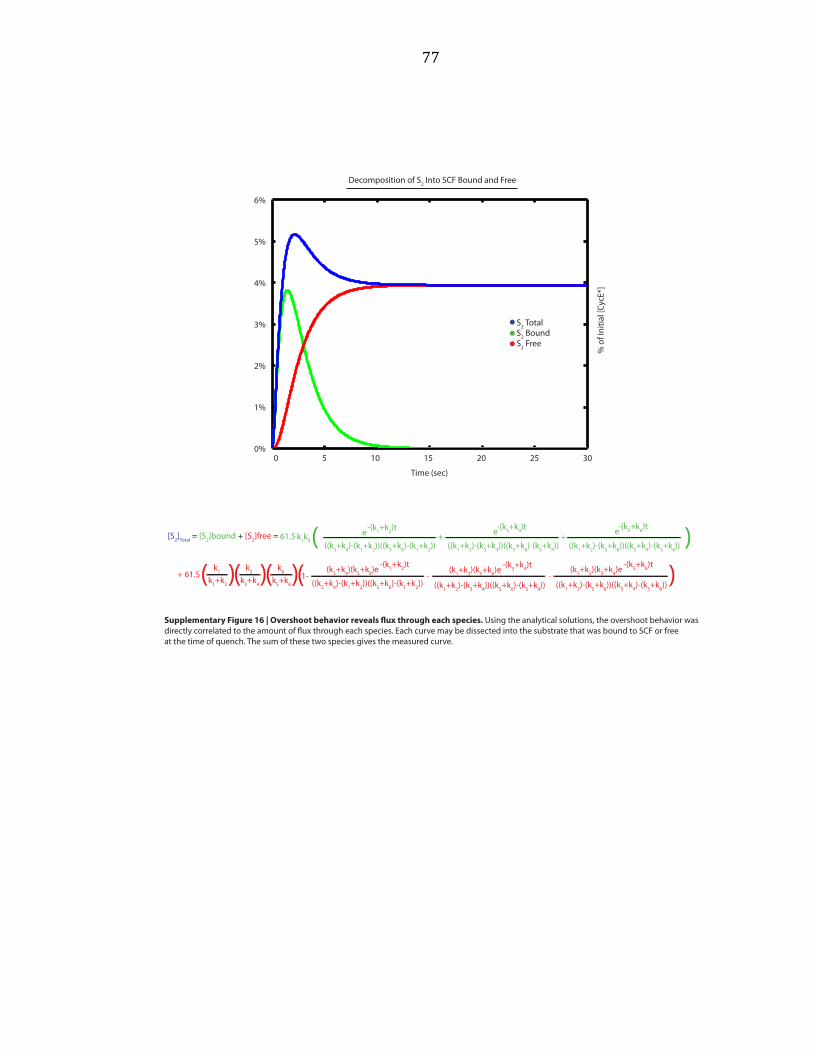
77
0 5 10 15 20 25 30
Time (sec)
% o
f Ini
tial [
CycE
*]
1%
2%
4%
5%
6%
3%
0%
[S2]Total = [S2]bound + [S2]free = 61.5 k1k3( ((k3+k4)-(k1+k2))((k5+k6)-(k1+k2)) )e-(k1+k2)t
((k1+k2)-(k3+k4))((k5+k6)-(k3+k4))e-(k3+k4)t
+((k1+k2)-(k5+k6))((k3+k4)-(k5+k6))
e-(k5+k6)t+
+ 61.5k1
k1+k2
k3
k3+k4( () ) (1-
(k3+k4)(k5+k6)e -(k1+k2)t )-k6
k5+k6( ) ((k3+k4)-(k1+k2))((k5+k6)-(k1+k2)) ((k1+k2)-(k3+k4))((k5+k6)-(k3+k4)) ((k1+k2)-(k5+k6))((k3+k4)-(k5+k6))
-(k1+k2)(k3+k4)e -(k5+k6)t(k1+k2)(k5+k6)e -(k3+k4)t
Decomposition of S2 Into SCF Bound and Free
S2 BoundS2 Total
S2 Free
Supplementary Figure 16 | Overshoot behavior reveals !ux through each species. Using the analytical solutions, the overshoot behavior was directly correlated to the amount of !ux through each species. Each curve may be dissected into the substrate that was bound to SCF or free at the time of quench. The sum of these two species gives the measured curve.
78
Appendix B: Supplementary Materials for Chapter 3
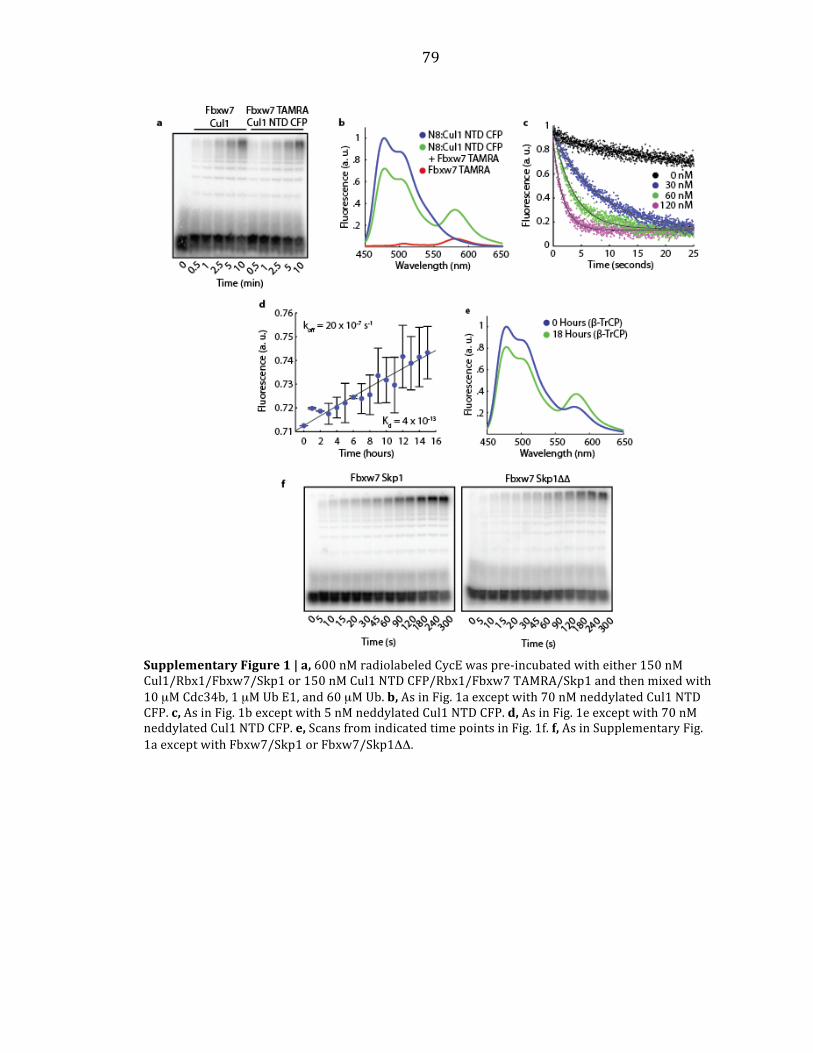
79
Supplementary Figure 1 | a, 600 nM radiolabeled CycE was pre-‐incubated with either 150 nM Cul1/Rbx1/Fbxw7/Skp1 or 150 nM Cul1 NTD CFP/Rbx1/Fbxw7 TAMRA/Skp1 and then mixed with 10 µM Cdc34b, 1 µM Ub E1, and 60 µM Ub. b, As in Fig. 1a except with 70 nM neddylated Cul1 NTD CFP. c, As in Fig. 1b except with 5 nM neddylated Cul1 NTD CFP. d, As in Fig. 1e except with 70 nM neddylated Cul1 NTD CFP. e, Scans from indicated time points in Fig. 1f. f, As in Supplementary Fig. 1a except with Fbxw7/Skp1 or Fbxw7/Skp1ΔΔ.
80
Bibliography
Bai C, Sen P, Hofmann K, Ma L, Goebl M, Harper JW, Elledge SJ (2006). SKP1 connects cell cycle regulators to the ubiquitin proteolysis machinery through a novel motif, the F-‐box. Cell. 86(2):263-‐74.
Bennett EJ, Rush J, Gygi SP, Harper JW (2010). Dynamics of cullin-‐RING ubiquitin
ligase network revealed by systematic quantitative proteomics. Cell. 143(6):951-‐65.
Chau V, Tobias JW, Bachmair A, Marriott D, Ecker DJ, Gonda DK, Varshavsky A
(1989). A multiubiquitin chain is confined to specific lysine in a targeted short-‐lived protein. Science. 243(4898):1576-‐83.
Chuang HW, Zhang W, Gray WM (2004). Arabidopsis ETA2, an apparent ortholog of
the human cullin-‐interacting protein CAND1, is required for auxin responses mediated by the SCF(TIR1) ubiquitin ligase. Plant Cell. 16(7):1883-‐97.
Ciehanover A, Hod Y, Hershko A. (1978) A heat-‐stable polypeptide component of an
ATP-‐dependent proteolytic system from reticulocytes. Biochem Biophys Res Commun. 81(4):1100-‐5.
Cope GA, Deshaies RJ (2002). COP9 signalosome: a multifunctional regulator of SCF
and other cullin-‐based ubiquitin ligases. Cell. 114(6):663-‐71. Deng L, Wang C, Spencer E, Yang L, Braun A, You J, Slaughter C, Pickart C, Chen ZJ
(2000). Activation of the IkappaB kinase complex by TRAF6 requires a dimeric ubiquitin-‐conjugating enzyme complex and a unique polyubiquitin chain. Cell. 103(2):351-‐61.
Deshaies RJ, Joazeiro CA (2009). RING domain E3 ubiquitin ligases. Annu Rev
Biochem. 78: 399-‐434. Duda DM, Borg LA, Scott DC, Hunt HW, Hammel M, Schulman BA (2008). Structural
insights into NEDD8 activation of cullin-‐RING ligases: conformational control of conjugation. Cell. 134(6):995-‐1006.
Dye BT, Schulman BA (2007). Structural mechanisms underlying posttranslational
modification by ubiquitin-‐like proteins. Annual Review of Biophysics and Biomolecular Structure. 36: 131-‐50.
Feldman RM, Correll CC, Kaplan KB, Deshaies RJ (1997). A complex of Cdc4p, Skp1p,
and Cdc53p/cullin catalyzes ubiquitination of the phosphorylated CDK inhibitor Sic1p. Cell. 91: 221-‐30.

81
Feng S, Shen Y, Sullivan JA, Rubio V, Xiong Y, Sun TP, Deng XW (2004). Arabidopsis CAND1, an unmodified CUL1-‐interacting protein, is involved in multiple developmental pathways controlled by ubiquitin/proteasome-‐mediated protein Degradation. Plant Cell. 16(7):1870-‐82.
Fersht, A. (1999). Structure And Mechanism In Protein Science: A Guide To Enzyme
Catalysis And Protein Folding. New York: W. H. Freeman and Company. Goldenberg SJ, Cascio TC, Shumway SD, Garbutt KC, Liu J, Xiong Y, Zheng N (2004).
Structure of the Cand1-‐Cul1-‐Roc1 complex reveals regulatory mechanisms for the assembly of the multisubunit cullin-‐dependent ubiquitin ligases. Cell. 119(4):517-‐28.
Goldknopf IL, Busch H. (1977). Isopeptide linkage between nonhistone and histone
2A polypeptides of chromosomal conjugate-‐protein A24. Proc Natl Acad Sci U S A. 74(3):864-‐8.
Goldstein G, Scheid M, Hammerling U, Schlesinger DH, Niall HD, Boyse EA. (1975).
Isolation of a polypeptide that has lymphocyte-‐differentiating properties and is probably represented universally in living cells. Proc Natl Acad Sci U S A. 72(1):11-‐5
Haas AL, Warms JV, Hershko A, Rose IA. (1982). Ubiquitin-‐activating enzyme.
Mechanism and role in protein-‐ubiquitin conjugation. J Biol Chem. 10;257(5):2543-‐8.
Hershko A, Ciechanover A, Heller H, Haas AL, Rose IA. (1980). Proposed role of ATP
in protein breakdown: conjugation of protein with multiple chains of the polypeptide of ATP-‐dependent proteolysis. Proc Natl Acad Sci U S A. 1980 Apr;77(4):1783-‐6.
Hershko A, Ciechanover A, Rose IA. (1981). Identification of the active amino acid
residue of the polypeptide of ATP-‐dependent protein breakdown. J Biol Chem. 256(4):1525-‐8.
Hochstrasser, M. (2006). Lingering Mysteries of Ubiquitin-‐Chain Assembly. Cell. 124:
27-‐34. Jin J, Li X, Gygi SP, Harper JW. (2007) Dual E1 activation systems for ubiquitin
differentially regulate E2 enzyme charging. Nature. 447(7148):1135-‐8. Jin L, Williamson A, Banerjee S, Philipp I, Rape M (2008). Mechanism of ubiquitin-‐
chain formation by the human anaphase-‐promoting complex. Cell. 133(4):653-‐65.
82
Kamura T, Conrad MN, Yan Q, Conaway RC, Conaway JW. (1999). The Rbx1 subunit of SCF and VHL E3 ubiquitin ligase activates Rub1 modification of cullins Cdc53 and Cul2. Genes & Development. 13: 2928-‐2933.
Kati WM, Johnson KA, Jerva LF, Anderson KS. (1992). Mechanism and fidelity of HIV
reverse transcriptase. J Biol Chem. 267: 25988-‐97. Kleiger G, Saha A, Lewis S, Kuhlman B, Deshaies RJ (2009). Rapid E2-‐E3 assembly
and disassembly enable processive ubiquitylation of cullin-‐RING ubiquitin ligase substrates. Cell. 139(5):957-‐68.
Lee JE, Sweredoski MJ, Graham RL, Kolawa NJ, Smith GT, Hess S, Deshaies RJ (2011).
The steady-‐state repertoire of human SCF ubiquitin ligase complexes does not require ongoing Nedd8 conjugation. Mol Cell Proteomics. 10(5):M110.006460.
Li W, Tu D, Brunger AT, Ye Y. (2007). A ubiquitin ligase transfers preformed
polyubiquitin chains from a conjugating enzyme to a substrate. Nature. 446: 333-‐337.
Li W, Tu D, Li L, Wollert T, Ghirlando R, Brunger AT, Ye Y. (2009). Mechanistic
insights into active site-‐associated polyubiquitination by the ubiquitin-‐conjugating enzyme Ube2g2. Proc Natl Acad Sci USA. 106: 3722-‐7.
Liu J, Furukawa M, Matsumoto T, Xiong Y (2002). NEDD8 modification of CUL1
dissociates p120(CAND1), an inhibitor of CUL1-‐SKP1 binding and SCF ligases. Mol Cell. 10(6):1511-‐8.
Lo SC, Hannink M (2006). CAND1-‐mediated substrate adaptor recycling is required
for efficient repression of Nrf2 by Keap1. Mol Cell Biol. 26(4):1235-‐44. Nash P, Tang X, Orlicky S, Chen Q, Gertler FB, Mendenhall MD, Sicheri F, Pawson T,
Tyers M. (2001). Multisite phosphorylation of a CDK inhibitor sets a threshold for the onset of DNA replication. Nature. 414: 514-‐21.
Orlicky S, Tang X, Willems A, Tyers M, Sicheri F. (2003). Structural basis for
phosphodependent substrate selection and orientation by the SCFCdc4 ubiquitin ligase. Cell. 112: 243-‐56.
Petroski MD, Deshaies RJ (2005a). Function and regulation of cullin–RING ubiquitin
ligases. Nat Rev Mol Cell Biol. 6: 9-‐20. Petroski MD, Deshaies RJ (2005b). Mechanism of Lysine 48-‐Linked Ubiquitin-‐Chain
Synthesis by the Cullin-‐RING Ubiquitin-‐Ligase Complex SCF-‐Cdc34. Cell. 123: 1107-‐1120.

83
Petroski MD, Deshaies RJ (2005c). In Vitro Reconstitution of SCF Substrate Ubiquitination with Purified Proteins. Methods in Enzymology. 398: 143-‐158.
Petroski MD, Kleiger G, Deshaies RJ. (2006). Evaluation of a Diffusion-‐Driven Mechanism for Substrate Ubiquitination by the SCF-‐Cdc34 Ubiquitin Ligase Complex. Molecular Cell. 24: 523-‐534.
Pierce NW, Kleiger G, Shan SO, Deshaies RJ (2009). Detection of sequential
polyubiquitylation on a millisecond timescale. Nature. 462(7273):615-‐9. Popp MW, Antos JM, Ploegh HL (2009). Site-‐specific protein labeling via sortase-‐
mediated transpeptidation. Curr Protoc Protein Sci. Chapter 15:Unit 15.3. Ravid, T. and M. Hochstrasser (2007). Autoregulation of an E2 enzyme by ubiquitin-‐
chain assembly on its catalytic residue. Nat Cell Biol. 9: 422-‐427. Saha A, Deshaies RJ (2008). Multimodal Activation of the Ubiquitin Ligase SCF by
Nedd8 Conjugation. Mol Cell. 32: 21-‐31. Schmidt MW, McQuary PR, Wee S, Hofmann K, Wolf DA (2009). F-‐box-‐directed CRL
complex assembly and regulation by the CSN and CAND1. Mol Cell. 35(5):586-‐97.
Schoenheimer R, Ratner S, Rittenberg D. (1939). Studies in Protein Metabolism: X.
The Metabolic Activity of Body Proteins Investigated with l (-‐)-‐Leucine Containing Two Isotopes. J Biol Chem. 130, 703–732.
Schulman BA, Carrano AC, Jeffrey PD, Bowen Z, Kinnucan ER, Finnin MS, Elledge SJ,
Harper JW, Pagano M, Pavletich NP (2000). Insights into SCF ubiquitin ligases from the structure of the Skp1-‐Skp2 complex. Nature. 408(6810):381-‐6.
Siergiejuk E, Scott DC, Schulman BA, Hofmann K, Kurz T, Peter M (2009). Cullin
neddylation and substrate-‐adaptors counteract SCF inhibition by the CAND1-‐like protein Lag2 in Saccharomyces cerevisiae. EMBO J. 28(24):3845-‐56.
Strohmaier H, Spruck CH, Kaiser P, Won KA, Sangfelt O, Reed SI. (2001). Human F-‐
box protein hCdc4 targets cyclin E for proteolysis and is mutated in a breast cancer cell line. Nature. 413: 316-‐22.
Thrower JS, Hoffman L, Rechsteiner M, Pickart CM. (2000). Recognition of the
polyubiquitin proteolytic signal. EMBO J. 19: 94-‐102. VanDemark AP, Hofmann RM, Tsui C, Pickart CM, Wolberger C (2001). Molecular
insights into polyubiquitin chain assembly: crystal structure of the Mms2/Ubc13 heterodimer. Cell. 105(6):711-‐20.
84
Wilkinson KD, Urban MK, Haas AL. (1980). Ubiquitin is the ATP-‐dependent proteolysis factor I of rabbit reticulocytes. J Biol Chem. Aug 25;255(16):7529-‐32.
Zhang W, Ito H, Quint M, Huang H, Noël LD, Gray WM (2008). Genetic analysis of
CAND1-‐CUL1 interactions in Arabidopsis supports a role for CAND1-‐mediated cycling of the SCFTIR1 complex. Proc Natl Acad Sci U S A. 105(24):8470-‐5.
Zheng J, Yang X, Harrell JM, Ryzhikov S, Shim EH, Lykke-‐Andersen K, Wei N, Sun H,
Kobayashi R, Zhang H (2002). CAND1 binds to unneddylated CUL1 and regulates the formation of SCF ubiquitin E3 ligase complex. Mol Cell. 10(6):1519-‐26.


