Markets, Policy and Impacts ICRISAT
Progress Report - 130
Salient features of village economies in the Semi-Arid Tropics (SAT) of India
KPC Rao, VK Chopde, Y Mohan Rao and
D Kumaracharyulu
ICRISAT
International Crops Research Institute For the Semi-Arid Tropics
June 2005
1
Table of Contents
Page Introduction 1
Changes in Population Characteristics 3
Occupational distribution 4
Details of Land Ownership 5
Operated area 6
Livestock Ownership 8
Cropping Patterns 11
Major Production Constraints in rainfed crops 16
Utilization of farm produce 19
Economics of Crop Enterprises 21
Crop economics as per the farm management concepts 27
Comparison of crop economics with the seventies 32
Economics of milk production in VLS villages 33
Economics of maintaining draft animals 35
Economics of small ruminants in VLS villages 36
Changes in the composition of net household income in VLS villages 39
Consumption expenditures and nutritional standards 41
Labour market participation and wages 44
Perceived benefits from soil conservation works 48
Perceptions of respondents about climate changes 52
Conclusions 54
References 57
2
Salient Features of Village Economies in the Semi-Arid Tropics (SAT) of
India K P C Rao, V K Chopde, Y Mohan Rao and D Kumaracharyulu
Introduction
India’s famed green revolution has largely bypassed the dry, semi-arid tropics (SAT). Regions
such as India’s SAT, with comparatively limited potential for agricultural growth but with rapid
population growth, pose difficult problems for an agricultural – based strategy of rural
development. Village Level Studies (VLS) of ICRISAT, which commenced in 1975, studied
three contrasting dryland regions based on the criteria of climate, soils and cropping patterns:
The Telengana region in Andhra Pradesh, the western Maharashtra (Bombay Deccan) and
Vidarbha region, also in Maharashtra. Two villages were selected carefully to represent each of
these regions: Aurepalle and Dokur (Mahaboobnagar), Shirapur and Kalman (Solapur) and
Kanzara and Kinkheda (Akola). These six villages were studied during the period 1975-76 to
1984-85, tracking them by monitoring 40 sample households from each of these six villages
using cost-accounting method. The sample of 40 households was divided equally between the
landless, small, medium and large farmers categories. Among the six villages, Aurepalle,
Shirapur and Kanzara were studied even more intensively on a regular basis by complementing
the regular data collection with several special purpose surveys. This longitudinal database, by
virtue of its quality and richness, attracted several researchers all over the world and formed
basis for a number of publications. It was rated as an International Public Good (IPG) by the
World Bank.
Several changes swept through the semi-arid tropics of India over the 17 years period
between 1984-85, when the first generation VLS was suspended and 2001-02, when the second
generation VLS surveys were resumed. Globalization of agricultural markets, deepening
resource crisis (in terms of land degradation and water depletion), growing population and
integration of labour markets have changed the livelihood options and living standards of the
rural people in the SAT. In order to accommodate the emerging areas of interest, new modules
were added on livestock enterprise economics; natural resource development and water
exploration investments; migration; benefits received from the Government programmes etc. In
3
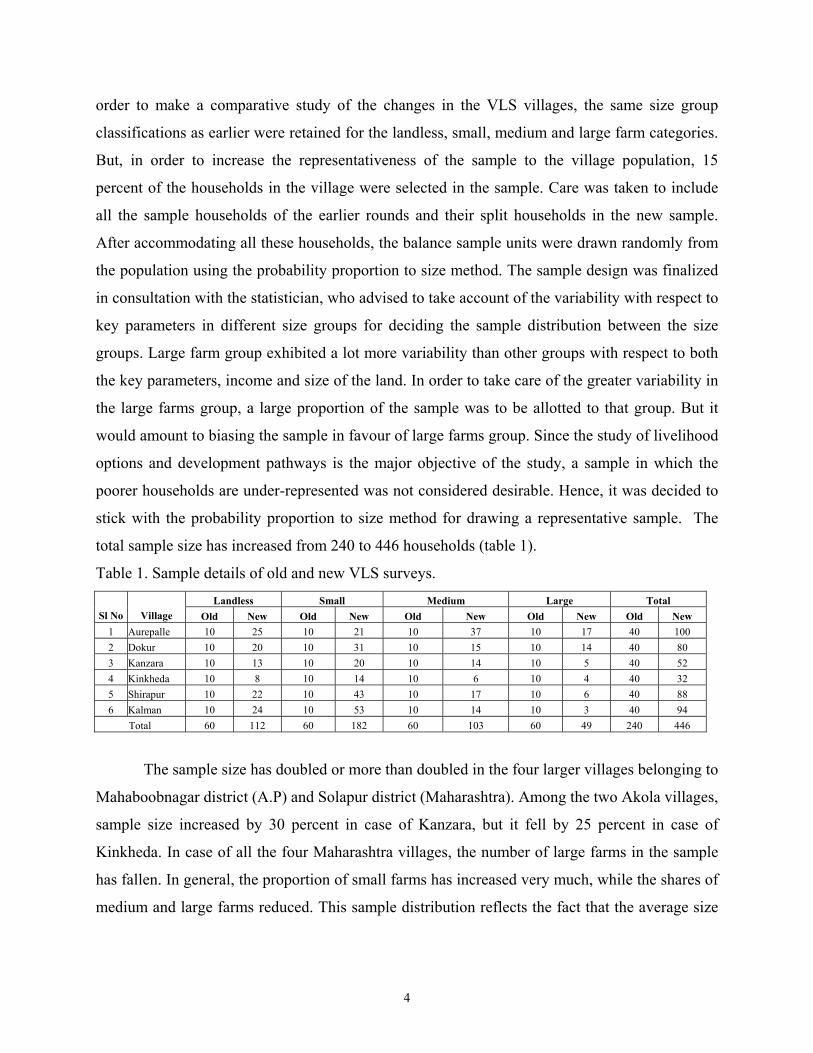
order to make a comparative study of the changes in the VLS villages, the same size group
classifications as earlier were retained for the landless, small, medium and large farm categories.
But, in order to increase the representativeness of the sample to the village population, 15
percent of the households in the village were selected in the sample. Care was taken to include
all the sample households of the earlier rounds and their split households in the new sample.
After accommodating all these households, the balance sample units were drawn randomly from
the population using the probability proportion to size method. The sample design was finalized
in consultation with the statistician, who advised to take account of the variability with respect to
key parameters in different size groups for deciding the sample distribution between the size
groups. Large farm group exhibited a lot more variability than other groups with respect to both
the key parameters, income and size of the land. In order to take care of the greater variability in
the large farms group, a large proportion of the sample was to be allotted to that group. But it
would amount to biasing the sample in favour of large farms group. Since the study of livelihood
options and development pathways is the major objective of the study, a sample in which the
poorer households are under-represented was not considered desirable. Hence, it was decided to
stick with the probability proportion to size method for drawing a representative sample. The
total sample size has increased from 240 to 446 households (table 1).
Table 1. Sample details of old and new VLS surveys. Landless Small Medium Large Total
Sl No Village Old New Old New Old New Old New Old New 1 Aurepalle 10 25 10 21 10 37 10 17 40 100 2 Dokur 10 20 10 31 10 15 10 14 40 80 3 Kanzara 10 13 10 20 10 14 10 5 40 52 4 Kinkheda 10 8 10 14 10 6 10 4 40 32 5 Shirapur 10 22 10 43 10 17 10 6 40 88 6 Kalman 10 24 10 53 10 14 10 3 40 94
Total 60 112 60 182 60 103 60 49 240 446
The sample size has doubled or more than doubled in the four larger villages belonging to
Mahaboobnagar district (A.P) and Solapur district (Maharashtra). Among the two Akola villages,
sample size increased by 30 percent in case of Kanzara, but it fell by 25 percent in case of
Kinkheda. In case of all the four Maharashtra villages, the number of large farms in the sample
has fallen. In general, the proportion of small farms has increased very much, while the shares of
medium and large farms reduced. This sample distribution reflects the fact that the average size
4
of holding is falling even in the SAT areas due to population pressure on land. Over time, large
and medium farms are becoming smaller on account of fragmentation and sub-division.
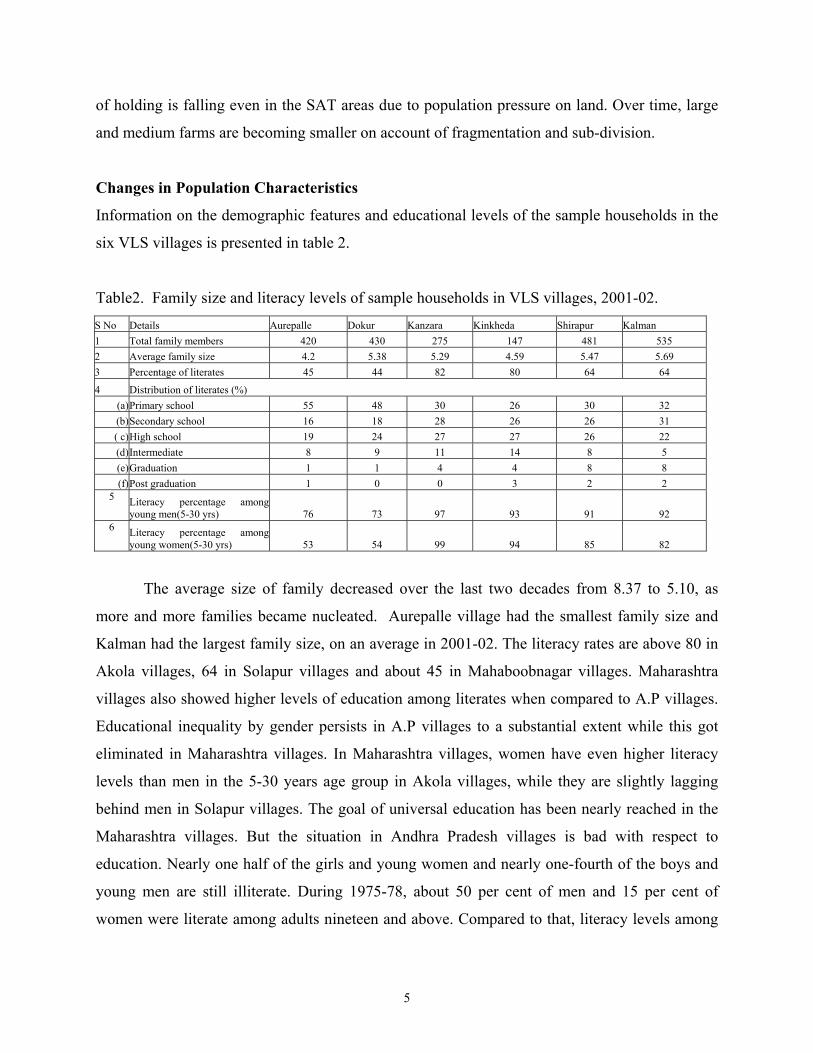
Changes in Population Characteristics
Information on the demographic features and educational levels of the sample households in the
six VLS villages is presented in table 2.
Table2. Family size and literacy levels of sample households in VLS villages, 2001-02. S No Details Aurepalle Dokur Kanzara Kinkheda Shirapur Kalman 1 Total family members 420 430 275 147 481 535 2 Average family size 4.2 5.38 5.29 4.59 5.47 5.69 3 Percentage of literates 45 44 82 80 64 64
4 Distribution of literates (%) (a) Primary school 55 48 30 26 30 32 (b) Secondary school 16 18 28 26 26 31 ( c) High school 19 24 27 27 26 22 (d) Intermediate 8 9 11 14 8 5 (e) Graduation 1 1 4 4 8 8 (f) Post graduation 1 0 0 3 2 2
5 Literacy percentage amongyoung men(5-30 yrs) 76 73 97 93 91 92
6 Literacy percentage amongyoung women(5-30 yrs) 53 54 99 94 85 82
The average size of family decreased over the last two decades from 8.37 to 5.10, as
more and more families became nucleated. Aurepalle village had the smallest family size and
Kalman had the largest family size, on an average in 2001-02. The literacy rates are above 80 in
Akola villages, 64 in Solapur villages and about 45 in Mahaboobnagar villages. Maharashtra
villages also showed higher levels of education among literates when compared to A.P villages.
Educational inequality by gender persists in A.P villages to a substantial extent while this got
eliminated in Maharashtra villages. In Maharashtra villages, women have even higher literacy
levels than men in the 5-30 years age group in Akola villages, while they are slightly lagging
behind men in Solapur villages. The goal of universal education has been nearly reached in the
Maharashtra villages. But the situation in Andhra Pradesh villages is bad with respect to
education. Nearly one half of the girls and young women and nearly one-fourth of the boys and
young men are still illiterate. During 1975-78, about 50 per cent of men and 15 per cent of
women were literate among adults nineteen and above. Compared to that, literacy levels among
5
women improved dramatically. Even male literacy rates improved to some extent, if not by the
same proportion as in case of females.
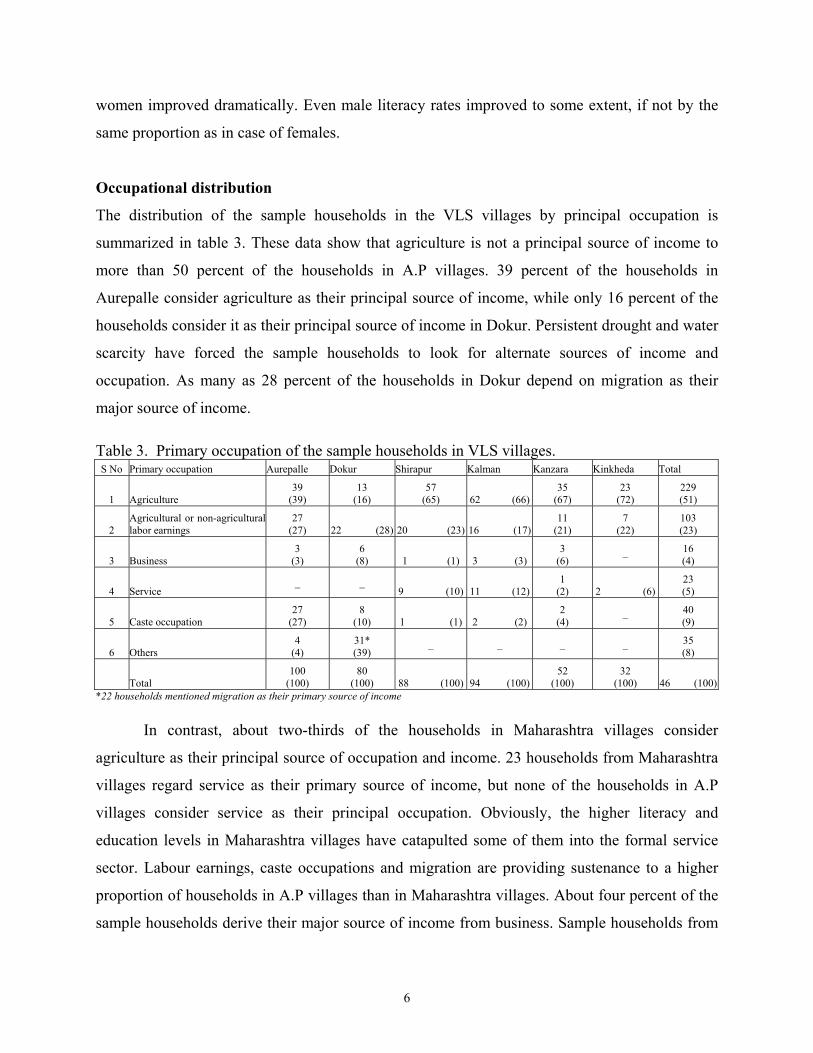
Occupational distribution
The distribution of the sample households in the VLS villages by principal occupation is
summarized in table 3. These data show that agriculture is not a principal source of income to
more than 50 percent of the households in A.P villages. 39 percent of the households in
Aurepalle consider agriculture as their principal source of income, while only 16 percent of the
households consider it as their principal source of income in Dokur. Persistent drought and water
scarcity have forced the sample households to look for alternate sources of income and
occupation. As many as 28 percent of the households in Dokur depend on migration as their
major source of income. Table 3. Primary occupation of the sample households in VLS villages. S No Primary occupation Aurepalle Dokur Shirapur Kalman Kanzara Kinkheda Total
1 Agriculture 39
(39) 13
(16) 57
(65) 62 (66)35
(67) 23
(72) 229 (51)
2 Agricultural or non-agricultural labor earnings
27 (27) 22 (28) 20 (23) 16 (17)
11 (21)
7 (22)
103 (23)
3 Business 3
(3) 6
(8) 1 (1) 3 (3) 3
(6) _ 16
(4)
4 Service _ _
9 (10) 11 (12)1
(2) 2 (6)23 (5)
5 Caste occupation 27
(27) 8
(10) 1 (1) 2 (2) 2
(4) _ 40
(9)
6 Others 4
(4) 31* (39)
_ _ _ _ 35 (8)
Total 100
(100) 80
(100) 88 (100) 94 (100)52
(100) 32
(100) 46 (100)*22 households mentioned migration as their primary source of income In contrast, about two-thirds of the households in Maharashtra villages consider
agriculture as their principal source of occupation and income. 23 households from Maharashtra
villages regard service as their primary source of income, but none of the households in A.P
villages consider service as their principal occupation. Obviously, the higher literacy and
education levels in Maharashtra villages have catapulted some of them into the formal service
sector. Labour earnings, caste occupations and migration are providing sustenance to a higher
proportion of households in A.P villages than in Maharashtra villages. About four percent of the
sample households derive their major source of income from business. Sample households from
6
Dokur and Kanzara are depending more on business as their principal occupation when
compared to other four villages. Other miscellaneous sources of occupation are also of some
importance, besides migration in A.P villages. These are in the informal services sector.
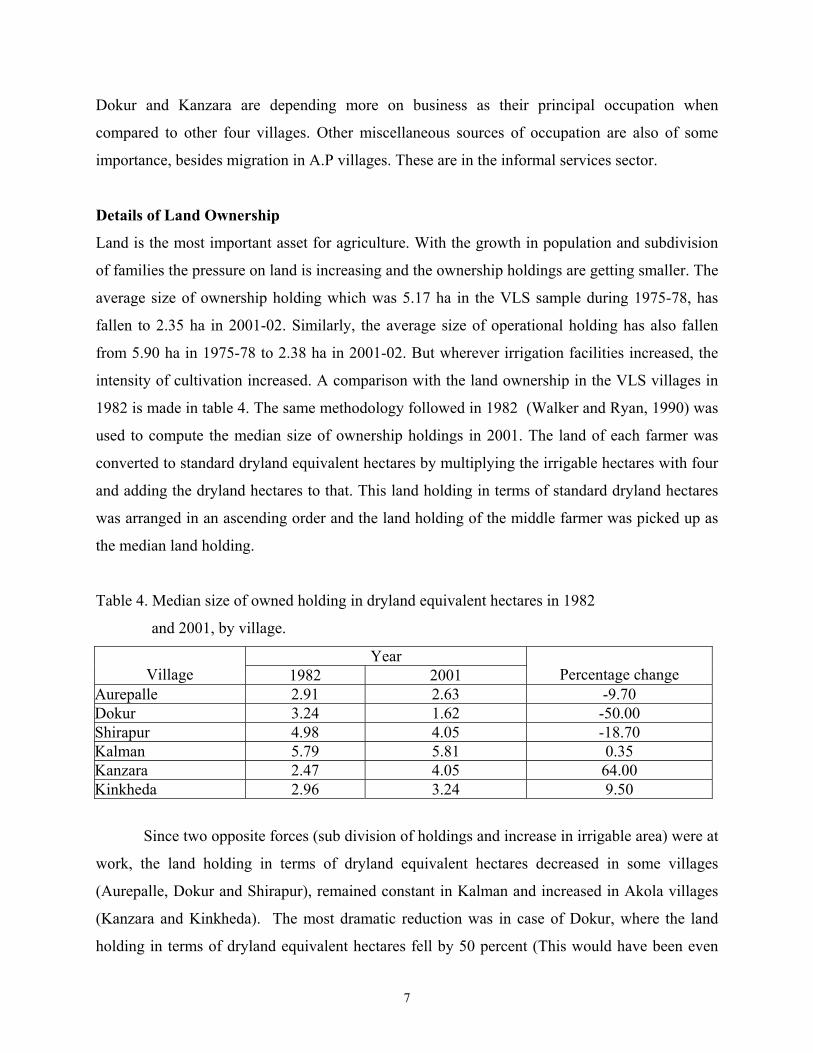
Details of Land Ownership
Land is the most important asset for agriculture. With the growth in population and subdivision
of families the pressure on land is increasing and the ownership holdings are getting smaller. The
average size of ownership holding which was 5.17 ha in the VLS sample during 1975-78, has
fallen to 2.35 ha in 2001-02. Similarly, the average size of operational holding has also fallen
from 5.90 ha in 1975-78 to 2.38 ha in 2001-02. But wherever irrigation facilities increased, the
intensity of cultivation increased. A comparison with the land ownership in the VLS villages in
1982 is made in table 4. The same methodology followed in 1982 (Walker and Ryan, 1990) was
used to compute the median size of ownership holdings in 2001. The land of each farmer was
converted to standard dryland equivalent hectares by multiplying the irrigable hectares with four
and adding the dryland hectares to that. This land holding in terms of standard dryland hectares
was arranged in an ascending order and the land holding of the middle farmer was picked up as
the median land holding.
Table 4. Median size of owned holding in dryland equivalent hectares in 1982
and 2001, by village.
Year Village 1982 2001 Percentage change
Aurepalle 2.91 2.63 -9.70 Dokur 3.24 1.62 -50.00 Shirapur 4.98 4.05 -18.70 Kalman 5.79 5.81 0.35 Kanzara 2.47 4.05 64.00 Kinkheda 2.96 3.24 9.50
Since two opposite forces (sub division of holdings and increase in irrigable area) were at
work, the land holding in terms of dryland equivalent hectares decreased in some villages
(Aurepalle, Dokur and Shirapur), remained constant in Kalman and increased in Akola villages
(Kanzara and Kinkheda). The most dramatic reduction was in case of Dokur, where the land
holding in terms of dryland equivalent hectares fell by 50 percent (This would have been even
7
sharper had we considered actual irrigated area instead of irrigable area). Dokur has a large tank,
which was getting filled up every year and was supporting two rice crops in the command area
all through the seventies and eighties. But during the last one decade, there was no water in the
tank due to scanty rainfall and cessation of inflows from the catchment area. Most of the
command area is lying fallow. Yet some respondents reported it as irrigable. In Aurepalle
village, there was no significant increase in irrigable area despite increase in the number of
borewells. The village tank has dried up in this village also and many of the open wells also
dried up. Overall, a 9.7 percent reduction was recorded in the land holding in terms of dryland
equivalent hectares.
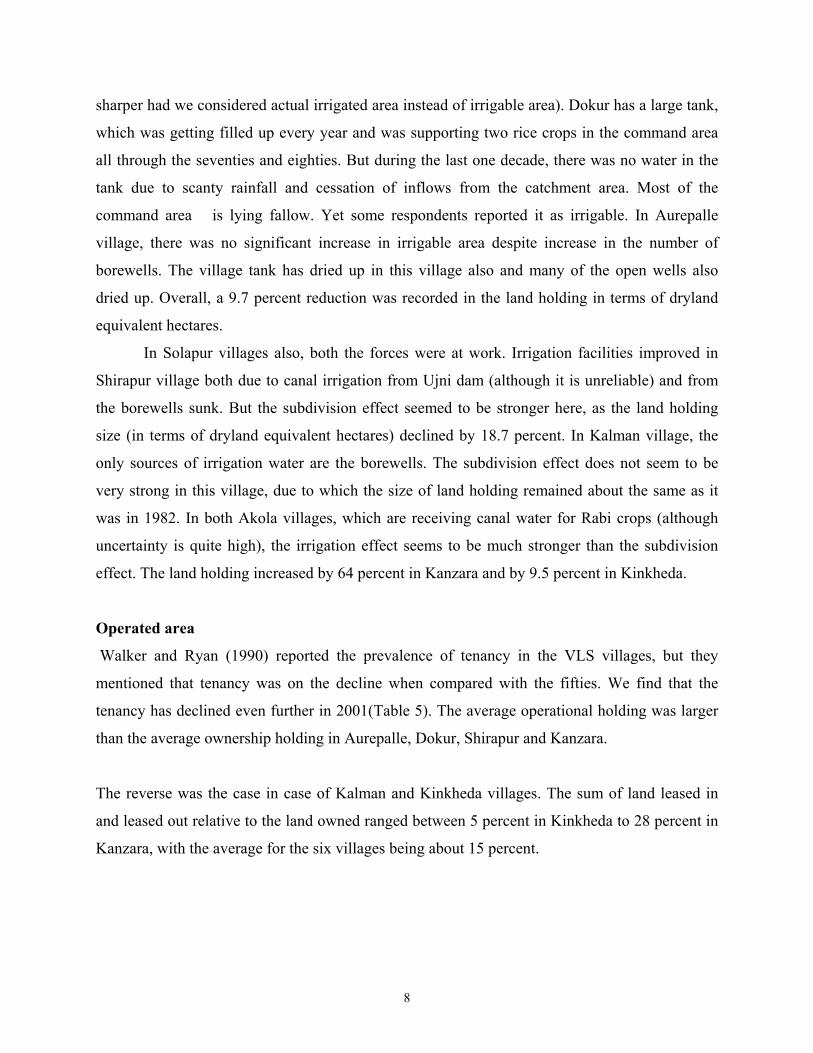
In Solapur villages also, both the forces were at work. Irrigation facilities improved in
Shirapur village both due to canal irrigation from Ujni dam (although it is unreliable) and from
the borewells sunk. But the subdivision effect seemed to be stronger here, as the land holding
size (in terms of dryland equivalent hectares) declined by 18.7 percent. In Kalman village, the
only sources of irrigation water are the borewells. The subdivision effect does not seem to be
very strong in this village, due to which the size of land holding remained about the same as it
was in 1982. In both Akola villages, which are receiving canal water for Rabi crops (although
uncertainty is quite high), the irrigation effect seems to be much stronger than the subdivision
effect. The land holding increased by 64 percent in Kanzara and by 9.5 percent in Kinkheda.
Operated area
Walker and Ryan (1990) reported the prevalence of tenancy in the VLS villages, but they
mentioned that tenancy was on the decline when compared with the fifties. We find that the
tenancy has declined even further in 2001(Table 5). The average operational holding was larger
than the average ownership holding in Aurepalle, Dokur, Shirapur and Kanzara.
The reverse was the case in case of Kalman and Kinkheda villages. The sum of land leased in
and leased out relative to the land owned ranged between 5 percent in Kinkheda to 28 percent in
Kanzara, with the average for the six villages being about 15 percent.
8
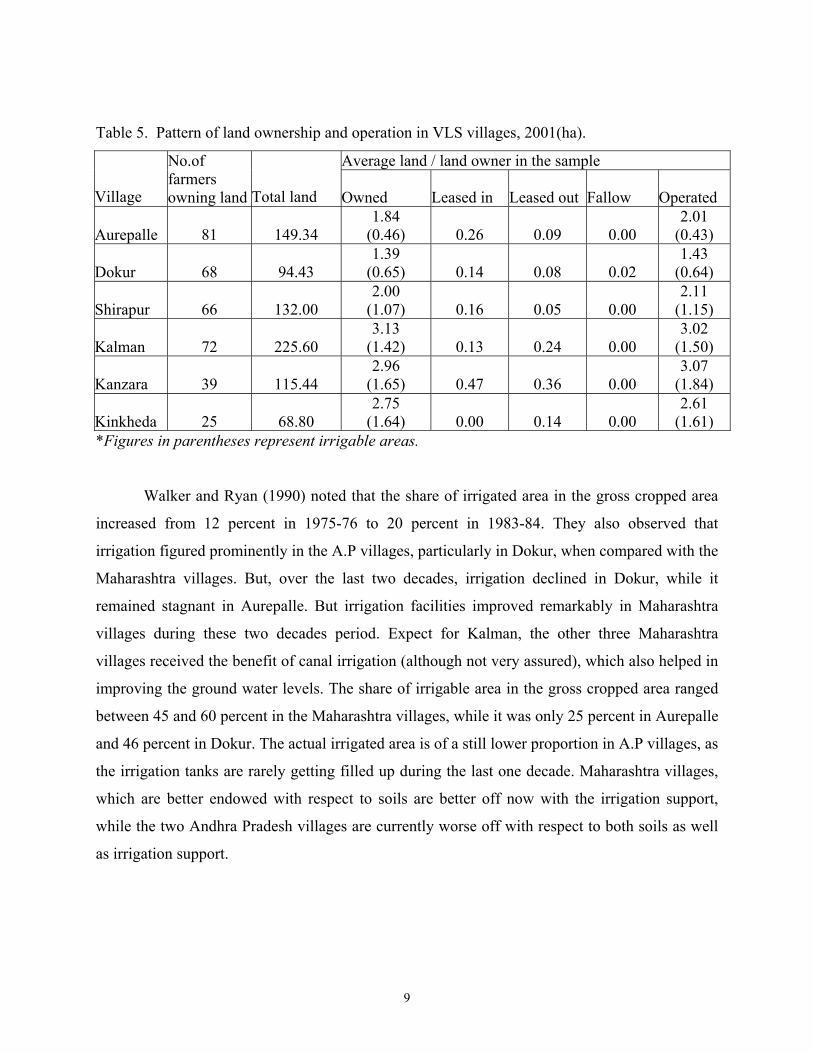
Table 5. Pattern of land ownership and operation in VLS villages, 2001(ha).
Average land / land owner in the sample
Village
No.of farmers owning land Total land Owned Leased in Leased out Fallow Operated
Aurepalle 81 149.34 1.84
(0.46) 0.26 0.09 0.00 2.01
(0.43)
Dokur 68 94.43 1.39
(0.65) 0.14 0.08 0.02 1.43
(0.64)
Shirapur 66 132.00 2.00
(1.07) 0.16 0.05 0.00 2.11
(1.15)
Kalman 72 225.60 3.13
(1.42) 0.13 0.24 0.00 3.02
(1.50)
Kanzara 39 115.44 2.96
(1.65) 0.47 0.36 0.00 3.07
(1.84)
Kinkheda 25 68.80 2.75
(1.64) 0.00 0.14 0.00 2.61
(1.61) *Figures in parentheses represent irrigable areas.
Walker and Ryan (1990) noted that the share of irrigated area in the gross cropped area
increased from 12 percent in 1975-76 to 20 percent in 1983-84. They also observed that
irrigation figured prominently in the A.P villages, particularly in Dokur, when compared with the
Maharashtra villages. But, over the last two decades, irrigation declined in Dokur, while it
remained stagnant in Aurepalle. But irrigation facilities improved remarkably in Maharashtra
villages during these two decades period. Expect for Kalman, the other three Maharashtra
villages received the benefit of canal irrigation (although not very assured), which also helped in
improving the ground water levels. The share of irrigable area in the gross cropped area ranged
between 45 and 60 percent in the Maharashtra villages, while it was only 25 percent in Aurepalle
and 46 percent in Dokur. The actual irrigated area is of a still lower proportion in A.P villages, as
the irrigation tanks are rarely getting filled up during the last one decade. Maharashtra villages,
which are better endowed with respect to soils are better off now with the irrigation support,
while the two Andhra Pradesh villages are currently worse off with respect to both soils as well
as irrigation support.
9
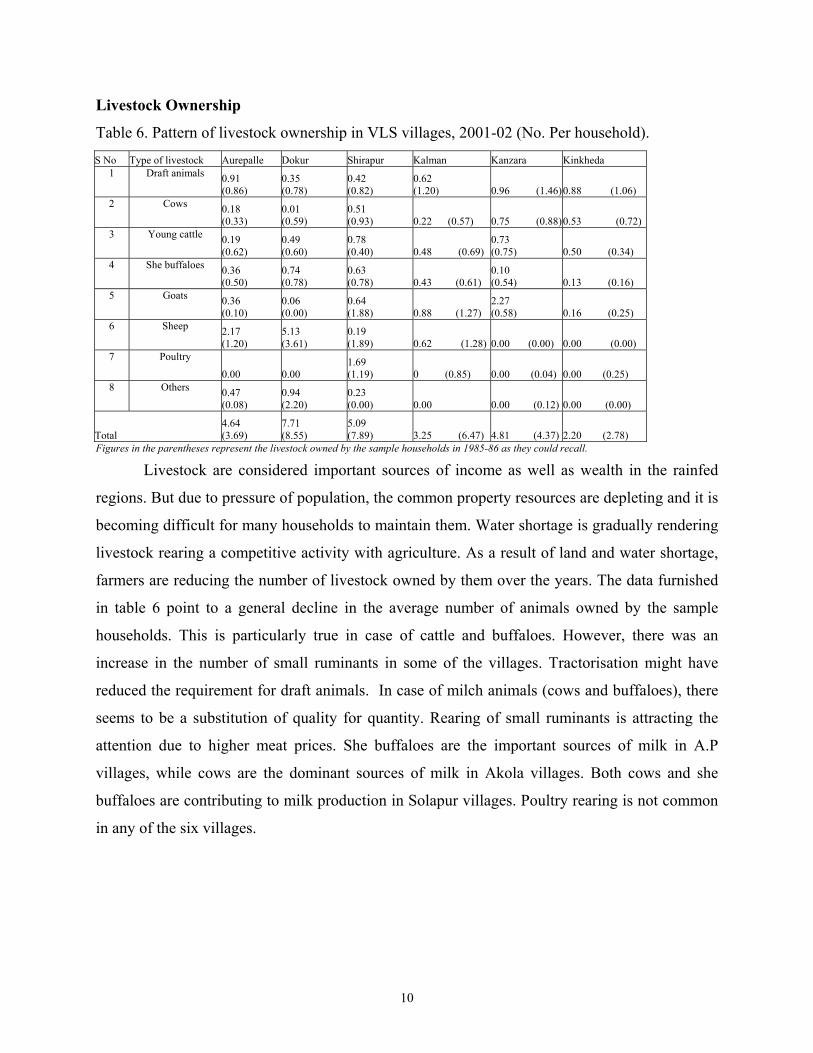
Livestock Ownership
Table 6. Pattern of livestock ownership in VLS villages, 2001-02 (No. Per household). S No Type of livestock Aurepalle Dokur Shirapur Kalman Kanzara Kinkheda
1 Draft animals 0.91 (0.86)
0.35 (0.78)
0.42 (0.82)
0.62 (1.20) 0.96 (1.46)0.88 (1.06)
2 Cows 0.18 (0.33)
0.01 (0.59)
0.51 (0.93) 0.22 (0.57) 0.75 (0.88)0.53 (0.72)
3 Young cattle 0.19 (0.62)
0.49 (0.60)
0.78 (0.40) 0.48 (0.69)
0.73 (0.75) 0.50 (0.34)
4 She buffaloes 0.36 (0.50)
0.74 (0.78)
0.63 (0.78) 0.43 (0.61)
0.10 (0.54) 0.13 (0.16)
5 Goats 0.36 (0.10)
0.06 (0.00)
0.64 (1.88) 0.88 (1.27)
2.27 (0.58) 0.16 (0.25)
6 Sheep 2.17 (1.20)
5.13 (3.61)
0.19 (1.89) 0.62 (1.28) 0.00 (0.00) 0.00 (0.00)
7 Poultry
0.00 0.00 1.69 (1.19) 0 (0.85) 0.00 (0.04) 0.00 (0.25)
8 Others 0.47 (0.08)
0.94 (2.20)
0.23 (0.00) 0.00 0.00 (0.12) 0.00 (0.00)
Total 4.64 (3.69)
7.71 (8.55)
5.09 (7.89) 3.25 (6.47) 4.81 (4.37) 2.20 (2.78)
Figures in the parentheses represent the livestock owned by the sample households in 1985-86 as they could recall.
Livestock are considered important sources of income as well as wealth in the rainfed
regions. But due to pressure of population, the common property resources are depleting and it is
becoming difficult for many households to maintain them. Water shortage is gradually rendering
livestock rearing a competitive activity with agriculture. As a result of land and water shortage,
farmers are reducing the number of livestock owned by them over the years. The data furnished
in table 6 point to a general decline in the average number of animals owned by the sample
households. This is particularly true in case of cattle and buffaloes. However, there was an
increase in the number of small ruminants in some of the villages. Tractorisation might have
reduced the requirement for draft animals. In case of milch animals (cows and buffaloes), there
seems to be a substitution of quality for quantity. Rearing of small ruminants is attracting the
attention due to higher meat prices. She buffaloes are the important sources of milk in A.P
villages, while cows are the dominant sources of milk in Akola villages. Both cows and she
buffaloes are contributing to milk production in Solapur villages. Poultry rearing is not common
in any of the six villages.
10
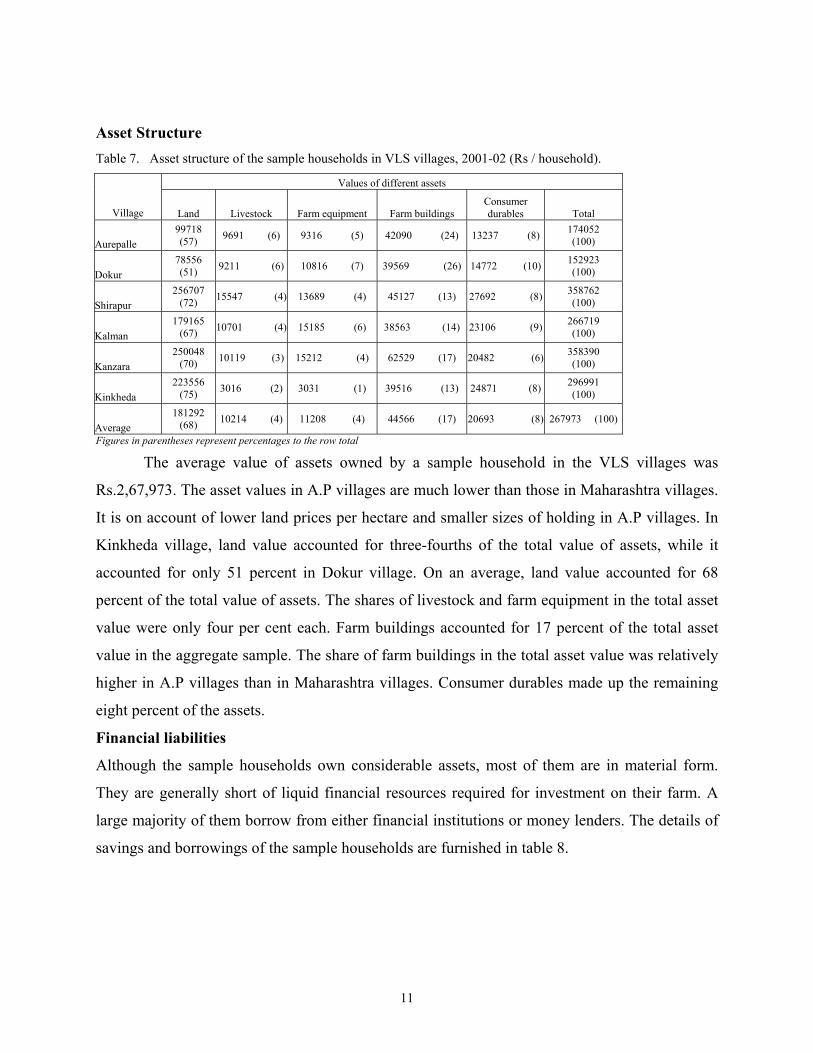
Asset Structure Table 7. Asset structure of the sample households in VLS villages, 2001-02 (Rs / household).
Values of different assets
Village Land Livestock Farm equipment Farm buildings Consumer durables Total
Aurepalle 99718 (57) 9691 (6) 9316 (5) 42090 (24) 13237 (8) 174052
(100)
Dokur 78556 (51) 9211 (6) 10816 (7) 39569 (26) 14772 (10) 152923
(100)
Shirapur 256707
(72) 15547 (4) 13689 (4) 45127 (13) 27692 (8) 358762 (100)
Kalman 179165
(67) 10701 (4) 15185 (6) 38563 (14) 23106 (9) 266719 (100)
Kanzara 250048
(70) 10119 (3) 15212 (4) 62529 (17) 20482 (6) 358390 (100)
Kinkheda 223556
(75) 3016 (2) 3031 (1) 39516 (13) 24871 (8) 296991 (100)
Average 181292
(68) 10214 (4) 11208 (4) 44566 (17) 20693 (8) 267973 (100)
Figures in parentheses represent percentages to the row total
The average value of assets owned by a sample household in the VLS villages was
Rs.2,67,973. The asset values in A.P villages are much lower than those in Maharashtra villages.
It is on account of lower land prices per hectare and smaller sizes of holding in A.P villages. In
Kinkheda village, land value accounted for three-fourths of the total value of assets, while it
accounted for only 51 percent in Dokur village. On an average, land value accounted for 68
percent of the total value of assets. The shares of livestock and farm equipment in the total asset
value were only four per cent each. Farm buildings accounted for 17 percent of the total asset
value in the aggregate sample. The share of farm buildings in the total asset value was relatively
higher in A.P villages than in Maharashtra villages. Consumer durables made up the remaining
eight percent of the assets.
Financial liabilities
Although the sample households own considerable assets, most of them are in material form.
They are generally short of liquid financial resources required for investment on their farm. A
large majority of them borrow from either financial institutions or money lenders. The details of
savings and borrowings of the sample households are furnished in table 8.
11
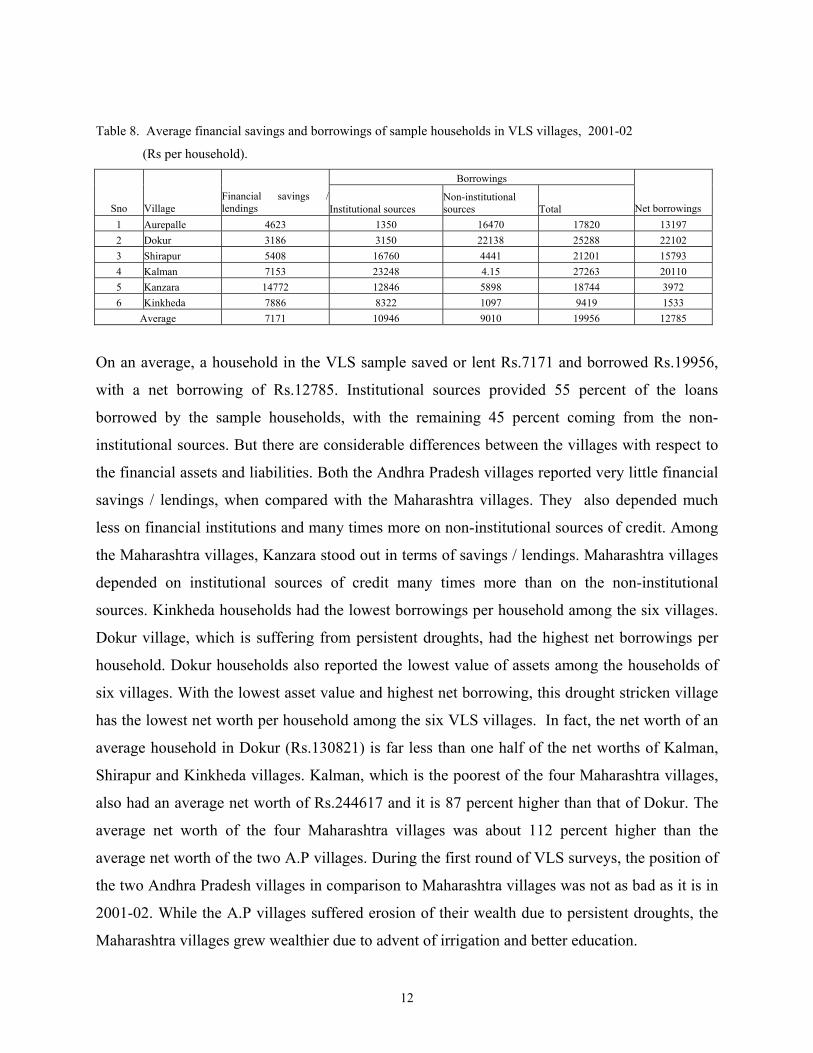
Table 8. Average financial savings and borrowings of sample households in VLS villages, 2001-02
(Rs per household).
Borrowings
Sno Village Financial savings /lendings Institutional sources
Non-institutional sources Total Net borrowings
1 Aurepalle 4623 1350 16470 17820 13197 2 Dokur 3186 3150 22138 25288 22102 3 Shirapur 5408 16760 4441 21201 15793 4 Kalman 7153 23248 4.15 27263 20110 5 Kanzara 14772 12846 5898 18744 3972 6 Kinkheda 7886 8322 1097 9419 1533
Average 7171 10946 9010 19956 12785
On an average, a household in the VLS sample saved or lent Rs.7171 and borrowed Rs.19956,
with a net borrowing of Rs.12785. Institutional sources provided 55 percent of the loans
borrowed by the sample households, with the remaining 45 percent coming from the non-
institutional sources. But there are considerable differences between the villages with respect to
the financial assets and liabilities. Both the Andhra Pradesh villages reported very little financial
savings / lendings, when compared with the Maharashtra villages. They also depended much
less on financial institutions and many times more on non-institutional sources of credit. Among
the Maharashtra villages, Kanzara stood out in terms of savings / lendings. Maharashtra villages
depended on institutional sources of credit many times more than on the non-institutional
sources. Kinkheda households had the lowest borrowings per household among the six villages.
Dokur village, which is suffering from persistent droughts, had the highest net borrowings per
household. Dokur households also reported the lowest value of assets among the households of
six villages. With the lowest asset value and highest net borrowing, this drought stricken village
has the lowest net worth per household among the six VLS villages. In fact, the net worth of an
average household in Dokur (Rs.130821) is far less than one half of the net worths of Kalman,
Shirapur and Kinkheda villages. Kalman, which is the poorest of the four Maharashtra villages,
also had an average net worth of Rs.244617 and it is 87 percent higher than that of Dokur. The
average net worth of the four Maharashtra villages was about 112 percent higher than the
average net worth of the two A.P villages. During the first round of VLS surveys, the position of
the two Andhra Pradesh villages in comparison to Maharashtra villages was not as bad as it is in
2001-02. While the A.P villages suffered erosion of their wealth due to persistent droughts, the
Maharashtra villages grew wealthier due to advent of irrigation and better education.
12
Cropping Patterns
Cropping patterns change over time in response to changes in weather patterns, and relative
prices. Over years, Indian agriculture has moved from a deficit scenario to a surplus position in
case of food grains. An elaborate public distribution system was built and a competitive private
trade has emerged. All these factors together have dispelled the food insecurity, which was a
matter of concern a few decades ago. The transaction costs have come down and farmers are
freed to some extent from the compulsion to produce the food grains and other agricultural
commodities they need for consumption. And also because of the faster advances made in
productivity of food grains, the amount of land resource that needs to be allocated for food
production has come down. At the level of the country, a few decades ago, nearly three-fourths
of land was allocated to food grain crops. Now this proportion has been reduced to two-thirds.
The cropping pattern changes at the micro-level can be very revealing. Tables 9,10 and 11
present the cropping patterns in Mahaboonagar, Solapur and Akola villages.
Cotton has emerged as the dominant crop in Aurepalle village, accounting for 53
percent of the sown area in Kharif. It was also grown along with pigeonpea (intercrop) in another
three percent area. Next to cotton, castor was the most important crop in the village, with 13
percent Kharif area under its sole crop and another 11 percent area under its intercropping with
pigeonpea. Paddy remained the crop of irrigated lands covering 9 percent area in Kharif and 90
percent area in Rabi. Sorghum was relegated to fourth position, covering 6 percent of Kharif area
as the sole crop and 4 percent of Kharif area as an intercrop with pigeonpea. Out of the gross
cropped area in Aurepalle village, cotton and cotton based intercrop covered 51 percent area. It
was followed by castor and castor based intercrop in 22 percent area, paddy in 16 percent area
and sorghum and sorghum based intercrop in 10 percent area. Crops like sunflower, sesamum
and horsegram accounted for the remaining one percent area.
13
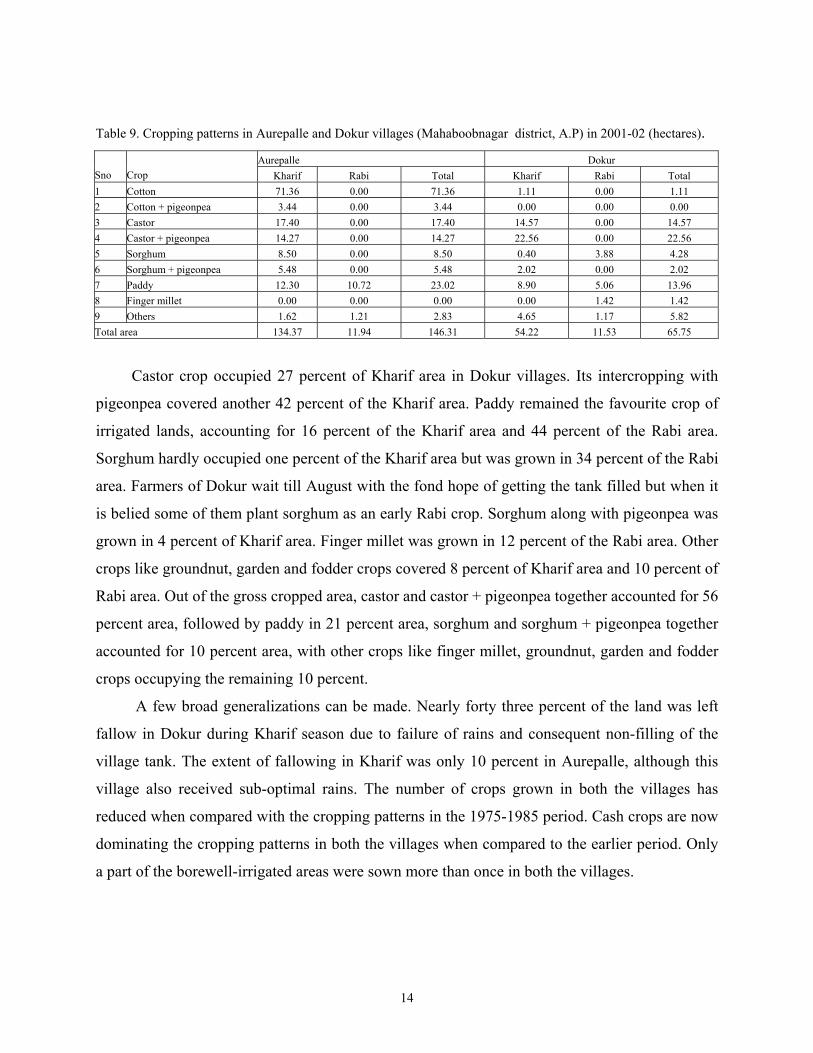
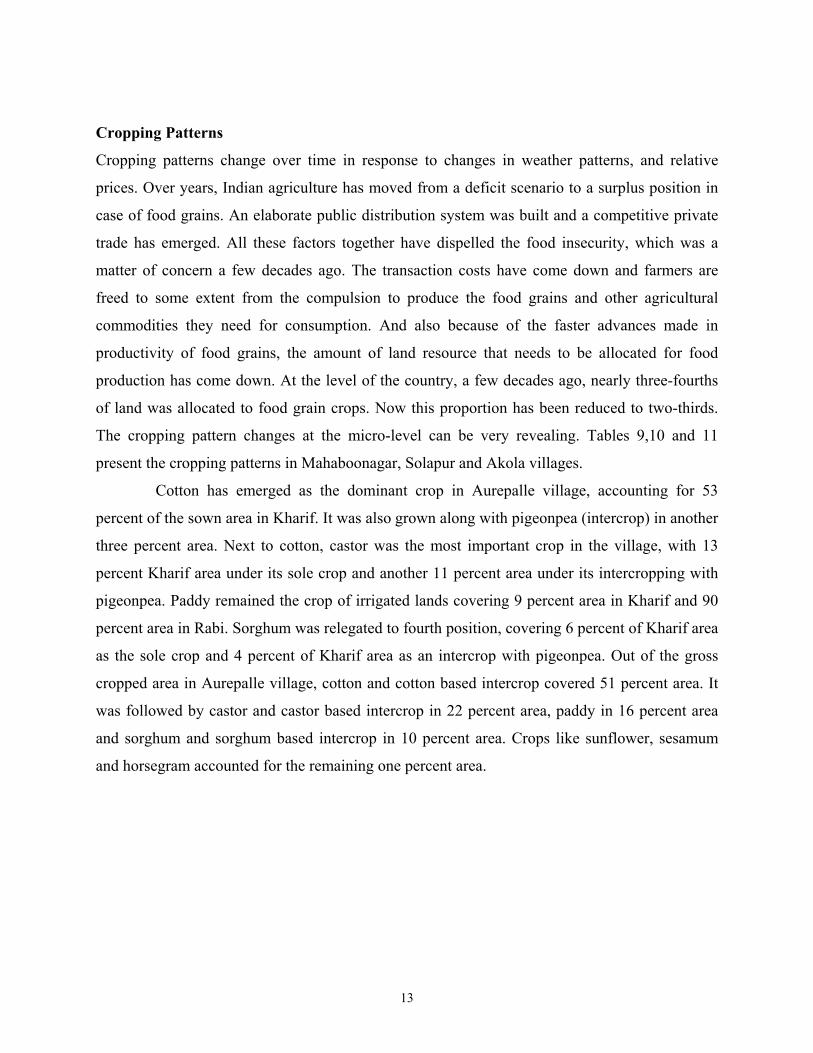
Table 9. Cropping patterns in Aurepalle and Dokur villages (Mahaboobnagar district, A.P) in 2001-02 (hectares). Aurepalle Dokur
Sno Crop Kharif Rabi Total Kharif Rabi Total 1 Cotton 71.36 0.00 71.36 1.11 0.00 1.11 2 Cotton + pigeonpea 3.44 0.00 3.44 0.00 0.00 0.00 3 Castor 17.40 0.00 17.40 14.57 0.00 14.57 4 Castor + pigeonpea 14.27 0.00 14.27 22.56 0.00 22.56 5 Sorghum 8.50 0.00 8.50 0.40 3.88 4.28 6 Sorghum + pigeonpea 5.48 0.00 5.48 2.02 0.00 2.02 7 Paddy 12.30 10.72 23.02 8.90 5.06 13.96 8 Finger millet 0.00 0.00 0.00 0.00 1.42 1.42 9 Others 1.62 1.21 2.83 4.65 1.17 5.82 Total area 134.37 11.94 146.31 54.22 11.53 65.75
Castor crop occupied 27 percent of Kharif area in Dokur villages. Its intercropping with
pigeonpea covered another 42 percent of the Kharif area. Paddy remained the favourite crop of
irrigated lands, accounting for 16 percent of the Kharif area and 44 percent of the Rabi area.
Sorghum hardly occupied one percent of the Kharif area but was grown in 34 percent of the Rabi
area. Farmers of Dokur wait till August with the fond hope of getting the tank filled but when it
is belied some of them plant sorghum as an early Rabi crop. Sorghum along with pigeonpea was
grown in 4 percent of Kharif area. Finger millet was grown in 12 percent of the Rabi area. Other
crops like groundnut, garden and fodder crops covered 8 percent of Kharif area and 10 percent of
Rabi area. Out of the gross cropped area, castor and castor + pigeonpea together accounted for 56
percent area, followed by paddy in 21 percent area, sorghum and sorghum + pigeonpea together
accounted for 10 percent area, with other crops like finger millet, groundnut, garden and fodder
crops occupying the remaining 10 percent.
A few broad generalizations can be made. Nearly forty three percent of the land was left
fallow in Dokur during Kharif season due to failure of rains and consequent non-filling of the
village tank. The extent of fallowing in Kharif was only 10 percent in Aurepalle, although this
village also received sub-optimal rains. The number of crops grown in both the villages has
reduced when compared with the cropping patterns in the 1975-1985 period. Cash crops are now
dominating the cropping patterns in both the villages when compared to the earlier period. Only
a part of the borewell-irrigated areas were sown more than once in both the villages.
14
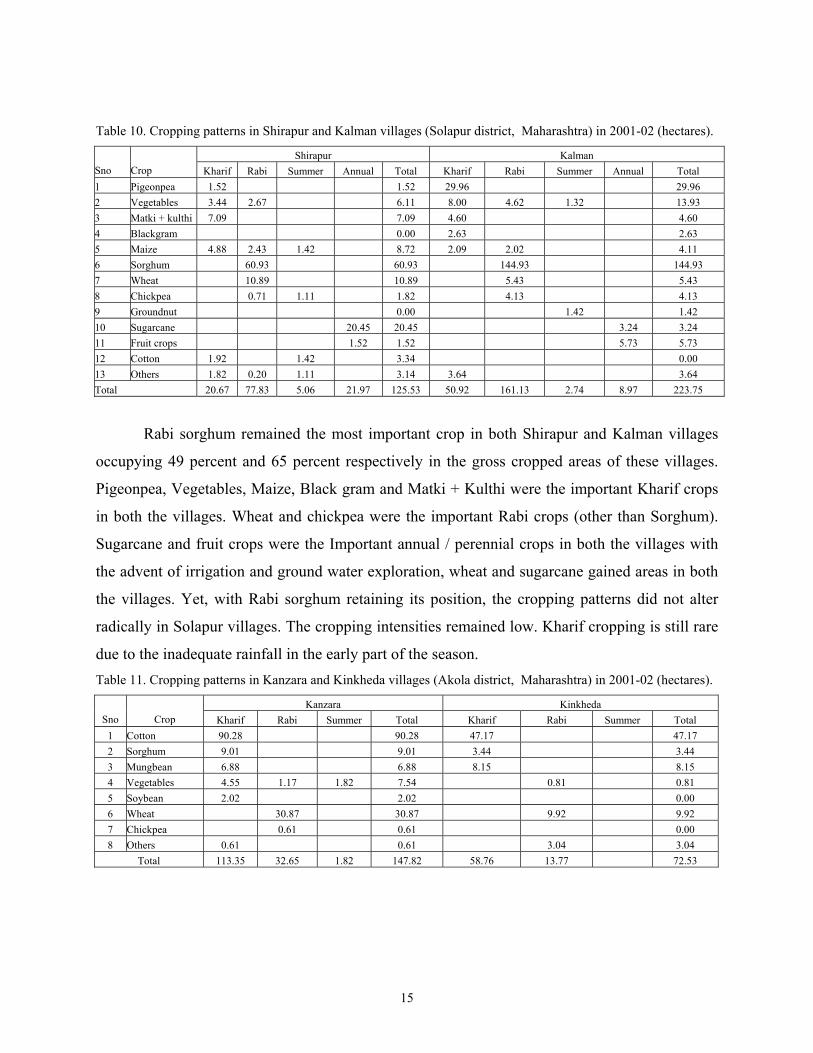
Table 10. Cropping patterns in Shirapur and Kalman villages (Solapur district, Maharashtra) in 2001-02 (hectares).
Shirapur Kalman Sno Crop Kharif Rabi Summer Annual Total Kharif Rabi Summer Annual Total 1 Pigeonpea 1.52 1.52 29.96 29.96 2 Vegetables 3.44 2.67 6.11 8.00 4.62 1.32 13.93 3 Matki + kulthi 7.09 7.09 4.60 4.60 4 Blackgram 0.00 2.63 2.63 5 Maize 4.88 2.43 1.42 8.72 2.09 2.02 4.11 6 Sorghum 60.93 60.93 144.93 144.93 7 Wheat 10.89 10.89 5.43 5.43 8 Chickpea 0.71 1.11 1.82 4.13 4.13 9 Groundnut 0.00 1.42 1.42 10 Sugarcane 20.45 20.45 3.24 3.24 11 Fruit crops 1.52 1.52 5.73 5.73 12 Cotton 1.92 1.42 3.34 0.00 13 Others 1.82 0.20 1.11 3.14 3.64 3.64 Total 20.67 77.83 5.06 21.97 125.53 50.92 161.13 2.74 8.97 223.75
Rabi sorghum remained the most important crop in both Shirapur and Kalman villages
occupying 49 percent and 65 percent respectively in the gross cropped areas of these villages.
Pigeonpea, Vegetables, Maize, Black gram and Matki + Kulthi were the important Kharif crops
in both the villages. Wheat and chickpea were the important Rabi crops (other than Sorghum).
Sugarcane and fruit crops were the Important annual / perennial crops in both the villages with
the advent of irrigation and ground water exploration, wheat and sugarcane gained areas in both
the villages. Yet, with Rabi sorghum retaining its position, the cropping patterns did not alter
radically in Solapur villages. The cropping intensities remained low. Kharif cropping is still rare
due to the inadequate rainfall in the early part of the season. Table 11. Cropping patterns in Kanzara and Kinkheda villages (Akola district, Maharashtra) in 2001-02 (hectares).
Kanzara Kinkheda Sno Crop Kharif Rabi Summer Total Kharif Rabi Summer Total
1 Cotton 90.28 90.28 47.17 47.17 2 Sorghum 9.01 9.01 3.44 3.44 3 Mungbean 6.88 6.88 8.15 8.15 4 Vegetables 4.55 1.17 1.82 7.54 0.81 0.81 5 Soybean 2.02 2.02 0.00 6 Wheat 30.87 30.87 9.92 9.92 7 Chickpea 0.61 0.61 0.00 8 Others 0.61 0.61 3.04 3.04
Total 113.35 32.65 1.82 147.82 58.76 13.77 72.53
15
Cotton was the dominant crop in both the villages during the Kharif season. Sorghum
and Mungbean were the other important crops. Wheat was the dominant crop in the Rabi season
in both the villages. Vegetables were grown in all the seasons in Kanzara village, but they were
only grown in Rabi in Kinkheda village. In the Rabi season, chickpea was grown to some extent
in Kanzara, while sunflower was grown in Kinkheda by some farmers. The cropping intensities
were higher in Akola villages when compared with either Solapur or Mahaboobnagar villages.
Changes over the years
In table 12, some comparisons were made between 1975-76 and 2001-02 (figures for
1975-76 were drawn from Jodha (1977)). The average size of holding fell by more than one half
in all the villages except Kanzara, where it fell by 47 percent. The average size of holding of the
entire VLS sample fell by 54 percent from 5.23 to 2.38 hectares over the 26 years period. The
relative importance of the food crops decreased in all the villages both in case of sole crops as
well as in case of inter / mixed crops. On an average, the percentage area under food grains to the
gross cropped area under sole crops fell from 72.50 to 37.32 percent in case of the sole crops.
The decline in the share of food grains in the gross cropped area under mixed/ inter crops was
even sharper from 63.50 percent to 7.96 percent. Thus, the shift away from food grain crops was
even greater in the VLS villages than that at the macro – level. This shift in favour of cash crops
was particularly pronounced in case of Mahaboobnagar and Akola villages. In Solapur villages,
Rabi sorghum is still the favourite (or there is no better substitute crop) due to which the share of
food grains in the total area under sole crops remained high. Mixed cropping practice has given Table 12. Changes in the percentage area under food grains under sole and mixed crop systems between 1975-76
and 201-02.
1975 – 76 2001 - 02
Sno Village Average sizeholding (ha)
Percentage area of solecrops under food grains
Percentage area of mixed crops under food grains
Average sizeholding (operational)
Percentage area of sole crops under food grains
Percentage area of mixed crops under food grains
1 Aurepalle 4.40 39.00 2.01 25.60 23.63 2 Dokur 2.60 85.00 1.43 13.85 8.22 3 Shirapur 4.40 83.00 2.11 68.58 0 4 Kalman 8.10 93.00 3.02 70.49 0 5 Kanzara 5.80 59.00 3.07 26.98 N.A* 6 Kinkheda 6.10 76.00 2.61 18.42 N.A*
Average 5.23 72.50 2.38 37.32 7.96 *No mixed crops were reported to have been grown
way to intercropping. These days, it is uncommon to have more than two crops even in the
intercropping system. In Akola villages, even intercropping practice has vanished, while in
16
Solapur villages, the only intercropping practices is that of two minor pulses i.e., matki and
kulthi.
Productivity levels
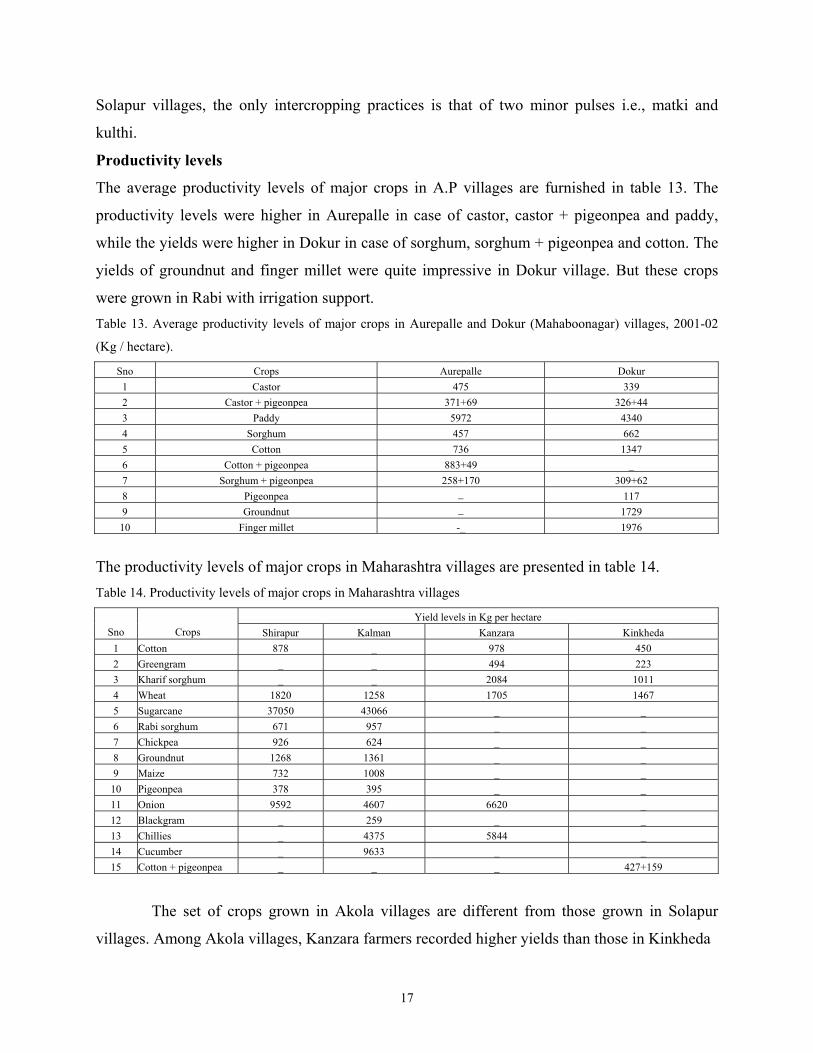
The average productivity levels of major crops in A.P villages are furnished in table 13. The
productivity levels were higher in Aurepalle in case of castor, castor + pigeonpea and paddy,
while the yields were higher in Dokur in case of sorghum, sorghum + pigeonpea and cotton. The
yields of groundnut and finger millet were quite impressive in Dokur village. But these crops
were grown in Rabi with irrigation support. Table 13. Average productivity levels of major crops in Aurepalle and Dokur (Mahaboonagar) villages, 2001-02
(Kg / hectare).
Sno Crops Aurepalle Dokur 1 Castor 475 339 2 Castor + pigeonpea 371+69 326+44 3 Paddy 5972 4340 4 Sorghum 457 662 5 Cotton 736 1347 6 Cotton + pigeonpea 883+49 _ 7 Sorghum + pigeonpea 258+170 309+62 8 Pigeonpea _ 117 9 Groundnut _ 1729 10 Finger millet -_ 1976
The productivity levels of major crops in Maharashtra villages are presented in table 14. Table 14. Productivity levels of major crops in Maharashtra villages
Yield levels in Kg per hectare Sno Crops Shirapur Kalman Kanzara Kinkheda
1 Cotton 878 _ 978 450 2 Greengram _ _ 494 223 3 Kharif sorghum _ _ 2084 1011 4 Wheat 1820 1258 1705 1467 5 Sugarcane 37050 43066 _ _ 6 Rabi sorghum 671 957 _ _ 7 Chickpea 926 624 _ _ 8 Groundnut 1268 1361 _ _ 9 Maize 732 1008 _ _
10 Pigeonpea 378 395 _ _ 11 Onion 9592 4607 6620 _ 12 Blackgram _ 259 _ _ 13 Chillies _ 4375 5844 _ 14 Cucumber _ 9633 _ _ 15 Cotton + pigeonpea _ _ _ 427+159
The set of crops grown in Akola villages are different from those grown in Solapur
villages. Among Akola villages, Kanzara farmers recorded higher yields than those in Kinkheda
17
virtually in case of every crop. Among the Solapur villages, Shirapur farmers obtained better
yields in case of wheat, chickpea and onion. Kalman farmers fared better in case of sugarcane,
rabi sorghum, groundnut, maize and pigeonpea. Kanzara farmers obtained a better yield of
chillies than Kalman farmers.
Major Production Constraints in rainfed crops
The major production constraints in case of rainfed crops as perceived by farmers differ by crop
and village. In Aurepalle, drought was perceived as the most important production constraint by
the farmers irrespective of the rainfed crop. Pests, diseases and weeds are the other constraints in
that order of importance. In Dokur village, persistent drought has rendered the paddy fields into
long-term fallows. Prosopis weed has grown like shrub bushes in those lands, harbouring wild
boars. These wild boars have become the biggest menace to all the edible crops in the village.
Wild boar menace was rated as the most serious production constraint in case of millet and
groundnut crops. It was rated as an important constraint in case of sorghum and pigeonpea.
Drought was rated as the most important constraint in case of cotton and as the second most
important constraint in case of castor, millet and pigeonpea. Pests were regarded as the most
important constraints in case of castor, sorghum and pigeonpea. Diseases and weeds were the
important constraints in case of some crops.
In Solapur villages, drought was identified as the most important production constraint in
case of rabi sorghum. Insect pests (pord borer) were the most important production constraint in
case of pigeonpea and chickpea. Diseases were the most limiting production constraint in case of
groundnut. Excess rain was perceived as the most important constraint in case of matki, a minor
pulse crop. Poor soils and weeds were also mentioned as important production constraints in case
of some crops.
18
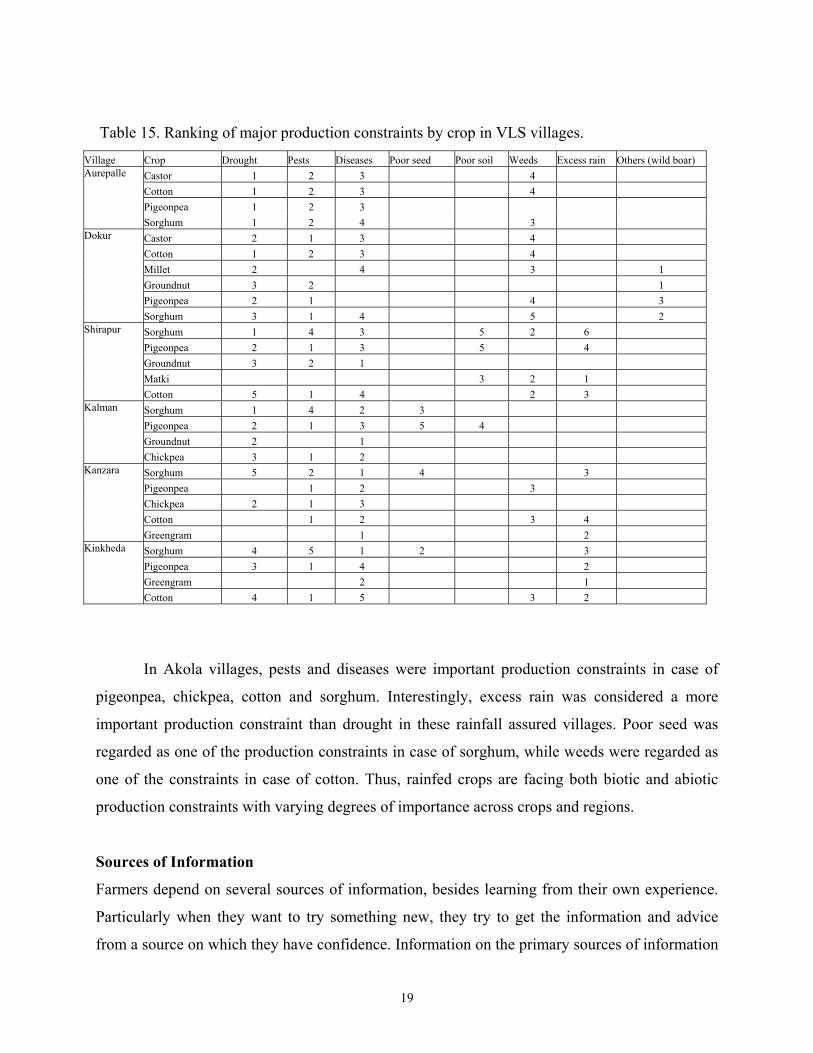
Table 15. Ranking of major production constraints by crop in VLS villages. Village Crop Drought Pests Diseases Poor seed Poor soil Weeds Excess rain Others (wild boar)
Castor 1 2 3 4 Cotton 1 2 3 4 Pigeonpea 1 2 3
Aurepalle
Sorghum 1 2 4 3 Castor 2 1 3 4 Cotton 1 2 3 4 Millet 2 4 3 1 Groundnut 3 2 1 Pigeonpea 2 1 4 3
Dokur
Sorghum 3 1 4 5 2 Sorghum 1 4 3 5 2 6 Pigeonpea 2 1 3 5 4 Groundnut 3 2 1 Matki 3 2 1
Shirapur
Cotton 5 1 4 2 3 Sorghum 1 4 2 3 Pigeonpea 2 1 3 5 4 Groundnut 2 1
Kalman
Chickpea 3 1 2 Sorghum 5 2 1 4 3 Pigeonpea 1 2 3 Chickpea 2 1 3 Cotton 1 2 3 4
Kanzara
Greengram 1 2 Sorghum 4 5 1 2 3 Pigeonpea 3 1 4 2 Greengram 2 1
Kinkheda
Cotton 4 1 5 3 2
In Akola villages, pests and diseases were important production constraints in case of
pigeonpea, chickpea, cotton and sorghum. Interestingly, excess rain was considered a more
important production constraint than drought in these rainfall assured villages. Poor seed was
regarded as one of the production constraints in case of sorghum, while weeds were regarded as
one of the constraints in case of cotton. Thus, rainfed crops are facing both biotic and abiotic
production constraints with varying degrees of importance across crops and regions.
Sources of Information
Farmers depend on several sources of information, besides learning from their own experience.
Particularly when they want to try something new, they try to get the information and advice
from a source on which they have confidence. Information on the primary sources of information
19
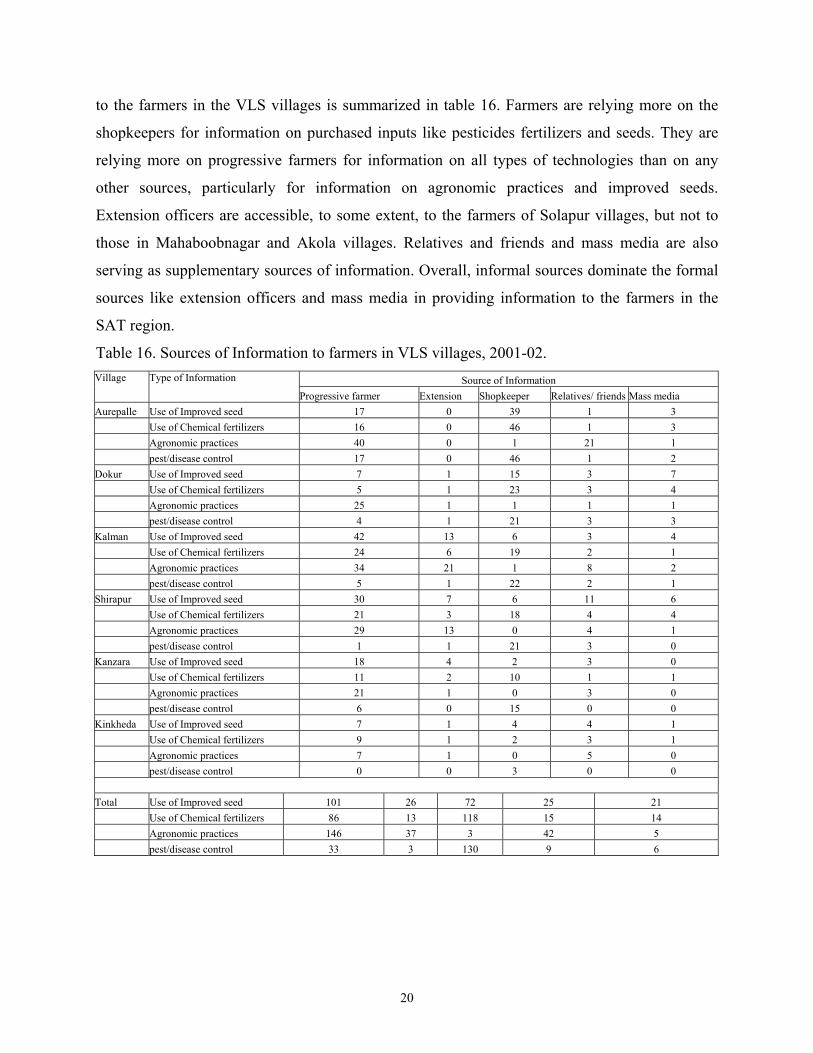
to the farmers in the VLS villages is summarized in table 16. Farmers are relying more on the
shopkeepers for information on purchased inputs like pesticides fertilizers and seeds. They are
relying more on progressive farmers for information on all types of technologies than on any
other sources, particularly for information on agronomic practices and improved seeds.
Extension officers are accessible, to some extent, to the farmers of Solapur villages, but not to
those in Mahaboobnagar and Akola villages. Relatives and friends and mass media are also
serving as supplementary sources of information. Overall, informal sources dominate the formal
sources like extension officers and mass media in providing information to the farmers in the
SAT region.
Table 16. Sources of Information to farmers in VLS villages, 2001-02. Source of Information Village Type of Information
Progressive farmer Extension Shopkeeper Relatives/ friends Mass media Aurepalle Use of Improved seed 17 0 39 1 3 Use of Chemical fertilizers 16 0 46 1 3 Agronomic practices 40 0 1 21 1 pest/disease control 17 0 46 1 2 Dokur Use of Improved seed 7 1 15 3 7 Use of Chemical fertilizers 5 1 23 3 4 Agronomic practices 25 1 1 1 1 pest/disease control 4 1 21 3 3 Kalman Use of Improved seed 42 13 6 3 4 Use of Chemical fertilizers 24 6 19 2 1 Agronomic practices 34 21 1 8 2 pest/disease control 5 1 22 2 1 Shirapur Use of Improved seed 30 7 6 11 6 Use of Chemical fertilizers 21 3 18 4 4 Agronomic practices 29 13 0 4 1 pest/disease control 1 1 21 3 0 Kanzara Use of Improved seed 18 4 2 3 0 Use of Chemical fertilizers 11 2 10 1 1 Agronomic practices 21 1 0 3 0 pest/disease control 6 0 15 0 0 Kinkheda Use of Improved seed 7 1 4 4 1 Use of Chemical fertilizers 9 1 2 3 1 Agronomic practices 7 1 0 5 0 pest/disease control 0 0 3 0 0
Total Use of Improved seed 101 26 72 25 21 Use of Chemical fertilizers 86 13 118 15 14 Agronomic practices 146 37 3 42 5 pest/disease control 33 3 130 9 6
20
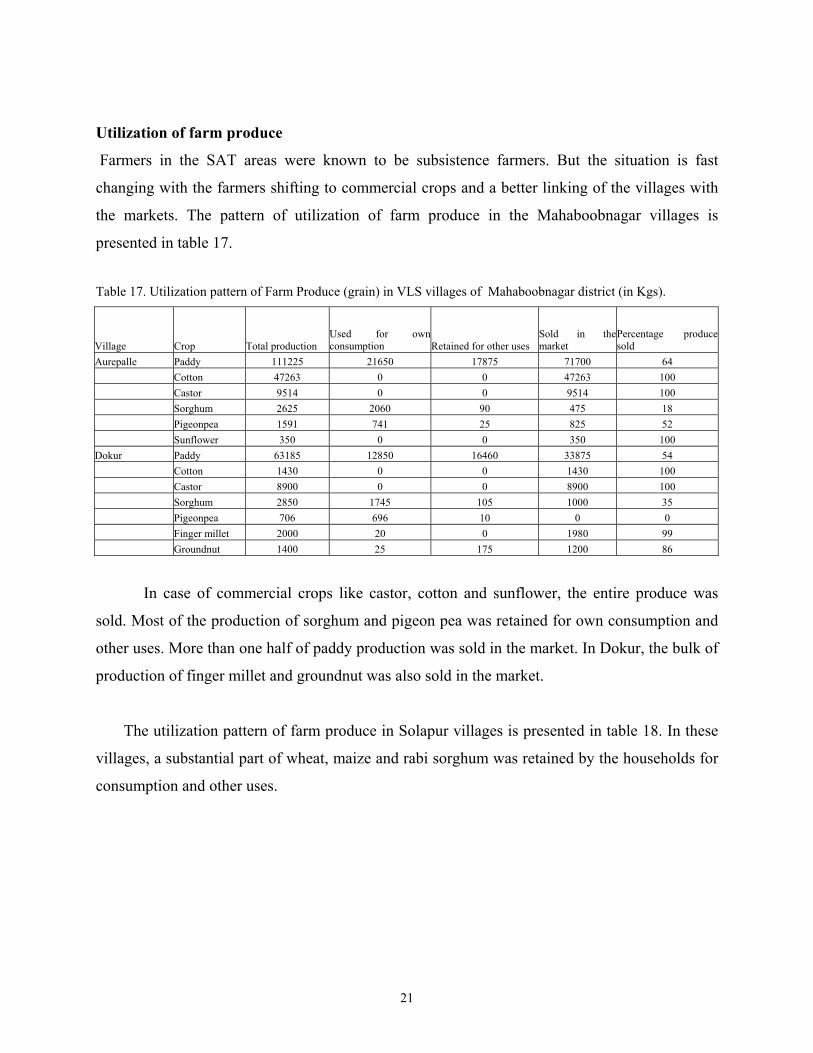
Utilization of farm produce
Farmers in the SAT areas were known to be subsistence farmers. But the situation is fast
changing with the farmers shifting to commercial crops and a better linking of the villages with
the markets. The pattern of utilization of farm produce in the Mahaboobnagar villages is
presented in table 17.
Table 17. Utilization pattern of Farm Produce (grain) in VLS villages of Mahaboobnagar district (in Kgs).
Village Crop Total production Used for own consumption Retained for other uses
Sold in themarket
Percentage produce sold
Aurepalle Paddy 111225 21650 17875 71700 64 Cotton 47263 0 0 47263 100 Castor 9514 0 0 9514 100 Sorghum 2625 2060 90 475 18 Pigeonpea 1591 741 25 825 52 Sunflower 350 0 0 350 100 Dokur Paddy 63185 12850 16460 33875 54 Cotton 1430 0 0 1430 100 Castor 8900 0 0 8900 100 Sorghum 2850 1745 105 1000 35 Pigeonpea 706 696 10 0 0 Finger millet 2000 20 0 1980 99 Groundnut 1400 25 175 1200 86
In case of commercial crops like castor, cotton and sunflower, the entire produce was
sold. Most of the production of sorghum and pigeon pea was retained for own consumption and
other uses. More than one half of paddy production was sold in the market. In Dokur, the bulk of
production of finger millet and groundnut was also sold in the market.
The utilization pattern of farm produce in Solapur villages is presented in table 18. In these
villages, a substantial part of wheat, maize and rabi sorghum was retained by the households for
consumption and other uses.
21
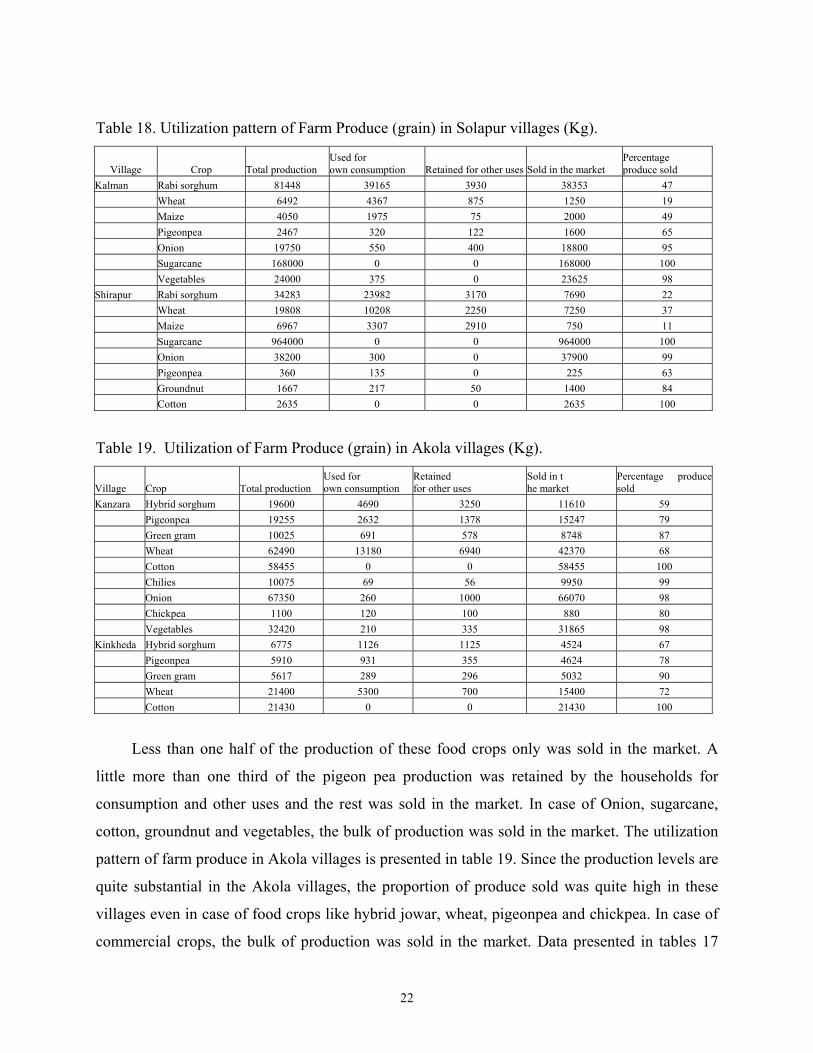
Table 18. Utilization pattern of Farm Produce (grain) in Solapur villages (Kg).
Village Crop Total production Used for own consumption Retained for other uses Sold in the market
Percentage produce sold
Kalman Rabi sorghum 81448 39165 3930 38353 47 Wheat 6492 4367 875 1250 19 Maize 4050 1975 75 2000 49 Pigeonpea 2467 320 122 1600 65 Onion 19750 550 400 18800 95 Sugarcane 168000 0 0 168000 100 Vegetables 24000 375 0 23625 98 Shirapur Rabi sorghum 34283 23982 3170 7690 22 Wheat 19808 10208 2250 7250 37 Maize 6967 3307 2910 750 11 Sugarcane 964000 0 0 964000 100 Onion 38200 300 0 37900 99 Pigeonpea 360 135 0 225 63 Groundnut 1667 217 50 1400 84 Cotton 2635 0 0 2635 100
Table 19. Utilization of Farm Produce (grain) in Akola villages (Kg).
Village Crop Total production Used for own consumption
Retained for other uses
Sold in t he market
Percentage produce sold
Kanzara Hybrid sorghum 19600 4690 3250 11610 59 Pigeonpea 19255 2632 1378 15247 79 Green gram 10025 691 578 8748 87 Wheat 62490 13180 6940 42370 68 Cotton 58455 0 0 58455 100 Chilies 10075 69 56 9950 99 Onion 67350 260 1000 66070 98 Chickpea 1100 120 100 880 80 Vegetables 32420 210 335 31865 98 Kinkheda Hybrid sorghum 6775 1126 1125 4524 67 Pigeonpea 5910 931 355 4624 78 Green gram 5617 289 296 5032 90 Wheat 21400 5300 700 15400 72 Cotton 21430 0 0 21430 100
Less than one half of the production of these food crops only was sold in the market. A
little more than one third of the pigeon pea production was retained by the households for
consumption and other uses and the rest was sold in the market. In case of Onion, sugarcane,
cotton, groundnut and vegetables, the bulk of production was sold in the market. The utilization
pattern of farm produce in Akola villages is presented in table 19. Since the production levels are
quite substantial in the Akola villages, the proportion of produce sold was quite high in these
villages even in case of food crops like hybrid jowar, wheat, pigeonpea and chickpea. In case of
commercial crops, the bulk of production was sold in the market. Data presented in tables 17
22
through 19 highlight the fact that the farmers in the SAT villages are selling a substantial
proportion of their produce in the market. Crop shifts in favour of commercial crops and reduced
transaction costs are mainly responsible for the transformation of subsistence agriculture into
commercial agriculture even in the rainfed areas of Semi-Arid Tropics.
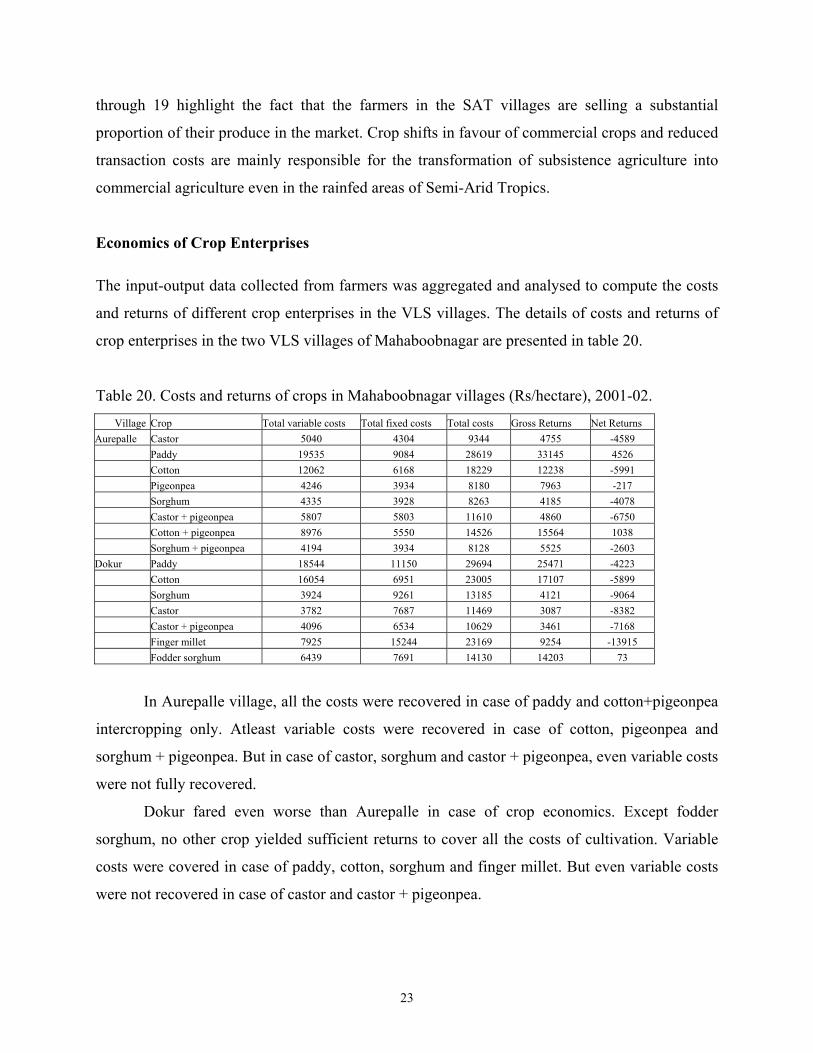
Economics of Crop Enterprises The input-output data collected from farmers was aggregated and analysed to compute the costs
and returns of different crop enterprises in the VLS villages. The details of costs and returns of
crop enterprises in the two VLS villages of Mahaboobnagar are presented in table 20.
Table 20. Costs and returns of crops in Mahaboobnagar villages (Rs/hectare), 2001-02. Village Crop Total fixed costs Total costs Gross Returns Net Returns Aurepalle Castor 5040 9344 4755
Total variable costs 4304 -4589
Paddy 19535 9084 28619 33145 4526 Cotton 12062 6168 18229 12238 -5991 Pigeonpea 4246 3934 8180 7963 -217 Sorghum 4335 3928 8263 4185 -4078 Castor + pigeonpea 5807 5803 11610 4860 -6750 Cotton + pigeonpea 8976 5550 14526 15564 1038 Sorghum + pigeonpea 4194 3934 8128 5525 -2603 Dokur Paddy 18544 11150 29694 25471 -4223 Cotton 16054 6951 23005 17107 -5899 Sorghum 3924 9261 13185 4121 -9064 Castor 3782 7687 11469 3087 -8382 Castor + pigeonpea 4096 6534 10629 3461 -7168 Finger millet 7925 15244 23169 9254 -13915 Fodder sorghum 6439 7691 14130 14203 73
In Aurepalle village, all the costs were recovered in case of paddy and cotton+pigeonpea
intercropping only. Atleast variable costs were recovered in case of cotton, pigeonpea and
sorghum + pigeonpea. But in case of castor, sorghum and castor + pigeonpea, even variable costs
were not fully recovered.
Dokur fared even worse than Aurepalle in case of crop economics. Except fodder
sorghum, no other crop yielded sufficient returns to cover all the costs of cultivation. Variable
costs were covered in case of paddy, cotton, sorghum and finger millet. But even variable costs
were not recovered in case of castor and castor + pigeonpea.
23
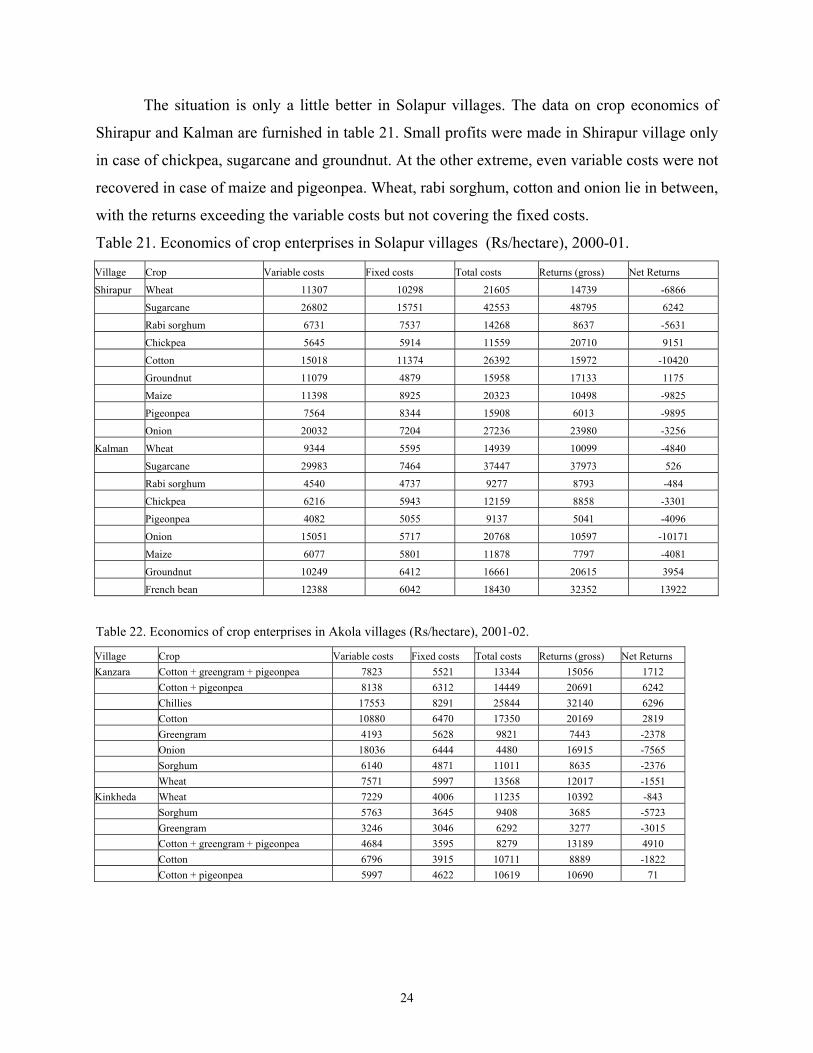
The situation is only a little better in Solapur villages. The data on crop economics of
Shirapur and Kalman are furnished in table 21. Small profits were made in Shirapur village only
in case of chickpea, sugarcane and groundnut. At the other extreme, even variable costs were not
recovered in case of maize and pigeonpea. Wheat, rabi sorghum, cotton and onion lie in between,
with the returns exceeding the variable costs but not covering the fixed costs.
Table 21. Economics of crop enterprises in Solapur villages (Rs/hectare), 2000-01.
Village Crop Variable costs Fixed costs Total costs Returns (gross) Net Returns
Shirapur Wheat 11307 10298 21605 14739 -6866
Sugarcane 26802 15751 42553 48795 6242
Rabi sorghum 6731 7537 14268 8637 -5631
Chickpea 5645 5914 11559 20710 9151
Cotton 15018 11374 26392 15972 -10420
Groundnut 11079 4879 15958 17133 1175
Maize 11398 8925 20323 10498 -9825
Pigeonpea 7564 8344 15908 6013 -9895
Onion 20032 7204 27236 23980 -3256
Kalman Wheat 9344 5595 14939 10099 -4840
Sugarcane 29983 7464 37447 37973 526
Rabi sorghum 4540 4737 9277 8793 -484
Chickpea 6216 5943 12159 8858 -3301
Pigeonpea 4082 5055 9137 5041 -4096
Onion 15051 5717 20768 10597 -10171
Maize 6077 5801 11878 7797 -4081
Groundnut 10249 6412 16661 20615 3954
French bean 12388 6042 18430 32352 13922
Table 22. Economics of crop enterprises in Akola villages (Rs/hectare), 2001-02.
Village Crop Variable costs Fixed costs Total costs Returns (gross) Net Returns Kanzara Cotton + greengram + pigeonpea 7823 5521 13344 15056 1712 Cotton + pigeonpea 8138 6312 14449 20691 6242 Chillies 17553 8291 25844 32140 6296 Cotton 10880 6470 17350 20169 2819 Greengram 4193 5628 9821 7443 -2378 Onion 18036 6444 4480 16915 -7565 Sorghum 6140 4871 11011 8635 -2376 Wheat 7571 5997 13568 12017 -1551 Kinkheda Wheat 7229 4006 11235 10392 -843 Sorghum 5763 3645 9408 3685 -5723 Greengram 3246 3046 6292 3277 -3015 Cotton + greengram + pigeonpea 4684 3595 8279 13189 4910 Cotton 6796 3915 10711 8889 -1822 Cotton + pigeonpea 5997 4622 10619 10690 71
24
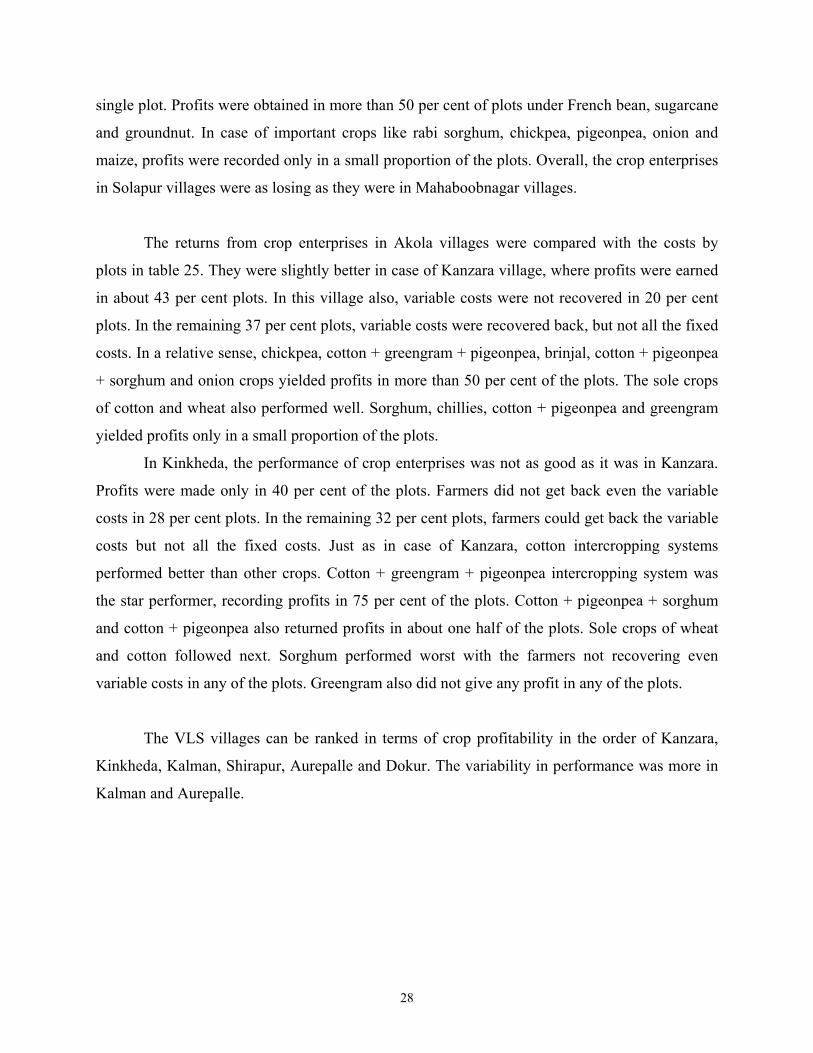
In Kalman also, farmers made small profits in case of sugarcane and groundnut, besides French
bean. In case of wheat, rabi sorghum, chickpea, pigeonpea and maize, farmers could get back the
variable costs but not the fixed costs. They did not recover even variable costs in case of onion.
The crop economics were a little better in Akola villages. In Kanzara village, cotton,
chillies and cotton-based intercropping systems could recover all costs and yielded some profits.
But in case of greengram, onion, sorghum and wheat, farmers could recover the variable costs,
but not all the fixed costs. They ended up with small to moderate losses in case of these crops. In
Kinkheda village, the farmers did not recover even the variable costs in case of sorghum. They
could recover variable costs in case of wheat, greengram and cotton, but not all the fixed costs.
However, they recovered all costs and earned small profits in case of cotton-based cropping
system.
Distribution of returns by plots in Mahaboobnagar villages
The average costs and returns of different crops are presented in tables 20 through 22. But the
presentation of costs and returns from different crops by plots will give the proportion of plots
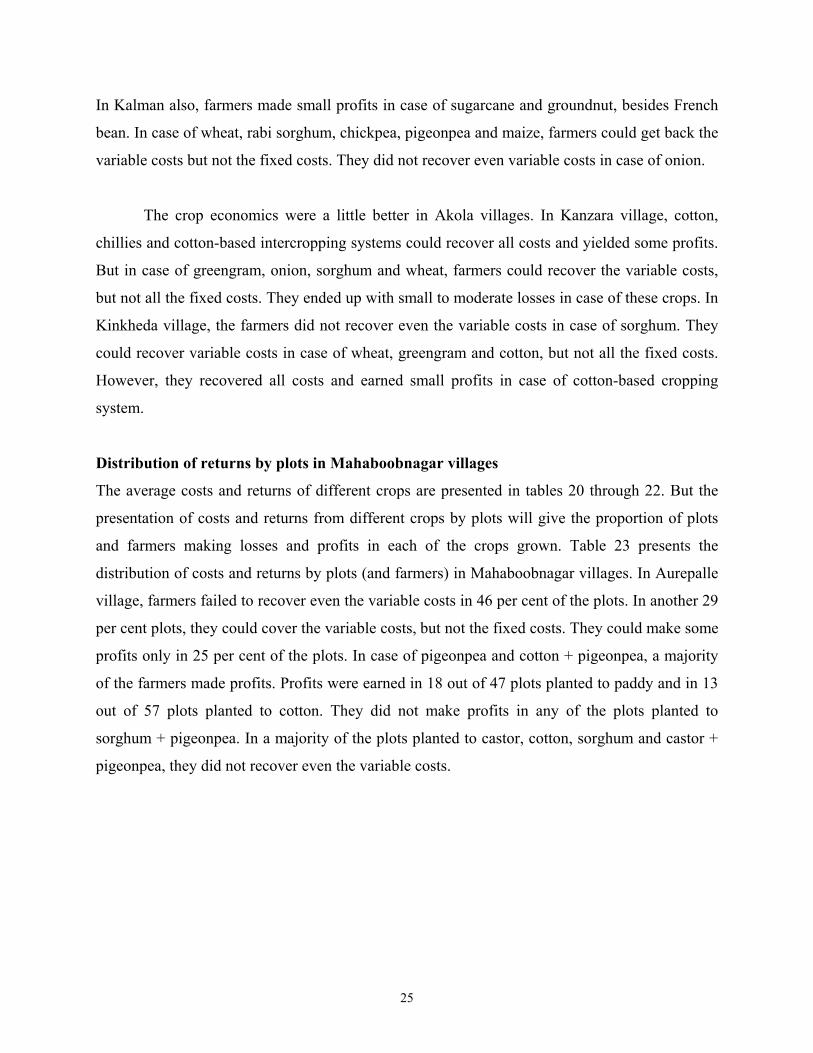
and farmers making losses and profits in each of the crops grown. Table 23 presents the
distribution of costs and returns by plots (and farmers) in Mahaboobnagar villages. In Aurepalle
village, farmers failed to recover even the variable costs in 46 per cent of the plots. In another 29
per cent plots, they could cover the variable costs, but not the fixed costs. They could make some
profits only in 25 per cent of the plots. In case of pigeonpea and cotton + pigeonpea, a majority
of the farmers made profits. Profits were earned in 18 out of 47 plots planted to paddy and in 13
out of 57 plots planted to cotton. They did not make profits in any of the plots planted to
sorghum + pigeonpea. In a majority of the plots planted to castor, cotton, sorghum and castor +
pigeonpea, they did not recover even the variable costs.
25
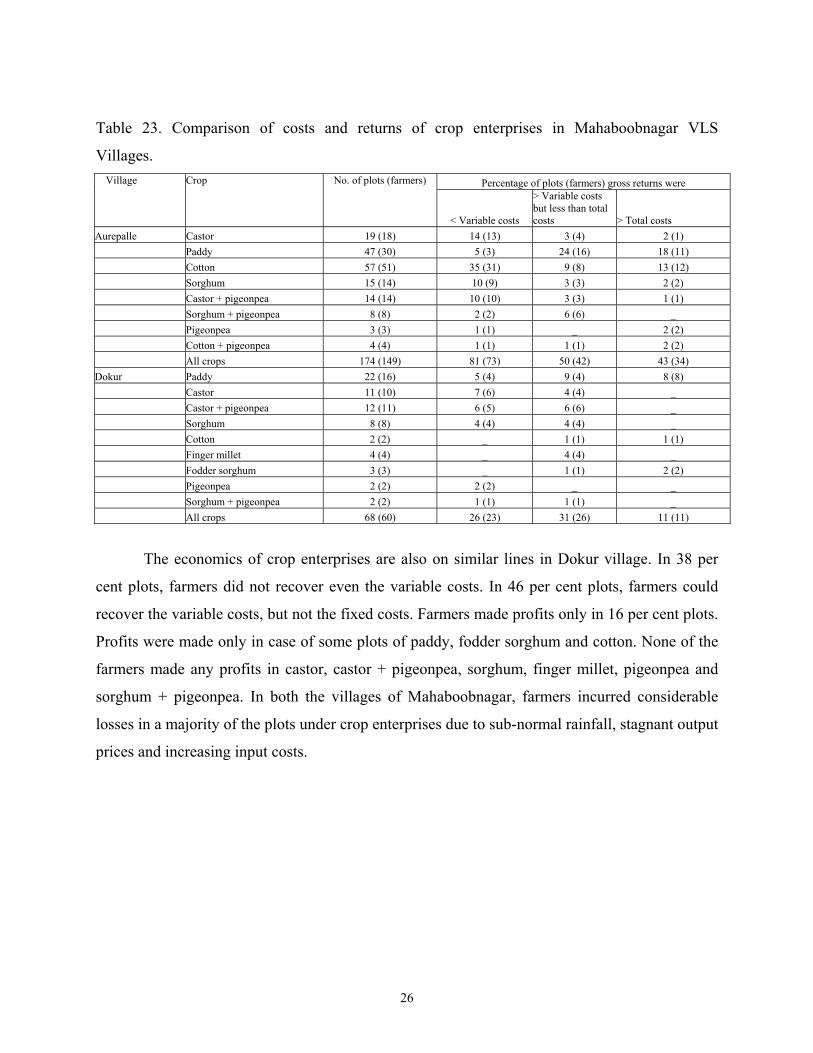
Table 23. Comparison of costs and returns of crop enterprises in Mahaboobnagar VLS
Villages. Percentage of plots (farmers) gross returns were Village Crop No. of plots (farmers)
< Variable costs
> Variable costs but less than total costs > Total costs
Aurepalle Castor 19 (18) 14 (13) 3 (4) 2 (1) Paddy 47 (30) 5 (3) 24 (16) 18 (11) Cotton 57 (51) 35 (31) 9 (8) 13 (12) Sorghum 15 (14) 10 (9) 3 (3) 2 (2) Castor + pigeonpea 14 (14) 10 (10) 3 (3) 1 (1) Sorghum + pigeonpea 8 (8) 2 (2) 6 (6) _ Pigeonpea 3 (3) 1 (1) _ 2 (2) Cotton + pigeonpea 4 (4) 1 (1) 1 (1) 2 (2) All crops 174 (149) 81 (73) 50 (42) 43 (34) Dokur Paddy 22 (16) 5 (4) 9 (4) 8 (8) Castor 11 (10) 7 (6) 4 (4) _ Castor + pigeonpea 12 (11) 6 (5) 6 (6) _ Sorghum 8 (8) 4 (4) 4 (4) _ Cotton 2 (2) _ 1 (1) 1 (1) Finger millet 4 (4) _ 4 (4) _ Fodder sorghum 3 (3) _ 1 (1) 2 (2) Pigeonpea 2 (2) 2 (2) _ _ Sorghum + pigeonpea 2 (2) 1 (1) 1 (1) _ All crops 68 (60) 26 (23) 31 (26) 11 (11)
The economics of crop enterprises are also on similar lines in Dokur village. In 38 per
cent plots, farmers did not recover even the variable costs. In 46 per cent plots, farmers could
recover the variable costs, but not the fixed costs. Farmers made profits only in 16 per cent plots.
Profits were made only in case of some plots of paddy, fodder sorghum and cotton. None of the
farmers made any profits in castor, castor + pigeonpea, sorghum, finger millet, pigeonpea and
sorghum + pigeonpea. In both the villages of Mahaboobnagar, farmers incurred considerable
losses in a majority of the plots under crop enterprises due to sub-normal rainfall, stagnant output
prices and increasing input costs.
26
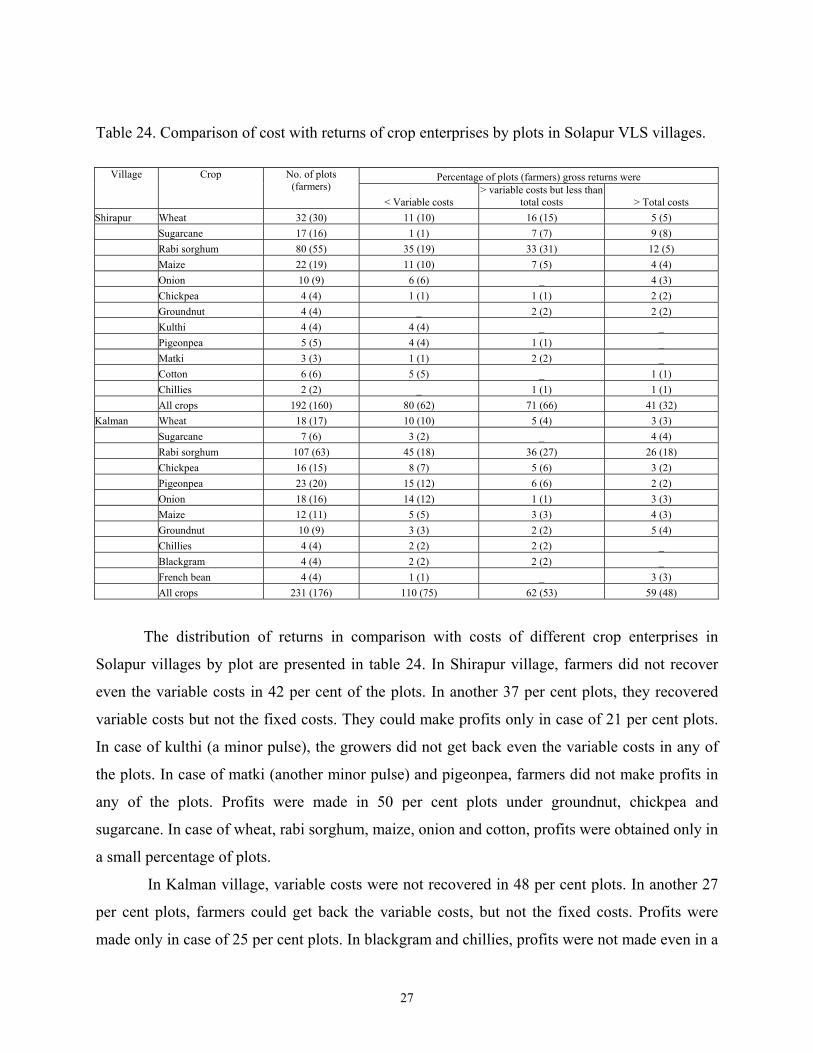
Table 24. Comparison of cost with returns of crop enterprises by plots in Solapur VLS villages.
Percentage of plots (farmers) gross returns were Village Crop No. of plots
(farmers) < Variable costs
> variable costs but less than total costs > Total costs
Shirapur Wheat 32 (30) 11 (10) 16 (15) 5 (5) Sugarcane 17 (16) 1 (1) 7 (7) 9 (8) Rabi sorghum 80 (55) 35 (19) 33 (31) 12 (5) Maize 22 (19) 11 (10) 7 (5) 4 (4) Onion 10 (9) 6 (6) _ 4 (3) Chickpea 4 (4) 1 (1) 1 (1) 2 (2) Groundnut 4 (4) _ 2 (2) 2 (2) Kulthi 4 (4) 4 (4) _ _ Pigeonpea 5 (5) 4 (4) 1 (1) _ Matki 3 (3) 1 (1) 2 (2) _ Cotton 6 (6) 5 (5) _ 1 (1) Chillies 2 (2) _ 1 (1) 1 (1) All crops 192 (160) 80 (62) 71 (66) 41 (32) Kalman Wheat 18 (17) 10 (10) 5 (4) 3 (3) Sugarcane 7 (6) 3 (2) _ 4 (4) Rabi sorghum 107 (63) 45 (18) 36 (27) 26 (18) Chickpea 16 (15) 8 (7) 5 (6) 3 (2) Pigeonpea 23 (20) 15 (12) 6 (6) 2 (2) Onion 18 (16) 14 (12) 1 (1) 3 (3) Maize 12 (11) 5 (5) 3 (3) 4 (3) Groundnut 10 (9) 3 (3) 2 (2) 5 (4) Chillies 4 (4) 2 (2) 2 (2) _ Blackgram 4 (4) 2 (2) 2 (2) _ French bean 4 (4) 1 (1) _ 3 (3) All crops 231 (176) 110 (75) 62 (53) 59 (48)
The distribution of returns in comparison with costs of different crop enterprises in
Solapur villages by plot are presented in table 24. In Shirapur village, farmers did not recover
even the variable costs in 42 per cent of the plots. In another 37 per cent plots, they recovered
variable costs but not the fixed costs. They could make profits only in case of 21 per cent plots.
In case of kulthi (a minor pulse), the growers did not get back even the variable costs in any of
the plots. In case of matki (another minor pulse) and pigeonpea, farmers did not make profits in
any of the plots. Profits were made in 50 per cent plots under groundnut, chickpea and
sugarcane. In case of wheat, rabi sorghum, maize, onion and cotton, profits were obtained only in
a small percentage of plots.
In Kalman village, variable costs were not recovered in 48 per cent plots. In another 27
per cent plots, farmers could get back the variable costs, but not the fixed costs. Profits were
made only in case of 25 per cent plots. In blackgram and chillies, profits were not made even in a
27
single plot. Profits were obtained in more than 50 per cent of plots under French bean, sugarcane
and groundnut. In case of important crops like rabi sorghum, chickpea, pigeonpea, onion and
maize, profits were recorded only in a small proportion of the plots. Overall, the crop enterprises
in Solapur villages were as losing as they were in Mahaboobnagar villages.
The returns from crop enterprises in Akola villages were compared with the costs by
plots in table 25. They were slightly better in case of Kanzara village, where profits were earned
in about 43 per cent plots. In this village also, variable costs were not recovered in 20 per cent
plots. In the remaining 37 per cent plots, variable costs were recovered back, but not all the fixed
costs. In a relative sense, chickpea, cotton + greengram + pigeonpea, brinjal, cotton + pigeonpea
+ sorghum and onion crops yielded profits in more than 50 per cent of the plots. The sole crops
of cotton and wheat also performed well. Sorghum, chillies, cotton + pigeonpea and greengram
yielded profits only in a small proportion of the plots.
In Kinkheda, the performance of crop enterprises was not as good as it was in Kanzara.
Profits were made only in 40 per cent of the plots. Farmers did not get back even the variable
costs in 28 per cent plots. In the remaining 32 per cent plots, farmers could get back the variable
costs but not all the fixed costs. Just as in case of Kanzara, cotton intercropping systems
performed better than other crops. Cotton + greengram + pigeonpea intercropping system was
the star performer, recording profits in 75 per cent of the plots. Cotton + pigeonpea + sorghum
and cotton + pigeonpea also returned profits in about one half of the plots. Sole crops of wheat
and cotton followed next. Sorghum performed worst with the farmers not recovering even
variable costs in any of the plots. Greengram also did not give any profit in any of the plots.
The VLS villages can be ranked in terms of crop profitability in the order of Kanzara,
Kinkheda, Kalman, Shirapur, Aurepalle and Dokur. The variability in performance was more in
Kalman and Aurepalle.
28
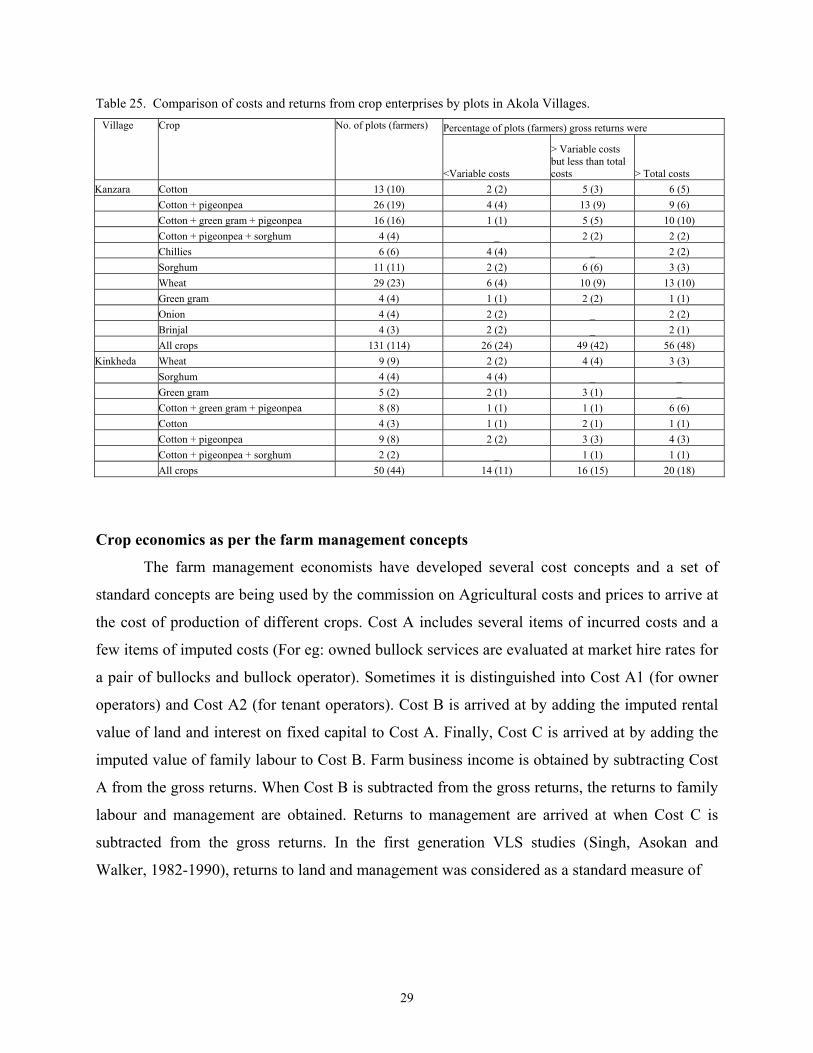
Table 25. Comparison of costs and returns from crop enterprises by plots in Akola Villages.
Percentage of plots (farmers) gross returns were Village Crop No. of plots (farmers)
<Variable costs
> Variable costs but less than total costs > Total costs
Kanzara Cotton 13 (10) 2 (2) 5 (3) 6 (5) Cotton + pigeonpea 26 (19) 4 (4) 13 (9) 9 (6) Cotton + green gram + pigeonpea 16 (16) 1 (1) 5 (5) 10 (10) Cotton + pigeonpea + sorghum 4 (4) _ 2 (2) 2 (2) Chillies 6 (6) 4 (4) _ 2 (2) Sorghum 11 (11) 2 (2) 6 (6) 3 (3) Wheat 29 (23) 6 (4) 10 (9) 13 (10) Green gram 4 (4) 1 (1) 2 (2) 1 (1) Onion 4 (4) 2 (2) _ 2 (2) Brinjal 4 (3) 2 (2) _ 2 (1) All crops 131 (114) 26 (24) 49 (42) 56 (48) Kinkheda Wheat 9 (9) 2 (2) 4 (4) 3 (3) Sorghum 4 (4) 4 (4) _ _ Green gram 5 (2) 2 (1) 3 (1) _ Cotton + green gram + pigeonpea 8 (8) 1 (1) 1 (1) 6 (6) Cotton 4 (3) 1 (1) 2 (1) 1 (1) Cotton + pigeonpea 9 (8) 2 (2) 3 (3) 4 (3) Cotton + pigeonpea + sorghum 2 (2) _ 1 (1) 1 (1) All crops 50 (44) 14 (11) 16 (15) 20 (18)
Crop economics as per the farm management concepts
The farm management economists have developed several cost concepts and a set of
standard concepts are being used by the commission on Agricultural costs and prices to arrive at
the cost of production of different crops. Cost A includes several items of incurred costs and a
few items of imputed costs (For eg: owned bullock services are evaluated at market hire rates for
a pair of bullocks and bullock operator). Sometimes it is distinguished into Cost A1 (for owner
operators) and Cost A2 (for tenant operators). Cost B is arrived at by adding the imputed rental
value of land and interest on fixed capital to Cost A. Finally, Cost C is arrived at by adding the
imputed value of family labour to Cost B. Farm business income is obtained by subtracting Cost
A from the gross returns. When Cost B is subtracted from the gross returns, the returns to family
labour and management are obtained. Returns to management are arrived at when Cost C is
subtracted from the gross returns. In the first generation VLS studies (Singh, Asokan and
Walker, 1982-1990), returns to land and management was considered as a standard measure of
29
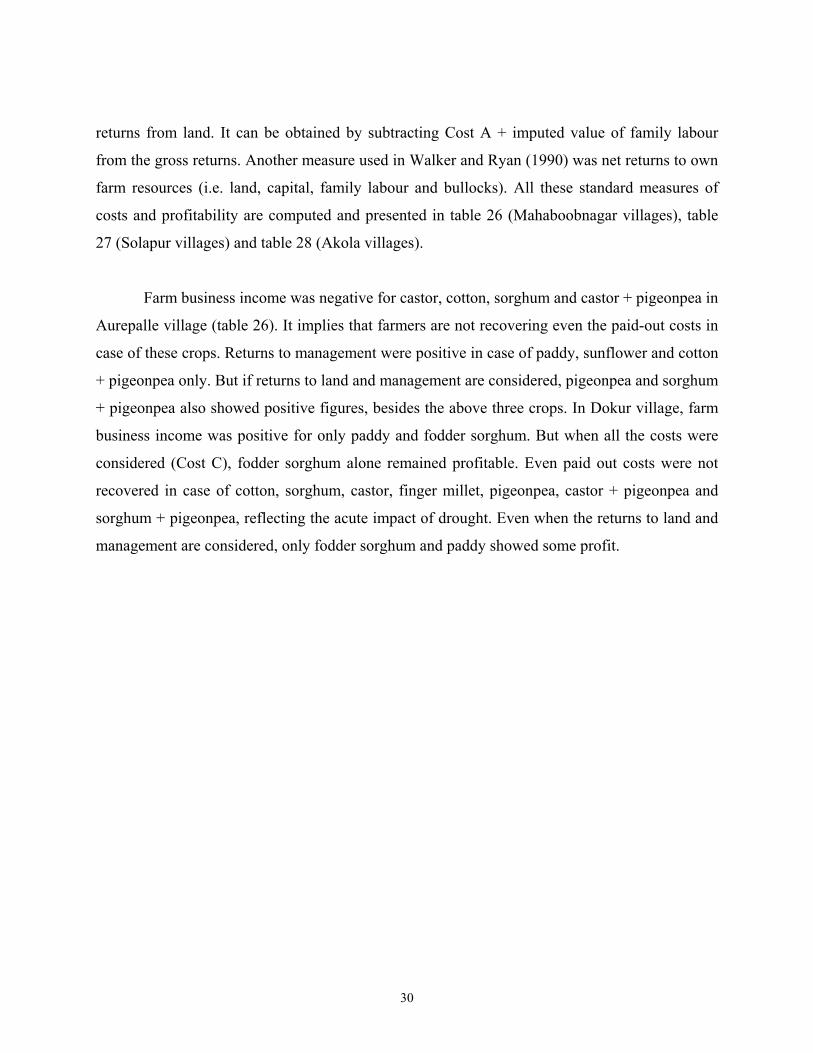
returns from land. It can be obtained by subtracting Cost A + imputed value of family labour
from the gross returns. Another measure used in Walker and Ryan (1990) was net returns to own
farm resources (i.e. land, capital, family labour and bullocks). All these standard measures of
costs and profitability are computed and presented in table 26 (Mahaboobnagar villages), table
27 (Solapur villages) and table 28 (Akola villages).
Farm business income was negative for castor, cotton, sorghum and castor + pigeonpea in
Aurepalle village (table 26). It implies that farmers are not recovering even the paid-out costs in
case of these crops. Returns to management were positive in case of paddy, sunflower and cotton
+ pigeonpea only. But if returns to land and management are considered, pigeonpea and sorghum
+ pigeonpea also showed positive figures, besides the above three crops. In Dokur village, farm
business income was positive for only paddy and fodder sorghum. But when all the costs were
considered (Cost C), fodder sorghum alone remained profitable. Even paid out costs were not
recovered in case of cotton, sorghum, castor, finger millet, pigeonpea, castor + pigeonpea and
sorghum + pigeonpea, reflecting the acute impact of drought. Even when the returns to land and
management are considered, only fodder sorghum and paddy showed some profit.
30
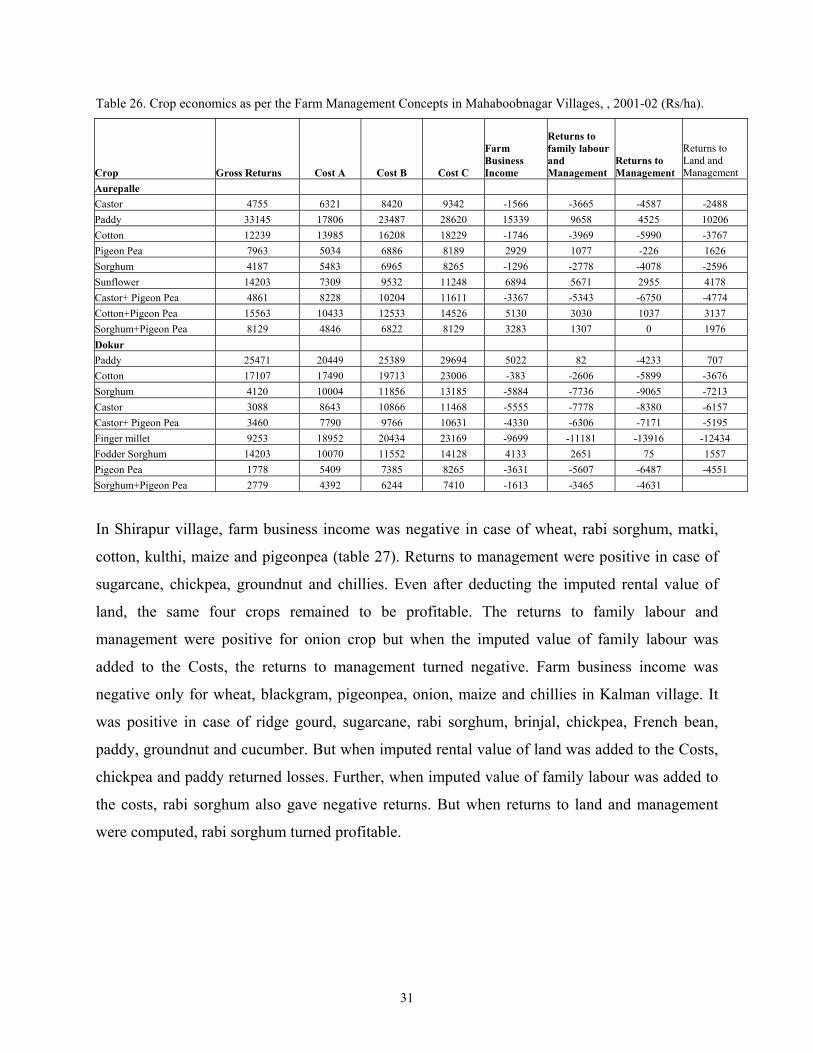
Table 26. Crop economics as per the Farm Management Concepts in Mahaboobnagar Villages, , 2001-02 (Rs/ha).
Crop Gross Returns Cost A Cost B Cost C
Farm Business Income
Returns to family labour and Management
Returns to Management
Returns to Land and Management
Aurepalle Castor 4755 6321 8420 9342 -1566 -3665 -4587 -2488 Paddy 33145 17806 23487 28620 15339 9658 4525 10206 Cotton 12239 13985 16208 18229 -1746 -3969 -5990 -3767 Pigeon Pea 7963 5034 6886 8189 2929 1077 -226 1626 Sorghum 4187 5483 6965 8265 -1296 -2778 -4078 -2596 Sunflower 14203 7309 9532 11248 6894 5671 2955 4178 Castor+ Pigeon Pea 4861 8228 10204 11611 -3367 -5343 -6750 -4774 Cotton+Pigeon Pea 15563 10433 12533 14526 5130 3030 1037 3137 Sorghum+Pigeon Pea 8129 4846 6822 8129 3283 1307 0 1976 Dokur Paddy 25471 20449 25389 29694 5022 82 -4233 707 Cotton 17107 17490 19713 23006 -383 -2606 -5899 -3676 Sorghum 4120 10004 11856 13185 -5884 -7736 -9065 -7213 Castor 3088 8643 10866 11468 -5555 -7778 -8380 -6157 Castor+ Pigeon Pea 3460 7790 9766 10631 -4330 -6306 -7171 -5195 Finger millet 9253 18952 20434 23169 -9699 -11181 -13916 -12434 Fodder Sorghum 14203 10070 11552 14128 4133 2651 75 1557 Pigeon Pea 1778 5409 7385 8265 -3631 -5607 -6487 -4551 Sorghum+Pigeon Pea 2779 4392 6244 7410 -1613 -3465 -4631
In Shirapur village, farm business income was negative in case of wheat, rabi sorghum, matki,
cotton, kulthi, maize and pigeonpea (table 27). Returns to management were positive in case of
sugarcane, chickpea, groundnut and chillies. Even after deducting the imputed rental value of
land, the same four crops remained to be profitable. The returns to family labour and
management were positive for onion crop but when the imputed value of family labour was
added to the Costs, the returns to management turned negative. Farm business income was
negative only for wheat, blackgram, pigeonpea, onion, maize and chillies in Kalman village. It
was positive in case of ridge gourd, sugarcane, rabi sorghum, brinjal, chickpea, French bean,
paddy, groundnut and cucumber. But when imputed rental value of land was added to the Costs,
chickpea and paddy returned losses. Further, when imputed value of family labour was added to
the costs, rabi sorghum also gave negative returns. But when returns to land and management
were computed, rabi sorghum turned profitable.
31
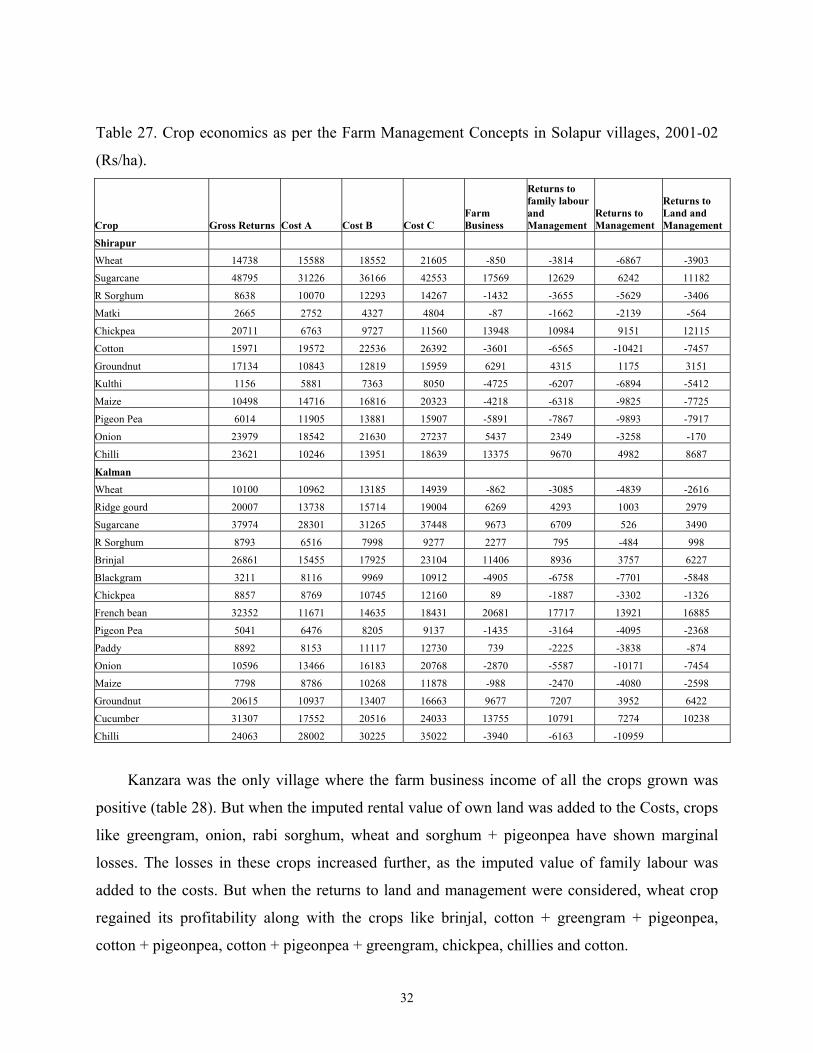
Table 27. Crop economics as per the Farm Management Concepts in Solapur villages, 2001-02
(Rs/ha).
Crop Gross Returns Cost A Cost B Cost C Farm Business
Returns to family labour and Management
Returns to Management
Returns to Land and Management
Shirapur
Wheat 14738 15588 18552 21605 -850 -3814 -6867 -3903
Sugarcane 48795 31226 36166 42553 17569 12629 6242 11182
R Sorghum 8638 10070 12293 14267 -1432 -3655 -5629 -3406
Matki 2665 2752 4327 4804 -87 -1662 -2139 -564
Chickpea 20711 6763 9727 11560 13948 10984 9151 12115
Cotton 15971 19572 22536 26392 -3601 -6565 -10421 -7457
Groundnut 17134 10843 12819 15959 6291 4315 1175 3151
Kulthi 1156 5881 7363 8050 -4725 -6207 -6894 -5412
Maize 10498 14716 16816 20323 -4218 -6318 -9825 -7725
Pigeon Pea 6014 11905 13881 15907 -5891 -7867 -9893 -7917
Onion 23979 18542 21630 27237 5437 2349 -3258 -170
Chilli 23621 10246 13951 18639 13375 9670 4982 8687
Kalman
Wheat 10100 10962 13185 14939 -862 -3085 -4839 -2616
Ridge gourd 20007 13738 15714 19004 6269 4293 1003 2979
Sugarcane 37974 28301 31265 37448 9673 6709 526 3490
R Sorghum 8793 6516 7998 9277 2277 795 -484 998
Brinjal 26861 15455 17925 23104 11406 8936 3757 6227
Blackgram 3211 8116 9969 10912 -4905 -6758 -7701 -5848
Chickpea 8857 8769 10745 12160 89 -1887 -3302 -1326
French bean 32352 11671 14635 18431 20681 17717 13921 16885
Pigeon Pea 5041 6476 8205 9137 -1435 -3164 -4095 -2368
Paddy 8892 8153 11117 12730 739 -2225 -3838 -874
Onion 10596 13466 16183 20768 -2870 -5587 -10171 -7454
Maize 7798 8786 10268 11878 -988 -2470 -4080 -2598
Groundnut 20615 10937 13407 16663 9677 7207 3952 6422
Cucumber 31307 17552 20516 24033 13755 10791 7274 10238
Chilli 24063 28002 30225 35022 -3940 -6163 -10959
Kanzara was the only village where the farm business income of all the crops grown was
positive (table 28). But when the imputed rental value of own land was added to the Costs, crops
like greengram, onion, rabi sorghum, wheat and sorghum + pigeonpea have shown marginal
losses. The losses in these crops increased further, as the imputed value of family labour was
added to the costs. But when the returns to land and management were considered, wheat crop
regained its profitability along with the crops like brinjal, cotton + greengram + pigeonpea,
cotton + pigeonpea, cotton + pigeonpea + greengram, chickpea, chillies and cotton.
32
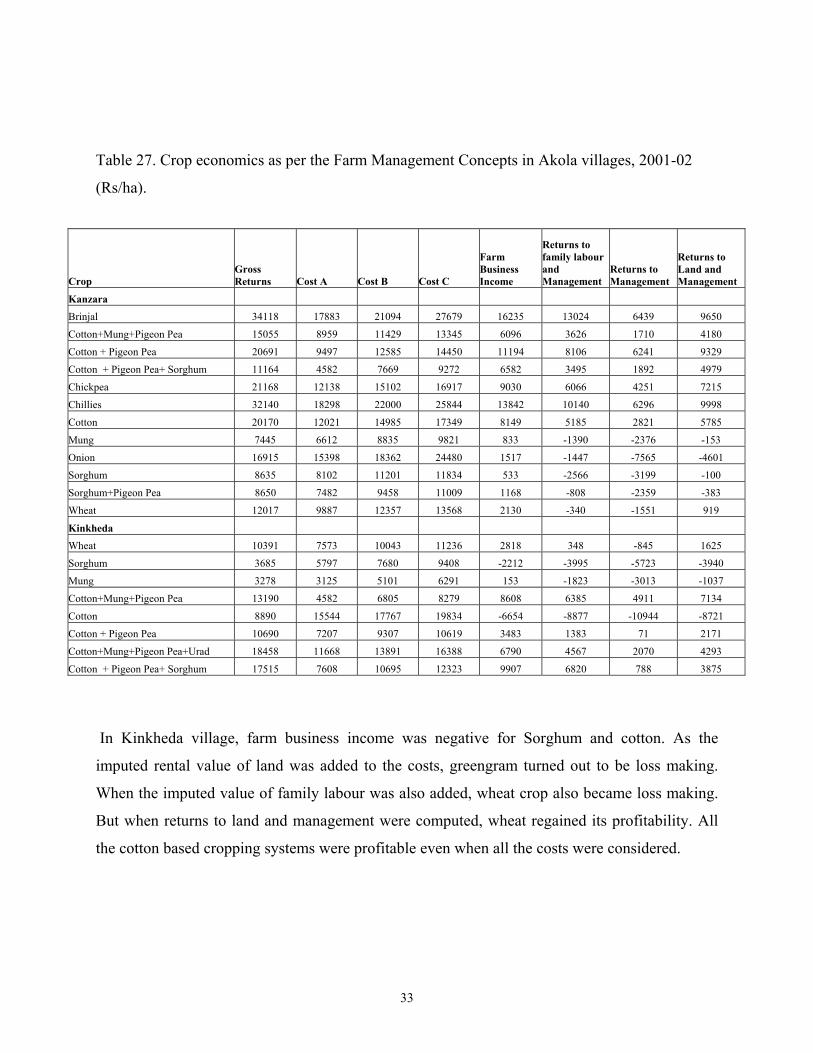
Table 27. Crop economics as per the Farm Management Concepts in Akola villages, 2001-02
(Rs/ha).
Crop Gross Returns Cost A Cost B Cost C
Farm Business Income
Returns to family labour and Management
Returns to Management
Returns to Land and Management
Kanzara
Brinjal 34118 17883 21094 27679 16235 13024 6439 9650
Cotton+Mung+Pigeon Pea 15055 8959 11429 13345 6096 3626 1710 4180
Cotton + Pigeon Pea 20691 9497 12585 14450 11194 8106 6241 9329
Cotton + Pigeon Pea+ Sorghum 11164 4582 7669 9272 6582 3495 1892 4979
Chickpea 21168 12138 15102 16917 9030 6066 4251 7215
Chillies 32140 18298 22000 25844 13842 10140 6296 9998
Cotton 20170 12021 14985 17349 8149 5185 2821 5785
Mung 7445 6612 8835 9821 833 -1390 -2376 -153
Onion 16915 15398 18362 24480 1517 -1447 -7565 -4601
Sorghum 8635 8102 11201 11834 533 -2566 -3199 -100
Sorghum+Pigeon Pea 8650 7482 9458 11009 1168 -808 -2359 -383
Wheat 12017 9887 12357 13568 2130 -340 -1551 919
Kinkheda
Wheat 10391 7573 10043 11236 2818 348 -845 1625
Sorghum 3685 5797 7680 9408 -2212 -3995 -5723 -3940
Mung 3278 3125 5101 6291 153 -1823 -3013 -1037
Cotton+Mung+Pigeon Pea 13190 4582 6805 8279 8608 6385 4911 7134
Cotton 8890 15544 17767 19834 -6654 -8877 -10944 -8721
Cotton + Pigeon Pea 10690 7207 9307 10619 3483 1383 71 2171
Cotton+Mung+Pigeon Pea+Urad 18458 11668 13891 16388 6790 4567 2070 4293
Cotton + Pigeon Pea+ Sorghum 17515 7608 10695 12323 9907 6820 788 3875
In Kinkheda village, farm business income was negative for Sorghum and cotton. As the
imputed rental value of land was added to the costs, greengram turned out to be loss making.
When the imputed value of family labour was also added, wheat crop also became loss making.
But when returns to land and management were computed, wheat regained its profitability. All
the cotton based cropping systems were profitable even when all the costs were considered.
33
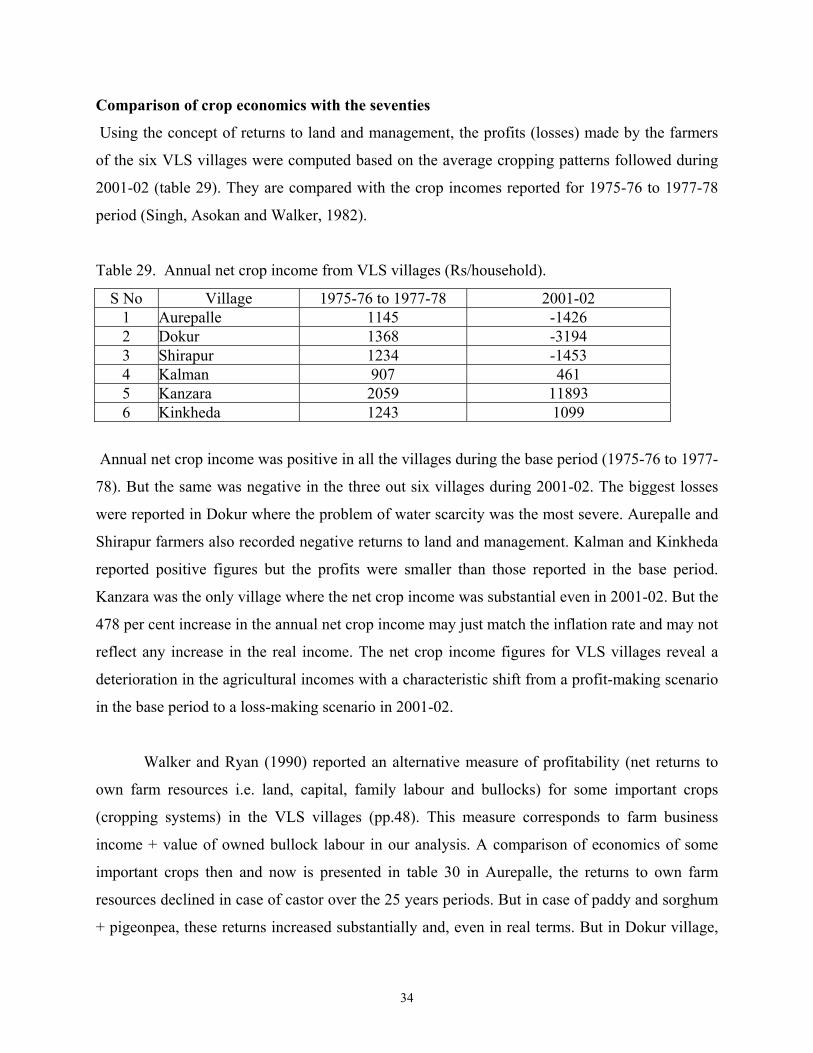
Comparison of crop economics with the seventies
Using the concept of returns to land and management, the profits (losses) made by the farmers
of the six VLS villages were computed based on the average cropping patterns followed during
2001-02 (table 29). They are compared with the crop incomes reported for 1975-76 to 1977-78
period (Singh, Asokan and Walker, 1982).
Table 29. Annual net crop income from VLS villages (Rs/household).
S No Village 1975-76 to 1977-78 2001-02 1 Aurepalle 1145 -1426 2 Dokur 1368 -3194 3 Shirapur 1234 -1453 4 Kalman 907 461 5 Kanzara 2059 11893 6 Kinkheda 1243 1099
Annual net crop income was positive in all the villages during the base period (1975-76 to 1977-
78). But the same was negative in the three out six villages during 2001-02. The biggest losses
were reported in Dokur where the problem of water scarcity was the most severe. Aurepalle and
Shirapur farmers also recorded negative returns to land and management. Kalman and Kinkheda
reported positive figures but the profits were smaller than those reported in the base period.
Kanzara was the only village where the net crop income was substantial even in 2001-02. But the
478 per cent increase in the annual net crop income may just match the inflation rate and may not
reflect any increase in the real income. The net crop income figures for VLS villages reveal a
deterioration in the agricultural incomes with a characteristic shift from a profit-making scenario
in the base period to a loss-making scenario in 2001-02.
Walker and Ryan (1990) reported an alternative measure of profitability (net returns to
own farm resources i.e. land, capital, family labour and bullocks) for some important crops
(cropping systems) in the VLS villages (pp.48). This measure corresponds to farm business
income + value of owned bullock labour in our analysis. A comparison of economics of some
important crops then and now is presented in table 30 in Aurepalle, the returns to own farm
resources declined in case of castor over the 25 years periods. But in case of paddy and sorghum
+ pigeonpea, these returns increased substantially and, even in real terms. But in Dokur village,
34
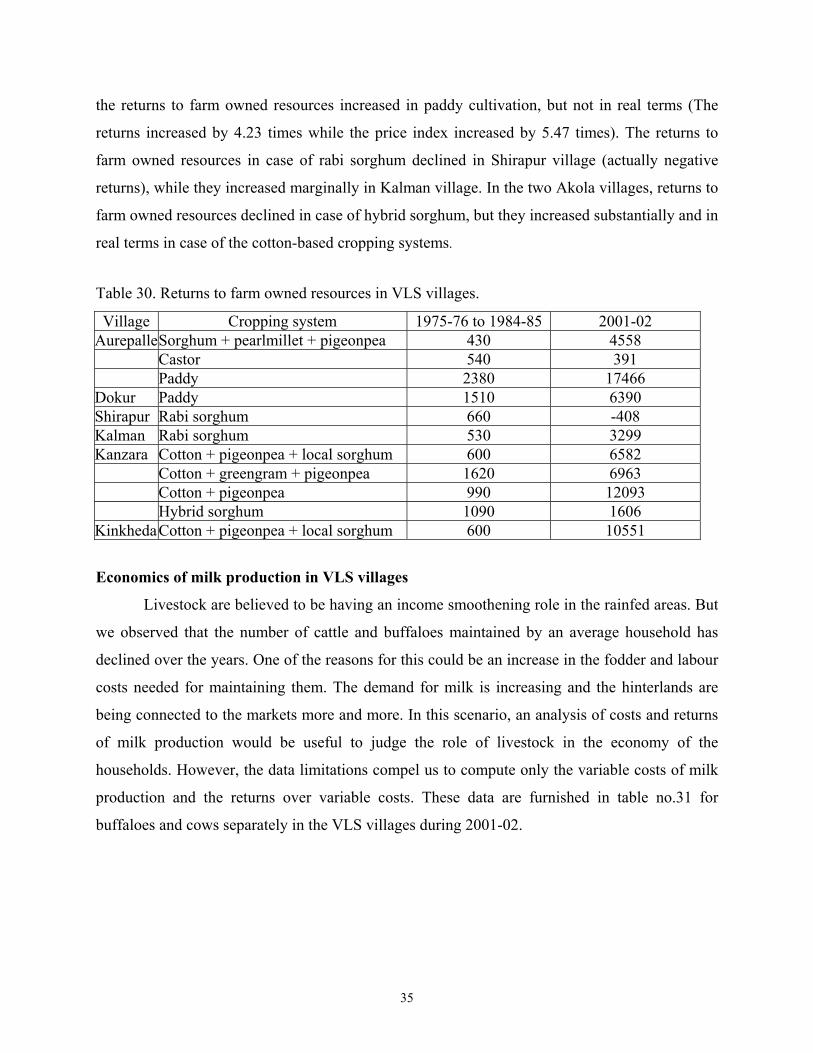
the returns to farm owned resources increased in paddy cultivation, but not in real terms (The
returns increased by 4.23 times while the price index increased by 5.47 times). The returns to
farm owned resources in case of rabi sorghum declined in Shirapur village (actually negative
returns), while they increased marginally in Kalman village. In the two Akola villages, returns to
farm owned resources declined in case of hybrid sorghum, but they increased substantially and in
real terms in case of the cotton-based cropping systems.
Table 30. Returns to farm owned resources in VLS villages.
Village Cropping system 1975-76 to 1984-85 2001-02 Aurepalle Sorghum + pearlmillet + pigeonpea 430 4558 Castor 540 391 Paddy 2380 17466 Dokur Paddy 1510 6390 Shirapur Rabi sorghum 660 -408 Kalman Rabi sorghum 530 3299 Kanzara Cotton + pigeonpea + local sorghum 600 6582 Cotton + greengram + pigeonpea 1620 6963 Cotton + pigeonpea 990 12093 Hybrid sorghum 1090 1606 Kinkheda Cotton + pigeonpea + local sorghum 600 10551
Economics of milk production in VLS villages
Livestock are believed to be having an income smoothening role in the rainfed areas. But
we observed that the number of cattle and buffaloes maintained by an average household has
declined over the years. One of the reasons for this could be an increase in the fodder and labour
costs needed for maintaining them. The demand for milk is increasing and the hinterlands are
being connected to the markets more and more. In this scenario, an analysis of costs and returns
of milk production would be useful to judge the role of livestock in the economy of the
households. However, the data limitations compel us to compute only the variable costs of milk
production and the returns over variable costs. These data are furnished in table no.31 for
buffaloes and cows separately in the VLS villages during 2001-02.
35
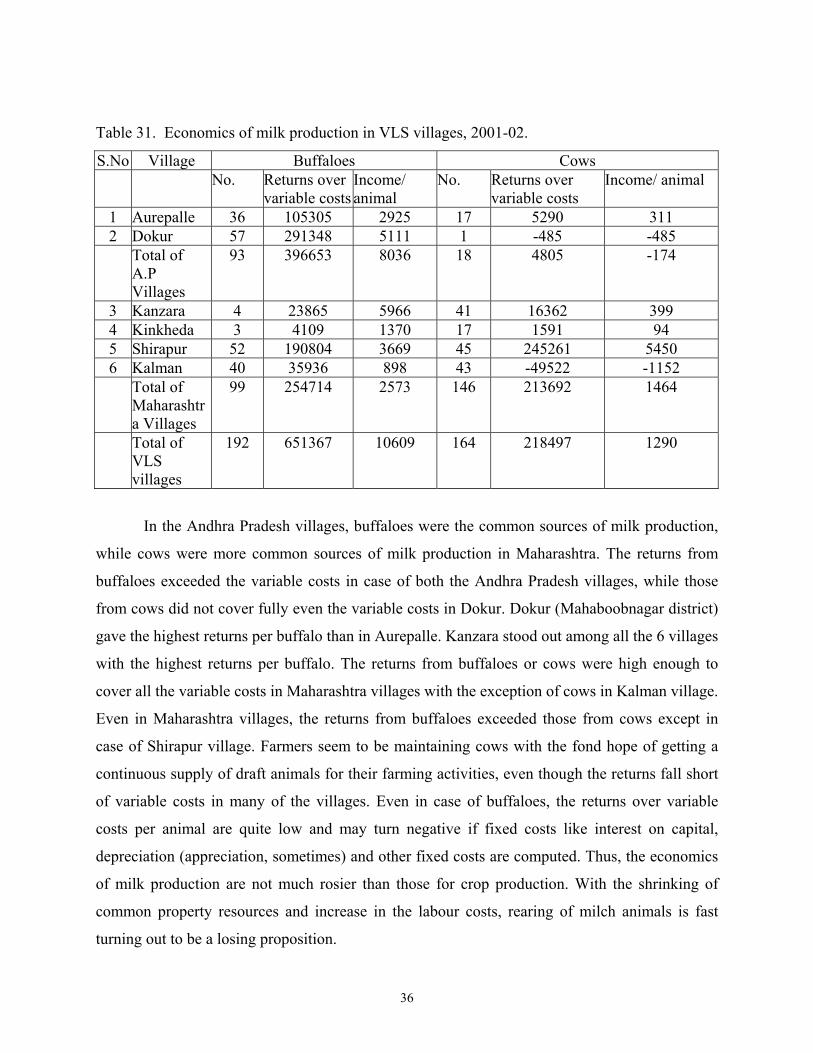
Table 31. Economics of milk production in VLS villages, 2001-02.
S.No Village Buffaloes Cows No. Returns over
variable costsIncome/ animal
No. Returns over variable costs
Income/ animal
1 Aurepalle 36 105305 2925 17 5290 311 2 Dokur 57 291348 5111 1 -485 -485 Total of
A.P Villages
93 396653 8036 18 4805 -174
3 Kanzara 4 23865 5966 41 16362 399 4 Kinkheda 3 4109 1370 17 1591 94 5 Shirapur 52 190804 3669 45 245261 5450 6 Kalman 40 35936 898 43 -49522 -1152 Total of
Maharashtra Villages
99 254714 2573 146 213692 1464
Total of VLS villages
192 651367 10609 164 218497 1290
In the Andhra Pradesh villages, buffaloes were the common sources of milk production,
while cows were more common sources of milk production in Maharashtra. The returns from
buffaloes exceeded the variable costs in case of both the Andhra Pradesh villages, while those
from cows did not cover fully even the variable costs in Dokur. Dokur (Mahaboobnagar district)
gave the highest returns per buffalo than in Aurepalle. Kanzara stood out among all the 6 villages
with the highest returns per buffalo. The returns from buffaloes or cows were high enough to
cover all the variable costs in Maharashtra villages with the exception of cows in Kalman village.
Even in Maharashtra villages, the returns from buffaloes exceeded those from cows except in
case of Shirapur village. Farmers seem to be maintaining cows with the fond hope of getting a
continuous supply of draft animals for their farming activities, even though the returns fall short
of variable costs in many of the villages. Even in case of buffaloes, the returns over variable
costs per animal are quite low and may turn negative if fixed costs like interest on capital,
depreciation (appreciation, sometimes) and other fixed costs are computed. Thus, the economics
of milk production are not much rosier than those for crop production. With the shrinking of
common property resources and increase in the labour costs, rearing of milch animals is fast
turning out to be a losing proposition.
36
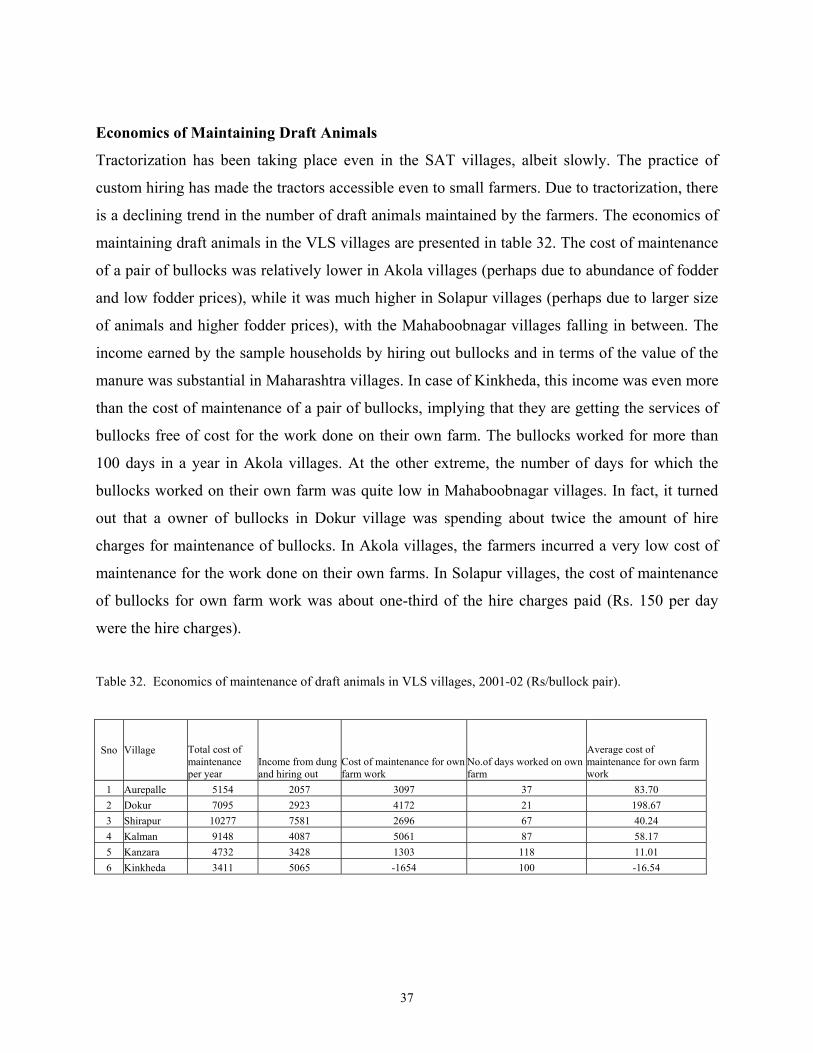
Economics of Maintaining Draft Animals
Tractorization has been taking place even in the SAT villages, albeit slowly. The practice of
custom hiring has made the tractors accessible even to small farmers. Due to tractorization, there
is a declining trend in the number of draft animals maintained by the farmers. The economics of
maintaining draft animals in the VLS villages are presented in table 32. The cost of maintenance
of a pair of bullocks was relatively lower in Akola villages (perhaps due to abundance of fodder
and low fodder prices), while it was much higher in Solapur villages (perhaps due to larger size
of animals and higher fodder prices), with the Mahaboobnagar villages falling in between. The
income earned by the sample households by hiring out bullocks and in terms of the value of the
manure was substantial in Maharashtra villages. In case of Kinkheda, this income was even more
than the cost of maintenance of a pair of bullocks, implying that they are getting the services of
bullocks free of cost for the work done on their own farm. The bullocks worked for more than
100 days in a year in Akola villages. At the other extreme, the number of days for which the
bullocks worked on their own farm was quite low in Mahaboobnagar villages. In fact, it turned
out that a owner of bullocks in Dokur village was spending about twice the amount of hire
charges for maintenance of bullocks. In Akola villages, the farmers incurred a very low cost of
maintenance for the work done on their own farms. In Solapur villages, the cost of maintenance
of bullocks for own farm work was about one-third of the hire charges paid (Rs. 150 per day
were the hire charges).
Table 32. Economics of maintenance of draft animals in VLS villages, 2001-02 (Rs/bullock pair).
Sno Village Total cost of maintenance per year
Income from dung and hiring out
Cost of maintenance for own farm work
No.of days worked on own farm
Average cost of maintenance for own farm work
1 Aurepalle 5154 2057 3097 37 83.70 2 Dokur 7095 2923 4172 21 198.67 3 Shirapur 10277 7581 2696 67 40.24 4 Kalman 9148 4087 5061 87 58.17 5 Kanzara 4732 3428 1303 118 11.01 6 Kinkheda 3411 5065 -1654 100 -16.54
37
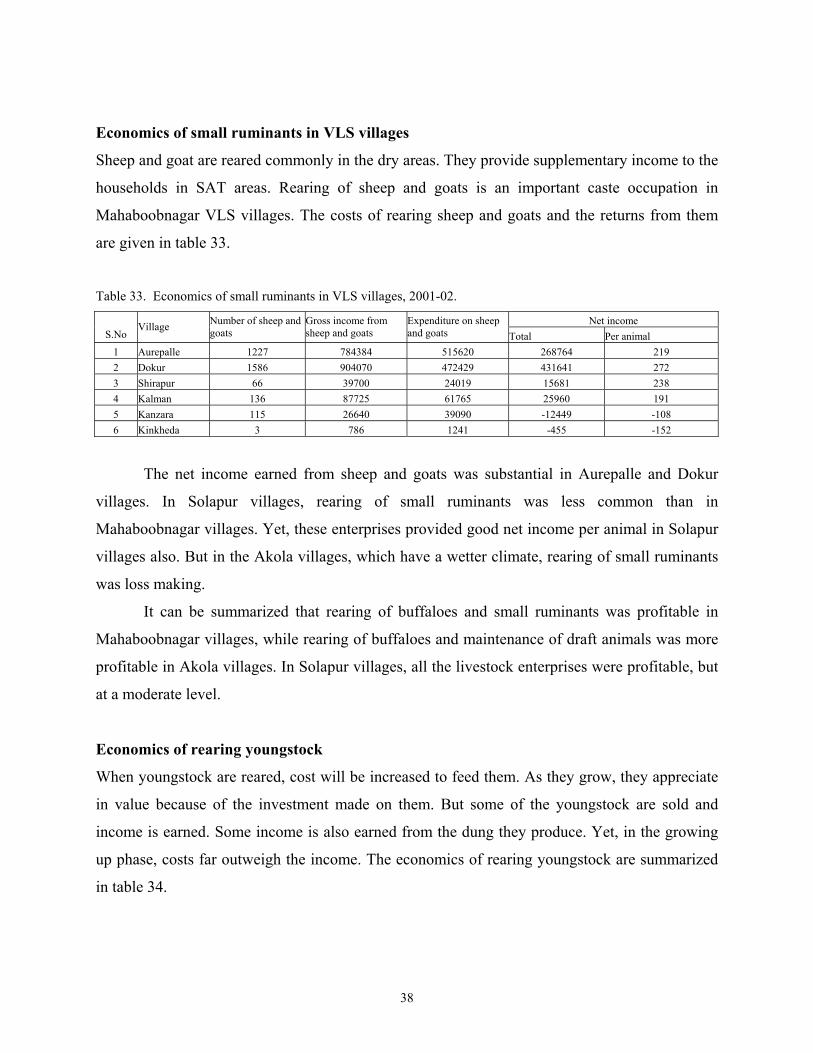
Economics of small ruminants in VLS villages
Sheep and goat are reared commonly in the dry areas. They provide supplementary income to the
households in SAT areas. Rearing of sheep and goats is an important caste occupation in
Mahaboobnagar VLS villages. The costs of rearing sheep and goats and the returns from them
are given in table 33.
Table 33. Economics of small ruminants in VLS villages, 2001-02.
Net income S.No
Village Number of sheep and goats
Gross income from sheep and goats
Expenditure on sheep and goats Total Per animal
1 Aurepalle 1227 784384 515620 268764 219 2 Dokur 1586 904070 472429 431641 272 3 Shirapur 66 39700 24019 15681 238 4 Kalman 136 87725 61765 25960 191 5 Kanzara 115 26640 39090 -12449 -108 6 Kinkheda 3 786 1241 -455 -152
The net income earned from sheep and goats was substantial in Aurepalle and Dokur
villages. In Solapur villages, rearing of small ruminants was less common than in
Mahaboobnagar villages. Yet, these enterprises provided good net income per animal in Solapur
villages also. But in the Akola villages, which have a wetter climate, rearing of small ruminants
was loss making.
It can be summarized that rearing of buffaloes and small ruminants was profitable in
Mahaboobnagar villages, while rearing of buffaloes and maintenance of draft animals was more
profitable in Akola villages. In Solapur villages, all the livestock enterprises were profitable, but
at a moderate level.
Economics of rearing youngstock
When youngstock are reared, cost will be increased to feed them. As they grow, they appreciate
in value because of the investment made on them. But some of the youngstock are sold and
income is earned. Some income is also earned from the dung they produce. Yet, in the growing
up phase, costs far outweigh the income. The economics of rearing youngstock are summarized
in table 34.
38
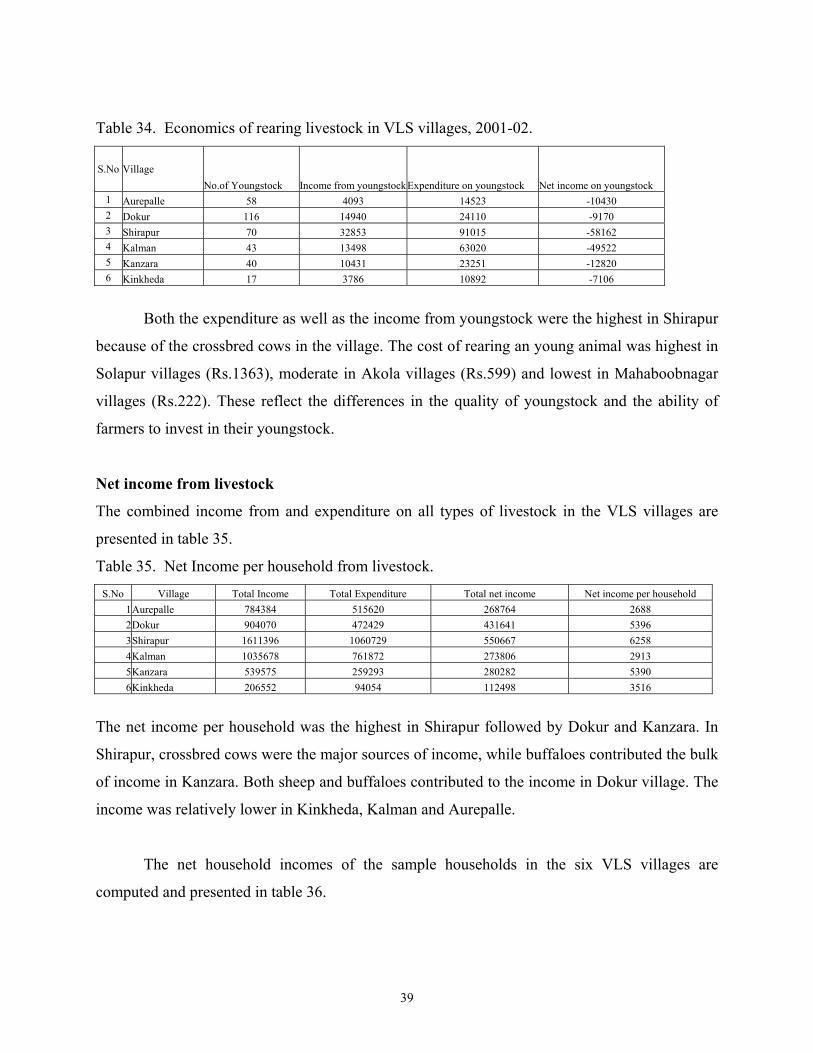
Table 34. Economics of rearing livestock in VLS villages, 2001-02.
S.No Village No.of Youngstock Income from youngstockExpenditure on youngstock Net income on youngstock
1 Aurepalle 58 4093 14523 -10430 2 Dokur 116 14940 24110 -9170 3 Shirapur 70 32853 91015 -58162 4 Kalman 43 13498 63020 -49522 5 Kanzara 40 10431 23251 -12820 6 Kinkheda 17 3786 10892 -7106
Both the expenditure as well as the income from youngstock were the highest in Shirapur
because of the crossbred cows in the village. The cost of rearing an young animal was highest in
Solapur villages (Rs.1363), moderate in Akola villages (Rs.599) and lowest in Mahaboobnagar
villages (Rs.222). These reflect the differences in the quality of youngstock and the ability of
farmers to invest in their youngstock.
Net income from livestock
The combined income from and expenditure on all types of livestock in the VLS villages are
presented in table 35.
Table 35. Net Income per household from livestock. S.No Village Total Income Total Expenditure Total net income Net income per household
1 Aurepalle 784384 515620 268764 2688 2 Dokur 904070 472429 431641 5396 3 Shirapur 1611396 1060729 550667 6258 4 Kalman 1035678 761872 273806 2913 5 Kanzara 539575 259293 280282 5390 6 Kinkheda 206552 94054 112498 3516
The net income per household was the highest in Shirapur followed by Dokur and Kanzara. In
Shirapur, crossbred cows were the major sources of income, while buffaloes contributed the bulk
of income in Kanzara. Both sheep and buffaloes contributed to the income in Dokur village. The
income was relatively lower in Kinkheda, Kalman and Aurepalle.
The net household incomes of the sample households in the six VLS villages are
computed and presented in table 36.
39
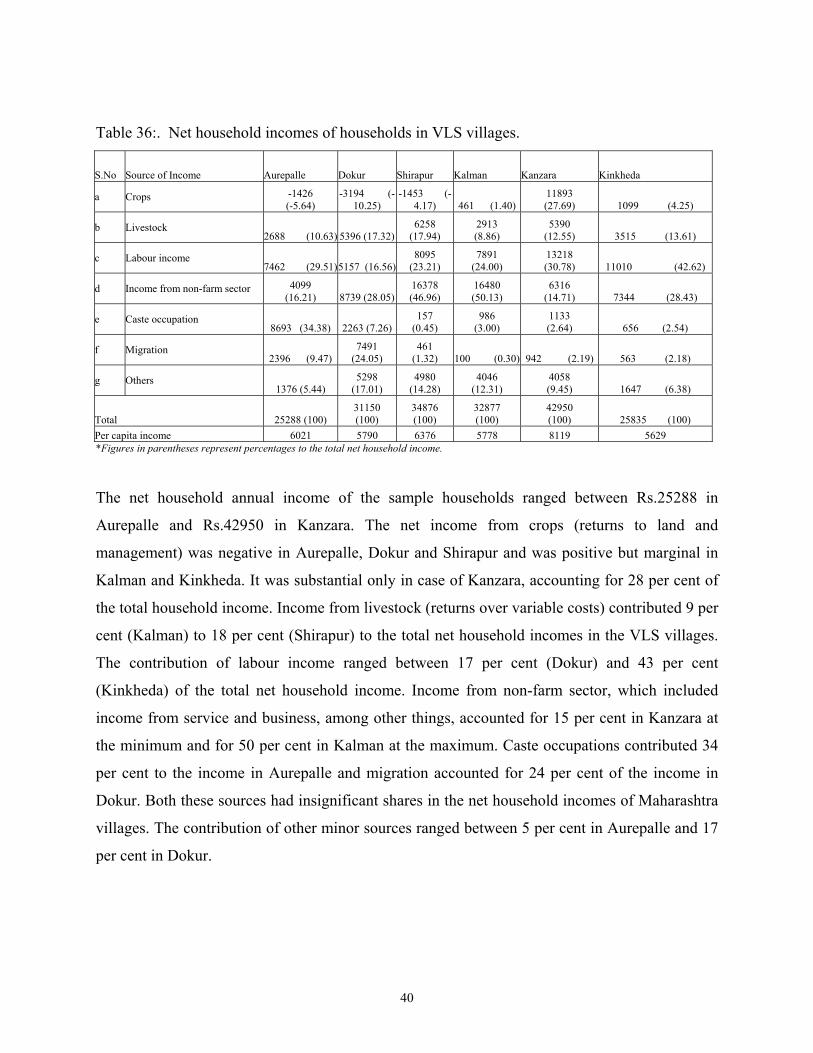
Table 36:. Net household incomes of households in VLS villages.
S.No Source of Income Aurepalle Dokur Shirapur Kalman Kanzara Kinkheda
a Crops -1426 (-5.64)
-3194 (-10.25)
-1453 (-4.17) 461 (1.40)
11893 (27.69) 1099 (4.25)
b Livestock 2688 (10.63) 5396 (17.32)
6258 (17.94)
2913 (8.86)
5390 (12.55) 3515 (13.61)
c Labour income 7462 (29.51)5157 (16.56)
8095 (23.21)
7891 (24.00)
13218 (30.78) 11010 (42.62)
d Income from non-farm sector 4099 (16.21) 8739 (28.05)
16378 (46.96)
16480 (50.13)
6316 (14.71) 7344 (28.43)
e Caste occupation 8693 (34.38) 2263 (7.26)
157 (0.45)
986 (3.00)
1133 (2.64) 656 (2.54)
f Migration 2396 (9.47)
7491 (24.05)
461 (1.32) 100 (0.30) 942 (2.19) 563 (2.18)
g Others 1376 (5.44)
5298 (17.01)
4980 (14.28)
4046 (12.31)
4058 (9.45) 1647 (6.38)
Total 25288 (100) 31150 (100)
34876 (100)
32877 (100)
42950 (100) 25835 (100)
Per capita income 6021 5790 6376 5778 8119 5629 *Figures in parentheses represent percentages to the total net household income.
The net household annual income of the sample households ranged between Rs.25288 in
Aurepalle and Rs.42950 in Kanzara. The net income from crops (returns to land and
management) was negative in Aurepalle, Dokur and Shirapur and was positive but marginal in
Kalman and Kinkheda. It was substantial only in case of Kanzara, accounting for 28 per cent of
the total household income. Income from livestock (returns over variable costs) contributed 9 per
cent (Kalman) to 18 per cent (Shirapur) to the total net household incomes in the VLS villages.
The contribution of labour income ranged between 17 per cent (Dokur) and 43 per cent
(Kinkheda) of the total net household income. Income from non-farm sector, which included
income from service and business, among other things, accounted for 15 per cent in Kanzara at
the minimum and for 50 per cent in Kalman at the maximum. Caste occupations contributed 34
per cent to the income in Aurepalle and migration accounted for 24 per cent of the income in
Dokur. Both these sources had insignificant shares in the net household incomes of Maharashtra
villages. The contribution of other minor sources ranged between 5 per cent in Aurepalle and 17
per cent in Dokur.
40
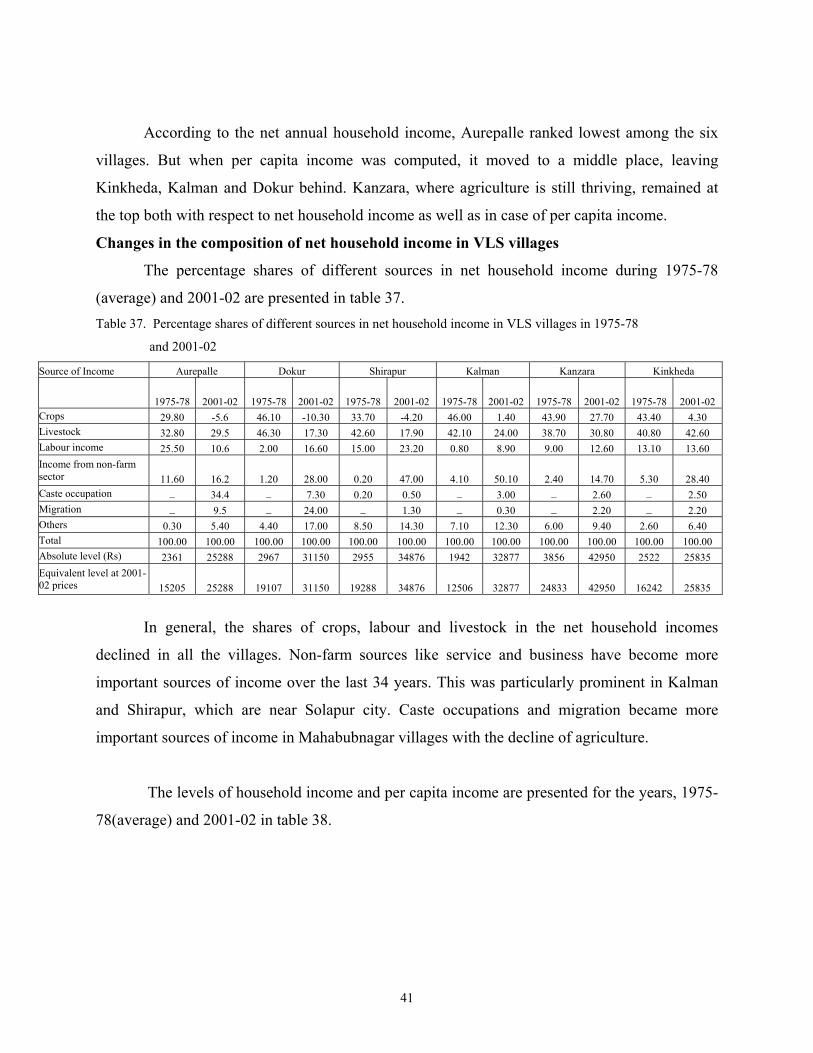
According to the net annual household income, Aurepalle ranked lowest among the six
villages. But when per capita income was computed, it moved to a middle place, leaving
Kinkheda, Kalman and Dokur behind. Kanzara, where agriculture is still thriving, remained at
the top both with respect to net household income as well as in case of per capita income.
Changes in the composition of net household income in VLS villages
The percentage shares of different sources in net household income during 1975-78
(average) and 2001-02 are presented in table 37. Table 37. Percentage shares of different sources in net household income in VLS villages in 1975-78
and 2001-02
Source of Income Aurepalle Dokur Shirapur Kalman Kanzara Kinkheda
1975-78 2001-02 1975-78 2001-02 1975-78 2001-02 1975-78 2001-02 1975-78 2001-02 1975-78 2001-02 Crops 29.80 -5.6 46.10 -10.30 33.70 -4.20 46.00 1.40 43.90 27.70 43.40 4.30 Livestock 32.80 29.5 46.30 17.30 42.60 17.90 42.10 24.00 38.70 30.80 40.80 42.60 Labour income 25.50 10.6 2.00 16.60 15.00 23.20 0.80 8.90 9.00 12.60 13.10 13.60 Income from non-farm sector 11.60 16.2 1.20 28.00 0.20 47.00 4.10 50.10 2.40 14.70 5.30 28.40 Caste occupation _ 34.4 _ 7.30 0.20 0.50 _ 3.00 _ 2.60 _ 2.50 Migration _ 9.5 _ 24.00 _ 1.30 _ 0.30 _ 2.20 _ 2.20 Others 0.30 5.40 4.40 17.00 8.50 14.30 7.10 12.30 6.00 9.40 2.60 6.40 Total 100.00 100.00 100.00 100.00 100.00 100.00 100.00 100.00 100.00 100.00 100.00 100.00 Absolute level (Rs) 2361 25288 2967 31150 2955 34876 1942 32877 3856 42950 2522 25835 Equivalent level at 2001-02 prices 15205 25288 19107 31150 19288 34876 12506 32877 24833 42950 16242 25835
In general, the shares of crops, labour and livestock in the net household incomes
declined in all the villages. Non-farm sources like service and business have become more
important sources of income over the last 34 years. This was particularly prominent in Kalman
and Shirapur, which are near Solapur city. Caste occupations and migration became more
important sources of income in Mahabubnagar villages with the decline of agriculture.
The levels of household income and per capita income are presented for the years, 1975-
78(average) and 2001-02 in table 38.
41
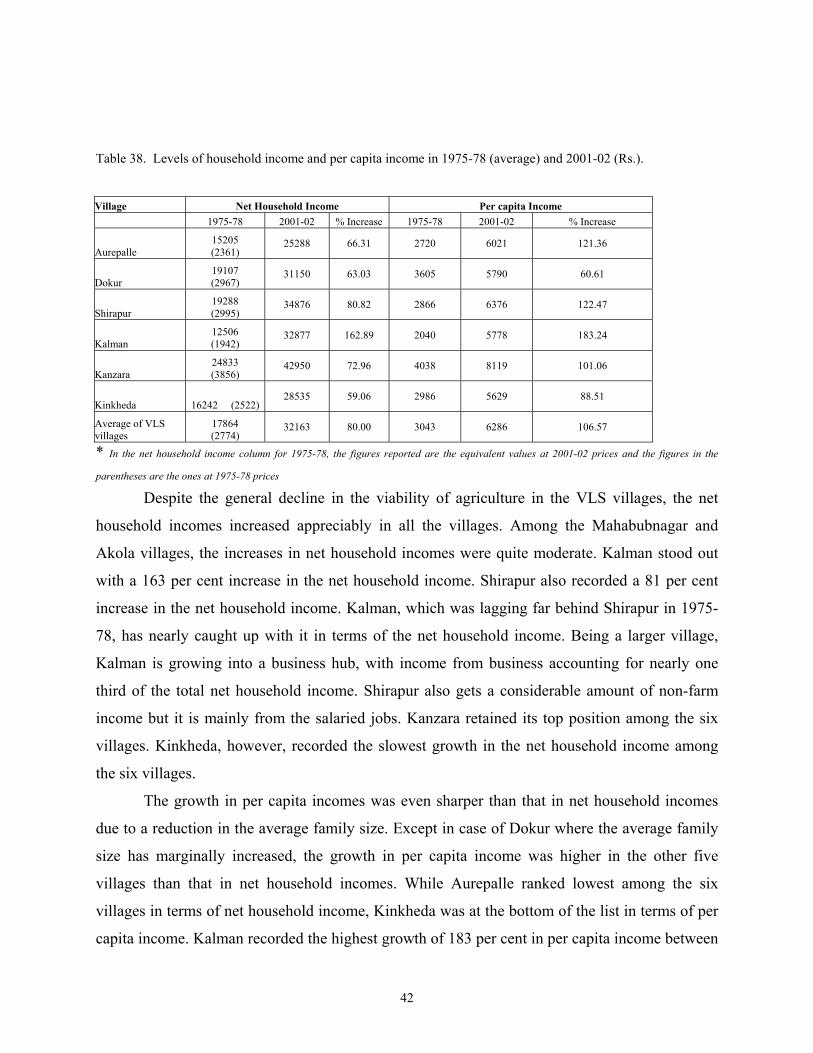
Table 38. Levels of household income and per capita income in 1975-78 (average) and 2001-02 (Rs.).
Village Net Household Income Per capita Income
1975-78 2001-02 % Increase 1975-78 2001-02 % Increase
Aurepalle 15205 (2361)
25288 66.31 2720 6021 121.36
Dokur 19107 (2967)
31150 63.03 3605 5790 60.61
Shirapur 19288 (2995)
34876 80.82 2866 6376 122.47
Kalman 12506 (1942)
32877 162.89 2040 5778 183.24
Kanzara 24833 (3856)
42950 72.96 4038 8119 101.06
Kinkheda 16242 (2522) 28535 59.06 2986 5629 88.51
Average of VLS villages
17864 (2774)
32163 80.00 3043 6286 106.57
* In the net household income column for 1975-78, the figures reported are the equivalent values at 2001-02 prices and the figures in the
parentheses are the ones at 1975-78 prices
Despite the general decline in the viability of agriculture in the VLS villages, the net
household incomes increased appreciably in all the villages. Among the Mahabubnagar and
Akola villages, the increases in net household incomes were quite moderate. Kalman stood out
with a 163 per cent increase in the net household income. Shirapur also recorded a 81 per cent
increase in the net household income. Kalman, which was lagging far behind Shirapur in 1975-
78, has nearly caught up with it in terms of the net household income. Being a larger village,
Kalman is growing into a business hub, with income from business accounting for nearly one
third of the total net household income. Shirapur also gets a considerable amount of non-farm
income but it is mainly from the salaried jobs. Kanzara retained its top position among the six
villages. Kinkheda, however, recorded the slowest growth in the net household income among
the six villages.
The growth in per capita incomes was even sharper than that in net household incomes
due to a reduction in the average family size. Except in case of Dokur where the average family
size has marginally increased, the growth in per capita income was higher in the other five
villages than that in net household incomes. While Aurepalle ranked lowest among the six
villages in terms of net household income, Kinkheda was at the bottom of the list in terms of per
capita income. Kalman recorded the highest growth of 183 per cent in per capita income between
42
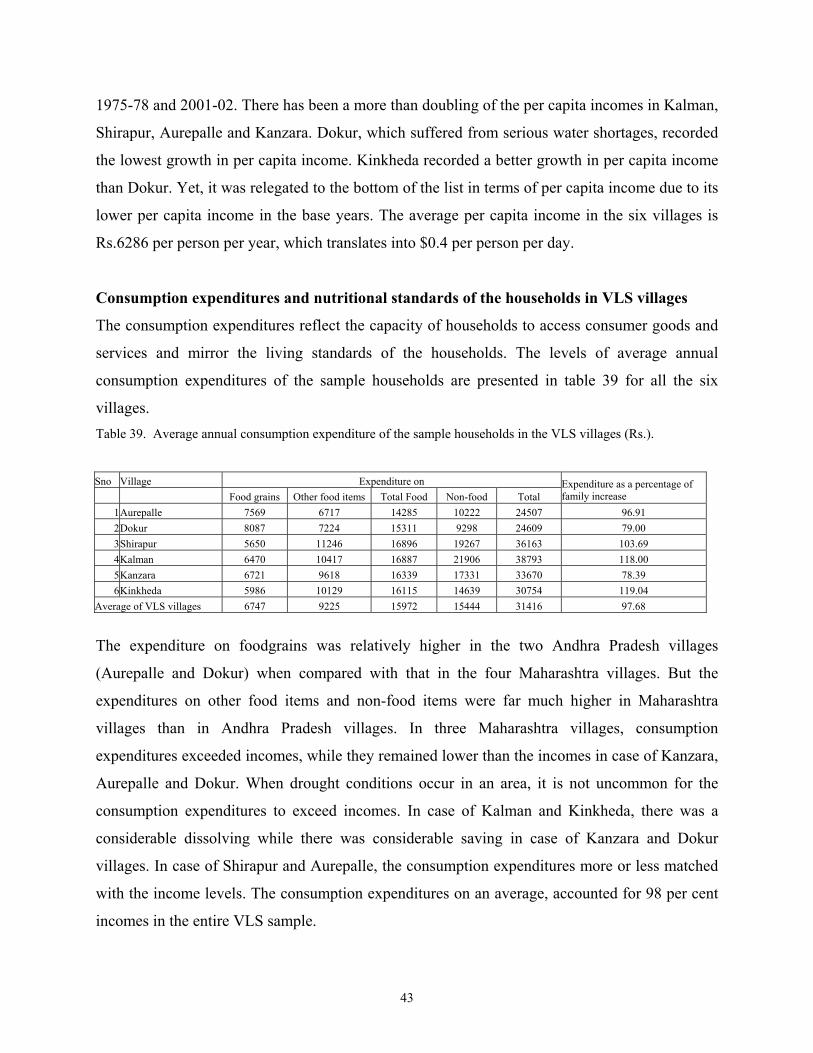
1975-78 and 2001-02. There has been a more than doubling of the per capita incomes in Kalman,
Shirapur, Aurepalle and Kanzara. Dokur, which suffered from serious water shortages, recorded
the lowest growth in per capita income. Kinkheda recorded a better growth in per capita income
than Dokur. Yet, it was relegated to the bottom of the list in terms of per capita income due to its
lower per capita income in the base years. The average per capita income in the six villages is
Rs.6286 per person per year, which translates into $0.4 per person per day.
Consumption expenditures and nutritional standards of the households in VLS villages
The consumption expenditures reflect the capacity of households to access consumer goods and
services and mirror the living standards of the households. The levels of average annual
consumption expenditures of the sample households are presented in table 39 for all the six
villages. Table 39. Average annual consumption expenditure of the sample households in the VLS villages (Rs.).
Sno Village Expenditure on Food grains Other food items Total Food Non-food Total
Expenditure as a percentage of family increase
1 Aurepalle 7569 6717 14285 10222 24507 96.91 2 Dokur 8087 7224 15311 9298 24609 79.00 3 Shirapur 5650 11246 16896 19267 36163 103.69 4 Kalman 6470 10417 16887 21906 38793 118.00 5 Kanzara 6721 9618 16339 17331 33670 78.39 6 Kinkheda 5986 10129 16115 14639 30754 119.04
Average of VLS villages 6747 9225 15972 15444 31416 97.68
The expenditure on foodgrains was relatively higher in the two Andhra Pradesh villages
(Aurepalle and Dokur) when compared with that in the four Maharashtra villages. But the
expenditures on other food items and non-food items were far much higher in Maharashtra
villages than in Andhra Pradesh villages. In three Maharashtra villages, consumption
expenditures exceeded incomes, while they remained lower than the incomes in case of Kanzara,
Aurepalle and Dokur. When drought conditions occur in an area, it is not uncommon for the
consumption expenditures to exceed incomes. In case of Kalman and Kinkheda, there was a
considerable dissolving while there was considerable saving in case of Kanzara and Dokur
villages. In case of Shirapur and Aurepalle, the consumption expenditures more or less matched
with the income levels. The consumption expenditures on an average, accounted for 98 per cent
incomes in the entire VLS sample.
43
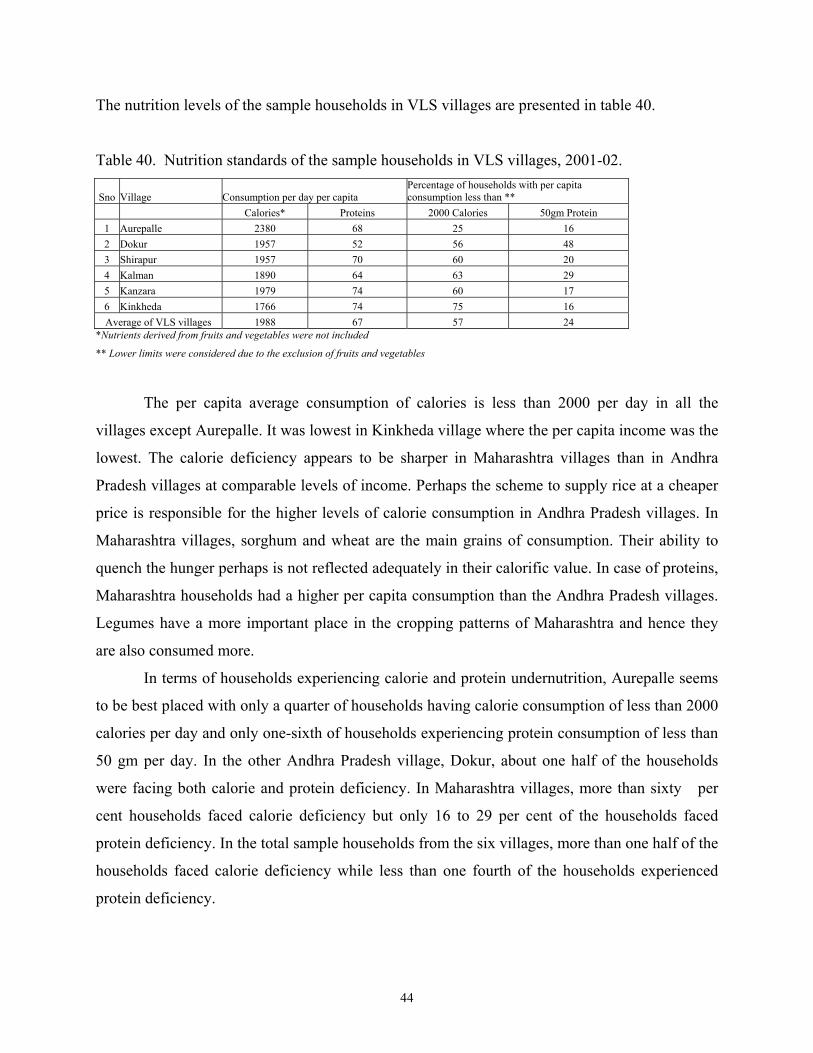
The nutrition levels of the sample households in VLS villages are presented in table 40.
Table 40. Nutrition standards of the sample households in VLS villages, 2001-02.
Sno Village Consumption per day per capita Percentage of households with per capita consumption less than **
Calories* Proteins 2000 Calories 50gm Protein 1 Aurepalle 2380 68 25 16 2 Dokur 1957 52 56 48 3 Shirapur 1957 70 60 20 4 Kalman 1890 64 63 29 5 Kanzara 1979 74 60 17 6 Kinkheda 1766 74 75 16 Average of VLS villages 1988 67 57 24
*Nutrients derived from fruits and vegetables were not included
** Lower limits were considered due to the exclusion of fruits and vegetables
The per capita average consumption of calories is less than 2000 per day in all the
villages except Aurepalle. It was lowest in Kinkheda village where the per capita income was the
lowest. The calorie deficiency appears to be sharper in Maharashtra villages than in Andhra
Pradesh villages at comparable levels of income. Perhaps the scheme to supply rice at a cheaper
price is responsible for the higher levels of calorie consumption in Andhra Pradesh villages. In
Maharashtra villages, sorghum and wheat are the main grains of consumption. Their ability to
quench the hunger perhaps is not reflected adequately in their calorific value. In case of proteins,
Maharashtra households had a higher per capita consumption than the Andhra Pradesh villages.
Legumes have a more important place in the cropping patterns of Maharashtra and hence they
are also consumed more.
In terms of households experiencing calorie and protein undernutrition, Aurepalle seems
to be best placed with only a quarter of households having calorie consumption of less than 2000
calories per day and only one-sixth of households experiencing protein consumption of less than
50 gm per day. In the other Andhra Pradesh village, Dokur, about one half of the households
were facing both calorie and protein deficiency. In Maharashtra villages, more than sixty per
cent households faced calorie deficiency but only 16 to 29 per cent of the households faced
protein deficiency. In the total sample households from the six villages, more than one half of the
households faced calorie deficiency while less than one fourth of the households experienced
protein deficiency.
44
The analysis of income, expenditure and consumption patterns of the sample households
pointed out to certain improvements in the standards of living of the households over the last two
decades period. We found that the per capita incomes more than doubled between 1975-78 and
2001-02. Walker and Ryan (1990) calculated the mean per capita income of the three villages,
Aurepalle, Shirapur and Kanzara over the nine-year period (1975-1984) to be Rs.700, which
translates into about $80 in 1977 prices. Compared to that, the mean per capita income of the
same three villages worked out to be Rs6839 in 2001-02, which is equivalent to $156.50. Even in
dollar terms, the per capita income has nearly doubled. But the structure of income has
undergone a substantial change. While crop income and labor income were the chief sources of
income at that time, non-farm income (mainly from salaried jobs and business) and labor income
are the major sources of income in 2001-02. In Mahabubnagar villages (Aurepalle and Dokur),
caste occupations and income from migration have also emerged as the important sources of
income. With the exception of Kanzara, crop income was either negative or low in 2001-02.
Livestock income emerged significant in Dokur and Shirapur villages.
Walker and Ryan found that about 60 per cent of the income was spent on food by the
sample households during the first generation VLS studies (1975-84). Now we found that about
50 per cent of income was spent on food by the sample households in 2001-02. It is quite
plausible to observe that the proportion of income spent on food decreases as the income
increases. Yet, there is considerable undernutrition in the sample households. Although the per
capita income did increase over the last two decades, it still represents only an income level of
$0.40 per day per person. Despite some improvement, the sample households are still facing
income poverty as well as consumption poverty.
45
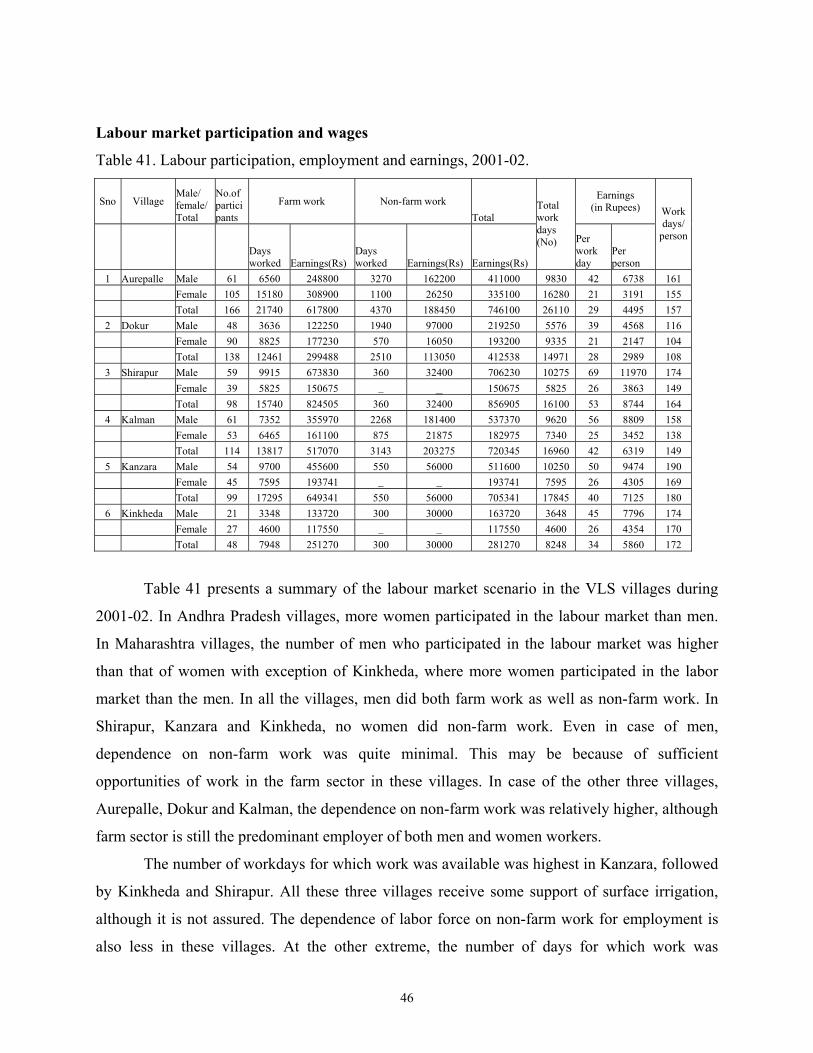
Labour market participation and wages
Table 41. Labour participation, employment and earnings, 2001-02.
Sno Village Male/ female/ Total
No.of partici pants
Farm work Non-farm work Total
Earnings (in Rupees)
Days worked Earnings(Rs)
Days worked Earnings(Rs) Earnings(Rs)
Total work days (No) Per
work day
Per person
Work days/
person
1 Aurepalle Male 61 6560 248800 3270 162200 411000 9830 42 6738 161 Female 105 15180 308900 1100 26250 335100 16280 21 3191 155 Total 166 21740 617800 4370 188450 746100 26110 29 4495 157 2 Dokur Male 48 3636 122250 1940 97000 219250 5576 39 4568 116 Female 90 8825 177230 570 16050 193200 9335 21 2147 104 Total 138 12461 299488 2510 113050 412538 14971 28 2989 108 3 Shirapur Male 59 9915 673830 360 32400 706230 10275 69 11970 174 Female 39 5825 150675 _ _ 150675 5825 26 3863 149 Total 98 15740 824505 360 32400 856905 16100 53 8744 164 4 Kalman Male 61 7352 355970 2268 181400 537370 9620 56 8809 158 Female 53 6465 161100 875 21875 182975 7340 25 3452 138 Total 114 13817 517070 3143 203275 720345 16960 42 6319 149 5 Kanzara Male 54 9700 455600 550 56000 511600 10250 50 9474 190 Female 45 7595 193741 _ _ 193741 7595 26 4305 169 Total 99 17295 649341 550 56000 705341 17845 40 7125 180 6 Kinkheda Male 21 3348 133720 300 30000 163720 3648 45 7796 174
Female 27 4600 117550 _ _ 117550 4600 26 4354 170 Total 48 7948 251270 300 30000 281270 8248 34 5860 172
Table 41 presents a summary of the labour market scenario in the VLS villages during
2001-02. In Andhra Pradesh villages, more women participated in the labour market than men.
In Maharashtra villages, the number of men who participated in the labour market was higher
than that of women with exception of Kinkheda, where more women participated in the labor
market than the men. In all the villages, men did both farm work as well as non-farm work. In
Shirapur, Kanzara and Kinkheda, no women did non-farm work. Even in case of men,
dependence on non-farm work was quite minimal. This may be because of sufficient
opportunities of work in the farm sector in these villages. In case of the other three villages,
Aurepalle, Dokur and Kalman, the dependence on non-farm work was relatively higher, although
farm sector is still the predominant employer of both men and women workers.
The number of workdays for which work was available was highest in Kanzara, followed
by Kinkheda and Shirapur. All these three villages receive some support of surface irrigation,
although it is not assured. The dependence of labor force on non-farm work for employment is
also less in these villages. At the other extreme, the number of days for which work was
46
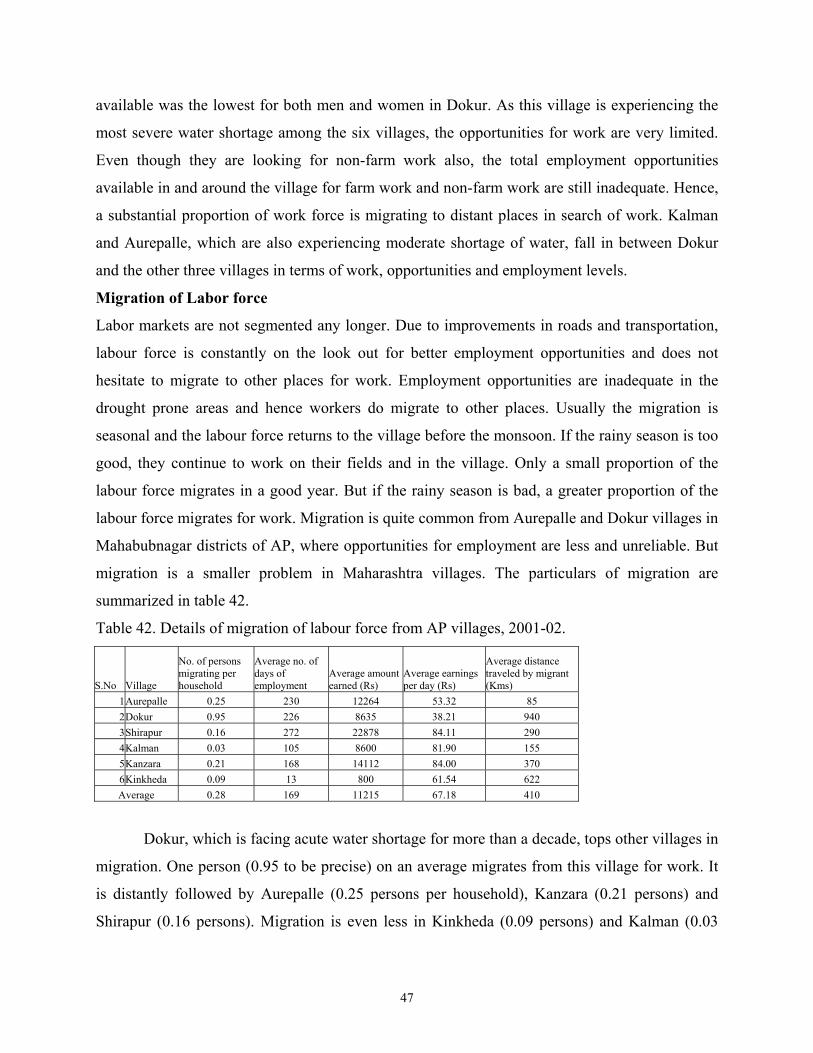
available was the lowest for both men and women in Dokur. As this village is experiencing the
most severe water shortage among the six villages, the opportunities for work are very limited.
Even though they are looking for non-farm work also, the total employment opportunities
available in and around the village for farm work and non-farm work are still inadequate. Hence,
a substantial proportion of work force is migrating to distant places in search of work. Kalman
and Aurepalle, which are also experiencing moderate shortage of water, fall in between Dokur
and the other three villages in terms of work, opportunities and employment levels.
Migration of Labor force
Labor markets are not segmented any longer. Due to improvements in roads and transportation,
labour force is constantly on the look out for better employment opportunities and does not
hesitate to migrate to other places for work. Employment opportunities are inadequate in the
drought prone areas and hence workers do migrate to other places. Usually the migration is
seasonal and the labour force returns to the village before the monsoon. If the rainy season is too
good, they continue to work on their fields and in the village. Only a small proportion of the
labour force migrates in a good year. But if the rainy season is bad, a greater proportion of the
labour force migrates for work. Migration is quite common from Aurepalle and Dokur villages in
Mahabubnagar districts of AP, where opportunities for employment are less and unreliable. But
migration is a smaller problem in Maharashtra villages. The particulars of migration are
summarized in table 42.
Table 42. Details of migration of labour force from AP villages, 2001-02.
S.No Village
No. of persons migrating per household
Average no. of days of employment
Average amount earned (Rs)
Average earnings per day (Rs)
Average distance traveled by migrant (Kms)
1 Aurepalle 0.25 230 12264 53.32 85 2 Dokur 0.95 226 8635 38.21 940 3 Shirapur 0.16 272 22878 84.11 290 4 Kalman 0.03 105 8600 81.90 155 5 Kanzara 0.21 168 14112 84.00 370 6 Kinkheda 0.09 13 800 61.54 622 Average 0.28 169 11215 67.18 410
Dokur, which is facing acute water shortage for more than a decade, tops other villages in
migration. One person (0.95 to be precise) on an average migrates from this village for work. It
is distantly followed by Aurepalle (0.25 persons per household), Kanzara (0.21 persons) and
Shirapur (0.16 persons). Migration is even less in Kinkheda (0.09 persons) and Kalman (0.03
47
persons). In the total VLS sample, on an average, 0.28 persons per household migrated for work
in 2001-02. An average migrant found work for 169 days and earned Rs11215. The average
earnings per day were Rs 67.18. They migrated to an average distance of 410 kms from their
villages. The average earnings per day were higher for the migrants from Maharashtra. Migrants
from Dokur traveled longest distance for work but they had the lowest earnings per day among
the six villages. It is perhaps because of the system of labour contractors who take batches of
workers to distant places in Gujarat or Rajasthan for work. They pay advances to the workers
and take substantial cuts in the earnings of the workers. They also run kitchens and serve food to
the workers. Migration is often looked at as an undesirable phenomenon. But it helps in the
integration of labour markets. The common policy response of the Governments has been to
create employment opportunities in the villages to discourage migration. But despite all the
employment programmes and food for work schemes, migration is only increasing in the
drought-prone villages. Time has arrived to look at migration from a positive perspective and to
facilitate it by providing facilities such as housing, education, health etc.,
Caste occupations and other sources
Caste occupations like toddy tapping, sheep rearing etc., are important sources of income in
Andhra Pradesh villages. They contribute to 28 per cent of the total income in Aurepalle, while
this proportion is much smaller at 6 per cent in case of Dokur. Migration is more an important
source of livelihood in Dokur, while caste occupations are important sources of income in
Aurepalle. In Maharashtra villages, caste occupations are less important and provide less than
two per cent of income. Other sources of income which contribute to 8.17 per cent of the total
incomes in the VLS villages include some caste occupations like tailoring, shoe making,
carpentry, masonry work and non-traditional sources like transport services, petty business and
minor services. Thus, the sources of livelihood have become more diversified now in the VLS
villages than in the past. Dependence has shifted from crop, livestock and labour sources more to
non-farm, migration, caste occupations and other sources over the years.
Government programmes
The Union and State Governments have a number of developmental and poverty alleviation
programs aimed at benefiting the rural poor. There are also strong programmes of social welfare,
48
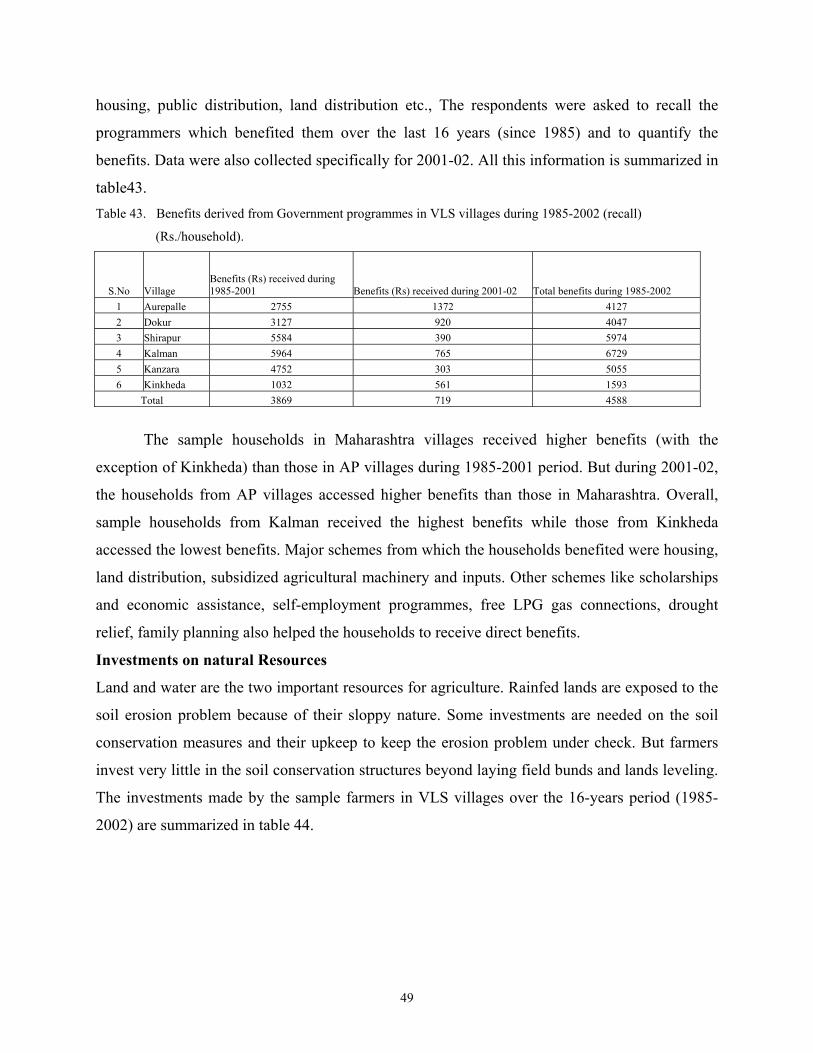
housing, public distribution, land distribution etc., The respondents were asked to recall the
programmers which benefited them over the last 16 years (since 1985) and to quantify the
benefits. Data were also collected specifically for 2001-02. All this information is summarized in
table43. Table 43. Benefits derived from Government programmes in VLS villages during 1985-2002 (recall)
(Rs./household).
S.No Village Benefits (Rs) received during 1985-2001 Benefits (Rs) received during 2001-02 Total benefits during 1985-2002
1 Aurepalle 2755 1372 4127 2 Dokur 3127 920 4047 3 Shirapur 5584 390 5974 4 Kalman 5964 765 6729 5 Kanzara 4752 303 5055 6 Kinkheda 1032 561 1593
Total 3869 719 4588
The sample households in Maharashtra villages received higher benefits (with the
exception of Kinkheda) than those in AP villages during 1985-2001 period. But during 2001-02,
the households from AP villages accessed higher benefits than those in Maharashtra. Overall,
sample households from Kalman received the highest benefits while those from Kinkheda
accessed the lowest benefits. Major schemes from which the households benefited were housing,
land distribution, subsidized agricultural machinery and inputs. Other schemes like scholarships
and economic assistance, self-employment programmes, free LPG gas connections, drought
relief, family planning also helped the households to receive direct benefits.
Investments on natural Resources
Land and water are the two important resources for agriculture. Rainfed lands are exposed to the
soil erosion problem because of their sloppy nature. Some investments are needed on the soil
conservation measures and their upkeep to keep the erosion problem under check. But farmers
invest very little in the soil conservation structures beyond laying field bunds and lands leveling.
The investments made by the sample farmers in VLS villages over the 16-years period (1985-
2002) are summarized in table 44.
49
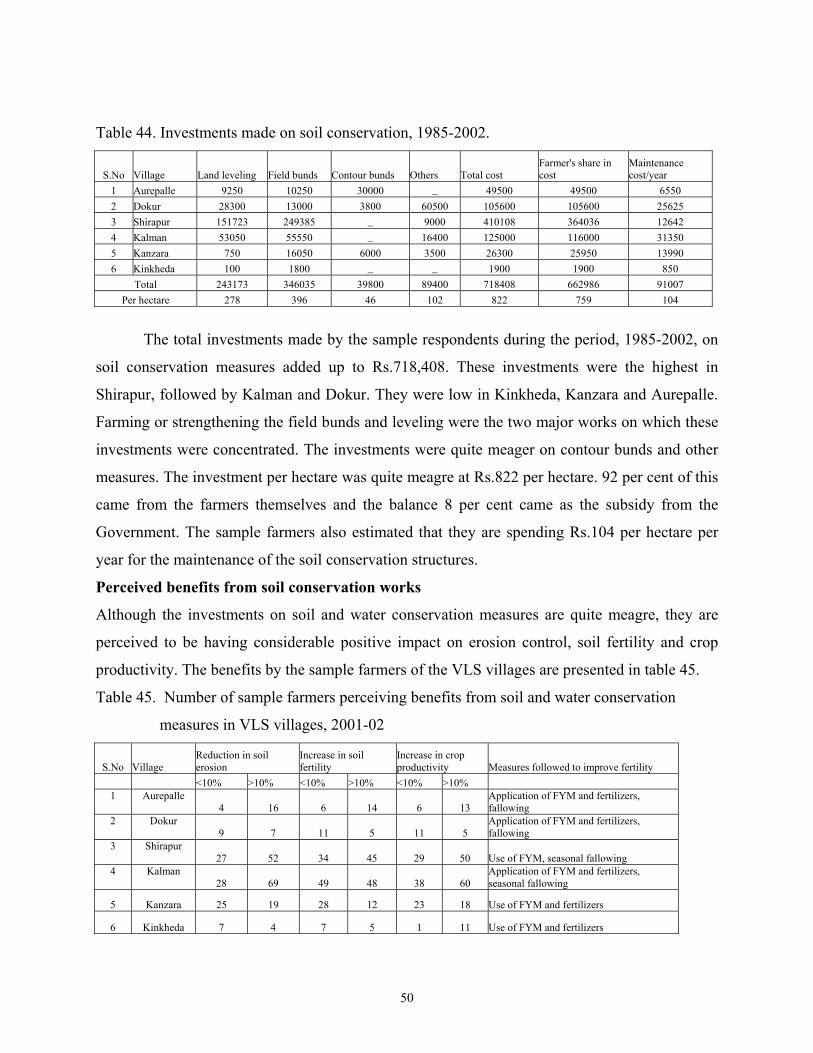
Table 44. Investments made on soil conservation, 1985-2002.
S.No Village Land leveling Field bunds Contour bunds Others Total cost Farmer's share in cost
Maintenance cost/year
1 Aurepalle 9250 10250 30000 _ 49500 49500 6550 2 Dokur 28300 13000 3800 60500 105600 105600 25625 3 Shirapur 151723 249385 _ 9000 410108 364036 12642 4 Kalman 53050 55550 _ 16400 125000 116000 31350 5 Kanzara 750 16050 6000 3500 26300 25950 13990 6 Kinkheda 100 1800 _ _ 1900 1900 850
Total 243173 346035 39800 89400 718408 662986 91007 Per hectare 278 396 46 102 822 759 104
The total investments made by the sample respondents during the period, 1985-2002, on
soil conservation measures added up to Rs.718,408. These investments were the highest in
Shirapur, followed by Kalman and Dokur. They were low in Kinkheda, Kanzara and Aurepalle.
Farming or strengthening the field bunds and leveling were the two major works on which these
investments were concentrated. The investments were quite meager on contour bunds and other
measures. The investment per hectare was quite meagre at Rs.822 per hectare. 92 per cent of this
came from the farmers themselves and the balance 8 per cent came as the subsidy from the
Government. The sample farmers also estimated that they are spending Rs.104 per hectare per
year for the maintenance of the soil conservation structures.
Perceived benefits from soil conservation works
Although the investments on soil and water conservation measures are quite meagre, they are
perceived to be having considerable positive impact on erosion control, soil fertility and crop
productivity. The benefits by the sample farmers of the VLS villages are presented in table 45.
Table 45. Number of sample farmers perceiving benefits from soil and water conservation
measures in VLS villages, 2001-02
S.No Village Reduction in soil erosion
Increase in soil fertility
Increase in crop productivity Measures followed to improve fertility
<10% >10% <10% >10% <10% >10% 1 Aurepalle
4 16 6 14 6 13 Application of FYM and fertilizers, fallowing
2 Dokur 9 7 11 5 11 5
Application of FYM and fertilizers, fallowing
3 Shirapur 27 52 34 45 29 50 Use of FYM, seasonal fallowing
4 Kalman 28 69 49 48 38 60
Application of FYM and fertilizers, seasonal fallowing
5 Kanzara 25 19 28 12 23 18 Use of FYM and fertilizers
6 Kinkheda 7 4 7 5 1 11 Use of FYM and fertilizers
50
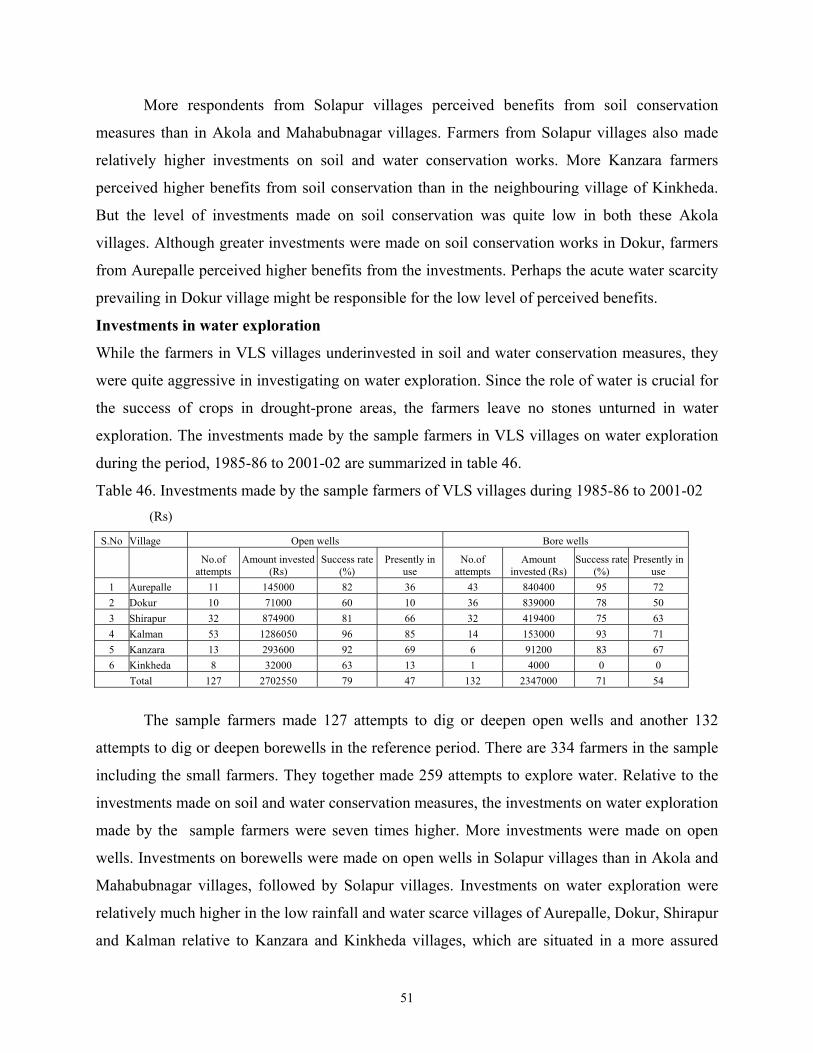
More respondents from Solapur villages perceived benefits from soil conservation
measures than in Akola and Mahabubnagar villages. Farmers from Solapur villages also made
relatively higher investments on soil and water conservation works. More Kanzara farmers
perceived higher benefits from soil conservation than in the neighbouring village of Kinkheda.
But the level of investments made on soil conservation was quite low in both these Akola
villages. Although greater investments were made on soil conservation works in Dokur, farmers
from Aurepalle perceived higher benefits from the investments. Perhaps the acute water scarcity
prevailing in Dokur village might be responsible for the low level of perceived benefits.
Investments in water exploration
While the farmers in VLS villages underinvested in soil and water conservation measures, they
were quite aggressive in investigating on water exploration. Since the role of water is crucial for
the success of crops in drought-prone areas, the farmers leave no stones unturned in water
exploration. The investments made by the sample farmers in VLS villages on water exploration
during the period, 1985-86 to 2001-02 are summarized in table 46.
Table 46. Investments made by the sample farmers of VLS villages during 1985-86 to 2001-02 (Rs)
S.No Village Open wells Bore wells
No.of
attempts Amount invested
(Rs) Success rate
(%) Presently in
use No.of
attempts Amount
invested (Rs) Success rate
(%) Presently in
use 1 Aurepalle 11 145000 82 36 43 840400 95 72 2 Dokur 10 71000 60 10 36 839000 78 50 3 Shirapur 32 874900 81 66 32 419400 75 63 4 Kalman 53 1286050 96 85 14 153000 93 71 5 Kanzara 13 293600 92 69 6 91200 83 67 6 Kinkheda 8 32000 63 13 1 4000 0 0
Total 127 2702550 79 47 132 2347000 71 54
The sample farmers made 127 attempts to dig or deepen open wells and another 132
attempts to dig or deepen borewells in the reference period. There are 334 farmers in the sample
including the small farmers. They together made 259 attempts to explore water. Relative to the
investments made on soil and water conservation measures, the investments on water exploration
made by the sample farmers were seven times higher. More investments were made on open
wells. Investments on borewells were made on open wells in Solapur villages than in Akola and
Mahabubnagar villages, followed by Solapur villages. Investments on water exploration were
relatively much higher in the low rainfall and water scarce villages of Aurepalle, Dokur, Shirapur
and Kalman relative to Kanzara and Kinkheda villages, which are situated in a more assured
51
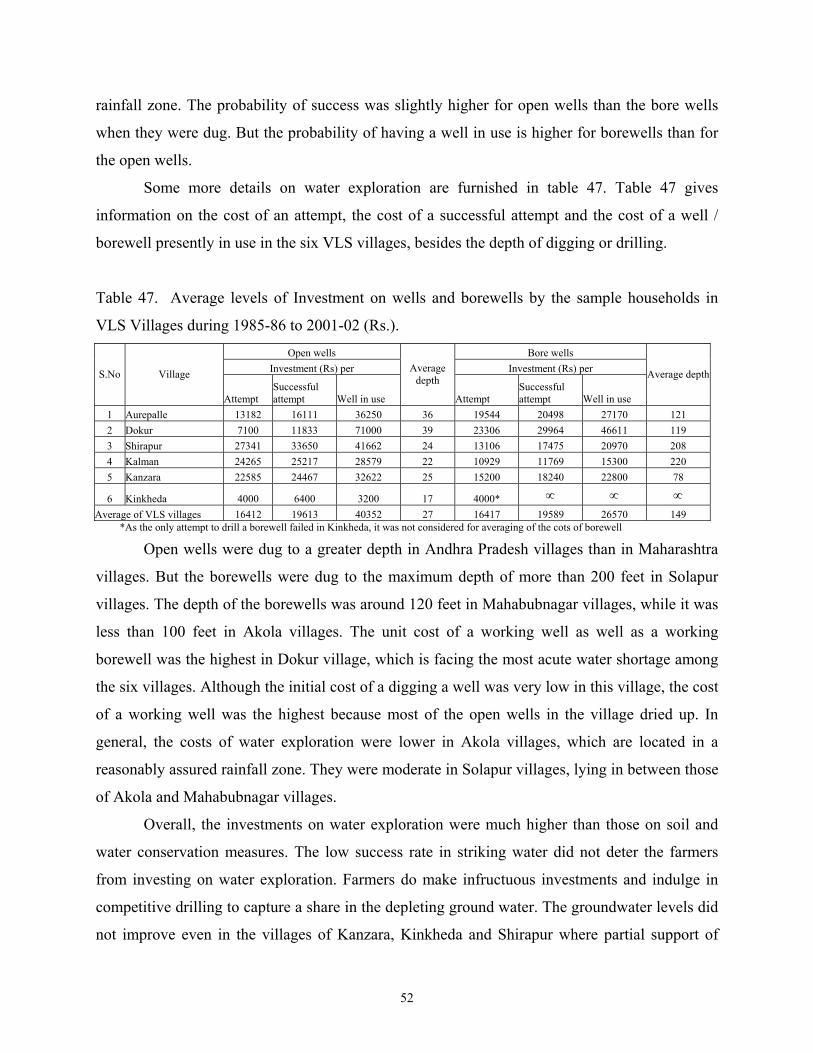
rainfall zone. The probability of success was slightly higher for open wells than the bore wells
when they were dug. But the probability of having a well in use is higher for borewells than for
the open wells.
Some more details on water exploration are furnished in table 47. Table 47 gives
information on the cost of an attempt, the cost of a successful attempt and the cost of a well /
borewell presently in use in the six VLS villages, besides the depth of digging or drilling.
Table 47. Average levels of Investment on wells and borewells by the sample households in
VLS Villages during 1985-86 to 2001-02 (Rs.). Open wells Bore wells
Investment (Rs) per Investment (Rs) per S.No Village
Attempt Successful attempt Well in use
Average depth
Attempt Successful attempt Well in use
Average depth
1 Aurepalle 13182 16111 36250 36 19544 20498 27170 121 2 Dokur 7100 11833 71000 39 23306 29964 46611 119 3 Shirapur 27341 33650 41662 24 13106 17475 20970 208 4 Kalman 24265 25217 28579 22 10929 11769 15300 220 5 Kanzara 22585 24467 32622 25 15200 18240 22800 78
6 Kinkheda 4000 6400 3200 17 4000* ∝ ∝ ∝ Average of VLS villages 16412 19613 40352 27 16417 19589 26570 149
*As the only attempt to drill a borewell failed in Kinkheda, it was not considered for averaging of the cots of borewell
Open wells were dug to a greater depth in Andhra Pradesh villages than in Maharashtra
villages. But the borewells were dug to the maximum depth of more than 200 feet in Solapur
villages. The depth of the borewells was around 120 feet in Mahabubnagar villages, while it was
less than 100 feet in Akola villages. The unit cost of a working well as well as a working
borewell was the highest in Dokur village, which is facing the most acute water shortage among
the six villages. Although the initial cost of a digging a well was very low in this village, the cost
of a working well was the highest because most of the open wells in the village dried up. In
general, the costs of water exploration were lower in Akola villages, which are located in a
reasonably assured rainfall zone. They were moderate in Solapur villages, lying in between those
of Akola and Mahabubnagar villages.
Overall, the investments on water exploration were much higher than those on soil and
water conservation measures. The low success rate in striking water did not deter the farmers
from investing on water exploration. Farmers do make infructuous investments and indulge in
competitive drilling to capture a share in the depleting ground water. The groundwater levels did
not improve even in the villages of Kanzara, Kinkheda and Shirapur where partial support of
52
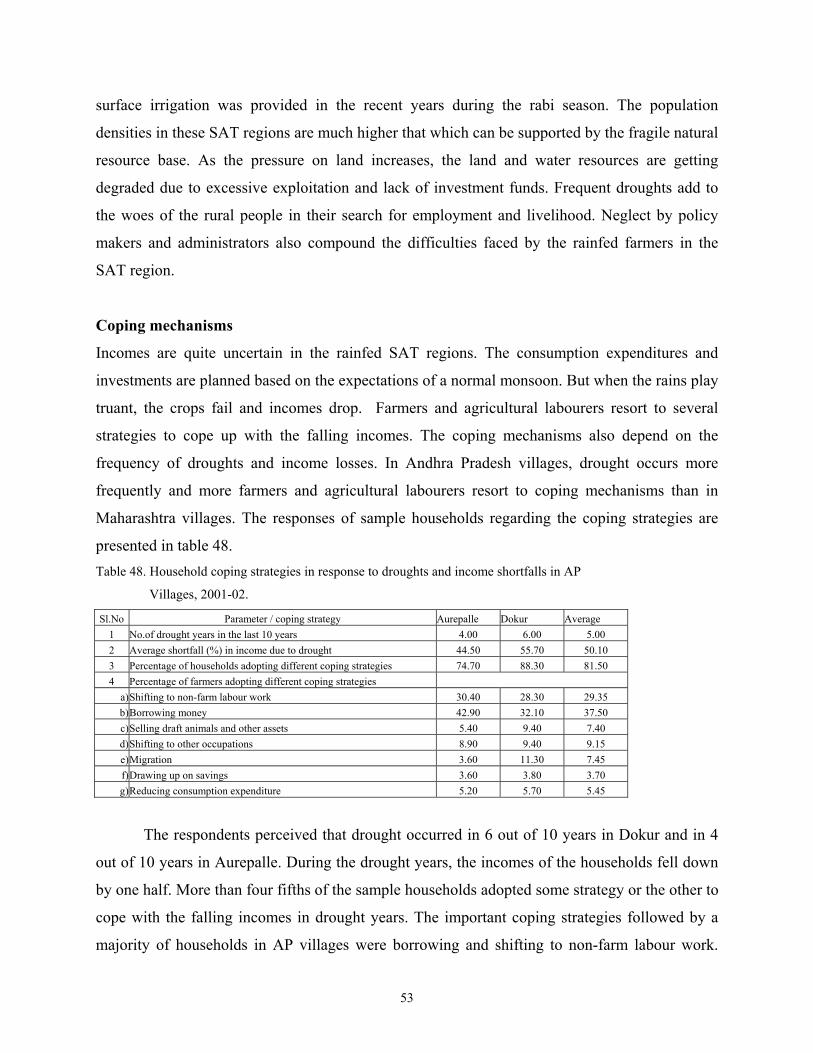
surface irrigation was provided in the recent years during the rabi season. The population
densities in these SAT regions are much higher that which can be supported by the fragile natural
resource base. As the pressure on land increases, the land and water resources are getting
degraded due to excessive exploitation and lack of investment funds. Frequent droughts add to
the woes of the rural people in their search for employment and livelihood. Neglect by policy
makers and administrators also compound the difficulties faced by the rainfed farmers in the
SAT region.
Coping mechanisms
Incomes are quite uncertain in the rainfed SAT regions. The consumption expenditures and
investments are planned based on the expectations of a normal monsoon. But when the rains play
truant, the crops fail and incomes drop. Farmers and agricultural labourers resort to several
strategies to cope up with the falling incomes. The coping mechanisms also depend on the
frequency of droughts and income losses. In Andhra Pradesh villages, drought occurs more
frequently and more farmers and agricultural labourers resort to coping mechanisms than in
Maharashtra villages. The responses of sample households regarding the coping strategies are
presented in table 48. Table 48. Household coping strategies in response to droughts and income shortfalls in AP
Villages, 2001-02.
Sl.No Parameter / coping strategy Aurepalle Dokur Average 1 No.of drought years in the last 10 years 4.00 6.00 5.00 2 Average shortfall (%) in income due to drought 44.50 55.70 50.10 3 Percentage of households adopting different coping strategies 74.70 88.30 81.50 4 Percentage of farmers adopting different coping strategies
a) Shifting to non-farm labour work 30.40 28.30 29.35 b) Borrowing money 42.90 32.10 37.50 c) Selling draft animals and other assets 5.40 9.40 7.40 d) Shifting to other occupations 8.90 9.40 9.15 e) Migration 3.60 11.30 7.45
Drawing up on savings 3.60 3.80 3.70 g) Reducing consumption expenditure 5.20 5.70 5.45 f)
The respondents perceived that drought occurred in 6 out of 10 years in Dokur and in 4
out of 10 years in Aurepalle. During the drought years, the incomes of the households fell down
by one half. More than four fifths of the sample households adopted some strategy or the other to
cope with the falling incomes in drought years. The important coping strategies followed by a
majority of households in AP villages were borrowing and shifting to non-farm labour work.
53
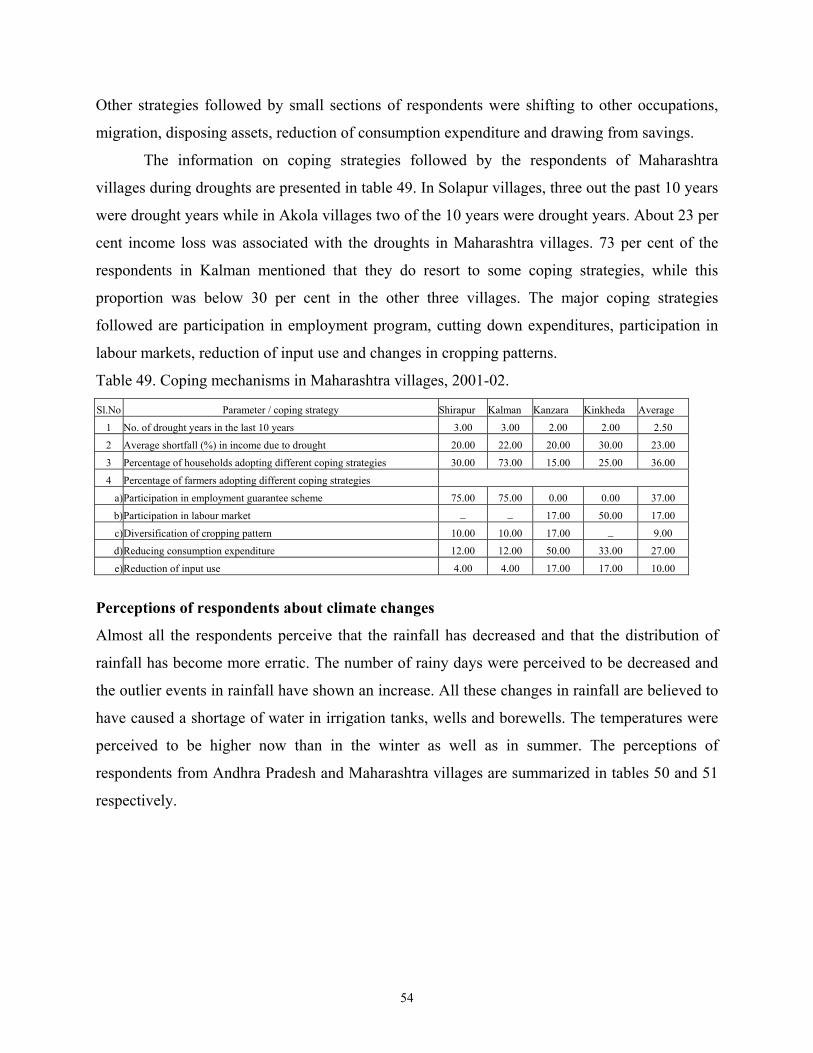
Other strategies followed by small sections of respondents were shifting to other occupations,
migration, disposing assets, reduction of consumption expenditure and drawing from savings.
The information on coping strategies followed by the respondents of Maharashtra
villages during droughts are presented in table 49. In Solapur villages, three out the past 10 years
were drought years while in Akola villages two of the 10 years were drought years. About 23 per
cent income loss was associated with the droughts in Maharashtra villages. 73 per cent of the
respondents in Kalman mentioned that they do resort to some coping strategies, while this
proportion was below 30 per cent in the other three villages. The major coping strategies
followed are participation in employment program, cutting down expenditures, participation in
labour markets, reduction of input use and changes in cropping patterns.
Table 49. Coping mechanisms in Maharashtra villages, 2001-02.
Sl.No Parameter / coping strategy Shirapur Kalman Kanzara Kinkheda Average
1 No. of drought years in the last 10 years 3.00 3.00 2.00 2.00 2.50
2 Average shortfall (%) in income due to drought 20.00 22.00 20.00 30.00 23.00
3 Percentage of households adopting different coping strategies 30.00 73.00 15.00 25.00 36.00
4 Percentage of farmers adopting different coping strategies a)Participation in employment guarantee scheme 75.00 75.00 0.00 0.00 37.00
Participation in labour market _ _ 17.00 50.00 17.00
c)Diversification of cropping pattern 10.00 10.00 17.00 _ 9.00
d)Reducing consumption expenditure 12.00 12.00 50.00 33.00 27.00
e)Reduction of input use 4.00 4.00 17.00 17.00 10.00
b)
Perceptions of respondents about climate changes
Almost all the respondents perceive that the rainfall has decreased and that the distribution of
rainfall has become more erratic. The number of rainy days were perceived to be decreased and
the outlier events in rainfall have shown an increase. All these changes in rainfall are believed to
have caused a shortage of water in irrigation tanks, wells and borewells. The temperatures were
perceived to be higher now than in the winter as well as in summer. The perceptions of
respondents from Andhra Pradesh and Maharashtra villages are summarized in tables 50 and 51
respectively.
54
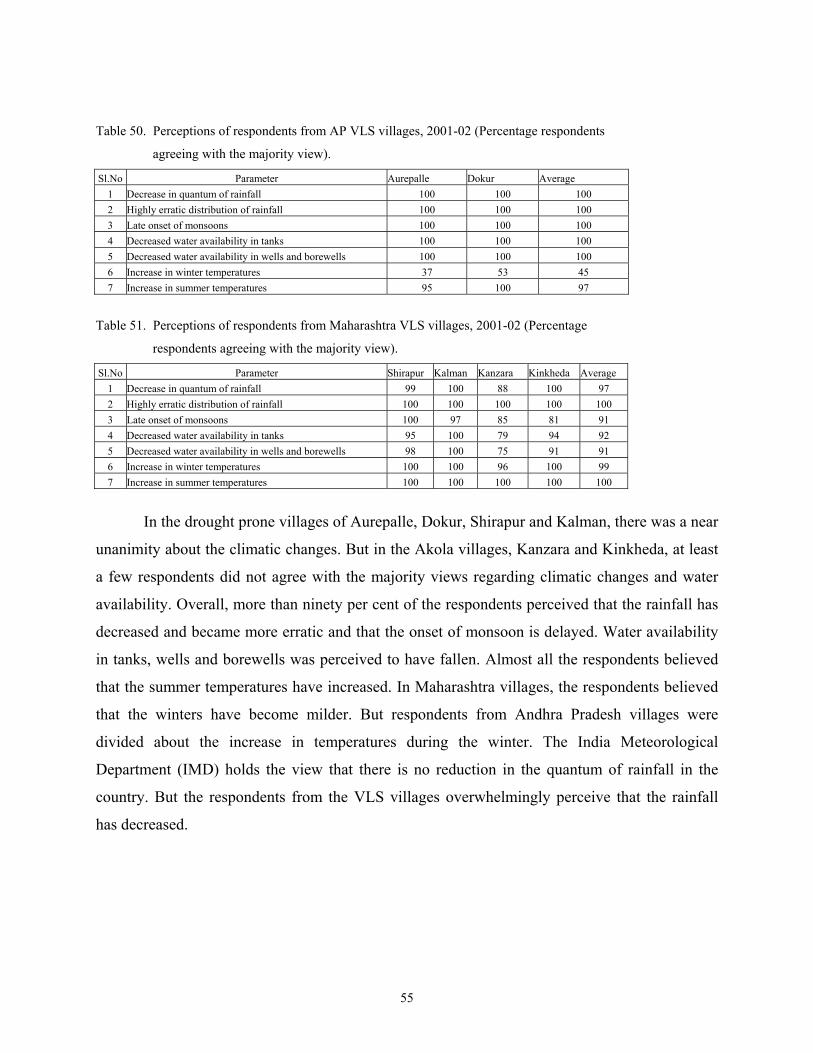
Table 50. Perceptions of respondents from AP VLS villages, 2001-02 (Percentage respondents
agreeing with the majority view).
Sl.No Parameter Aurepalle Dokur Average 1 Decrease in quantum of rainfall 100 100 100 2 Highly erratic distribution of rainfall 100 100 100 3 Late onset of monsoons 100 100 100 4 Decreased water availability in tanks 100 100 100 5 Decreased water availability in wells and borewells 100 100 100 6 Increase in winter temperatures 37 53 45
95 100 97 7 Increase in summer temperatures
Table 51. Perceptions of respondents from Maharashtra VLS villages, 2001-02 (Percentage
respondents agreeing with the majority view).
Sl.No Parameter Shirapur Kalman Kanzara Kinkheda Average 1 Decrease in quantum of rainfall 99 100 88 100 97 2 Highly erratic distribution of rainfall 100 100 100 100 100 3 Late onset of monsoons 100 97 85 81 91 4 Decreased water availability in tanks 95 100 79 94 92 5 Decreased water availability in wells and borewells 98 100 75 91 91 6 Increase in winter temperatures 100 100 96 100 99 7 Increase in summer temperatures 100 100 100 100 100
In the drought prone villages of Aurepalle, Dokur, Shirapur and Kalman, there was a near
unanimity about the climatic changes. But in the Akola villages, Kanzara and Kinkheda, at least
a few respondents did not agree with the majority views regarding climatic changes and water
availability. Overall, more than ninety per cent of the respondents perceived that the rainfall has
decreased and became more erratic and that the onset of monsoon is delayed. Water availability
in tanks, wells and borewells was perceived to have fallen. Almost all the respondents believed
that the summer temperatures have increased. In Maharashtra villages, the respondents believed
that the winters have become milder. But respondents from Andhra Pradesh villages were
divided about the increase in temperatures during the winter. The India Meteorological
Department (IMD) holds the view that there is no reduction in the quantum of rainfall in the
country. But the respondents from the VLS villages overwhelmingly perceive that the rainfall
has decreased.
55
Conclusions
Some broad conclusions can be drawn from the results of 2001-02 survey based on the sample
from the six villages in Maharashtra and Andhra Pradesh.
1) Over the 25 years period, the families have become more nuclear than joint. The average size
of family has fallen from 8.37 to 5.10.
2) The literacy levels have improved substantially. This improvement has been more dramatic in
case of females than the males.
3) The occupational structure has become more diversified. Agriculture was the predominant
occupation for most of the cultivator households in 1975-78. But now less than 50 per cent of the
households in AP villages and two-thirds of the households in Maharashtra villages only
consider it as their main occupation.
4) The average size of ownership holding in the VLS sample has fallen from 5.17 ha in 1975-78
to 2.35 ha in 201-02. Similarly, the average size of operational holding in the VLS sample has
fallen from 5.90 ha in 1975-78 to 2.38 ha in 2001-02.
5) But due to an increase in the irrigable area, the ownership holding in terms of standard dryland
equivalent hectares declined only marginally.
6) There was a reversal of the position of AP and Maharashtra villages with respect to irrigation.
In 1975-78, irrigation figured more prominently in AP villages. But, in 2001-02, Maharashtra
villages are a better access to irrigation than the AP villages due to the advent of surface
irrigation facility in three out of four Maharashtra villages.
7) The number of cattle and buffaloes owned by an average household has decreased. But there
is an increase in the number of small ruminants reared in some of the villages. Livestock
numbers decreased due to tractorisation and due to substitute quantity with quality in case of
dairy animals.
8) A sample household in VLS villages owned assets valued at Rs.2,67,973/-. The asset value in
Andhra Pradesh villages was only Rs.163,488 as against the average asset value of Rs.387,209 in
Maharashtra villages. But the households were short of financial assets and were net borrowers.
9) The share of cash crops decreased in the cropping patterns over the years. Sorghum and other
coarse grains lost areas significantly during the kharif season. But rabi sorghum still holds its fort
in the absence of better alternatives.
56
10) The productivity levels of crops were generally lower in the VLS villages. Drought was
regarded as the most important production constraint in Aurepalle, Shirapur and Kalman. Pests
and diseases were regarded as the most important production constraint in Akola villages, while
wild boars along with drought were the important production constraints in Dokur village.
11) Farmers get information on technology and inputs more from progressive farmers and
shopkeepers than from the officials of the agricultural department.
12) Farmers from the SAT villages were found to be selling a substantial proportion of their
produce in the market, signaling a transition from subsistence to commercial agriculture.
13) Farmers were found to be recovering all the costs only in case of about 29 per cent plots. In
37 per cent plots, they were not recovering even the variable costs while in the other 34 per cent
plots, they were recovering the variable costs, but not the fixed costs.
14) Annual net crop income was negative in case of Dokur, Aurepalle and Shirapur villages. In
case of Kalman and Kinkheda, the annual net crop income was smaller than that recorded in
2001-02. The annual net crop income was substantial only in Kanzara village and it was good
enough to match the base year (1975-76 to 1977-78) crop income after adjusting for inflation.
15) Milk production also turned to be not much profitable after paying for the variable costs.
With the exception of Shirapur, the returns from buffaloes exceeded those from cows in all the
VLS villages. Returns from cows did not cover even the variable costs in Dokur and Kalman.
16) Rearing of draft animals turned out to be economical in the VLS villages, except in case of
Dokur where the bullocks found work only for a limited number of days.
17) Rearing of small ruminants turned out to be profitable in the dry areas of Mahabubnagar and
Solapur villages, but not in the Akola region which was wetter.
18) The net income from livestock per household was the highest in Shirapur, followed by Dokur
and Kanzara. It was relatively lower in Aurepalle, Kalman and Kinkheda.
19) The employment opportunities within the agricultural sector were higher in Kanzara,
Kinkheda and Shirapur, which receive some support of surface irrigation in the post-rainy (rabi)
season.
20) Migration of work force to distant places is becoming increasingly common in the two
Mahabubnagar villages of Aurepalle and Dokur.
21) The real wages of workers have shown an increase over the last three decades.
57
22) While the income shares of crops, livestock and agricultural labour income declined over the
years, the shares of non-farm income, caste occupations, migration and other sources increased.
23) The percapita incomes increased and doubled even after they were adjusted for inflation.
Income sources have become more diversified now than three decades ago.
24) Despite increases in per capita incomes, the average per capita income worked out to only $
0.40 per day.
25) The households incurred about one-fourth of their consumption expenditure on foodgrains
and another one-fourth on other food items. The remaining half of the consumption expenditure
was spent on non-food items of consumption.
26) Considerable undernutrition was observed in the sample both with respect to calories and
proteins. Calorie undernutrition was more pronounced in case of Maharashtra villages, while
protein undernutrition was relatively more in Andhra Pradesh villages.
27) Sample households benefited to some extent from the developmental and welfare programs
of the Government such as housing, land distribution, subsidized agricultural machinery and
inputs and public distribution system. But the benefits received in a year worked out to only
about 5 per cent of the household income.
28) Farmers invested Rs.822 per hectare on soil conservation measures over a period of 15 years
and spent Rs.104 per hectare per year on the maintenance of these structures. Farmers from
Solapur villages invested more than those in Mahabubnagar and Akola villages on soil
conservation works.
29) Farmers invested seven times more on water exploration than what they invested on soil
conservation. Relatively more investments were made on water exploration in the villages facing
water scarcity than in the villages receiving some support of surface irrigation. But the rate of
success in striking water has decreased over the years.
30) The sample households resorted to many coping strategies in the face of droughts and
income shortfalls. AS the probability of the occurrence of a drought and income shortfall
associated with that are higher in Andhra Pradesh villages, a larger percentage of the households
resorted to coping strategies like borrowing, shifting to non-farm work, migration, reduced
consumption and disposal of asserts.
31) The sample households perceived that the climate change is associated with reduced rainfall,
its uneven distribution and increased temperatures. These perceptions, which are held
58
unanimously by a large majority of the sample are not shared by India Meteorological
Department (IMD) which holds that there is no decline in rainfall at the country level.
32) The increasingly non-viable nature of farming (both crops and livestock) in the villages of
Indian SAT are a cause for concern to the researchers, policy makers ands administrators. Many
bold initiatives are needed on the fronts of technology generation, market linkages and policy
formulation to reuse the rainfed farm households in the SAT villages.
References
Jodha, NS. 1997. Resource base as a determinant of cropping patterns, occasional paper 14,
Economics program, ICRISAT, Begumpet, Hyderabad – 500016.
Singh, RP, Asokan M and Walker TS. 1982. Size, composition and other aspects of Rural
Income in the Semi-Arid Tropics of India, progress report 33, Economics program, ICRISAT,
Patancheru, AP – 502324.
Walker, TS and KV Subba Rao. 1982. Yield and net returns distributions in common village
cropping systems in the Semi-arid Tropics of India, progress report 41, Economics program,
ICRISAT, Patancheru, AP – 502324.
Walker, TS, Singh, RP and Jodha, NS. 1983. Dimensions of Farm-Level diversification in the
Semi-arid Tropics of Rural South India, ICRISAT, Patancheru, AP – 502324.
Walker, TS and Ryan, JG. 1990. Village and Household economics in India’s Semi-arid
Tropics, The John Hopkins Universtiy press, Baltimore.
59
60
Progress Reports are informal communications about ongoing research, or thoughts of ICRISAT staff members, which are designed to stimulate thinking and comments of professional colleagues within and outside the Institute. These reports are not to be considered as formal publications bearing the endorsement of the Institute. Progress reports were earlier referred to as Occasional Papers/Discussion Papers.
Abstract
The village level studies (VLS) were resumed in 2002 with enlarged sample and additional modules. The data relating to the cropping year, 2001-02 were collected, analysed and presented in this progress report in a brief summary form. Wherever possible, the results were compared with those of the first phase of VLS (1975-85). Although the real household net incomes have gone up substantially for the sample farmers, the crop and livestock enterprises were found to be non-viable in most of the cases due to erratic and sub-normal distribution of rainfall, soaring input costs and stagnant output prices. Poverty incidence is still high and considerable part of the sample population suffers from both caloric and protein malnutrition. Farmers have been investing quite heavily on water exploration despite the low probability of success in striking water. Although the real wages of labour have gone up, they continue to suffer from under-employment. In the low rainfall areas, quite a significant proportion of the labour force migrates to urban areas and distant places in search of work. The welfare and developmental programs of the Government provide some help to the rural poor, but it is not adequate to lift them out of poverty.
Acknowledgements The authors are grateful to Dr. MCS Bantilan, Theme Leader, Markets, Policy and Impacts (MPI) for her constant encouragement, support and guidance to the village level studies. Thanks are also due to Mr. P. Parthasarathy Rao for his contributions to the livestock module. We also thank our field investigators, student interns, data entry operators and programmers for their unstinted support and duty-consciousness. Last, but not the least, all the 446 sample households who responded positively and gave their time to sit through the long and demanding interviews. Our thanks are also due to the administrative and support personnel of MPI theme for their able and timely support. Needless to add, but the authors alone are responsible for any errors contained in the report.
Authors


